Article

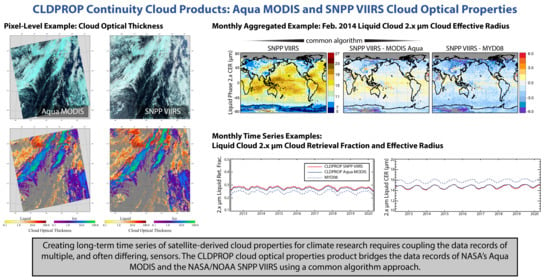
The NASA MODIS-VIIRS Continuity Cloud Optical Properties Products

1
Earth Sciences Division, NASA Goddard Space Flight Center, Greenbelt, MD 20771, USA
2
Science Systems Applications Inc., Lanham, MD 20706, USA
3
Space Science and Engineering Center, University of Wisconsin-Madison, Madison, WI 53706, USA
4
ADNET Systems Inc., Bethesda, MD 20817, USA
5
University Space Research Association, Columbia, MD 21046, USA
*
Author to whom correspondence should be addressed.
Submission received: 23 November 2020 / Revised: 17 December 2020 / Accepted: 21 December 2020 / Published: 22 December 2020

Abstract

:
The NASA Aqua MODIS and Suomi National Polar-Orbiting Partnership (SNPP) Visible Infrared Imaging Radiometer Suite (VIIRS) climate data record continuity cloud properties products (CLDPROP) were publicly released in April 2019 with an update later that year (Version 1.1). These cloud products, having heritage with the NASA Moderate-resolution Imaging Spectroradiometer (MODIS) MOD06 cloud optical properties product and the NOAA GOES-R Algorithm Working Group (AWG) Cloud Height Algorithm (ACHA), represent an effort to bridge the multispectral imager records of NASA’s Earth Observing System (EOS) and NOAA’s current generation of operational weather satellites to achieve a continuous, multi-decadal climate data record for clouds that can extend well into the 2030s. CLDPROP offers a “continuity of approach,” applying common algorithms and ancillary datasets to both MODIS and VIIRS, including utilizing only a subset of spectral channels available on both sensors to help mitigate instrument differences. The initial release of the CLDPROP_MODIS and CLDPROP_VIIRS data records spans the SNPP observational record (2012-present). Here, we present an overview of the algorithms and an evaluation of the intersensor continuity of the core CLDPROP_MODIS and CLDPROP_VIIRS cloud optical property datasets, i.e., cloud thermodynamic phase, optical thickness, effective particle size, and derived water path. The evaluation includes analyses of pixel-level MODIS/VIIRS co-locations as well as spatial and temporal aggregated statistics, with a focus on identifying and understanding the root causes of individual dataset discontinuities. The results of this evaluation will inform future updates to the CLDPROP products and help scientific users determine the appropriate use of the product datasets for their specific needs.

Graphical Abstract

1. Introduction

With the launch of the twin Moderate-resolution Imaging Spectroradiometers (MODIS) [1] onboard the Earth Observing System (EOS) Terra and Aqua platforms in December 1999 and May 2002, respectively, the National Aeronautics and Space Administration (NASA) began a new era of advanced global imager observations of the Earth. MODIS offered unprecedented spatial capabilities for a global imager, having observations with a nadir resolution of 250 m, 500 m, and 1 km, depending on the spectral channel. For retrievals of cloud properties, MODIS also offered unique spectral capabilities. Two shortwave infrared (SWIR) window channels, 1.64 and 2.13 µm, coupled with a legacy 3.75 µm mid-wave infrared (MWIR) channel provide strong information content on cloud microphysics due to size-dependent cloud particle absorption in those channels [2,3,4]. Multiple spectral channels within the thermal infrared (IR) 13 µm CO2 absorption band enable CO2-slicing cloud-top retrievals of thin high-altitude ice clouds [5,6]. And for the first time, a channel within the 1.38 µm water vapor absorption band was included to provide sensitivity to optically thin cirrus [7,8,9]. The widely used MODIS cloud product suite developed by the NASA MODIS Science Team includes the MOD35/MYD35 cloud mask product [10,11,12,13] and the MOD06/MYD06 product with cloud-top (temperature, pressure, emissivity, and IR-derived thermodynamic phase) [6,14] and cloud optical properties (shortwave-derived thermodynamic phase, cloud optical thickness, effective particle size, and derived water path) [15,16] datasets. Note the product filename designators MOD and MYD refer to Terra and Aqua MODIS, respectively, though the algorithms for each instrument are nearly identical. Due to the 1 km native resolution of several key spectral channels needed by the optical properties algorithm, those datasets are reported at a 1 km spatial resolution.
To date, the MODIS imagers have provided stable, well characterized observational records extending more than 20 (Terra) and 18 (Aqua) years. Nevertheless, data records on the order of three decades or more are likely needed to detect climate trends and feedbacks such as those of clouds [17]. This inevitably necessitates merging the observational records of multiple like sensors. For the EOS MODIS data records, the obvious candidate for product continuity is the Visible Infrared Imaging Radiometer Suite (VIIRS) onboard the joint NASA and National Oceanic and Atmospheric Administration (NOAA) Suomi National Polar-orbiting Partnership (SNPP) satellite (launched in October 2011) and NOAA’s new generation Joint Polar Satellite System (JPSS) operational series beginning with NOAA-20 (launched in November 2017). With three scheduled follow-ons to NOAA-20, VIIRS offers the opportunity to extend the geophysical data records of EOS MODIS well into the 2030s.
For cloud properties, however, directly porting the MOD35/MYD35 and MOD06/MYD06 cloud product algorithms to VIIRS is not possible. While in some respects VIIRS is an advancement over MODIS, particularly in spatial resolution (750 m at nadir for all moderate resolution VIIRS spectral channels used in the cloud algorithm suite) and swath coverage (3060 km across track vs. 2330 km across track for MODIS), VIIRS lacks the key near-IR (NIR) and IR water vapor and CO2 absorption channels that on MODIS provide significant information on multilayer clouds [18] and cloud-top properties (i.e., CO2-slicing for high, thin clouds). In addition, the spectral location of the VIIRS 2.25 µm channel differs from its 2.13 µm MODIS analog. This difference has implications for retrievals of cloud particle size and thermodynamic phase classification due to the strong variability of liquid and ice absorption across the broader 2 µm atmospheric spectral window [19,20]. Thus, the approach taken towards extending the EOS MODIS cloud property data records to VIIRS involved the development of common algorithms utilizing only spectral channels common to both imagers. Although the spectral information content available from MODIS is degraded with this common implementation, the continuity of approach can eliminate most algorithm and spectral information content differences that are challenging to disentangle from other factors (e.g., sensor spatial resolution, intersensor relative radiometry, etc.) and thereby confound interpretation of cloud property data records across different sensors [21,22,23].
This paper describes the common multi-sensor cloud optical property algorithm that, together with a cloud-top properties algorithm detailed separately [24,25], forms the NASA CLDPROP continuity cloud properties product that seeks to obtain a continuous, long-term cloud data record from MODIS to VIIRS. The CLDPROP continuity cloud products, along with the CLDMSK continuity cloud mask product [26] and an extensive suite of analysis tools and datasets, are produced by the NASA Atmosphere Science Investigator-led Processing System (A-SIPS) at the University of Wisconsin-Madison. The CLDPROP cloud optical properties algorithm shares heritage with the MOD06/MYD06 algorithms, though there are key differences implemented in response to the spectral limitations of VIIRS and other changes with respect to MODIS (discussed in Section 2). Granule-level examples and statistical aggregations from the latest public release of the Aqua MODIS and SNPP VIIRS CLDPROP products, Version 1.1 (v1.1), are shown in Scion 3, along with an assessment of intersensor continuity. A discussion of the ongoing challenges that have yet to be addressed appears in Section 4, followed by conclusions in Section 5.

2. Materials and Methods

2.1. Imager Cloud Optical Property Retrievals

The role of clouds in the Earth’s radiative budget, i.e., how and to what extent clouds interact with incoming solar and emitted terrestrial radiation and thus warm or cool the atmosphere, is largely determined by their radiative quantities—cloud optical thickness (COT) and effective particle radius (CER)—in addition to their thermodynamic phase (e.g., liquid, ice) and vertical location within the atmospheric column (cloud-top pressure, temperature, height). The modern satellite era has greatly advanced our knowledge of clouds and their radiative effects, providing a global perspective of the spatial and temporal (e.g., seasonal, interannual) variation of clouds and their properties. Of particular importance are observations from spaceborne imagers that measure reflected incoming solar and emitted terrestrial radiation from the Earth.
Imager-based retrievals of the cloud optical properties COT and CER rely on the spectral scattering and absorption properties of the liquid droplets and ice particles that compose clouds. Specifically, reflectance observations in non-absorbing visible (VIS) and NIR channels mainly provide information on COT, or cloud opacity, while reflectance observations in absorbing SWIR or MWIR channels, where liquid/ice absorption strength is a function of particle size, also (or exclusively) provide information on CER [2]. Simultaneous COT and CER retrievals utilizing the combined VIS to MWIR spectral information content have been pursued at least since the mid-1980s with imagers such as the Advanced Very High-Resolution Radiometer (AVHRR) [3] on NOAA’s polar orbiting meteorological satellite series (NOAA-6 to NOAA-19), and have become standard practice in the EOS era with MODIS [15,27,28] and numerous advanced airborne imagers [29,30]. In practice, these retrievals typically employ a bi-spectral approach [4], using pre-computed look-up tables (LUTs) of spectral cloud reflectance as a function of COT, CER, and view geometry.

2.2. Aqua MODIS

The MODIS on NASA’s EOS Aqua satellite observes the Earth in 36 narrowband spectral channels from the VIS to the IR. Aqua is in a sun-synchronous orbit at roughly 705 km altitude, with an ascending ground track that crosses the equator in the early afternoon, at about 13:35 local solar time (LST). MODIS has a ground swath width of 2330 km and native nadir spatial resolution that varies from 250 m (VIS/NIR 0.66 and 0.86 µm channels), 500 m (VIS/SWIR 0.47, 0.55, 1.24, 1.64, 2.13 µm), and up to 1 km (remaining channels). Pixel-level calibrated spectral reflectance and radiance observations are reported in the MYD021KM Level-1B (L1B) product at 1 km spatial resolution, with associated 1 km geolocation (latitude, longitude, view/solar zenith and azimuth angles) reported in the MYD03 product. Both the MYD021KM and MYD03 products are publicly archived in the Level-1 and Atmosphere Archive and Distribution System (LAADS) Distribute Active Archive Center (DAAC) [31] at NASA’s Goddard Space Flight Center (GSFC). The CLDPROP and CLDMSK algorithms ingest the most recent version of these datasets, Collection 6.1 (C6.1).

2.3. SNPP VIIRS

The VIIRS on the joint NASA-NOAA SNPP satellite and NOAA’s JPSS series (NOAA-20+) observes the Earth in 16 moderate resolution M-bands (750 m at nadir) and five imagery resolution I-bands (375 m at nadir) from the VIS to the IR. Like Aqua, SNPP is in a sun-synchronous orbit, though at roughly 834 km altitude with an ascending ground track that crosses the equator in the early afternoon at about 13:30 LST. Given the unique needs of its Atmosphere, Ocean, and Land disciplines, however, NASA has developed its own L1B and geolocation software for VIIRS. This software is consistent with and leverages the infrastructure developed for MODIS [32], and thus is distinct from similar products produced by NOAA. For the SNPP VIIRS M-bands, the NASA-generated pixel-level calibrated spectral reflectance and radiance observations are reported in the VNP02MOD product, with associated geolocation in the VNP03MOD product. Both of these NASA products are publicly archived in the LAADS DAAC. For the initial release of the SNPP VIIRS CLDMSK and CLDPROP products (v1.0 and v1.1, respectively), the algorithms ingest Collection Version 1 of the NASA VNP02MOD and VNP03MOD products.
The CLDPROP and CLDMSK product algorithms, however, do not ingest the VIIRS L1B files as-is. A unique feature of VIIRS is the onboard detector aggregation and deletion scheme that eliminates pixels from successive scans that overlap—the so-called bow-tie pixels [33]. To remain consistent with the sampling of MODIS, which does not employ a bow-tie pixel deletion scheme, the NASA A-SIPS has developed and implemented an algorithm that “restores” the deleted VIIRS bow-tie pixels. This restoration uses nearest-neighbor sampling of succeeding or preceding scans. The bow-tie restoral algorithm is run prior to the CLDMSK and CLDPROP algorithms. Moreover, radiometric adjustment factors for a subset of shortwave spectral channels are applied to the VIIRS L1B, the result of an extensive pixel-matching relative radiometric analysis that found SNPP VIIRS NIR and SWIR spectral reflectance to be systematically brighter than Aqua MODIS [34]. While radiometric adjustments can be derived for and applied to either MODIS or VIIRS, Aqua MODIS was used as the reference imager as a pragmatic choice given its status as the heritage imager and the anchor of the MODIS-VIIRS CLDMSK and CLDPROP climate data records.

2.4. The CLDPROP Cloud Optical Property Retrieval Algorithms

2.4.1. Algorithm Heritage

The CLDPROP Level-2 cloud optical property retrieval algorithms were developed within the Cross-platform HIgh resolution Multi-instrument AtmosphEric Retrieval Algorithms (CHIMAERA) package [35]. CHIMAERA also includes the MODIS Science Team cloud optical properties product (MOD06/MYD06 for Terra/Aqua, respectively) algorithms [16], the Deep Space Climate Observatory (DSCOVR) Earth Polychromatic Imaging Camera (EPIC) cloud product algorithms [36,37], and related algorithms supporting cloud remote sensing applications for other airborne [30,38] and spaceborne imagers. CHIMAERA utilizes a shared-core approach, such that much of its code base is common to all supported imagers. For CLDPROP, the optical properties retrieval algorithm has direct heritage with the C6.1 MOD06/MYD06 algorithm [16], with only modest modifications that include updated cloud reflectance LUTs; removal of the multilayer cloud detection algorithm; changes to the optical properties thermodynamic phase algorithm to account for more limited information from the new cloud-top properties retrieval; updated output file format to the modern Network Common Data Format version 4 (netCDF-4) [39]; and upgraded I/O to support ingestion of VIIRS L1B and geolocation files. Details on the more significant algorithm changes for CLDPROP optical properties with respect to MOD06/MYD06 are presented in the sections below.
The CLDPROP optical properties algorithm uses only spectral channels common to both MODIS and VIIRS. These spectral channels, along with their primary application, are listed in Table 1. The CLDPROP products are produced at the U. Wisconsin A-SIPS and are pushed to the LAADS DAAC at NASA GSFC for public archive and distribution. The current version of CLDPROP, Version 1.1 (v1.1), was released in November 2019; this was a reprocessing of the initial Version 1.0 (v1.0) to implement an update to the cloud optical properties phase algorithm.
Consistent with MOD06/MYD06, all CLDPROP COT, CER, and derived cloud water path Level-2 datasets have associated uncertainty datasets calculated as discussed in [16] for the principal quantifiable error sources. The retrieval uncertainty covariance matrix (Sret) is calculated from
S r e t   =   K T S y 1 K 1 +   i K 1 K b i   S b i   K 1 K b i T
where Sy and Sb are the measurement and various model (i index) error covariance matrices, respectively, and K and Kb contain partial derivatives that map measurement and model errors, respectively, to inferred cloud top reflectance. The matrix formulation of (1) can be derived from standard variance algebra keeping only first order (linear) terms and is equivalent to an optimal estimation calculation [40] when the a priori uncertainties are removed (i.e., assumed too large to usefully constrain the solution space). Example Level-2 retrievals and uncertainties are shown in Section 3.1.

2.4.2. Changes in Liquid Phase LUTs

The retrieval of COT and CER from VIS, NIR, and SWIR reflectance observations requires pre-computed LUTs of cloud reflectance (and emissivity in the MWIR and window IR) that make reasonably realistic assumptions on liquid and ice cloud microphysics (e.g., particle size distribution) and scattering/absorption properties. For the MOD06/MYD06 cloud reflectance LUTs, liquid cloud scattering/absorption properties are calculated from Mie theory assuming liquid water refractive indices obtained from [41] for wavelengths (λ) < 1.0 µm, [42] for 1.0 µm < λ < 2.6 µm, and [43] for λ > 3.5 µm. Ice cloud scattering/absorption properties are obtained from [44] at all wavelengths, assuming a severely roughened aggregate of hexagonal columns. For both liquid and ice clouds, the particle size distributions are vertically homogeneous, and are assumed to be gamma distributions having an effective variance of 0.1.
CLDPROP, however, uses an updated liquid water imaginary index of refraction dataset in the SWIR obtained at a laboratory super-cooled temperature of 265 K [19], rather than the heritage dataset [42] for laboratory measurements at 300 K. Empirically, this 265 K dataset is found to provide better consistency between CER retrievals from the MODIS 2.13 µm and VIIRS 2.25 µm (collectively referred to as 2.x µm) channels for relatively homogeneous marine boundary layer clouds [20]. The primary impacts of this imaginary refractive index change with respect to the heritage dataset are an increase in single scattering albedo for the VIIRS 2.25 µm channel (i.e., decreased absorption) and a decrease for the MODIS 2.13 µm channel (i.e., increased absorption), corresponding to roughly a 1.0 µm increase and 1.5 µm decrease in CER retrievals, on average, for the respective VIIRS and MODIS channels. Substantial impacts on the single scattering albedo in the 1.6 µm spectral region are also found. However, the corresponding CER retrieval differences between the VIIRS 1.61 µm and MODIS 1.64 µm channels are similar to what is found using the heritage 300 K dataset, since changes in the imaginary index of refraction in both channels are of the same sign and about the same magnitude.
To maintain consistent assumptions across the spectrum, CLDPROP also uses an updated 265 K complex index of refraction dataset for the MWIR (3.7 µm), interpolated from the 258 K and 269 K measurements of [45]. This change with respect to the refractive index assumptions of MOD06/MYD06 [43] results in slightly larger CER retrievals from the 3.7 µm channel for both MODIS and VIIRS [20].
While these new index of refraction datasets provide better closure between the Aqua MODIS and SNPP VIIRS spectral CER retrievals, the relatively large impacts in the 2.x µm spectral region have not been separated unambiguously from relative radiometric differences between MODIS and VIIRS in those channels. Moreover, their usage in CLDPROP precludes a direct comparison with the MODIS MOD06/MYD06 products that continue to use the heritage index of refraction datasets for C6.1.

2.4.3. Other Changes

In addition to the updated liquid water cloud LUTs, CLDPROP changes with respect to MOD06/MYD06 include modifications to the cloud thermodynamic phase algorithm used in the optical properties retrieval and removal of datasets that can provide scene quality assurance (QA). The CLDPROP cloud optical properties (COP) phase algorithm is largely based on the C6.1 MOD06/MYD06 phase algorithm [46] that considers a broad range of information, including cloud-top temperature (CTT) retrievals, IR-derived phase results [14], and SWIR/MWIR spectral CER retrievals. The changes to this algorithm for CLDPROP result from the use of a new cloud-top properties algorithm [25] and the spectral mismatch between the MODIS 2.13 µm and VIIRS 2.25 µm channels.
The C6.1 MOD06/MYD06 COP phase algorithm has a cold cloud sanity check that overrides an undetermined or ambiguous liquid phase result, provided that the IR-derived phase indicates an ice cloud and that the cloud is cold (CTT < 240 K), with the CO2-slicing approach providing the cloud-top solution rather than the IR window approach, a general indicator of high-altitude clouds. VIIRS does not have IR channels in the 13 µm CO2 absorption region. Therefore, the CLDPROP cloud-top property retrievals do not include a CO2-slicing solution, and the CLDPROP COP phase algorithm removes the dependence on the cloud-top solution method.
Moreover, the spectral mismatch of the MODIS 2.13 µm and VIIRS 2.25 µm channels compels an additional change to the COP phase algorithm. In C6.1 MOD06/MYD06, spectral CER were introduced into the COP phase algorithm. These tests, consisting of ice and liquid phase CER retrieval differences between the 1.64, 2.13, and 3.75 µm spectral channels, rely on the differential absorption of liquid and ice throughout much of the SWIR and MWIR. Ice crystals are generally more absorbing than liquid cloud droplets in the SWIR and MWIR, resulting in TOA reflectance that is generally darker for ice clouds than for liquid clouds. In the VIIRS 2.25 µm channel, however, ice is substantially less absorbing than in the MODIS 2.13 µm channel, and ice and liquid phase 2.25 µm CER retrieval differences have more ambiguous phase information. This is shown by the example plots of the 0.86–2.x µm COT-CER solution space for MODIS and VIIRS in Figure 1a,b, respectively. Here, information on thermodynamic phase is indicated by the relative separation of the liquid (red lines) and ice (blue lines) solution spaces. For VIIRS, the two solution spaces completely overlap, indicating that comparing liquid and ice phase CER retrievals from the 2.25 µm channel is ambiguous in most cases. Early testing of the CLDPROP optical properties algorithms suggested that removing the 2.25 µm CER test from the VIIRS phase algorithm, while simultaneously giving twice the weighting to the 1.61 µm CER test, yields phase results roughly equivalent to those from MODIS where all three spectral CER retrievals are used. Note that this is a similar approach to that used for Aqua MODIS, in both C6.1 and CLDPROP, for pixels with inoperable 1.64 µm detectors, in which case the 2.13 µm CER test is given twice the weighting. While omitting the 2.25 µm and duplicating the 1.61 µm CER tests for the VIIRS COP phase algorithm was the pragmatic pathway for the initial v1.0/v1.1 releases of the CLDPROP products, a long-term strategy for thermodynamic phase continuity between the imagers is still under investigation.
Omitted cloud optical property datasets in CLDPROP with respect to MOD06/MYD06 include portions of the Clear Sky Restoral (CSR) flag and the multilayer cloud flag. Both of these flags provide useful pixel-level information on retrieval quality by identifying pixels for which the single layer, homogeneous, plane-parallel cloud forward model assumption is expected to break down and thus introduce significant but, in practice, unquantifiable retrieval errors. The CSR algorithm [16] attempts to identify pixels that are classified as cloudy, or more appropriately “not clear,” by the cloud mask but are likely only partially cloudy (PCL) or are “not clear” for reasons other than the presence of clouds, e.g., optically thick smoke/dust or bright sun glint. The heavy aerosol and sun glint pixels are “restored to clear sky” and removed from the cloudy pixel population in the optical properties datasets. For MOD06/MYD06, two types of PCL pixels are identified: those at cloud edge, and those that sub-pixel variability tests, namely 250 m cloud mask results, indicate are not overcast. For CLDPROP, the cloud edge CSR test remains. However, the sub-pixel variability CSR test is removed as analogous direct M-band sub-pixel information is not available on VIIRS. The 375 m I-bands on VIIRS may enable reimplementation of this sub-pixel variability test in some, though not identical, form in future releases of CLDPROP; an exploration of their utility is ongoing.
The MOD06/MYD06 cloud optical properties algorithm also includes a multilayer cloud detection algorithm designed to identify pixels likely to have more than one cloud layer, primarily liquid clouds with an overlying thin cirrus that may have impacts on thermodynamic phase classification and retrievals of CER [18,47]. This algorithm employs a weighted voting scheme, the bulk of whose tests rely on spectral channels located within the 0.94 µm water vapor absorption band or the 13 µm CO2 absorption band. Because analogous absorption channels are missing on VIIRS, the multilayer cloud detection algorithm is omitted in its entirety from the initial v1.0/v1.1 releases of CLDPROP. Previous investigations have shown, however, that the 1.38 µm water vapor absorption channel that is included on both MODIS and VIIRS can provide information on the presence of multilayer clouds [48], and in fact constitutes one of the tests implemented within the MOD06/MYD06 multilayer cloud detection algorithm. Appropriately utilizing this information on its own in a manner consistent with the needs of the optical property retrievals is being pursued.

2.4.4. Inputs and Ancillary Datasets

The CLDPROP cloud optical properties algorithm ingests a number of datasets from ancillary products and upstream processed algorithms, in addition to the Aqua MODIS and SNPP VIIRS pixel-level geolocation and L1B reflectance products listed in Section 2.2 and Section 2.3. Similar to MOD06 processing, CLDPROP ancillary datasets include National Center for Environmental Prediction (NCEP) Global Data Assimilation System (GDAS) atmospheric profiles [49], MODIS-derived gap-filled surface spectral albedo (MCD43B3) [50], Near-real-time Ice and Snow Extent (NISE) snow and sea ice amount products [51], and a land surface spectral emissivity product [52]. Ingested upstream continuity datasets are from the cloud mask (CLDMSK) product and the cloud-top property algorithm that is part of CLDPROP but processed prior to the optical property algorithms.

2.5. CLDPROP_M3 and MYD08 Global Gridded Datasets

In addition to granule-level examples of the Aqua MODIS and SNPP VIIRS CLDPROP Level-2 products, spatial and temporal statistical comparisons between the two imagers are performed using the CLDPROP_M3 monthly global gridded Level-3 products. The CLDPROP_M3 datasets are 1° equal angle aggregations of the Level-2 pixel-level CLDPROP datasets and include scalar statistics and histograms for the CLDPROP cloud-top and optical properties retrievals as well as the CLDMSK cloud mask. Because VIIRS has a wider ground swath than MODIS, its aggregations for the CLDPROP_M3 products (and their daily CLDPROP_D3 counterparts) are limited to view angles roughly consistent with the MODIS swath, namely view zenith angle < 65.5°. Like the CLDPROP Level-2 products, these monthly aggregated products are produced at the U. Wisconsin A-SIPS and are publicly archived in the LAADS DAAC at NASA GSFC. The current version of these products, v1.1, consistent with the Level-2 products, is used here.
By design, the CLDPROP continuity aggregation code was developed to be consistent with the standard Aqua MODIS Collection 6.1 (C6.1) MYD08 Level-3 algorithm that is run at the MODIS Adaptive Processing System (MODAPS) at NASA GSFC (also publicly archived at the LAADS DAAC). Like CLDPROP_M3, the MYD08 Level-3 product is a 1° equal angle aggregation of the Level-2 pixel-level MODIS retrievals, but includes all MODIS Atmosphere Discipline datasets in addition to the cloud datasets. Though the codes and production facilities that produce the MYD08_M3 and CLDPROP_M3 aggregations are different, tests have shown that the CLDPROP_M3 results are indeed consistent with MYD08 when ingesting the MYD06 Level-2 products. Therefore, assessment of the CLDPROP aggregations is performed, in part, via direct comparison with C6.1 MYD08 Level-3 datasets, specifically the MYD08_M3 monthly product and, for cloud optical property phase fractions that are not available in MYD08_M3, monthly aggregations calculated from the MYD08_D3 daily product.

3. Results

Assessing the continuity of the current v1.1 CLDPROP cloud optical properties products is accomplished via comparisons of Aqua MODIS and SNPP VIIRS pixel-level retrieval results as well as spatial and temporal statistical aggregations. The assessment begins with a granule example of a scene observed concurrently by both imagers. A comparison of monthly aggregated cloud optical property retrieval statistics is then presented, followed by a comparison of multiyear time series for the overlapping Aqua MODIS and SNPP VIIRS data records.

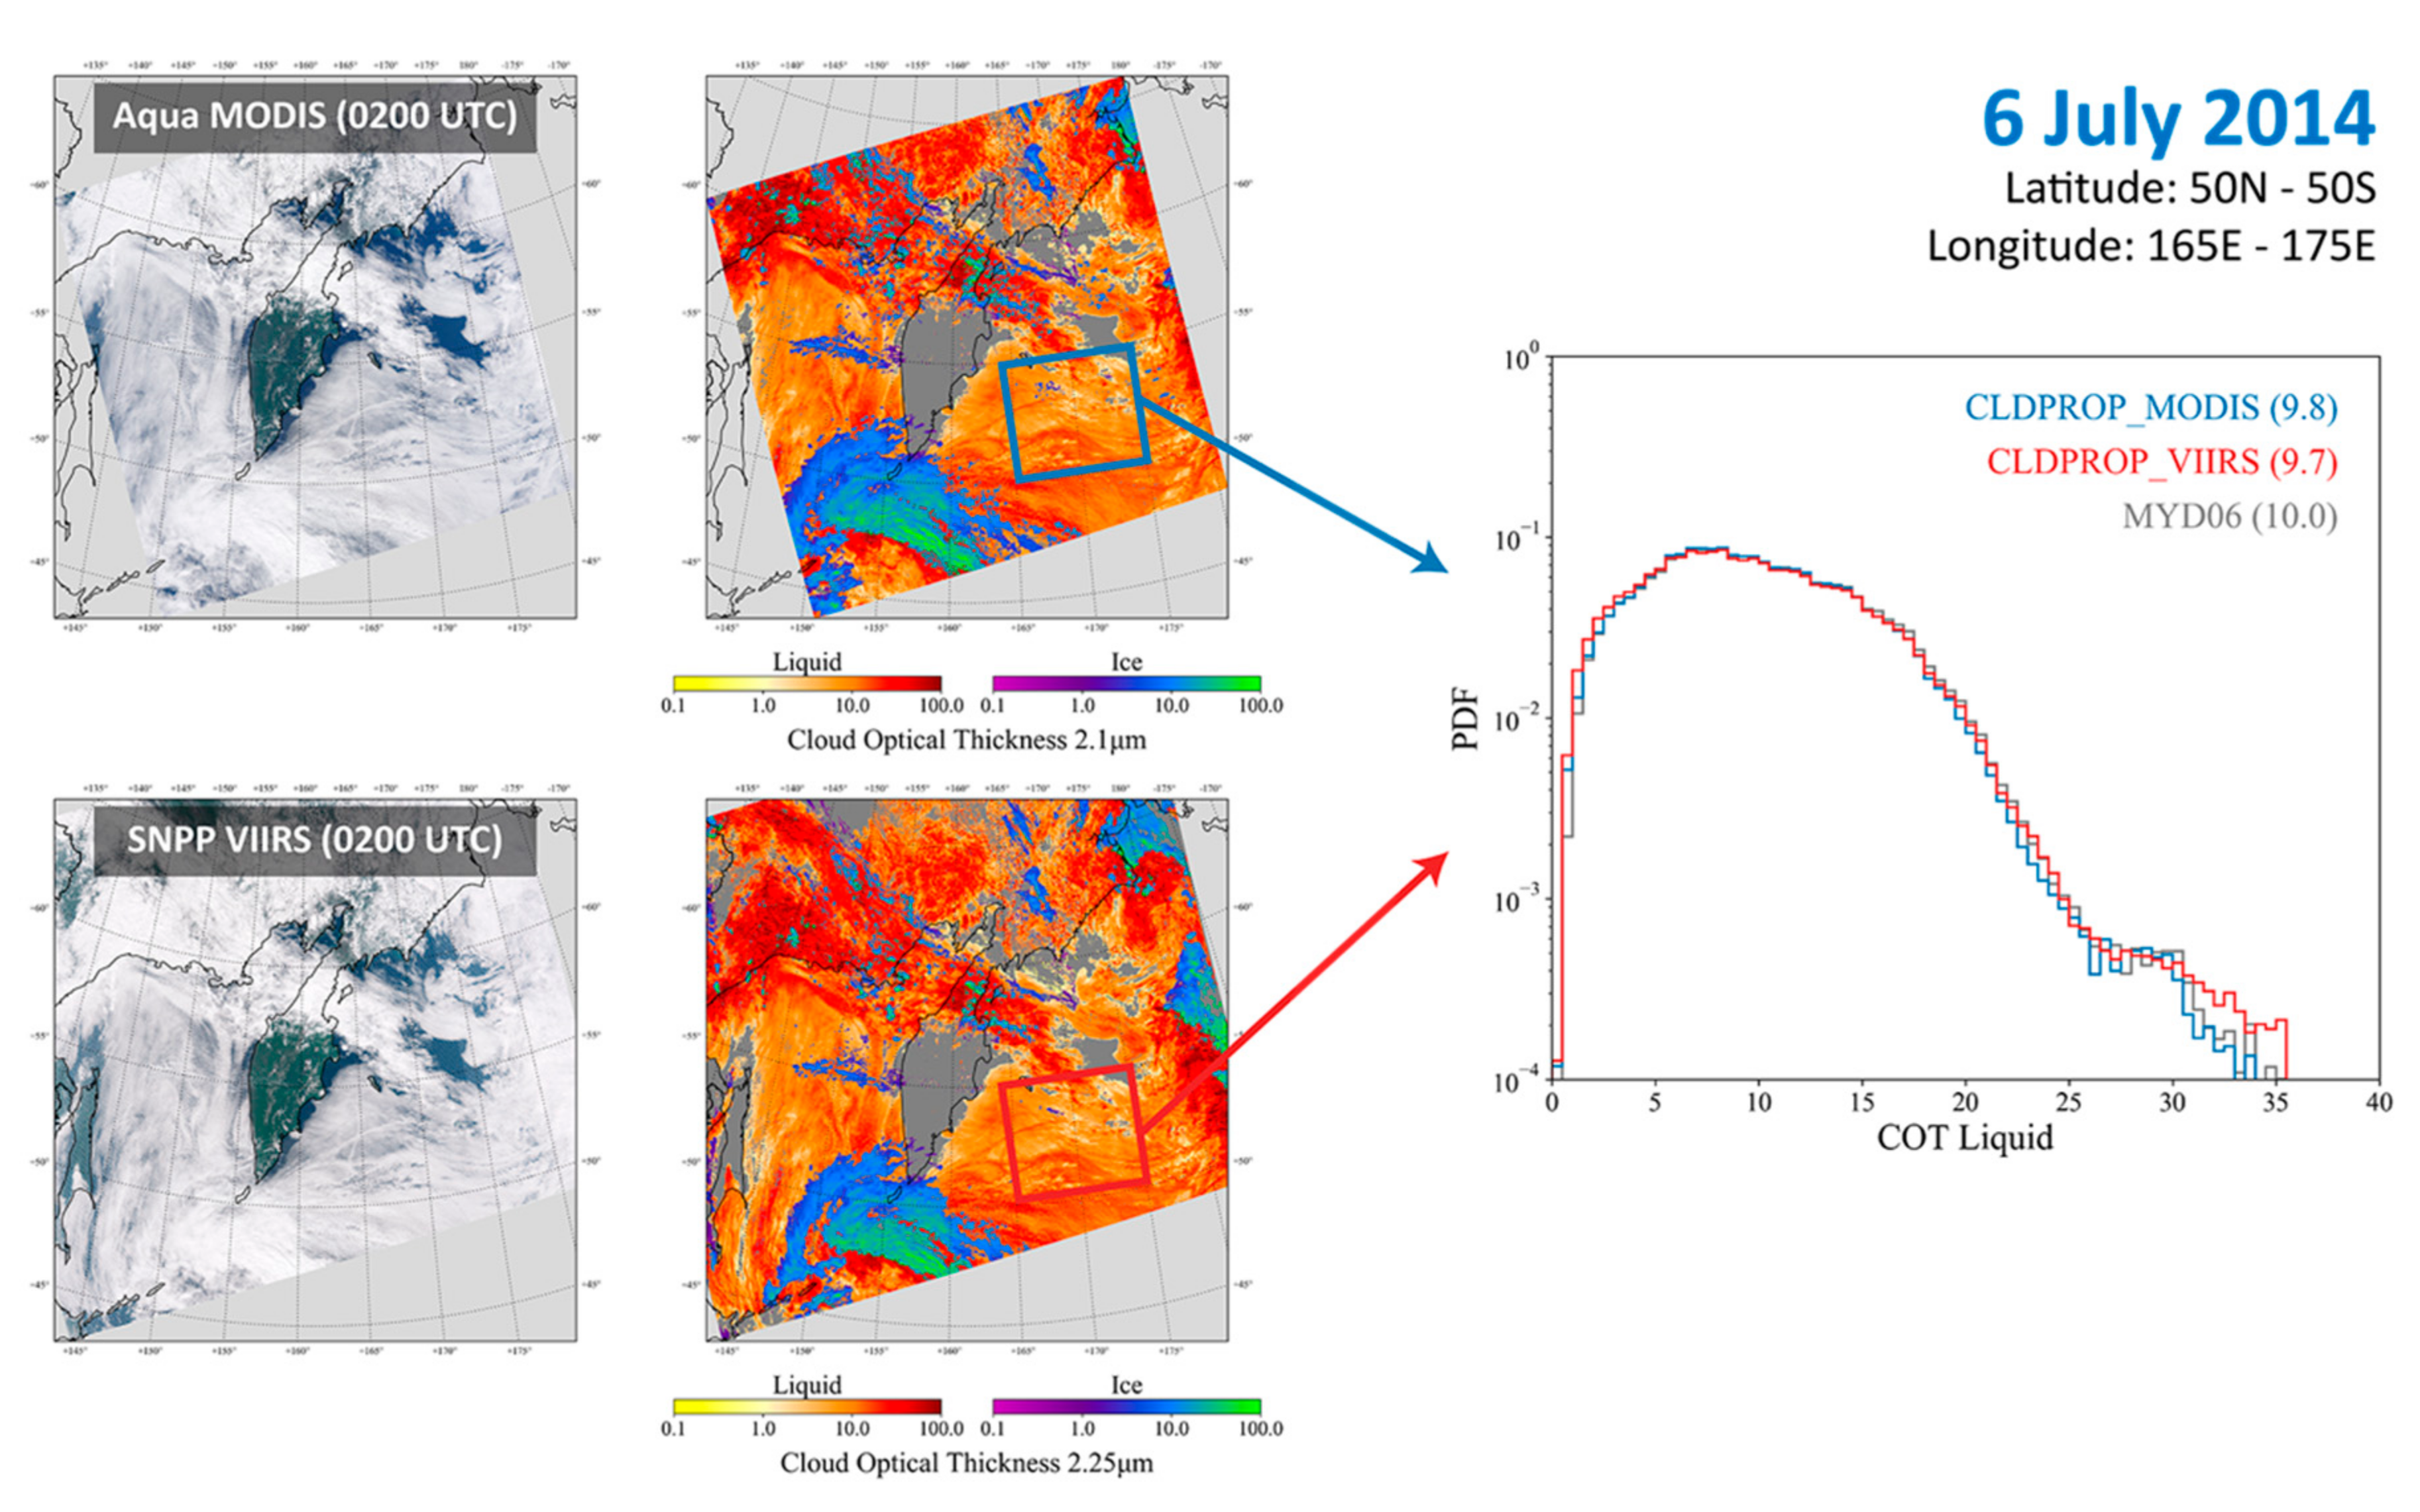
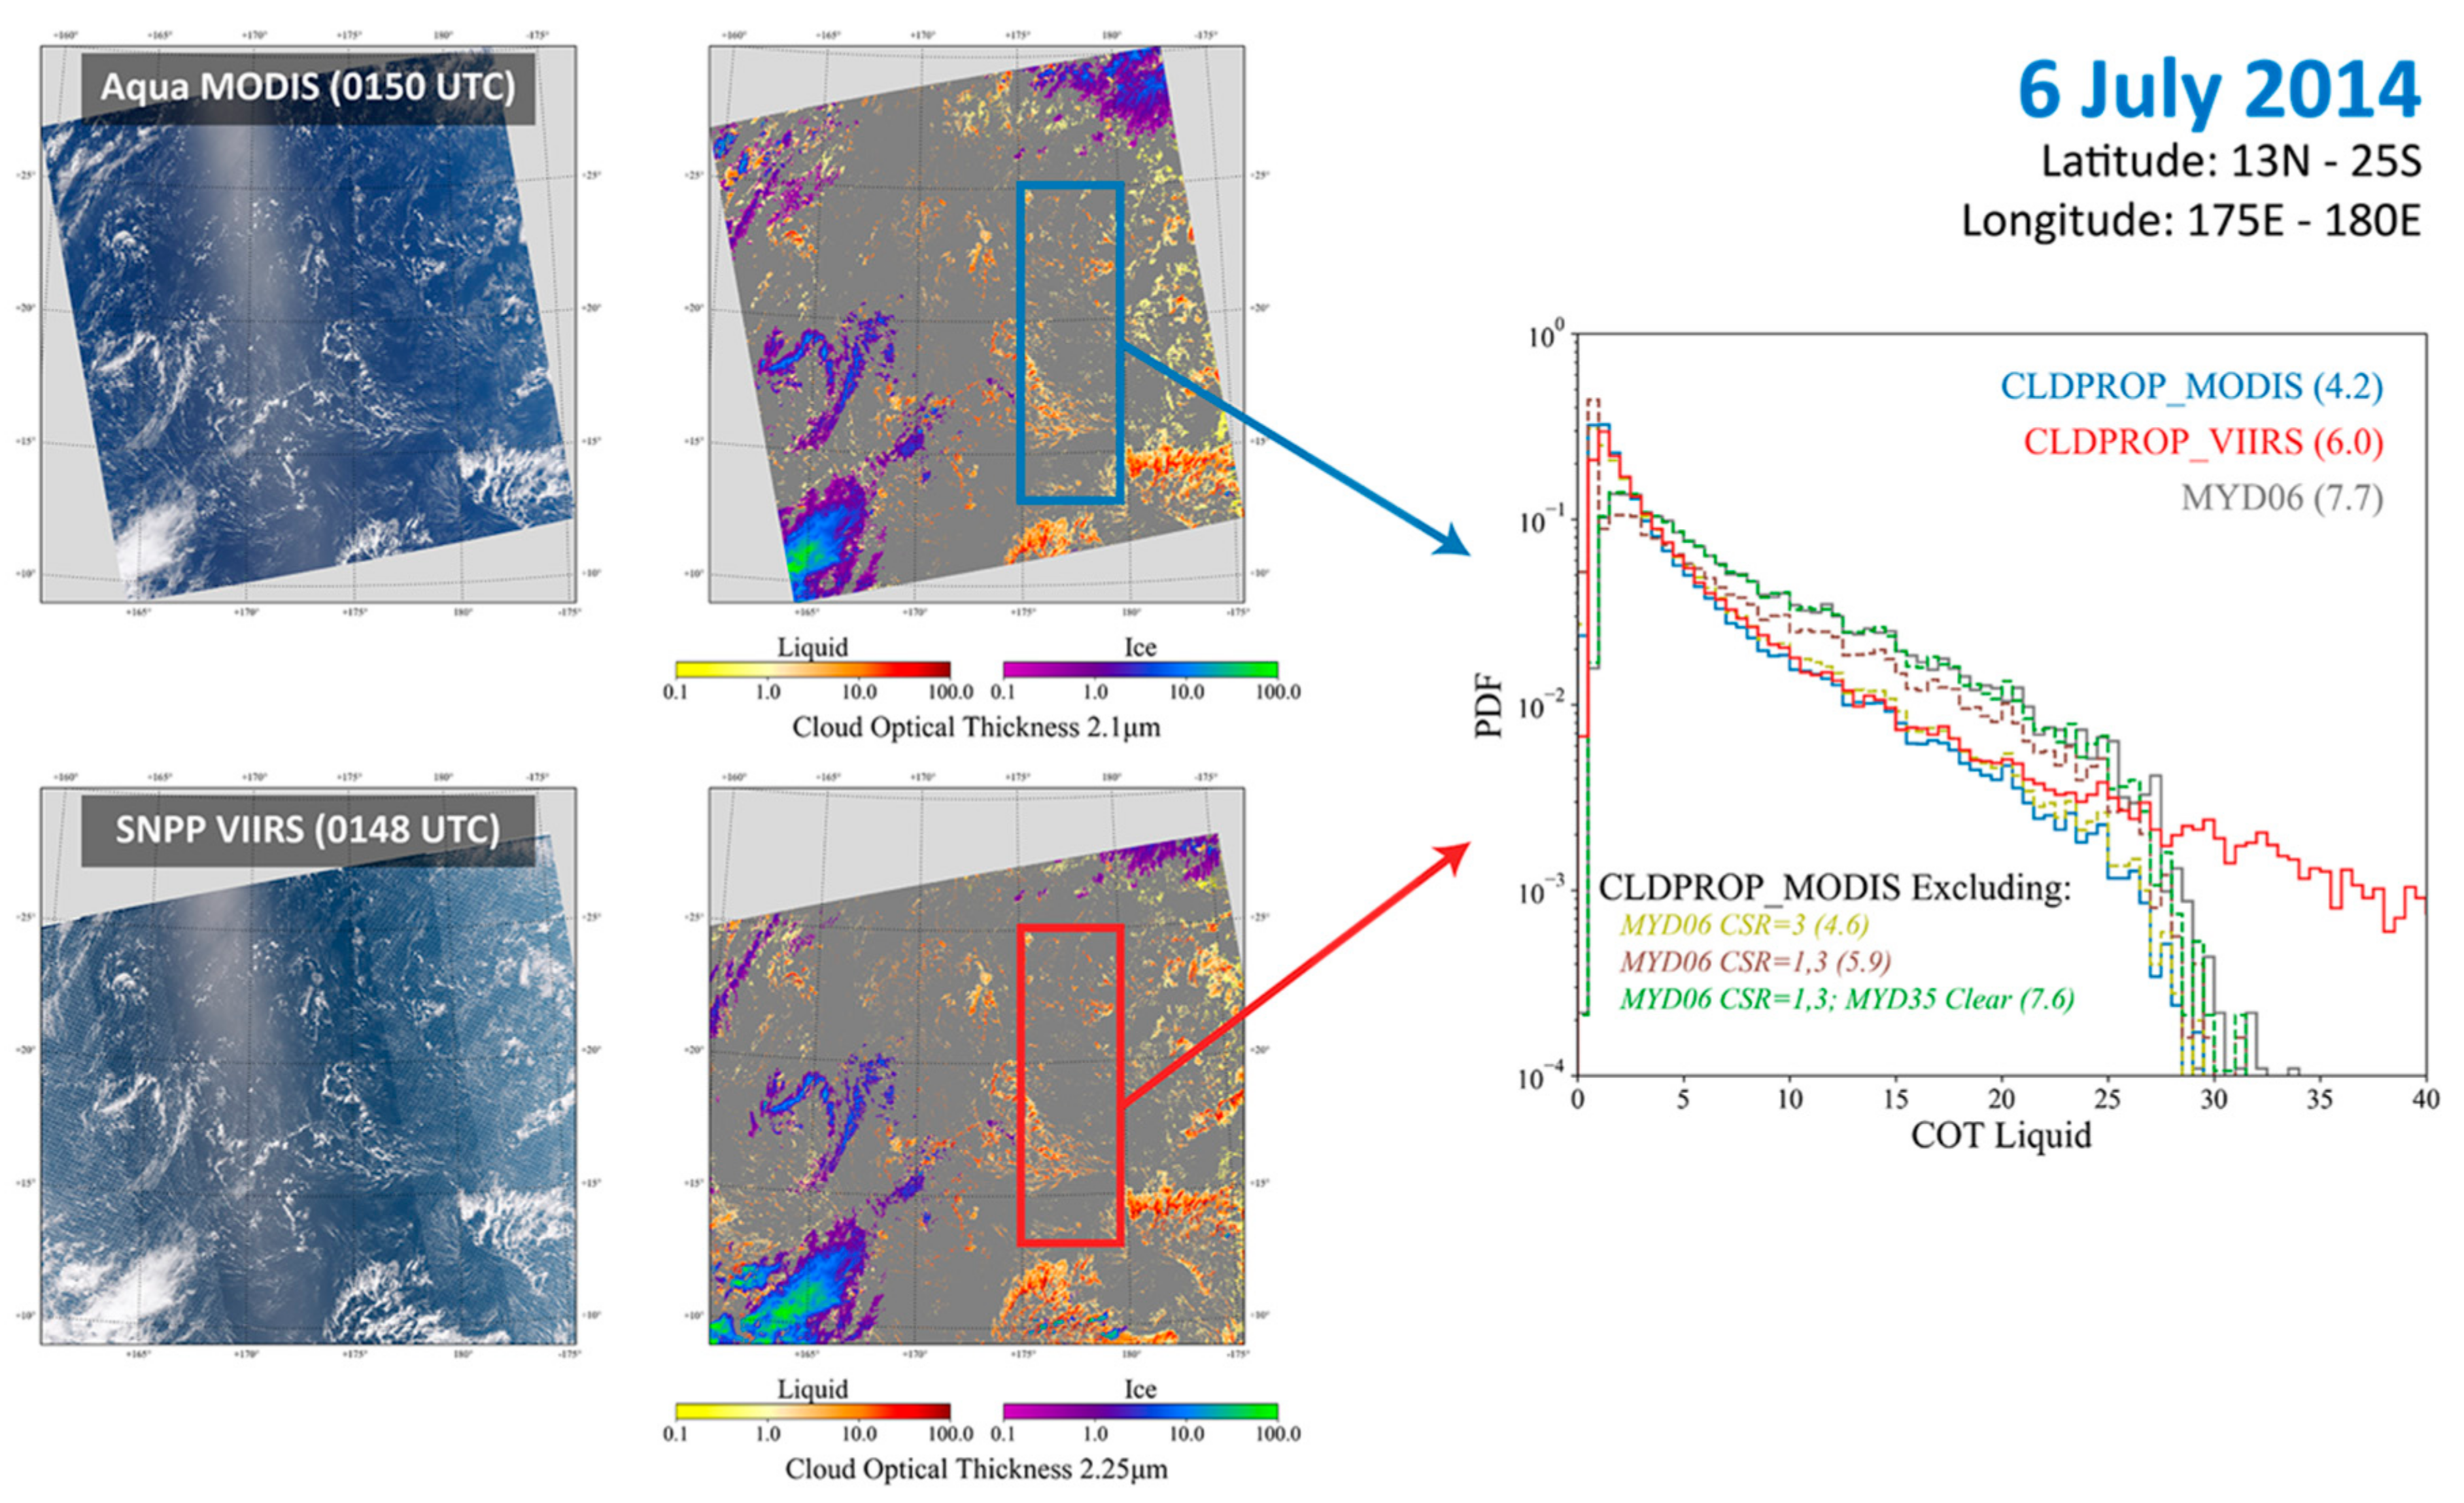
3.1. Granule Example

Figure 2 shows a heterogeneous cloud scene over the northern Atlantic Ocean observed concurrently by Aqua MODIS (left column, 1630 UTC granule) and SNPP VIIRS (right column, combined 1624 and 1630 UTC granules) on 29 November 2014 from nearly coincident ground tracks. Note that a common scene in Aqua MODIS and SNPP VIIRS can occur across different data granule times since the satellites are at different orbit altitudes, resulting in an approximate 3-day near (but not exact) co-location phasing of the two satellites, in addition to having different data granule temporal spans (5 and 6 min for MODIS and VIIRS, respectively). The top row (a) shows false color RGBs from MODIS (R: 2.13 µm, G: 0.86 µm, B: 0.66 µm) and VIIRS (R: 2.25 µm, G: 0.87 µm, B: 0.67 µm). The relatively white colorations are generally indicative of liquid water clouds, while the cyan colors generally indicate ice phase clouds. Notice the reduced color contrast for VIIRS in accordance with the expectations of Figure 1. The missing pixel pattern towards the edges of the VIIRS granules represents the bow-tie pixels in each scanline that are deleted during onboard processing. The middle row (b) shows the CLDPROP CSR results, with categories identified in the associated color bar. The bottom row (c) shows the CLDPROP cloud optical properties thermodynamic phase results, again with categories identified in the color bar. A cursory assessment of the CSR and phase results shows broad agreement between the Aqua MODIS and SNPP VIIRS CLDPROP datasets, though differences do exist that have implications on the monthly and time series statistics in the following sections. For instance, pixel size differences effect differences in cloud detection [53], here noticeably in the northwest portion of the granule where MODIS observes more clouds than VIIRS (see in particular the CSR results). In addition, phase differences, for example around 28° N latitude, 41° W longitude that appear to be associated with multilayer and multiphase clouds as suggested in the top row of the figure and confirmed with the MYD06 multilayer dataset (not shown), have implications on retrievals of CER as will be discussed below.
Aqua MODIS and SNPP VIIRS COT retrievals for the scene in Figure 2 are shown in Figure 3a, along with their relative pixel-level uncertainties in Figure 3b. As in Figure 2, Aqua MODIS is shown in the left column and SNPP VIIRS is shown in the right column. For the COT retrievals, a dual color bar denotes thermodynamic phase, with warm colors indicating a liquid or unknown phase and cool colors indicating an ice phase. Note also that the COT retrievals are for the overcast pixel population only, as determined by the CSR algorithm, while the COT retrieval uncertainties are for the combined overcast and cloud edge pixel population (white and dark blue pixels, respectively, in Figure 2b).
CER retrievals from the MODIS 2.13 µm and VIIRS 2.25 µm channels, collectively referred to as 2.x µm, for the scene in Figure 2 are shown in Figure 4a, along with their relative pixel-level uncertainties in Figure 4b. The results from Aqua MODIS and SNPP VIIRS again are shown in the left and right columns, respectively. A dual color bar in the CER figures denotes the thermodynamic phase. As in Figure 3, the CER retrievals are for the overcast pixel population only, as determined by the CSR algorithm, while the CER retrieval uncertainties are for the combined overcast and cloud edge pixel population. While differences between the two sensors for 2.x µm CER retrievals are evident in many parts of this scene, focusing on the likely multilayer/multiphase clouds within the regions indicated by the white and black boxes shown in Figure 4a is a useful demonstration of the challenges involved in achieving intersensor retrieval consistency. The black box is of interest because it shows a region having an abrupt phase discontinuity though the two sensors disagree on the exact location of the boundary (MODIS detecting more ice phase relative to VIIRS). The respective CER retrievals are comparable in magnitude even though the phase classification differs. In contrast, both sensors agree on a liquid phase just to the north of the boundary (location indicated by the arrow), though the MODIS 2.x µm CER is much larger than that from VIIRS, perhaps by 5 µm or more. This discrepancy can be explained by the existence of a low water cloud with an overlying optically thin ice cloud that is too thin to trigger an ice phase detection [47]. With much stronger ice absorption at 2.13 µm than at 2.25 µm (see the solution space plots in Figure 1 above, or Figure 3 in [20]), a thin ice cloud overlying a low liquid cloud depresses the TOA reflectance at 2.13 µm compared to at 2.25 µm, thus yielding larger retrieved liquid CER from MODIS. Moreover, in the heterogeneous, likely multilayer cloud region to the south, where both imagers detect ice phase clouds, VIIRS generally retrieves much larger 2.x µm CER than does MODIS, also consistent with the existence of a lower water cloud. These results in such complex scenes highlight the importance of multilayer cloud detection, which is omitted from CLDPROP due to VIIRS’s lack of NIR and IR absorption channels (see Section 2.4.3 and [46,47]), that can serve as cloud optical property retrieval QA.
CER retrievals from the 1.6 and 3.7 µm spectral channels are shown in Figure 5a,b, respectively. Once again, the results from Aqua MODIS and SNPP VIIRS are shown in the left and right columns, respectively. There is generally good agreement between the CLDPROP MODIS and VIIRS 1.6 and 3.7 µm CER retrievals. The ice phase clouds in particular do not appear to have the same divergence in the likely multilayer cloud regions, as is evident in the 2.x µm retrievals in Figure 4. It is important to note that intersensor CER agreement in this region is for analogous MODIS and VIIRS spectral channels that are nearly spectrally aligned, whereas the disagreement in the 2.x µm CER retrievals is from spectral channels that are not aligned and are in a spectral region where ice and liquid absorption vary substantially. This reemphasizes the challenges in achieving geophysical retrieval continuity across the two sensors when using the critical, yet spectrally mismatched, 2.x µm channels.

3.2. Continuity Evaluation Using Monthly Spatial Statistics

Granule-level comparisons are useful for pinpointing specific inconsistencies in algorithm performance across MODIS and VIIRS, such as the divergent CER results in the likely multilayer region discussed in Figure 4. However, given that a primary objective of the CLDPROP algorithms is to achieve a consistent, multi-decadal, multi-sensor cloud product data record for climate and radiation studies, a more appropriate assessment involves comparisons of spatiotemporal aggregations. In this section, comparisons of archived CLDPROP and MYD08 monthly gridded cloud optical property statistics (described in Section 2.5) are shown for February 2014. In all figures, the left column shows the monthly statistics for the SNPP VIIRS CLDPROP datasets, and the center column shows the absolute differences between the SNPP VIIRS and Aqua MODIS CLDPROP datasets, each of which are obtained from the CLDPROP_M3 monthly gridded product; these two columns have the “common algorithm” heading, indicating that the results are from the CLDPROP algorithms applied to both VIIRS and MODIS. The right column shows the absolute difference between the SNPP VIIRS CLDPROP datasets and like datasets from the heritage Aqua MODIS MYD06 product, obtained here from the MYD08_M3 monthly gridded product (or the MYD08_D3 daily product for the cloud optical properties phase fractions that are not available as a monthly aggregation). As such, the column demonstrates the intersensor absolute differences that would be expected had a common algorithm approach applied to both VIIRS and MODIS not been pursued. Presented in this way, smaller absolute differences in the center “VIIRS – MODIS Aqua” column versus the righthand “VIIRS – MYD08” column indicate the CLDPROP common algorithm approach applied to both VIIRS and MODIS is providing improved intersensor continuity over a VIIRS-only product compared with the heritage MODIS MYD06 algorithms.
Note that the focus of this section is on intersensor dataset continuity, specifically the impact of algorithm consistency (radiative models, ancillary datasets, aggregation choices, etc.) as described in Section 2.4, and not the overall accuracy of each sensor/algorithm dataset. While the standard MODIS cloud product suite uses more spectral channels, this only directly improves the information content for the cloud-top properties datasets (MODIS CO2 slicing channels [6,24,25]) and to a lesser extent the cloud mask [11,26] (CO2 and water vapor absorbing channels). Therefore, though both the common algorithm cloud-top and cloud mask datasets would be expected to have less inherent information content, the resulting impact on optical property dataset accuracy through the algorithm’s above-cloud atmospheric corrections and cloudy pixel sampling is not obvious. This is particularly true for liquid water clouds given the change in the choice of index of refraction datasets (Section 2.4.2). Consequently, the common algorithm optical property continuity results presented here should not necessarily be interpreted as synonymous with reduced information content or accuracy. Such a determination will have to wait for further study and is highly likely to depend on cloud type and region.
Figure 6 shows monthly daytime cloud fraction (top row) from the cloud mask and the cloud optical properties phase fractions derived from the cloud optical properties thermodynamic phase algorithm. Phase fraction is defined here as the fraction of all daytime pixel observations that are identified as either ice, liquid, or undetermined phase (rows indicated by the labels on the left), irrespective of the success of the cloud optical property retrieval algorithm, such that the sum of these three phase fractions in a given grid box equals the cloud fraction (top row) in that grid box (ignoring pixels “restored to clear sky” by the CSR algorithm–see Section 2.4.3–that are not flagged by the cloud mask algorithm). Note that the cloud fractions in the “common algorithm” columns are from the CLDMSK product [26], while the heritage MYD08 cloud fraction in the righthand column is from the MYD35 product [11,12,13]. For all three phase designations, there is no broad improvement in the phase agreement for the CLDPROP COP phase algorithm compared to that between CLDPROP VIIRS and MYD08 (with CLDPROP VIIRS showing overall smaller ice cloud fractions and larger liquid cloud fraction than either MODIS algorithm). This result perhaps is expected given that the CLDPROP COP phase algorithm is largely based on that of MYD06, with only limited modifications (see Section 2.4.3). However, there are obvious differences in the CLDMSK and heritage MYD35 daytime cloud fractions (top row) whose impacts on phase fractions are difficult to disentangle from those of phase algorithm modifications.
Ice and liquid cloud optical property retrieval fractions for overcast clouds for the same month are shown in Figure 7 and Figure 8, respectively. Retrieval fractions are defined as the fraction of total pixels that are identified as overcast by the CSR algorithm and result in successful cloud optical property (COT, CER) retrievals, and thus by definition are less than or equal to the ice and liquid phase fractions shown in Figure 6. Since the rate of cloud optical property retrieval success, or failure, is dependent on the SWIR or MWIR spectral channel used in the CER retrieval [54], retrieval fractions for the three core retrieval channel combinations are shown here, identified by their CER spectral channel (1.6 µm, 2.x µm, and 3.7 µm). Despite the overall smaller successful retrieval fractions, the ice cloud retrieval fractions in Figure 7 show intersensor and inter-algorithm absolute differences roughly consistent with the ice phase fraction differences in Figure 6. Likewise, the absolute differences between the MODIS and VIIRS CLDPROP products (common algorithm) are consistent with the liquid phase fraction differences in Figure 6. The CLDPROP VIIRS and MYD08 liquid retrieval fraction differences, however, are much larger over global oceans, with CLDPROP VIIRS having significantly higher retrieval fractions. This is largely due to differences in the CSR algorithms between CLDPROP and MYD06, namely the exclusion in CLDPROP of the sub-pixel cloud mask variability test that removes from the overcast pixel population those pixels over ocean that the 250 m MYD35 cloud mask tests indicate are only partially cloudy (see Section 2.4.3). Thus, the CLDPROP overcast pixel population is larger than that of MYD06, resulting in larger CLDPROP retrieval fractions than MYD08. Moreover, the exclusion of this test disproportionately affects the liquid phase pixel population since liquid clouds are generally more spatially heterogeneous than ice clouds. Nevertheless, these results highlight the importance to intersensor continuity of the common algorithm approach that applies consistent algorithm choices across all sensors.
Monthly COT means for the overcast pixel population in February 2014 are shown in Figure 9, separated by ice (top row) and liquid (bottom row) phase. COT here is derived from the standard channel pair that couples a non-absorbing VIS, NIR, or SWIR channel with the absorbing 2.x µm channel. There are two points to note. First, the intersensor and inter-algorithm absolute differences for ice clouds are rather noisy; the causes for this are not immediately obvious. The ice cloud radiative model assumption is consistent across both CLDPROP and MYD06, thus implying such differences might arise from differences in pixel populations, either due to inconsistent cloud mask or thermodynamic phase algorithm results. However, there appears to be little correlation with the cloud mask, phase, and retrieval fraction differences in Figure 6 and Figure 7. Further investigation is therefore necessary. Second, there are systematic biases in the CLDPROP continuity algorithm for liquid clouds (middle column, bottom row) over the global oceans, where CLDPROP VIIRS COT is larger than that of CLDPROP MODIS. Moreover, the absolute value of these CLDPROP differences appears to be larger than those between CLDPROP VIIRS and the heritage MYD08 (right column). As discussed in Section 2.3, radiometric adjustment factors are applied to the VIIRS shortwave channels prior to ingestion into the CLDPROP algorithm. To the extent that these adjustments were derived from homogeneous liquid cloud maritime scenes [34], consistent liquid COT over global oceans between VIIRS and MODIS CLDPROP should have been achieved by default. Rather, the positive differences for the continuity algorithm may indicate overcast cloud sampling differences in broken cloudy scenes due to inherent pixel field-of-view (FOV) differences. Likewise, the apparently smaller differences between CLDPROP VIIRS and MYD08 may be indicative of achieving a better result for the wrong reason(s), though in this case the impact is made more complicated by differences in the CSR algorithm that caused the liquid retrieval fraction differences in Figure 8. Such sampling differences and their impacts are discussed further in Section 4.
Monthly liquid CER means for the overcast pixel population in February 2014 are shown in Figure 10 for the individual CER spectral channels (1.6, 2.x, and 3.7 µm) used in the retrieval as indicated by the labels on the left. As discussed in Section 2.4.2, the CLDPROP algorithm uses different complex index of refraction datasets compared to those used by MYD06, thus the CER retrieval absolute differences between CLDPROP VIIRS and MYD08 (right column) are expected, as is the substantially improved agreement between the CLDPROP VIIRS and MODIS 2.x µm retrievals that use the same 265 K assumption (center column, middle row). VIIRS and MODIS CER differences for the 3.7 µm channels, on the other hand, flip signs for the CLDPROP continuity algorithm (center column) versus CLDPROP VIIRS and MYD08 (right column), with the continuity algorithm differences having slightly larger magnitudes. As with the SWIR channels, a refractive index change was also made for the 3.7 µm retrievals for CLDPROP, namely a 265 K dataset derived from [45] that was selected to provide consistency with the SWIR channel assumptions, at least in terms of the default cloud temperature used for forward modeling. That said, the reasons for this 3.7 µm liquid CER behavior remain unclear, and further investigation is warranted. Further details on index of refraction sensitivities for this example month are discussed in [20].
Monthly ice CER means for the overcast pixel population in February 2014 are shown in Figure 11, again separated by the CER spectral channel used in the retrieval. Similar to the COT means in Figure 9, the ice CER absolute differences shown here are noisier than those for liquid CER in Figure 10. In addition, the CLDPROP VIIRS and MODIS CER differences (center column) are quite large, particularly for the 2.x µm retrievals, for which VIIRS retrieves significantly larger CER than does MODIS, up to 6 µm or more at the monthly mean scale shown here. It is not clear if these differences for the 2.x µm channel retrievals are related to the bulk ice complex index of refraction assumption (e.g., [55] demonstrated sensitivities in the IR), as was the case for the liquid 2.x µm CER retrievals, to vertical heterogeneity arising from real microphysical process, e.g., crystal growth, sedimentation [56], or to some combination. As with the 3.7 µm liquid CER differences, further investigation into the 2.x µm ice CER differences is warranted.

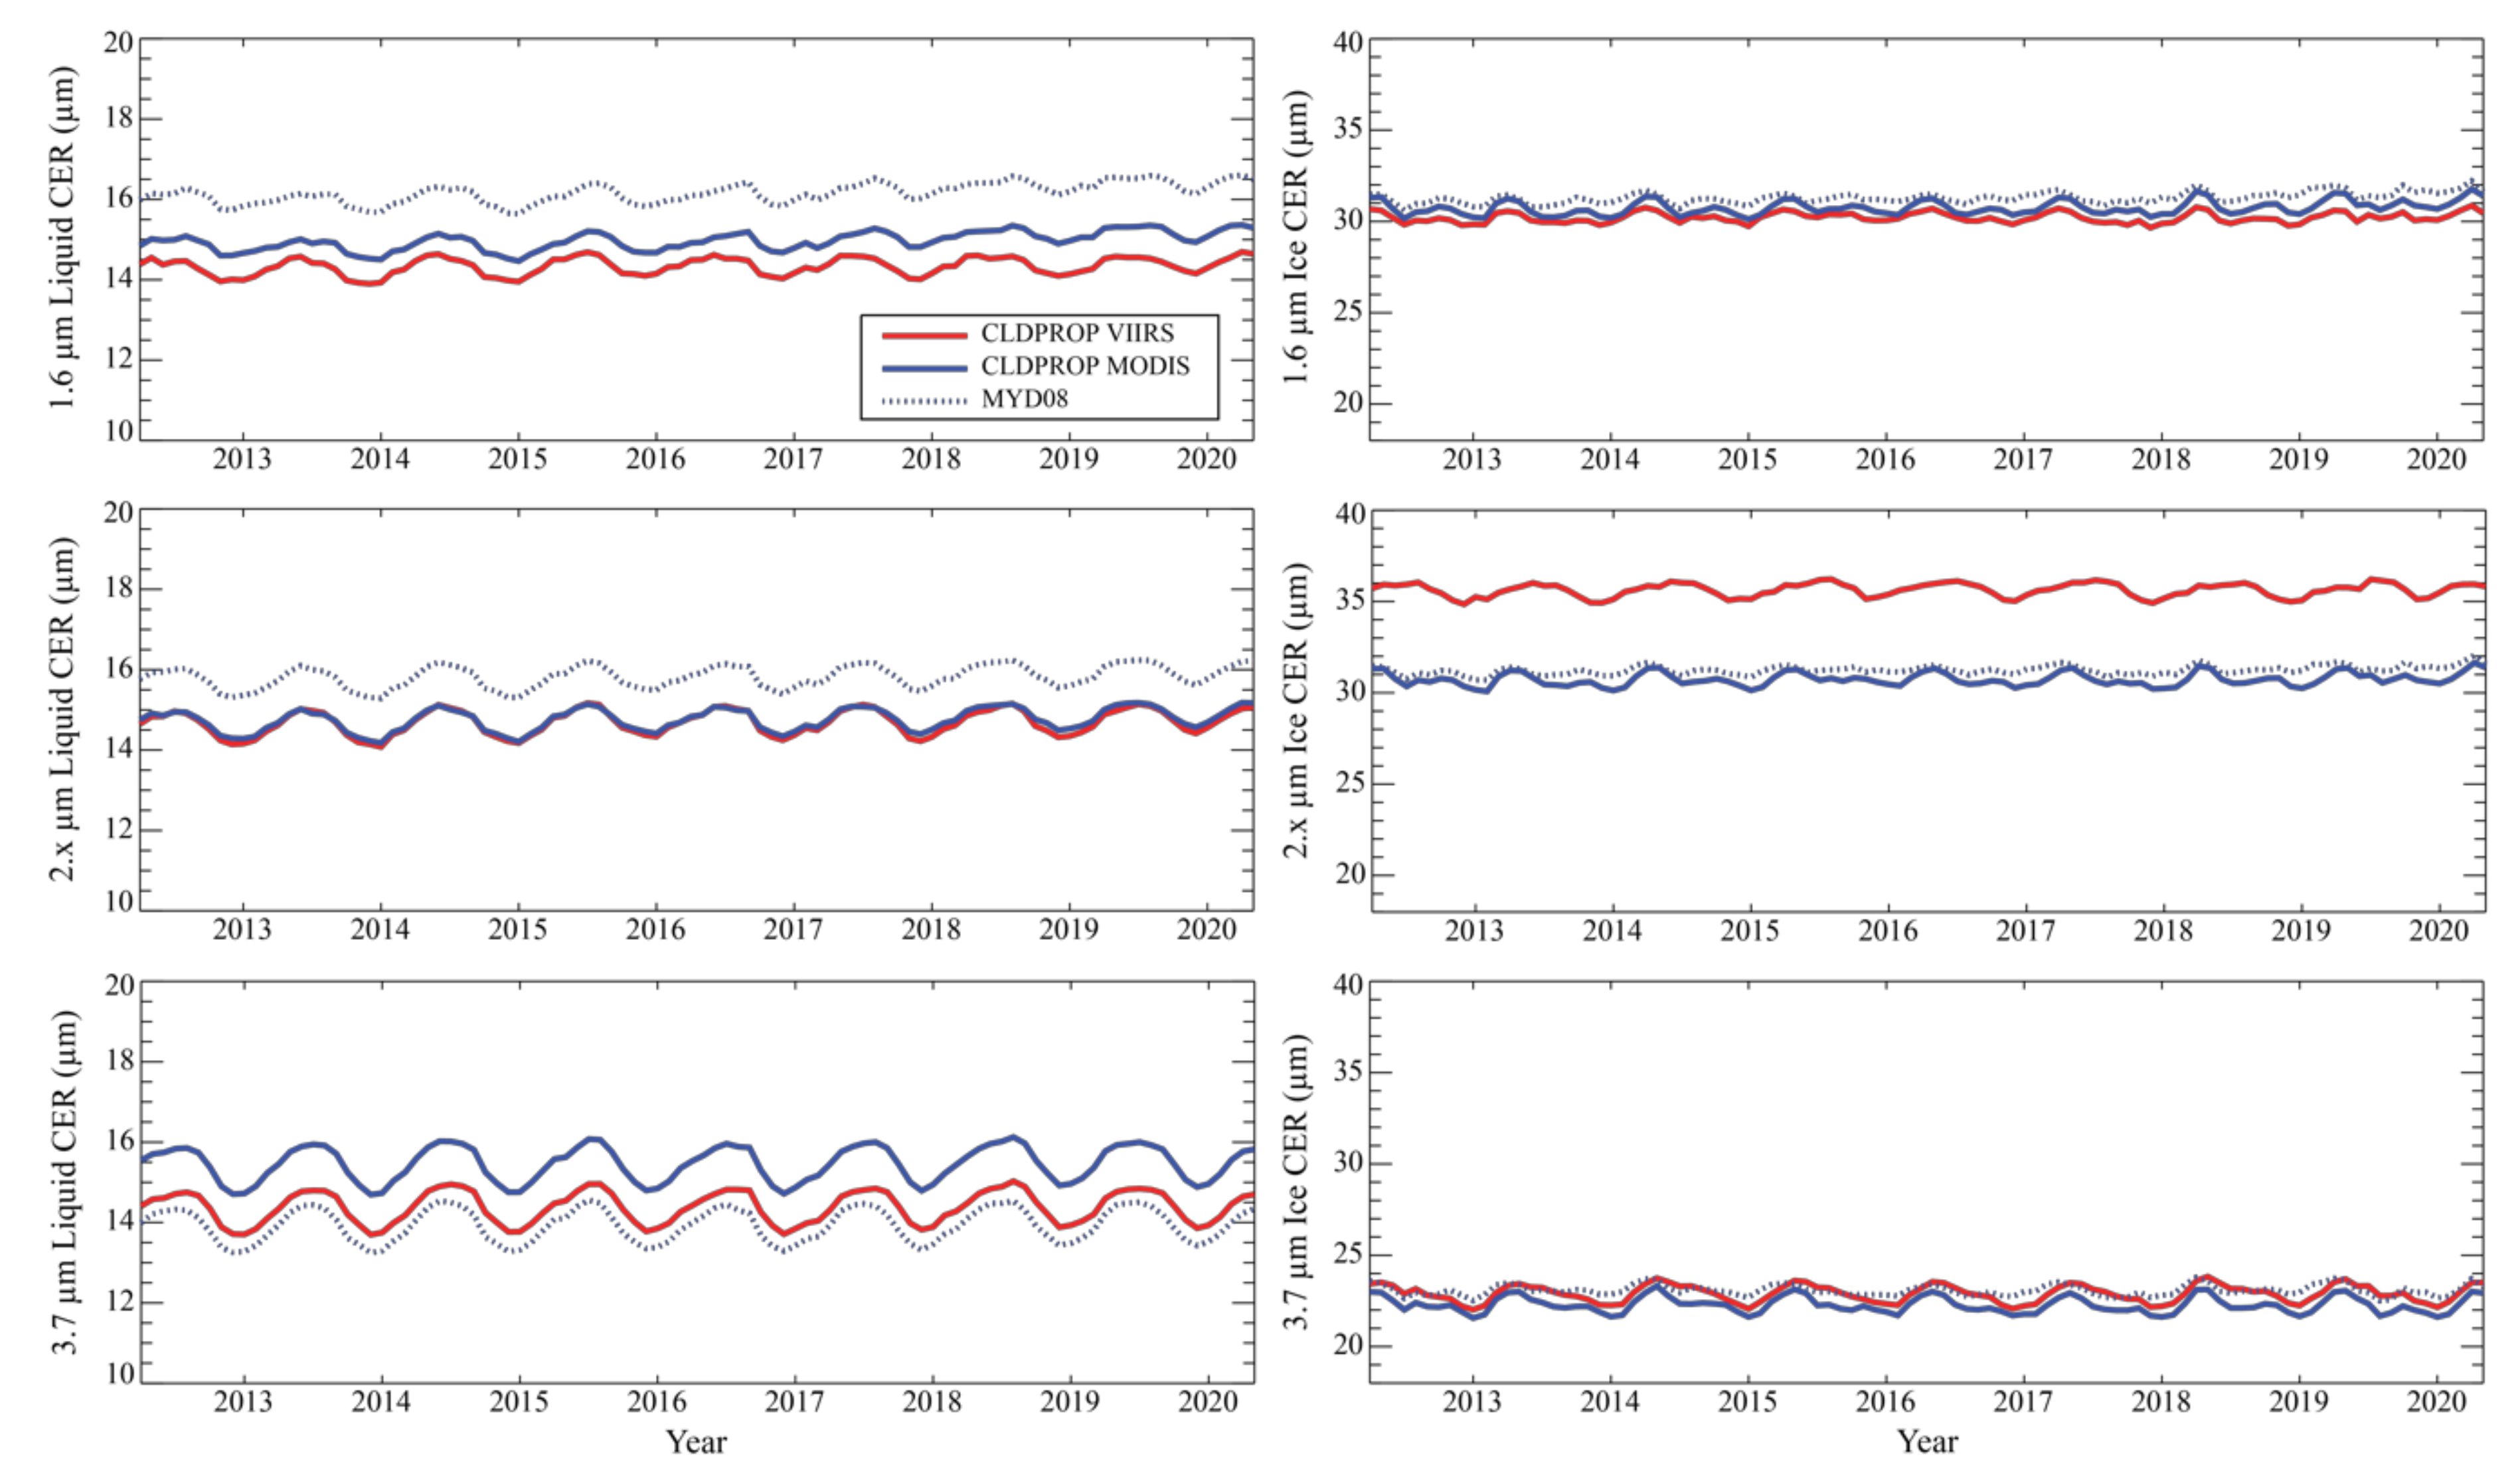
3.3. Continuity Evaluation Using Multi-Year Time Series

To evaluate the temporal continuity of the CLDPROP VIIRS and MODIS cloud optical properties datasets, the monthly gridded analysis of Section 3.2 is extended to a monthly time series for the common SNPP and Aqua data record from April 2012 through May 2020. Like the monthly analysis in Section 3.2, these time series are derived from the monthly global gridded products, namely v1.1 CLDPROP_M3 for the VIIRS and MODIS continuity datasets, and C6.1 MYD08_M3 for the heritage MODIS MYD06 datasets, where the monthly cloud optical properties phase fractions are once again derived from the MYD08_D3 daily product. Specifically, aggregation calculations are pixel-weighted for latitudes between 60° N and 60° S, thus excluding the polar regions, and include all surface types (land, ocean, sea ice, etc.). In all figures in this section, the VIIRS and MODIS CLDPROP datasets correspond to solid red and blue lines, respectively, while the MODIS MYD08 datasets correspond to the dotted blue lines. Therefore, the CLDPROP common algorithm paradigm for climate data record continuity across Aqua MODIS and SNPP VIIRS is supported when the solid blue and red lines are closer together than either are to the dotted blue line.
Time series of cloud optical properties phase fractions, derived from the cloud optical properties thermodynamic phase algorithm, are shown in Figure 12 for ice (top) and liquid (bottom) phases. Recalling the discussion of Figure 6, the phase fraction is defined as the fraction of all pixel observations that are identified as either ice, liquid, or undetermined (not shown) phase, irrespective of the success of the cloud optical property retrieval algorithm, such that their sum equals the corresponding cloud fraction (again, excluding from the cloudy pixel population those pixels “restored to clear sky” by the CSR algorithm). Across the entire data record, all phase fractions agree to within a few percent, though CLDPROP VIIRS identifies slightly more liquid clouds than CLDPROP MODIS and less ice clouds. Moreover, both CLDPROP fractions also agree with MYD08, an unsurprising result given that the CLDPROP algorithm is largely based on the MYD06 algorithm.
Cloud optical property retrieval fractions for liquid (left column) and ice (right column) phases are shown in Figure 13, separated by the spectral channel used in the CER retrieval as indicated by the row labels on the left. As in Figure 7 and Figure 14, the retrieval fractions here are defined as the fraction of total pixels that are identified as overcast by the CSR algorithm and result in successful cloud optical property (COT, CER) retrievals. Though the retrieval fractions will be smaller than the phase fractions in Figure 12, the general pattern is consistent with the phase fractions, namely that CLDPROP VIIRS observes more liquid clouds than does CLDPROP MODIS and less ice clouds. However, for liquid phase retrievals using the 1.6 µm channel (upper left) and ice phase retrievals using the 2.x µm channel (middle right), the comparatively larger disagreement implies higher retrieval failure rates for CLDPROP MODIS in the former and CLDPROP VIIRS in the latter. To the extent that COT and CER retrieval failures occur when the cloud radiative forward model is not an accurate representation of the scene, the causes of these enhanced failure rates (lower successful retrieval fractions) are difficult to pinpoint. Nevertheless, the lower retrieval fraction for the MODIS 1.6 µm liquid retrievals may result in part from enhanced horizontal heterogeneity effects in this less absorbing channel [54,57], which might have a greater impact on MODIS due to its larger pixel sizes compared to VIIRS, particularly at the edge of the scan. For the smaller VIIRS 2.x µm ice retrieval fractions, vertical heterogeneity effects, e.g., profiles of ice crystal shape and size, may be at play, given that ice absorption in the VIIRS 2.25 µm channel is smaller than in the MODIS 2.13 µm channel, and thus VIIRS may have sensitivity deeper into the cloud. Liquid water cloud heterogeneity effects are discussed further in Section 4 for an example scene.
The time series of ice (top) and liquid (bottom) monthly COT means for the overcast pixel population are shown in Figure 14. Consistent with the February 2014 results shown in Figure 9, the CLDPROP MODIS liquid COT time series is systematically smaller than either CLDPROP VIIRS or MYD08. This is likely the result, in part, of MODIS and VIIRS pixel resolution differences, in addition to differences in the Clear Sky Restoral algorithm implementation between CLDPROP and MYD06, that have impacts on sampling in broken or otherwise heterogeneous cloud scenes. These are discussed further in Section 4.
The time series of liquid (left column) and ice (right column) monthly CER means for the overcast pixel population are shown in Figure 15 for the three primary spectral retrieval channels (1.6, 2.x, and 3.7 µm) as indicated by the labels on the left. Consistent with Figure 10, the CLDPROP continuity algorithm provides the smallest discrepancy between MODIS and VIIRS for the 1.6 and 2.x µm liquid CER retrievals. However, the two MODIS liquid 3.7 µm CER means are quite different, with CLDPROP VIIRS agreeing better with MYD08. The MODIS differences are due, in part, to the different index of refraction assumptions used in CLDPROP and MYD06 (see Section 2.4.2); and, considering these different index of refraction assumptions, the better agreement of CLDPROP VIIRS with MYD08 is not expected, as discussed previously. For ice clouds, both CLDPROP and MYD08 agree for the 1.6 µm and 3.7 µm ice CER retrievals, though the CLDPROP VIIRS 2.x µm CER retrievals are substantially larger than either flavor of MODIS 2.x µm ice retrievals (also see Figure 11), perhaps the result of vertical heterogeneity effects that may also affect the 2.x µm ice retrieval fractions shown in Figure 13 or incorrect spectral index of refraction. Investigation of these differences is ongoing.

4. Discussion

The varying levels of agreement between the SNPP VIIRS and Aqua MODIS CLDPROP cloud optical properties datasets shown in Section 3, and their relation to the heritage Aqua MODIS MYD08 products derived from MYD06, bring to light a number of confounding factors, including differences in analogous spectral channel locations and sensor FOV, that have implications on the ability to achieve a continuous cloud optical property dataset that bridges MODIS and VIIRS.
To illustrate the impact of FOV differences between MODIS and VIIRS, Figure 16 and Figure 17 show case study granules from 6 July, 2014, for a liquid water overcast scene and a broken cloudy scene, respectively, where the Aqua and SNPP orbits were in rough alignment and MODIS and VIIRS viewed the same geographic region within a few minutes of each other. Figure 16 shows the MODIS and VIIRS true color RGBs and geolocated CLDPROP COT retrievals (CSR-identified overcast pixels only, retrievals from the VIS/NIR/SWIR-2.x µm channel pair) for a stratocumulus cloud deck off the Kamchatka Peninsula observed by both MODIS and VIIRS at 0200 UTC. Probability distributions of liquid phase COT for the geographic region highlighted by the blue and red boxes in the MODIS and VIIRS COT plots, respectively, are also shown, as is the corresponding COT distribution from MYD06 (gray line); the regional mean COT for each dataset is indicated within the parentheses in the respective plot labels. There is excellent agreement between CLDPROP and MYD06 for liquid phase COT for the relatively homogeneous clouds in this region, an indication that the VIIRS radiometric adjustments [34] yield desirable results.
Figure 17 shows similar plots for a broken cumulus scene over the central Pacific Ocean observed roughly ten minutes prior to the scene in Figure 16 (MODIS and VIIRS observation times 0150 and 0148 UTC, respectively). Here, while the CLDPROP MODIS (blue line) and CLDPROP VIIRS (red line) liquid COT probability distributions (again, overcast pixels only) agree quite well for COT less than about 20, they sharply disagree at larger COT, with VIIRS exhibiting a long tail resulting in a considerably larger mean COT (6.0 versus 4.2 for CLDPROP MODIS). The MYD06 mean COT (gray line) is even larger (7.7), despite the fact that its distribution does not exhibit a long tail like CLDPROP VIIRS.
The divergent COT histograms in Figure 17 point toward some combination of sampling and FOV differences. Focusing first on the divergence of CLDPROP MODIS and MYD06, where FOV impacts are eliminated and only sampling differences remain, two underlying causes are at play, namely differences in the upstream cloud mask algorithms (CLDMSK generally yields higher cloud fraction over ocean than does MYD35, see Figure 6) and the exclusion of the MYD06 CSR sub-pixel variability test (CSR = 3) in CLDPROP (see Section 2.4.3). These two factors collectively yield more overcast cloud pixels in CLDPROP MODIS (and CLDPROP VIIRS) compared to MYD06. Successively removing pixels from the CLDPROP MODIS overcast population that are not included in the same MYD06 population, namely those identified by MYD06 as partly cloudy (CSR = 3, gold line) and cloud edge (CSR = 1, brown line), and finally those identified by MYD35 as clear sky (green line), show that CLDPROP MODIS COT agrees quite well with MYD06, as should be expected since the pixel population is now consistent.
The divergence between CLDPROP MODIS and CLDPROP VIIRS at COT larger than 20, on the other hand, is likely primarily due to FOV differences that can have impacts on both sampling and the influence of cloud heterogeneity. Whereas the CLDPROP VIIRS minus CLDPROP MODIS liquid phase retrieval fraction differences for the VIS/NIR/SWIR-2.x µm channel pair are relatively small on average (Figure 8, middle row, center panel), the sampling differences in this specific broken cloud scene are not negligible. Indeed, the liquid cloud retrieval fraction—i.e., the fraction of successful optical property retrievals for overcast pixels—for the region in Figure 17 is roughly 9% for CLDPROP VIIRS compared to 12.5% for CLDPROP MODIS. The implication of this sampling difference is that the higher fraction from the coarser resolution MODIS is more likely to include pixels that are not completely cloudy; note again that the MYD06 sub-pixel cloudiness CSR test is not applied in CLDPROP—for reference, the MYD06 liquid retrieval fraction for this same region is roughly only 4%. Furthermore, such sub-pixel heterogeneity is expected to yield smaller retrieved COT due to radiative smoothing (e.g., [58]), a consequence that will affect MODIS to a greater extent than VIIRS, since the across-swath pixel growth of VIIRS is limited by its onboard detector aggregation scheme [33]. Though FOV differences can plausibly explain the remaining COT differences between CLDPROP MODIS and CLDPROP VIIRS, fully disentangling the intersensor retrieval consequences of FOV differences on cloudy pixel sampling versus sub-pixel heterogeneity is challenging to quantify.
Beyond FOV differences, the seemingly innocuous spectral offset between the MODIS 2.13 µm and VIIRS 2.25 µm channels is shown in Figure 10, Figure 11 and Figure 15 to have substantial impacts on intersensor liquid and ice phase CER retrieval continuity. As was discussed in detail in [20], and briefly in this paper in Section 2.4.2, the inconsistency observed in liquid CER retrievals from these 2.x µm channels using forward models consistent with C6.1 MYD06 revealed a likely forward model deficiency involving the assumed complex index of refraction for liquid water. While the update to a supercooled liquid water assumption (265 K) in the SWIR [19] yielded improved global consistency in liquid CER retrievals from the MODIS and VIIRS 2.x µm channels (see Figure 10 and Figure 15), the correlation of 2.x µm liquid CER retrieval differences with cloud-top temperature shown in Figure 9 in [20] suggests a temperature-dependent imaginary index of refraction is needed. Furthermore, the equivalent index of refraction update in the MWIR [45] did not yield similar improvement in liquid CER retrieval consistency from the 3.7 µm channels, again suggesting that the optimal liquid index of refraction assumptions remain an open question. Moreover, the ice phase 2.x µm CER retrieval differences shown in Figure 11 and Figure 15 suggest a deficiency in the ice cloud forward model, perhaps attributable to similar complex index of refraction assumptions for ice (e.g., [55] showed temperature sensitivities of the ice refractive index in the IR), though the agreement for the 1.6 and 3.7 µm CER retrievals for all three products shown suggests otherwise. Alternatively, the larger spectral mismatch in the 2.x µm channels (see Table 1), coupled with the fact that ice is substantially less absorbing in the VIIRS 2.25 µm channel versus the MODIS 2.13 µm channel (see Figure 1 above), may indicate that vertical heterogeneity arising from real microphysical processes, e.g., crystal growth and sedimentation that would tend towards particle sizes that decrease with height within the cloud [56], may be influencing the behavior of CER retrievals from spectral channels having different vertical sensitivities. This hypothesis is consistent with the fact that CER retrievals from the 1.6 and 2.x µm spectral regions are much larger than those from the 3.7 µm spectral region (see again Figure 11 and Figure 15) where ice absorption is largest, as well as with the VIIRS 2.25 µm channel, where ice absorption is weakest, giving the largest CER retrievals. If this physical explanation accounts for a significant part of these observed differences, then ice CER retrieval continuity across the MODIS 2.13 µm and VIIRS 2.25 µm channels may not be achievable, insofar as continuity is defined as intersensor retrievals having the same values. These spectral CER results are tantalizing, and their implications are being explored. In addition, tools for understanding platform sensitivities, e.g., scattering angle and time sampling due to Aqua and SNPP being in different orbital planes, have been developed and are being investigated.
As was discussed in Section 2.4.3, due to the lack of key SWIR and IR absorption channels on VIIRS, the CLDPROP cloud optical properties product algorithms omit portions of the clear sky restoral (CSR) algorithm tests and several additional pixel-level metrics that provide useful scene quality assurance (QA) in MYD06. Moreover, a pragmatic choice was made to implement a modified version of the C6.1 MYD06 cloud thermodynamic phase algorithm. Since the release of the v1.0/v1.1 products, our efforts have focused on addressing these algorithm differences and omissions in future versions. For thermodynamic phase, we have been exploring machine learning approaches that, using the VIIRS SWIR and IR channels alone, can provide equivalent or better skill than the more spectrally capable C6.1 MYD06 algorithm that is currently implemented in modified form in CLDPROP [59]. Similar tools are being explored for identifying multilayer cloud scenes that can have adverse impacts on CER retrievals [18,47], specifically exploiting the information content of the 1.38 µm water vapor absorption band (e.g., [48]). For the CSR algorithm, where the MYD06 250 m sub-pixel heterogeneity tests were omitted for CLDPROP, we will explore an appropriate use of the co-located VIIRS 375 m I-bands for similar sub-pixel information; a notable caveat that must be addressed, however, is the dissimilar mapping of the I-bands into the VIIRS 750 m M-band pixels compared to that of the MODIS 250 m observations into the 1 km pixels. Ultimately, the goals of these efforts are twofold—to advance the state of the art in imager cloud optical property retrievals and to enhance their usefulness to the scientific community.

5. Conclusions

Development of geophysical data product continuity between disparate instruments requires, to the extent possible, the use of common algorithms. Algorithm commonality includes the radiative forward models (and assumptions therein), the inversion methodology, pre-/post-processing data filtering, and supporting ancillary datasets. Data filtering can be explicit (e.g., scene classification(s), quality assurance (QA) and uncertainty assignments) or implicit (e.g., failure of the algorithm to successfully retrieve values within the solution space, instrument-related differences). The only exception to this common algorithm paradigm is if the forward radiative models are without error for observations from both instruments (which are also without error) and if each set of observations has complete (unambiguous, unique) information content for the retrieved geophysical quantities. Of course, none of these ideal situations is ever true.
Product continuity is particularly challenging across the MODIS (EOS) and VIIRS (SNPP, JPSS) cloud products due to key missing or mismatched spectral channels. In addition, there are inherent scan-dependent pixel field-of-view and sampling differences between the sensors. Thus, algorithm commonality—to the extent it can be achieved—is a necessary condition for data continuity between these sensors but may not be sufficient. Here, we described a common cloud optical property algorithm (CLDPROP) applied to both SNPP VIIRS and Aqua MODIS observations for a common 8-year observation period. The results were compared between the two continuity products and with the Aqua MODIS standard cloud product (MYD06).
For the v1.1 release of the CLDPROP MODIS and VIIRS cloud optical property products, good agreement is found between their respective cloud thermodynamic phase classifications, as the global liquid and ice phase fractions agree to within a couple of percent, though VIIRS generally finds more liquid clouds and less ice clouds than MODIS (Figure 6 and Figure 12). For cloud optical property retrieval success/failure (e.g., the ice and liquid retrieval fractions in Figure 7, Figure 8 and Figure 13), higher liquid cloud failure rates are found for the MODIS VIS/NIR/SWIR-1.64 µm channel pair versus the VIIRS VIS/NIR/SWIR-1.61 µm channel pair, and for the ice cloud VIIRS VIS/NIR/SWIR-2.25 µm channel pair versus the MODIS VIS/NIR/SWIR-2.13 µm channel pair. The liquid failure rate pattern is perhaps linked to the higher sensitivity of 1.6 µm CER retrievals to heterogeneity effects that are expected to be larger for MODIS than for VIIRS due to FOV differences. As discussed in the previous section, the ice cloud failure rate pattern requires further investigation.
For retrievals of cloud optical thickness (COT), liquid retrievals (Figure 9 and Figure 14) show differences, despite having served as the basis for the derivation of the VIIRS shortwave radiometric adjustment factors [34] that were applied prior to processing the CLDMSK and CLDPROP algorithms. However, these are plausibly attributable to sampling differences in broken cloudy regimes arising from the FOV differences between MODIS and VIIRS, as discussed in Figure 16 and Figure 17. For retrievals of cloud particle effective size (CER), the implementation of a new liquid complex index of refraction dataset, namely for supercooled clouds (265 K temperature), yields good agreement between retrievals from the analogous MODIS and VIIRS 2.x µm channels; for retrievals from the analogous MODIS and VIIRS 1.6 µm channels, the continuity approach is defensible, as the CLDPROP MODIS and VIIRS retrieval means are closer together than either are to the MYD06 means (e.g., Figure 15). However, the analogous MODIS and VIIRS 3.7 µm liquid CER retrievals show significant disagreement, a result that requires further investigation. Likewise, mixed results are found for ice clouds, where the respective CER retrievals from the 1.6 and 3.7 µm channels show good agreement while those from the 2.x µm channels diverge substantially. This latter disagreement may be linked to vertical heterogeneity or the ice imaginary index of refraction (see the discussion in Section 4), though further investigation is also warranted.

Author Contributions

Conceptualization, S.P.; methodology, S.P. and K.M.; software, K.M. (analy-sis code), N.A. (analysis code), G.W. (Level-2), P.A.H. (Level-3), R.E.H. (analysis code), B.M., S.D., P.V.; formal analysis, S.P., K.M., and N.A.; data production assistance, R.E.H.; writing–review and editing, S.P. and K.M.; visualizations, N.A., K.M., and S.P.; project administration, S.P. All authors have read and agreed to the published version of the manuscript.

Funding

This research was supported by the NASA Earth Science Division Terra Aqua Suomi NPP 2017 ROSES solicitation (NNH17ZDA001N-TASNPP).

Acknowledgments

We appreciate helpful input from Michael D. King during the development of these continuity products. We are grateful to Denis Botambekov, Liam Gumley and Elaine Prins from the NASA Atmosphere Science Investigator-led Processing System (A-SIPS), University of Wisconsin-Madison Space Science and Engineering Center, for their assistance in processing the CLDPROP VIIRS and MODIS Level-2 and Level-3 files used in this study. We thank the NASA Goddard Space Flight Center Level-1 and Atmosphere Archive and Distribution System (LAADS) (ladsweb.modaps.eosdis.nasa.gov) where production versions of the VIIRS and MODIS CLDPROP cloud continuity products and the MODIS standard cloud products are available.

Conflicts of Interest

The authors declare no conflict of interest.

References

  1. Salomonson, V.V.; Barnes, W.L.; Maymon, P.W.; Montgomery, H.E.; Ostrow, H. MODIS: Advanced facility instrument for studies of the Earth as a system. IEEE Trans. Geosci. Remote Sens. 1989, 27, 145–153. [Google Scholar] [CrossRef]
  2. Twomey, S.; Cocks, T. Spectral Reflectance of Clouds in the Near-Infrared: Comparison of Measurements and Calculations. J. Meteorol. Soc. Jpn. 1982, 60, 583–592. [Google Scholar] [CrossRef] [Green Version]
  3. Arking, A.; Childs, J.D. Retrieval of Cloud Cover Parameters from Multispectral Satellite Images. J. Appl. Meteorol. Clim. 1985, 24, 322–333. [Google Scholar] [CrossRef] [Green Version]
  4. Nakajima, T.; King, M.D. Determination of the optical-thickness and effective particle radius of clouds from reflected solar-radiation measurements. Part 1: Theory. J. Atmos. Sci. 1990, 47, 1878–1893. [Google Scholar] [CrossRef] [Green Version]
  5. Menzel, W.P.; Smith, W.L.; Stewart, T.R. Improved Cloud Motion Wind Vector and Altitude Assignment Using VAS. J. Appl. Meteorol. Clim. 1983, 22, 377–384. [Google Scholar] [CrossRef]
  6. Menzel, W.P.; Frey, R.A.; Zhang, H.; Wylie, D.P.; Moeller, C.C.; Holz, R.E.; Maddux, B.; Baum, B.A.; Strabala, K.I.; Gumley, L.E. MODIS Global Cloud-Top Pressure and Amount Estimation: Algorithm Description and Results. J. Appl. Meteorol. Climatol. 2009, 47, 1175–1198. [Google Scholar] [CrossRef] [Green Version]
  7. Gao, B.-C.; Goetz, A.F.H.; Wiscombe, W.J. Cirrus cloud detection from Airborne Imaging Spectrometer data using the 1.38 µm water vapor band. Geophys. Res. Lett. 1993, 20, 301–304. [Google Scholar] [CrossRef]
  8. Gao, B.-C.; Kaufman, Y.J. Selection of the 1.375-mu m MODIS channel for remote sensing of cirrus clouds and stratospheric aerosols from space. J. Atmos. Sci. 1995, 52, 4231–4237. [Google Scholar] [CrossRef]
  9. Meyer, K.; Platnick, S. Utilizing the MODIS 1.38 μm channel for cirrus cloud optical thickness retrievals: Algorithm and retrieval uncertainties. J. Geophys. Res. Atmos. 2010, 115. [Google Scholar] [CrossRef]
  10. Ackerman, S.A.; Strabala, K.I.; Menzel, W.P.; Frey, R.A.; Moeller, C.C.; Gumley, L.E. Discriminating clear sky from clouds with MODIS. J. Geophys. Res. 1998, 103, 32141–32157. [Google Scholar] [CrossRef]
  11. Frey, R.A.; Ackerman, S.A.; Liu, Y.; Strabala, K.I.; Zhang, H.; Key, J.; Wang, X. Cloud Detection with MODIS. Part I: Improvements in the MODIS Cloud Mask for Collection 5. J. Atmos. Ocean. Technol. 2008, 25, 1057–1072. [Google Scholar] [CrossRef]
  12. Ackerman, S.A.; Holz, R.E.; Frey, R.; Eloranta, E.W.; Maddux, B.C.; McGill, M. Cloud Detection with MODIS. Part II: Validation. J. Atmospheric Ocean. Technol. 2008, 25, 1073–1086. [Google Scholar] [CrossRef] [Green Version]
  13. Ackerman, S.A.; Frey, R.; Strabala, K.I.; Liu, Y.; Gumley, L.E.; Baum, B.; Menzel, W.P. Discriminating Clear-Sky from Cloud with MODIS—Algorithm Theoretical Basis Document; NASA: Washington, DC, USA, 2010.
  14. Baum, B.A.; Menzel, W.P.; Frey, R.A.; Tobin, D.C.; Holz, R.E.; Ackerman, S.A.; Heidinger, A.K.; Yang, P. MODIS Cloud-Top Property Refinements for Collection 6. J. Appl. Meteorol. Climatol. 2012, 51, 1145–1163. [Google Scholar] [CrossRef]
  15. Platnick, S.; King, M.D.; Ackerman, S.A.; Menzel, W.P.; Baum, B.A.; Riédi, J.C.; Frey, R.A. The MODIS cloud products: Algorithms and examples from terra. IEEE Trans. Geosci. Remote Sens. 2003, 41, 459–473. [Google Scholar] [CrossRef] [Green Version]
  16. Platnick, S.; Meyer, K.G.; Yang, P.; Ridgway, W.L.; Riedi, J.C.; King, M.D.; Wind, G.; Amarasinghe, N.; Marchant, B.; Arnold, G.T.; et al. The MODIS Cloud Optical and Microphysical Products: Collection 6 Updates and Examples from Terra and Aqua. IEEE Trans. Geosci. Remote Sens. 2017, 55, 502–525. [Google Scholar] [CrossRef] [PubMed] [Green Version]
  17. Wielicki, B.A.; Young, D.F.; Mlynczak, M.G.; Thome, K.J.; Leroy, S.; Corliss, J.; Anderson, J.G.; Ao, C.O.; Bantges, R.; Best, F.; et al. Achieving Climate Change Absolute Accuracy in Orbit. Bull. Am. Meteorol. Soc. 2013, 94, 1519–1539. [Google Scholar] [CrossRef] [Green Version]
  18. Wind, G.; Platnick, S.; King, M.D.; Hubanks, P.A.; Pavolonis, M.J.; Heidinger, A.K.; Yang, P.; Baum, B.A. Multilayer Cloud Detection with the MODIS Near-Infrared Water Vapor Absorption Band. J. Appl. Meteorol. Climatol. 2010, 49, 2315–2333. [Google Scholar] [CrossRef]
  19. Kou, L.; Labrie, D.; Chylek, P. Refractive-indexes of water and ice in the 0.65- to 2.5-µm spectral range. Appl. Opt. 1993, 32, 3531–3540. [Google Scholar] [CrossRef] [Green Version]
  20. Platnick, S.; Meyer, K.; Amarasinghe, N.; Wind, G.; Hubanks, P.; Holz, R. Sensitivity of Multispectral Imager Liquid Water Cloud Microphysical Retrievals to the Index of Refraction. Remote Sens. 2020, 12, 4165. [Google Scholar] [CrossRef]
  21. Stubenrauch, C.J.; Rossow, W.B.; Kinne, S.; Ackerman, S.; Cesana, G.; Chepfer, H.; Di Girolamo, L.; Getzewich, B.; Guignard, A.; Heidinger, A.; et al. Assessment of Global Cloud Datasets from Satellites: Project and Database Initiated by the GEWEX Radiation Panel. Bull. Am. Meteorol. Soc. 2013, 94, 1031–1049. [Google Scholar] [CrossRef]
  22. Hamann, U.; Walther, A.; Baum, B.A.; Bennartz, R.; Bugliaro, L.; Derrien, M.; Francis, P.N.; Heidinger, A.; Joro, S.; Kniffka, A.; et al. Remote sensing of cloud top pressure/height from SEVIRI: Analysis of ten current retrieval algorithms. Atmos. Meas. Tech. 2014, 7, 2839–2867. [Google Scholar] [CrossRef] [Green Version]
  23. Roebeling, R.A.; Baum, B.; Bennartz, R.; Hamann, U.; Heidinger, A.; Meirink, J.F.; Stengel, M.; Thoss, A.; Walther, A.; Watts, P. Summary of the Fourth Cloud Retrieval Evaluation Workshop. Bull. Am. Meteorol. Soc. 2015, 96, ES71–ES74. [Google Scholar] [CrossRef]
  24. Heidinger, A.K.; Pavolonis, M.J. Gazing at Cirrus Clouds for 25 Years through a Split Window. Part I: Methodology. J. Appl. Meteorol. Climatol. 2009, 48, 1100–1116. [Google Scholar] [CrossRef]
  25. Heidinger, A.K.; Bearson, N.; Foster, M.J.; Li, Y.; Wanzong, S.; Ackerman, S.; Holz, R.E.; Platnick, S.; Meyer, K. Using Sounder Data to Improve Cirrus Cloud Height Estimation from Satellite Imagers. J. Atmos. Ocean. Technol. 2019, 36, 1331–1342. [Google Scholar] [CrossRef]
  26. Frey, R.A.; Ackerman, S.A.; Holz, R.E.; Dutcher, S.; Griffith, Z. The Continuity MODIS-VIIRS Cloud Mask. Remote Sens. 2020, 12, 3334. [Google Scholar] [CrossRef]
  27. Minnis, P.; Sun-Mack, S.; Young, D.F.; Heck, P.W.; Garber, D.P.; Chen, Y.; Spangenberg, D.A.; Arduini, R.F.; Trepte, Q.Z.; Smith, W.L.; et al. CERES Edition-2 Cloud Property Retrievals Using TRMM VIRS and Terra and Aqua MODIS Data—Part I: Algorithms. IEEE Trans. Geosci. Remote Sens. 2011, 49, 4374–4400. [Google Scholar] [CrossRef]
  28. Minnis, P.; Sun-Mack, S.; Chen, Y.; Khaiyer, M.M.; Yi, Y.; Ayers, J.K.; Brown, R.R.; Dong, X.; Gibson, S.C.; Heck, P.W.; et al. CERES Edition-2 Cloud Property Retrievals Using TRMM VIRS and Terra and Aqua MODIS Data—Part II: Examples of Average Results and Comparisons With Other Data. IEEE Trans. Geosci. Remote Sens. 2011, 49, 4401–4430. [Google Scholar] [CrossRef]
  29. King, M.D.; Platnick, S.; Yang, P.; Arnold, G.T.; Gray, M.A.; Riedi, J.C.; Ackerman, S.A.; Liou, K.-N. Remote Sensing of Liquid Water and Ice Cloud Optical Thickness and Effective Radius in the Arctic: Application of Airborne Multispectral MAS Data. J. Atmos. Ocean. Technol. 2004, 21, 857–875. [Google Scholar] [CrossRef]
  30. King, M.D.; Platnick, S.; Wind, G.; Arnold, G.T.; Dominguez, R.T. Remote sensing of radiative and microphysical properties of clouds during TC4: Results from MAS, MASTER, MODIS, and MISR. J. Geophys. Res. Atmos. 2010, 115. [Google Scholar] [CrossRef] [Green Version]
  31. LAADS DAAC. Available online: https://ladsweb.modaps.eosdis.nasa.gov/ (accessed on 8 August 2020).
  32. Level-1 and Atmosphere Archive & Distribution System. In NASA Visible Infrared Imaging Radiometer Suite Level-1B Product User Guide; NASA Goddard Space Flight Center: Greenbelt, MD, USA, 2018.
  33. Cao, C.; Xiong, X.; Wolfe, R.; DeLuccia, F.; Liu, Q.; Blonski, S.; Lin, G.; Nishihama, M.; Pogorzala, D.; Oudrari, H.; et al. Visible Infrared Imaging Radiometer Suite (VIIRS) Sensor Data Record (SDR) User’s Guide; NOAA Technical Report NESDIS 142A; NOAA: Washington, DC, USA, 2013.
  34. Meyer, K.; Platnick, S.; Holz, R.; Dutcher, S.; Quinn, G.; Nagle, F. Derivation of Shortwave Radiometric Adjustments for SNPP and NOAA-20 VIIRS for the NASA MODIS-VIIRS Continuity Cloud Products. Remote Sens. 2020, 12, 4096. [Google Scholar] [CrossRef]
  35. Wind, G.; Platnick, S.; Meyer, K.; Arnold, T.; Amarasinghe, N.; Marchant, B.; Wang, C. The CHIMAERA system for retrievals of cloud top, optical and microphysical properties from imaging sensors. Comput. Geosci. 2020, 134, 104345. [Google Scholar] [CrossRef]
  36. Meyer, K.; Yang, Y.; Platnick, S. Uncertainties in cloud phase and optical thickness retrievals from the Earth Polychromatic Imaging Camera (EPIC). Atmos. Meas. Tech. 2016, 9, 1785–1797. [Google Scholar] [CrossRef] [PubMed] [Green Version]
  37. Yang, Y.; Meyer, K.; Wind, G.; Zhou, Y.; Marshak, A.; Platnick, S.; Min, Q.; Davis, A.B.; Joiner, J.; Vasilkov, A.; et al. Cloud products from the Earth Polychromatic Imaging Camera (EPIC): Algorithms and initial evaluation. Atmos. Meas. Tech. 2019, 12, 2019–2031. [Google Scholar] [CrossRef] [PubMed] [Green Version]
  38. Meyer, K.; Platnick, S.; Arnold, G.T.; Holz, R.E.; Veglio, P.; Yorks, J.; Wang, C. Cirrus cloud optical and microphysical property retrievals from eMAS during SEAC4RS using bi-spectral reflectance measurements within the 1.88 µm water vapor absorption band. Atmos. Meas. Tech. 2016, 9, 1743–1753. [Google Scholar] [CrossRef] [PubMed] [Green Version]
  39. Unidata. Network Common Data Form (netCDF) Version 4; UCAR/Unidata: Boulder, CO, USA, 2020. [Google Scholar]
  40. Rodgers, C.D. Inverse Methods for Atmospheric Sounding: Theory and Practice; World Scientific Publishing Co., Inc.: Hackensack, NJ, USA, 2000. [Google Scholar]
  41. Hale, G.M.; Querry, M.R. Optical Constants of Water in the 200-nm to 200-μm Wavelength Region. Appl. Opt. 1973, 12, 555–563. [Google Scholar] [CrossRef]
  42. Palmer, K.F.; Williams, D. Optical properties of water in the near infrared. J. Opt. Soc. Am. 1974, 64, 1107–1110. [Google Scholar] [CrossRef]
  43. Downing, H.D.; Williams, D. Optical constants of water in the infrared. J. Geophys. Res. Atmos. 1975, 80, 1656–1661. [Google Scholar] [CrossRef]
  44. Yang, P.; Bi, L.; Baum, B.A.; Liou, K.-N.; Kattawar, G.W.; Mishchenko, M.I.; Cole, B. Spectrally Consistent Scattering, Absorption, and Polarization Properties of Atmospheric Ice Crystals at Wavelengths from 0.2 to 100 μm. J. Atmos. Sci. 2013, 70, 330–347. [Google Scholar] [CrossRef]
  45. Wagner, R.; Benz, S.; Möhler, O.; Saathoff, H.; Schnaiter, M.; Schurath, U. Mid-infrared Extinction Spectra and Optical Constants of Supercooled Water Droplets. J. Phys. Chem. A 2005, 109, 7099–7112. [Google Scholar] [CrossRef]
  46. Marchant, B.; Platnick, S.; Meyer, K.; Arnold, G.T.; Riedi, J. MODIS Collection 6 shortwave-derived cloud phase classification algorithm and comparisons with CALIOP. Atmos. Meas. Tech. 2016, 9, 1587–1599. [Google Scholar] [CrossRef] [Green Version]
  47. Marchant, B.; Platnick, S.; Meyer, K.; Wind, G. Evaluation of the Aqua MODIS Collection 6.1 multilayer cloud detection algorithm through comparisons with CloudSat CPR and CALIPSO CALIOP products. Atmos. Meas. Tech. 2020. [Google Scholar] [CrossRef]
  48. Pavolonis, M.J.; Heidinger, A.K. Daytime Cloud Overlap Detection from AVHRR and VIIRS. J. Appl. Meteorol. 2004, 43, 762–778. [Google Scholar] [CrossRef] [Green Version]
  49. Derber, J.C.; Parrish, D.F.; Lord, S.J. The New Global Operational Analysis System at the National Meteorological Center. Weather Forecast. 1991, 6, 538–547. [Google Scholar] [CrossRef] [Green Version]
  50. Schaaf, C.B.; Liu, J.; Gao, F.; Strahler, A. Aqua and Terra MODIS albedo and reflectance anisotropy products. In Land Remote Sensing and Global Environmental Change: NASA’s Earth Observing System and the Science of ASTER and MODIS; Ramachandran, B., Justice, C., Abrams, M., Eds.; Springer: New York, NY, USA, 2011; pp. 549–561. [Google Scholar]
  51. Brodzik, M.J.; Stewart, J.S. Near-Real-Time SSM/I-SSMIS EASE-Grid Daily Global Ice Concentration and Snow Extent, Version 5; NASA National Snow and Ice Data Center Distributed Active Archive Center: Boulder, CO, USA, 2016. [CrossRef]
  52. Seemann, S.W.; Borbas, E.E.; Knuteson, R.O.; Stephenson, G.R.; Huang, H.-L. Development of a Global Infrared Land Surface Emissivity Database for Application to Clear Sky Sounding Retrievals from Multispectral Satellite Radiance Measurements. J. Appl. Meteorol. Clim. 2008, 47, 108–123. [Google Scholar] [CrossRef]
  53. Dey, S.; Di Girolamo, L.; Zhao, G. Scale effect on statistics of the macrophysical properties of trade wind cumuli over the tropical western Atlantic during RICO. J. Geophys. Res. Atmos. 2008, 113. [Google Scholar] [CrossRef] [Green Version]
  54. Cho, H.-M.; Zhang, Z.; Meyer, K.; Lebsock, M.; Platnick, S.; Ackerman, A.S.; Di Girolamo, L.; C.-Labonnote, L.; Cornet, C.; Riedi, J.; et al. Frequency and causes of failed MODIS cloud property retrievals for liquid phase clouds over global oceans. J. Geophys. Res. Atmos. 2015, 120, 4132–4154. [Google Scholar] [CrossRef] [PubMed]
  55. Iwabuchi, H.; Yang, P. Temperature dependence of ice optical constants: Implications for simulating the single-scattering properties of cold ice clouds. J. Quant. Spectrosc. Radiat. Transf. 2011, 112, 2520–2525. [Google Scholar] [CrossRef]
  56. Van Diedenhoven, B.; Ackerman, A.; Fridlind, A.M.; Cairns, B.; Riédi, J. Global Statistics of Ice Microphysical and Optical Properties at Tops of Optically Thick Ice Clouds. J. Geophys. Res. Atmos. 2020, 125, 401–421. [Google Scholar] [CrossRef]
  57. Zhang, Z.; Platnick, S. An assessment of differences between cloud effective particle radius retrievals for marine water clouds from three MODIS spectral bands. J. Geophys. Res. Atmos. 2011, 116. [Google Scholar] [CrossRef] [Green Version]
  58. Kato, S.; Hinkelman, L.M.; Cheng, A. Estimate of satellite-derived cloud optical thickness and effective radius errors and their effect on computed domain-averaged irradiances. J. Geophys. Res. Atmos. 2006, 111. [Google Scholar] [CrossRef]
  59. Wang, C.; Platnick, S.; Meyer, K.; Zhang, Z.; Zhou, Y. A machine-learning-based cloud detection and thermodynamic-phase classification algorithm using passive spectral observations. Atmos. Meas. Tech. 2020, 13, 2257–2277. [Google Scholar] [CrossRef]
Figure 1. Example COT and CER solution space for liquid (red lines) and ice (blue lines) phase clouds for the (a) Aqua MODIS 0.86–2.13 µm and (b) SNPP VIIRS 0.87–2.25 µm channel pairs. The viewing geometry is denoted in the plot. Because thermodynamic phase information is indicated by a separation of the liquid and ice solution space, the VIIRS 2.25 µm channel’s phase information is more ambiguous compared with the analogous MODIS channel.
Remotesensing 13 00002 g001
Figure 2. An example scene over the northern Atlantic Ocean on 29 November 2014, observed by Aqua MODIS (left column, 1630 UTC granule) and SNPP VIIRS (right column, 1624 and 1630 UTC granules) nearly simultaneously from coincident ground tracks. (a) False color SWIR-NIR-VIS composites (see text for details). (b) Results of the cloud optical properties Clear Sky Restoral algorithm (see Section 2.4.3). (c) Results of the cloud optical properties thermodynamic phase algorithm.
Remotesensing 13 00002 g002
Figure 3. Aqua MODIS (left column) and SNPP VIIRS (right column) CLDPROP cloud optical thickness (COT) retrieval results for the scene in Figure 2. (a) COT for the designated overcast pixel population, i.e., Clear Sky Restoral (CSR) = 0, with a dual color bar indicating thermodynamic phase. (b) COT retrieval uncertainty for all cloudy pixels, regardless of CSR designation.
Remotesensing 13 00002 g003
Figure 4. Aqua MODIS (left column) and SNPP VIIRS (right column) CLDPROP cloud effective radius (CER) retrieval results from the analogous MODIS 2.13 µm and VIIRS 2.25 µm spectral channels (collectively referred to as 2.x µm) for the scene in Figure 2. (a) CER for the overcast (CSR = 0) pixel population, with a dual color bar indicating thermodynamic phase. (b) CER retrieval uncertainty for all cloudy pixels, regardless of CSR designation. The boxes and arrow indicate likely multilayer and multiphase scenes (see text for further details).
Remotesensing 13 00002 g004
Figure 5. Additional Aqua MODIS (left column) and SNPP VIIRS (right column) CLDPROP spectral cloud effective radius (CER) retrieval results for the overcast (CSR = 0) pixel population in the scene in Figure 2. Dual color bars indicate thermodynamic phase. (a) CER from the analogous MODIS 1.64 µm and VIIRS 1.61 µm spectral channels. (b) CER from the analogous MODIS 3.75 µm and VIIRS 3.70 µm spectral channels.
Remotesensing 13 00002 g005
Figure 6. Gridded (1°) daytime cloud fraction (top row) and cloud optical property phase fractions for February 2014; ice, liquid, and undetermined phase fraction rows are indicated by the labels on the left. The left column shows the SNPP VIIRS CLDMSK and CLDPROP datasets. The middle column shows the absolute differences between SNPP VIIRS and Aqua MODIS from the common CLDMSK and CLDPROP algorithms. The right column shows the absolute differences between SNPP VIIRS CLDMSK/CLDPROP and Aqua MODIS MYD08.
Remotesensing 13 00002 g006
Figure 7. Gridded (1°) ice cloud retrieval fractions for February 2014, separated by the CER retrieval spectral channel used (1.6 µm, 2.x µm, 3.7 µm) as indicated by the labels on the left. The column layout follows that used in Figure 6.
Remotesensing 13 00002 g007
Figure 8. Same as Figure 7, but for liquid phase clouds.
Remotesensing 13 00002 g008
Figure 9. Gridded (1°) mean cloud optical thickness (COT) for the overcast pixel population in February 2014, separated by ice (top row) and liquid (bottom row) phase. The column layout follows that used in Figure 6.
Remotesensing 13 00002 g009
Figure 10. Gridded (1°) mean liquid cloud effective radius (CER) for the overcast pixel population in February 2014, separated by the CER retrieval spectral channel used (1.6, 2.x, and 3.7 µm) as indicated by the labels on the left. The column layout follows that used in Figure 6.
Remotesensing 13 00002 g010
Figure 11. Same as Figure 10, but for ice phase clouds.
Remotesensing 13 00002 g011
Figure 12. Time series of monthly ice (top) and liquid (bottom) cloud optical property phase fractions for the SNPP VIIRS (solid red line) and Aqua MODIS (solid blue line) CLDPROP products, and the heritage Aqua MODIS MYD08 (dotted blue line) product, covering the time period from April 2012 through May 2020. The monthly values are pixel-weighted calculations for ±60° latitude.
Remotesensing 13 00002 g012
Figure 13. Time series of monthly liquid (left column) and ice (right column) cloud optical property successful retrieval fractions for the three primary CER retrieval channels (1.6, 2.x, and 3.7 µm) as indicated by the labels on the left. Line style and color designations are the same as in Figure 12. The monthly values are pixel-weighted calculations for ±60° latitude, and are for the overcast pixel population only as determined by the Clear Sky Restoral (CSR) algorithm.
Remotesensing 13 00002 g013
Figure 14. Time series of ice (top) and liquid (bottom) monthly COT means for the overcast pixel population only, calculated for ±60° latitude. Line style and color designations are the same as in Figure 12.
Remotesensing 13 00002 g014
Figure 15. Time series of monthly liquid (left column) and ice (right column) CER means for the three primary spectral retrieval channels (1.6 µm, 2.x µm, 3.7 µm) as indicated by the labels on the left. Line style and color designations are the same as in Figure 12. The monthly values are pixel-weighted calculations for ±60° latitude, and are for the overcast pixel population only, as determined by the CSR algorithm.
Remotesensing 13 00002 g015
Figure 16. Overcast, relatively homogeneous scene off the Kamchatka Peninsula observed concurrently by Aqua MODIS (0200 UTC granule) and SNPP VIIRS (0200 UTC granule) on 6 July 2014. Probability distributions of overcast (CSR = 0) liquid COT from CLDPROP MODIS (blue line) and CLDPROP VIIRS (red line), in addition to MYD06 (gray line), are shown at the right for the region highlighted in the images. Mean COT for each histogram is shown in the parentheses.
Remotesensing 13 00002 g016
Figure 17. Similar to Figure 16, except for a broken cloudy scene over the tropical Pacific Ocean observed concurrently by Aqua MODIS (0150 UTC granule) and SNPP VIIRS (0148 UTC granule) on 6 July 2014. Also shown are the CLDPROP MODIS COT probability distributions excluding pixels identified by the MYD06 Clear Sky Restoral as being partly cloudy via sub-pixel heterogeneity tests (CSR = 3, gold line) and the cloud edge test (CSR = 1, brown line), and those identified by MYD35 as clear sky (green line).
Remotesensing 13 00002 g017
Table 1. Analogous Aqua MODIS and SNPP/NOAA-20+ VIIRS spectral channels used in the CLDPROP cloud optical properties algorithm, along with their instrument designation in parenthesis and primary use.
MODIS Central Wavelength (Band Designation)VIIRS Central Wavelength (Band Designation)Primary Use
0.66 µm (B1)0.67 µm (M5)COT over land
0.86 µm (B2)0.87 µm (M7)COT over water
1.24 µm (B5)1.24 µm (M8)COT over snow/ice
1.64 µm (B6)1.61 µm (M10)CER; cloud thermodynamic phase; supplemental COT over snow/ice (coupled with 2.13/2.25 µm)
2.13 µm (B7)2.25 µm (M11)CER; cloud thermodynamic phase
3.75 µm (B20)3.70 µm (M12)CER; cloud thermodynamic phase
Publisher’s Note: MDPI stays neutral with regard to jurisdictional claims in published maps and institutional affiliations.

