
Spatial and Temporal Variability of Soil Salinity in the Yangtze River Estuary Using Electromagnetic Induction


State Key Laboratory of Soil and Sustainable Agriculture, Institute of Soil Science, Chinese Academy of Sciences (CAS), Nanjing 210008, China
*
Author to whom correspondence should be addressed.
Remote Sens. 2021, 13(10), 1875; https://0-doi-org.brum.beds.ac.uk/10.3390/rs13101875
Submission received: 19 March 2021
/
Revised: 4 May 2021
/
Accepted: 5 May 2021
/
Published: 11 May 2021
(This article belongs to the Special Issue Advances of Proximal and Remote Sensing in Soil Salinity Mapping)
Abstract
:Soil salt-water dynamics in the Yangtze River Estuary (YRE) is complex and soil salinity is an obstacle to regional agricultural production and the ecological environment in the YRE. Runoff into the sea is reduced during the impoundment period as the result of the water-storing process of the Three Gorges Reservoir (TGR) in the upper reaches of the Yangtze River, which causes serious seawater intrusion. Soil salinity is a problem due to shallow and saline groundwater under serious seawater intrusion in the YRE. In this research, we focused on the temporal variation and spatial distribution characteristics of soil salinity in the YRE using geostatistics combined with proximally sensed information obtained by an electromagnetic induction (EM) survey method in typical years under the impoundment of the TGR. The EM survey with proximal sensing method was applied to perform soil salinity survey in field in the Yangtze River Estuary, allowing quick determination and quantitative assessment of spatial and temporal variation of soil salinity from 2006 to 2017. We developed regional soil salinity survey and mapping by coupling limited laboratory data with proximal sensed data obtained from EM. We interpreted the soil electrical conductivity by constructing a linear model between the apparent electrical conductivity data measured by an EM 38 device and the soil electrical conductivity (EC) of soil samples measured in laboratory. Then, soil electrical conductivity was converted to soil salt content (soil salinity g kg−1) through established linear regression model based on the laboratory data of soil salinity and soil EC. Semivariograms of regional soil salinity in the survey years were fitted and ordinary kriging interpolation was applied in interpolation and mapping of regional soil salinity. The cross-validation results showed that the prediction results were acceptable. The soil salinity distribution under different survey years was presented and the area of salt affected soil was calculated using geostatistics method. The results of spatial distribution of soil salinity showed that soil salinity near the riverbanks and coastlines was higher than that of inland. The spatial distribution of groundwater depth and salinity revealed that shallow groundwater and high groundwater salinity influenced the spatial distribution characteristics of soil salinity. Under long-term impoundment of the Three Gorges Reservoir, the variation of soil salinity in different hydrological years was analyzed. Results showed that the area affected by soil salinity gradually increased in different hydrological year types under the impoundment of the TGR.

1. Introduction
Soil salinization is widespread in the world and it is one of the major obstacles to agricultural production [1] and the ecological environment [2,3,4,5,6,7]; it affects an area accounting for approximately 6% of the total global land [8]. Saline soil is mostly distributed in China, India, Pakistan, Australia and the United States. Saline soil area in China accounts for 10% of the area of global saline soil [9]. Secondary salinization occurs because of the movement of salts from the subsoil into the surface soil. Salt can be brought to the surface soil by capillary water movement under conditions of a rising water table, whereas salt accumulates in the root zone as a result of evaporation and evapotranspiration [10]. Soil salt accumulation affects plant growth through the change in physical, chemical and biological processes [11,12,13,14,15]. Salt affects the growth of crops and impedes production and land may be abandoned in severe circumstances as the result of salinization. With the growth of the world population, available land for agriculture will increase in demand, in order to satisfy human requirement in the future. Soil salinization is a problem worthy of attention, which could restrict agricultural production and plant growth and distribution of the ecosystem [16].
Most research with regard to soil salinity focused on semi-arid and arid areas [17] where irrigation has been developed for agriculture and secondary salinization occurs frequently [18,19,20,21]. However, there were relatively few cases that studied similar processes in coastal lands near the estuary. In coastal areas, the surface water and groundwater, groundwater depth and salinity of soil vary greatly as the result of the variation of seawater level, runoff into the sea and seawater intrusion [22,23]. Several research results showed that estuary area has become more fragile as a result of environmental factors: sea level rise, saltwater intrusion, surface water level rise, changes in upstream river discharges and erosion of coastal embankment contractions [24,25]. Salinized soil is widely distributed in coastal areas in China, as the result of high groundwater salinity and a shallow water table, which might be the consequences of serious seawater intrusion and tidal activity [26].
The Yangtze River Estuary (YRE) is characterized as a fragile and sensitive ecosystem resulting from seawater intrusion, poor salt and water excretion and low topography [27,28]. Soil salinity is a common problem in Yangtze River Estuary. This is mainly due to the existence of shallow, saline groundwater table and soil parent material, whereas it has also been influenced by the seawater level rise and the distribution of inflow into the sea as the result of large water conservancy projects [29]. Runoff is an essential factor affecting seawater intrusion [30]. The regional environmental conditions, such as shallow groundwater, high-salinity groundwater and changing runoff into the sea, all have certain effects on the salt accumulation and salinized soil area. Meanwhile, more serious seawater intrusion occurs in the northern branch of the Yangtze River because of less runoff compared with that in the southern branch [31]. The water storage process of the Three Gorges Reservoir affects the runoff into the sea, thus intensifying the saltwater intrusion into the estuary, especially in dry years and dry seasons [32,33]. The monthly average river level in the estuary fell 20 cm in recent years and the saline water intrusion intensified soil and groundwater salinity were aggravated in dry years after the Three Gorges Project [34]. The probable impact factors of soil salinity were analyzed [35] and selected to predict the soil salinity in Qidong, in the northern branch of the YRE.
Most previous studies on the spatial-temporal changes in soil salinity concentrated on the salt-affected soils in limited locations and small fields [36]. Traditional sampling of soil salinity was carried out using the electrical conductivity (EC) of 1:5 soil–water diluted extract (dS m−1) as a characterization for soil salinity. However, traditional survey methods are time-consuming and labor-consuming and cannot be applied in large-scale research [37]. On the other hand, on a regional scale, it cannot afford the information related to the spatial characteristics of soil salinity. Methods for soil salinity investigation have been revolutionarily changed by the application of electromagnetic induction (EM) equipment [38]. Soil apparent electrical conductivity (ECa, mS m−1) can be conveniently obtained proximally and to certain depths without plugging the EM sensors into the soil [39]. This method can be used in regional surveys to map soil salinity after data calibrations [40,41]. However, EM survey with proximal sensing method was often applied in arid areas and the EC conversions was based on one parameter acquired by EM induction with relatively lower prediction accuracy and could not be generalized in similar climate condition owing to large difference of soil moisture condition [42,43].
Geostatistical methods were widely utilized in pedology, hydrology, ecology, geology and meteorology in recent years. Geostatistical analysis methods, such as the kriging interpolation method, have been applied to soil science research to predict soil properties at unsampled sites [44,45]. Applying geostatistical method to the prediction of soil properties, studied spatial characteristics of soil salinity were studied using electromagnetic induction (EM), which substantially reduced the soil sample numbers [46]. Spatial distribution of apparent electrical conductivity was studied to evaluate the source of soil salinization in an irrigated cotton field using a mobile electromagnetic sensing system [47]. Several geostatistical methods were compared to determine the optimal prediction method during research into the spatial similarity of EM38 data of different sample quantities [48]. An integrated risk assessment method was developed for determining the spatial-temporal soil salinity using a combination of the combination of remote sensing and geographic information system [49].
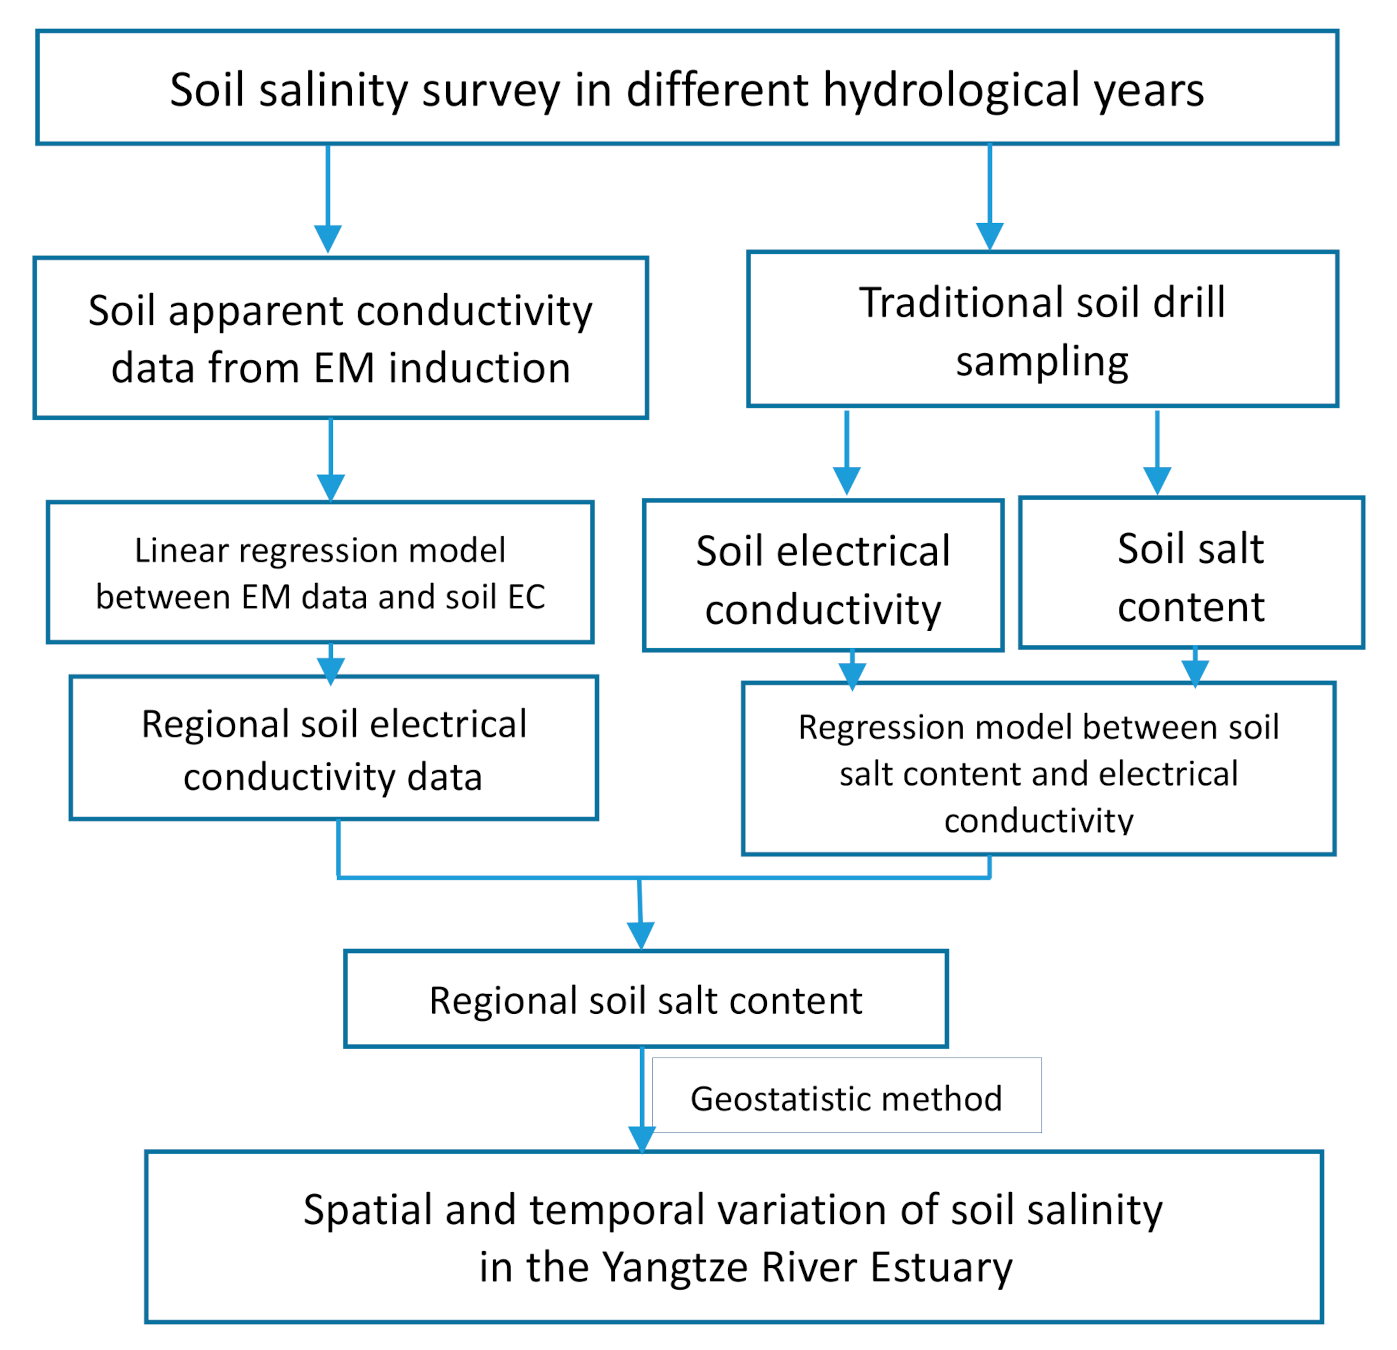
However, spatial distribution of soil salinity at the field or regional scale in the Yangtze River Estuary and the temporal variation of the salt-affected land have rarely been studied. The sea-level rise and variation of seasonal runoff from the upper reaches of large dams will lead to more serious seawater intrusion. Regional agricultural productivity and the ecological system will be affected as a result of the alteration of salt-water balance. Considering the importance of studying the spatial distribution and temporal variation of soil salinity in the YRE, soil salinity surveys were carried out using electromagnetic induction for several years in the estuary (flowchart of the study was shown in Figure 1). In this paper, regional soil apparent conductivity data was obtained by the EM measurement in survey years and was converted to soil salt content (soil salinity g kg−1) using the classical statistical method: an interpretation equation describing the relationship between soil electrical conductivity (EC) and soil apparent conductivity was constructed on the basis of EM induction measurements and soil EC was transformed into soil salinity based on the established statistical model. Accordingly, regional soil salinity was predicted using geostatistics method. Finally, spatial characteristics of regional soil salinity were studied and temporal variation of regional soil salinity was analyzed.
2. Materials and Methods
2.1. Study Area
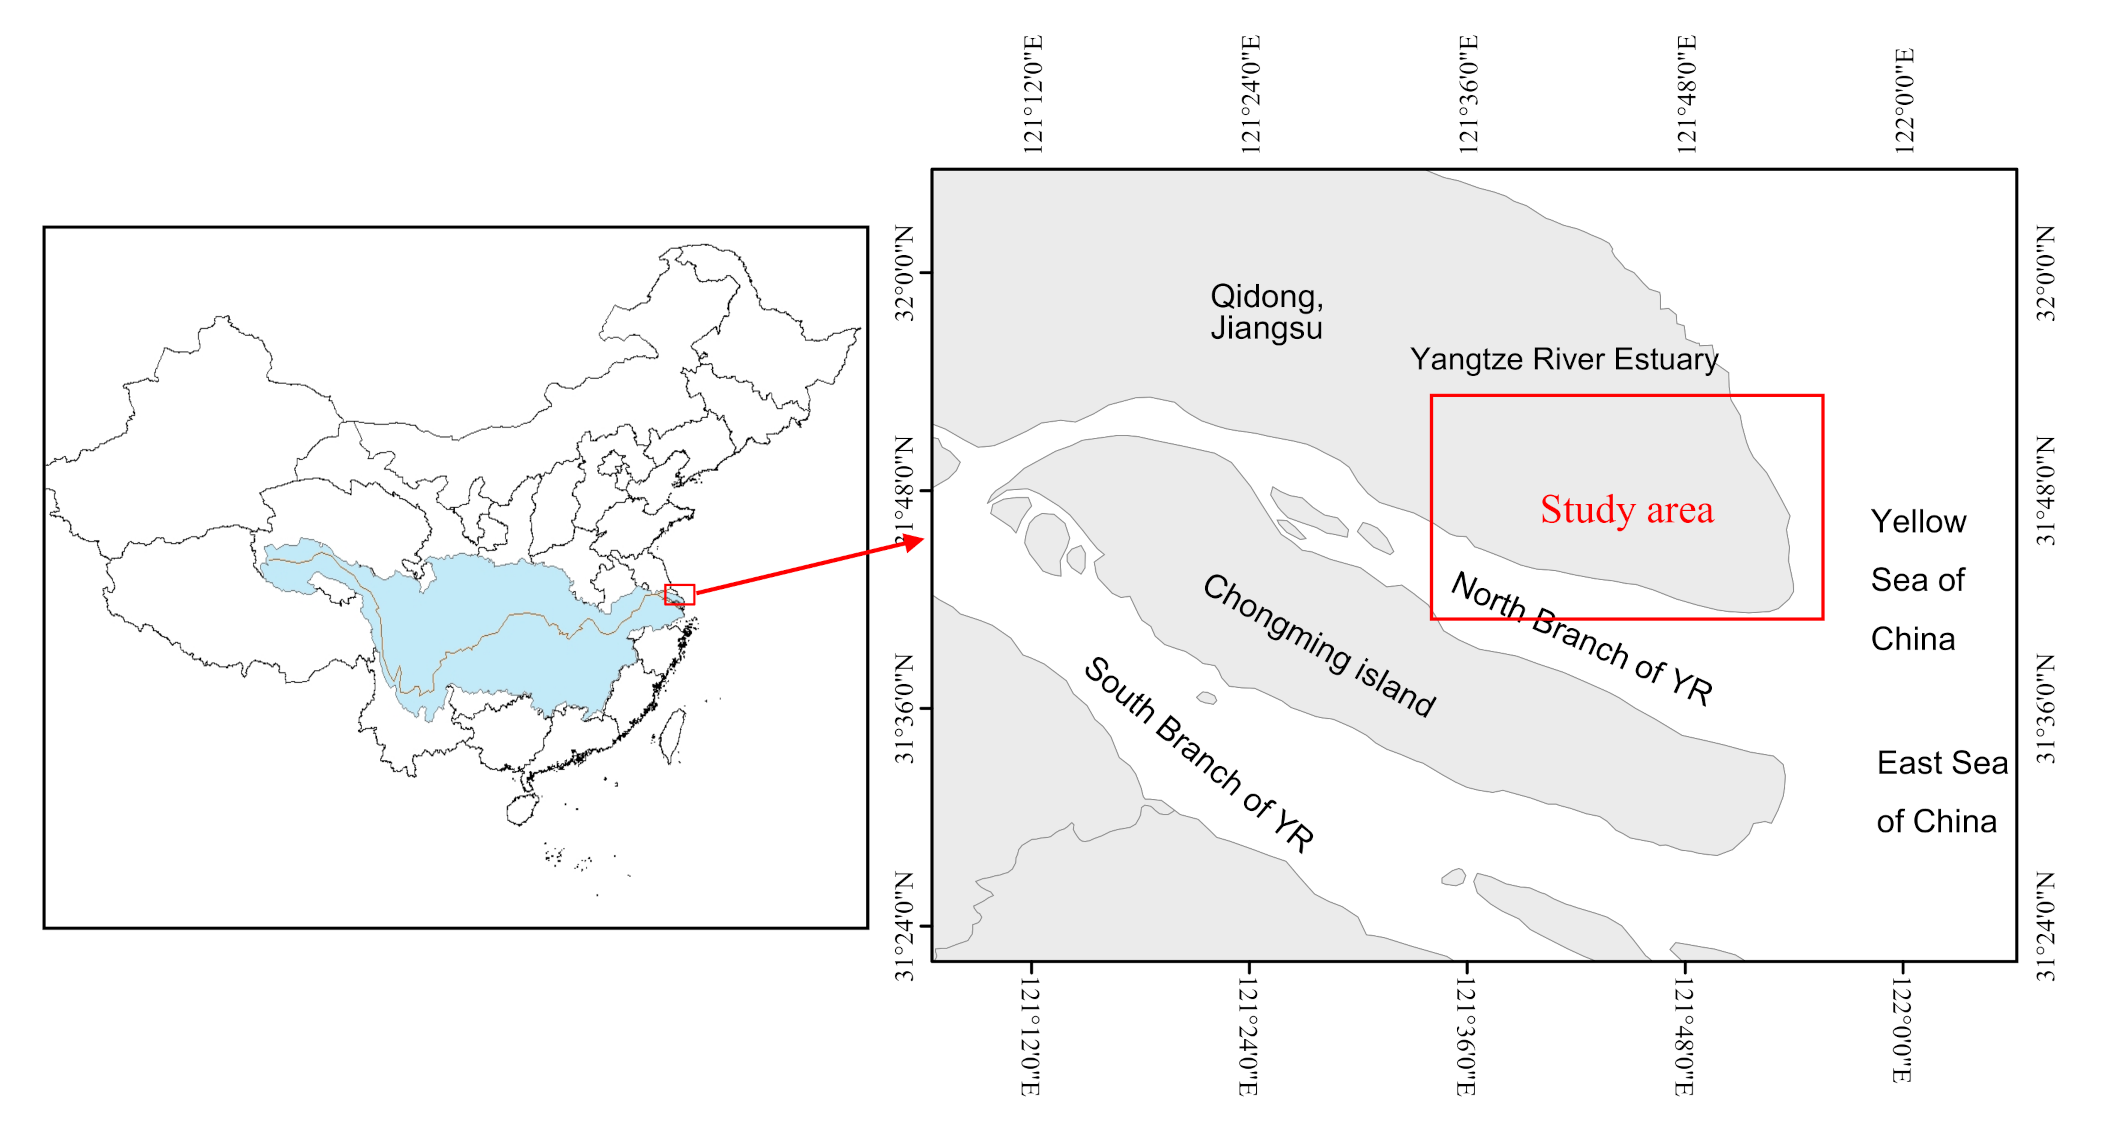
As shown in Figure 2, the study area was located in Qidong county (31°41′–32°06′, 121°25′–121°54′), Jiangsu Province, which is near the Yangtze River and the crossing of East China and Yellow Seas. This region belongs to the northern branch of the YRE. The east and south sides of the study area are surrounded by the sea and the Yangtze River, respectively.
The flow diversion ratio of the northern branch is lower than 5% [31], which could result in a high risk of saline water intrusion and soil salinization. The study area has been influenced by seawater intrusion for years as it located in the YRE. As a result of seawater intrusion, the risk of soil salinization is extremely high. The Three Gorges Reservoir is located in the upper reaches of the Yangtze River and after the TGR was put into operation, the seasonal distribution of downstream flows changed. In particular, the process of reservoir impoundment in autumn reduced the downstream flow and led to the intensification of seawater intrusion, thereby increasing the risk of soil salinization. The study area is located in a mid-latitude region and belongs to the northern subtropical climate zone. The average annual rainfall in the area is 1031.1 mm and it is unevenly distributed throughout the year. The average annual evaporation is 1364 mm, which is 29.2% higher than the precipitation. Salinity problems have arisen due to the combined effect of the hydrological environment and meteorological environment. Under this background, the northern branch of the estuary was selected as the survey region in this paper.
2.2. Soil Sampling Method and Laboratory Analysis
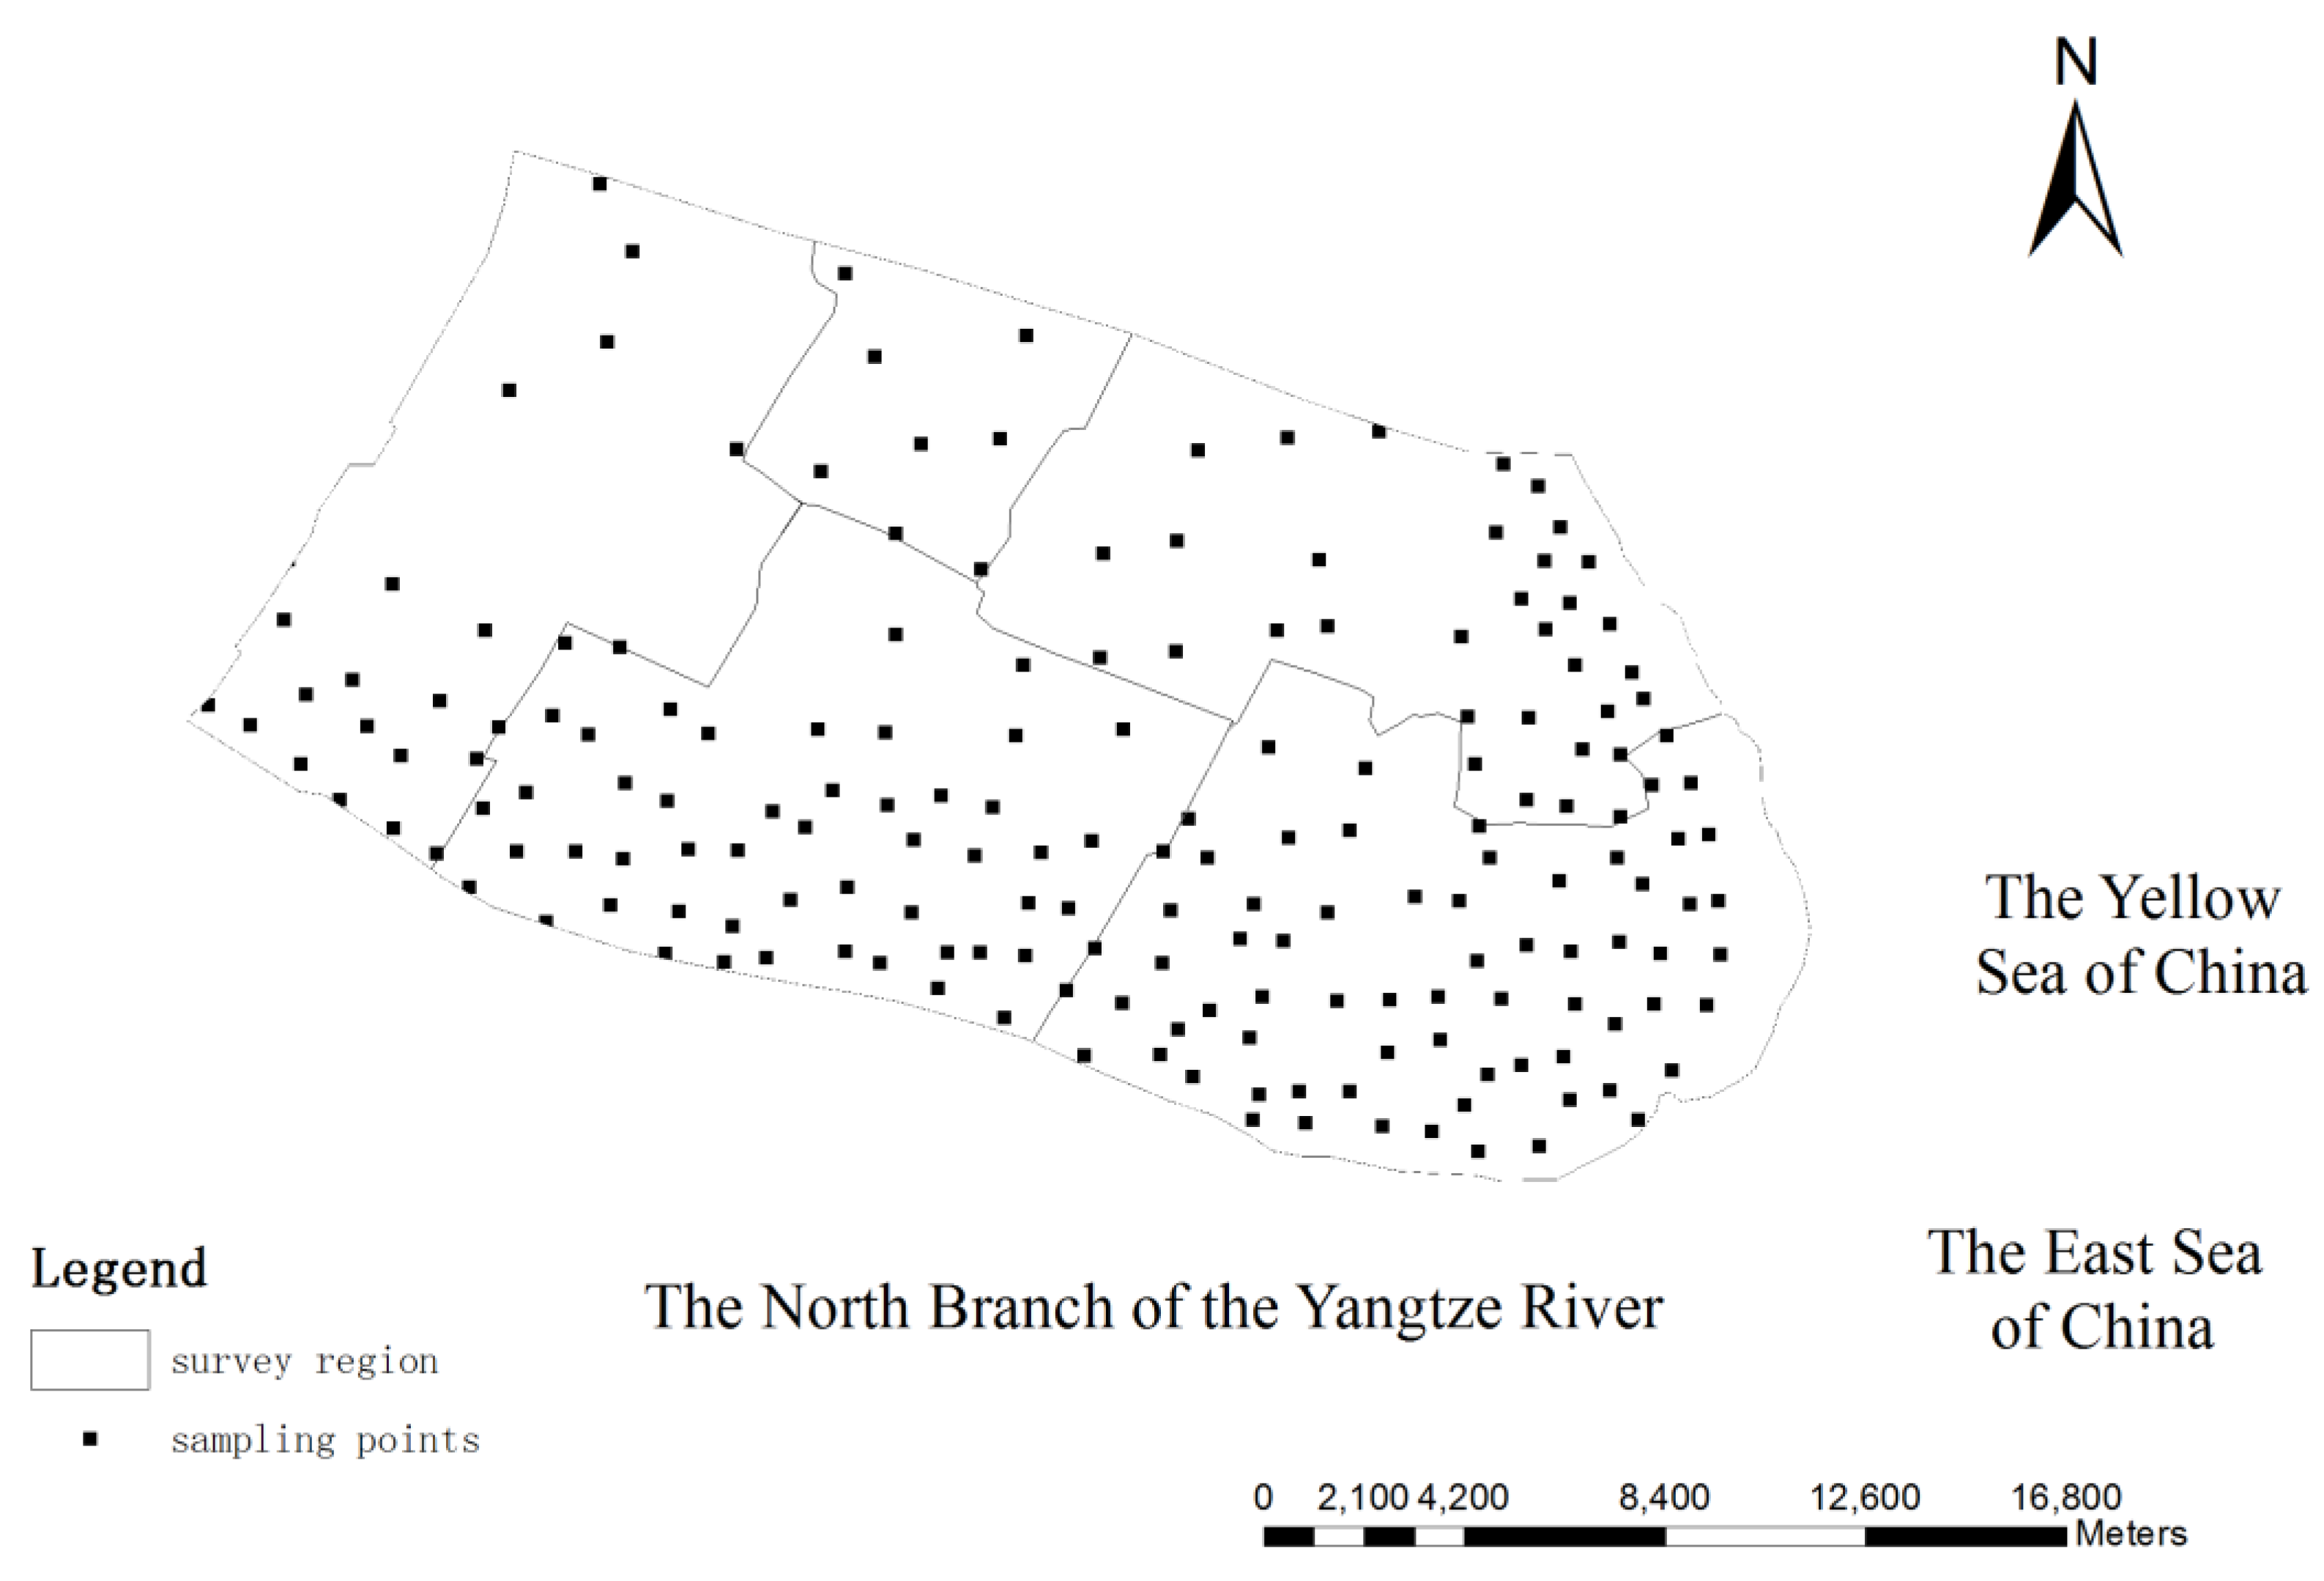
In the Yangtze River Estuary, salt accumulation may occur in the surface layer from October to December as the result of high evaporation and low precipitation. In order to study the spatiotemporal evolution characteristics of regional soil salinity in the estuary, regional soil salinity survey was carried out in autumn during the typical impoundment years of the Three Gorges Reservoir. A grid sampling survey was carried out with increased density toward the river and the sea (Figure 3). Within 5 km of the river and sea, the grid density was 1 km, whereas in other inland areas, the grid density was 2 km. Further adjustments were made according to the actual environmental situation.
A proximally sensed EM instrument was used in regional survey. EM sensor (EM38-MK2) was used to collect data of soil apparent electrical conductivity (ECa). At every sampling site, ECa was recorded in horizontal and vertical mode at both 1 m and 0.5 m using proximally sensed instrument of the Electromagnetic induction (EM38-MK2) and global positioning system (GPS) information was collected at each sampling point. Soil temperature at each sample point was measured concurrently. Some of the survey points were sampled using traditional drilling method to calibrate the relationship established between soil electrical conductivity and soil apparent conductivity measured using EM38-MK2. The salinity of the selected soil samples covered the range of salinity from lower values to higher values in order to establish the calibration equation more reasonably. The selected soil samples were obtained using soil drilling at depths of 0–20 cm, 20–40 cm, 40–60 cm, 60–80 cm and 80–100 cm. A total of 35 calibration sites were chosen among the grid sampling points.
Drilled soil samples were naturally air-dried, crushed and sieved (2 mm) before laboratory analysis. Soil EC was measured using conductivity meter. The soil soluble salt content was determined using the ion summation method. Conventional soil analysis methods described by Lu (1999) were applied in the laboratory analysis of sodium, potassium, calcium, magnesium, chlorine, sulphate, carbonate and bicarbonate [50].
2.3. EM Measurement Method
EM38-MK2 was used in the measurements of soil apparent conductivity in the horizontal and vertical mode based on proximal sensing principle. The free conductive medium makes the soil as a conductor based on the EM measurement principle, whereby an induced eddy current is formed under the action of a magnetic field. After the secondary electromagnetic field intensity signal generated by the induced eddy current is intercepted by the receiving coil at the first end, it is amplified and forms an output voltage, which is proportional to the apparent conductivity; consequently, the apparent conductivity is converted and the conductivity reading is output by the instrument.
The soil temperature influences the apparent electrical conductivity by affecting the ionic activity in the solution. A previous study showed that every 1 °C increase in temperature would result in ECa increasing by 1.9% [51]. If the soil temperature difference in the study area exceeds 10 °C, the apparent conductivity needs to be adjusted to the reference temperature of 25 °C for comparative analysis [52].
where ft was the temperature calibration factor, which was the parameter calibrated to 25 °C and T was the measured soil temperature. The ECa values of horizontal and vertical mode were corrected by temperature.
2.4. Statistical Analyses
2.4.1. Classical Statistical Analysis
Classical statistical analyses such as descriptive statistical results were performed using the SPSS 13.0 statistic software package (SPSS Inc., Chicago, IL, USA). Multiple linear regression models in 3.1.1 were established using the proximal sensed data of EM instrument in the SPSS 13.0.
Based on the regression model, soil apparent conductivity was converted into the soil conductivity measured in laboratory. Linear regression model between soil salinity and soil electrical conductivity was constructed. Through the above methods, soil salinity could be interpreted by ECa using the established regression models.
The predicted value of interpreted regional soil salinity using the kriging interpolation method was calibrated by the measured value and the prediction accuracy is evaluated by ME (mean error), ASE (average standard error) and RMSE (root mean square error) and the calculation formulas were listed as follows.
Z*(xi) and Z(xi) represented the observed and predicted value of the soil salinity at the interpolation points; n is the number of sample points.
2.4.2. Geostatistical Analysis Method
A geostatistics method was chosen to define the variance structure of soil salinity, which included semivariograms calculation, kringing interpolation, mapping and calculation of estimated results of soil salinity in the topsoil. Semivariograms are frequently used in the analysis of spatial distribution and variability of the spatial properties. Here, they were used to quantify the spatial variation of the regional variable and the ordinary kriging method was applied for prediction. Semivariogram and spatial structure analyses for variables was carried out by Geostatistical software (GS+ 7.0, Gamma Design Software). The ordinary kriging method is considered as one of the most basic kriging methods. It allows estimating the properties of locations without sampling. Therefore, it was applied to conduct an interpolation of the spatial scatter points attributes. The spatial distribution of soil salinity was plotted and the area of soil salinity classification was calculated using the ArcMap 10.2 GIS produced by the Environmental Systems Research Institute.
Semi-variance is defined as half of the predicted square difference between sample values at a given distance. The estimated semi-variance at lag h is calculated as follows:
where z is the regionalized variable and z(xi) and z(xi + h) are measured sample values at xi and xi+h points, respectively. N is the number of pairs separated by distances h (lag space).
All the semi-variograms in the survey years were analyzed to determine the spatial variance of soil salinization and the parameters for the semivariance model were presented in Section 3.3.
3. Result and Discussion
3.1. Modeling Soil Salt Content and Calibration with Measured Value in Field
3.1.1. Soil Electrical Conductivity Interpreted by ECa Measurements
According to relevant study, there was a significant correlation between soil salinity and proximal sensed ECa (obtained from EM 38). In our study, the soil electrical conductivity was predicted using the soil apparent electrical conductivity after temperature calibration. The soil electrical conductivity was selected as the dependent variable, whereas ECa measurements (specifically, EM1h, EM1v, EM0.5h and EM0.5v,) determined using EM38-MK2 were selected as the independent variables. EM1h, EM1v, EM0.5h and EM0.5v represented the measured values at 1 m horizontal mode, 1 m vertical mode, 0.5 m Horizontal mode and 0.5 m Vertical mode, respectively. In this paper, a regression analysis between soil electrical conductivity and calibrated ECa was performed in SPSS software, as described below.
In order to predict soil salinity with higher accuracy, two regression models were established between soil EC and soil apparent conductivity, in order to analyze the soil electrical conductivity at different depths of 35 sample points in autumn 2010. In Table 1, a, b, c and d, represented the parameters of the linear regression equation. The coefficient of determination in the Enter regression model was higher than that in stepwise regression model. Therefore, the Enter regression model was chosen to predict the soil electrical conductivity from data in vertical and horizontal modes of EM38 measurements.
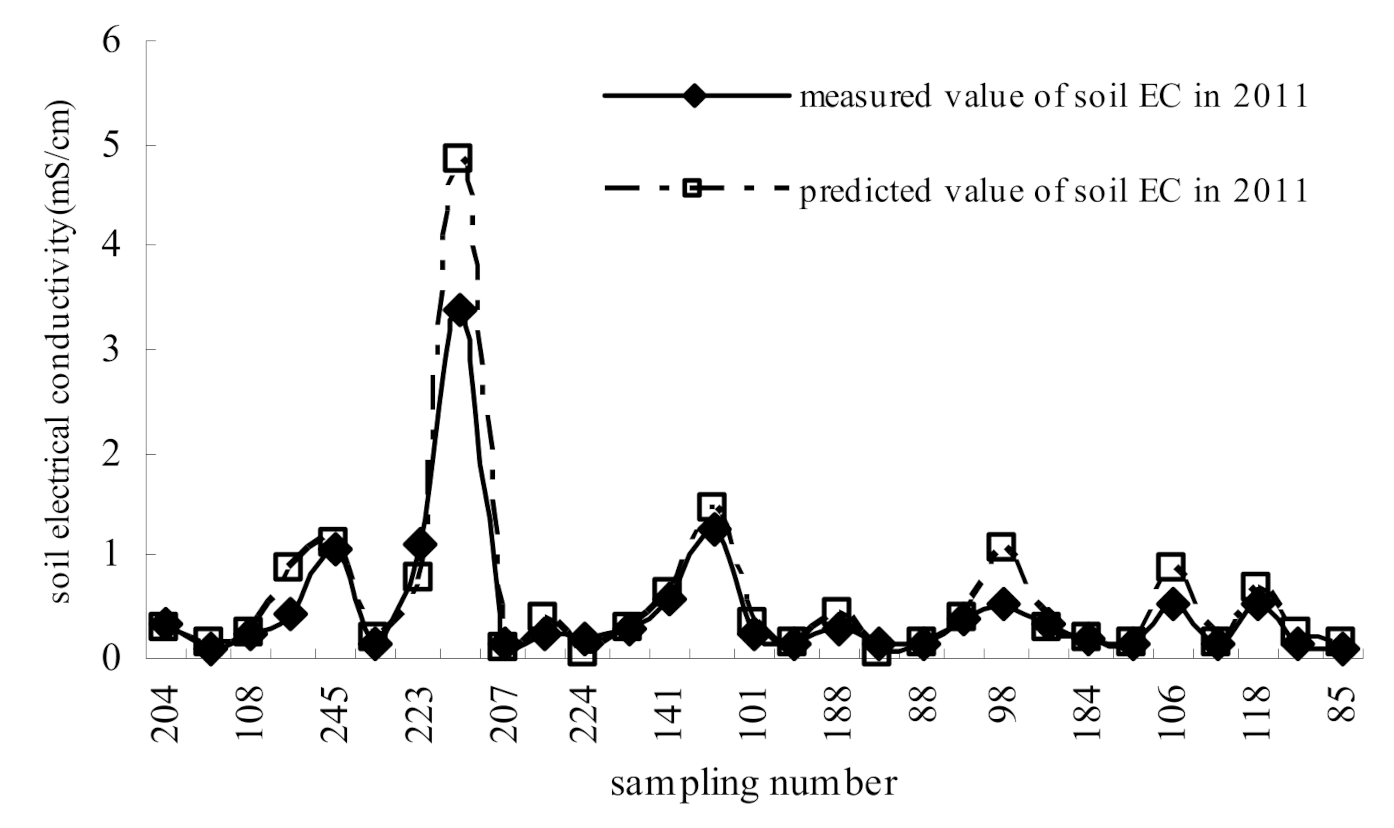
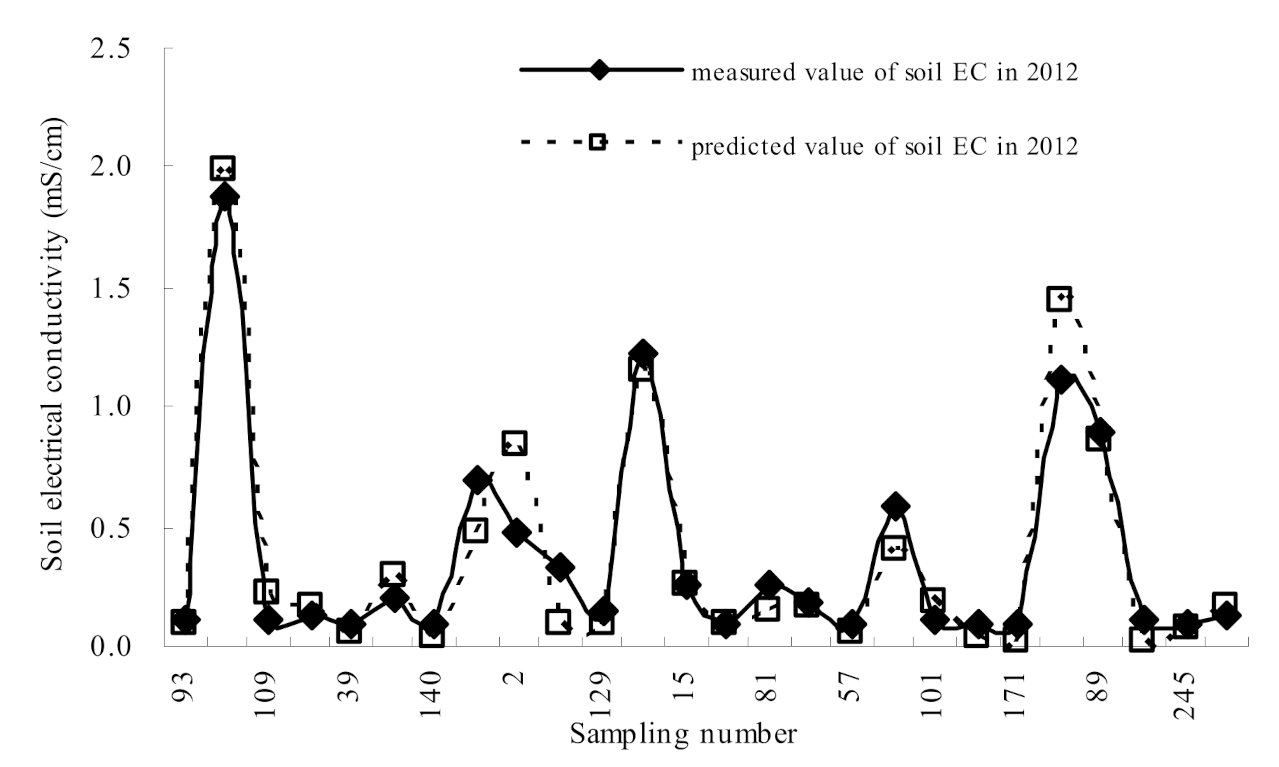
3.1.2. Validation of Soil Electrical Conductivity Interpreted from ECa Measurements
The regression model described in Section 3.1.1 could be used to calculate soil EC using ECa measurement values in areas without drill sampling points. Before applying the regression model, a verification of the model was done using the measured data in October 2011 and 2012. Soil electrical conductivity was calculated according to the regression model and then compared with the measured data. Values obtained in October 2011 and 2012 were presented in Figure 4 and Figure 5. The results showed that the soil electrical conductivity of the surface layer, as measured in laboratory, was highly consistent with the predicted value after conversion using apparent conductivity. The determination coefficient was more than 0.90. Results showed that the equation model could be used in the prediction of soil electrical conductivity when using EM38-MK2. Thus, sampling time and cost can be saved using the EM38-MK2 survey method with high measurement accuracy.
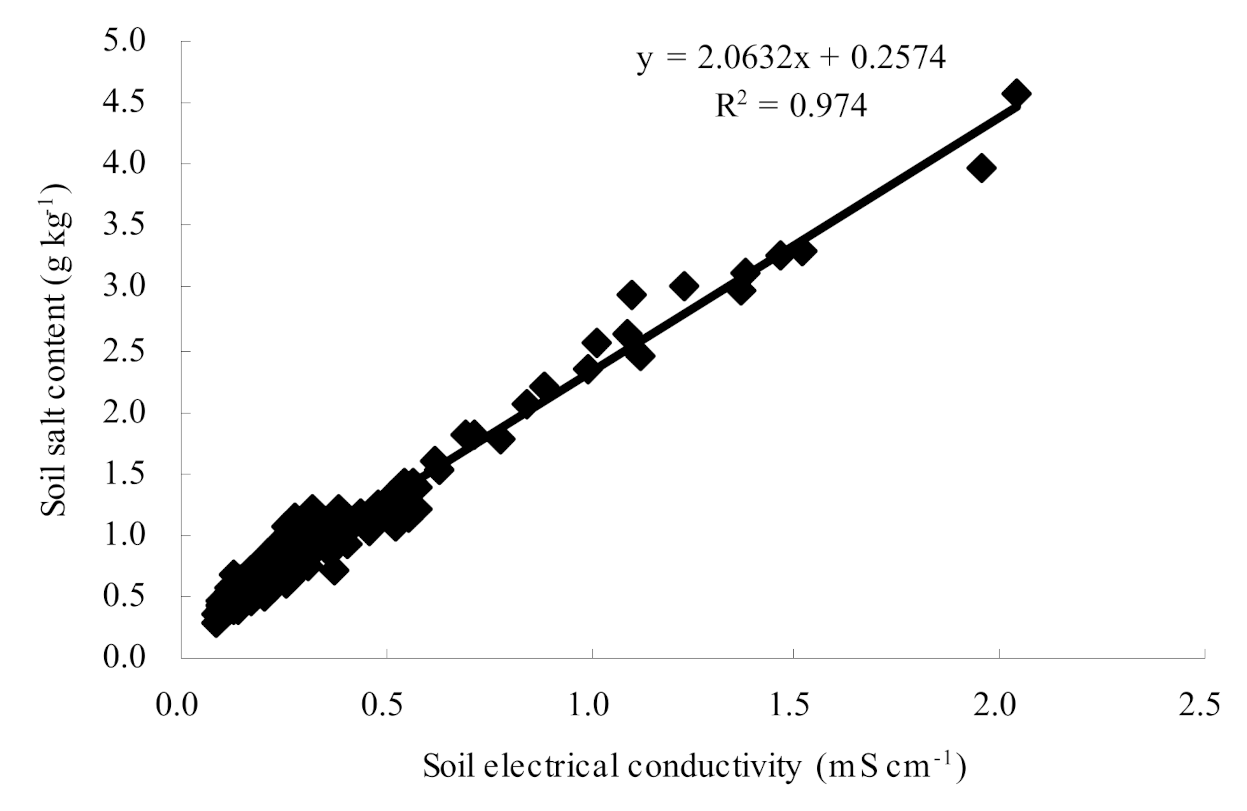
3.1.3. Soil Salt Content Interpreted by ECa Measurements
Electrical conductivity can be regarded as a crude indicator of soil salinity, since it is related to the sum of all ionized solutes or total dissolved salt content. A total of 175 soil samples were collected from 35 soil profiles in autumn 2011. The electrical conductivity and total soluble salt in soil were analyzed in the laboratory. An equation describing the relationship between soil electrical conductivity and total soluble salt in soil was constructed (Figure 6). According to the experimental data, there was a significant correlation between total soluble salt content (soil salinity, g kg−1) and soil EC. As such, soil electrical conductivity interpreted from ECa measurements could be converted to soil salt content with high precision.
3.2. Classical Statistical Analysis of Regional Soil Salinity
The soil salt content at every sampling site was calculated from the soil electrical conductivity measured in the laboratory using equation established in Section 3.1.3. We carried out regional surveys of soil salinity in October to December from 2006 to 2017 and several years were selected in order to study the spatial and temporal variability of soil salinity in the YRE.
The descriptive statistical characteristics of soil salinity at the 0–20 cm layer of all sample sites in different sampling years were shown in Table 2. Taking 2011 as an example, the soil salinity in 2011 ranged from 0.183 to 13.11 g kg−1. The coefficient of variation (CV) is an important parameter to evaluate the spatial variation of soil properties [53]. Values of <0.10, 0.10–1.0 and >1.0 indicated weak, moderate and strong variability, respectively. The high CV values in 2011 indicated a strong degree of variability of soil salinity, whereas the remainder presented moderate variability. The soil salt content in 2011 showed strong variability, with the remainder showing moderate variability. Therefore, soil salinity is the major issue that should be addressed due to its great variability.
3.3. Semivariogram Analysis
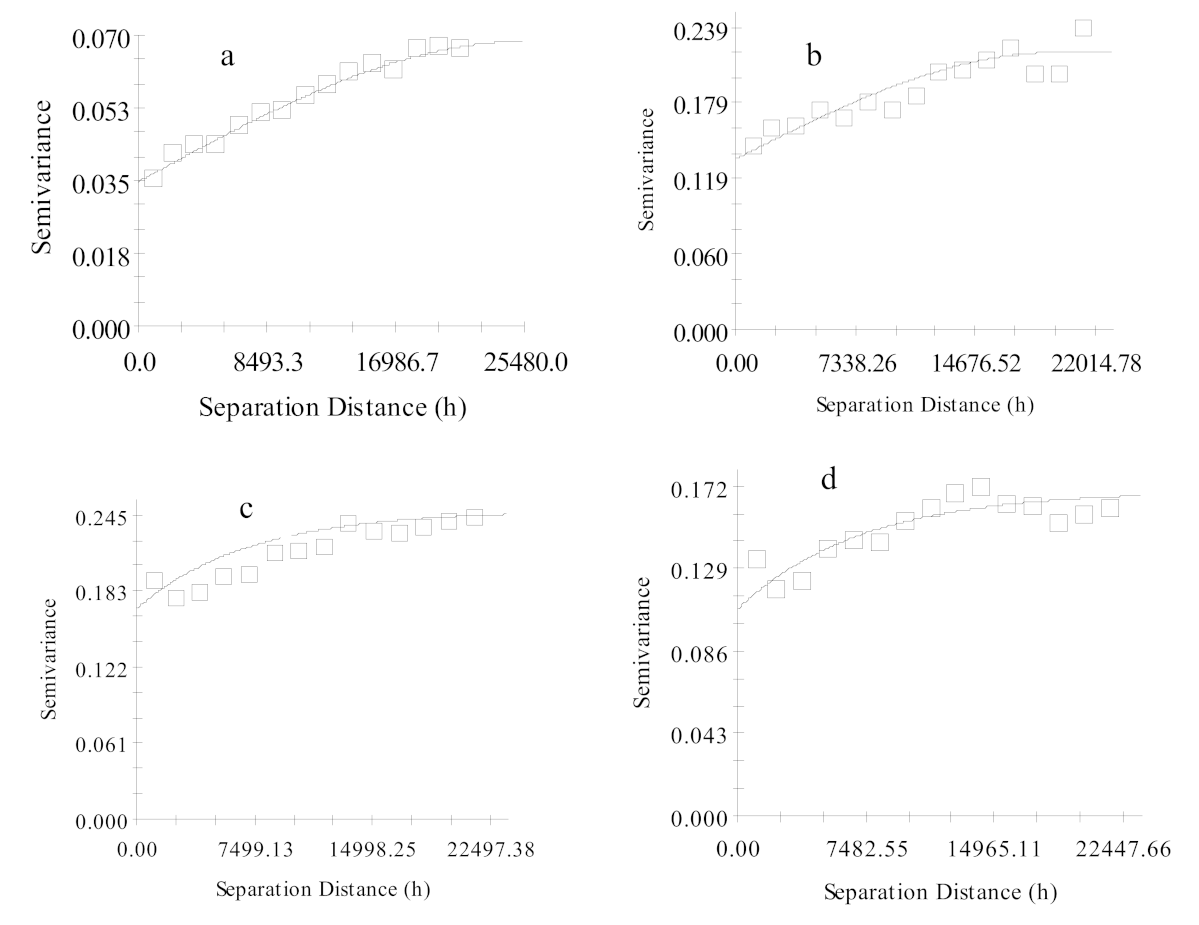
Semivariogram γ(h) is the most important element of spatial variance, as it explains the spatial autocorrelation of the spatial properties. Multiple models were applied in the selection of a semi-variogram to study the influence of random factors on regional soil salinity. A semivariance model with optimal fitting parameters forms an important basis of accurate spatial prediction. In this paper, the semi-variogram model of soil salinity was constructed using GS+ software (Figure 7). The semivariogram of soil salinity at 20 cm depth for each survey year performed well with high determination coefficients and the residual sum of squares were within the acceptable range. The structure variance parameters, such as the nugget variance, nugget effect (C0) and the sill, were listed in Table 3. As shown in Table 3, the C0 values in different survey years varied as the result of different hydrological years.
The nugget effect (C0) represents the spatial heterogeneity of random variance. The sill represents structure variance, which indicates the maximum variation of soil salinity. The nugget–sill ratio, usually called the nugget effect, represented the characteristics of spatial heterogeneity. A larger value denotes that more spatial heterogeneity is caused by random factors. The ratios 0.25 and 0.75 represented the two thresholds for system spatial correlation, whereby values of <25%, 25–75% and >75% indicate strong, moderate and weak spatial autocorrelation, respectively [54,55]. As shown in Table 3, the C0 values in each survey year were small, indicating that the variability of soil salinity was caused by random factors, whereas the inherent variability was weak on the scale of this study. According to the range and classification of the nugget-sill ratio, the soil salinity in 2008 indicated weak spatial autocorrelation, whereas the remaining survey years indicated moderate spatial autocorrelation, suggesting that the spatial variability of soil salinity was due to the comprehensive effects of structural factors (such as climate, parent material, topography and soil type.) and random factors (such as cultivation, soil improvement and fertilization). The mean error (ME) was close to zero, and average standard error (ASE) was close the root mean square error (RMSE), which showed that data cross-validation results were acceptable.
3.4. Spatial Distribution of Soil Salinity
The Datong hydrological station (30.767° north (N), 117.617° east (E)), located 1221 km downstream of the TGR and 624 km upstream of the estuary areas of the East China Sea, is the last hydrologic station in the lower reaches of the Yangtze River [56]. It represents the hydrological conditions of the Yangtze River Estuary and describing the flow into the sea. In this paper, the hydrological year type was divided according to the discharge data of Datong station as low flow years, median flow years and high flow years [57].
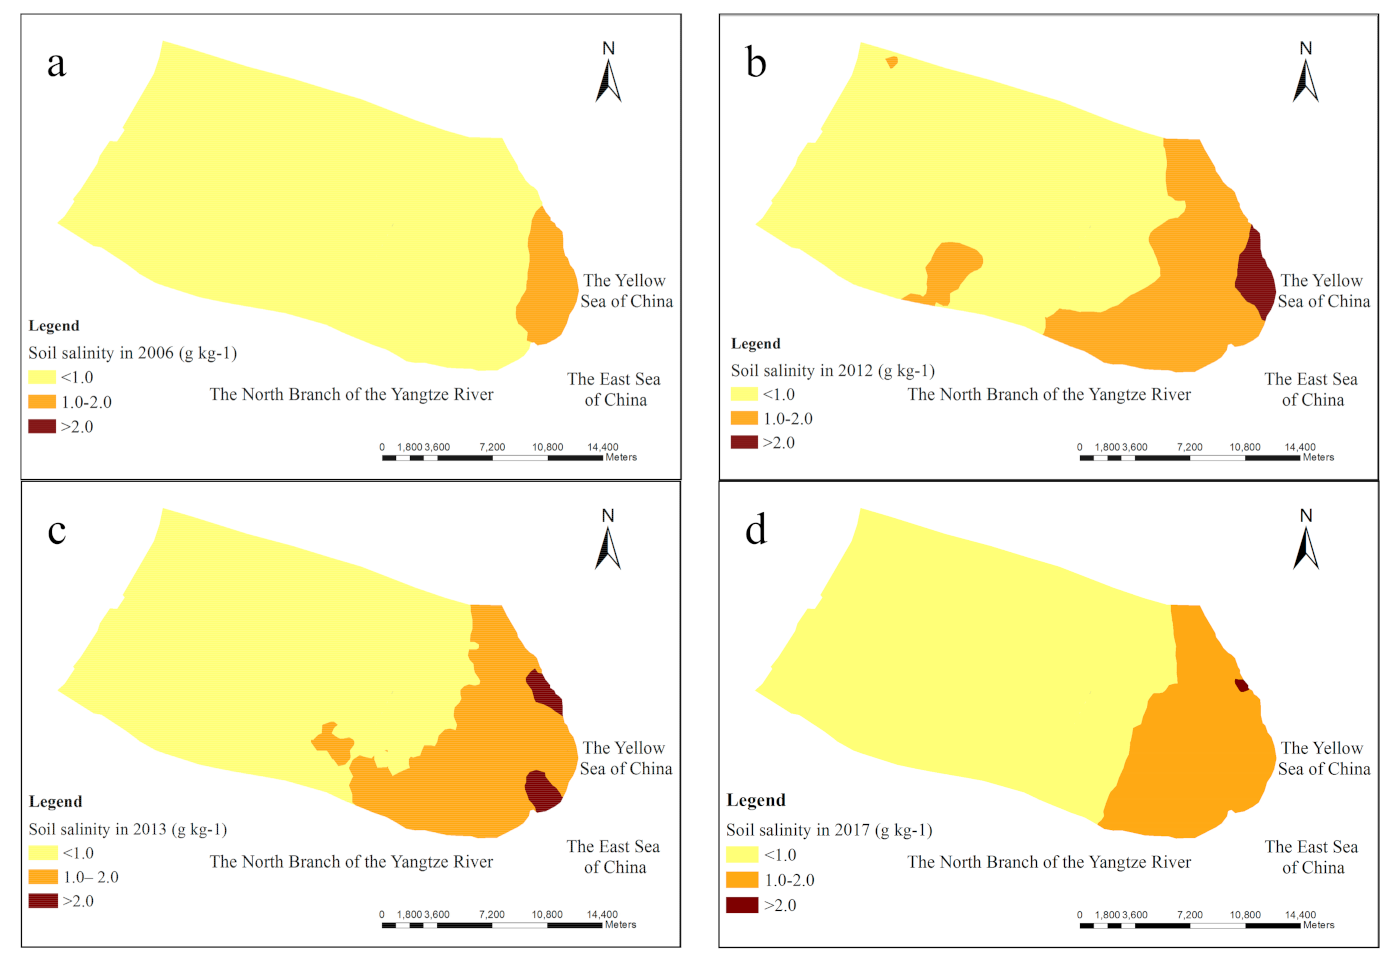
Soils were classified into non-salinized (<1.0 g kg−1), mildly salinized (1.0–2.0 g kg−1), moderately salinized (2.0–4.0 g kg−1), severely salinized (4.0–6.0 g kg−1) and saline (>6.0 g kg−1) soil according to classification of soil salt content in the coastal area [10]. In this paper, according to the focus of the research, soils were classified into non-salinized soil (<1.0 g kg−1) and salt-affected soil or salinized soil (>1.0 g kg−1).
The ordinary kriging interpolation method was applied to predict the spatial variability of soil salinity and the spatial distribution of soil salinity in typical years was mapped in Figure 8. As shown in Figure 8, the spatial distribution of different survey years showed the same characteristic. As the distance from the ocean and Yangtze River decreased, the soil salt content gradually increased. Non-salinized soil was mainly distributed in the northwestern part of the survey area, whereas moderately and severely salinized soil was mainly concentrated near the coastal and riverside zones.
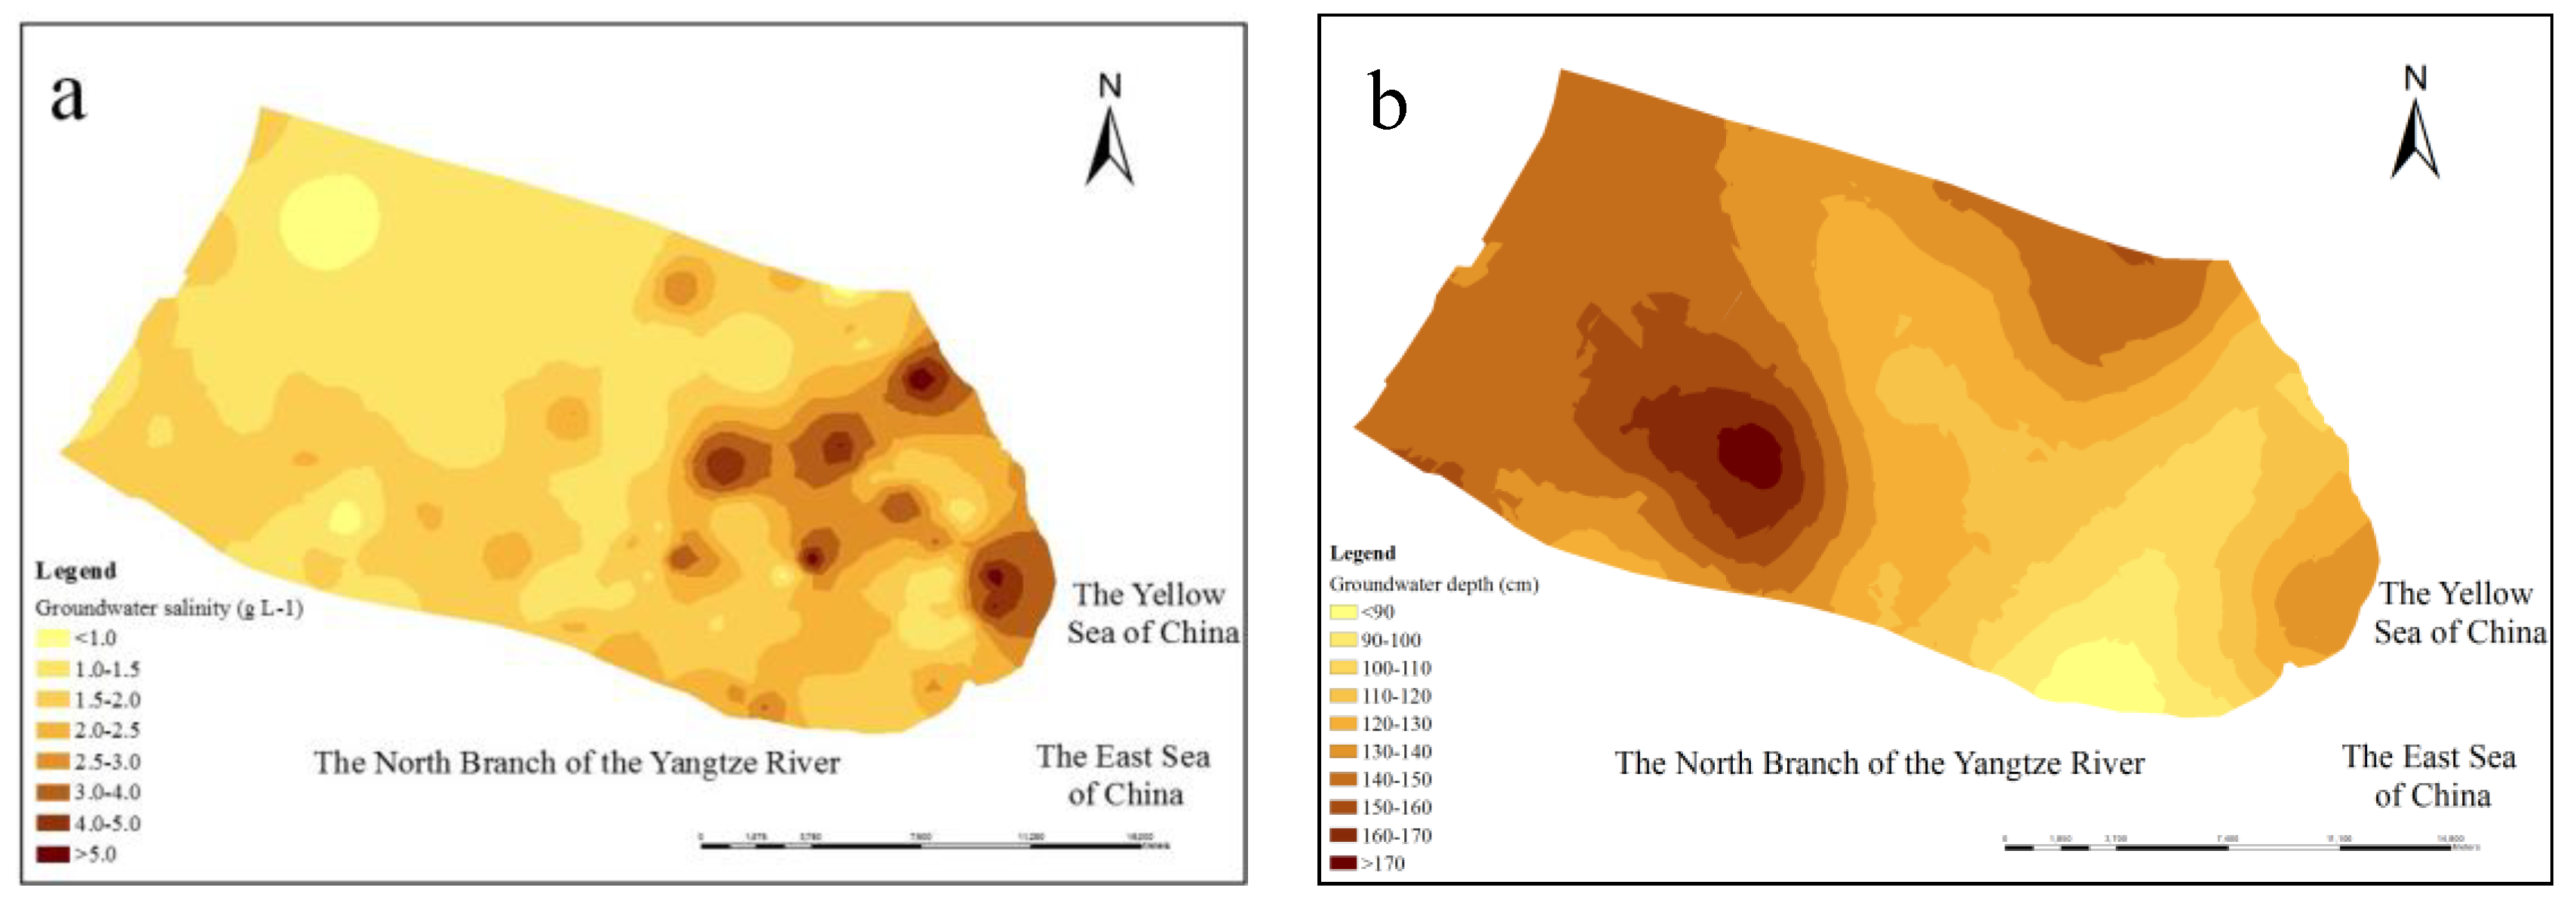
The spatial distribution of soil salinity was closely related to the groundwater environment. Groundwater depth and salinity were investigated and the results were presented in Figure 9. The Survey results showed that groundwater salinity near the estuary was higher than that inland, whereas the groundwater depth was shallower than that inland. Shallow groundwater and high groundwater salinity influenced the spatial distribution of soil salinity.
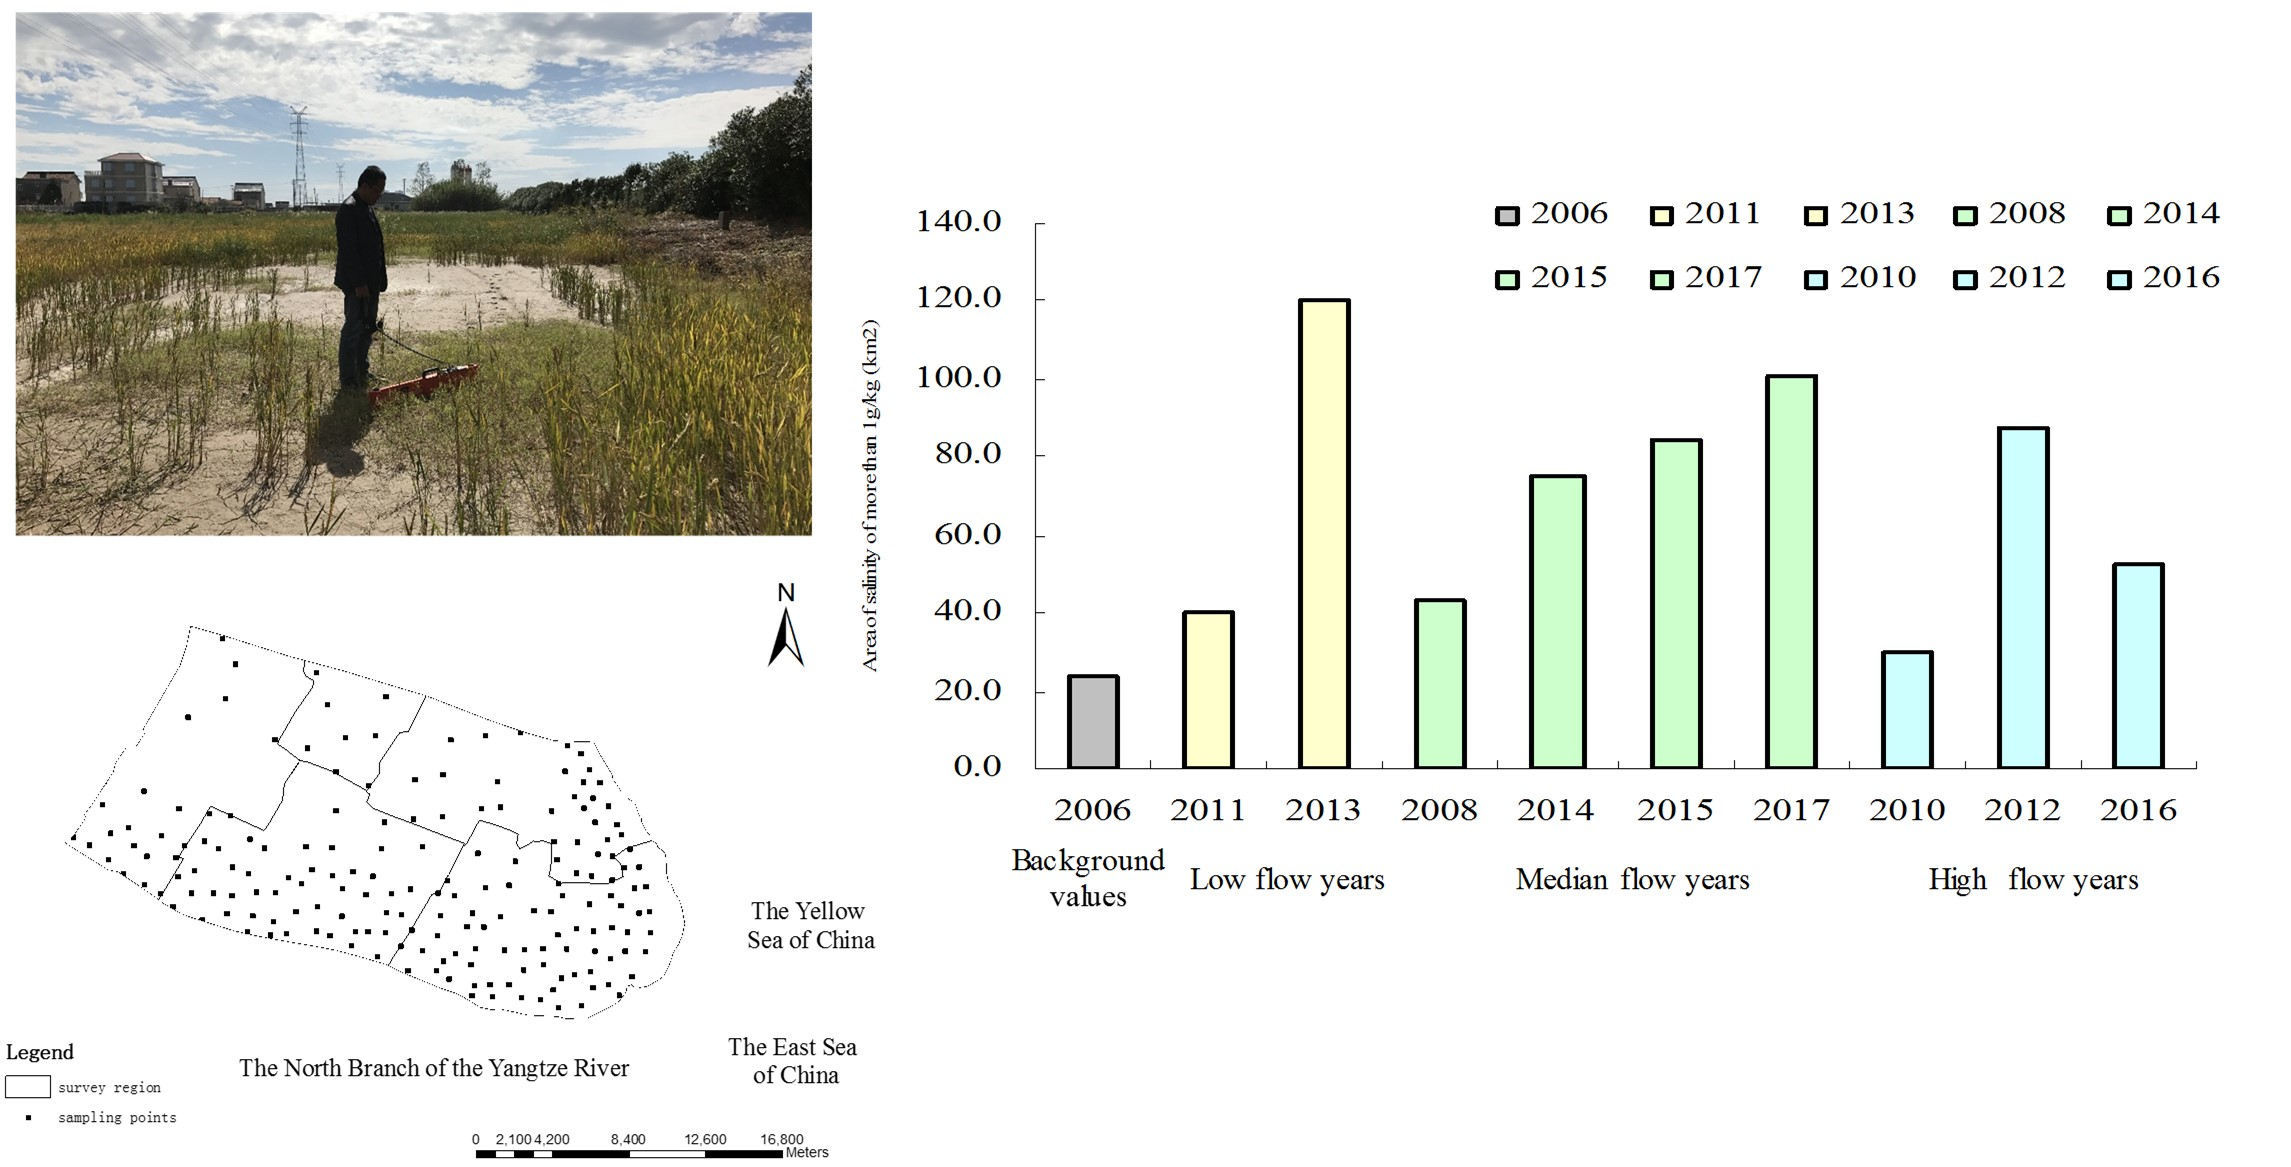
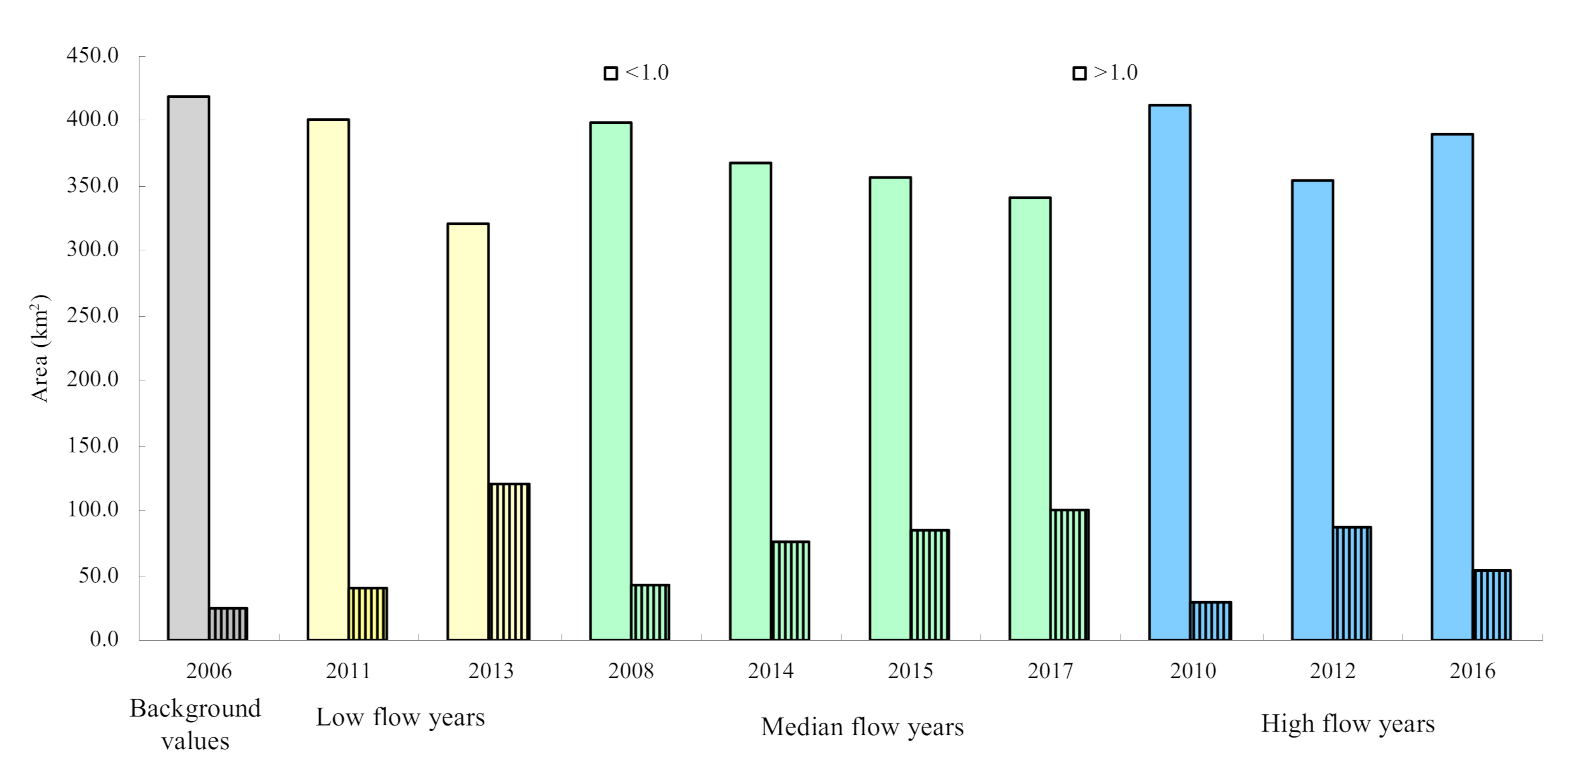
The primary stage of impoundment of the Three Gorges Reservoir occurred from 2003 to 2006. In 2008, the impounding height started its 175 m trial impoundment plan. The year 2006 was selected as the background value and the survey years were grouped according to the hydrological year type. For soil salinity in different hydrological year types, the areas of both salinized and non-salinized soil were calculated (Table 4). The result showed that regardless of the hydrological year, the area of salt-affected soil increased (Figure 10). Areas of soil with salinity > 1.0 g kg−1 decreased because the flow exceeded 32,000 m3 s−1. However, the areas of soil with salinity > 1.0 g kg−1 in 2016 were larger than those with similar flow in 2012. Areas of salt-affected soil presented a trend of continuous growth under the hydrological year types. In conclusion the area affected by soil salinity gradually increased in different hydrological year types under the impoundment of the TGR.
4. Discussion
Soil salinity is an important factor affecting plant growth, determining the plant’s spatial distribution. The study area of this paper was typical, because of complex salt-water environment. It is different from arid area where water was limited and secondary salinization occurred frequently owing to irrigation. In estuary areas, the background values of soil salinity are higher than that of inland and other environmental factors such as the salinity of surface water and groundwater influences the variation of soil salinity and its spatial distribution. The distribution of soil salinity is an indicator of the ecological environment and understanding of the spatial distribution and temporal variation of soil salinity is important in terms of environmental and agricultural aspects in estuary areas. In this study, soil salinity was investigated by ECa measurement by the way of proximal induction EM38 and the change in soil salinity on a temporal and spatial scale was studied using geostatistical methods on the basis of the soil salinity survey across several years. In this paper, the proximal sensed data of ECa measured by EM was converted to soil salt content through established statistical models with high accuracy. Consequently, the soil salinity was easily and conveniently acquired through the proximal sensed data obtained from EM instrument. The result was consistent with that of Li et al. [21]. In our research, soil salinity was interpreted through constructing simple linear model using the four parameters of EM induction with satisfactory prediction results verified by measured data. The simple method can be applied in the region around the estuarine or coastal area with similar soil conditions (similar water condition, soil salinity condition and soil clay content) [58], in order to obtain the basic information of surface soil salinity quickly. ECa data could also be obtained from EM38 and other proximal sensed instrument such as EM31, in order to get deeper and more accurate information of soil salinity [21,59].
The descriptive statistics of soil salt salinity in different survey years showed that soil salinization was a problem in the YRE. Soil salinity displayed moderate and strong variability in the survey years. Soil salinity varied greatly from year to year and the maximum soil salinity reached the standard of severe salinization. From the year 2008, the average value of soil salinity was basically near 1.0 g kg−1 or exceeded 1.0 g kg−1, which could be classified as salinized soil. Semivariogram analysis showed that soil salinity in almost every survey year displayed moderate spatial autocorrelation, indicating that the spatial variability of soil salinity was mainly caused by the combined effects of structural factors (such as climate, parent material, topography and soil type) and random factors (such as cultivation, soil improvement and fertilization.). This could be due to the survey area being large, thus presenting several differences in climate, soil parent material, topography, saltwater intrusion and some other influent factors [22].
The spatial distribution of soil salinity in the estuary might be attributed to the distances to the sea [60,61] and the riverbank of the Yangtze River, as well as the topography, groundwater salinity and level, soil parent material, etc. Area with high soil salinity is generally close to the sea and this was consistent with high groundwater level and salinity. The result of Zhang et al. in the YRE showed that parent material and high groundwater salinity affected the variation of soil salinity, which indicated that soil salinity was not easy to discharge from soil due to high groundwater table salinity [59]. Hydrological year type was selected as the basis of comparison in this paper and salinized soil area was found to be expanding. Area of soil with a salinity > 1.0 g kg−1 increased during low-flow years, median-flow years and high-flow years. This research result revealed that, on the premise of similar hydrological year, the area of salinized soil in the survey region gradually increased under the combined effect of long-term water-storage condition of the TGR and climate change, which has great guiding significance for local agricultural and ecological environment. Runoff into the sea was one of the most important factors affecting seawater intrusion. Regional soil salinity was mainly influenced by seawater intrusion. Large dams in the upper reaches reduced river flow in specific periods, which could aggravate the seawater intrusion [27,29]. This might be one of the reasons for the increased range of salinized soil. From the result in the paper and in relevant study, the region is with high risk of soil salinization and the temporal and spatial dynamics of soil salinity should be concerned for a long time [35].
5. Conclusions
This research investigated the spatial distribution and temporal variation of regional soil salinity under the impoundment of the TGD in the YRE. In the paper, electro-magnetic induction (EM38) was applied to perform a field-scale soil salinity survey in the YRE and enabling a quick determination and quantitative assessment of the spatial and temporal variation of soil salinity on a regional scale from 2006 to 2017. Soil salinity was estimated from the apparent electrical conductivity of soil (ECa) using multiple linear regression models established on the basis of the EM 38 data. The modeled soil electrical conductivity was verified using the measured data and the result was acceptable. Semivariogram models were established and discussed and results showed that soil salinity in most survey years indicated moderate spatial autocorrelation. The spatial distribution of all survey years showed the same characteristics, whereby the soil salt content gradually increased as the distance from the ocean and the river decreased. Non-salinized soil was mainly distributed in the northwestern part of the survey area and moderately and regions with severely salinized soil were mainly concentrated near the coastal and riverside zones. The spatial distribution of soil salinity was visualized in the form of a quantitative classification and the area of salt-affected soil was calculated. Under long-term impoundment of the Three Gorges Reservoir, areas of salt-affected were calculated in different hydrological year types and the areas of salt-affected soil presented an increasing trend in the group of low-, median- and high-flow years in autumn. The interaction between the soil salinity and the groundwater and surface water should be further studied in this area, in order to better understand the source of the soil salinity and its variation.
Author Contributions
Conceptualization, W.X. and J.Y.; Investigation, X.W.; methodology, W.X. and J.Y.; writing—original draft preparation, W.X.; formal analysis, W.X. and R.Y.; Validation, W.X. and R.Y.; Writing—original draft, W.X.; Writing—review & editing, W.X. and J.Y. All authors have read and agreed to the published version of the manuscript.
Funding
This research was funded by the National Key Research and Development Program of China (2019YFD0900702, 2016YFC0501300, 2019YFD1002702), National Natural Science Foundation Project (No. 41701253, NO.41977015, U1806215), the ecological and environmental monitoring project funded by Three Gorges Project Management Department of the Ministry of Water Resources of the People’s Republic of China.
Institutional Review Board Statement
Not applicable.
Informed Consent Statement
Not applicable.
Acknowledgments
We want to thank the editor and anonymous reviewers for their valuable comments and suggestions to this paper. And we want to show our appreciation to the data support of the web server of Yangtze River Hydrology.
Conflicts of Interest
The authors declare no conflict of interest.
References
- Rady, M.M. Effect of 24-epibrassinolide on growth, yield, antioxidant system and cadmium content of bean (Phaseolus vulgaris L.) plants under salinity and cadmium stress. Sci. Hortic. 2011, 129, 232–237. [Google Scholar] [CrossRef]
- Metternicht, G.; Zinck, J. Remote sensing of soil salinity: Potentials and constraints. Remote Sens. Environ. 2003, 85, 1–20. [Google Scholar] [CrossRef]
- Wang, Y.; Xiao, D.; Li, Y.; Li, X. Soil salinity evolution and its relationship with dynamics of groundwater in the oasis of inland river basins: Case study from the Fubei region of Xinjiang Province, China. Environ. Monit. Assess. 2007, 140, 291–302. [Google Scholar] [CrossRef]
- Manchanda, G.; Garg, N. Alleviation of salt-induced ionic, osmotic and oxidative stresses in Cajanus cajan nodules by AM inoculation. Plant Biosyst. 2011, 145, 88–97. [Google Scholar] [CrossRef]
- Zhang, H.J.; Dong, H.Z.; Li, W.J.; Zhang, D.M. Effects of Soil Salinity and Plant Density on Yield and Leaf Senescence of Field-Grown Cotton. J. Agron. Crop Sci. 2011, 198, 27–37. [Google Scholar] [CrossRef]
- Zhang, Z.J.; Li, H.Z.; Qiao, S.J.; Zhang, X.; Liu, P.P.; Liu, X.L. Effect of salinity on seed germination, seedling growth, and phys-iological characteristics of Perilla frutescens. Plant Biosyst. 2012, 146, 245–251. [Google Scholar] [CrossRef]
- Elias, P.J.; Dite, D.; Suvada, R.; Pis, V.; Ikrenyi, I. Hordeum geniculatum in the Pannonian Basin: Ecological requirements and grassland vegetation on salt-affected soils. Plant Biosyst. 2013, 147, 1–18. [Google Scholar] [CrossRef]
- FAO; ITPS. Status of the World’s Soil Resources (SWSR)—Main Report; Food and Agriculture Organization of the United Nations and Intergovernmental Technical Panel on Soils: Rome, Italy, 2015. [Google Scholar]
- Ivushkin, K.; Bartholomeus, H.; Bregt, A.K.; Pulatov, A.; Kempen, B.; de Sousa, L. Global mapping of soil salinity change. Remote Sens. Environ. 2019, 231, 111260. [Google Scholar] [CrossRef]
- Wang, Z.Q.; Zhu, S.Q.; Yu, R.P. Saline Soil in China; Science Press: Beijing, China, 1993. [Google Scholar]
- Karlen, D.L.; Tomer, M.D.; Neppel, J.; Cambardella, C.A. A preliminary watershed scale soil quality assessment in north central Iowa, USA. Soil Tillage Res. 2008, 99, 291–299. [Google Scholar] [CrossRef]
- Li, X.; Liu, Y.; Chen, M.; Song, Y.P.; Song, J.; Wang, B.S.; Feng, G. Relationships between ion and chlorophyll accumulation in seeds and adaptation to saline environments in Suaeda salsa populations. Plant Biosyst. Int. J. Deal. Asp. Plant Biol. 2012, 146, 142–149. [Google Scholar] [CrossRef]
- Xing, J.J.; Cai, M.; Chen, S.S.; Chen, L.; Lan, H.Y. Seed germination, plant growth and physiological responses of Salsola ikon-nikovii to short-term NaCl stress. Plant Biosyst. 2013, 147, 285–297. [Google Scholar] [CrossRef]
- Shelef, O.; Lazarovitch, N.; Rewald, B.; Golan, G.A.; Rachmilevitch, S. Root halotropism: Salinity effects on Bassia indica root. Plant Biosyst. 2010, 144, 471–478. [Google Scholar] [CrossRef]
- Rewald, B.; Leuschner, C.; Wiesman, Z.; Ephrath, J.E. Influence of salinity on root hydraulic properties of three olive varieties. Plant Biosyst. Int. J. Deal. Asp. Plant Biol. 2011, 145, 12–22. [Google Scholar] [CrossRef]
- Barradas, J.M.M.; Abdelfattah, A.; Matula, S.; Doležal, F. Effect of Fertigation on Soil Salinization and Aggregate Stability. J. Irrig. Drain. Eng. 2015, 141, 05014010. [Google Scholar] [CrossRef]
- Li, H.X.; Liu, X.; Hu, B.; Biswas, A.; Jiang, Q.; Liu, W.; Wang, N.; Peng, J. Field-Scale Characterization of Spatio-Temporal Variability of Soil Salinity in Three Dimensions. Remote Sens. 2020, 12, 4043. [Google Scholar] [CrossRef]
- Ding, J.; Yang, S.; Shi, Q.; Wei, Y.; Wang, F. Using Apparent Electrical Conductivity as Indicator for Investigating Potential Spatial Variation of Soil Salinity across Seven Oases along Tarim River in southern Xinjiang, China. Remote Sens. 2020, 12, 2601. [Google Scholar] [CrossRef]
- Nurmemet, I.; Ghulam, A.; Tiyip, T.; Elkadiri, R.; Ding, J.-L.; Maimaitiyiming, M.; Abliz, A.; Sawut, M.; Zhang, F.; Abliz, A.; et al. Monitoring Soil Salinization in Keriya River Basin, Northwestern China Using Passive Reflective and Active Microwave Remote Sensing Data. Remote Sens. 2015, 7, 8803–8829. [Google Scholar] [CrossRef] [Green Version]
- Tian, C.; Mai, W.; Zhao, Z. Study on key technologies of ecological management of saline alkali land in arid area of Xinjiang. Acta Ecol. Sin. 2016, 3636, 7064–7068. [Google Scholar]
- Li, X.; Yang, J.; Liu, M.; Liu, G.; Yu, M. Spatio-Temporal Changes of Soil Salinity in Arid Areas of South Xinjiang Using Electro-magnetic Induction. J. Integr. Agric. 2012, 11, 1365–1376. [Google Scholar] [CrossRef]
- Lv, Z.Z.; Liu, G.M.; Yang, J.S.; Zhang, M.M.; He, L.D.; Shao, H.B.; Yu, S.P. Spatial Variability of Soil Salinity in Bohai Sea Coastal Wetlands, China: Partition into Four Management Zones. Plant Biosyst. 2013, 147, 1201–1210. [Google Scholar] [CrossRef] [Green Version]
- Liu, W.; Lu, F.; Xu, X.; Chen, G.; Fu, T.; Su, Q. Spatial and Temporal Variation of Soil Salinity During Dry and Wet Seasons in the Southern Coastal Area of Laizhou Bay, China. Indian J. Geo Mar. Sci. 2020, 49, 260–270. [Google Scholar]
- World Bank. Bangladesh: Climate Change and Sustainable Development; Report No. 21104-BD; World Bank, Rural Development Unit, South Asia Region: Dhaka, Bangladesh, 2000; pp. 1–45. [Google Scholar]
- Rawlani, A.K.; Sovacool, B.K. Building responsiveness to climate change through community based adaptation in Bangladesh. Mitig. Adapt. Strat. Glob. Chang. 2011, 16, 845–863. [Google Scholar] [CrossRef]
- Paz, M.C.; Farzamian, M.; Paz, A.M.; Castanheira, N.L.; Gonçalves, M.C.; Santos, F.M. Assessing soil salinity dynamics using time-lapse electromagnetic conductivity imaging. SOIL 2020, 6, 499–511. [Google Scholar] [CrossRef]
- Xie, W.P.; Yang, J.S.; Yao, R.J.; Wang, X.P. Impact Study of Impoundment of the Three Gorges Reservoir on Salt-Water Dynamics and Soil Salinity in the Yangtze River Estuary. J. Environ. Inform. 2020, 36, 11–23. [Google Scholar] [CrossRef]
- Shao, A.J.; Zhao, L.Y.; Wang, S.W. Analysis of the dynamic impact of Three-Gorge Project on regime of soil water and salt in Yangtze River Delta. Cluster Comput. 2016, 19, 2051–2060. [Google Scholar]
- Kotb, T.H.; Watanabe, T.; Ogino, Y.; Tanji, K.K. Soil salinization in the Nile Delta and related policy issues in Egypt. Agric. Water Manag. 2000, 43, 239–261. [Google Scholar] [CrossRef]
- Jiang, C.L.; Yan, Y.X. Impact of water conservancy project on ecosystem and environment of the Yangtze River estuary. Resour. Environ. Yangtze Basin 2003, 12, 547–551. [Google Scholar]
- Chen, Q.J.; Xu, J.Y.; Zhu, J.R. Determination of critical flow for saline water intrusion into water source area of Yangtze River estuary and guarantee measures. Yangtze River 2011, 42, 67–72. [Google Scholar]
- Chen, J.Y.; Xu, H.G. Impacts of the Yangtze River Three-Gorege Hydro-engineering works on the Yangtze estuar. Resour. Environ. Yangtze Valley 1995, 4, 242–246, (In Chinese with an English Abstract). [Google Scholar]
- An, Q.; Wu, Y.Q.; Talor, S.; Zhao, B. Influence of the Three Gorges Project on saltwater intrusion in the Yangtze River Estuary. Environ. Geol. 2009, 56, 1679–1686. [Google Scholar] [CrossRef]
- Yu, S.P.; Yang, J.S.; Liu, G.M. Impact on soil salinization in Yangtze River estuary by Three-Gorge project. J. Liaoning Tech. Univ. 2009, 28, 1013–1017. [Google Scholar]
- Zhang, T.J.; Yang, J.S.; Liu, G.M.; Yang, Q.Y. Application of Grey System Theory Evaluating the Influencing Factors of soil Salinity. Chin. J. Soil Sci. 2010, 41, 793–796. [Google Scholar]
- Sheng, J.; Ma, L.; Jiang, P.; Li, B.; Huang, F.; Wu, H. Digital soil mapping to enable classification of the salt-affected soils in desert agro-ecological zones. Agric. Water Manag. 2010, 97, 1961–1970. [Google Scholar] [CrossRef]
- Li, H.Y.; Shi, Z.; Webster, R.; Triantafilis, J. Mapping the three-dimensional variation of soil salinity in a rice-paddy soil. Geoderma 2013, 195, 31–41. [Google Scholar] [CrossRef]
- McNeill, J.D. Electromagnetic Terrain Conductivity Measurement at Low Induction Numbers; Geonics Limited: Mississauga, ON, Canada, 1980; pp. 1–15. [Google Scholar]
- Corwin, D.L.; Lesch, S.M. Application of soil electrical conductivity to precision agriculture: Theory, principles, and guidelines. Agron. J. 2003, 95, 455–471. [Google Scholar] [CrossRef]
- Triantafilis, J.; Laslett, G.M.; McBratney, A.B. Calibrating an electromagnetic induction instrument to measure salinity in soil under irrigated cotton. Soil Sci. Soc. Am. J. 2000, 64, 1008–1017. [Google Scholar] [CrossRef]
- Triantafilis, J.; Odeh, I.O.A.; McBratney, A.B. Five geostatistical methods to predict soil salinity from electromagnetic induction data across irrigated cotton. Soil Sci. Soc. Am. J. 2001, 65, 869–978. [Google Scholar] [CrossRef]
- Wang, F.; Yang, S.; Wei, Y.; Shi, Q.; Ding, J. Characterizing soil salinity at multiple depth using electromagnetic induction and remote sensing data with random forests: A case study in Tarim River Basin of southern Xinjiang, China. Sci. Total Environ. 2020, 754, 142030. [Google Scholar] [CrossRef]
- Taghizadeh-Mehrjardi, R.; Minasny, B.; Sarmadian, F.; Malone, B.P. Digital mapping of soil salinity in Ardakan region, central Iran. Geoderma 2013, 213, 15–28. [Google Scholar] [CrossRef]
- Cetin, M.; Kirda, C. Spatial and temporal changes of soil salinity in a cotton field irrigated with low-quality water. J. Hydrol. 2003, 272, 238–249. [Google Scholar] [CrossRef]
- Douaik, A.; Van Meirvenne, M.; Tóth, T. Soil salinity mapping using spatiotemporal kriging Bayesian maximum entropy with interval soft data. Geoderma 2005, 128, 234–248. [Google Scholar] [CrossRef]
- Lesch, S.M.; Rhoades, J.D.; Lund, L.J.; Corwin, D.L. Mapping soil salinity using calibrated electromagnetic measurements. Soil Sci. Soc. Am. J. 1992, 56, 540–548. [Google Scholar] [CrossRef]
- Triantafilis, J.; Ahmed, M.F.; Odeh, I.O.A. Application of a mobile electromagnetic sensing system (MESS) to assess cause and management of soil salinization in an irrigated cotton-growing field. Soil Use Manag. 2002, 18, 330–339. [Google Scholar] [CrossRef]
- Yang, J.S.; Yao, R.J. Comparison of interpolation approaches based on spatial variability of apparent soil electrical conductivity with an electromagnetic induction. Trans. CSAE 2007, 23, 50–57. [Google Scholar]
- Wang, Z.; Zhang, F.; Zhang, X.; Chan, N.W.; Kung, H.-T.; Zhou, X.; Wang, Y. Quantitative Evaluation of Spatial and Temporal Variation of Soil Salinization Risk Using GIS-Based Geostatistical Method. Remote Sens. 2020, 12, 2405. [Google Scholar] [CrossRef]
- Lu, R.K. Analysis Method of Soil Agro-Chemistry; Agricultural Science and Technology Press: Beijing, China, 1999. [Google Scholar]
- Corwind, L.; Leschs, M. Characterizing soil spatial variability with apparent soil electrical conductivity I. Survey protocols. Comput. Electron. Agric. 2005, 46, 103–133. [Google Scholar] [CrossRef]
- Sheets, K.R.; Hendrickx, J.M.H. Noninvasive soil water content measurement using electromagnetic induction. Water Resour. Res. 1995, 31, 2401–2409. [Google Scholar] [CrossRef]
- Lei, Z.D.; Yang, S.X.; Xie, S.C. Soil Water Dynamics; Tsing Hua University Press: Beijing, China, 1988. [Google Scholar]
- Cambardella, C.A.; Moorman, T.B.; Novak, J.M.; Parkin, T.B.; Karlen, D.L.; Turco, R.F.; Konopka, A. Field-scale variability of soilproperties in central Iowa soils. Soil Sci. Soc. Am. J. 1994, 58, 1501–1511. [Google Scholar] [CrossRef]
- Chang, Y.H.; Scrimshaw, M.D.; Emmerson, R.H.C.; Lester, J.N. Geostatistical analysis of sampling uncertainty at the Tollesbury Managed Retreat site in Blackwater Estuary, Essex, UK: Kriging and cokriging approach to minimize sampling density. Sci. Total Environ. 1998, 22, 43–57. [Google Scholar] [CrossRef]
- Yang, S.L.; Zhao, Q.Y.; Belkin, I.M. Temporal variation in the sediment load of the Yangtze River and the influences of human activities. J. Hydrol. 2002, 263, 56–71. [Google Scholar] [CrossRef]
- Shen, H.T. Material Flux in the Yangtze River Estuary; Ocean Press: Beijing, China, 2001. [Google Scholar]
- Visconti, F.; de Paz, J.M. Sensitivity of soil electromagnetic induction measurements to salinity, water content, clay, organic matter and bulk density. Precis. Agric. 2021, 1–19. [Google Scholar] [CrossRef]
- Wang, J.; Zhao, X.; Zhao, D.; Arshad, M.; Zare, E.; Triantafilis, J. Reconnaissance scale mapping of salinity in three dimensions using EM38 and EM34 data and inversion modeling. Land Degrad. Dev. 2020, 31, 2936–2951. [Google Scholar] [CrossRef]
- McLeod, M.K.; Slavich, P.G.; Irhas, Y.; Moore, N.; Rachman, A.; Ali, N.; Iskandar, T.; Hunta, C.; Caniago, C. Soil salinity in Aceh after the December 2004 Indian Ocean tsunami. Agric. Water Manag. 2010, 97, 605–613. [Google Scholar] [CrossRef]
- Wahab, M.A.; Rasheed, M.A.; Youssef, R.A. Degradation hazard assessment of some soils North Nile Delta, Egypt. J. Am. Sci. 2010, 6, 156–161. [Google Scholar]
Figure 1.
Flowchart of the work.

Figure 2.
Locations of the study area.

Figure 3.
Survey region and distribution of soil sampling points (The black dots represented the sampling points).
Figure 3.
Survey region and distribution of soil sampling points (The black dots represented the sampling points).

Figure 4.
Comparison of predicted and measured value in October 2011.

Figure 5.
Comparison of predicted and measured value in October 2012.

Figure 6.
Correlation between the soil electrical conductivity and soil salt content.

Figure 7.
Semi-variograms of soil salinity at 20 depths in typical years. (a) Semi-variogram of soil salinity 2006; (b) Semi-variogram of soil salinity 2012; (c) Semi-variogram of soil salinity 2013; (d) Semi-variogram of soil salinity 2017.
Figure 7.
Semi-variograms of soil salinity at 20 depths in typical years. (a) Semi-variogram of soil salinity 2006; (b) Semi-variogram of soil salinity 2012; (c) Semi-variogram of soil salinity 2013; (d) Semi-variogram of soil salinity 2017.

Figure 8.
Spatial distributions of soil salinity in typical hydrological years. (a) Spatial distributions of soil salinity in 2006; (b) Spatial distributions of soil salinity in 2012; (c) Spatial distributions of soil salinity in 2013; (d) Spatial distributions of soil salinity in 2017.
Figure 8.
Spatial distributions of soil salinity in typical hydrological years. (a) Spatial distributions of soil salinity in 2006; (b) Spatial distributions of soil salinity in 2012; (c) Spatial distributions of soil salinity in 2013; (d) Spatial distributions of soil salinity in 2017.

Figure 9.
Spatial distributions of groundwater depth and salinity in the Yangtze River Estuary in 2008. (a) Spatial distributions of groundwater salinity; (b) Spatial distributions of groundwater depth.
Figure 9.
Spatial distributions of groundwater depth and salinity in the Yangtze River Estuary in 2008. (a) Spatial distributions of groundwater salinity; (b) Spatial distributions of groundwater depth.

Figure 10.
Area of salt affected soil variation.


Table 1.
Multiple linear regression models between soil electrical conductivity and EM data.
| Depth (cm) | Regression Model | EC1:5 = a × EM1v + b × EM1h + c × EM0.5v + d × EM0.5h + e | |||||
|---|---|---|---|---|---|---|---|
| a | b | c | d | e | R2 | ||
| 0~20 | Stepwise regression model | 0 | 0 | 0 | 0.006 | −0.108 | 0.787 |
| 0~20 | Enter regression model | −0.0084 | 0.0122 | 0.0016 | 0.0009 | −0.0184 | 0.841 |
Table 2.
Descriptive statistical results of soil salt content in different sample year (g kg−1).
| Statistics | 2006 | 2008 | 2011 | 2012 | 2013 | 2014 | 2015 | 2016 | 2017 |
|---|---|---|---|---|---|---|---|---|---|
| Mean | 0.62 | 0.87 | 0.89 | 1.15 | 1.33 | 1.02 | 1.20 | 0.92 | 1.12 |
| Std. Error of Mean | 0.02 | 0.08 | 0.10 | 0.06 | 0.08 | 0.05 | 0.08 | 0.04 | 0.05 |
| Std. Deviation | 0.11 | 0.74 | 1.74 | 0.82 | 1.12 | 0.62 | 1.07 | 0.52 | 0.70 |
| Coefficient of variation (CV, %) | 17.7 | 85.1 | 195.5 | 71.3 | 84.2 | 60.8 | 89.2 | 56.5 | 62.5 |
| Variance | 5.06 | 0.55 | 6.61 | 0.66 | 1.26 | 0.39 | 1.15 | 0.27 | 0.48 |
| Skewness | 0.12 | 5.36 | 0.19 | 2.42 | 3.55 | 2.87 | 5.22 | 3.62 | 2.52 |
| Std. Error of Skewness | 30.67 | 0.26 | 53.18 | 0.19 | 0.18 | 0.19 | 0.18 | 0.19 | 0.19 |
| Kurtosis | 0.24 | 30.21 | 0.37 | 6.30 | 17.44 | 9.85 | 40.08 | 19.38 | 6.90 |
| Std. Error of Kurtosis | 0.62 | 0.52 | 12.93 | 0.38 | 0.36 | 0.37 | 0.36 | 0.38 | 0.37 |
| Range | 3.05 | 5.14 | 0.18 | 4.60 | 8.89 | 3.85 | 10.47 | 4.28 | 3.82 |
| Minimum | 0.32 | 0.58 | 0.89 | 0.47 | 0.51 | 0.48 | 0.52 | 0.41 | 0.54 |
| Maximum | 3.37 | 5.72 | 13.11 | 5.08 | 9.40 | 4.33 | 11.00 | 4.69 | 4.36 |
Table 3.
Parameters of Semi-variogram models for soils salinity in survey years.
| Time | Model Type | C0 | Sill | Range | Nugget-Sill (%) | R2 | RSS | ME | ASE | RMSE |
|---|---|---|---|---|---|---|---|---|---|---|
| 2006 | Spherical | 0.035 | 0.069 | 25,480 | 50.7 | 0.982 | 2.68 × 10⁻⁵ | 0.001 | 0.240 | 0.343 |
| 2008 | Exponential | 0.002 | 0.086 | 10,350 | 198.4 | 0.846 | 1.10 × 10⁻³ | 0.038 | 0.355 | 0.423 |
| 2010 | Gussian | 0.193 | 0.549 | 31,211 | 35.2 | 0.954 | 5.98 × 10⁻³ | 0.031 | 0.391 | 0.546 |
| 2011 | Exponential | 0.150 | 0.251 | 21,880 | 59.8 | 0.861 | 3.56 × 10⁻³ | 0.068 | 0.897 | 1.023 |
| 2012 | Exponential | 0.079 | 0.140 | 20,120 | 56.4 | 0.845 | 1.75 × 10⁻³ | 0.034 | 0.314 | 0.576 |
| 2013 | Exponential | 0.169 | 0.248 | 21,455 | 68.2 | 0.835 | 2.26 × 10⁻³ | 0.031 | 0.410 | 0.845 |
| 2014 | Exponential | 0.053 | 0.106 | 12,600 | 49.5 | 0.909 | 2.38 × 10⁻⁴ | 0.022 | 0.247 | 0.446 |
| 2015 | Spherical | 0.104 | 0.150 | 23,692 | 69.1 | 0.527 | 5.09 × 10⁻³ | 0.035 | 0.393 | 0.776 |
| 2016 | Spherical | 0.050 | 0.118 | 6870 | 42.4 | 0.406 | 5.36 × 10⁻³ | 0.001 | 0.240 | 0.343 |
| 2017 | Exponential | 0.064 | 0.130 | 16,770 | 49.6 | 0.736 | 1.03 × 10⁻³ | 0.021 | 0.331 | 0.513 |
Table 4.
Area of different salinity grades in different survey years.
| Hydrological Types | Survey Year | Area of Different Salinity Grades (km2) | Annual Average Flow at Datong Station (m3 s−1) | |
|---|---|---|---|---|
| <1.0 g kg−1 | >1.0 g kg−1 | |||
| Background value | 2006 | 418.0 | 23.7 | 21,937.7 |
| low flow year | 2011 | 401.7 | 40.0 | 21,091.2 |
| 2013 | 321.6 | 120.0 | 24,996.2 | |
| median flow year | 2008 | 398.2 | 43.4 | 26,159.9 |
| 2014 | 366.8 | 74.8 | 28,253.1 | |
| 2015 | 356.9 | 84.8 | 28,614.6 | |
| 2017 | 340.4 | 101.2 | 29,161.7 | |
| high flow year | 2010 | 412.0 | 29.6 | 32,218.3 |
| 2012 | 354.3 | 87.4 | 31,497.1 | |
| 2016 | 389.2 | 52.5 | 32,614.0 | |
Publisher’s Note: MDPI stays neutral with regard to jurisdictional claims in published maps and institutional affiliations. |
© 2021 by the authors. Licensee MDPI, Basel, Switzerland. This article is an open access article distributed under the terms and conditions of the Creative Commons Attribution (CC BY) license (https://creativecommons.org/licenses/by/4.0/).
Share and Cite
MDPI and ACS Style
Xie, W.; Yang, J.; Yao, R.; Wang, X. Spatial and Temporal Variability of Soil Salinity in the Yangtze River Estuary Using Electromagnetic Induction. Remote Sens. 2021, 13, 1875. https://0-doi-org.brum.beds.ac.uk/10.3390/rs13101875
AMA Style
Xie W, Yang J, Yao R, Wang X. Spatial and Temporal Variability of Soil Salinity in the Yangtze River Estuary Using Electromagnetic Induction. Remote Sensing. 2021; 13(10):1875. https://0-doi-org.brum.beds.ac.uk/10.3390/rs13101875
Chicago/Turabian StyleXie, Wenping, Jingsong Yang, Rongjiang Yao, and Xiangping Wang. 2021. "Spatial and Temporal Variability of Soil Salinity in the Yangtze River Estuary Using Electromagnetic Induction" Remote Sensing 13, no. 10: 1875. https://0-doi-org.brum.beds.ac.uk/10.3390/rs13101875
Note that from the first issue of 2016, this journal uses article numbers instead of page numbers. See further details here.