Article

Identifying Seasonal Groundwater-Irrigated Cropland Using Multi-Source NDVI Time-Series Images

1
L’Unité Mixte de Recherche Littoral, Environnement, Géomatique, Télédétection, le Centre National de la Recherche Scientifique, University of Rennes, 35043 Rennes, France
2
Indo-French Cell for Water Science, Indian Institute of Science, Bangalore 560012, India
3
Department of Civil Engineering, Indian Institute of Science, Bangalore 560012, India
4
Institut de Recherche Pour le Développement, Centre National de la Recherche Scientifique, Université Toulouse III-Paul Sabatier, l’Unité Mixte de Recherche Littoral, Géosciences Environnement Toulouse–La Terre, 31401 Toulouse, France
5
L’Institut National de Recherche pour l’Agriculture, l’alimentation et l’Eenvironnement, AgroCampus Ouest, l’Unité Mixte de Recherche Littoral, Sol Agro et hydrosystème Spatialisation, 35043 Rennes, France
6
Earth Observation and Disaster Management Programme Office, Indian Space Research Organisation, Headquarter, Bangalore 560094, India
*
Author to whom correspondence should be addressed.
Remote Sens. 2021, 13(10), 1960; https://0-doi-org.brum.beds.ac.uk/10.3390/rs13101960
Submission received: 23 March 2021 / Revised: 5 May 2021 / Accepted: 7 May 2021 / Published: 18 May 2021
(This article belongs to the Special Issue Irrigation Mapping Using Satellite Remote Sensing)

Abstract

:
Groundwater has become a major source of irrigation in the past few decades in India, but as it comes from millions of individual borewells owned by smallholders irrigating small fields, it is difficult to quantify the actual irrigated area across seasons and years. This study’s main goal was to monitor seasonal irrigated cropland using multiple optical satellite images. The proposed research was performed over the Berambadi watershed, an experimental site in southern peninsular India. While cloud cover during crop growth is the greatest obstacle to optical remote sensing in tropical regions, the cloud-free images from multiple optical satellite platforms (Landsat-8 (OLI), EO1 (ALI), IRS-P6 (LISS3 and LISS4), and Spot5Take5 (HRG2)) were used to fill data gaps during crop growth periods. The seasonal cumulative normalized difference vegetation index (NDVI) was calculated and resampled at 5 m spatial resolution for various cropping seasons. The support vector machine (SVM) classification was applied to seasonal cumulative NDVI images for irrigated cropland area classification. Validation of the classified irrigated cropland was performed by calculating kappa coefficients for three cropping seasons (summer, kharif, and rabi) from 2014–2016 using ground observations. Kappa coefficients ranged from 0.81–0.96 for 2014–2015 and 0.62–0.89 for 2015–2016, except for summer 2016, when it was 1.00. Groundwater irrigation in the watershed ranged from 4.6% to 16.5% of total cropland during these cropping seasons. These results showed that multi-source optical satellite data are relevant for quantifying areas under groundwater irrigation in tropical regions.

1. Introduction

Groundwater is the primary source of freshwater, and globally, 70% of freshwater is used to irrigate 18% of the agricultural areas [1,2]. Globally, about 301 million ha of cropland are equipped for irrigation, and about 38% of the total cropland uses groundwater for irrigation purpose [1]. India, China, and the USA are the main countries equipped for groundwater irrigation, with 39, 19, and 17 million ha area, respectively [1,3]. Extensive uncontrolled use of groundwater for irrigation usually results in freshwater scarcity [4]. Groundwater is considered a more reliable and flexible source of freshwater for irrigation than canals [1,5]. Groundwater is used as the primary freshwater resource even though there is high uncertainty about groundwater recharge and storage estimates. Globally, groundwater recharge is about 12,600 km3 yr−1, and groundwater withdrawal ranges from 600–1000 km3 yr−1 [6,7,8].
Surface water and groundwater irrigation in India has increased significantly since the Green Revolution in the 1960s [9]. Agriculture, which is the largest sector of employment in India, benefitted from diverse irrigation practices, high-yield crop varieties, and fertilizers [10,11,12]. Groundwater salinization is a growing concern in semi-arid regions where groundwater is intensively used for irrigation [11]. Agricultural production is susceptible to short-term anomalies, episodic extreme weather, erratic seasonal rainfall, extensive use of groundwater, and high air temperatures [13,14,15]. More than 94% of Indian farmers have small landholdings (<4 ha) [16,17], and irrigation intensity, the source of irrigation, classification of irrigated crop types, and precise monitoring of irrigated cropland are the most significant challenges in tropical regions with small fields [18,19].
Monitoring groundwater-irrigated cropland and identifying intensive cropping areas are two of the crucial steps to control the global scarcity of freshwater [19,20]. The primary sources of total cultivation and irrigation data in India are the Ministry of Water Resources, Directorate of Economics and Statistics, and Food and Agricultural Organization (FAO) of the United Nations [13,19]. The normalized difference vegetation index (NDVI) calculated from remote sensing images, which is highly sensitive to green vegetation, is used globally to identify irrigated areas [13,21,22,23,24,25,26,27]. Several irrigated cropland studies have been conducted at global, regional, national, and watershed scales in the past few years. The United States Geological Survey Global Land Cover map was developed using a monthly composite of NDVI obtained from the Advanced Very High-Resolution Radiometer at 1 km spatial resolution [28]. The FAO published the Global Map of Irrigation Area, developed by Siebert et al. [1,29], based on approximate information about the total irrigated area from national statistics and satellite-derived irrigated areas with 0.5 arc-minute spatial resolution. The International Water Management Institute released a 10 km spatial resolution global irrigated cropland map using the Thenkabail et al. [30] algorithm. Ambika et al. [13] developed a moderate resolution (250 m) irrigated cropland map of agro-ecological zones in India using NDVI products from MODIS time-series images from 2000–2015.
However, monitoring field-scale groundwater-irrigated cropland for multiple cropping seasons requires high spatial and temporal resolution time-series images [19,26,27]. This study aimed to use freely available high spatial and temporal resolution optical satellite images to monitor irrigated cropland. Optical satellite payloads such as Landsat-8 (LS8), Sentinel-2 (S2), Earth Observation-1 Advanced Land Imager (EO1-ALI), and Spot-5 Take-5 (S5T5) with a spatial resolution of 30, 10, 30, and 5 m, respectively, are available free of charge for research purposes [31,32,33,34]. This study developed a method to classify field-scale irrigated cropland for the three cropping seasons (summer, kharif, and rabi) of 2014–2016 in a watershed of southern peninsular India. We used all available cloud-free optical satellite images for the analysis and performed intensive ground observation simultaneously. The field-scale linear relation between mean NDVI estimated from LS8 Operational Land Imager (OLI) and other optical satellite products was calculated before combining several NDVI products. These individual NDVI products were then used to calculate cumulative seasonal NDVI at the field scale. These seasonal normalized cumulative NDVI products identified intensification of irrigation with high values. Then, we applied a support vector machine (SVM) classification to these products and validated the results using ground observations.

2. Materials and Methods
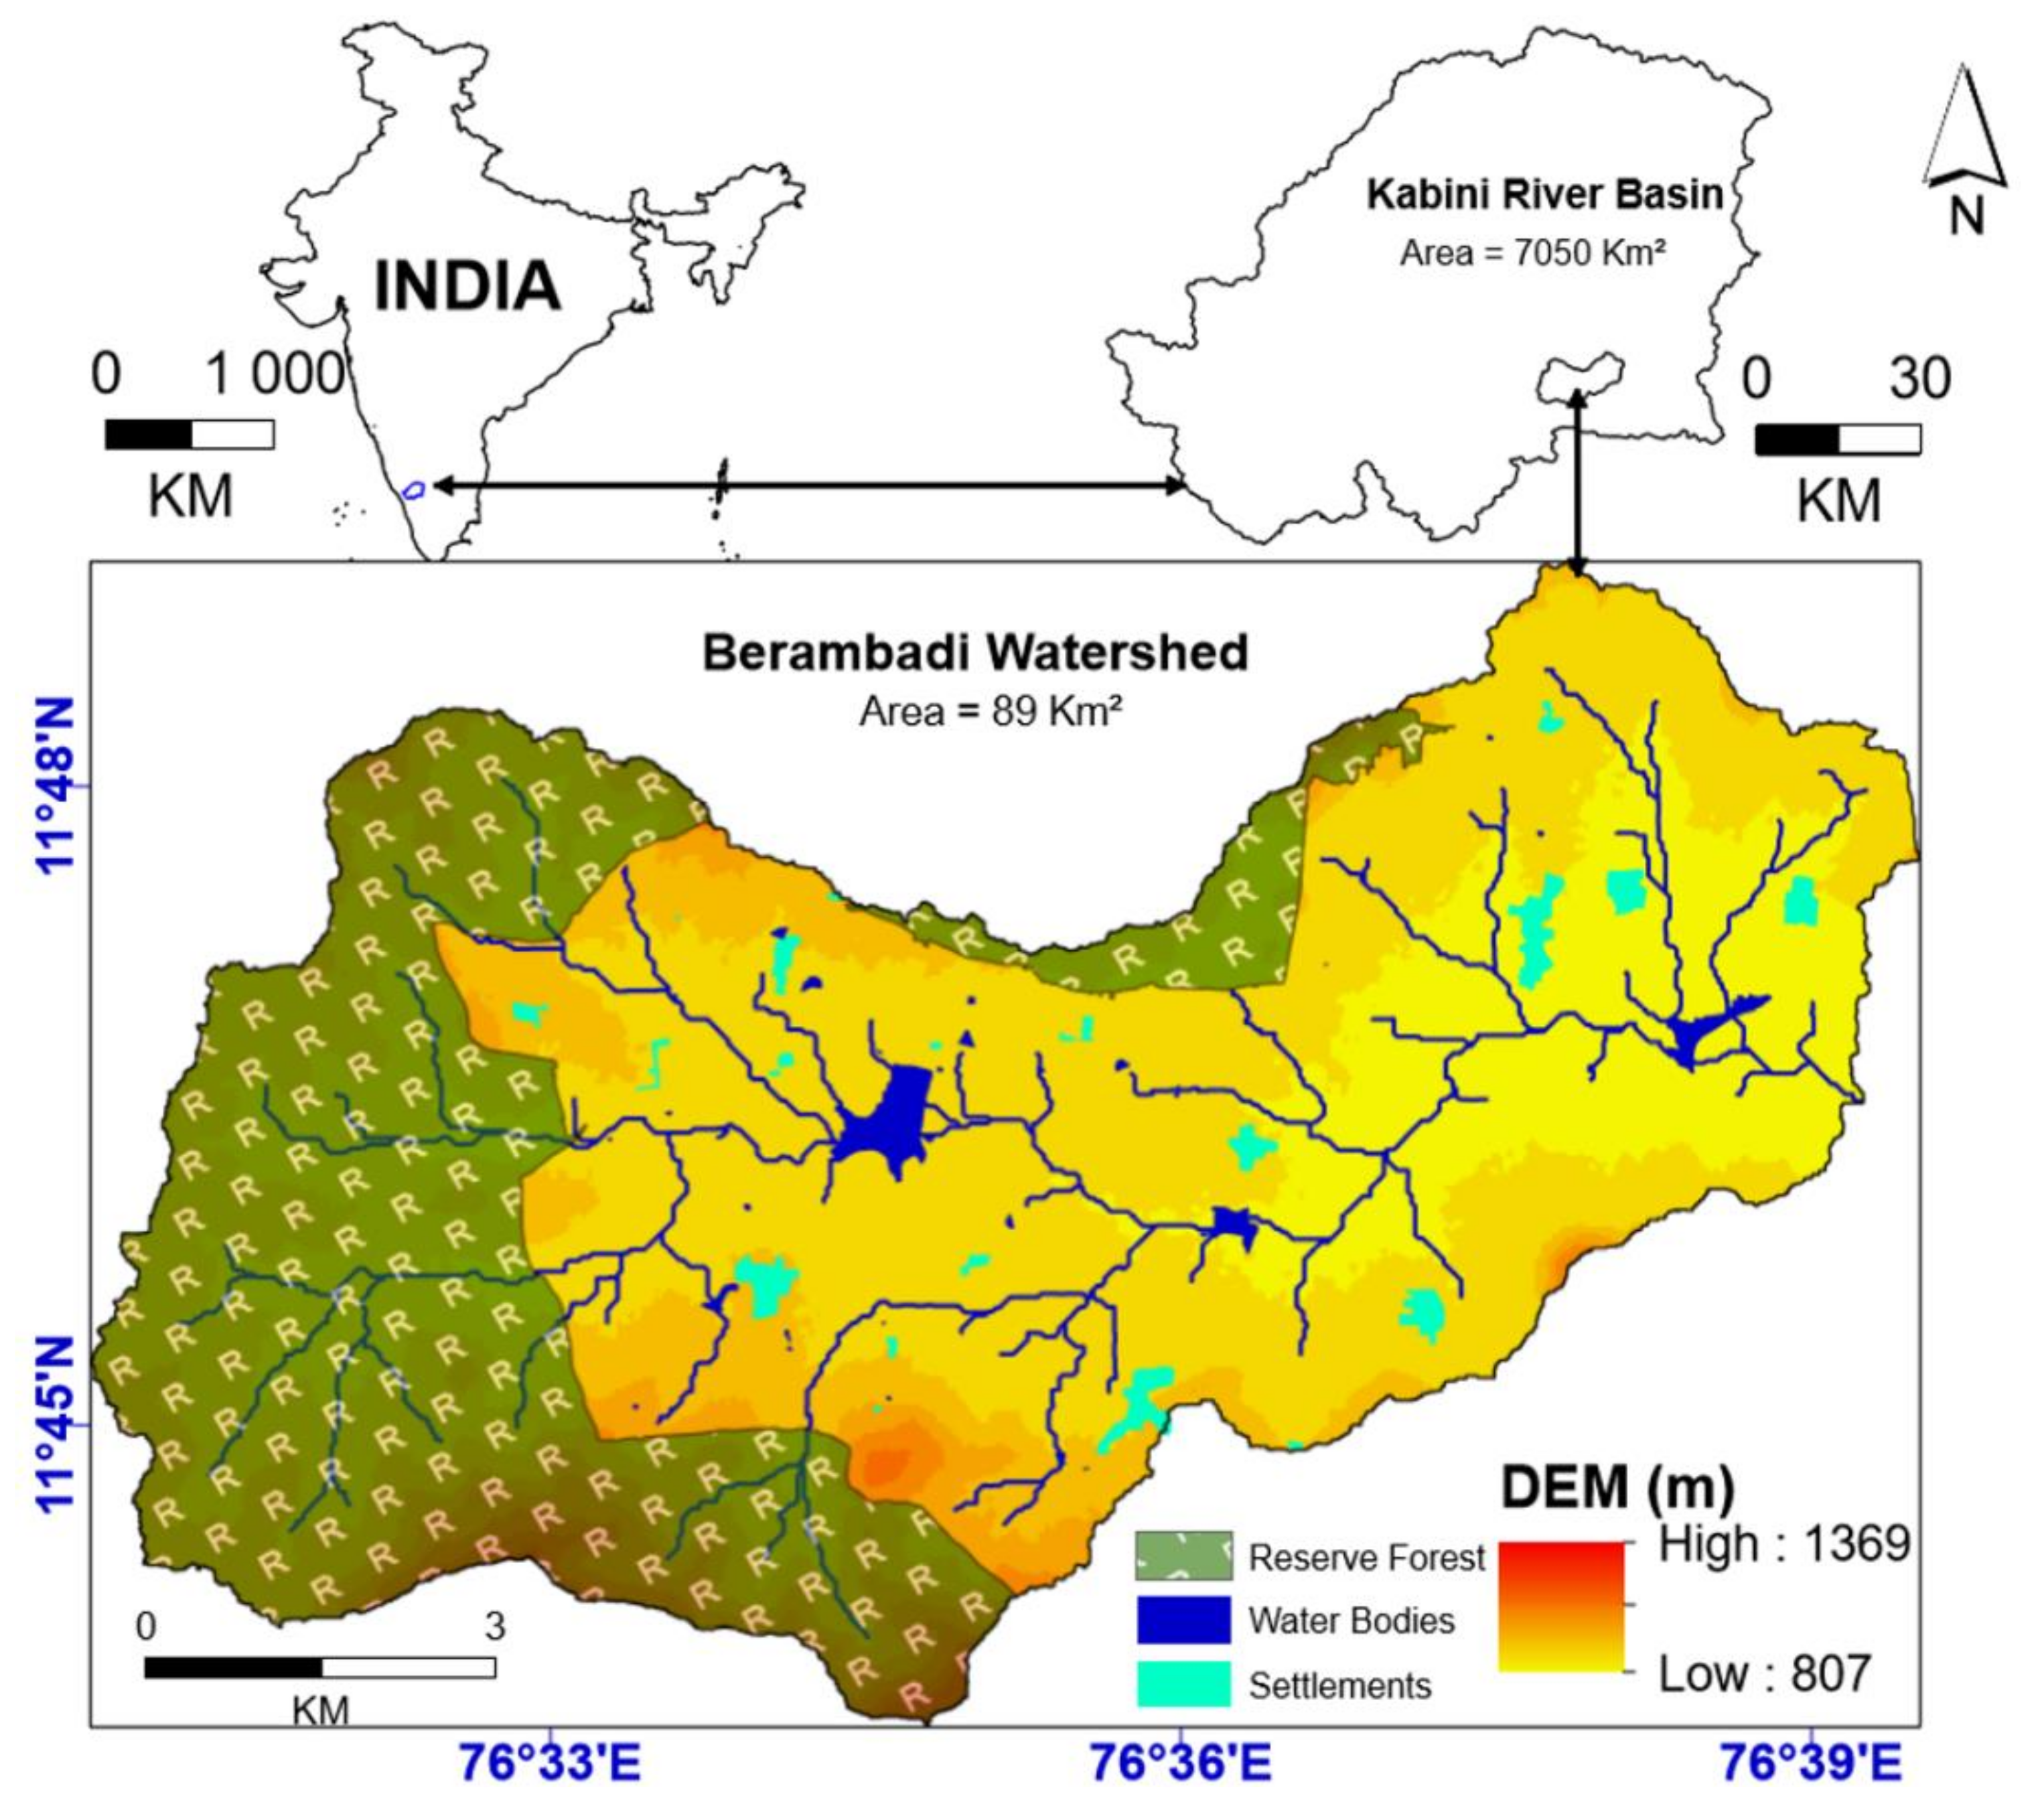
2.1. Study Area

The Berambadi watershed is a 89 km2 sub-catchment of the Kabini River basin (a tributary of the Cauvery River) [35,36] (Figure 1). This agriculturally dominant watershed is part of the Environmental Research Observatory M-TROPICS (https://mtropics.obs-mip.fr/ (accessed on 1 March 2021)) that is itself a part of OZCAR (Critical Zone Observatories: Research and Application), the French Network of Critical Zone Observatories (http://www.ozcar-ri.org/ozcar/ (accessed on 1 March 2021)) [37]. The Berambadi watershed is a calibration and validation site of several satellite missions, such as Radarsat-2, SMOS, RISAT-1, and S5T5 [36,38], in the framework of the ongoing project “Assimilation of Multi-satellite data at Berambadi watershed for Hydrology And land Surface experiment” (AMBHAS) [35,39]. The watershed is well equipped with real-time ground-based equipment such as a flux tower, weather station, probes for soil moisture, COSMOS (Cosmic-ray Soil Moisture Observing System), and rain gauges [18,36]. The climate is sub-humid with total mean annual rainfall and potential evapotranspiration of 800 and 1100 mm, respectively [10], with large inter-annual variability in the rainfall. Large values of annual actual evapotranspiration, sometimes exceeding annual rainfall, were measured in the watershed [36,40], which can be related to the intensive use of groundwater for irrigation. Rainfed (non-irrigated) cultivation is dominant in the watershed, with the assistance of the southwest (SW) and northeast (NE) monsoons [36].
Cropland (52%) and forest reserves (35%) cover 87% of the watershed, and the remaining 13% is covered by other land uses, such as water bodies, settlements, road networks, and wasteland [18]. Cropping seasons in the Berambadi watershed are categorized as kharif (monsoon, mid-May to mid-September), rabi (post-monsoon, mid-September to mid-January), and summer (pre-monsoon, mid-January to mid-May) according to the local farming practices [18,38,41,42]. Farmers in the watershed use mainly drip, sprinkler, and flood irrigation during the cropping seasons (Figure A1).
Since the kharif cropping season is the rainfed season in the watershed, most of its crops are non-irrigated, such as sunflower, maize, beans, marigold, sorghum, and finger millet. When rain does not fall during a crop growth period, farmers partially irrigate if they have an irrigation system and groundwater available. Cash crops are also grown in the kharif season, such as onion, cabbage, chili, beetroot, banana, turmeric, and sugarcane, depending upon groundwater availability [18,41]. Onion, beetroot, and cabbage are grown for three months, turmeric and chili are grown for eight months, and sugarcane and banana are annual crops. Perennial crops such as coconut are also grown in the watershed, alone and with other crops such as marigold, turmeric, and banana, with annual irrigation practices. The rabi cropping season also includes intensively irrigated crops, e.g., turmeric, chili, banana, sugarcane, garlic, beetroot, cabbage, tomato, and beans (Figure A2) and non-irrigated crops, e.g., maize, sorghum, sunflower, marigold, horse gram, chickpea, beans, finger millet, and groundnut (Figure A3). The NE monsoon helps farmers grow non-irrigated crops, and farmers with an irrigation system consider irrigated cropping. The summer cropping season includes only irrigated crops such as beetroot, banana, sugarcane, vegetables, and tomato.
Groundwater is the only source of irrigation in the Berambadi watershed, and it has high spatial heterogeneity [42]. Farmers grow long-duration crops such as sugarcane and banana in the rabi season due to the increase in groundwater after monsoon rainfall (kharif season) [18]. Because the groundwater level has fallen to about 30 m below the surface, dug wells and open wells have almost entirely disappeared from the watershed, which has no canals [36,38]. Farmers plan the irrigation method based on the groundwater level, personal financial status, and government aid. The National Bureau of Soil Survey and Land Use Planning published a map of soil types in the watershed at 1:50,000 scale [38]. The main soil textures in the watershed include clay, sandy clay, sandy clay loam, loamy sand, and sandy loam. Clay soil is the main type along with the drainage network in the downstream area of the watershed. Due to clay soil’s high water-holding capacity property, farmers prefer to transport water from downstream tanks to upstream fields.

2.2. Remote Sensing Data Collection and Image Pre-Processing

Clouds are the greatest obstacle to using the images from the same satellite for an entire study period. To address the unavailability of time-series images from the same satellite due to cloud cover, we obtained optical images from several platforms, including LS8, S5T5, EO1-ALI, and the Indian Remote Sensing (IRS) satellite IRS-P6 (Figure 2). LS8 OLI images, EO1-ALI images, High Resolution Geometrical sensor images from S5T5, and Linear Imaging Self Scanning Sensor (LISS-3 and LISS-4) images from IRS-P6 (Resourcesat-2) were obtained from the summer season of 2014 to that of 2016. All images obtained were pre-processed for atmospheric correction using the Second Simulation of a Satellite Signal in the Solar Spectrum [43,44,45] radiative transfer model, followed by a geometric correction. A total of 43 optical satellite cloud-free images from multiple platforms were obtained (Figure 2).
The 18,500 ha of agricultural cropland in the Berambadi watershed [18] contain about 19,600 fields, most of which are smaller than 1 ha [18,46]. All 43 satellite images were resampled at 5 m spatial resolution using the nearest neighbor resampling algorithm without changing the original pixel values [18,47,48,49].

2.3. Ground Observation Data

We collected ground observation data from farmers for all seven monitored cropping seasons (summer 2014, kharif 2014, rabi 2014–2015, summer 2015, kharif 2015, rabi 2015–2016, and summer 2016). Due to limited funds, the ground survey was performed in the middle of the kharif and rabi seasons in 2014 and 2015. During these surveys, farmers also provided data for the summer seasons of 2014 and 2015. Summer 2016 crop data were collected during the kharif season of 2016. The quality of the data collected was maintained while performing the surveys (e.g., data were collected only if the farmer was certain of his/her answers). The ground survey was performed to collect a maximum amount of data about crop and water management at the field scale. A variety of data were collected from the survey while processing the datasets and generating results. The main data collected during the field survey included:
(i)
seasonal crop type
(ii)
irrigation practices (e.g., number of irrigation events)
(iii)
crop sowing dates
(iv)
crop harvest dates
(v)
whether the crop was irrigated, rainfed, or partially irrigated
(vi)
source of irrigation water (own borewell or neighbor’s borewell)
The spatially distributed survey was performed throughout the entire watershed. The survey indicated that farmers performed unplanned partial irrigation during crop growth when rainfall was absent, depending on their irrigation system [38]. After finishing all ground observations, the data were divided into two categories to decrease heterogeneity in cropping practices in the watershed:
(i)
annually irrigated croplands (irrigated in all three cropping seasons)
(ii)
others (rainfed, partially irrigated, and left fallow for one cropping season)
The total number of fields surveyed for 2014–2015, 2015–2016, and summer 2016 were 628, 731, and 604, respectively (Table 1). The intensively irrigated crops included long-duration crops that grow in all three cropping seasons (e.g., banana, sugarcane, irrigated coconut), crops that grow in two seasons (e.g., turmeric, ginger (kharif and rabi), and single-season crops (e.g., beetroot, onion, garlic, cabbage, carrot, watermelon, vegetables).
Spatially-distributed intensively-irrigated croplands were surveyed in 2014, 2015, and 2016 in the Berambadi watershed (Figure 3), and all samples were divided evenly and randomly into training (calibration) and validation samples. These data were used to classify the irrigated croplands and validate the classification outputs, respectively.

2.4. Rainfall Monitoring in the Berambadi Watershed

Monthly rainfall varied among cropping seasons from summer 2014 to summer 2016 (Figure 4). In the kharif monsoon season, most farming practices depend on the SW monsoon rainfall. The sowing of rainfed (non-irrigated) crops in the kharif season depends on the season’s first rainfall. Farmers with an irrigation system do not wait for the first rain and begin sowing crops such as turmeric (with onion and beetroot) in the first week of May. The rabi season benefits from NE monsoon rainfall to grow crops. Fewer rainy days during the NE monsoon (e.g., in 2014) directly influenced total cultivation. Based on the groundwater level, farmers with an irrigation system consider the cropping season when selecting which crop to sow. Thunderstorms may occur during the summer season, but rainfall is not certain, and only farmers with an irrigation system can grow crops during this season.
In the experimental watershed, usually, the SW monsoon has less rainfall (monthly rainfall ~25 mm) at the beginning of cropping season and high rainfall (~150 mm) at the end of cropping season (Figure 4). The pattern of rainfall usually remains the same year to year; only the rainfall intensity varies. Due to the weaker beginning of the SW monsoon in 2014, most of the rainfed farms grew no crops. Comparatively, in 2015, the beginning of the SW monsoon was better, and rainfed crops grew normally. SW rainfall plays a major role in the rainfed farmers’ sustainability and groundwater recharge process [18]. Due to the weak SW monsoon in 2014, farmers were mostly dependent on groundwater irrigation for crop survival. During the kharif cropping season of 2014, the groundwater level depleted by more than 40 m in downstream watershed areas. The intensive groundwater irrigation and poor monsoon season played a significant role in groundwater depletion [36].

2.5. Method Developed

The comprehensive method to classify seasonal intensively irrigated croplands using multiple satellite images had multiple steps (Figure 5). The pre-processed and resampled 5 m resolution images were used to calculate the NDVI time-series. Seasonal cumulative NDVI at the field scale was used to classify the irrigated croplands during each cropping season. Results of the method developed were validated using ground observations.

2.5.1. NDVI Value Estimation and Correction

Mean NDVI was estimated for each field for all satellite dates using manually digitized field boundaries [18]. NDVI was calculated from the near-infrared (NIR) and red spectral bands:
NDVI = NIR Red NIR + Red
The uncertainty among multiple satellite sensors needed to be considered to avoid sensor errors [50,51]. These sensor uncertainties result from:
(i)
differences in spectral responses of different sensors;
(ii)
surface and atmospheric differences among pass dates of the satellite sensors;
(iii)
bi-directional reflectance effects.
While more images used in the study came from LS8 than from the other satellite platforms, all NDVI products were normalized with respect to that from LS8 [51]. A field-scale linear regression was calculated between Landsat-8 (OLI)-based NDVI and NDVI calculated from other satellite images (using only cloud-free images) for the same or nearest date. This NDVI correction was performed to reduce the uncertainty among the NDVI products [51,52]. The coefficients of determination (R2) of these regressions were high (Figure 6). A high R2 (0.85) was obtained for images acquired on the same day from S5T5 and EO1-ALI satellites. Since the IRS LISS-3 and IRS LISS-4 images were acquired with a two-day difference, their R2 was lower (0.67).
The linear regression equations were applied to the NDVI datasets derived from the other satellite images (EO1 (ALI); Spot5Take5; IRS-P6 (LISS3); IRS-P6 (LISS4)). Equations (1)–(4) represent the equations obtained from linear regression between NDVI values obtained from Landsat-8 (OLI) and other satellite datasets. These equations were further implemented over other satellite datasets to calculate refined NDVI images.
Landsat-8 (OLI) = −0.15570 + 1.39822 × [EO1 (ALI)]
Landsat-8 (OLI) = 0.02173 + 0.93487 × [Spot5Take5 (HRG2)]
Landsat-8 (OLI) = 0.29517 + 0.95276 × [IRS-P6 (LISS3)]
Landsat-8 (OLI) = 0.12545 + 0.92574 × [IRS-P6 (LISS4)]

2.5.2. SVM Image Classification

The support vector machine (SVM) algorithm, developed in the late 1970s and formerly known as a binary classifier with an adapted algorithm to reduce the multiclass problems [53], is broadly used for remotely sensed image processing due to its flexibility and high classification accuracy outputs [53,54,55]. SVM, which is categorized as a supervised non-parametric discriminative statistical learning classifier [56], discriminates training samples with multi-dimensional hyperplanes in the feature space [57,58]. We implemented the SVM algorithm using the scikit-learn library [59] to classify irrigated croplands for all cropping seasons. Seasonal cumulative NDVI from the satellite sensors at the field scale was classified to discriminate between irrigated and non-irrigated cropland in the Berambadi watershed using ground-observed training and validation samples.
Classified outputs were validated by calculating several accuracy parameters derived from the error matrix [60,61]: the overall accuracy, which is the ratio of correctly classified pixels and total pixels; the producer’s accuracy, which indicates the probability of a reference pixel being correctly classified (i.e., measure of omission errors); the user’s accuracy, which indicates the probability that a point on the ground of a given category is represented by its pixel on the map (i.e., commission errors); and the kappa coefficient, which is a measure of the proportional (or percentage) improvement by the classifier over a purely random assignment to classes. Kappa coefficient values range from +1 (perfect agreement) to 0 (no agreement above that expected by chance) to −1 (complete disagreement). First, the cumulative seasonal NDVI, two-season NDVI, and annual NDVI were estimated. Then, the field boundaries of the Berambadi watershed [18] were used to estimate the mean cumulative NDVI at field scale, which was used to perform the SVM classification.
The main objective was to identify intensively irrigated croplands in the three cropping seasons. Seasonal cumulative NDVI were calculated at the field scale to classify intensively irrigated seasonal croplands. The major focus for the kharif season was to identify croplands that grew long-duration irrigated crops, such as turmeric, banana, sugarcane, chili, as well as two irrigated crops in a season (e.g., onion followed by beetroot).

3. Results and Discussion

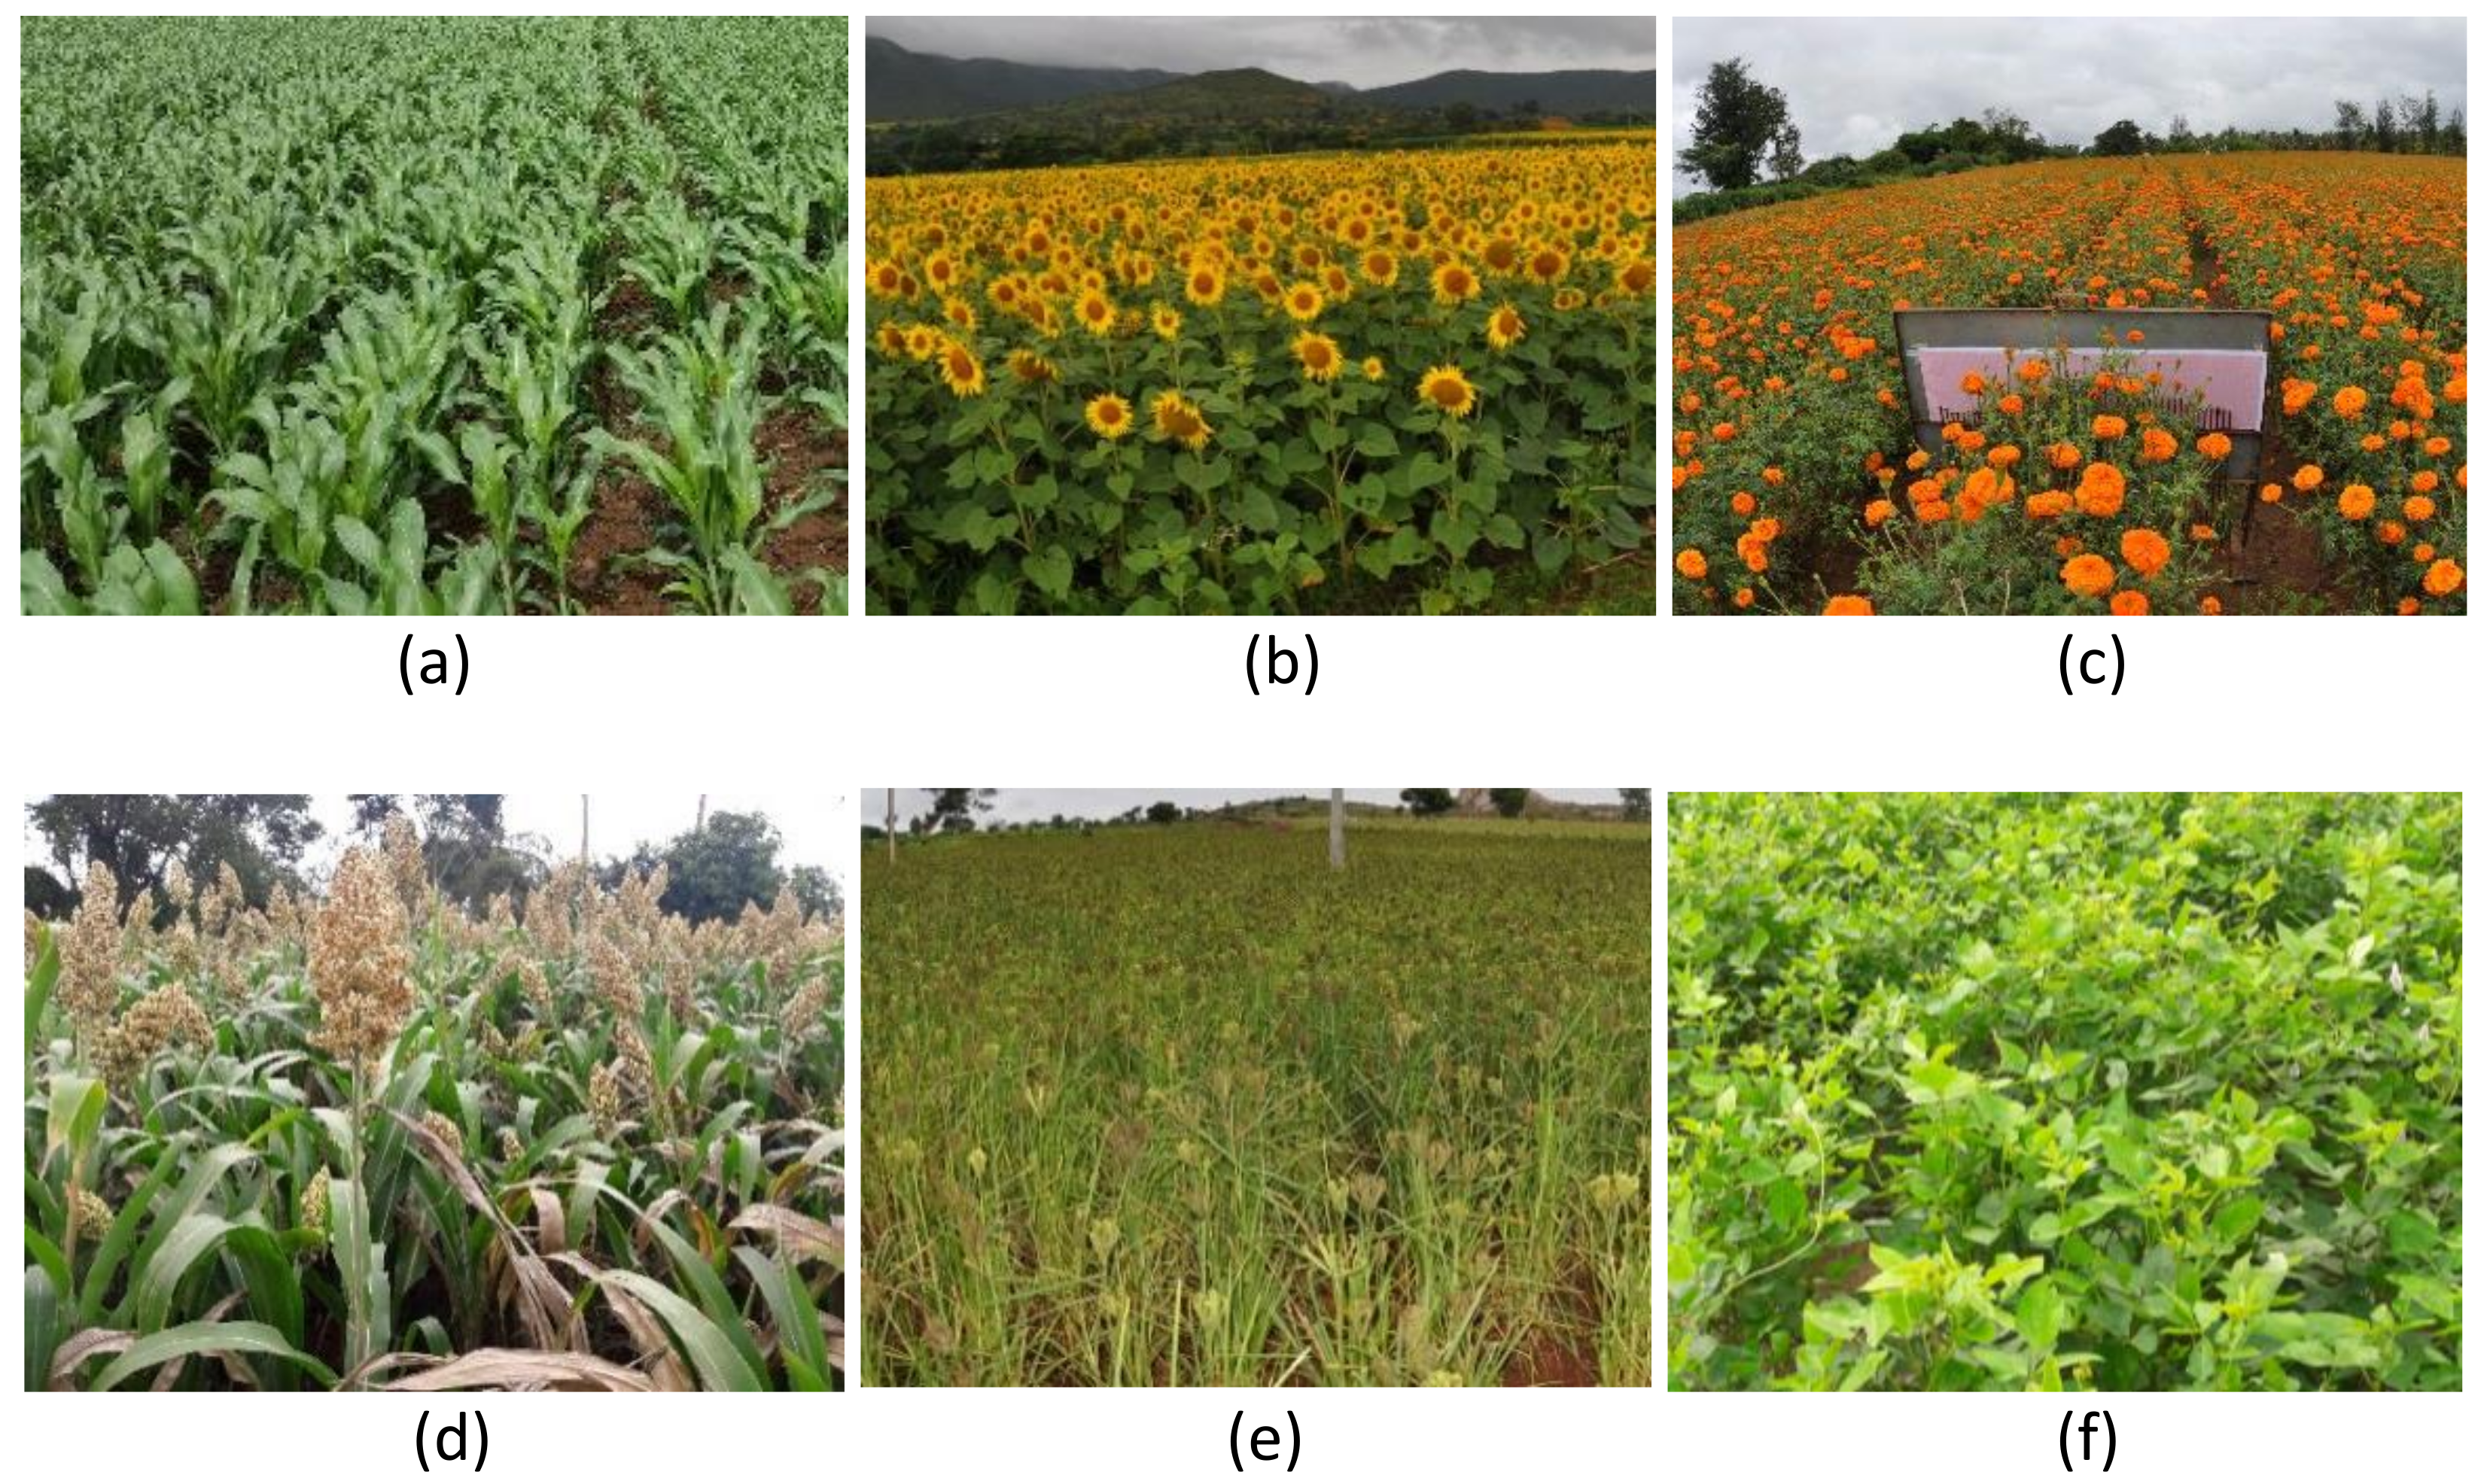
3.1. Temporal Growth Curves of the Major Crops Cultivated in the Watershed

The corrected NDVI, presented in Figure 7 as a temporal crop growth curve, can be used to precisely identify the sowing and harvesting times of irrigated and non-irrigated crops. Sugarcane and banana, which are annual crops, were harvested, respectively, in the rabi season (January) and at the end of the summer season (April). When the onion was cultivated with turmeric, it became mature in about two months and showed a peak in May followed by harvesting. Short duration (~90 days) irrigated crops (beetroot, beans, cabbage) matured in May or June and were harvested at the end of the kharif season (August or September). Non-irrigated crops (marigold, maize, sunflower) were planted in April, matured in June, and were harvested in September. Marigold flower harvesting started immediately after maturation, showing a high decrease in NDVI.
Seasonal cumulative NDVI ranges vary according to crop type. The classification of irrigated and non-irrigated cropland must be performed based on ground observations. Given the variability in crop type and duration, it is unlikely that generic ranges of NDVI might allow for the classification of irrigated and non-irrigated croplands in other contexts without ground observations. In the future work, we would like to identify an NDVI range representing irrigated and non-irrigated cropland.

3.2. Irrigated Cropland Classification for 2014–2015

The intensive irrigated cropland percentage during the summer, kharif, and rabi cropping seasons of year 2014–2015 is presented in this section. Table 2 shows that irrigated cropland percentages during the summer, kharif, and rabi cropping seasons of year 2014–2015 were respectively 6.3%, 9.2%, and 15.7%. The cropland with two-season irrigation comprised about 5–7% of the total cultivated area in the watershed. Approximately 4.6% of cropland was cultivated throughout the year and included banana, sugarcane, coconuts, mango, and silver oak with pepper. The annual cropland area (~4.57%) occurs in the single and dual-season irrigated cropland estimations as this area is under irrigation in all cropping seasons of the year.
The groundwater was shallower in the upstream area of the watershed than in the downstream area [18]. Thus, farmers were more likely to irrigate intensively in the upstream area (Figure 8). Crops could be grown during the summer season only with groundwater irrigation, while the kharif season had mostly rainfed crops. Irrigation dominated in the rabi season after the groundwater was recharged in the monsoon season [18].
Two-season irrigation in the watershed requires sufficient groundwater availability. Two-season and annually irrigated croplands were located in the watershed’s upstream area (Figure 9) due to its shallower groundwater. During the kharif and rabi seasons, two-season irrigation fields (e.g., turmeric, sugarcane, banana) were clustered in the downstream area and the middle of the watershed.

3.3. Irrigated Cropland Classification for 2015–2016

Irrigated croplands in the 2015–2016 cropping seasons (Table 3) were relatively more common than in 2014–2015 (Table 3). For the 2015–2016 summer, kharif, and rabi seasons, 15.9%, 16.5%, and 14.0% of croplands were intensively irrigated. Overall, 10.6% of cropland was irrigated in both the 2015 summer and kharif seasons. Similarly, 9.4% of cropland was irrigated in both the kharif and rabi seasons. Annually irrigated croplands occupied about 7.3% of cropland in the watershed.
Irrigation of croplands intensified in the upstream areas in all 2015–2016 cropping seasons. The intensity of irrigated croplands followed the main drainage network of the watershed (Figure 10). More than 500 mm of rainfall during the 2014–2015 kharif and summer cropping seasons recharged the groundwater, which motivated farmers to irrigate in the 2015 summer cropping season. Upstream (near forest reserves) and downstream farmers performed intensive irrigation in the 2015 summer season (Figure 10). The upstream farmers between the national reserve forest and the watershed’s main water body performed intensive irrigation practices in all three cropping seasons.
Fields with two-season and annual irrigation were located mainly in the watershed’s upstream area near drainage (Figure 11). The high irrigation intensity in the upstream area was due to the area’s shallower groundwater and groundwater recharge by the nearby reserve forest. Large fields with long-duration irrigation were located in the upstream area due to its shallower groundwater [18].

3.4. Irrigated Cropland Classification for Summer 2016

During the 2016 summer cropping season, 12.8% of cropland in the watershed used groundwater for irrigation purposes (Table 4). The SVM classification algorithm precisely identified the irrigated cropland cluster distributed in the watershed.
In the 2016 summer season, the irrigated cropland was distributed along drainage in the watershed (Figure 12). The downstream and middle areas of the watershed were cultivated in the summer season of 2016 after sufficient groundwater recharge in the kharif and rabi seasons in 2015–2016. The kharif (SW monsoon) and rabi (NE monsoon) seasonal rainfall in 2015–2016 were, respectively, 375 mm and 354 mm. Total rainfall was 63 mm for the 2016 summer season. Due to the adequate rain during the SW and NE monsoons, the groundwater was recharged and spatially distributed intensively irrigated fields were observed (Figure 12).

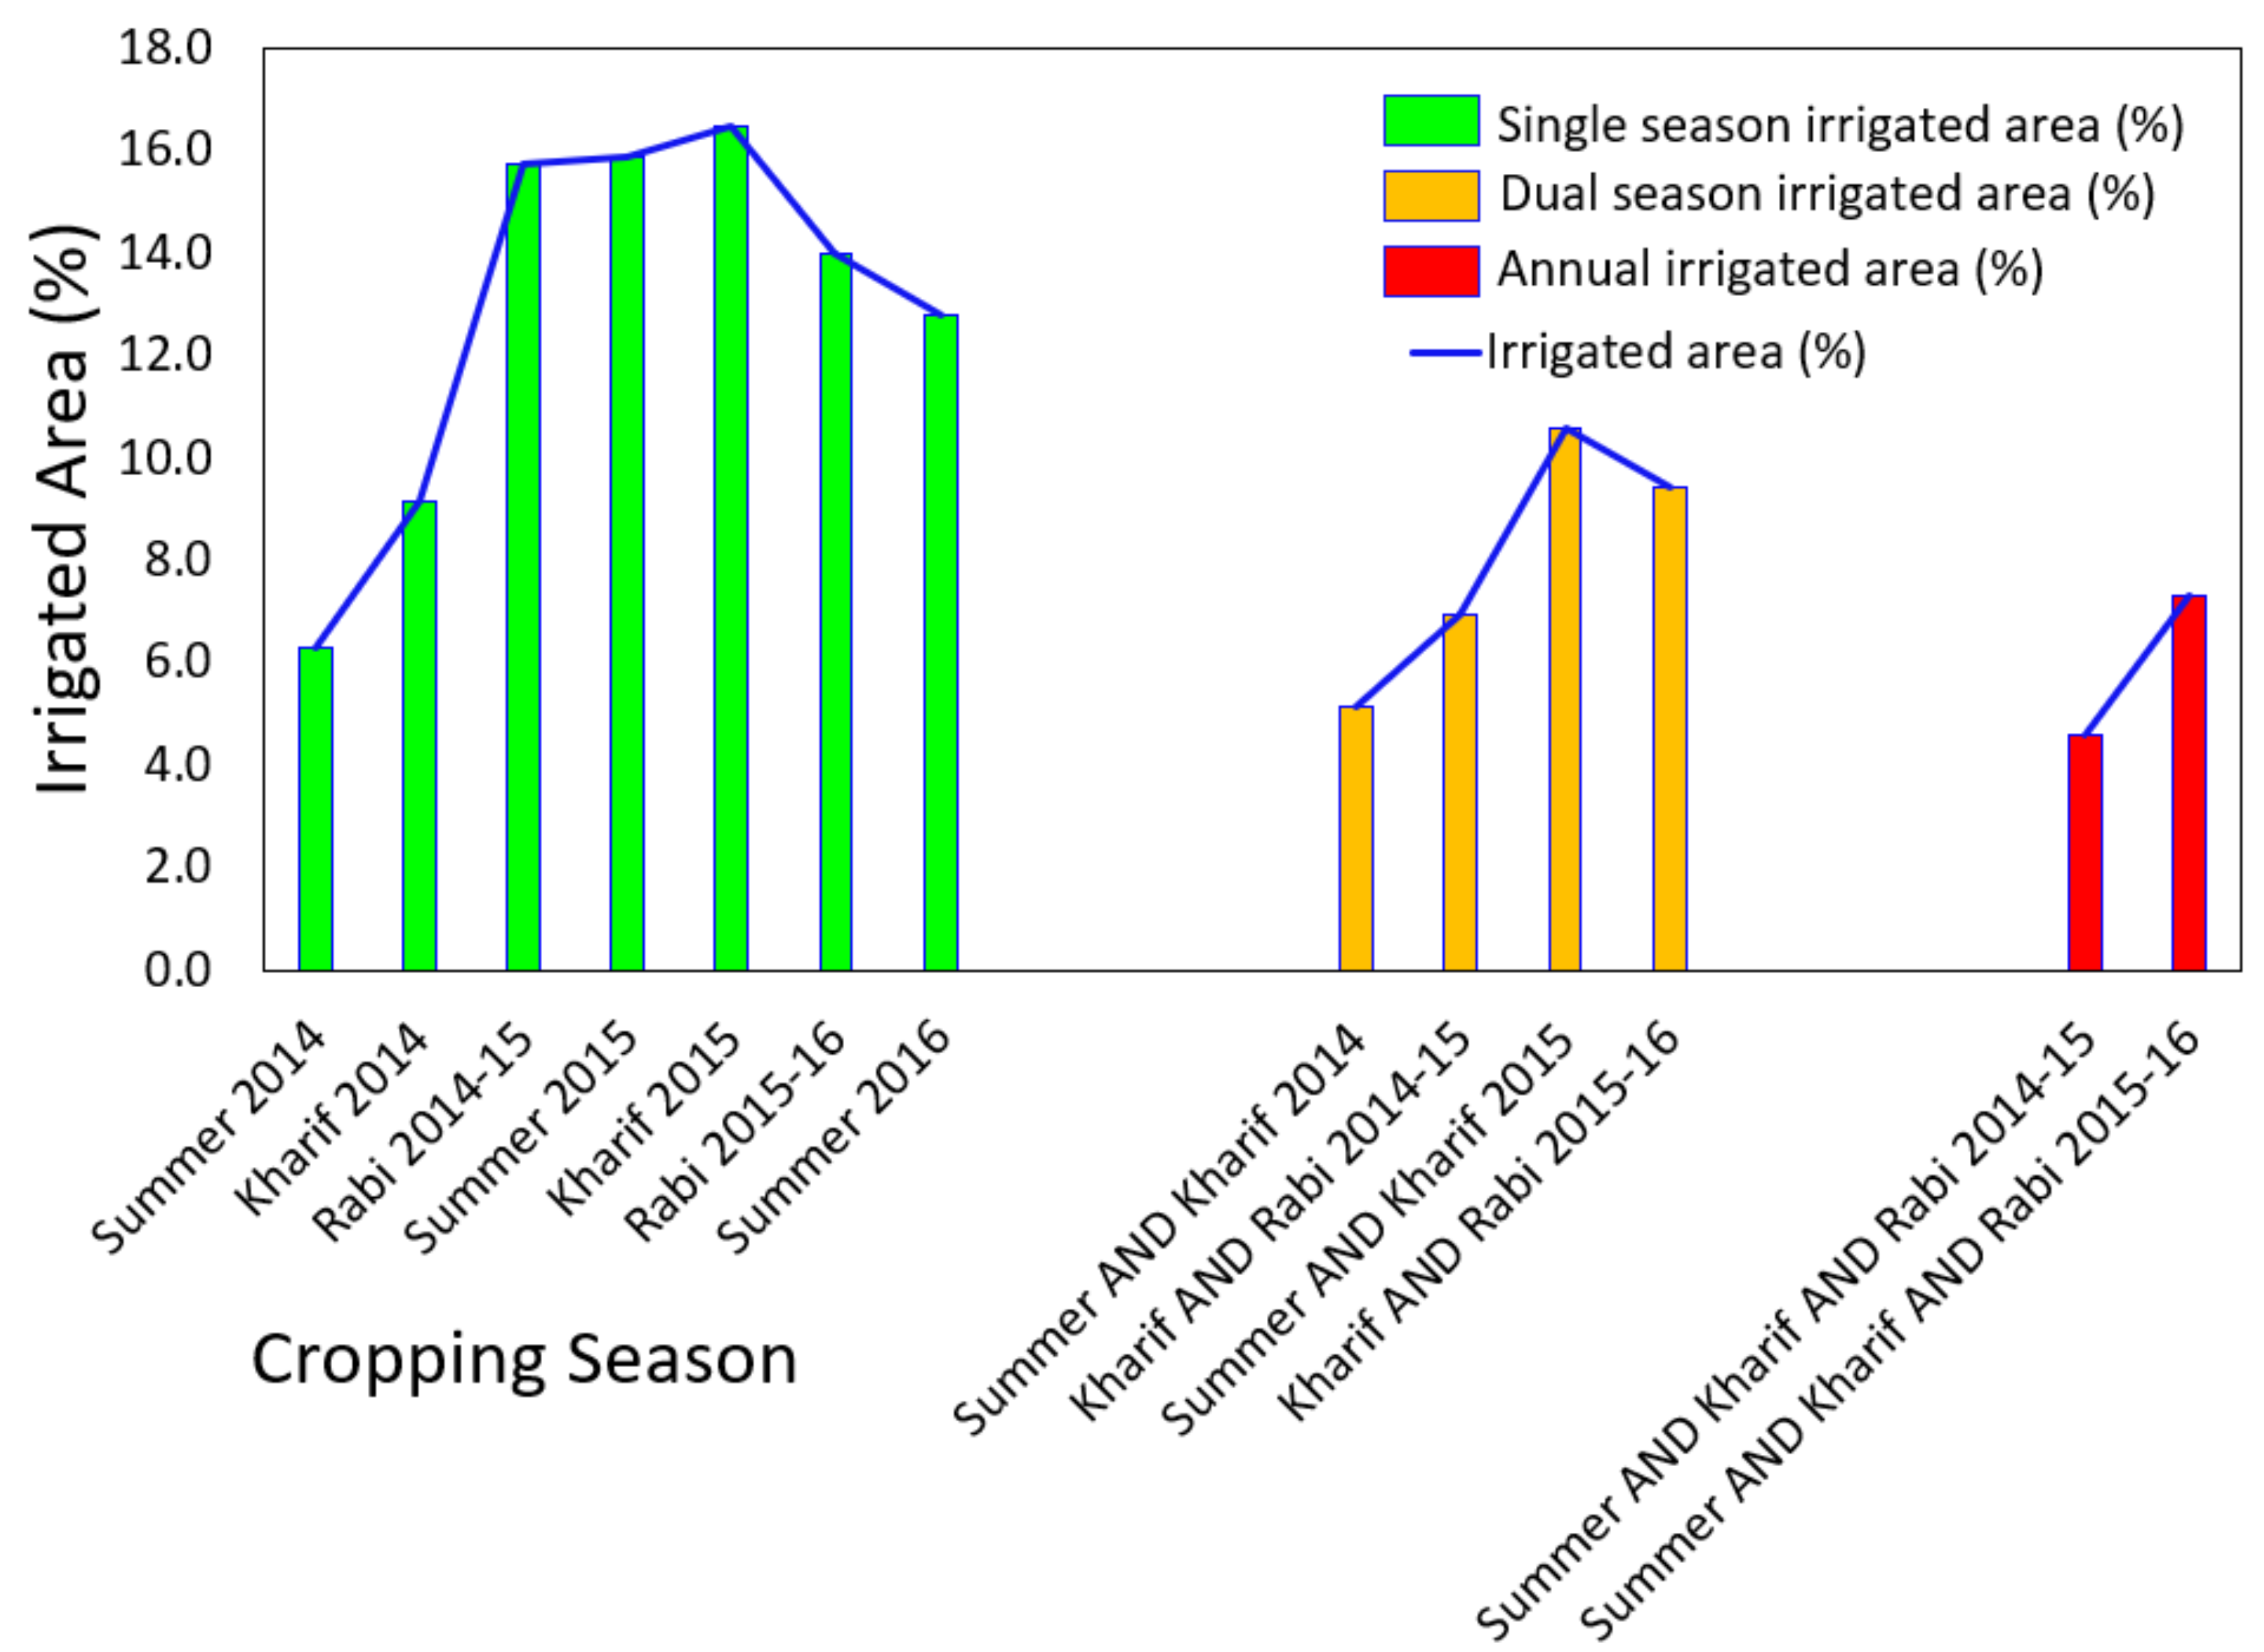
3.5. Synthesizing of Irrigated Cropland Areas Estimation

Irrigated cropland area percentage with respect to the total cropland area during multiple cropping seasons, dual cropping seasons, and annually (all three cropping seasons) is presented in Figure 13. Annually irrigated croplands are the main groundwater-consuming farmlands as they perform irrigation activities during all three cropping seasons. The total annually irrigated cropland area in 2014–2015 was 4.6%, and in 2015–2016 it was 7.3%. The annually irrigated cropland is under irrigation during all three cropping seasons so that these annually irrigated croplands were included in the single and dual irrigated cropland estimation. The crop cultivation in these annually irrigated croplands can be subdivided into three sections:
  • tree plantations (coconuts, mangoes, silver oak) and annual crops such as sugarcane and banana;
  • eight-month duration crops (dual season crops such as turmeric) followed by a single-season crop such as onion, garlic, beetroot, cabbage, or other vegetables;
  • three individual single-season crops such as onion, garlic, beetroot, cabbage, or other vegetables.
The dual season croplands comprise either an eight-month duration of one crop such as turmeric and ginger or two seasons of individual irrigated crops such as onion, garlic, beetroot, cabbage, carrot, tomato, or other vegetables. Dual-irrigated cropland during various successive season combinations varies from 5.1% to 10.6%, as presented in Figure 13.
A single-season irrigated cropland comprises about four months of individual crop cultivation during a particular cropping season. The majority of farmers prioritize single-season irrigated crop cultivation. Figure 13 represents high variation in various single season intensive irrigated cropland percentages. The single-season irrigated area percentage varies from 6.3% to 16.5%.
Irrigation practices in the Berambadi watershed occurred downstream and gradually moved upstream over time [18,42]. This was confirmed by the results of this study (Figure 8, Figure 9, Figure 10, Figure 11 and Figure 12), which show clusters of irrigated croplands in the upstream area of the watershed where there is a high number of working borewells [62]. The observed groundwater table shows a shallow groundwater table in the upstream of the watershed [18,42,43]. However, Robert et al. 2017 [62] showed that the proportion of irrigated farms is still higher downstream with small farms (area < 0.3 ha) due to the high rate of borehole failure in this part of the catchment. Those results are consistent with this study, highlighting an increased number of small, irrigated parcels cultivated in the downstream area only during the single cropping season (Figure 8, Figure 10 and Figure 12).

3.6. Validation of Irrigated Cropland Classification

Table 5 represents the comparative study between the presented research outcomes and [18]. The multiple approach classification showed high classification accuracy with a kappa index >0.76 for the two seasons (Table 5) even though the uncertainty increased in the samples due to the use of annually irrigated cropland. A comparative study was performed for the rabi 2015 and summer 2016 seasons by Sharma et al. [18].
The number of spatially distributed annually irrigated samples was kept large in order to validate the developed method’s ability to classify seasonal irrigated cropland. The total irrigated area for the 2015 rabi season was estimated at 14% and 12.7% for the 2016 summer season.
During the rabi season, all kharif crops such as turmeric, banana, sugarcane, and chili are extended with tomato, banana, and sugarcane cultivation later in the cropping season. Some farmers grow short-duration crops (two to three months) such as beetroot, garlic, or cabbage immediately after harvesting turmeric in the rabi season. During the summer season, bananas and sugarcane from the previous season are still growing, and farmers with an irrigation system grow short-duration crops such as cabbage, beetroot, and watermelon. During the summer season, cultivation depends entirely on the farm’s irrigation system. Only farmers with an irrigation system grow in the summer season. This explains why the classification of cultivated land irrigated during the summer cropping season had high accuracy scores (>86%). Classification uncertainty was reduced since all crops were grown with an irrigation system.
All classified outputs showed a high concentration of intensively irrigated croplands in the upstream area of the Berambadi watershed.

4. Conclusions

Our study demonstrated an approach to monitor groundwater-irrigated croplands with high classification accuracy for three cropping seasons in southern India. In tropical countries such as India, cloud cover is the greatest obstacle to optical remote sensing. Acquiring images from the same satellite is rarely possible during the rabi and kharif seasons. We demonstrated the ability to use multiple satellite images (LS8, SPOT-5, EO1-ALI, and IRS-P6) to monitor irrigated cropland even when a given satellite product was unavailable. The overall classification accuracy for the cropping seasons using SVM classification exceeded 82%. However, crop type classification remains a challenge due to the small fields (<0.5 ha) and the high diversity of crop types and water-management practices in the watershed. The study indicates that cropland was irrigated less during cropping seasons in 2014–2015 than in those of 2015–2016 due to a drought in 2014. The method can identify intensively irrigated cropping areas despite a dearth of time-series images from a given satellite.

Author Contributions

Conceptualization, A.K.S., L.H.-M., and M.S.; methodology, A.K.S., L.H.-M., and S.C.; software, A.K.S.; validation, A.K.S. and L.H.-M.; formal analysis, A.K.S.; investigation, A.K.S.; resources, A.K.S. and S.B. (Sriramulu Buvaneshwari); data curation, A.K.S., S.B. (Sriramulu Buvaneshwari), and H.M.; writing—original draft preparation, A.K.S.; writing—review and editing, A.K.S., L.H.-M., S.B. (Sriramulu Buvaneshwari), M.S., S.C., L.R., S.B. (Soumya Bandyopadhyay), and H.M.; visualization, A.K.S. and L.H.-M.; supervision, A.K.S., L.H.-M., M.S., S.C., S.B. (Sriramulu Buvaneshwari), L.R., S.B. (Soumya Bandyopadhyay), and H.M.; project administration, S.C. and M.S.; funding acquisition, S.C, M.S., and L.R. All authors have read and agreed to the published version of the manuscript.

Funding

This study was funded by Indo-French collaboration research projects such as IFCPAR/CEFIPRA AICHA project 4700-W1 (2013–2016), ATCHA ANR-16-CE03-0006 (2017–2020), a UBL Ph.D. student grant for mobility (2017), and CNES/TOSCA (Irriga-Detection project (2017–2019)).

Institutional Review Board Statement

Not applicable.

Informed Consent Statement

Not applicable.

Data Availability Statement

Not applicable.

Acknowledgments

We thank Littoral—Environnement—Télédétection—Géomatique (LETG)-Rennes laboratory, University of Rennes-2, and Indian Institute of Science (IISc)-Bengaluru for facilitating the study. The authors also would like to thank the “Assimilation of Multi satellite data at Berambadi watershed for Hydrology And land Surface experiment” (AMBHAS) team and the Berambadi watershed farmers for their kind cooperation. The authors also thank the United States Geological Survey (USGS), Indian Space Research Organization (ISRO), and Le site du Centre national d’études spatiales (CNES) for providing satellite images.

Conflicts of Interest

The authors declare no conflict of interest.

Appendix A

Figure A1. Irrigation practices in the Berambadi watershed: (a) drip irrigation, (b) sprinkler irrigation, (c) flood irrigation.
Remotesensing 13 01960 g0a1
Figure A2. Examples of non-irrigated crops grown in the Berambadi watershed: (a) maize, (b) sunflower, (c) marigold, (d) sorghum, (e) finger millet, and (f) horse gram.
Remotesensing 13 01960 g0a2
Figure A3. Examples of irrigated crops grown in the Berambadi watershed: (a) sugarcane, (b) turmeric, (c) beetroot, (d) cabbage, (e) beans, and (f) banana.
Remotesensing 13 01960 g0a3

References

  1. Siebert, S.; Burke, J.; Faures, J.M.; Frenken, K.; Hoogeveen, J.; Döll, P.; Portmann, F.T. Groundwater use for irrigation—A global inventory. Hydrol. Earth Syst. Sci. 2010, 14, 1863–1880. [Google Scholar] [CrossRef] [Green Version]
  2. Thenkabail, P.; States, U.; Survey, G.; Turral, H.; Biradar, C.M. Remote Sensing of Global Croplands for Food Security; CRC Press: Boca Raton, FL, USA, 2009; p. 6579. [Google Scholar]
  3. Thenkabail, P.S.; Biradar, C.M.; Noojipady, P.; Dheeravath, V.; Li, Y.J.; Velpuri, M.; Reddy, G.P.O.; Cai, X.; Gumma, M.K.; Turral, H.; et al. A Global Irrigated Area Map (GIAM) using remote sensing at the end of the last millennium. In A Global Irrigated Area Map (GIAM) Using Remote Sensing at the End of the Last Millennium; International Water Management Institute (IWMI): Colombo, Sri Lanka, 2008. [Google Scholar]
  4. Shah, T.; Hassan, M.U.; Khattak, M.Z.; Banerjee, P.S.; Singh, O.; Rehman, S.U. Is Irrigation Water Free? A Reality Check in the Indo-Gangetic Basin. World Dev. 2009, 37, 422–434. [Google Scholar] [CrossRef]
  5. Taylor, R. When wells run dry. Nature 2014, 516, 179–180. [Google Scholar] [CrossRef]
  6. Petra, D. Vulnerability to the impact of climate change on renewable groundwater resources: A global-scale assessment. Environ. Res. Lett. 2009, 4, 035006. [Google Scholar]
  7. Siebert, S.; Portmann, F.T.; Döll, P. Global Patterns of Cropland Use Intensity. Remote Sens. 2010, 2, 1625–1643. [Google Scholar] [CrossRef] [Green Version]
  8. Shah, T. Crop per Drop of Diesel? Energy Squeeze on India’s Smallholder Irrigation. Econ. Polit. Wkly. 2007, 42, 4002–4009. [Google Scholar]
  9. Narayanamoorthy, A. Development and composition of irrigation in India: Temporal trends and regional patterns. Irrig. Drain. 2010, 60, 431–445. [Google Scholar] [CrossRef]
  10. Sriramulu, B.; Riotte, J.; Sekhar, M.; Kumar, M.S.M.; Kumar, A.; Louis, J.; Audry, S.; Giriraja, P.R.; Praveenkumarreddy, Y.; Moger, H.; et al. Groundwater resource vulnerability and spatial variability of nitrate contamination: Insights from high density tubewell monitoring in a hard rock aquifer. Sci. Total Environ. 2017, 579, 838–847. [Google Scholar]
  11. Buvaneshwari, S.; Riotte, J.; Sekhar, M.; Sharma, A.K.; Helliwell, R.; Kumar, M.S.M.; Braun, J.J.; Ruiz, L. Potash fertilizer promotes incipient salinization in groundwater irrigated semi-arid agriculture. Sci. Rep. 2020, 10, 3691. [Google Scholar] [CrossRef]
  12. Sriramulu, B.; Riotte, J.; Ruiz, L.; Sekhar, M.; Mohan Kumar, M.S.; Kumar Sharma, A.; Louis Duprey, J.; Audry, S.; Praveen, Y.; Hemanth, M.; et al. High spatial variability of nitrate in the hard rock aquifer of an irrigated catchment: Implications for water resource assessment and vulnerability. Gen. Assem. Conf. Abstr. 2016, 18, EGU2016–EGU5430. [Google Scholar]
  13. Ambika, A.K.; Wardlow, B.; Mishra, V. Data Descriptor: Remotely sensed high resolution irrigated area mapping in India for 2000 to 2015. Sci. Data 2016, 3, 160118. [Google Scholar] [CrossRef] [Green Version]
  14. Mondal, P.; Jain, M.; Robertson, A.W.; Galford, G.L.; Small, C.; DeFries, R.S. Winter crop sensitivity to inter-annual climate variability in central India. Clim. Chang. 2014, 126, 61–76. [Google Scholar] [CrossRef] [Green Version]
  15. Rodell, M.; Velicogna, I.; Famiglietti, J.S. Satellite-based estimates of groundwater depletion in India. Nat. Cell Biol. 2009, 460, 999–1002. [Google Scholar] [CrossRef] [Green Version]
  16. Jain, M.; Srivastava, A.K.; Joon, R.K.; McDonald, A.; Royal, K.; Lisaius, M.C.; Lobell, D.B. Mapping smallholder wheat yields and sowing dates using micro-satellite data. Remote Sens. 2016, 8, 860. [Google Scholar] [CrossRef] [Green Version]
  17. Meiyappan, P.; Roy, P.S.; Sharma, Y.; Ramachandran, R.M.; Joshi, P.K.; DeFries, R.S.; Jain, A.K. Dynamics and determinants of land change in India: Integrating satellite data with village socioeconomics. Reg. Environ. Chang. 2016, 17, 753–766. [Google Scholar] [CrossRef] [PubMed]
  18. Sharma, A.K.; Hubert-Moy, L.; Buvaneshwari, S.; Sekhar, M.; Ruiz, L.; Bandyopadhyay, S.; Corgne, S. Irrigation History Estimation Using Multitemporal Landsat Satellite Images: Application to an Intensive Groundwater Irrigated Agricultural Watershed in India. Remote Sens. 2018, 10, 893. [Google Scholar] [CrossRef] [Green Version]
  19. Thenkabail, P.S.; Dheeravath, V.; Biradar, C.M.; Gangalakunta, O.R.P.; Noojipady, P.; Gurappa, C.; Velpuri, M.; Gumma, M.; Li, Y. Irrigated Area Maps and Statistics of India Using Remote Sensing and National Statistics. Remote Sens. 2009, 1, 50–67. [Google Scholar] [CrossRef] [Green Version]
  20. Shiklomanov, I.A. Appraisal and Assessment of World Water Resources. Water Int. 2000, 25, 11–32. [Google Scholar] [CrossRef]
  21. Thenkabail, P.S.; Biradar, C.M.; Noojipady, P.; Dheeravath, V.; Li, Y.J.; Velpuri, M.; Gumma, M.; Gangalakunta, O.R.P.; Turral, H.; Cai, X.; et al. Global irrigated area map (GIAM), derived from remote sensing, for the end of the last millennium. Int. J. Remote Sens. 2009, 30, 3679–3733. [Google Scholar] [CrossRef]
  22. Ozelkan, E.; Chen, G.; Ustundag, B.B. Multiscale object-based drought monitoring and comparison in rainfed and irrigated agriculture from Landsat 8 OLI imagery. Int. J. Appl. Earth Obs. Geoinf. 2016, 44, 159–170. [Google Scholar] [CrossRef]
  23. Pervez, M.S.; Brown, J.F. Mapping irrigated lands at 250-m scale by merging MODIS data and National Agricultural Statistics. Remote Sens. 2010, 2, 2388–2412. [Google Scholar] [CrossRef] [Green Version]
  24. Biggs, T.W.; Thenkabail, P.S.; Gumma, M.K.; Scott, C.A.; Parthasaradhi, G.R.; Turral, H.N. Irrigated area mapping in heterogeneous landscapes with MODIS time series, ground truth and census data, Krishna Basin, India. Int. J. Remote Sens. 2006, 27, 4245–4266. [Google Scholar] [CrossRef]
  25. Gumma, M.K.; Thenkabail, P.S.; Nelson, A. Mapping Irrigated Areas Using MODIS 250 Meter Time-Series Data: A Study on Krishna River Basin (India). Water 2011, 3, 113–131. [Google Scholar] [CrossRef] [Green Version]
  26. Zheng, B.; Myint, S.W.; Thenkabail, P.S.; Aggarwal, R.M. International Journal of Applied Earth Observation and Geoinformation A support vector machine to identify irrigated crop types using time-series Landsat NDVI data. Int. J. Appl. Earth Obs. Geoinf. 2015, 34, 103–112. [Google Scholar] [CrossRef]
  27. Saadi, S.; Simonneaux, V.; Boulet, G.; Raimbault, B.; Mougenot, B.; Fanise, P.; Ayari, H.; Lili-Chabaane, Z. Monitoring Irrigation Consumption Using High Resolution NDVI Image Time Series: Calibration and Validation in the Kairouan Plain (Tunisia). Remote Sens. 2015, 7, 13005–13028. [Google Scholar] [CrossRef] [Green Version]
  28. Loveland, T.R.; Reed, B.C.; Brown, J.F.; Ohlen, D.O.; Zhu, Z.; Yang, L.; Merchant, J.W. Development of a global land cover characteristics database and IGBP DISCover from 1 km AVHRR data. Int. J. Remote Sens. 2000, 21, 1303–1330. [Google Scholar] [CrossRef]
  29. Siebert, S.; Hoogeveen, J.; Faures, J.; Frenken, K.; Feick, S. Development and validation of the global map of irrigation areas Development and validation of the global map of irrigation areas. Hydrol. Earth Syst. Sci. 2005, 2, 1299–1327. [Google Scholar]
  30. Thenkabail, P.S.; Schull, M.; Turral, H. Ganges and Indus river basin land use/land cover (LULC) and irrigated area mapping using continuous streams of MODIS data. Remote Sens. Environ. 2005, 95, 317–341. [Google Scholar] [CrossRef]
  31. Teluguntla, P.; Thenkabail, P.; Oliphant, A.; Xiong, J.; Gumma, M.K.; Congalton, R.G.; Yadav, K.; Huete, A. A 30-m landsat-derived cropland extent product of Australia and China using random forest machine learning algorithm on Google Earth Engine cloud computing platform. ISPRS J. Photogramm. Remote Sens. 2018, 144, 325–340. [Google Scholar] [CrossRef]
  32. Ferrant, S.; Selles, A.; Le Page, M.; Herrault, P.-A.; Pelletier, C.; Al-Bitar, A.; Mermoz, S.; Gascoin, S.; Bouvet, A.; Saqalli, M.; et al. Detection of Irrigated Crops from Sentinel-1 and Sentinel-2 Data to Estimate Seasonal Groundwater Use in South India. Remote Sens. 2017, 9, 1119. [Google Scholar] [CrossRef] [Green Version]
  33. Lobell, D.; Asner, G. Comparison of earth observing-1 ali and landsat etm+ for crop identification and yield prediction in mexico. IEEE Trans. Geosci. Remote Sens. 2003, 41, 1277–1282. [Google Scholar] [CrossRef]
  34. Vrieling, A.; Skidmore, A.K.; Wang, T.; Meroni, M.; Ens, B.J.; Oosterbeek, K.; O’Connor, B.; Darvishzadeh, R.; Heurich, M.; Shepherd, A.; et al. Spatially detailed retrievals of spring phenology from single-season high-resolution image time series. Int. J. Appl. Earth Obs. Geoinf. 2017, 59, 19–30. [Google Scholar] [CrossRef]
  35. Sekhar, M.; Ruiz, L. IFCPAR/CEFIPRA PROJECT-Adaptation of Irrigated Agriculture to Climate Change (AICHA): Project Proposal; IFCPAR/CEFIPRA: New Delhi, India, 2010. [Google Scholar]
  36. Sekhar, M.; Riotte, J.; Ruiz, L.; Jouquet, J.; Braun, J.J. Influences of Climate and Agriculture on Water and Biogeochemical Cycles: Kabini Critical Zone Observatory. Proc. Indian Natl. Sci. Acad. 2016, 82, 833–846. [Google Scholar] [CrossRef]
  37. Gaillardet, J.; Braud, I.; Hankard, F.; Anquetin, S.; Bour, O.; Dorfliger, N.; De Dreuzy, J.; Galle, S.; Galy, C.; Gogo, S.; et al. OZCAR: The French Network of Critical Zone Observatories. Vadose Zone J. 2018, 17, 180067. [Google Scholar] [CrossRef] [Green Version]
  38. Sharma, A.K.; Hubert-Moy, L.; Sriramulu, B.; Sekhar, M.; Ruiz, L.; Bandyopadhyay, S.; Mohan, S.; Corgne, S. Evaluation of Radarsat-2 quad-pol SAR time-series images for monitoring groundwater irrigation. Int. J. Digit. Earth 2019, 12, 1177–1197. [Google Scholar] [CrossRef]
  39. Tomer, S.K.; Al Bitar, A.; Sekhar, M.; Zribi, M.; Bandyopadhyay, S.; Sreelash, K.; Sharma, A.K.; Corgne, S.; Kerr, Y. Retrieval and multi-scale validation of Soil Moisture from multi-temporal SAR Data in a semi-arid tropical region. Remote Sens. 2015, 7, 8128–8153. [Google Scholar] [CrossRef] [Green Version]
  40. Eswar, R.; Sekhar, M.; Bhattacharya, B.K. Disaggregation of LST over India: Comparative analysis of different vegetation indices. Int. J. Remote Sens. 2016, 37, 1035–1054. [Google Scholar] [CrossRef]
  41. Mangiarotti, S.; Sharma, A.; Corgne, S.; Hubert-Moy, L.; Ruiz, L.; Sekhar, M.; Kerr, Y. Can the global modeling technique be used for crop classification? Chaos Solitons Fractals 2018, 106, 363–378. [Google Scholar] [CrossRef]
  42. Sharma, A.K.; Ruiz, L.; Sriramulu, B.; Sekhar, M. Irrigated area estimation using Landsat satellite images in the Berambadi watershed. EGU Gen. Assem. Conf. Abstr. 2018, 20, 17445. [Google Scholar]
  43. Vermote, E.F.; Tanre, D.; Deuze, J.L.; Herman, M.; Morcette, J.-J. Second Simulation of the Satellite Signal in the Solar Spectrum, 6S: An overview. IEEE Trans. Geosci. Remote Sens. 1997, 35, 675–686. [Google Scholar] [CrossRef] [Green Version]
  44. U.S. Geological Survey. Landsat 8 Collection 1 (C1) Land Surface Reflectance Code (LaSRC) Product Guide; Department of the Interior, U.S. Geological Survey, USGS Press: Reston, VA, USA, 2020.
  45. Claverie, M.; Vermote, E.F.; Franch, B.; Masek, J.G. Evaluation of the Landsat-5 TM and Landsat-7 ETM+ surface reflectance products. Remote Sens. Environ. 2015, 169, 390–403. [Google Scholar] [CrossRef]
  46. Robert, M.; Thomas, A.; Sekhar, M.; Badiger, S.; Ruiz, L.; Willaume, M.; Leenhardt, D.; Bergez, J.-E. Farm Typology in the Berambadi Watershed (India): Farming Systems Are Determined by Farm Size and Access to Groundwater. Water 2017, 9, 51. [Google Scholar] [CrossRef] [Green Version]
  47. Xu, L.; Li, B.; Yuan, Y.; Gao, X.; Zhang, T. A Temporal-Spatial Iteration Method to Reconstruct NDVI Time Series Datasets. Remote Sens. 2015, 7, 8906–8924. [Google Scholar] [CrossRef] [Green Version]
  48. Yan, L.; Roy, D.P. Remote Sensing of Environment Automated crop field extraction from multi-temporal Web Enabled Landsat Data. Remote Sens. Environ. 2014, 144, 42–64. [Google Scholar] [CrossRef] [Green Version]
  49. Behera, M.; Tripathi, P.; Das, P.; Srivastava, S.; Roy, P.; Joshi, C.; Behera, P.; Deka, J.; Kumar, P.; Khan, M.; et al. Remote sensing based deforestation analysis in Mahanadi and Brahmaputra river basin in India since 1985. J. Environ. Manag. 2018, 206, 1192–1203. [Google Scholar] [CrossRef]
  50. Roy, D.; Kovalskyy, V.; Zhang, H.; Vermote, E.; Yan, L.; Kumar, S.; Egorov, A. Characterization of Landsat-7 to Landsat-8 reflective wavelength and normalized difference vegetation index continuity. Remote Sens. Environ. 2016, 185, 57–70. [Google Scholar] [CrossRef] [PubMed] [Green Version]
  51. Ke, Y.; Im, J.; Lee, J.; Gong, H.; Ryu, Y. Characteristics of Landsat 8 OLI-derived NDVI by comparison with multiple satellite sensors and in-situ observations. Remote Sens. Environ. 2015, 164, 298–313. [Google Scholar] [CrossRef]
  52. Hwang, T.; Song, C.; Bolstad, P.V.; Band, L.E. Downscaling real-time vegetation dynamics by fusing multi-temporal MODIS and Landsat NDVI in topographically complex terrain. Remote Sens. Environ. 2011, 115, 2499–2512. [Google Scholar] [CrossRef]
  53. Mathur, A.; Foody, G.M. Multiclass and Binary SVM Classification: Implications for Training and Classification Users. IEEE Geosci. Remote Sens. Lett. 2008, 5, 241–245. [Google Scholar] [CrossRef]
  54. Guidici, D.; Clark, M.L. One-Dimensional Convolutional Neural Network Land-Cover Classification of Multi-Seasonal Hyperspectral Imagery in the San Francisco Bay Area, California. Remote Sens. 2017, 9, 629. [Google Scholar] [CrossRef] [Green Version]
  55. Dusseux, P.; Corpetti, T.; Hubert-Moy, L.; Corgne, S. Combined Use of Multi-Temporal Optical and Radar Satellite Images for Grassland Monitoring. Remote Sens. 2014, 6, 6163–6182. [Google Scholar] [CrossRef] [Green Version]
  56. Löw, F. Agricultural Crop Mapping from Multi-Scale Remote Sensing Data-Concepts and Applications in Heterogeneous Middle Asian Agricultural Landscapes. Ph.D. Thesis, Universität Würzburg, Würzburg, Germany, 2013. [Google Scholar]
  57. Pal, M.; Mather, P.M. Support vector machines for classification in remote sensing. Int. J. Remote Sens. 2005, 26, 1007–1011. [Google Scholar] [CrossRef]
  58. Cheng, S.; Shih, F.Y. An improved incremental training algorithm for support vector machines using active query. Pattern Recognit. 2007, 40, 964–971. [Google Scholar] [CrossRef]
  59. Pedregosa, F.; Weiss, R.; Brucher, M. Scikit-learn: Machine Learning in Python. J. Mach. Learn. Res. 2011, 12, 2825–2830. [Google Scholar]
  60. Cheema, M.J.M.; Bastiaanssen, W.G.M. Land use and land cover classification in the irrigated Indus Basin using growth phenology information from satellite data to support water management analysis. Agric. Water Manag. 2010, 97, 1541–1552. [Google Scholar] [CrossRef]
  61. Story, M.; Congalton, R.G. Remote Sensing Brief Accuracy Assessment: A User’s Perspective. Photogramm. Eng. Remote Sens. 1986, 52, 397–399. [Google Scholar]
  62. Robert, M.; Thomas, A.; Sekhar, M.; Badiger, S.; Ruiz, L.; Raynal, H.; Bergez, J.-E. Adaptive and dynamic decision-making processes: A conceptual model of production systems on Indian farms. Agric. Syst. 2017, 157, 279–291. [Google Scholar] [CrossRef]
Figure 1. Location of the Berambadi watershed in the Kabini River Basin of India.
Remotesensing 13 01960 g001
Figure 2. Temporal frequency and resolution of multi-source optical satellite images used in the study. Abbreviations used in the figure are as follows: EO1, Earth Observing-1; ALI, Advanced Land Imager; IRS-P6, Indian Remote-Sensing Satellite-P6 also known as ResourceSat-1; LISS3, Linear Imaging Self Scanning Sensor-3; LISS4, Linear Imaging Self Scanning Sensor-4; OLI, Operational Land Imager; HRG-2, High Resolution Geometric-2.
Remotesensing 13 01960 g002
Figure 3. Ground-observed training (calibration) and validation fields with annual (summer + kharif + rabi) irrigated (intensive irrigation) and other (partial irrigation in the absence of rainfall, rainfed only, and fallow land) croplands for 2014, 2015, and 2016.
Remotesensing 13 01960 g003
Figure 4. Monthly and seasonal rainfall representation during the various cropping seasons from 2014–2016.
Remotesensing 13 01960 g004
Figure 5. Flowchart of the developed method. Abbreviations used in the figure are as follows: EO1, Earth Observing-1; ALI, Advanced Land Imager; IRS-P6, Indian Remote-Sensing Satellite-P6 also known as ResourceSat-1; LISS3, Linear Imaging Self Scanning Sensor-3; LISS4, Linear Imaging Self Scanning Sensor-4; OLI, Operational Land Imager; HRG-2, High Resolution Geometric-2; SVM, Support Vector Machine; NDVI, Normalized Differential Vegetation Index.
Remotesensing 13 01960 g005
Figure 6. Linear relation between Landsat-8 (LS8) Operational Land Imager (OLI) NDVI and other satellites’ corrected NDVI.
Remotesensing 13 01960 g006
Figure 7. Temporal NDVI curves of irrigated (AC) and non-irrigated (D) crops divided into four sub-sections. The sub-section (A) consists of turmeric and turmeric with onion, (B) consists of banana and sugarcane, (C) consists of beetroot, beans, and cabbage, and (D) consists of marigold, maize, and sunflower crops.
Remotesensing 13 01960 g007
Figure 8. Classification of seasonal (summer; khharif; rabi) intensively irrigated cropland for 2014–2015.
Remotesensing 13 01960 g008
Figure 9. Classification of two-season (summer and kharif; kharif and rabi) and annually irrigated (summer and kharif and rabi) cropland for 2014–2015.
Remotesensing 13 01960 g009
Figure 10. Classification of seasonal (summer; kharif; rabi) intensively irrigated cropland for 2015–2016.
Remotesensing 13 01960 g010
Figure 11. Classification of two-season (summer and kharif; kharif and rabi) and annually irrigated (summer and kharif and rabi) cropland classification for 2015–2016.
Remotesensing 13 01960 g011
Figure 12. Classification of summer season irrigated cropland for 2016.
Remotesensing 13 01960 g012
Figure 13. Representation of irrigated area percentage during various single cropping seasons, dual cropping seasons, and all cropping seasons.
Remotesensing 13 01960 g013
Table 1. The number of intensively irrigated fields (irrigation in summer, kharif, and rabi cropping seasons) and other cropland fields (partially irrigated in the absence of rainfall, non-irrigated, and fallow land) sampled.
YearIntensively Irrigated FieldsOther Cropland FieldsTotal
2014–2015182446628
2015–2016218513731
2016152452604
Table 2. Classification accuracy of intensively irrigated cropland (Irr; intensive irrigation) and other croplands (Oth; rainfed, fallow, and partial irrigation in the absence of rainfall) for 2014–2015.
Cropping SeasonIrrigated Area (km2)Irrigated Area (%)Error of Omission (%)Error of Commission (%)Kappa CoeffOverall Acc. (%)
Summer 20142.876.27Irr = 9.17Irr = 2.870.9094.87
Oth = 2.05Oth = 6.67
Kharif 20144.189.15Irr = 2.14Irr = 7.60.9195.59
Oth = 6.15Oth = 1.71
Rabi 2014–20157.1815.72Irr = 4.52Irr = 7.650.8994.62
Oth = 6.04Oth = 3.54
Summer AND Kharif 20142.345.12Irr = 14.3Irr = 2.820.8592.75
Oth = 1.9Oth = 9.99
Kharif AND Rabi 2014–20153.176.95Irr = 10.57Irr = 5.190.8793.31
Oth = 3.58Oth = 8.05
Summer AND Kharif AND Rabi 2014–20152.094.57Irr = 18.39Irr = 2.960.8190.28
Oth = 1.89Oth = 12.49
Table 3. Classification accuracy of intensively irrigated cropland (Irr; intensive irrigation) and other croplands (Oth; rainfed, fallow, and partial irrigation in the absence of rainfall) for 2015–2016.
Cropping SeasonIrrigated Area (km2)Irrigated Area (%)Error of Omission (%)Error of Commission (%)Kappa CoeffOverall Acc. (%)
Summer 20157.1615.86Irr =2 2.98Irr = 9.920.7286.66
Oth = 6.25Oth = 15.29
Kharif 20157.4316.47Irr = 13.73Irr = 5.260.8492.15
Oth = 3.53Oth = 9.48
Rabi 2015–20166.4313.98Irr = 21.43Irr = 7.320.7688.28
Oth = 4.57Oth = 14.19
Summer AND Kharif 20154.7610.55Irr = 35.75Irr = 4.30.6583.69
Oth = 2.11Oth = 21.05
Kharif AND Rabi 2015–20164.239.43Irr = 35.56Irr = 1.880.6784.47
Oth = 0.9Oth = 20.77
Summer AND Kharif AND Rabi 2015–20163.277.28Irr = 41.06Irr = 1.30.6282.34
Oth = 0.57Oth = 23.17
Table 4. Classification accuracy of intensively irrigated cropland (Irr; intensive irrigation) and other croplands (Oth; rainfed, fallow, and partial irrigation in the absence of rainfall) for 2016.
Cropping
Season
Irrigated Area (km2)Irrigated Area (%)Error of Omission (%)Error of Commission (%)Kappa CoeffOverall Acc. (%)
Summer 20165.8812.78Irr = 0Irr = 01.0100
Oth = 0Oth = 0
Table 5. Validation of the method developed.
Cropping SeasonClassification Developed
Annually Irrigated SamplesSeasonal Irrigated Samples
Rabi 2015kappa = 0.76kappa = 0.80
OA = 88.3%OA = 89.8%
Summer 2016kappa = 1.00kappa = 0.83
OA = 100.0%OA = 91.7%
Publisher’s Note: MDPI stays neutral with regard to jurisdictional claims in published maps and institutional affiliations.

