Article

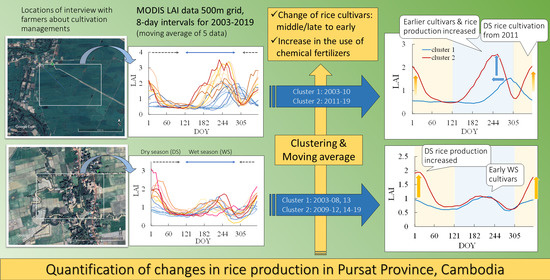
Quantification of Changes in Rice Production for 2003–2019 with MODIS LAI Data in Pursat Province, Cambodia

1
Graduate School of Agricultural Science, Tohoku University, Sendai 9808572, Japan
2
Center for Southeast Asian Studies, Kyoto University, Kyoto 6068501, Japan
3
Faculty of Economics, Hannan University, Matsubara 5808502, Japan
4
Faculty of Land Management and Land Administration, Royal University of Agriculture, Phnom Penh 12401, Cambodia
5
Center for Agricultural and Environmental Studies, Royal University of Agriculture, Phnom Penh 12401, Cambodia
*
Author to whom correspondence should be addressed.
Remote Sens. 2021, 13(10), 1971; https://0-doi-org.brum.beds.ac.uk/10.3390/rs13101971
Submission received: 13 April 2021 / Revised: 12 May 2021 / Accepted: 15 May 2021 / Published: 18 May 2021

Abstract

:
Rice is not merely a staple food but an important source of income in Cambodia. Rapid socioeconomic development in the country affects farmers’ management practices, and rice production has increased almost three-fold over two decades. However, detailed information about the recent changes in rice production is quite limited and mainly obtained from interviews and statistical data. Here, we analyzed MODIS LAI data (MCD152H) from 2003 to 2019 to quantify rice production changes in Pursat Province, one of the great rice-producing areas in Cambodia. Although the LAI showed large variations, the data clearly indicate that a major shift occurred in approximately 2010 after applying smoothing methods (i.e., hierarchical clustering and the moving average). This finding is consistent with the results of the interviews with the farmers, which indicate that earlier-maturing cultivars had been adopted. Geographical variations in the LAI pattern were illustrated at points analyzed along a transverse line from the mountainside to the lakeside. Furthermore, areas of dry season cropping were detected by the difference in monthly averaged MODIS LAI data between January and April, which was defined as the dry season rice index (DSRI) in this study. Consequently, three different types of dry season cropping areas were recognized by nonhierarchical clustering of the annual LAI transition. One of the cropping types involved an irrigation-water-receiving area supported by canal construction. The analysis of the peak LAI in the wet and dry seasons suggested that the increase in rice production was different among cropping types and that the stagnation of the improvements and the limitation of water resources are anticipated. This study provides valuable information about differences and changes in rice cropping to construct sustainable and further-improved rice production strategies.

Graphical Abstract

1. Introduction

Rice is the principal crop in Cambodia, where it occupies 75 percent of the cultivated land. It is also one of the important industries in Cambodia, since more than 20 percent of working-age people are involved in rice production, processing, and marketing [1]. After achieving self-sufficiency in 1995, the total production of rice in the country has increased three-fold [2], and rice has recently become a promising commodity for export [3]. Promoting rice production is of significant importance to economic development and poverty reduction in Cambodia [4]. The increase in rice production was achieved by the expansion of the cultivation area and improved yield [4]. However, limited quantitative information on factors driving the increase in production makes future prospects uncertain.
Pursat Province, located in western Cambodia, is a typical rice-producing area, reflecting the current situation of the whole country over a shorter time scale [5]. It was reported that the increase in rice production in Pursat Province occurred as a result of drastic changes in cultivation management, such as expanding the use of chemical fertilizers and introducing modern varieties. Yagura et al. (2020) also pointed out that one of the key factors in these drastic changes was irrigation infrastructure [5]. The Cambodian government has been promoting the construction and revitalization of its irrigation infrastructure [6,7]. Several reports have indicated that the construction of irrigation channels increases rice productivity in the wet season by providing supplemental irrigation and reducing flood risks. Additionally, the availability of irrigation water expanded the rice production area in the dry season [8]. However, these reports were either case studies based mostly on intensive and extensive interviews with farmers or statistical data. Temporal and spatial analyses of the impacts of irrigation availability on rice production have rarely been conducted.
Satellite-based remote sensing has been widely used as an effective tool to evaluate regional crop growth. For example, the moderate resolution imaging spectroradiometer (MODIS) provides leaf area index (LAI) products as a growth indicator at constant (4- or 8-day) intervals with a spatial resolution of 500 m. Additionally, vegetation indices such as the normalized difference vegetation index (NDVI) and the enhanced vegetation index (EVI) can be obtained from MODIS data. Several studies have investigated crop yield modeling in combination with the MODIS LAI product and other vegetation indices. Son et al. (2013) demonstrated regional yield prediction in the Vietnamese rice cropping area with the MODIS LAI product (MOD15A2) and the EVI calculated by MODIS spectral data (MOD09A1) [9]. Planting, heading, and harvesting dates were reasonably estimated by the EVI calculated from MODIS spectral data (MOD13Q1 and MYD13Q1) in Cambodia [10]. Changes in crop production can also be analyzed for a two-decade period because the MODIS product has been collected since 2000. The EVI and NDVI from MODIS data were integrated with a rice phenology model for a sixteen-year period to reveal the effects of weather variation in a study by Wang et al. (2020) [11]. Song et al. (2020) used the MODIS LAI product from 2003 to 2018 to monitor spatiotemporal changes in the winter wheat phenology in China in response to climate warming [12]. However, the spatial resolution of these products (500 m) is often considered too large for field-scale analysis of rice production in Asia, and the unexpected fluctuation in the LAI caused mostly by cloud contamination also restricts its inclusion in analysis. Therefore, some noise-filtering or smoothing procedures to exclude unacceptable noise are necessary.
To overcome the limitations associated with these fluctuations and the spatial resolution of these data, in this study, cluster analysis and averaging were applied to time series data from the MODIS LAI product in Pursat Province. Based on the analysis, changes in rice production over 17 years (2003–2019) were evaluated. In addition, interviews with local farmers reinforced our understanding of the background of rice production changes. Special attention was paid to areas where dry season rice was cultivated because irrigation had an important role in it. The prospects and potential for enhancing rice production in the region are discussed.

2. Materials and Methods

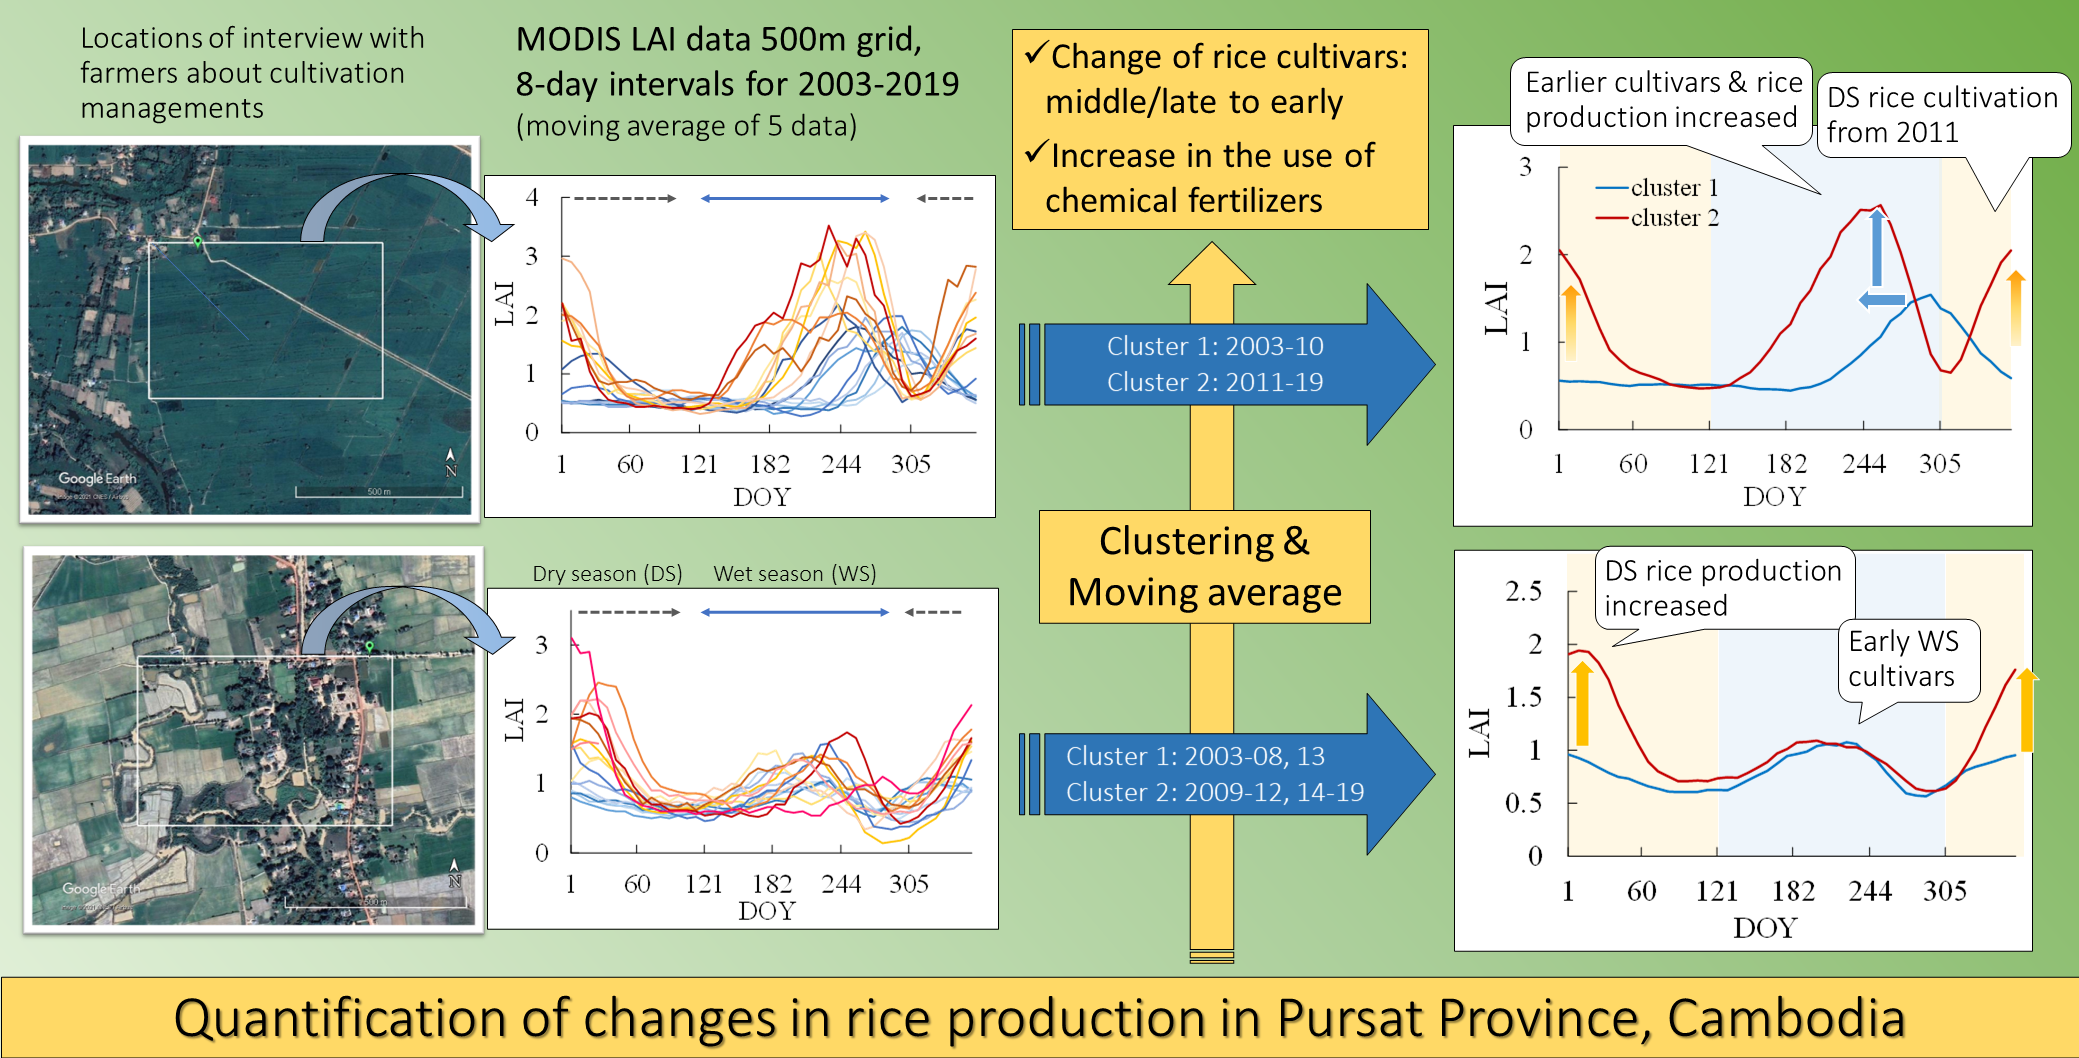
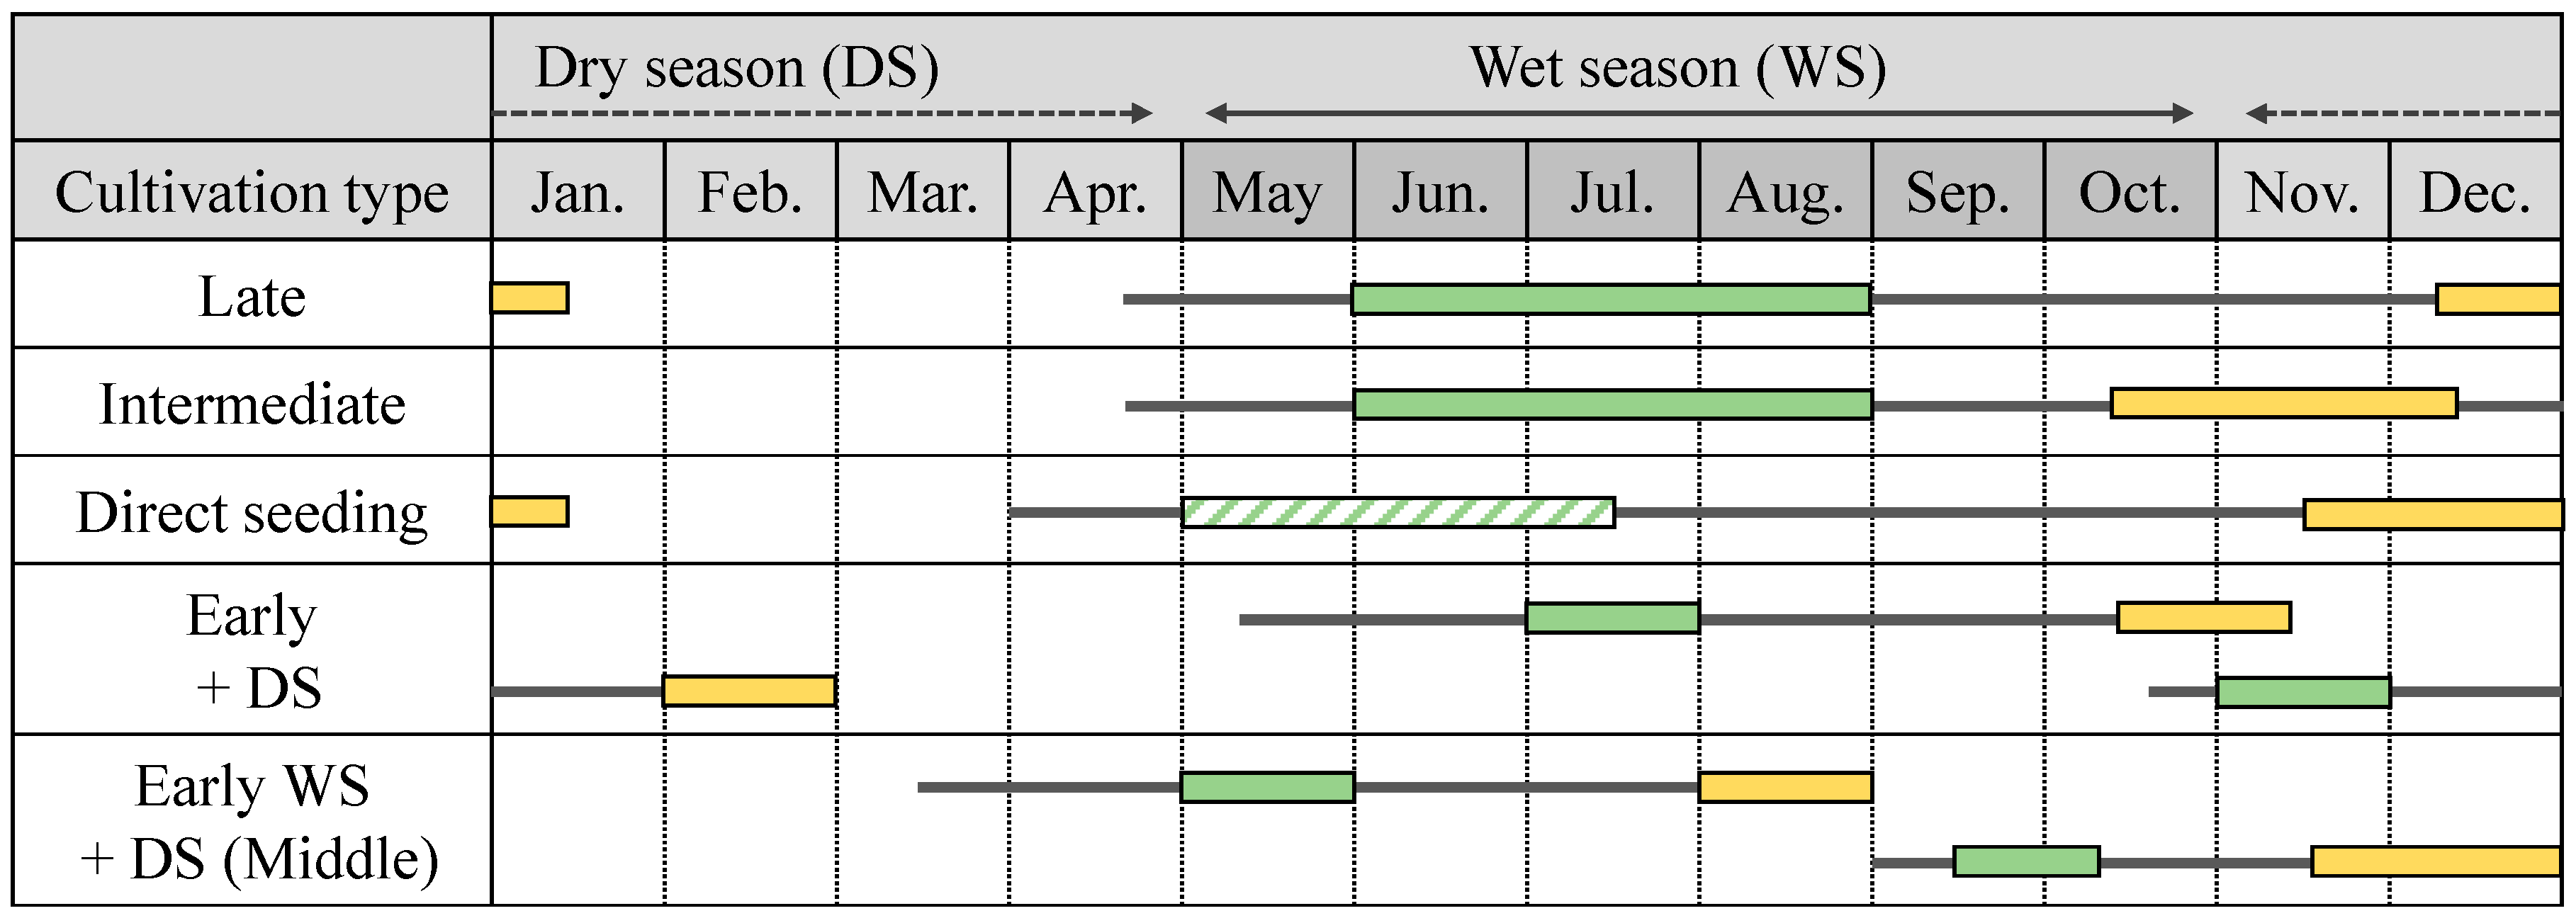
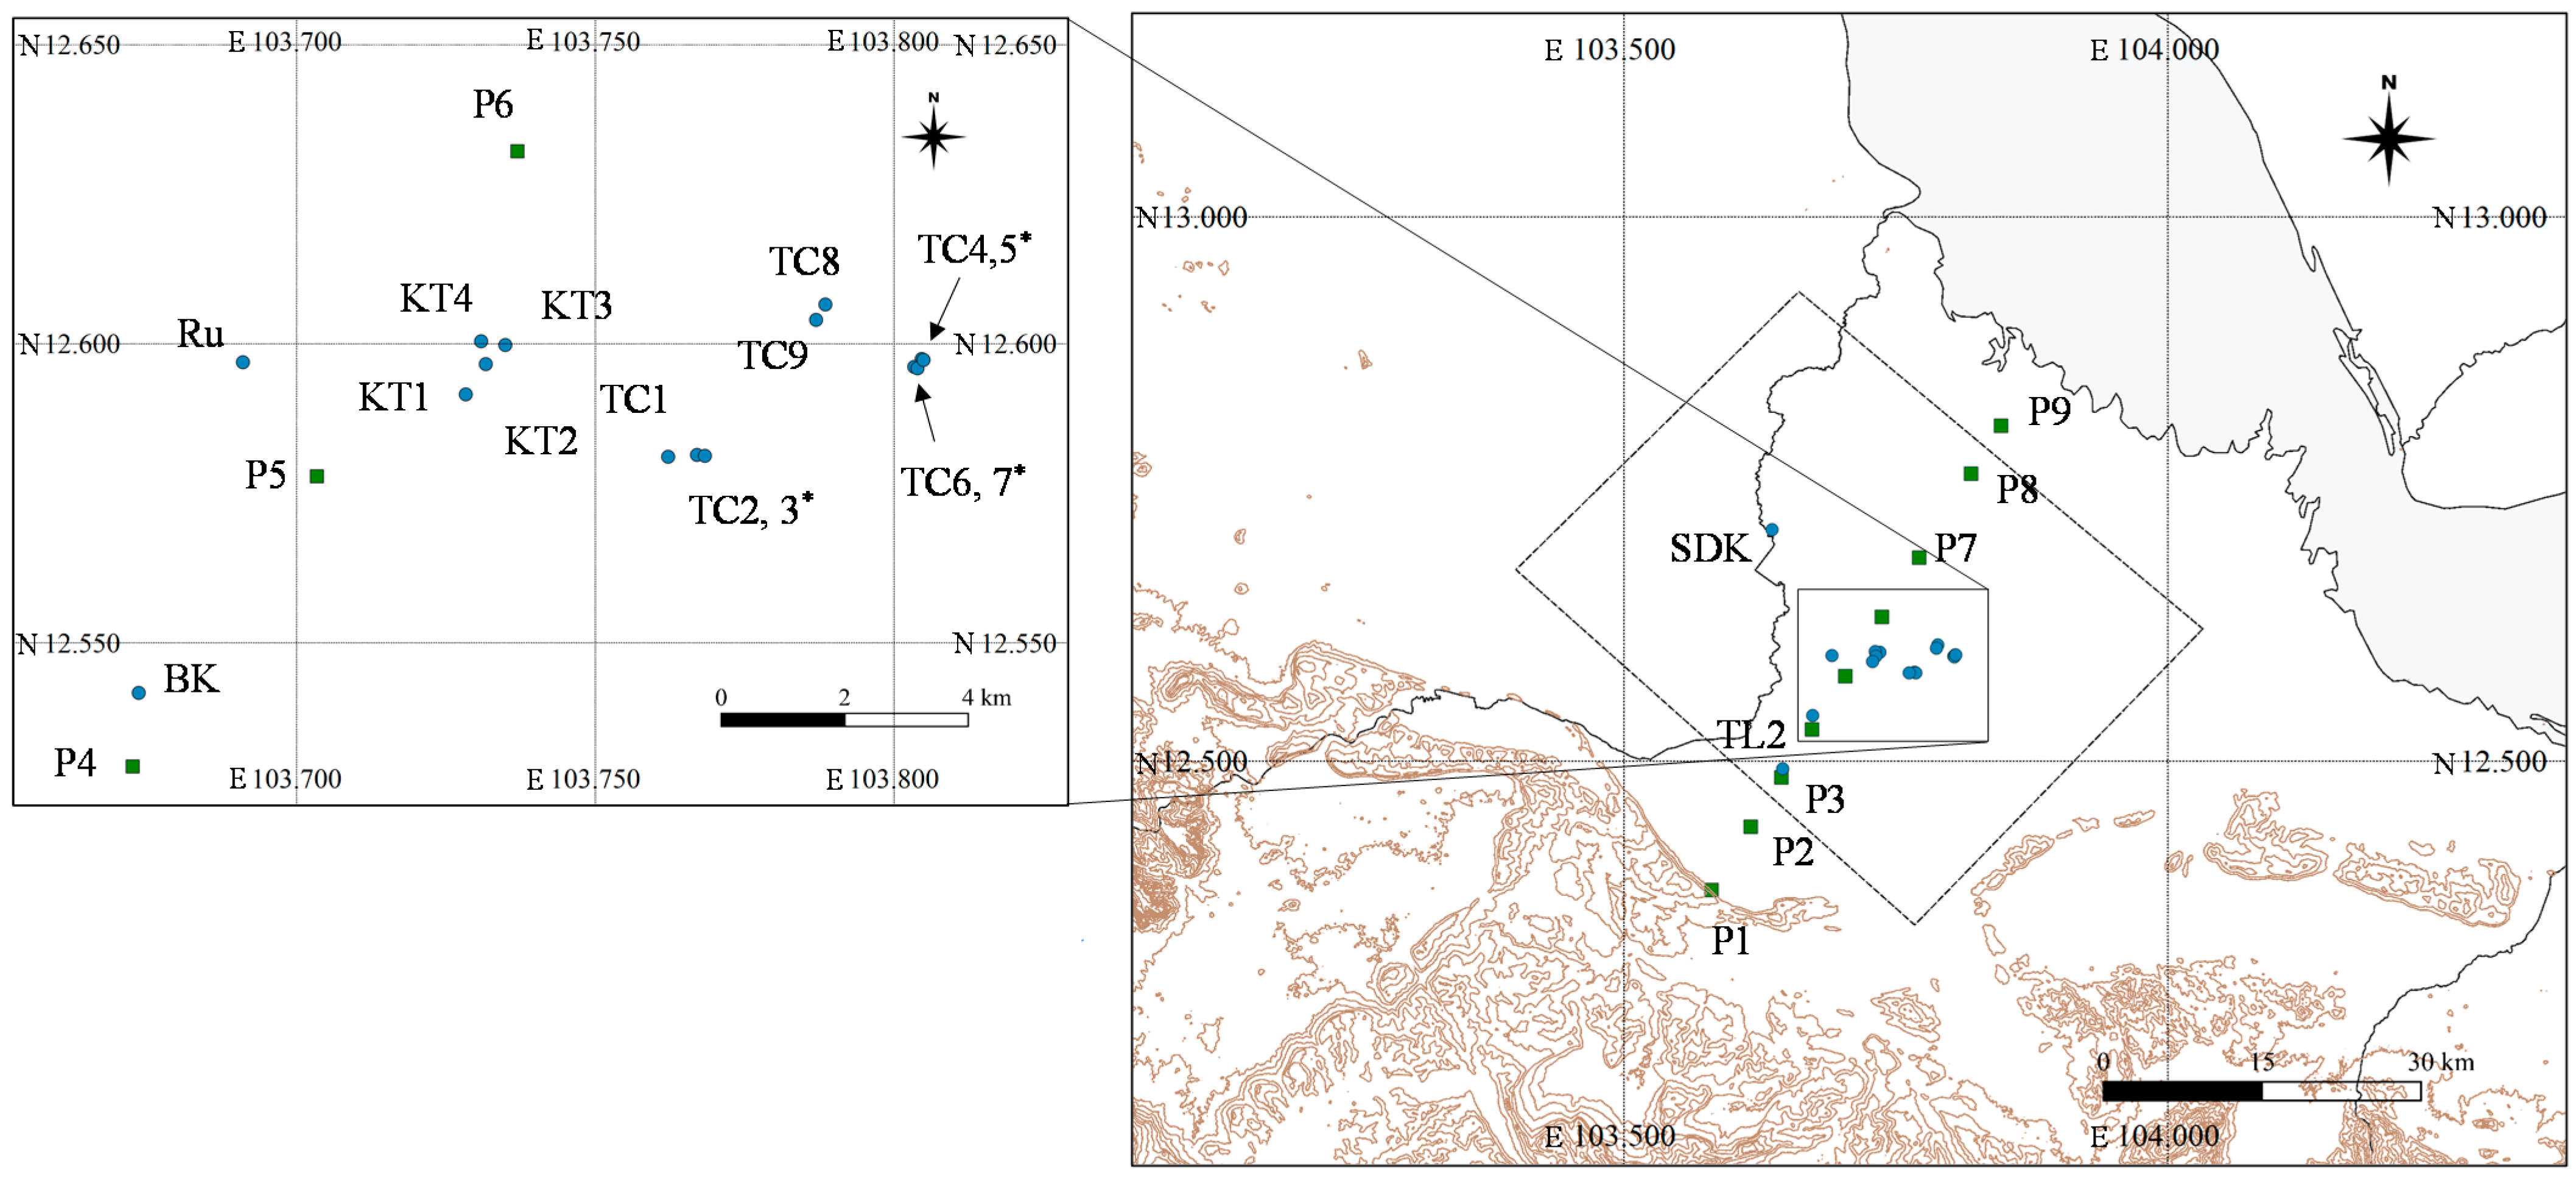
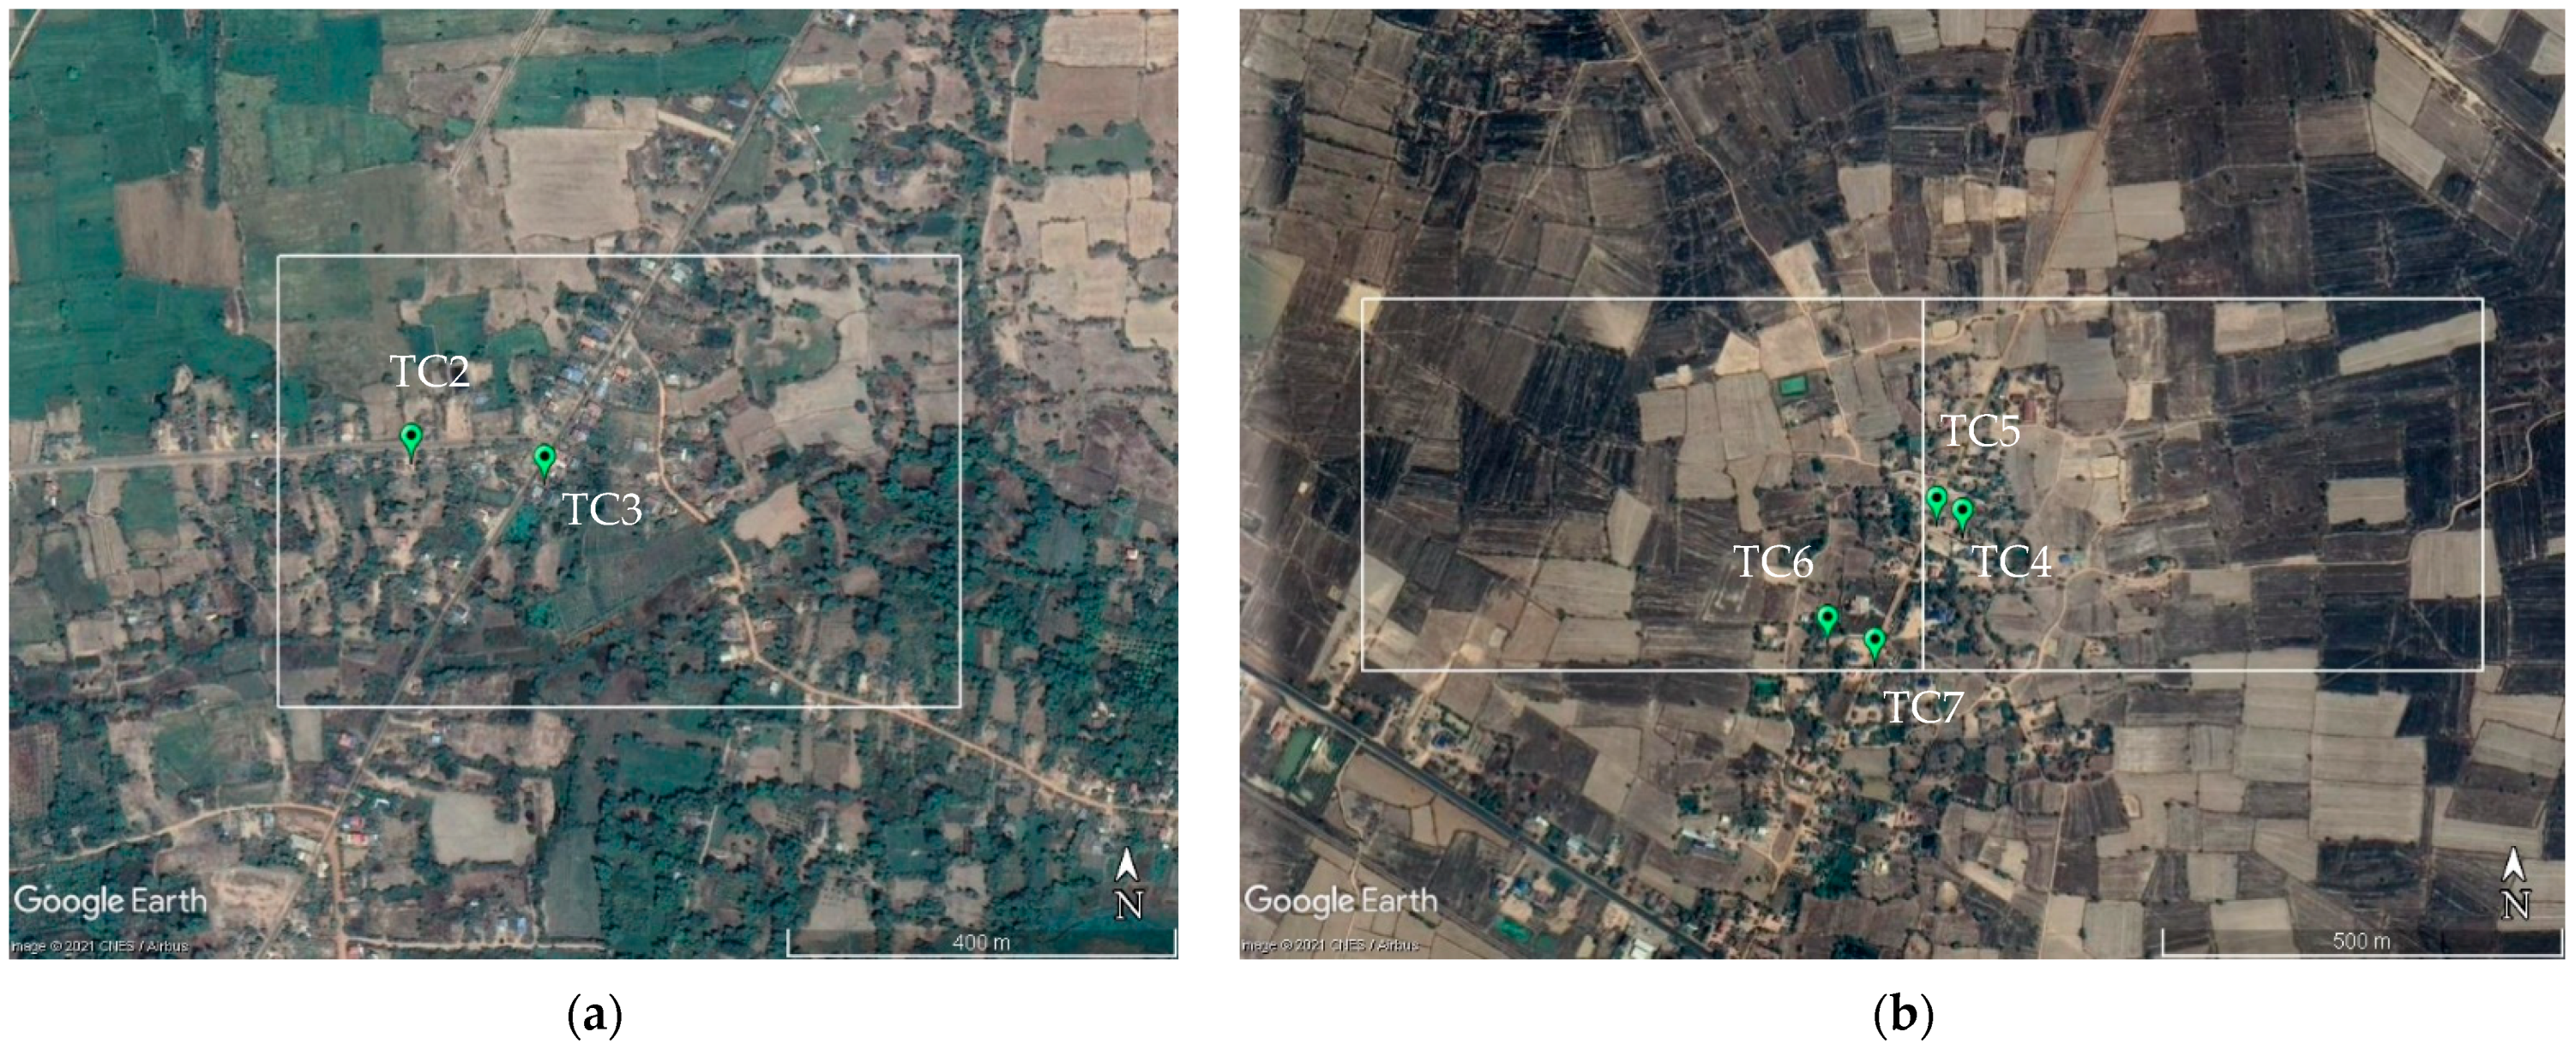
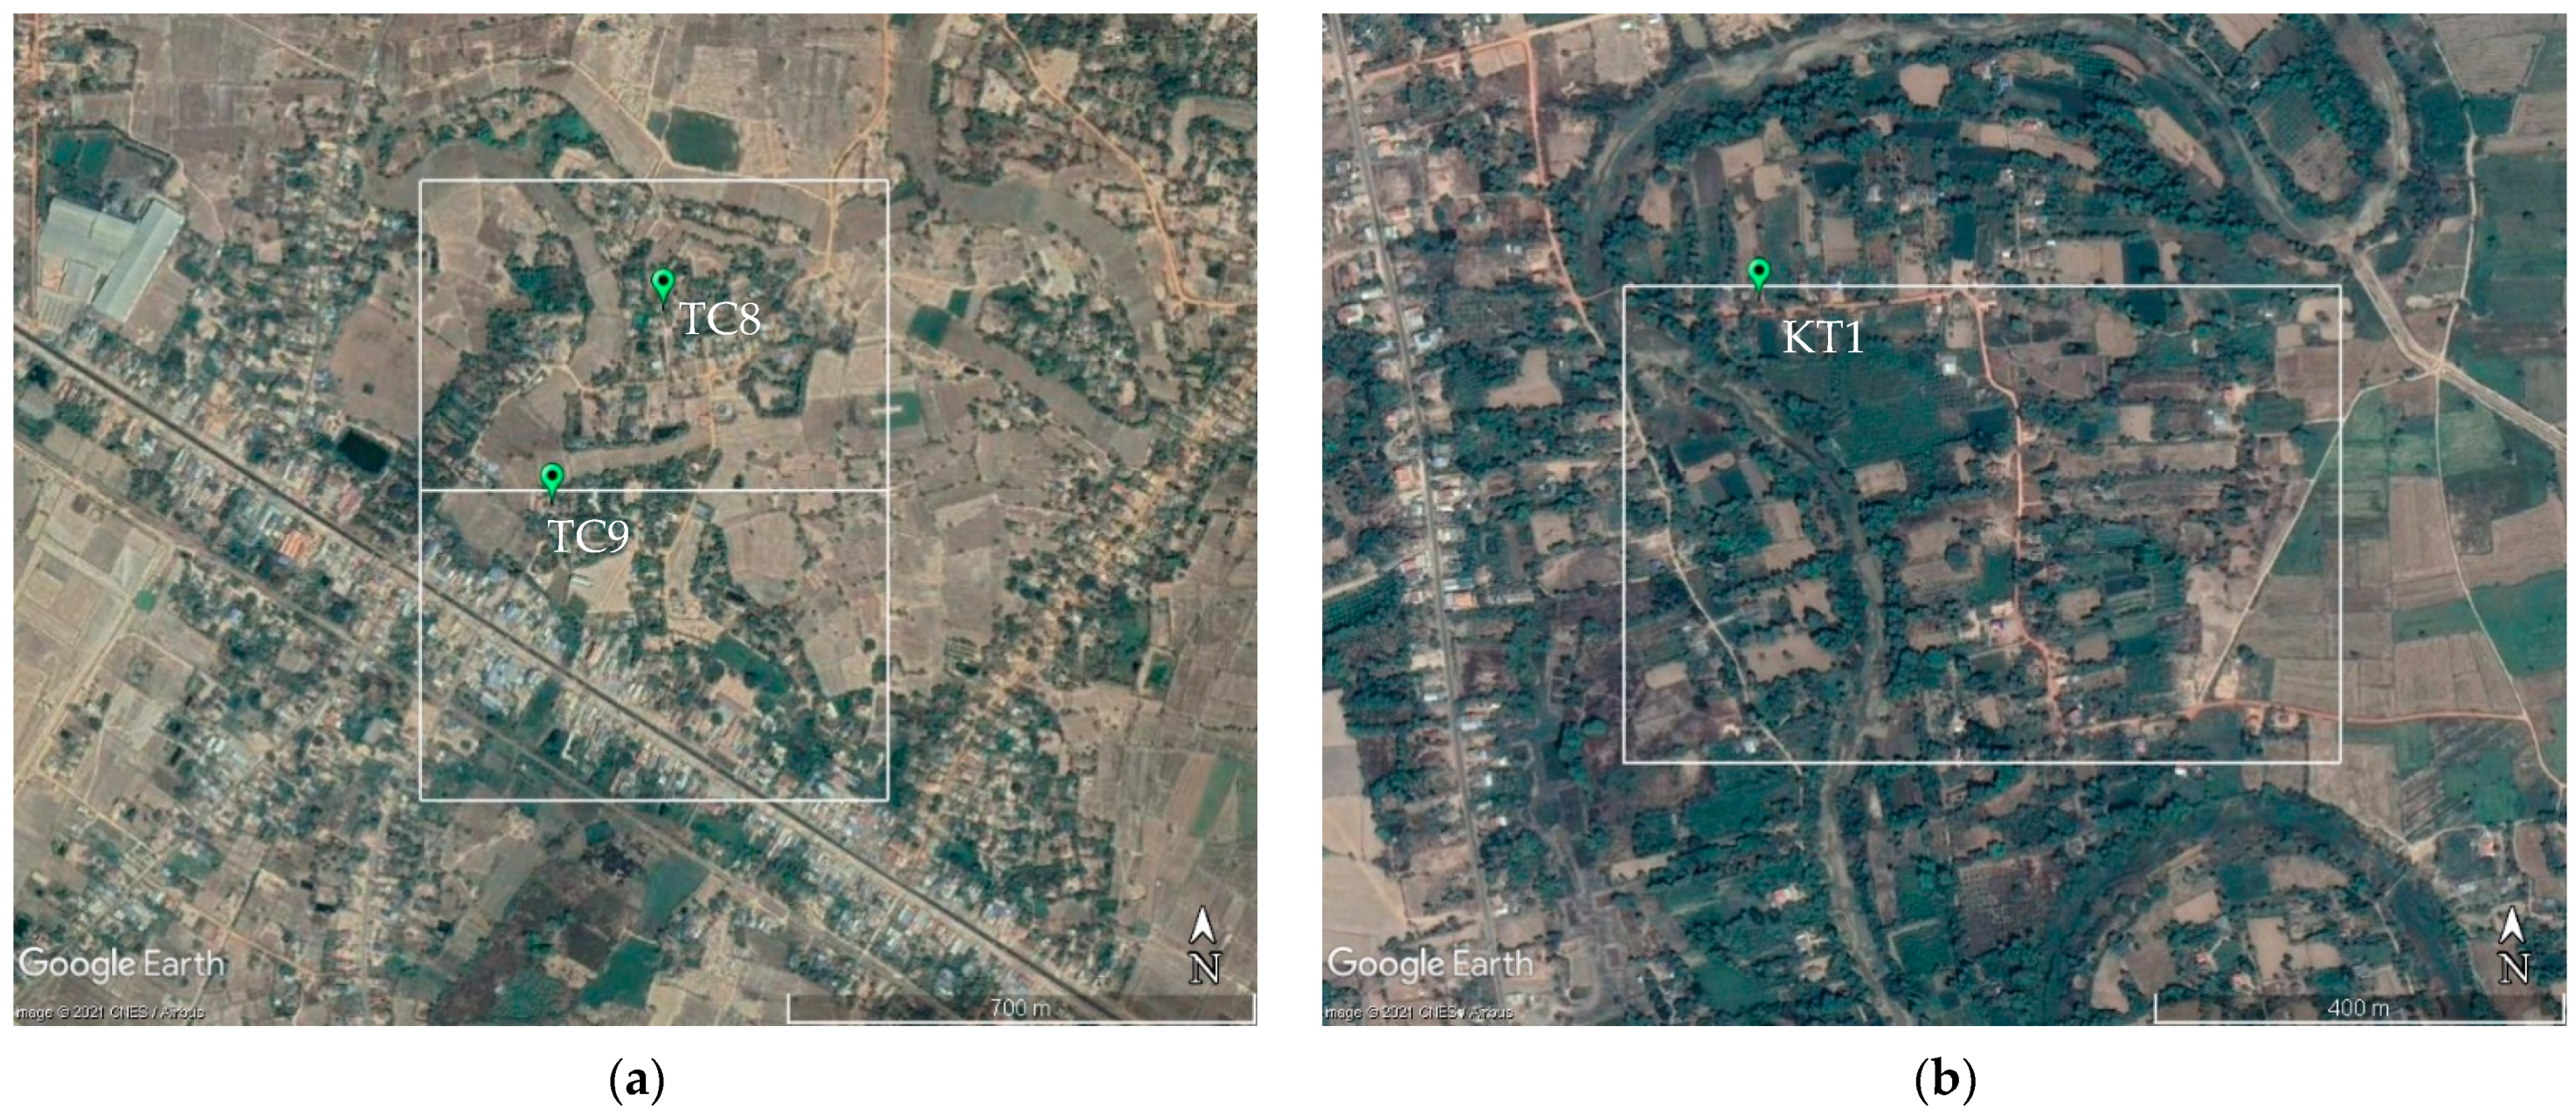
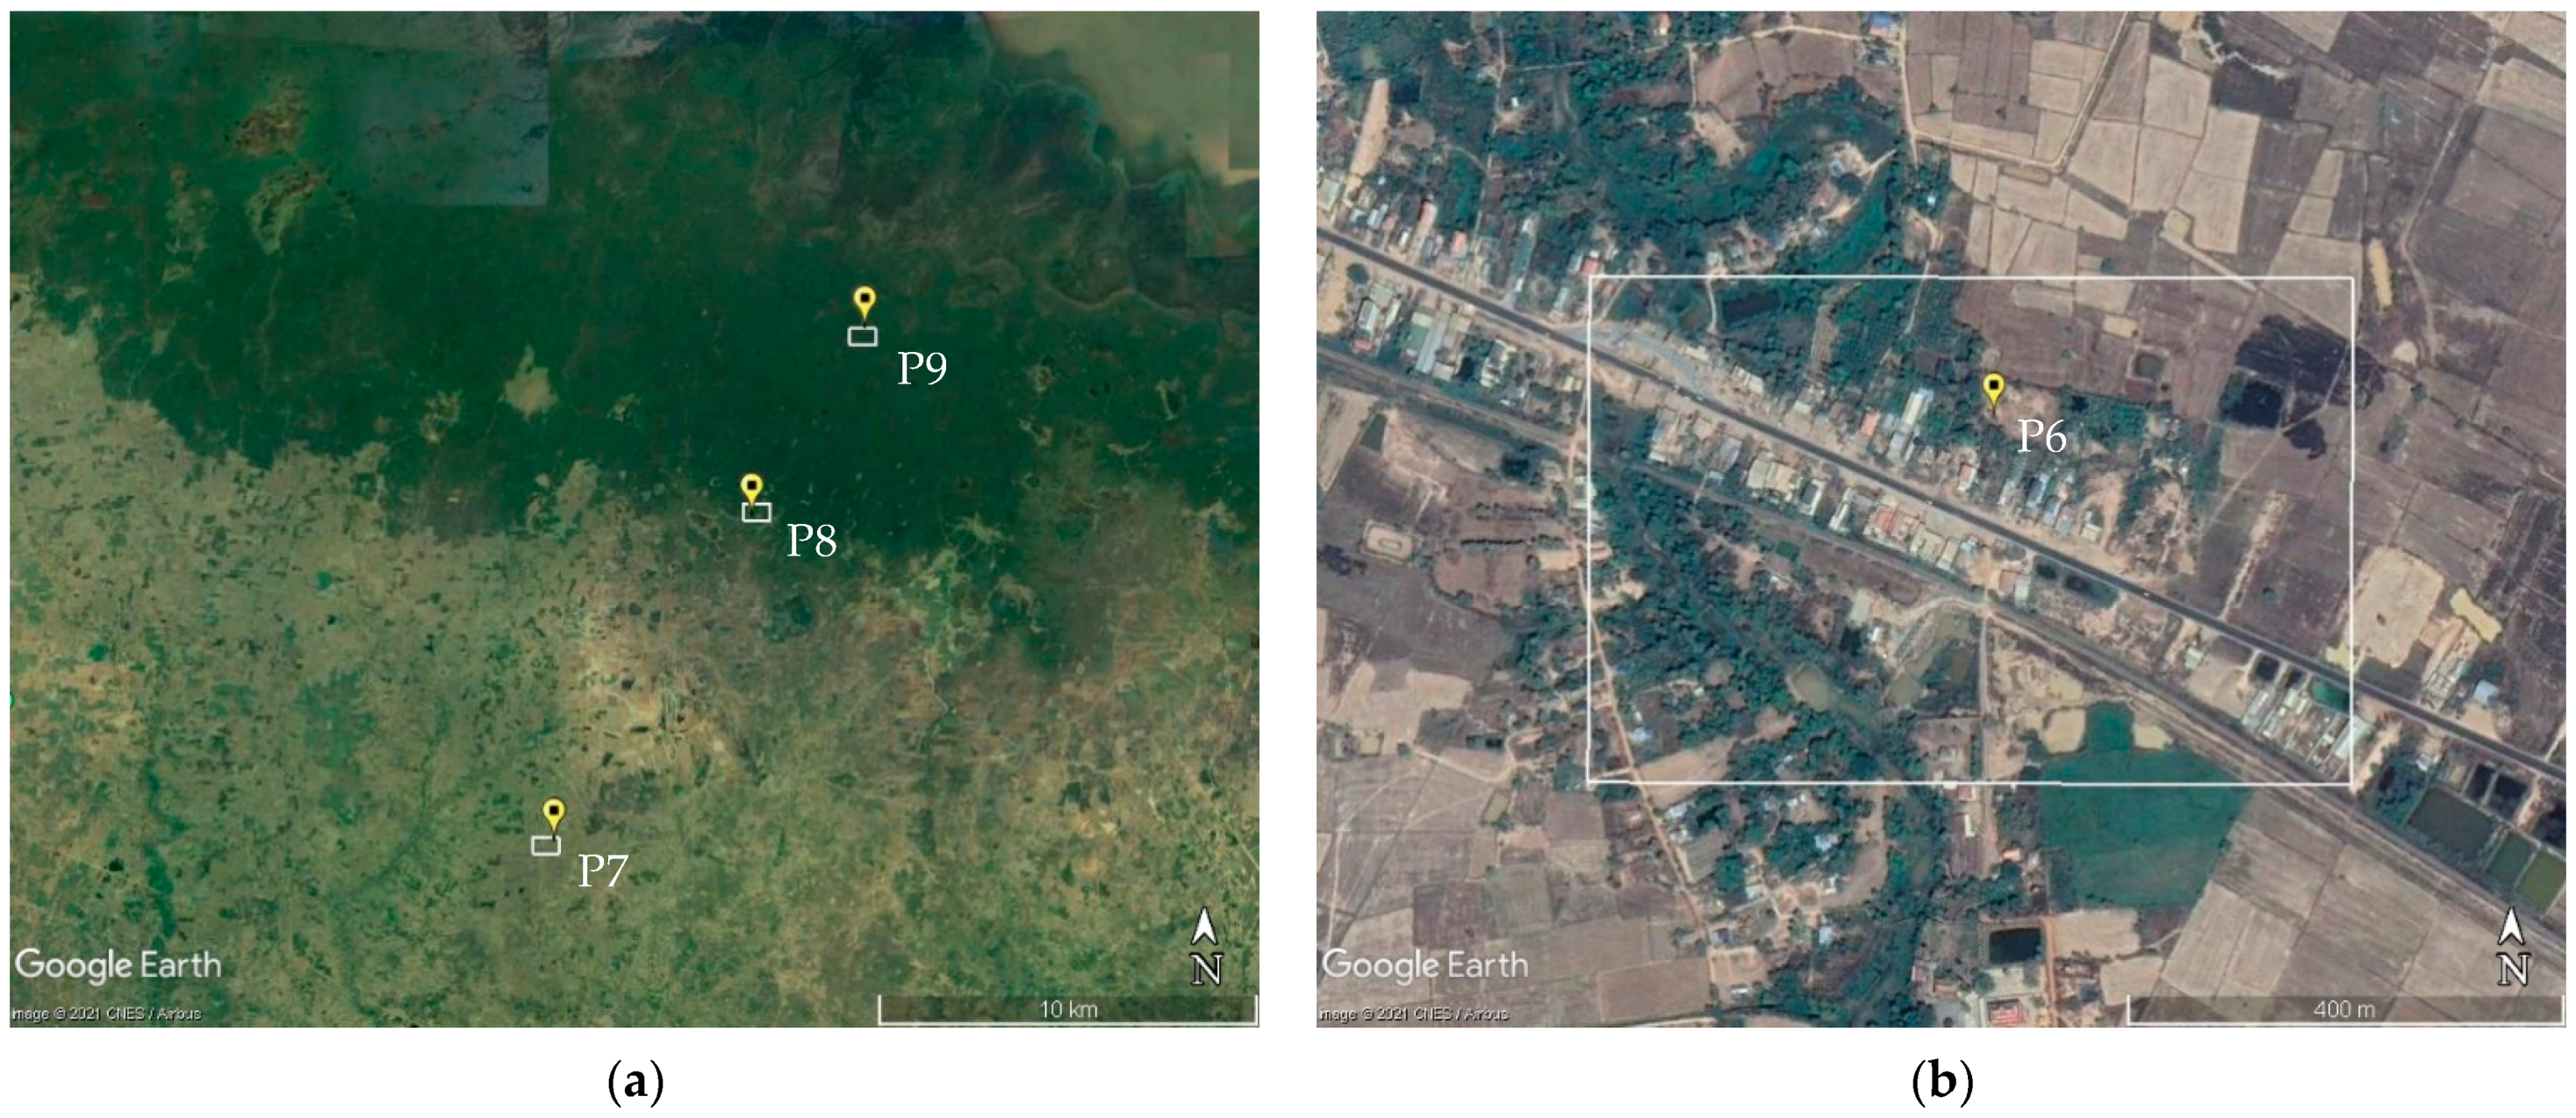
2.1. Study Area and Cropping Season

Pursat Province is in the western part of Cambodia between Tonle Sap Lake and the northern end of the Cardamom Mountains. Rivers and lakes in this region are often flooded in the wet season, resulting in the inundation of the surrounding area. The lowland area of Pursat Province is a part of the Tonle Sap Plain. The western side of the province shares a boundary with Thailand.
Pursat is characterized by a tropical monsoon climate. The dry season (DS) starts in November and ends in April, with the driest month being February. The wet season (WS) starts in May and ends in October, with bimodal rainfall peaks in June and September/October [8]. Rice is the dominant crop grown on lowland plains, where the majority of WS rice is sown or transplanted from May to June and harvested from October to January, depending on the maturity trait of the cultivar and water availability. Cultivation types and seasons are described in Figure 1. Growth duration is determined by the sensitivity of cultivars to daylength. According to Ouk et al. (2009) [13], early cultivars with low sensitivity to daylength grow for less than 120 days, and those with greater sensitivity to daylength mature earlier than the middle of October. Intermediate cultivars with relatively low sensitivity grow for 120 to 150 days, and those with greater sensitivity mature from mid-October to mid-November. Late cultivars with relatively low sensitivity to daylength grow for more than 150 days, and those with greater sensitivity mature after the middle of November. With irrigation water, second (DS) rice cultivations can be started from November to December, after the WS rice’s cultivation is finished. The DS rice is harvested from January to February. With enough water in March or April, farmers can establish the first crop from one to three months earlier and can therefore plant a second crop (Figure 1).

2.2. Interview with Farmers on Cultivation Management

Interviews with rice-growing farmers were conducted at one of the centers of the rice-producing areas in Pursat Province in August 2014. Full-time farmers who agreed to the survey were selected as interviewees. The location and cultivation management approach were confirmed by interviews with 13 farmers of 13 fields in the Trapeang chorng (TC) and Khnar Totueng (KT) communes in Bakan district. Additional interviews were conducted with 4 farmers for each of 4 fields in the Svay Doun Kaev (SDK), Boeng Khnar (BK), Ta Lou (TL), and Rumlech (Ru) communes in Bakan district in August 2015. Changes in cultivation management and the reasons for those changes were identified in the interviews (Figure 2, Table 1). The results were used to understand the LAI changes at each location because the farmers’ field did not exactly match the analyzed pixel.
Figure 2. Interviewed farmers’ locations (blue circles) and additional analyzed points (green squares). The dotted rectangle in the right figure is the area analyzed for DS rice cropping. Some of the adjacent locations in the left figure (indicated with *) were included in the same set of pixels from the MODIS LAI data (see Figure 3). Elevation data were downloaded from the website of the Consultative Group on International Agricultural Research (CGIAR) (https://srtm.csi.cgiar.org/srtmdata/, accessed on 22 February 2021).
Remotesensing 13 01971 g002

2.3. LAI Data Analysis

2.3.1. LAI Data

MODIS data (MCD15A2H version 6), which have been provided since July 2002, for the seventeen-year period 2003–2019 were downloaded from the website of the Earth Observing System Data and Information System (EOSDIS) (https://search.earthdata.nasa.gov/, accessed on 6 November 2018 for 2003–2017, 24 June 2019 for 2018 and 18 August 2020 for 2019). MCD15A2H contains a combined product, including the fraction of photosynthetically active radiation (FPAR) and leaf area index (LAI), of an 8-day composite dataset with a 500-m pixel size. The MODIS LAI/FPAR algorithm uses spectral information from the MODIS red (648 nm) and near-infrared (NIR, 858 nm) surface reflectance and the secondary algorithm uses empirical relationships between the NDVI and canopy LAI and FPAR. LAI data were used for the analysis.

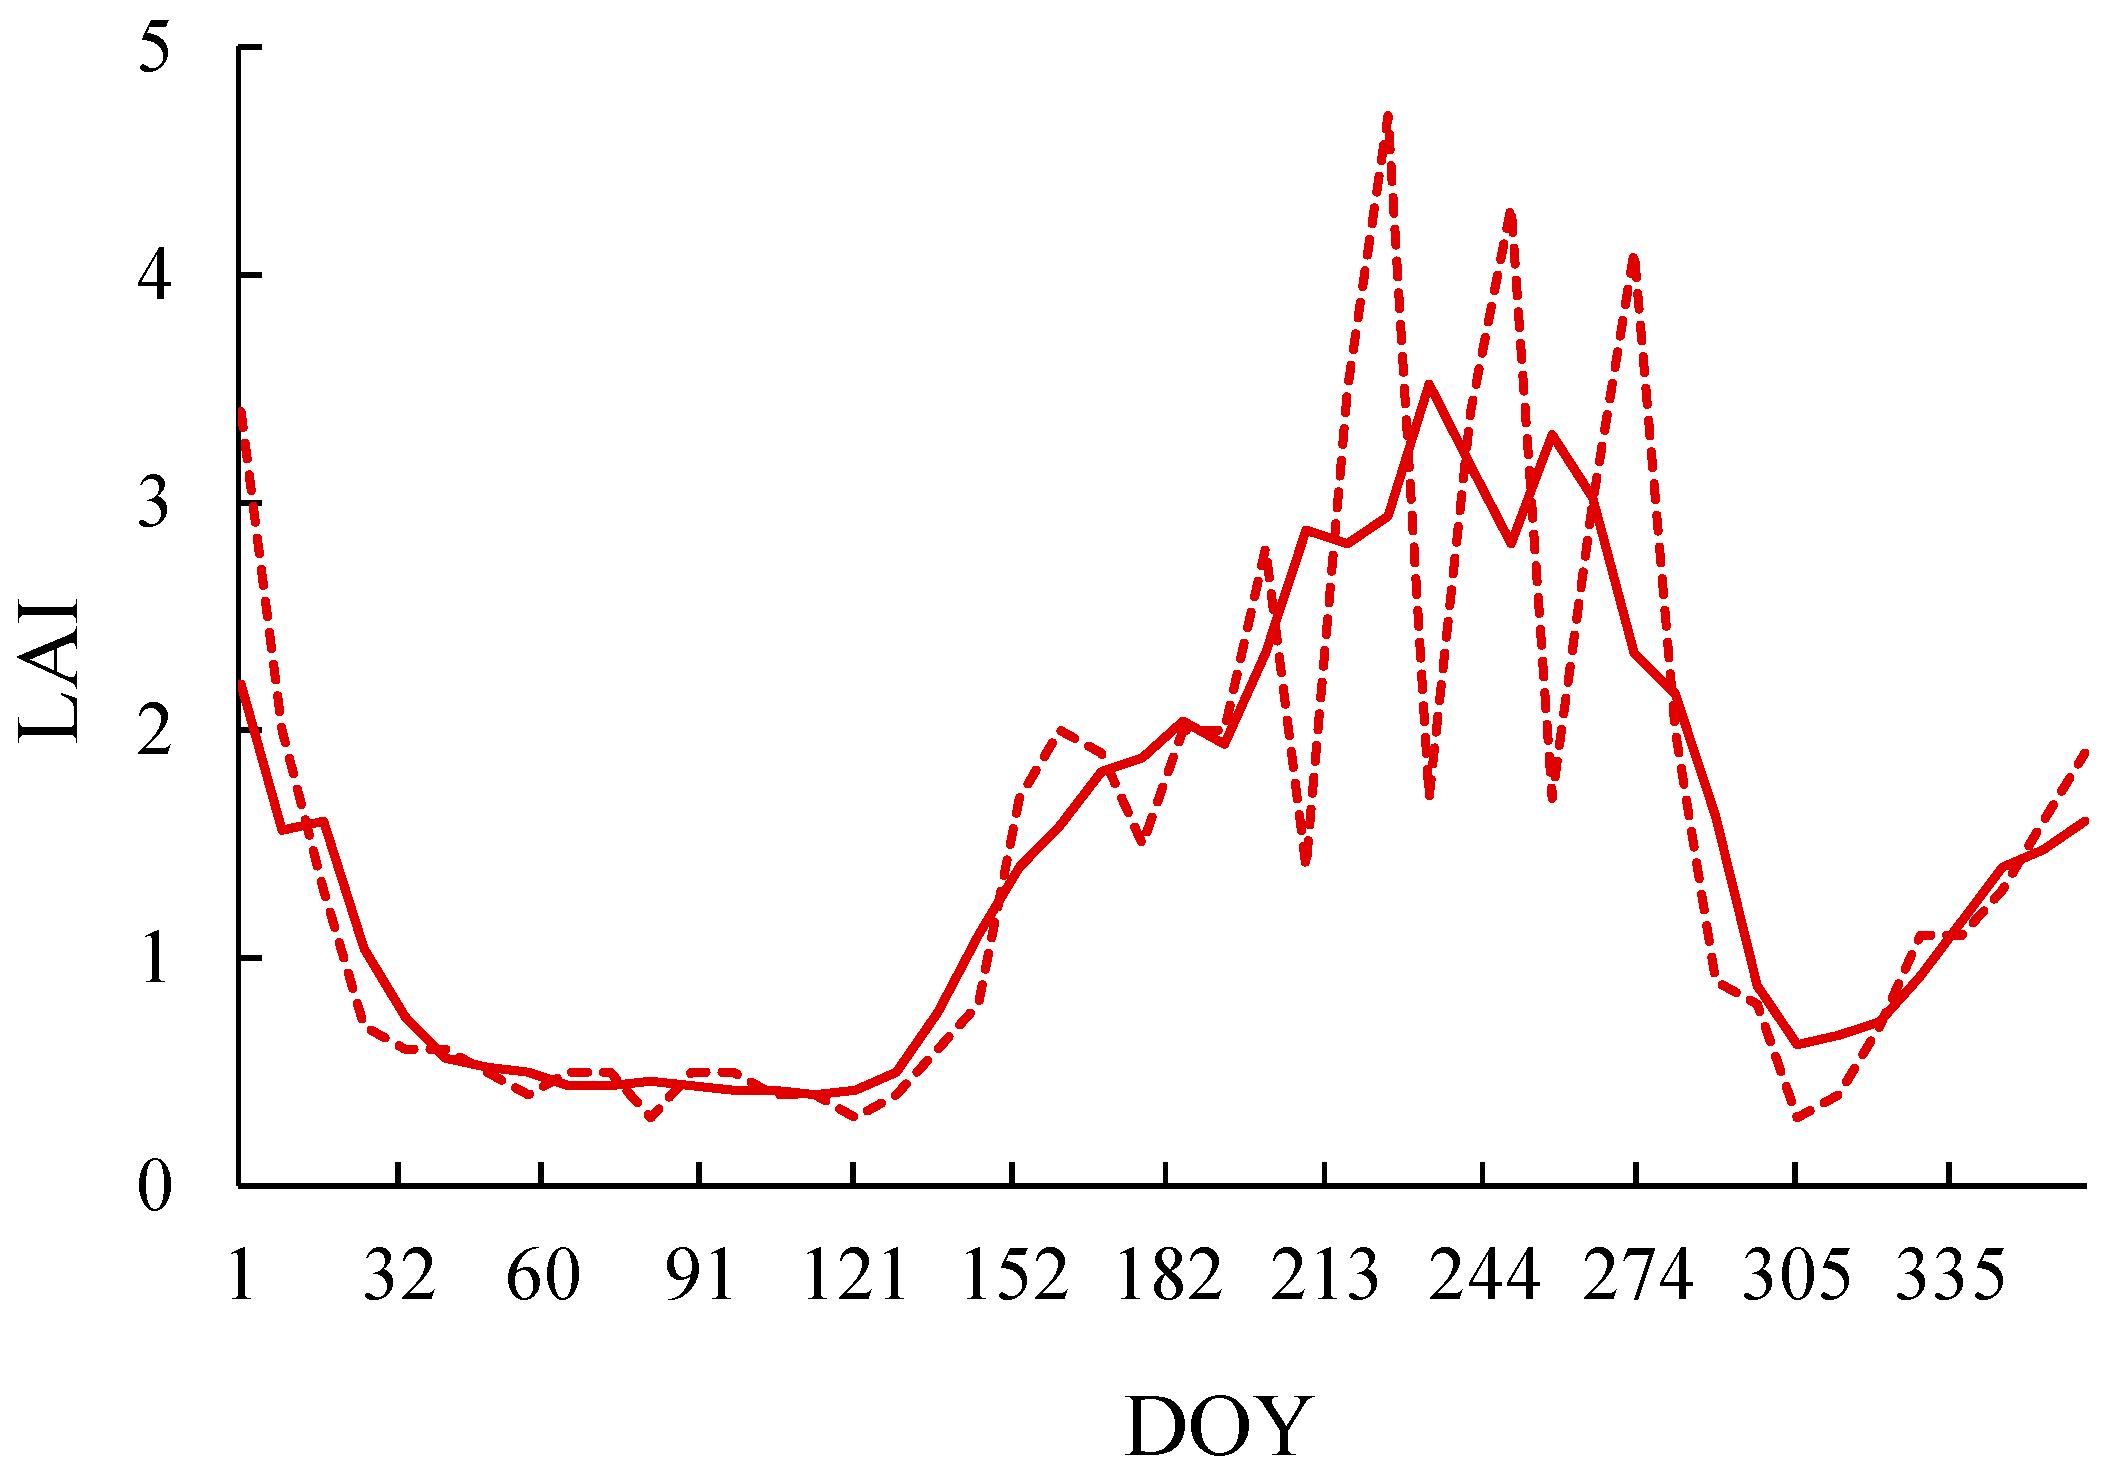
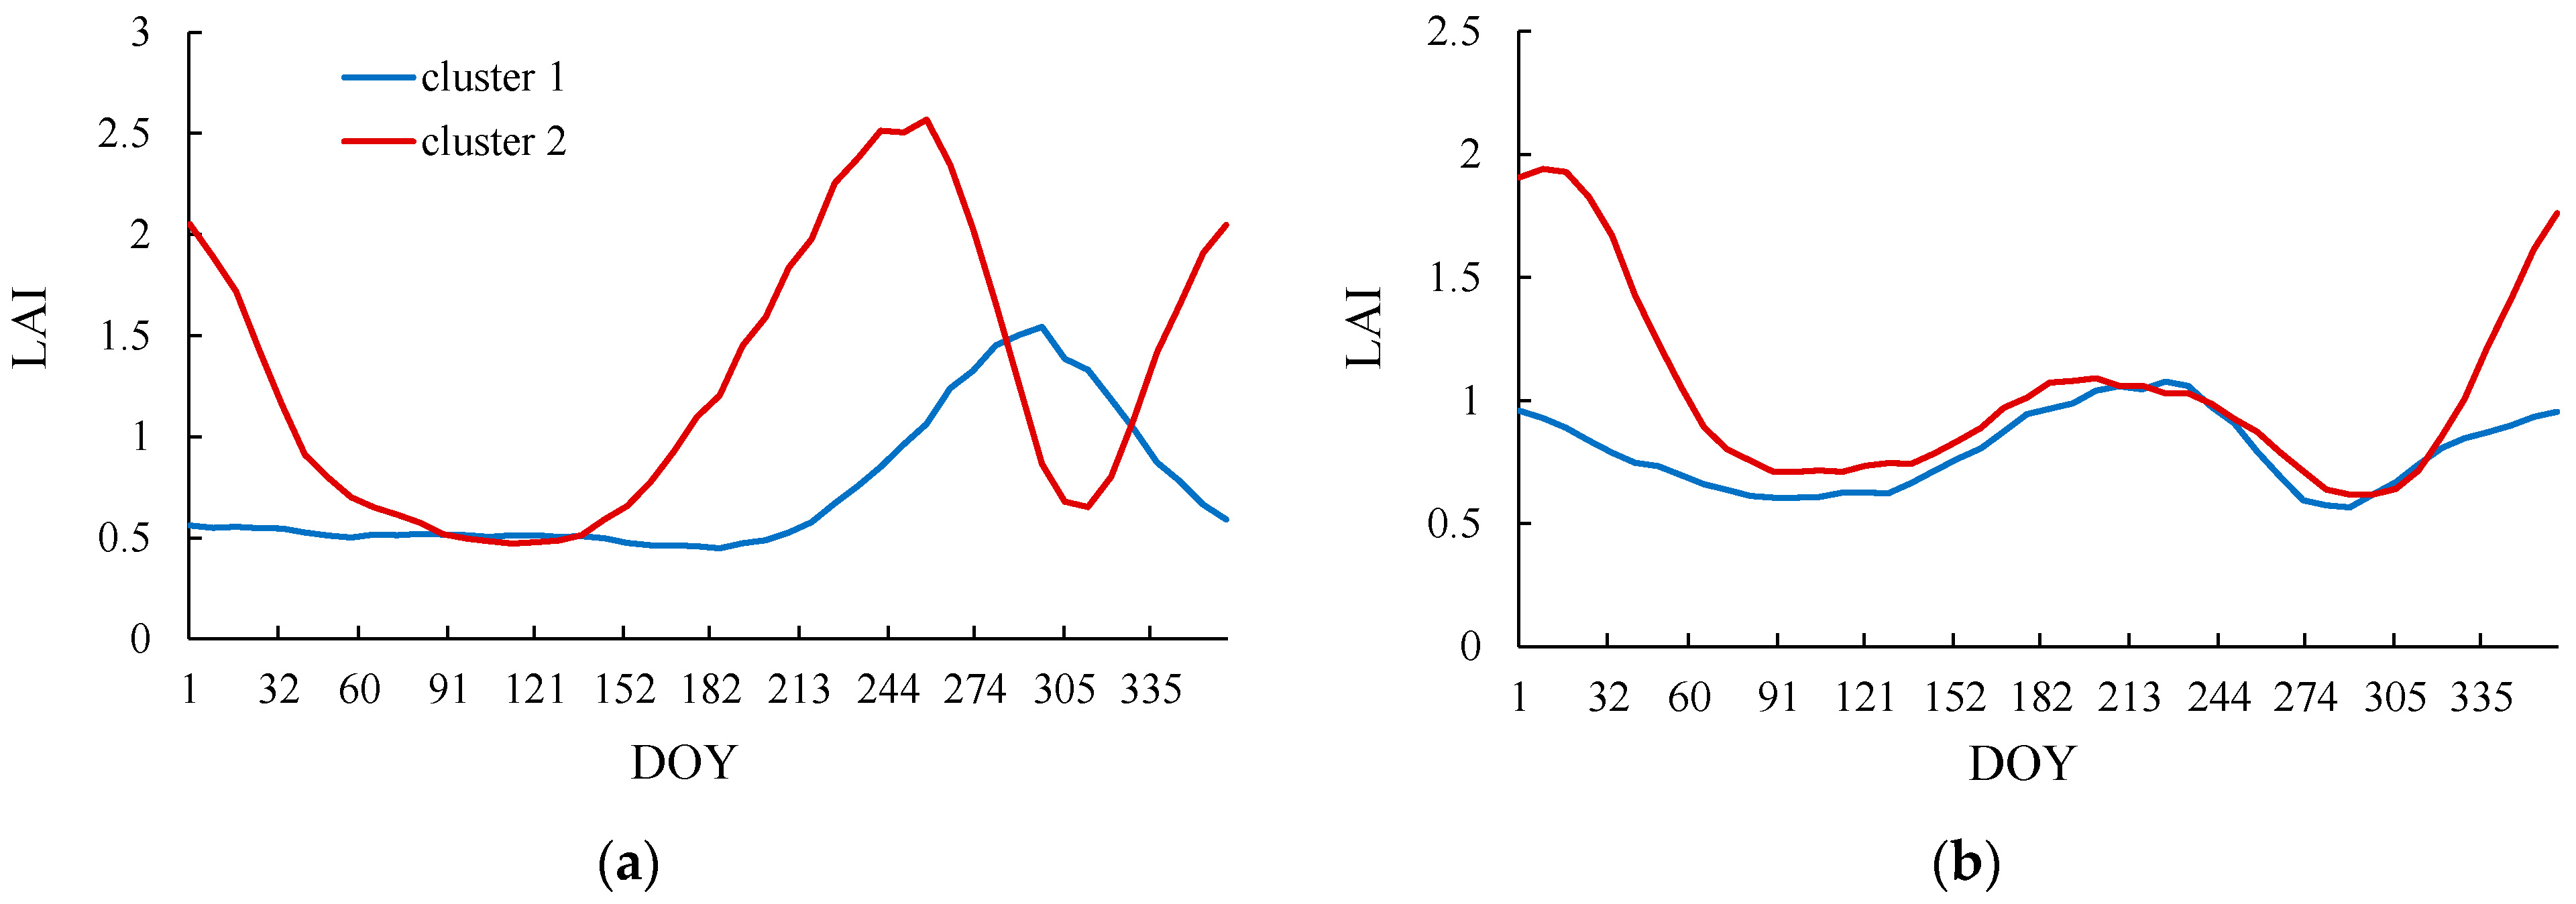
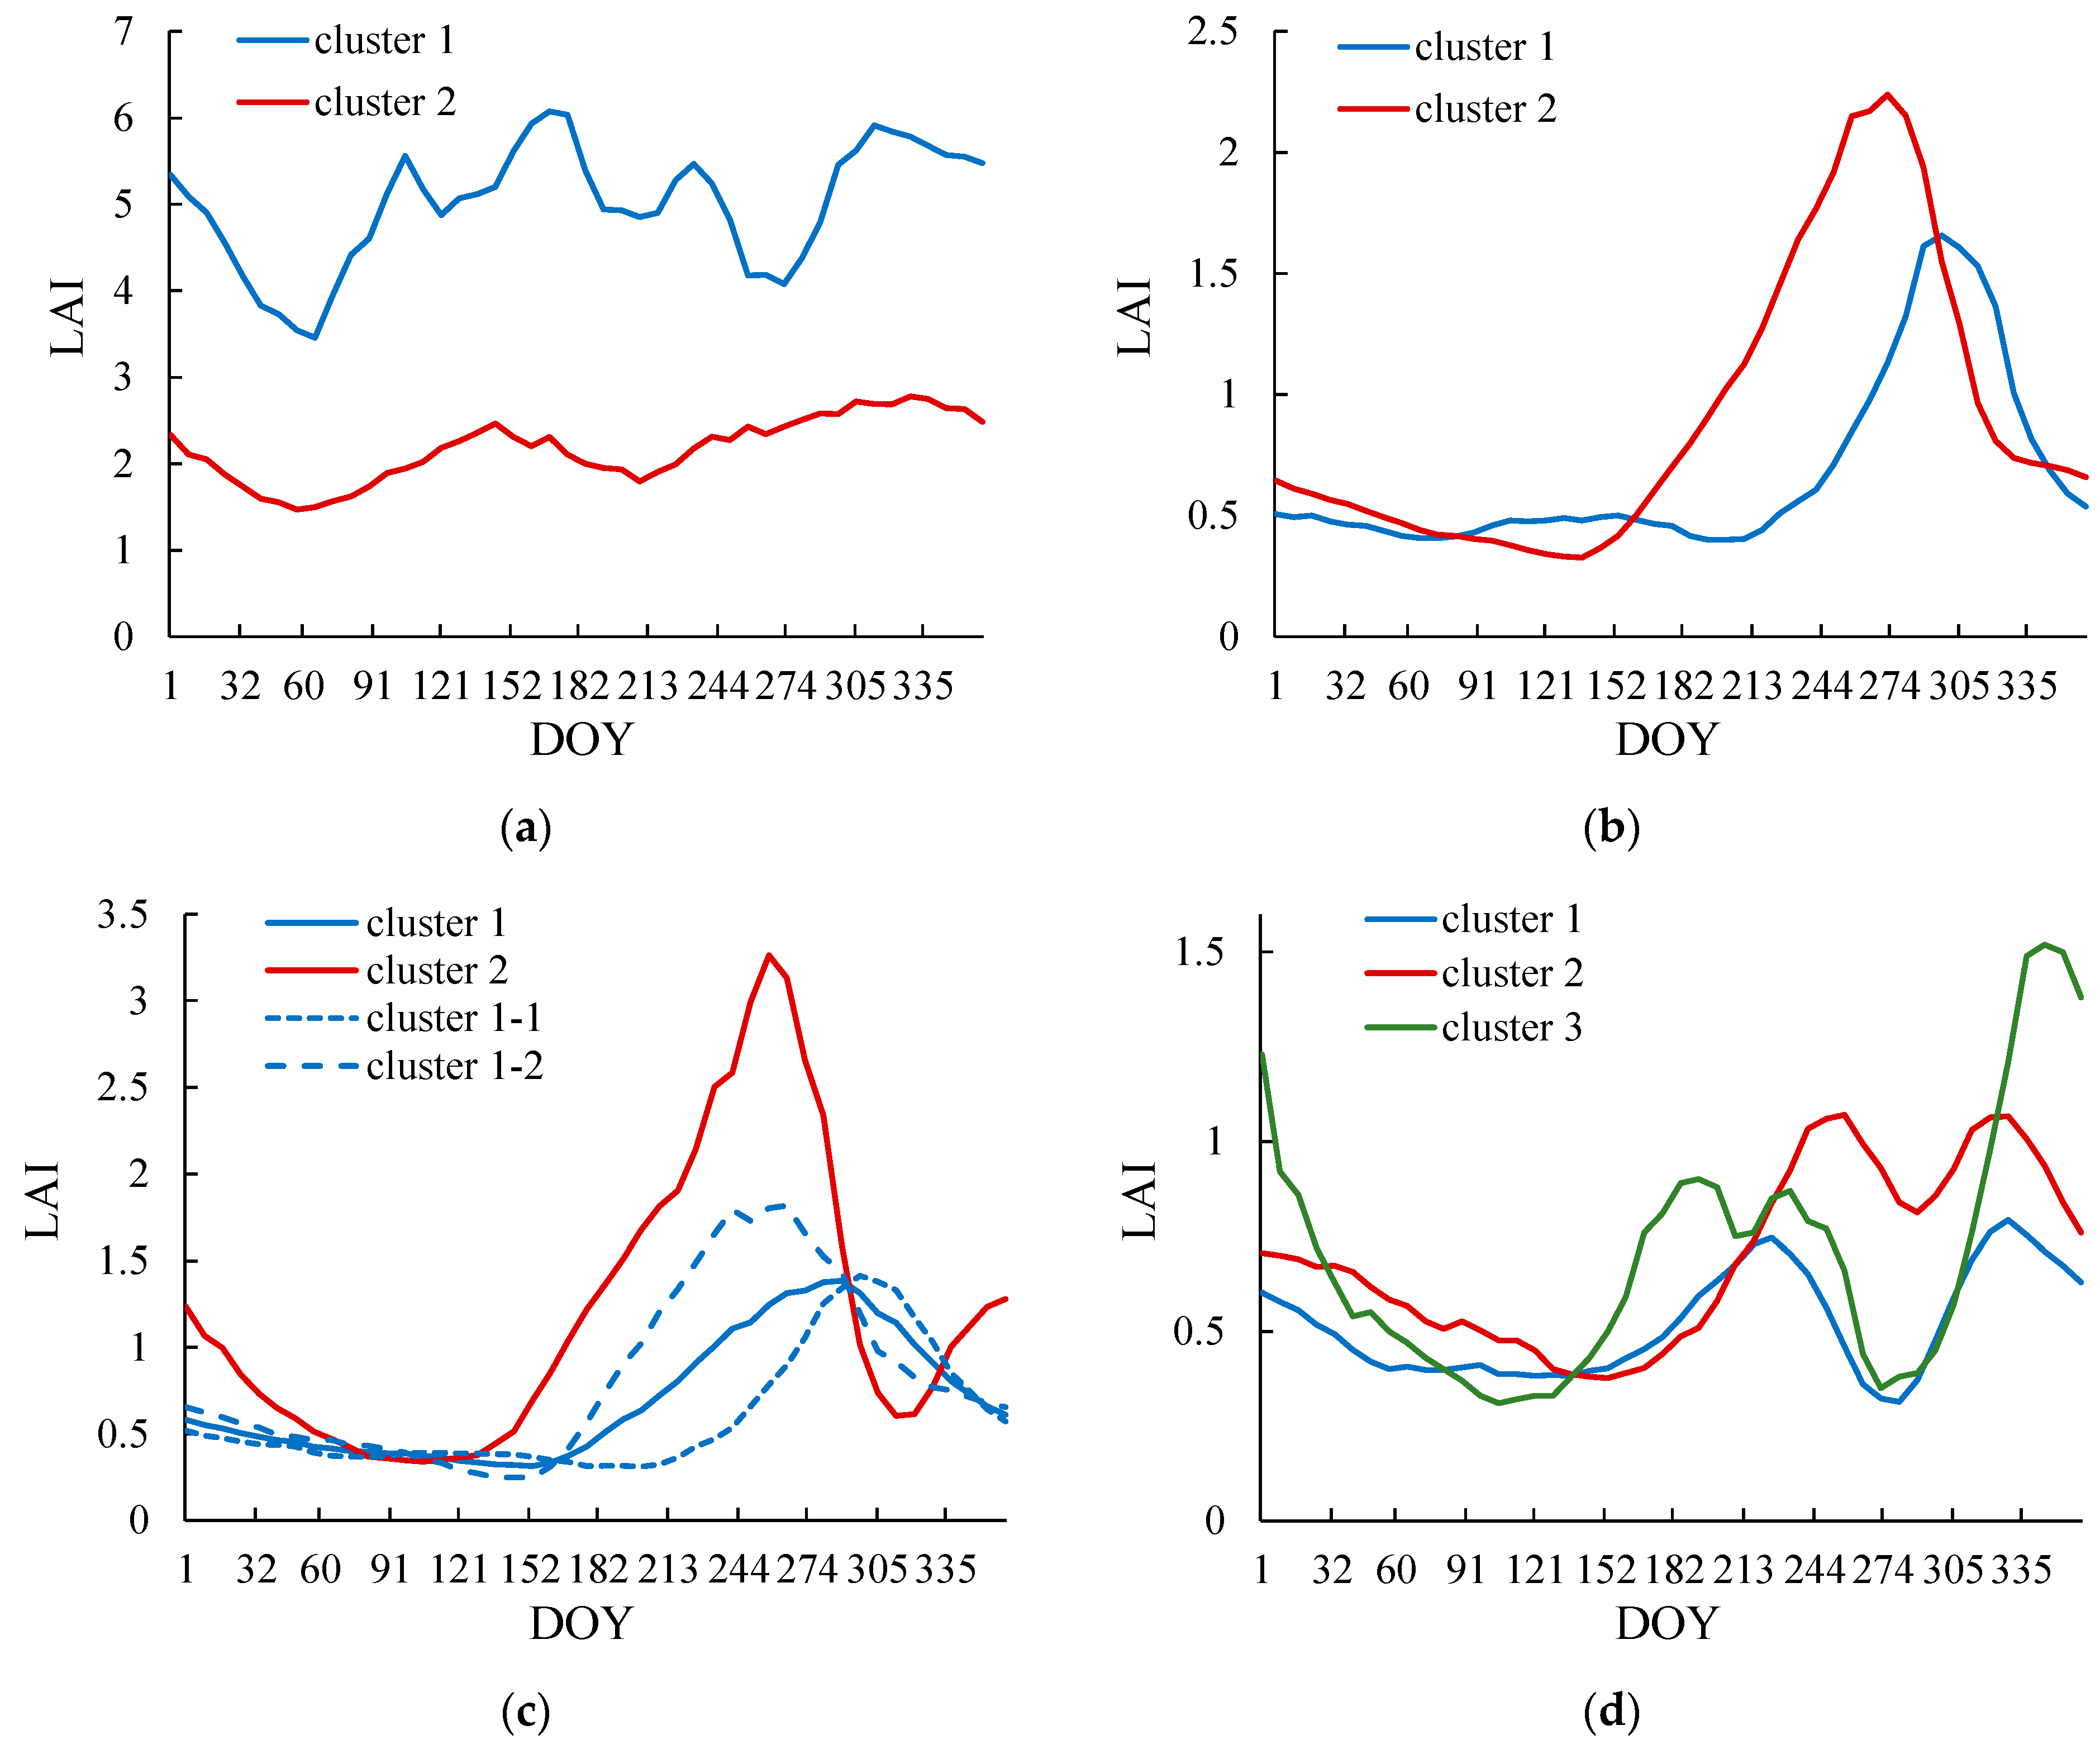
2.3.2. Point-Level Analysis

The LAI time series data were extracted for each single pixel corresponding to the 17 locations of the interviewed farmers with the Global Positioning System (GPS) coordinates. Each dataset had 17-year data points with a time series of 46 LAI values (8-day intervals) per year. Since three pairs of locations, TC2 and TC3, TC4 and TC5, and TC6 and TC7, are close to each other and included in one pixel respectively, a total of 14 datasets were obtained. Nine points were additionally selected on a transverse line from the mountainside to Tonle Sap Lake to clarify spatial variations in LAI (Figure 2). The time series LAI data were extracted for each single pixel of 9 points.
Hierarchical clustering was performed for each point of the interviewed farmers’ fields and the transverse line to evaluate temporal changes in LAI patterns during the period from 2003 to 2019. A clustering algorithm was applied to calculate the Euclidean distance between each yearly dataset of 46 data sequences (8-day intervals), and a dendrogram was created based on the Ward method. Two or three clusters were defined when the distance between the clusters was greater than the smallest distance between the yearly data on the bottom of the dendrogram. The annual transition of LAI was calculated by averaging the data of the same date in each cluster and is represented by a moving average of five data points (40 days).

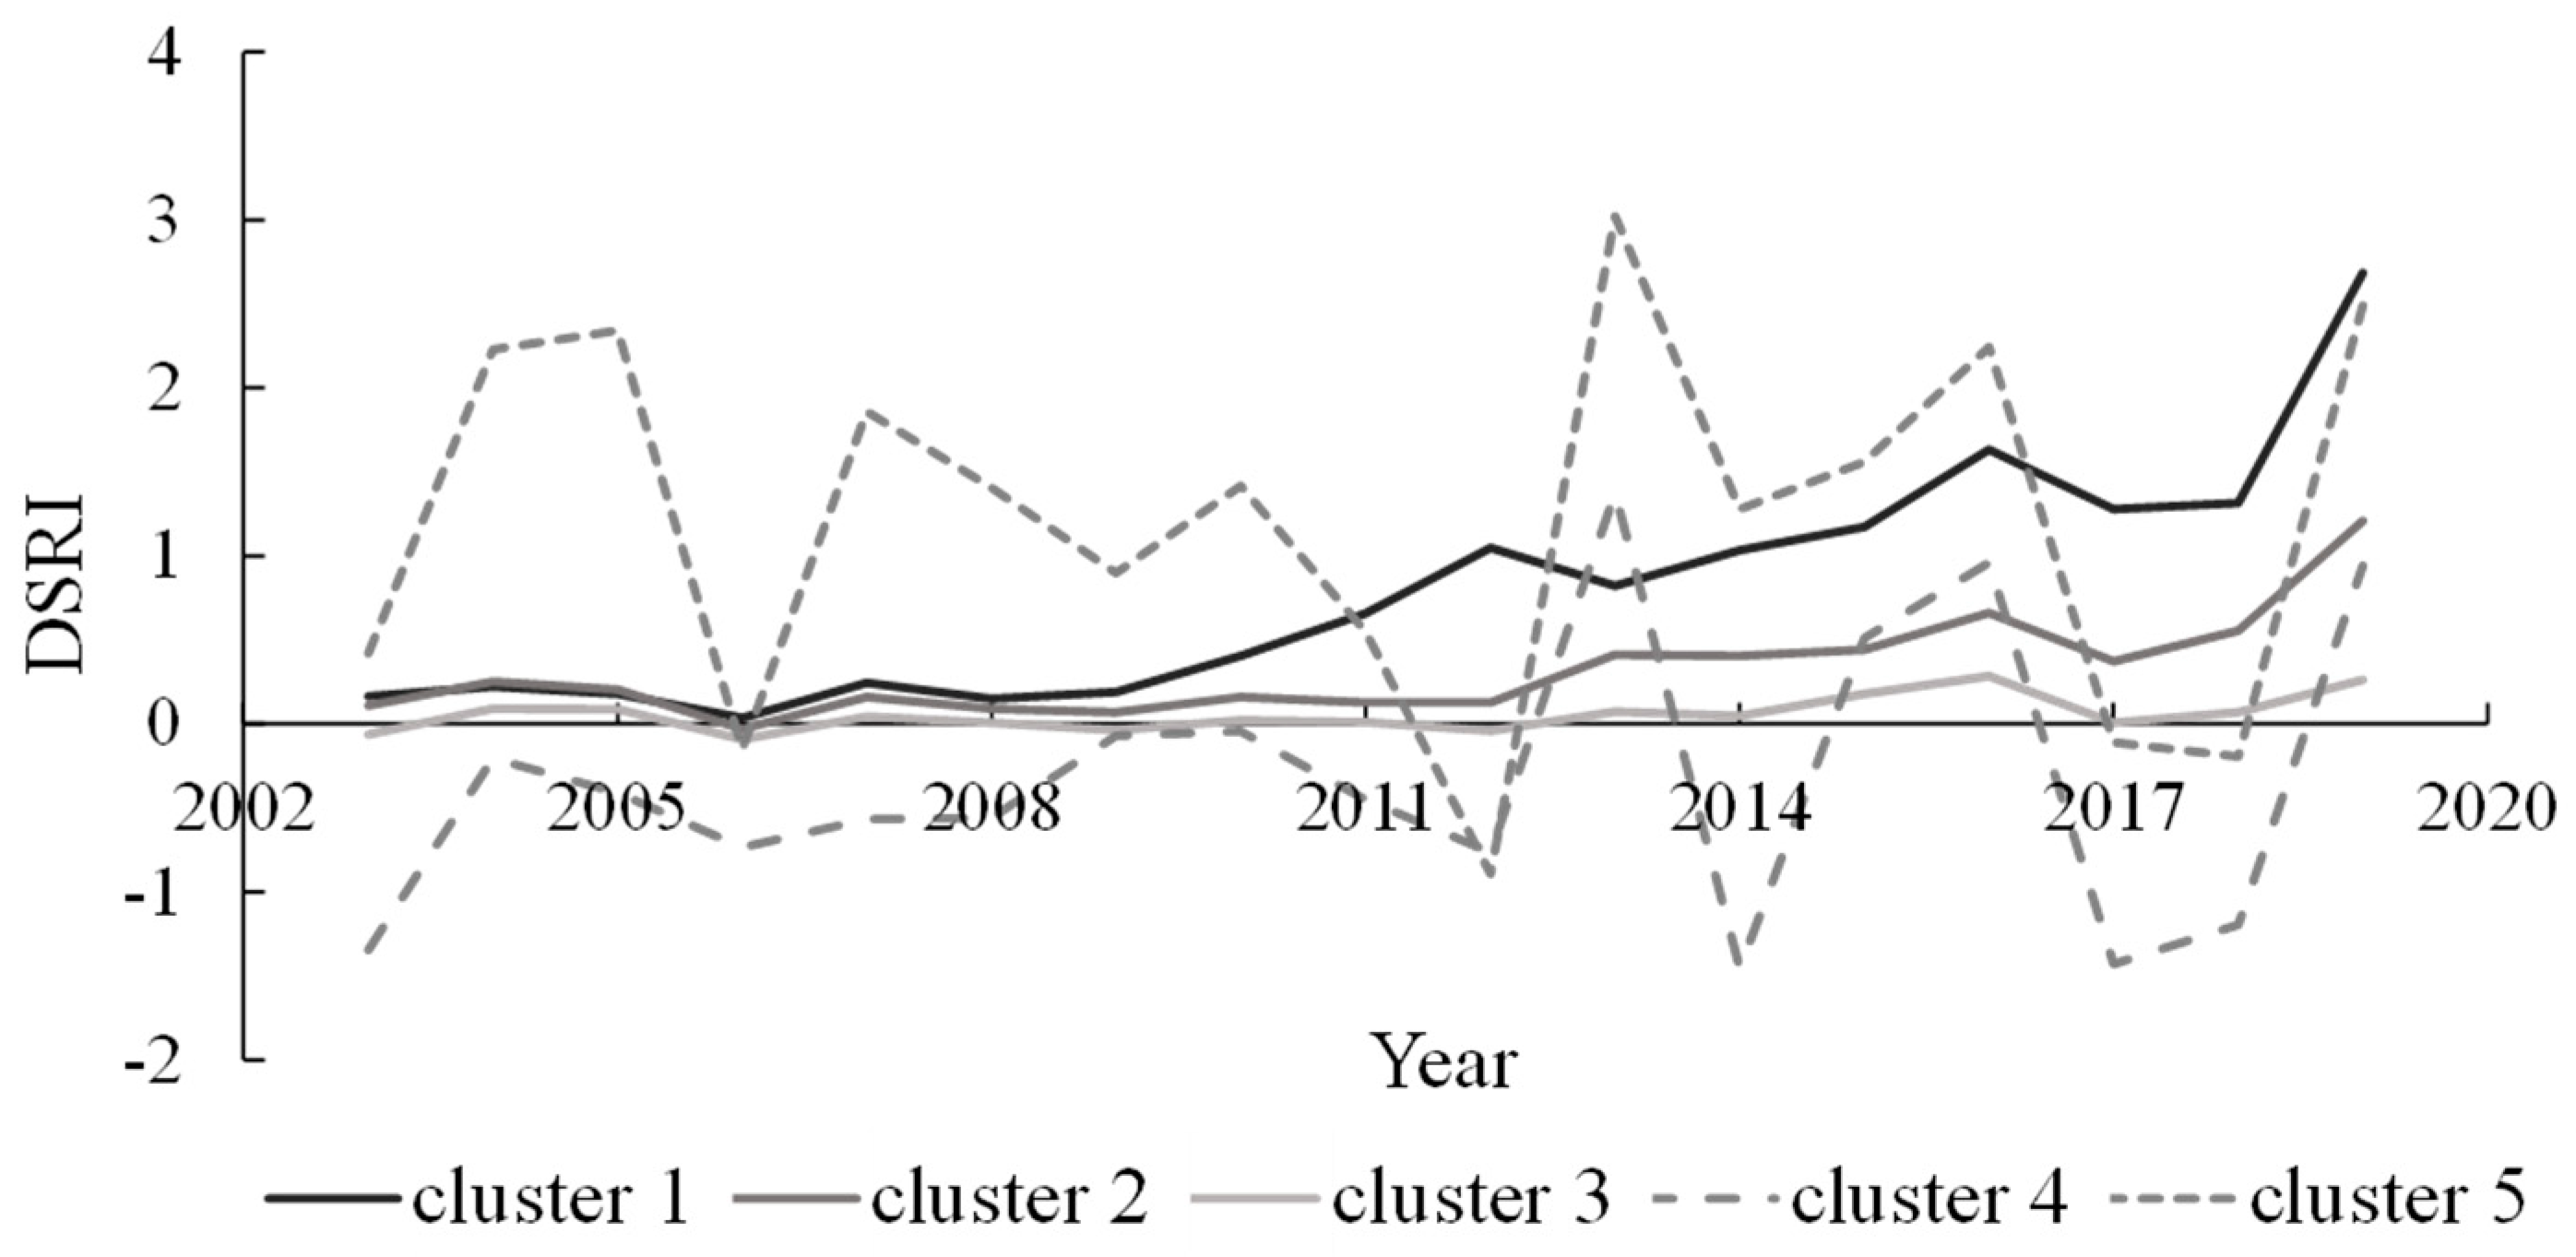
2.3.3. Analysis of Dry Season Rice

In addition to point-level analysis, the rectangular area shown in Figure 2 was analyzed to reveal the spread of the dry season rice’s cultivation. Bakan district was mainly covered in the area, and the surrounding districts were partially included. Two districts in Battambang Province near the boundary, the Moung Russei and Rukh Kiri districts, were also incorporated. The rectangle contained the Pursat River, Svay Doun Kaev River, Kambot River, Chambot River, Boeung Khnar canal, Damnak Ompil canal, Kbal Hong canal, and several streams and reservoirs. According to the results of the point-level analysis, LAI peaks occur mostly in January for the DS rice, and the lowest LAI is commonly observed in April. Therefore, DS cultivation could be estimated by the difference in the monthly average LAI between January and April, which was defined as the dry season rice index (DSRI) in this study. The data corresponded to days of the year (DOYs) 1, 9, 17, and 25 and DOYs 89, 97, 105, and 113 for January and April, respectively. The DSRI for each pixel was calculated during 2003–2019. Since the number of pixels were huge, k-means clustering, a nonhierarchical method for classifying pixels based on the DSRI value of each year, was conducted for the area. The number of clusters and iterations was set to 5 and 100, respectively. The pixels belonging to the clusters that showed an increasing trend in the DSRI were selected as areas of dry season cultivation. For the selected pixels, 782 LAI values (46 data sequences per year from 2003 to 2019) were extracted and the pixels were further classified into 5 clusters by k-means clustering based on the 782 successive values. After averaging the LAI values of each cluster at each time point and calculating the moving averages of 5 consecutive values, clusters that showed LAI patterns of rice cultivation were selected. The peak values of both the dry and wet season of the selected cluster were extracted to indicate changes in the peak values. In addition, the annual LAI transitions of the selected clusters were analyzed by hierarchical clustering to identify changes from 2003 to 2019.

2.4. Software

LAI data extraction from the MCD15A2H dataset and geographical presentation were performed using Quantum Geographic Information System (QGIS version 2.1.8) software. Hierarchical clustering and k-means clustering were performed using R (version 4.0.0, R development Core Team) and RStudio software (RStudio, PBC). The R functions and packages used in this study were the hclust and dist functions for hierarchical clustering and the k-means function for k-means clustering in the stats package.

3. Results

3.1. Changes in Rice Cultivation Management

3.1.1. Changes in the Fields of the Interviewed Farmers

Most interviewed farmers grew Somaly, which is a fragrant landrace with high quality and value (Table 1). It is a mixture of different but closely related cultivars [15]. Other common cultivars were Phka Rumduol, Sen Kra Ob, and Sen Pidao, which also produce fragrant rice [13,16]. Phka Rumduol and Riang Chey are photosensitive and have intermediate maturity traits, while Sen Kra Ob, Sen Pidao, and IR varieties are not photosensitive and mature in less than 120 days [13,15]. Another notable finding is that many of the farmers reduced the number of cultivars they grew, and Somaly accounted for a larger proportion as a result (Table 1 and Table 2). The cultivar shift occurred in approximately 2010 (Table 2). Since the non-photosensitive and early maturing cultivars can be grown in any season, the farmers were likely to grow them in the DS. Most farmers wanted to conduct double cropping, but its application was severely restricted by the availability of irrigation water. The farmers stated that the water source was insufficient in the DS even though their paddy fields accessed an irrigation channel.
Traditionally, transplanting was performed, but broadcasting has increased recently due to labor shortages [5]. As indicated in this paper, many of the farmers adopted broadcasting to save time and labor (Table 1). On the other hand, none of the farmers owned a harvester, and only one farmer had a tractor. The most common machinery among the farmers was a cultivator, which half of them purchased from 2005 to 2015 (Table 2). Chemical fertilizers have recently become common, while other chemicals, such as pesticides, insecticides, and herbicides, have not yet been used by some farmers.
As shown in Figure 4, the annual LAI transitions had some fluctuations in values due to effects of cloud, but they became smoothed by the moving average of 5 consecutive data values. Therefore, the moving average helped us to illustrate the annual LAI transitions clearly. The transitions in the fields of the interviewed farmers presented large variations among years, with one or two peaks per year (Figure 5). Hierarchical clustering showed that 17 years were divided in approximately 2010, although some exceptional years were observed (Table 2). At KT3, the transition of cluster 1 (before 2011) demonstrated a peak on DOY 297, while that of cluster 2 (after 2010) exhibited two peaks, on DOYs 1 and 257 (Figure 6a). The change from cluster 1 to cluster 2 indicated that the farmers shifted to earlier-maturing cultivars. The larger LAI in cluster 2 may reflect the increase in rice productivity. In addition, another peak that overlapped the end of the year and the beginning of the next year appeared in cluster 2, which suggests DS rice cropping. A similar pattern was observed at KT2 and KT4. The transition at SDK had two peaks, DOY 5 (during the DS) and approximately DOY 197 (during the WS) in both clusters 1 and 2 (Figure 5b and Figure 6b); the peak of cluster 2 in the DS reached approximately double that of the WS, although no significant change in the WS was observed. At TC8, TC9, and KT1, no clusters were obtained because the proportion of paddy fields was relatively low in the pixels (Figure 7).

3.1.2. Changes at Points on the Transverse Line

Geographic variations in the annual LAI transitions and their changes were observed on the transverse line. P8 and P9 (Figure S1), which had different patterns from other sites during most of the year, probably represented a non-crop vegetation type (Figure 8a). Additionally, P1 exhibited a different annual LAI transition, with quite high values in cluster 1 (2003–2006), suggesting that P1 was a forested area. However, the LAI of cluster 2 (2007–2019) declined drastically, indicating deforestation and a land use change in approximately 2007 (Figure 9a). From P2 to P7, the annual LAI transitions showed similar patterns, with one or two peaks in a year, as those shown in the fields of the interviewed farmers. Hierarchical clustering tended to classify consecutive years into the same clusters, except P6 (Figure 8b and Table 3).
Two clusters were obtained at P5 (Table 3), and the differences in the annual LAI transition between them were similar to those found in the fields of interviewed farmers, such as TK3 (Figure 9c). Another finding of note is that cluster 1 could be divided into two subclusters: 2003–2006, 2008, and 2010 (cluster 1-1) and 2007, 2009, and 2011–2013 (cluster 1-2). The change between cluster 1-1 and cluster 1-2 was characterized by the movement of the peak from DOY 297 to DOY 265. Since the timing of the peak of cluster 1–2 was similar to that of cluster 2, a change in cultivar may have occurred in approximately 2010, followed by an increase in the peak value after 2013 (Figure 9c). These trends were also observed at P2, P3, and P4; however, no peak in the DS was recognized at these sites (Figure 9b).
A different annual LAI transition pattern was observed at P7 (Figure 9d). The short period between the peaks on DOY 257 and DOY 329 in cluster 2 may indicate single cropping with a temporary decrease in LAI due to flooding rather than double cropping. The location of P7, which is flood prone, may support this assumption. Similar findings were observed for cluster 1, for which both peak values were low and the period between them was longer than that for cluster 2. The peaks on DOY 193 and DOY 233 in cluster 3 may also correspond to single cropping. The periods between the two peaks were 104, 72, and 40 days in cluster 1, 2, and 3, respectively. The decrease in this period indicates some improvement in the drainage system, which mitigated flood damage. The larger peak of LAI on DOY 345 in cluster 3 suggests that farmers started DS rice cropping in 2018.

3.2. Dry Season Rice Cropping

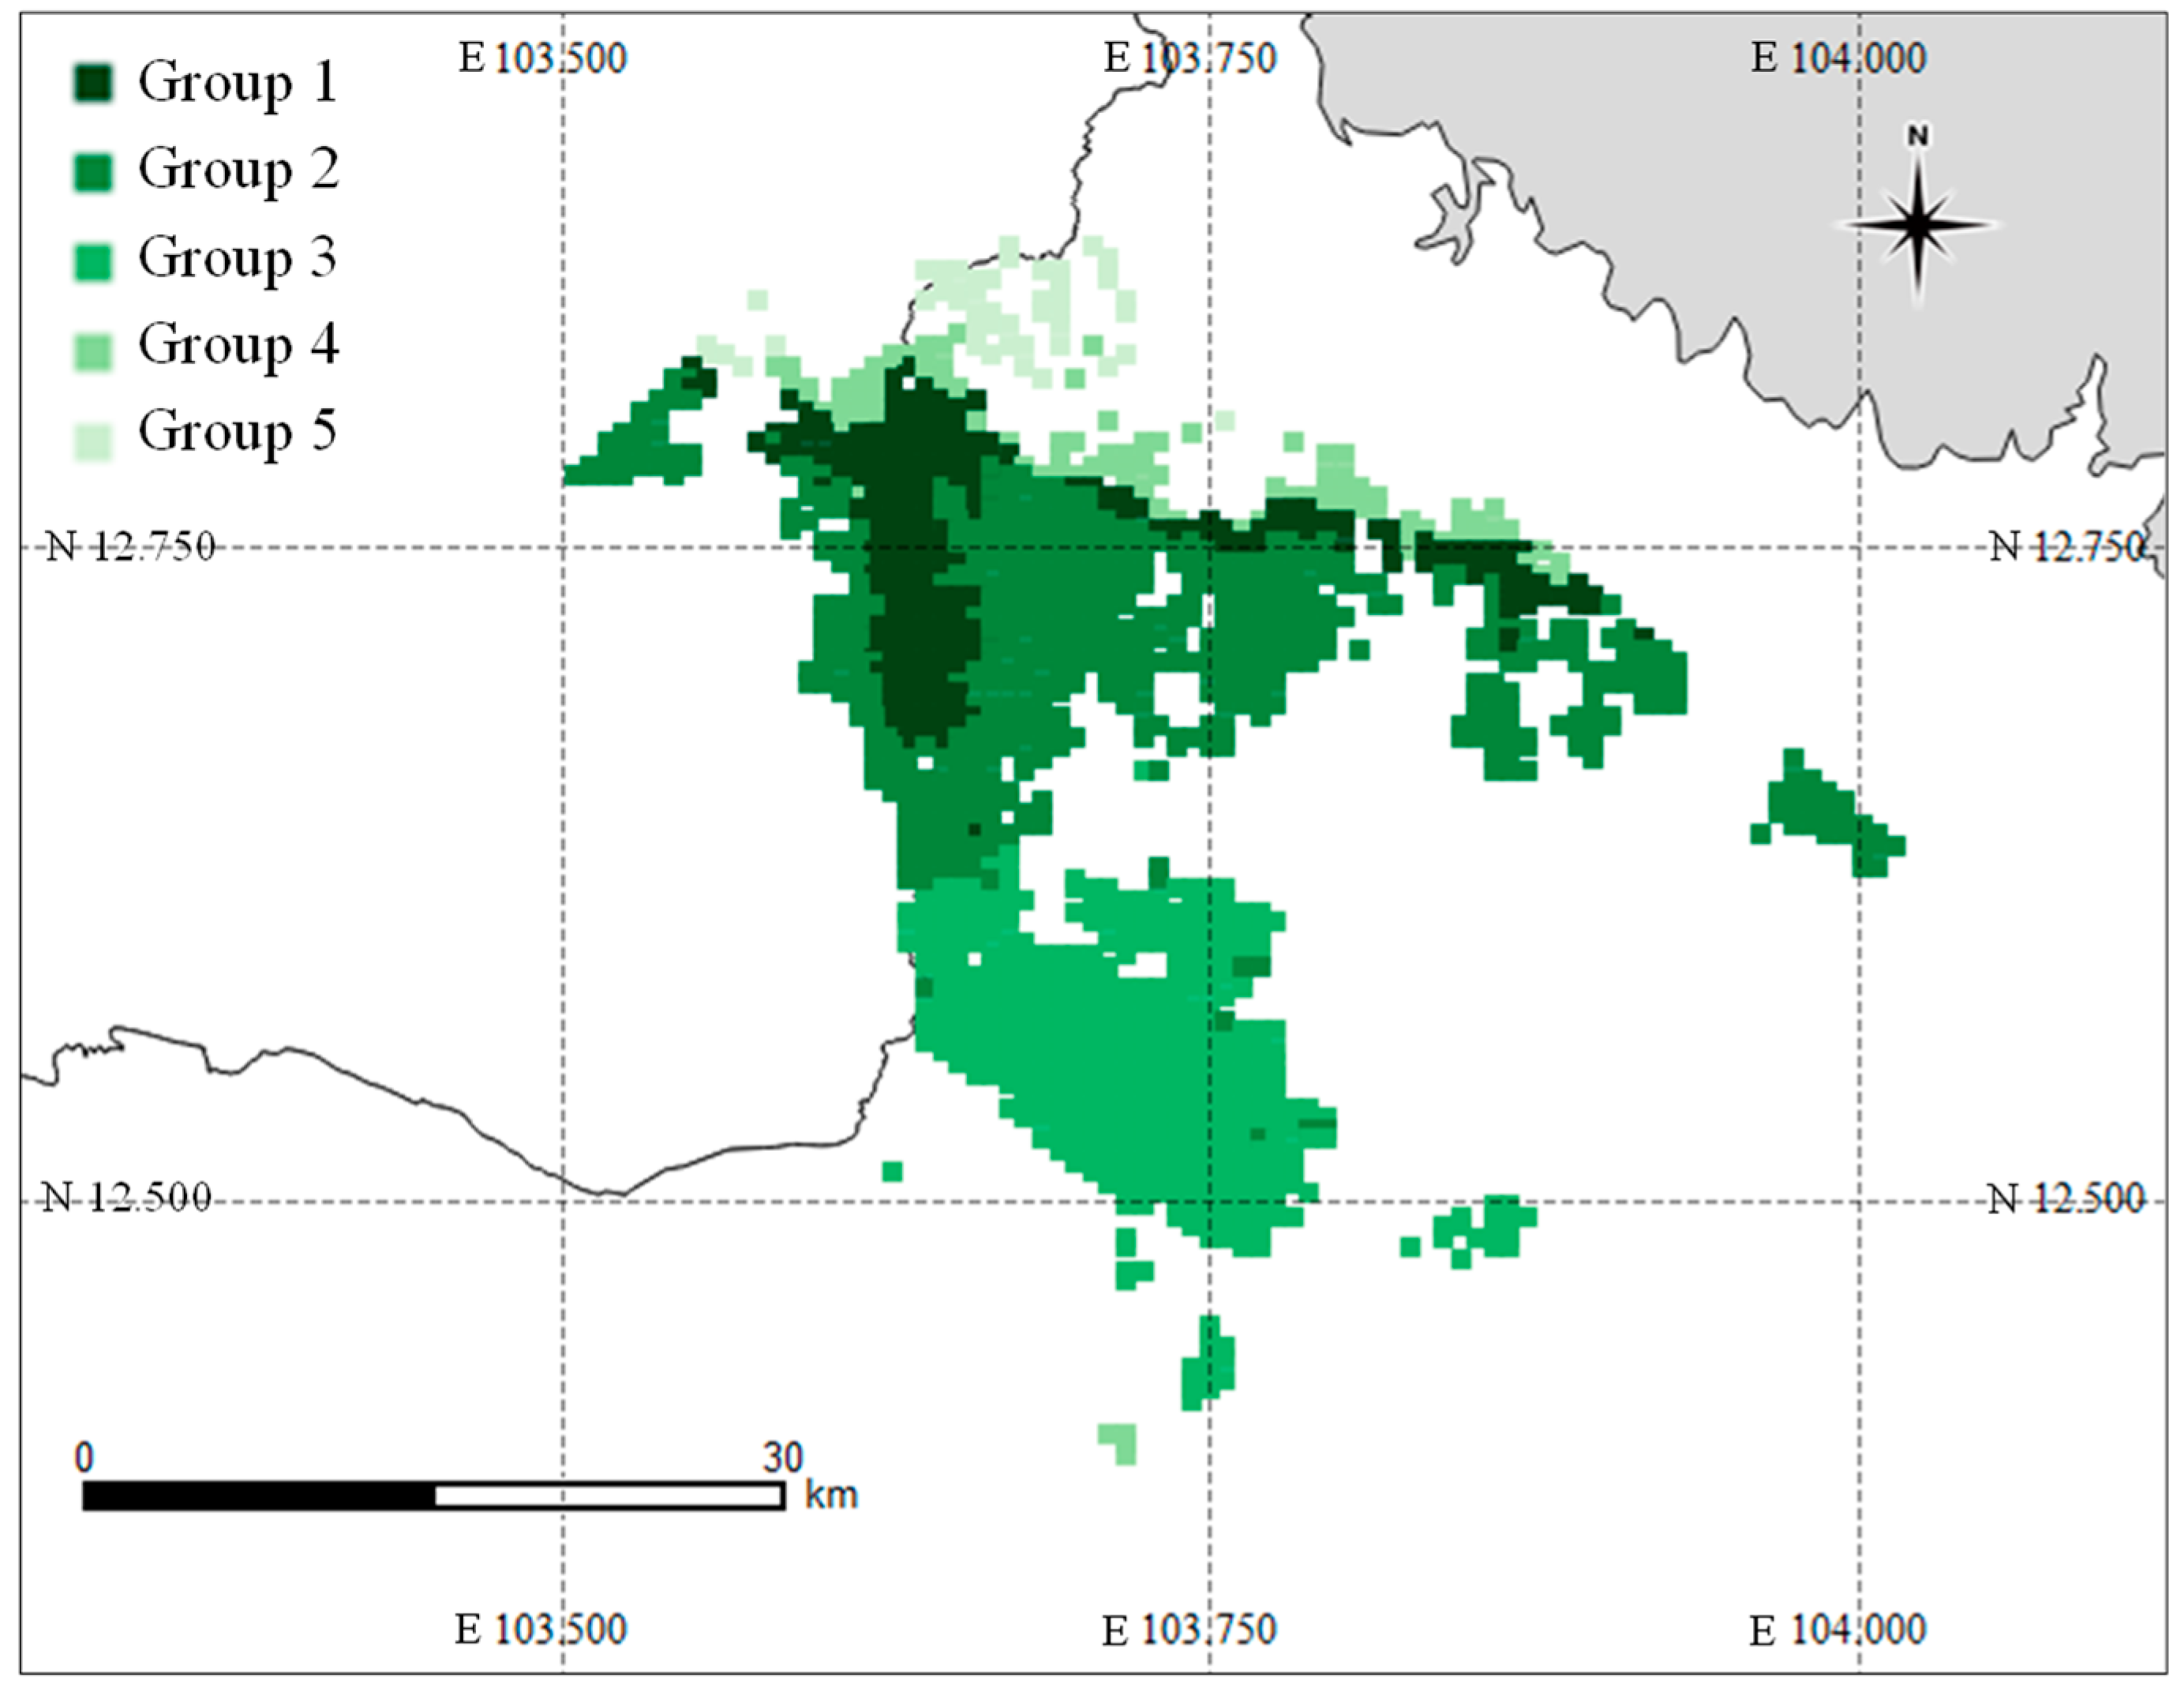
3.2.1. Detecting the Area of Dry Season Rice Cropping

Changes in the DSRI were obviously different among clusters obtained in the k-means clustering (Figure 10). The geographical distribution of clusters is shown in Figure 11. Cluster 1 (C1) was mostly distributed around the Svay Don Kev River and Damnak Ompil irrigation canal and exhibited an apparent increase in the DSRI beginning in 2010. Cluster 2 (C2) was largely observed in the area surrounding C1 and showed a gradual increase in the DSRI; however, the increase in the DSRI in C2 was smaller and occurred later than in C1. Cluster 5 (C5) was predominant in the area nearest to the lake and showed a large fluctuation in the DSRI. Cluster 4 was found in the area close to C5, and the DSRI of C4 was consistent with that of C5. The remaining area belonged to Cluster 3 (C3), with only a slight increase in the DSRI of the LAI beginning in approximately 2013. C1 and C2 showed constantly increasing tendencies. SDK, a field belonging to interviewed farmers, was included in C1, while P5, which was on the transverse line, belonged to C2. KT2, KT3, and KT4 were at the border between C1 and C2. P7, TC1, BK, and Ru were at the boundary between C2 and C3. The LAI pattern of the rice was identified or estimated at these locations as mentioned above. The areas included in C1 and C2 were provided for further analysis.

3.2.2. Types of and Changes in Rice Cropping

The 1724 pixels included in C1 and C2 were further divided into five groups by k-means clustering based on 17 years of LAI data. The geographic distribution of the groups is shown in Figure 12. Group 1 (G1) was mainly distributed along a border between the Svay Doun Kaev commune in Bakan district, Pursat Province and Ruessei Krang in Moung Ruessei district, Battambang Province. In addition, the Ou Ta Paong commune was included in G1. Group 2 (G2) was the surrounding area of G1, and Group 3 (G3) was across the Rumlech, Khnar Totueng, and Trapeang chorng communes in Bakan district. G1 was located along the Svay Doun Kaev River and Svay Don Dev River. Regarding the location of the fields belonging to the interviewed farmers, SDK was in the area of G1, while Ru, BK, TC1, KT1, KT2, KT3, and KT4 were included in G3. Additionally, P5, located on a transverse line, was encompassed by G3. Group 4 (G4) and Group 5 (G5) consisted of limited areas near the lake. The annual transition of the average LAI of G5 was mostly between 3 and 6, indicating that this group probably represented forest vegetation. In addition, the area of G4 possibly consisted of forest or grassland because the LAI values of G4 were greater than 1 throughout the years (Figure not shown). Consequently, the values of G1, G2, and G3 were characterized as rice cultivation (Figure 13a–c). A significant decrease in the value of all groups except for G3 in late 2011 might have been caused by floods, as reported in Kamoshita and Ouk (2015) [17].
The annual LAI transition in G1 featured double peaks beginning in 2003, while that in G2 and G3 featured a single peak by 2011 (Figure 13 and Figure 14). In other words, DS cropping has probably been conducted in the area of G1 since 2003 and might have started in G2 and G3 in approximately 2011. Since the area of G1 mainly surrounded the Svay Doun Kaev and Svay Doun Dev Rivers, double cropping was the predominant practice from an earlier year due to water accessibility. Water availability might be improved in G2 and G3 by constructing or repairing irrigation channels. Similar tendencies in G1 and G3 were observed in SDK and P5, respectively.
Hierarchical analysis was conducted on the annual LAI transitions of G1, G2, and G3. The results reveal that the transitions changed from approximately 2011 or 2012 in these groups. In particular, the trends of the WS and DS rice were different among the three groups (Figure 14); the peak value of the WS rice did not differ significantly in G1 or G2, while an increasing tendency for DS rice was observed beginning in 2011 in G1, possibly followed by G2 beginning in 2015 or later. On the other hand, the peak LAI of the WS rice gradually increased from approximately 2011 in G3. That is, while DS rice was predominant in G1 and G2, WS rice remained prevalent in G3 even though DS rice was introduced.

4. Discussion

The MODIS LAI data had some fluctuations in values because of clouds; however, the fluctuations became smoothed by the moving average of five consecutive values. In addition, MODIS data are affected by the mixture of components, such as houses and roads, because of their resolution. For example, some LAI values obtained in this study were relatively low compared with those measured directly in the farmers’ fields [18]. Furthermore, changes in LAI values were difficult to quantify in pixels, which had low proportions of paddy fields. Thus, there are limitations associated with using MODIS data to analyze the crop growth in a field or at a specific time point. This study quantified long-term regional changes in rice production by clustering and averaging the LAI values. The results reveal some significant patterns of shifts in the annual transition of LAI; for example, the peak moved from November to September, the peak value increased by at most twice, and the cultivation of DS rice was implemented. These changes seemed to occur from the late 2000s to the early 2010s and can probably be attributed to the introduction of cultivars with traits related to earlier maturity and increasing the use of chemical fertilizers [19]. Additionally, the interview survey supported the results by confirming that changes in cultivars had been made in approximately 2010. These significant changes possibly reflect the socioeconomic development and transformation from subsistence to commercial agriculture that began in the late 2000s, which included access to new cultivars and agrochemicals and the use of irrigation water [5]. Some later years were grouped into the earlier cluster and some earlier years were grouped into the later cluster due to the yearly variation in planting time and rice growth, which might be affected by the timing of rain and the availability of water. In addition, each pixel might contain several paddy fields with temporal variations and different growth characteristics in rice cultivation.
Geographic variations in rice production and their changes were observed on the transverse line. The results suggest that earlier-maturing cultivars have become common in the WS at P2, P3, P4, P5, and P6, while double cropping may have been implemented only at P5. Furthermore, the risk of flood damage in the WS was indicated at P7, and farmers might adopt countermeasures to flooding, such as growing earlier-maturing cultivars or cultivating DS rice.
The area-level analysis revealed three types of double cropping areas. First, at G3, where irrigation channels were constructed or repaired, DS cropping began in approximately 2011. For example, the Japan International Cooperation Agency (JICA) implemented a project to construct irrigation channels from 2009 to 2014 in this area [20,21]. The results indicate that the production of DS rice increased slightly, while that of WS rice improved from 2011 to 2015. Second, in G1 (a riverside area), double cropping consisting of early WS rice and DS rice began earlier than 2003. The interview survey revealed that only the farmers in this area grew an early fragrant cultivar in the WS and sowed DS rice in September, earlier than in the other areas. Cropping seems to be an adaptation to floods in the WS and the utilization of river water in the DS. The production of DS rice improved in 2011, while that of WS rice was almost constant. These results also suggest that the improvement of WS rice production in the area is restricted by the flood risk. Finally, G2 was identified as a location where rice growth in both the WS and the DS was more unstable than in other areas due to floods or poor water availability. Farmers sometimes suffered from floods in the late WS (i.e., in September and October) and from water shortages in the DS.
This study quantitatively reveals the improvement in rice production in the WS and DS. Although irrigation influenced this improvement, the effect was somewhat limited in the WS and, at times, only apparent in the DS. Furthermore, most interviewed farmers mentioned that there was insufficient irrigation water. Climate change may affect the amount of available water in both seasons by increasing intensive rain patterns and drought [22]. The Cambodian government promoted the development of irrigation canals [8], but the risk of competition for water will arise if water resources are not evaluated correctly. In addition, many farmers require a pump for irrigation, which leads to costs associated with owning or renting the pump and fuel [23]. This is likely another major constraint on rice production. Additionally, labor shortages have become more serious in recent years due to migration to urban areas, forcing farmers to adopt broadcasting methods rather than transplanting [16]. The yield of broadcasted rice tends to be lower than that of transplanted rice [18]. This kind of partially extensive cropping might be one of the factors limiting rice production due to inadequate cultivation management (e.g., herbicides and hand weeding). Another expectation is the stagnation of improvement. The results indicate that a major change occurred in approximately 2011; however, no obvious change has occurred since then. The peak LAI value also shows that the improvement became almost stagnant in approximately 2015. Thus, the development of crop and pest management strategies is recommended for the further improvement of rice production [24]. Adaptive techniques, such as water-saving irrigation, will also be required to enhance crop productivity and increase grain yield considering future extreme climate events and competition for water resources [25].

5. Conclusions

In this study, LAI data from MODIS were used to analyze rice production changes from 2003 to 2019. The data had some fluctuations or outliers; however, clustering and averaging processes can be used as powerful tools to quantify crop growth changes at broader temporal and spatial scales. This method provides a novel utilization of the consecutive MODIS LAI data obtained every 8 days since 2003. This result implies that a group of small-sized paddy fields can be analyzed. This method will be helpful in quantifying crop growth changes in other countries and regions.
The WS rice productivity improved due to changes in cultivars and fertilization, and double cropping was implemented in some areas. However, the stagnation of the improvement of rice production and the limitation of water resources are expected. Since detailed statistical data and field investigation data are quite limited in Cambodia, the analysis of MODIS LAI data is an effective method for classifying the area and characterizing the changes in and constraints on rice production. The information obtained by this analysis will contribute to developing strategies that meet the requirements for further improvement in each area.

Supplementary Materials

The following are available online at https://0-www-mdpi-com.brum.beds.ac.uk/article/10.3390/rs13101971/s1, Figure S1, Annual LAI transitions for each year at P8 and P9.

Author Contributions

Conceptualization, K.H.; Data curation, R.Y.; Formal analysis, Y.I.; Investigation, S.K., K.Y., S.H. and K.S.; Supervision, K.H.; Validation, S.K. and K.Y.; Writing—original draft, Y.I.; Writing—review & editing, K.H. All authors have read and agreed to the published version of the manuscript.

Funding

This work was partly supported by JSPS KAKENHI, Grant Numbers 15H05144, 19H00559 and 19H03069.

Institutional Review Board Statement

Not applicable.

Informed Consent Statement

Not applicable.

Data Availability Statement

Publicly available datasets were analyzed in this study. This data can be found here: [https://search.earthdata.nasa.gov/, accessed on 12 April 2021]. The interviewed data is available on request from the corresponding author.

Acknowledgments

We are grateful to the students of the Royal University of Agriculture for helping us interview the local farmers.

Conflicts of Interest

The authors declare no conflict of interest.

Abbreviations

The following abbreviations are used in this manuscript.
DSDry season
DSRIDry season rice index
EVIEnhanced Vegetation Index
FPARFraction of photosynthetically active radiation
GPSGlobal Positioning Systems
LAILeaf area index
MODISModerate resolution imaging spectroradiometer
NDVINormalized Difference Vegetation Index
WSWet season

References

  1. Cambodia Rice Export Potential and Strategies, CAMBODIA AGRIBUSINESS SERIES-No. 4; International Finance Corporation (IFC): Phnom Penh, Cambodia, 2015.
  2. Food and Agriculture Organization of the United Nations FAOSTAT. Available online: http://www.fao.org/faostat/en/#data/QC (accessed on 29 September 2020).
  3. Yu, B.; Diao, X. Cambodia’s Agricultural Strategy: Future Development Options for the Rice Sector; A Policy Discussion Paper Special Report 9; Cambodia Development Resource Institute (CDRI), Council for Agricultural and Rural Development (CARD), and International Food Policy Research Institute (IFPRI): Phnom Penh, Cambodia, 2011. [Google Scholar]
  4. Ishikawa, K. The Marketing and Trading of Rice in Cambodia: The Rice Market System and Price Changes Under a Market-Oriented Economy. Forum Int. Dev. S 2010, 39, 99–120. [Google Scholar]
  5. Yagura, K. Transformation of Agriculture and Its Mechanism in Pursat Province, Cambodia: Utilization of Untapped Resources and Funding from External Sources. Jpn. J. S. Asian Stud. 2021, 59. in press. [Google Scholar]
  6. Sothy, E.; Sokcheng, S.; Chhum, C.; Pirom, K. Rice Policy Study: Implications of Rice Policy Changes in Vietnam for Cambodia’s Rice Policy and Rice Producers in South-Eastern Cambodia, CDRI Working Paper Series No. 113; Cambodia Development Resource Institute (CDRI): Phnom Penh, Cambodia, 2017. [Google Scholar]
  7. Cambodia: Northwest Irrigation Sector Project, Completion Report; Asian Development Bank (ADB): Manila, Philippines, 2014.
  8. FAO AQUASTAT Country Profile—Cambodia; Food and Agriculture Organization of the United Nations (FAO): Rome, Italy, 2011.
  9. Son, N.T.; Chen, C.F.; Chen, C.R.; Chang, L.Y.; Duc, H.N.; Nguyen, L.D. Prediction of rice crop yield using MODIS EVI-LAI data in the Mekong Delta, Vietnam. Int. J. Remote Sens. 2013, 34, 7275–7292. [Google Scholar] [CrossRef]
  10. Tsujimoto, K.; Ohta, T.; Hirooka, Y.; Homma, K. Estimation of Planting date in paddy fields by time-series MODIS data for basin-scale rice production modeling. Paddy Water Environ. 2019, 17, 83–90. [Google Scholar] [CrossRef]
  11. Wang, H.; Ghosh, A.; Linquist, B.A.; Hijmans, R.J. Satellite-Based Observations Reveal Effects of Weather Variation on Rice Phenology. Remote Sens. 2020, 12, 1522. [Google Scholar] [CrossRef]
  12. Song, Y.; Wang, J.; Yu, Q.; Huang, J. Using MODIS LAI Data to Monitor Spatio-Temporal Changes of Winter Wheat Phenology in Response to Climate Warming. Remote Sens. 2020, 12, 786. [Google Scholar] [CrossRef] [Green Version]
  13. Nadar, W.; Ouk, M.; Elsner, J.; Brendel, T.; Schubbert, R. The DNA fingerprint in food forensics part II: The Jasmine rice case. Agr. Food Ind. Technol. 2020, 31, 4–8. [Google Scholar]
  14. Kamoshita, A. “Nettai-ajia no inasaku” [Rice production in tropical asia]. In “Saishin Nogyo Gijutsu, Sakumotsu” [The Latest Agricultural Techniques]; Rural Culture Association, Ed.; Rural Culture Association: Tokyo, Japan, 2009; Volume 1, pp. 107–120. (In Japanese) [Google Scholar]
  15. Ouk, M.; Sakhan, S.; Men, S. Rice breeding methods for Cambodia. Breed. Res. 2009, 11, 65–71. (In Japanese) [Google Scholar]
  16. Kodo, T.; Homma, K.; Kobayashi, S.; Yagura, K.; Sanara, H.; Soben, K. Effects of irrigation facilities development on cultivation management and productivity of rice in Cambodia. Jpn. J. S. Asian Stud. 2021, 59. in press. [Google Scholar]
  17. Kamoshita, A.; Ouk, M. Field level damage of deepwater rice by the 2011 Southeast Asian Flood in a flood plain of Tonle Sap Lake, Northwest Cambodia. Paddy Water Environ. 2015, 13, 455–463. [Google Scholar] [CrossRef] [Green Version]
  18. Hirooka, Y.; Homma, K.; Kodo, T.; Shiraiwa, T.; Soben, K.; Chann, M.; Tsujimoto, K.; Tamagawa, K.; Koike, T. Evaluation of cultivation environment and management based on LAI measurement in farmers’ paddy fields in Pursat province, Cambodia. Field Crops Res. 2016, 199, 150–155. [Google Scholar] [CrossRef]
  19. Johnston, R.; Try, T.; Silva, S. Agriculture Water Management Planning in Cambodia; Issue Brief #1; The International Water Management Institute (IWMI): Colombo, Sri Lanka, 2013. [Google Scholar]
  20. Special Assistance for Project Formation for West Tonle Sap Irrigation and Drainage Rehabilitation and Improvement Project in the Kingdom of Cambodia; Final Report, Volume-I, Main Report; Japan International Cooperation Agency (JICA), Nippon Koei Co., Ltd.: Tokyo, Japan, 2009.
  21. Project for Improvement of Agricultural River Basin Management and Development (TSC 3); Summary of Terminal Evaluation; Japan International Cooperative Agency (JICA): Tokyo, Japan, 2014.
  22. Chhinh, N.; Millington, A. Drought Monitoring for Rice Production in Cambodia. Climate 2015, 3, 792–811. [Google Scholar] [CrossRef] [Green Version]
  23. Sophea, K. The Rice Situation in Cambodia. Technical Assistance Consultant’s Report; Asian Development Bank (ADB): Manila, Philippines, 2012. [Google Scholar]
  24. Castilla, N.P.; Stuart, A.M.; Makara, O.; Sathya, K.; Somany, S.; Kumar, V.; Hadi, B.A.R. Characterization of cropping practices, pest constraints, and yield variation in irrigated lowland rice of Cambodia. Crop Prot. 2020, 135, 10496. [Google Scholar] [CrossRef]
  25. Yang, J.; Liu, K.; Wang, Z.; Du, Y.; Zhang, J. Water-Saving and High-Yielding Irrigation for Lowland Rice by Controlling Limiting Values of Soil Water Potential. J. Integr. Plant Biol. 2007, 49, 1445–1454. [Google Scholar] [CrossRef]
Figure 1. Major cultivation types and durations in Pursat Province. Modified from Kamoshita (2009) [14] (pp. 107–120). The green and yellow boxes indicate transplanting and harvesting times, respectively. The green shaded box indicates the time of seed broadcasting.
Remotesensing 13 01971 g001
Figure 3. Google Earth images taken on 8 February 2020. The white rectangles show the pixels of MODIS LAI data. The green pins indicate (a) TC2 (left) and TC3 (right) and (b) TC4 (right) and TC5 (left) in the right rectangle and TC6 (left) and TC7 (right) in the left rectangle.
Remotesensing 13 01971 g003
Figure 4. Annual LAI transitions in 2019 at KT3. The dotted line shows raw data and the solid line shows moving averages of 5 consecutive values.
Remotesensing 13 01971 g004
Figure 5. Annual LAI transitions for each year at two interviewed farmers’ locations: (a) KT3 and (b) SDK. The data shown are the moving averages of 5 consecutive values.
Remotesensing 13 01971 g005
Figure 6. Annual transitions of average LAI for each cluster at two interviewed farmers locations: (a) KT3 and (b) SDK. The data shown are the moving averages of 5 consecutive values.
Remotesensing 13 01971 g006
Figure 7. Google Earth images taken on 8 February 2020. The white rectangles show pixels of MODIS LAI data. The green pins indicate (a) TC8 in the upper rectangle and TC9 in the lower rectangle and (b) KT1.
Remotesensing 13 01971 g007
Figure 8. Google Earth Images taken on 8 February 2020. The white rectangles show pixels of the data. The yellow pins indicate (a) P7, P8, and P9 from the lower left to the upper right and (b) P6.
Remotesensing 13 01971 g008
Figure 9. Annual transitions of average LAI for each cluster at four of the points on the transverse line: (a) P1, (b) P4, (c) P5, and (d) P7. Cluster 1 at P5 was divided into subclusters: 2003, 2004, 2005, 2006, 2008, and 2010 (cluster 1-1) and 2007, 2009, 2011, 2012, and 2013 (cluster 1-2). The data shown are the moving averages of 5 consecutive values.
Remotesensing 13 01971 g009
Figure 10. Seventeen-year transitions of the dry season rice index (DSRI).
Remotesensing 13 01971 g010
Figure 11. Distribution of the DSRI clusters classified by the k-means method.
Remotesensing 13 01971 g011
Figure 12. Distribution of the groups classified by k-means clustering for LAI data covering 2003–2019 and consisting of 1724 pixels (clusters 1 and 2 in Figure 10 and Figure 11).
Remotesensing 13 01971 g012
Figure 13. Annual transitions of the average LAI for three classified groups: (a) G1, (b) G2, and (c) G3. The data shown are the moving averages of 5 consecutive values.
Remotesensing 13 01971 g013aRemotesensing 13 01971 g013b
Figure 14. Peak value of the LAI in the wet season (WS) and the dry season (DS) for Groups 1, 2, and 3 (G1, 2, and G3).
Remotesensing 13 01971 g014
Table 1. Basic information from the interviewed farmers. For the data on the four locations in 2015, summaries of four neighboring farmers’ interviews are provided, and were recorded near their paddy fields. All communes in this table correspond to the locations of interviewed farmers’ houses. Abbreviations used in this table are as follows: CEM, crop establishment method; TP, transplanting; BC, broadcasting.
YearCommuneIDCultivarsSeeding TimeCEMGPS
2014Trapeang chorngTC1Somaly, +other cultivar(s)MayTP12.5811, 103.7622
Trapeang chorngTC2SomalyMid–MayBoth12.5814, 103.7671
Trapeang chorngTC3SomalyEarly MayBoth12.5812, 103.7683
Trapeang chorngTC4Somaly, Riang CheyUnknownBoth12.5973, 103.8049
Trapeang chorngTC5Somaly, Phka RumduolMid–MayBC12.5975, 103.8046
Trapeang chorngTC6SomalyLate JuneTP12.5961, 103.8034
Trapeang chorngTC7SomalyLate JuneBoth12.5959, 103.8039
Trapeang chorngTC8Somaly, Phka Rumduol, Riang CheyEarly JuneBoth12.6066, 103.7885
Trapeang chorngTC9Somaly, Phka Rumduol, Riang CheyEarly MayBC12.6040, 103.7869
Khnar TotuengKT1SomalyEarly MayBC12.5915, 103.7284
Khnar TotuengKT2Somaly, Sen Kra ObLate AprilBC12.5966, 103.7317
Khnar TotuengKT3SomalyEarly MayBC12.5998, 103.7349
Khnar TotuengKT4SomalyEarly MayBC12.6004, 103.7309
2015Svay Doun KaevSDKSen Pidao, IRs, +2 cultivarsApril – Early June/Late Sep. – Early Oct.BC12.7125, 103.6364
Boeung KhnarBKSomaly, Riang Chey, +2 cultivarsMid-June – JulyBC12.5416, 103.6736
Ta LouTLSomaly, Riang Chey, +3 cultivarsNo informationBC12.4929, 103.6459
RumlechRuSomaly, IRs, +1 cultivarEarly April – Early Aug.BC12.5969, 103.6910
Table 2. Major changes in cultivation management and years for pairs of clusters. TC2 and TC3, TC4 and TC5, and TC6 and TC7 were in the same sets of pixels (indicated with *1–3). No information about machines was collected at KT1-4 (indicated with *4). TC8, TC9, and KT1 were not grouped into clusters (shown as “null”).
IDMajor Changes in Cultivation Management (Year)Cluster 1Cluster 2
TC1Change cultivars (2012)2003-102011-19
TC2Change cultivars (2011)2003-102011-19
TC3Change cultivars (2008-09), Buy a cultivator (2011)
TC4Change cultivars (unknown), Buy a cultivator (2012)2003–2009, 12, 13, 15, 16, 192010, 11, 14, 17, 18
TC5Change cultivars (2015), Buy a cultivator (2011)
TC6Buy a cultivator (2009)2003-09, 12, 162010, 11, 13-15, 17-19
TC7Change cultivars (2014)
TC8No changes obtainednullnull
TC9Buy a cultivator (2007)nullnull
KT1Change cultivars (2008) *4nullnull
KT2Change cultivars (2008) *42003-102011-19
KT3Change cultivars (2009) *42003-102011-19
KT4Change cultivars (2009) *42003-102011-19
SDKChange cultivars (2010, 14, 15), Buy a cultivator (2005, 09, 15)2003-08, 132009-12, 14-19
BKChange cultivars (2010), Buy a cultivator (2013)2003-06, 08, 102007, 09, 11-19
TLBuy a cultivator (2010 or 12), Change cultivars (2015)2003-12, 152013, 14, 16-19
RuChange cultivars (2005, 11, 15), Buy a cultivator and a tractor (2011, 15)2003-122013-19
Table 3. Clusters of 9 points on the transverse line. No effective clusters were obtained at P6, P8, and P9 (shown as “null”).
Cluster 1Cluster 2Cluster 3 or Other
P12003-062007-19
P22004-13, 17-192014-162003
P32003-122013-19
P42003-06, 08, 102007, 09, 11-19
P52003-132014-19
P6nullnullnull
P72003-09, 11, 122010, 13-172018-19
P8nullnullnull
P9nullnullnull
Publisher’s Note: MDPI stays neutral with regard to jurisdictional claims in published maps and institutional affiliations.

