
Biases in CloudSat Falling Snow Estimates Resulting from Daylight-Only Operations


1
Earth System Science Interdisciplinary Center, University of Maryland, College Park, MD 20740, USA
2
NASA Goddard Space Flight Center, Greenbelt, MD 20771, USA
3
Space Science and Engineering Center, University of Wisconsin-Madison, Madison, WI 53706, USA
*
Author to whom correspondence should be addressed.
Remote Sens. 2021, 13(11), 2041; https://0-doi-org.brum.beds.ac.uk/10.3390/rs13112041
Submission received: 19 April 2021
/
Revised: 14 May 2021
/
Accepted: 18 May 2021
/
Published: 21 May 2021
(This article belongs to the Special Issue Remote Sensing of Precipitation at the Mid- to High-Latitudes)
Abstract
:Falling snow is a key component of the Earth’s water cycle, and space-based observations provide the best current capability to evaluate it globally. The Cloud Profiling Radar (CPR) on board CloudSat is sensitive to snowfall, and other satellite missions and climatological models have used snowfall properties measured by it for evaluating and comparing against their snowfall products. Since a battery anomaly in 2011, the CPR has operated in a Daylight-Only Operations (DO-Op) mode, in which it makes measurements primarily during only the daylit portion of its orbit. This work provides estimates of biases inherent in global snowfall amounts derived from CPR measurements due to this shift to DO-Op mode. We use CloudSat’s snowfall measurements during its Full Operations (Full-Op) period prior to the battery anomaly to evaluate the impact of the DO-Op mode sampling. For multi-year global mean values, the snowfall fraction during DO-Op changes by −10.16% and the mean snowfall rate changes by −8.21% compared with Full-Op. These changes are driven by the changes in sampling in DO-Op and are very little influenced by changes in meteorology between the Full-Op and DO-Op periods. The results highlight the need to sample consistently with the CloudSat observations or to adjust snowfall estimates derived from CloudSat when using DO-Op data to evaluate other precipitation products.
1. Introduction
Facing a warming climate, increasingly detailed and complete information is necessary to understand changes in the water and energy budgets and reduce uncertainties in predictions of future climate. Observations are a crucial adjunct to numerical models to better constrain model parameters and validate simulations. Moreover, observations, especially remote sensing ones at a near global scale, are an important monitoring tool for trend and change analyses. CloudSat, a NASA research satellite launched in 2006 and designed specifically to provide observations of clouds, has produced an observational record likely approaching a duration sufficient for such analyses (e.g., [1]).
The Cloud Profiling Radar (CPR) onboard CloudSat is a 94 GHz nadir pointing radar with an oversampled 240 m vertical resolution and a 1.4 × 1.7 km2 footprint. Its −27 dBZ sensitivity makes it one of the most valuable satellite sensors for cloud observations, but it has also been widely used for light rain and snowfall detection and quantification [2]. CloudSat has helped scientists understand the vertical profiles of clouds and precipitation [3], improve precipitation estimates [4,5,6,7,8] as well as provide fundamental insights on cloud microphysics for cloud models [9,10] and radiation fluxes [11,12].
For five years after launch, CloudSat flew continuously within the Afternoon-Train, or A-Train, a constellation of six Earth-observing satellites orbiting in a sun-synchronous polar orbit, crossing the equator within a few minutes of each other, around 0130AM/PM local time [13]. In April 2011 a battery anomaly forced CloudSat to exit the constellation temporarily and modify its operating parameters. This event signaled the start of a second major era for CloudSat, the switch to so called Daylight-Only Operations (DO-Op). Since the beginning of DO-Op, the CPR has collected data primarily during only the sunlit portion of the orbit. While many studies have so far used data from the Full Operations (Full-Op) period prior to the battery anomaly [4,7,14,15], the need for more recent CloudSat observations for comparison against new sensors such as the Global Precipitation Measurement (GPM) Core Observatory [16,17] or for the recent validation and optimization of models in a changing climate have increasingly required the use of the DO-Op observations as well [5,9,18,19]. This study compares CloudSat snowfall measurements taken during the Full-Op period against those taken during the DO-Op period to assess the impact of this change in sampling on snowfall properties estimated from the CloudSat snowfall product. These impacts have the potential to influence the interpretation of comparisons against model simulations and other snowfall products and so need to be quantified. After a data and methods section (Section 2), this study describes the spatial and temporal sampling biases common to all CloudSat products due to the transition from Full-Op to DO-Op (Section 3) and then focuses on the impact of the transition on estimates of longer-term variations in snowfall detection and quantification (Section 4). Conclusions and remarks are provided in Section 5.
2. Data and Methods
The analyses focus on the 2C-SNOW-PROFILE (2CSP) version R05 CloudSat product [20]. The data are separated into two approximately equal-length time periods taken from the Full-Op period (September 2006 to August 2010) and from the DO-Op period (September 2012 to August 2016). We refer to the two datasets as simply the Full-Op data and the DO-Op data. The operational changes under DO-Op causes a substantial reduction in the number of vertical reflectivity profiles observed and a bias in sampling that favors day-time rather than night-time observations. Here and through the remainder of this paper, “profile” indicates a single atmospheric column as observed by the CPR. Owing to slight delays inherent in each transition between daylight and dark operation, DO-Op mode samples some Arctic night profiles, essentially no Antarctic night profiles, and further omits some Antarctic day profiles. The DO-Op period incurred 35 days with missing data, while the Full-Op period incurred 64 days with missing data, causing the Full-Op data to represent 29 fewer days than do the DO-Op data.
The Full-Op and DO-Op data are gridded onto a 1° × 1° latitude-longitude grid. The choice of grid dimensions reflects this work’s focus on snowfall, and thus, on mostly middle and high latitudes where CloudSat observations are spatially denser than at low latitudes. At low latitudes, 1° × 1° sampling of CloudSat observations leads to patchy sampling, with small or zero sample counts in some grid boxes and large sample counts in others. In this work, the spatially gridded data are used primarily for diagnosing spatial patterns, while quantitative results are produced using zonal, hemispheric, or global data. As a result, the quantitative results are not impacted by patchy sampling that occurs in the gridded data.
We examine the number of profiles (normalized to remove biases due to missing data), the snowfall fraction (SF), and the mean snowfall rate (MSR) within each grid box. Following the methodology in [7], the SF is defined as the ratio of snowing profiles (2CSP surface snowfall rate > 0 mm y−1) to the total number of profiles within each grid box. Similarly, MSR is calculated as the mean of the snowfall rates for all profiles (snowing and non-snowing) observed within a grid box. The number of profiles for ascending (northward, sunlit portion of the orbit) and descending (southward, dark portion) orbits of Full-Op and DO-Op are separated to better highlight the sampling differences between the two periods. For SF and MSR calculations, ground clutter corrections have been applied following the method described in [4] and formerly suggested by the developers [20].
Since the long-term (i.e., annual- to decadal-scale) variability of precipitation could play a substantial role in the comparisons between the two periods, a third dataset is introduced in which the Full-Op data are sampled to mimic the sampling of the DO-Op data. To obtain the Full-Op resampled (Full-Op-R) dataset, a latitudinal mask has been created based on daily DO-Op observations and then applied to the Full-Op to reproduce the same sampling as DO-Op. The mask was produced by evaluating the range of latitudes over which valid CPR profiles were observed for each day in the DO-Op period. These data were composited to determine the range of latitudes to exclude as a function of day of year. This way, a comparison between the Full-Op and the resampled Full-Op-R is obtained which excludes the effects of long-term temporal variability of precipitation, leaving only the day–night sampling differences to play a role in the results. The DO-Op mask is provided as Supplementary Materials [21].
Multi-year global mean accumulations of snowfall are a useful basis for comparing the behavior of global models against the CloudSat observations. We use the ECMWF ERA5 reanalysis [22] snowfall accumulation product to examine changes in global mean accumulation between the Full-Op and DO-Op periods and compare these changes against those in the CloudSat Full-Op and DO-Op data. For these comparisons, the ERA5 hourly snow surface accumulation variable (‘Snowfall’) at the native 0.25° spatial resolution is re-gridded at the 1° × 1° resolution to match the CloudSat grid and is provided as yearly mm of liquid water equivalent accumulation.
3. Spatial and Temporal Biases
The number of CPR profiles measured from the sensor during the two distinct operational periods represents the first indicator of the bias in the spatial distribution of CloudSat profiles. Figure 1 shows the number of profiles for each grid box separated by operational periods and by ascending versus descending orbits. Because of the inclined orbit, the number of profiles increases poleward, reaching up to ~29,000 profiles in four years in a single grid box at 82° latitude. Sampling gaps are increasingly present moving equatorward, but for the purpose of estimating the snowfall bias, the sampling at high latitudes (taken typically to be poleward of 60° N/S) during Full-Op can be considered acceptable [7]. While the total counts for Full-Op are the same for the ascending and descending orbits (3.85·108, Table 1, Figure 1a,b), for DO-Op the numbers differ substantially with 3.48·108 (0.69·108) for ascending (descending) orbits (Table 1, Figure 1c,d). Figure 1e,f show the percentage difference of the number of profiles between the two periods. Table 1 also provides the number of profiles partitioned by hemisphere and shows the southern hemisphere (SH) descending orbits suffering from DO-Op mode with only 0.10·108 profiles observed compared to 1.94·108 observed during Full-Op. This hemispheric asymmetry is caused by the delay incurred for the sensor to come back up and start acquisition when entering daylight, so part of the daylight section of the orbit (about 20 latitude degrees) is also missing. On the other hand, the batteries can still provide some power after the satellite enters the umbra, allowing the acquisition of data also during a portion of the descending orbit.
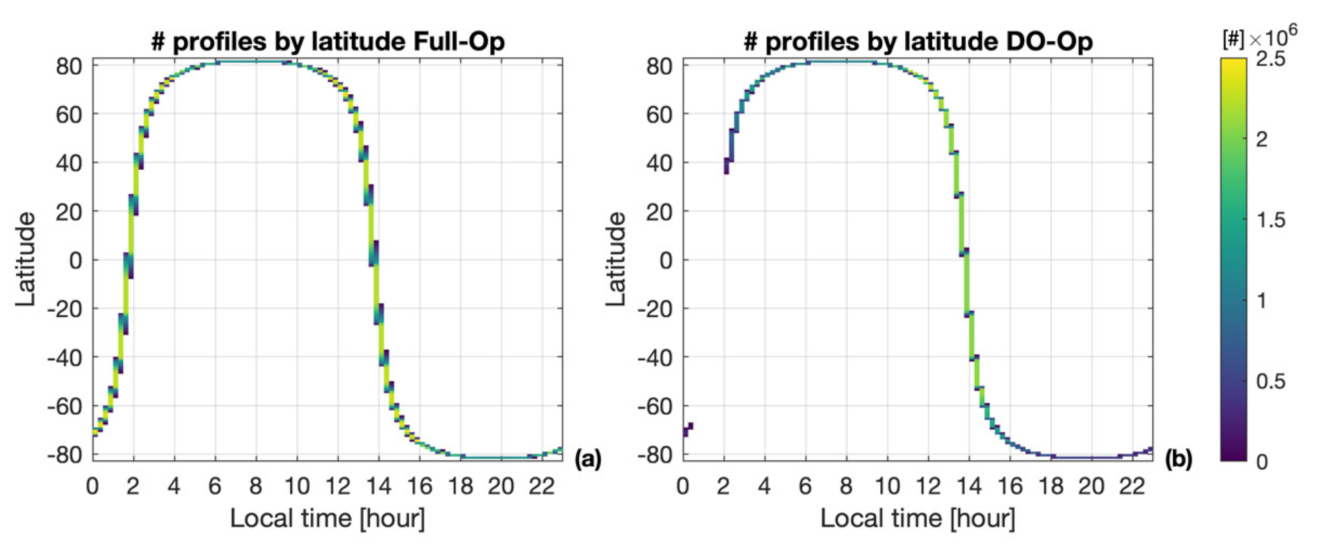
The latitudinal variation in sampling during DO-Op also introduces a temporal gap in the CPR measurements (Figure 2). As already mentioned, CloudSat flies in a sun-synchronous orbit, so it overpasses a given latitude at a fixed local time. DO-Op completely misses any observation between 00–02AM (Figure 2b) and shows a substantial decrease on the number of profiles between 02–04AM (−40 to −100%) and 04PM–00AM (−40 to −70%). This latter sampling issue precludes using DO-Op for any analysis of day–night differences between 64S and 40N.
4. Snowfall Fraction and Rate Biases
4.1. Full-Op vs. DO-Op
The spatial and temporal biases on the CloudSat sampling during DO-Op also affect the snowfall fraction and mean snowfall rates. Figure 3 shows the SF (left column) and the MSR (right column) for each period. The difference in the number of profiles between the two periods is evident from the patchy patterns, especially over the SH in Figure 3c,d. The striped pattern directed SE–NW reflects the prevalence of ascending orbits in the DO-Op dataset. In general, compared to Full-Op, smaller SF and MSR are shown for DO-Op versus Full-Op over several regions such as the North Atlantic, the Sea of Japan, the Southern Ocean, and to a lesser extent over some inland areas of North America and Eurasia.
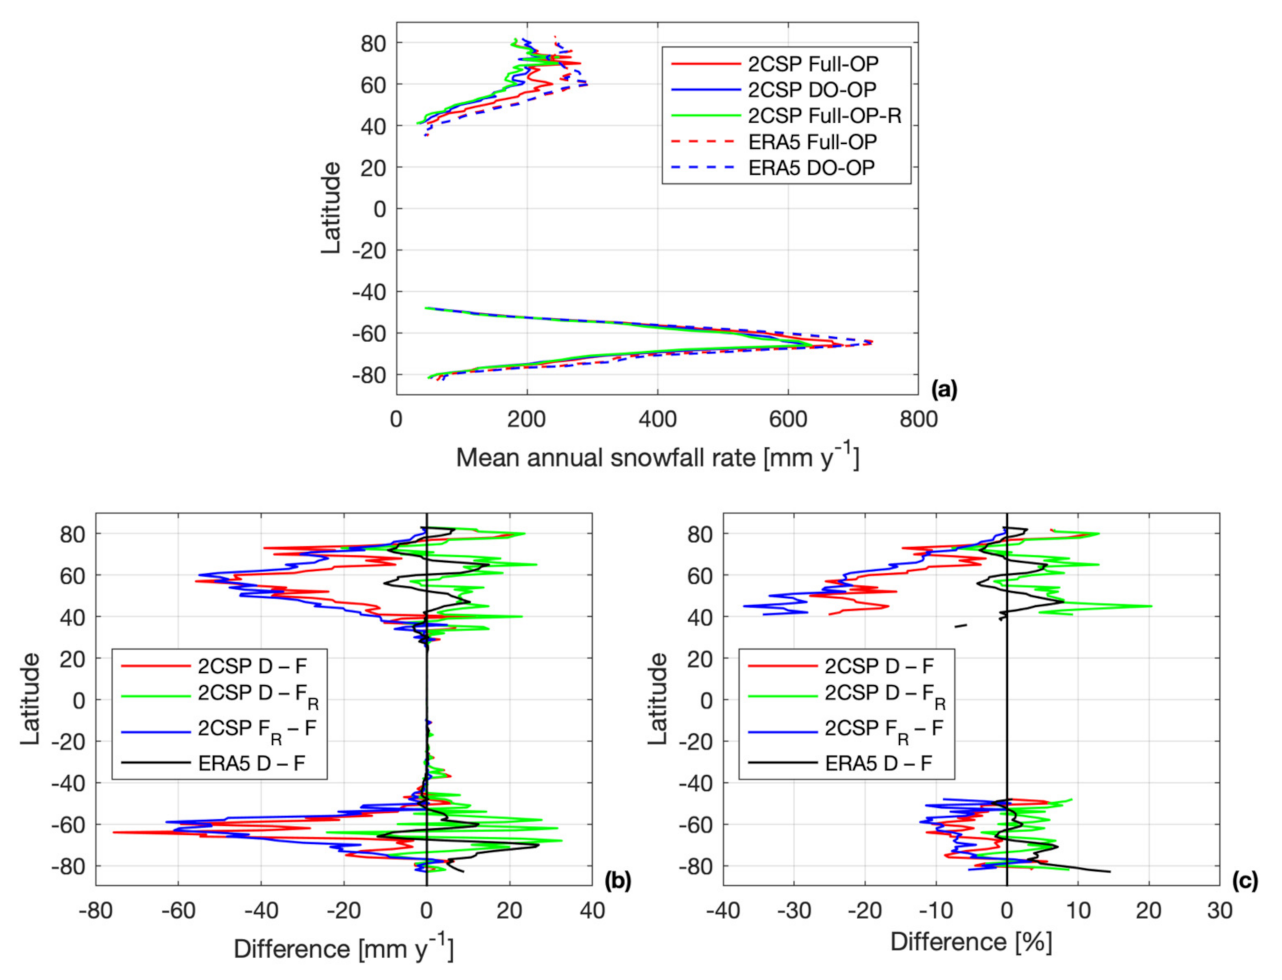
To have a better sense of the bias behavior and to quantify the snowfall actually missed when considering the DO-Op long-term averages, we evaluate the gridded MSR into zonal values resolved at 1° latitude (Figure 4a). The DO-Op latitudinal MSR (solid blue line) generally shows smaller values than does the Full-Op (solid red line) over almost all latitudes. This was already expected given Figure 3, especially for the 40–70N and 50–80S latitudinal ranges. The differences of DO-Op relative to Full-Op (D−F) reach peak values of −75.64 mm y−1 at 64S latitude, −55.78 mm y−1 at 57N, and −39.27 mm y−1 at 73N (Figure 4b). These correspond to −11.35%, −25.55%, and −14.72%, respectively (Figure 4c).
Note that while most of the differences are negative, for latitudes 75–82N the differences become positive. Since the Full-Op and DO-Op datasets are obtained from different time periods, these MSR differences included the effects of both the DO-Op sampling biases and longer-term temporal variability in precipitation. Since the sampling of profiles for both DO-Op ascending and descending orbits at high NH latitudes is very similar to that for Full-Op (Figure 1), the larger DO-Op MSR values might be due to longer-term temporal variability of precipitation, which we explore further in Section 4.2.
4.2. Full-Op-R
To separate the effect of precipitation variability between the two periods from that of sampling biases in DO-Op, we introduce the Full-Op-R dataset and compare it with the DO-Op and the Full-Op datasets. The normalized counts of profiles for the Full-Op-R dataset are similar to those for DO-Op (Table 1). The spatial distributions of SF and MSR for Full-Op-R look very similar to those for DO-Op (Figure 3); however, SF and MSR values for DO-Op are generally larger than those for Full-Op-R (Table 2).
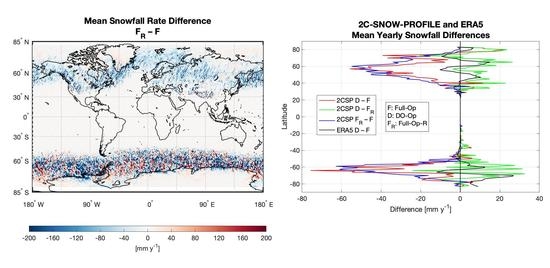
For the differences between Full-Op-R and Full-Op (FR−F), there is no precipitation variability affecting the results and any dissimilarity is solely due to the different sampling applied. The differences in this case also highlight the strongly disparate impacts on the northern and southern hemispheres (Figure 5a,b). The northern hemisphere exhibits weakly positive to strongly negative differences in both SF and MSR with a concentration of positive differences over Greenland. The southern hemisphere exhibits a mix of strongly positive and negative differences but with mostly positive differences over the Antarctic continent. Both Greenland and Antarctica have areas (southern Greenland and the Antarctic Peninsula) where the mostly positive differences in SF and MSR transition to more negative differences. In the northern hemisphere oceans, the differences for SF and MSR over the Sea of Japan and the North Atlantic Ocean are uniformly negative. For the Southern Ocean, the differences for SF and MSR are mixed positive and negative, as noted above, but with a preponderance of negative values.
Striped patterns directed NE–SW are apparent in the Fr−F difference plots, especially over the NH. This is consistent with the preferential omission of descending rather than ascending tracks in the NH. For the NH, there is clear underestimation of SF and MSR by Full-Op-R, suggesting that the day-night differences are strong and poorly represented. In contrast, for the SH, the patterns are less apparent, consistent with the omission of a mixture of ascending and descending tracks.
Since DO-Op and Full-Op-R are sampled equivalently, the differences are solely related to the variability of precipitation between the DO-Op and Full-Op periods. During DO-Op, over the Northern Hemisphere, both snowfall fraction and rate are larger compared to Full-Op-R. Except for some negative differences over the Gulf of Alaska, the North Atlantic region and some patchy areas over central Asia, the differences are generally positive, with regions strongly positive, such as the Beaufort Sea and Arctic Ocean north of Alaska or the Kara Sea (Figure 5c,d). The Southern Hemisphere shows a mix of strongly positive and negative differences, with negative differences over the Antarctic continent around 45–0W and 80–130E.
The Full-Op-R latitudinal MSR (Figure 4a, green line) is in good agreement with the DO-Op MSR (solid blue line), with some differences around 60–70N likely due to precipitation variability between the two periods. To explore these data in more detail, in Figure 4b,c we compare FR−F (blue lines) and D−F (red lines). The variation with latitude of FR−F in Figure 4b is very similar to that for D−F, showing in general a slightly more substantial difference than D−F for most of the latitudes. This increased bias corresponds with the larger global FR−F values shown in Table 2 when compared to the D−F. The peak of FR−F in the SH is shifted slightly north (59S) when compared to D−F (64S), with −62.92 mm y−1 (−12.24%). The NH FR−F bias peak (Figure 4b) is −54.96 mm y−1 (−23.03%) at 60N, while the percentage difference peak (Figure 4c) for the same FR−F is located around 50N at −33.48%. The percentage differences are smaller for the SH with maximum values between −5% and −12%. Finally, the two peaks at 57N and 73N shown for D−F are barely discernable in the case of FR−F, confirming that longer-term temporal precipitation variability is impacting D−F.
As further confirmation that we can actually isolate the precipitation differences between the two periods, the green lines in Figure 4b,c show the difference between DO-Op and Full-Op-R (D−FR). The sampling in this case is the same for both periods, the only factor in play is the variability of precipitation for the two periods, shown as departures from the zero-difference line. The difference in this case is globally positive (as shown in Table 2 with the DO-Op MSR value larger than the Full-Op-R one), as are the latitudinal plots except for a few negative peaks around 60S, 50–60N, and 70–80N. The precipitation differences range between ±20 mm y−1 (±10%), demonstrating the lower impact on MSR of precipitation long-term temporal variability when compared to the DO-Op sampling effects. Finally, we note that in the 75–82N region, Full-Op-R is consistent with Full-Op, highlighting once more that the DO-Op sampling does not affect the very high north latitudes.
4.3. CPR vs. ERA5
As an additional and independent comparison between Full-Op and DO-Op periods and to characterize the precipitation variability between the two periods, we consider the yearly snowfall accumulation from ERA5 reanalysis. For simplicity, we refer to Full-Op and DO-Op to indicate the September 2006–August 2010 and September 2012–August 2016 periods also for ERA5 data, but do not apply DO-Op-like sampling to the ERA5 data. What emerges from the comparison between the two periods in ERA5 is that global snowfall accumulation does not decrease from the Full-Op to the DO-Op period (Table 2). Globally, the ERA5 average snowfall accumulation is about equal at ~86 mm y−1 for both the Full-Op and DO-Op periods. This result suggests that no significant differences should be observed on a global scale for the 2CSP global mean snowfall between Full-Op and DO-Op as well. While 2CSP averages show 74.63 mm y−1 for Full-Op and only 68.32 mm y−1 (−8.46%) for DO-Op, for Full-Op-R the 2CSP average is somewhat smaller with 65.45 mm y−1 (−12.30%). Global 2CSP SF is also affected, going from 4.33% for Full-Op to 3.89% for DO-Op (−10.16%) and to 3.84% for the Full-Op-R (−11.32%).
Similar to the global averages, ERA5 latitudinal MSR (Figure 4a, dashed lines) does not show substantial changes between the Full-Op and DO-Op periods. Comparing the two hemispheres, ERA5 shows larger yearly snow accumulation over the Southern Ocean (735 and 725 mm y−1, respectively, for the Full-Op and the DO-Op around 65S) and a smaller accumulation peak in the NH (about 300 mm y−1 around 60N). The same pattern is followed by the 2CSP datasets (solid lines), showing only some small differences around 70–75N, where some spikes exceeding ERA5 averages are displayed due to higher MSR over the North Atlantic and Baffin Bay between Greenland and Canada. Additionally, the difference plots (Figure 4b,c) show that the differences between ERA5 DO-Op and ERA5 Full-Op (black lines) agree with D−FR (green line), highlighting once more that both ERA5 D−F and 2CSP D−FR represent only the relatively minor precipitation variability between the two periods.
5. Conclusions
CloudSat is one of the most useful sensors for quasi-global (82S-82N) detection and retrieval of snowfall; however, the shift to DO-Op has had non-negligible impacts on the long-term average snowfall fractions of occurrence and rates. This study shows that the number of profiles during DO-Op globally decreases by −46% compared to Full-Op with different distributions of the sampling bias between the northern (NH) and southern (SH) hemispheres and between ascending (predominantly day-time) and the descending (night-time) orbit segments. Ascending orbits show a global −10% bias in profile numbers when comparing DO-Op to Full-Op, while descending orbits show a −82% bias, primarily due to a complete lack of observations between 65S–35N. This latitudinal bias also impacts observation of the day-night differences in snowfall, with a lack of observations between 00–02AM and 40–100% fewer observations between 02–04AM and 04PM–00AM. The decrease of the number of profiles in general and the lack of night-time observations in particular influence the fraction of snowfall occurrence and the amount of solid precipitation measured by the satellite during DO-Op. The snowfall fraction (SF) during DO-Op decreases by −10.16% and the mean snowfall rate (MSR) by −8.46% relative to Full-Op with consequent underestimation of solid precipitation during DO-Op. A resampled dataset (Full-Op-R) isolates the impacts of sampling biases from the precipitation variability between periods, both of which impact the Full-Op/DO-Op comparison. Full-Op-R consists of the Full-Op dataset resampled to mimic the daylight-dominant sampling of DO-Op. The analysis shows that globally the daylight-dominant sampling introduces a MSR bias of −12.30% relative to Full-Op, while latitudinally, the bias could reach values up to −33.48% around 50N. The SF and MSR biases depend strongly on the latitude and the time, with a general underestimation of snowfall detection and mean rates over most of the NH. The very high northern latitudes (75–82N) are the exception, since the DO-Op sampling there does not decrease the number of profiles, and consequently, does not impact SF and MSR. The SH, due to the high amount of solid precipitation experienced over the Antarctic peninsula, the western coast of Antarctica and the eastern Southern Ocean (40–140E), shows a larger bias but smaller percentage difference. More detailed temporal and seasonal analyses are necessary to understand how much the DO-Op sampling affects analyses of the day–night differences and seasonal cycles of precipitation.
The results demonstrate the need to consider the biases introduced by the transition to DO-Op when using the 2CSP CloudSat product. Unless addressed, these biases will influence the evaluation of trends using CloudSat snowfall data; the comparison of CloudSat snowfall against other snowfall products, whether observation- or model-based; and the use of the CloudSat data in machine learning. First, recent work suggests the potential utility of CloudSat and/or future CloudSat-like snowfall observations for climate change detection [1]. Given this study’s results, clearly any such analysis would also need to compensate for differences in day–night sampling among the observations. Second, the authors of [1] introduced the concept of scale- and definition-aware treatments when using observations to test climate models. These results indicate the need for such comparisons to be sampling-aware as well.
Sampling-awareness extends to observational studies as well. As an example, comparisons of the GPM radar-based snowfall product against CloudSat snowfall in DO-Op, using thorough normalizations for differences in retrievals and instrument performance, found a −43% difference in mean snowfall over roughly 60S to 60N [18]. Although the normalizations make a simple application of the results from our study impossible, these results suggest the difference is larger. In the same vein, comparisons against CloudSat snowfall arising after the launch of EarthCARE [23] must also consider carefully the impact of DO-Op.
Finally, the CloudSat precipitation datasets are increasingly used as sources of training and a priori constraints for other retrievals. Recent machine learning applications use collections of CloudSat profiles coincident with the desired remote sensing observations as training datasets or constraints [24,25,26]. For coincident observations themselves, the DO-Op sampling issues that impact global, regional, and zonal precipitation properties as described in Section 4 do not come into play; however, a collection of such coincident observations from the DO-Op period will be biased toward day-time observations. Developers should carefully evaluate the impact of such biases on their algorithms.
Supplementary Materials
The DO-Op mask used to obtain the Full-Op-R dataset is available as supplementary material at https://zenodo.org/record/4749304. The dataset is available in either comma-separated variable (CSV) or Hierarchical Data Format 5 (HDF5) format. A Readme.pdf file is also provided with a detailed description of the dataset.
Author Contributions
Conceptualization, L.M. and N.B.W.; Formal Analysis, L.M.; Methodology, L.M. and N.B.W.; Visualization, L.M.; Writing—Original Draft Preparation, L.M.; Writing—Review and Editing, L.M. and N.B.W. All authors have read and agreed to the published version of the manuscript.
Funding
Dr. Lisa Milani has been funded by the NASA Global Precipitation Measurement Mission to improve the evaluation/validation effort of the GPM mission. Work by Dr. Norman B. Wood was performed at University of Wisconsin—Madison for the Jet Propulsion Laboratory, California Institute of Technology, sponsored by the National Aeronautics and Space Administration.
Data Availability Statement
For this study, the 2C-SNOW-PROFILE product has been used. This dataset is publicly available through the CloudSat Data Processing Center (http://www.cloudsat.cira.colostate.edu/, accessed on 18 April 2021). The authors acknowledge the use of ERA5 ECMWF Reanalysis single level data (snowfall) from September 2006–August 2010 and September 2012–August 2016 (https://cds.climate.copernicus.eu/cdsapp#!/dataset/reanalysis-era5-single-levels?tab=overview, accessed on 18 April 2021). The data required to resample the Full-Op data to produce Full-Op-R are available in [21].
Acknowledgments
The authors would like to thank T. L’Ecuyer for the valuable discussion during the early stage of this project. The three anonymous reviewers are also acknowledged for helping improving the quality of the paper with their constructive comments and suggestions.
Conflicts of Interest
The authors declare no conflict of interest.
References
- Kay, J.E.; L’Ecuyer, T.; Pendergrass, A.; Chepfer, H.; Guzman, R.; Yettella, V. Scale-aware and definition-aware evaluation of modeled near-surface precipitation frequency using CloudSat observations. J. Geophys. Res. Atmos. 2018, 123, 4294–4309. [Google Scholar] [CrossRef]
- Lebsock, M.D.; L’Ecuyer, T.S.; Wood, N.B.; Haynes, J.M.; Smalley, M.A. Status of the CloudSat mission. In Satellite Precipitation Measurement; Levizzani, V., Kidd, C., Kirschbaum, D.B., Kummerow, C.D., Nakamura, K., Turk, F.J., Eds.; Springer International Publishing: Cham, Switzerland, 2020; Volume 1, pp. 25–43. ISBN 978-3-030-24568-9. [Google Scholar]
- Liu, G. Deriving snow cloud characteristics from CloudSat observations. J. Geophys. Res. Atmos. 2009, 114. [Google Scholar] [CrossRef] [Green Version]
- Milani, L.; Kulie, M.S.; Casella, D.; Dietrich, S.; L’Ecuyer, T.S.; Panegrossi, G.; Porcù, F.; Sanò, P.; Wood, N.B. CloudSat snowfall estimates over Antarctica and the Southern Ocean: An assessment of independent retrieval methodologies and multi-year snowfall analysis. Atmos. Res. 2018, 213, 121–135. [Google Scholar] [CrossRef]
- King, F.; Fletcher, C.G. Using CloudSat-CPR retrievals to estimate snow accumulation in the Canadian Arctic. Earth Space Sci. 2020, 7. [Google Scholar] [CrossRef]
- Behrangi, A.; Christensen, M.; Richardson, M.; Lebsock, M.; Stephens, G.; Huffman, G.J.; Bolvin, D.; Adler, R.F.; Gardner, A.; Lambrigtsen, B.; et al. Status of high-latitude precipitation estimates from observations and reanalyses. J. Geophys. Res. 2016, 121, 4468–4486. [Google Scholar] [CrossRef] [PubMed]
- Kulie, M.S.; Milani, L.; Wood, N.B.; Tushaus, S.A.; Bennartz, R.; L’Ecuyer, T.S. A shallow cumuliform snowfall census using spaceborne radar. J. Hydrometeorol. 2016, 17, 1261–1279. [Google Scholar] [CrossRef]
- Behrangi, A.; Lebsock, M.; Wong, S.; Lambrigtsen, B. On the quantification of oceanic rainfall using spaceborne sensors. J. Geophys. Res. Atmos. 2012, 117. [Google Scholar] [CrossRef]
- Cho, H.; Jun, S.Y.; Ho, C.H.; McFarquhar, G. Simulations of winter Arctic clouds and associated radiation fluxes using different cloud microphysics schemes in the Polar WRF: Comparisons with CloudSat, CALIPSO, and CERES. J. Geophys. Res. Atmos. 2020, 125. [Google Scholar] [CrossRef]
- Li, X.; Krueger, S.K.; Strong, C.; Mace, G.G.; Benson, S. Midwinter Arctic leads form and dissipate low clouds. Nat. Commun. 2020, 11, 206. [Google Scholar] [CrossRef]
- Lenaerts, J.T.M.; Van Tricht, K.; Lhermitte, S.; L’Ecuyer, T.S. Polar clouds and radiation in satellite observations, reanalyses, and climate models. Geophys. Res. Lett. 2017, 44, 3355–3364. [Google Scholar] [CrossRef]
- Kramer, R.J.; Matus, A.V.; Soden, B.J.; L’Ecuyer, T.S. Observation-based radiative kernels from CloudSat/CALIPSO. J. Geophys. Res. Atmos. 2019, 124, 5431–5444. [Google Scholar] [CrossRef]
- Kelly, A.C.; Macie, E.J. The A-Train: NASA’s Earth Observing System (Eos) satellites and other Earth observation satellites. In Proceedings of the 4th IAA Symposium on Small Satellites for Earth Observation, Berlin, Germany, 7–11 April 2003; p. 4. [Google Scholar]
- Kulie, M.S.; Milani, L. Seasonal variability of shallow cumuliform snowfall: A CloudSat perspective. Q. J. R. Meteorol. Soc. 2018, 144, 329–343. [Google Scholar] [CrossRef] [Green Version]
- Cao, Q.; Hong, Y.; Chen, S.; Gourley, J.J.; Zhang, J.; Kirstetter, P.E. Snowfall detectability of NASA’s Cloudsat: The first cross-investigation of its 2C-Snow-Profile product and National Multi-sensor Mosaic QPE (NMQ) snowfall data. Prog. Electromagn. Res. 2014, 148, 55–61. [Google Scholar] [CrossRef]
- Skofronick-Jackson, G.; Petersen, W.A.; Berg, W.; Kidd, C.; Stocker, E.F.; Kirschbaum, D.B.; Kakar, R.; Braun, S.A.; Huffman, G.J.; Iguchi, T.; et al. The global precipitation measurement (GPM) mission for science and society. Bull. Am. Meteorol. Soc. 2017, 98, 1679–1695. [Google Scholar] [CrossRef]
- Hou, A.Y.; Kakar, R.K.; Neeck, S.; Azarbarzin, A.A.; Kummerow, C.D.; Kojima, M.; Oki, R.; Nakamura, K.; Iguchi, T. The Global Precipitation Measurement mission. Bull. Am. Meteorol. Soc. 2014, 95, 701–722. [Google Scholar] [CrossRef]
- Skofronick-Jackson, G.; Kulie, M.; Milani, L.; Munchak, S.J.; Wood, N.B.; Levizzani, V. Satellite estimation of falling snow: A Global Precipitation Measurement (GPM) core observatory perspective. J. Appl. Meteorol. Climatol. 2019, 58, 1429–1448. [Google Scholar] [CrossRef]
- Lenaerts, J.; Camron, M.D.; Wyburn-Powell, C.; Kay, J. Present-day and future Greenland Ice Sheet precipitation frequency from satellite observations and an Earth System Model. Cryosph. Discuss. 2020, 1–18. [Google Scholar] [CrossRef] [Green Version]
- Wood, N.B.; L’Ecuyer, T.S. Level 2C Snow Profile Process Description and Interface Control Document, Product Version P1_R05; NASA JPL CloudSat Project Document Revision 0; National Aeronautics and Space Administration, Jet Propulsion Laboratory: Pasadena, CA, USA, 2018; pp. 1–26. Available online: http://www.cloudsat.cira.colostate.edu/sites/default/files/products/files/2C-SNOW-PROFILE_PDICD.P1_R05.rev0_.pdf (accessed on 19 May 2021).
- Milani, L.; Wood, N.B. Supplementary Data: Biases in CloudSat Falling Snow Estimates Resulting from Daylight-Only Operations; Ver 1.0.0. Zenodo: Geneva, Switzerland, 2021. Available online: https://zenodo.org/record/4749304 (accessed on 19 May 2021). [CrossRef]
- Hersbach, H.; Bell, B.; Berrisford, P.; Biavati, G.; Horányi, A.; Sabater, J.M.; Nicolas, J.; Peubey, C.; Radu, R.; Rozum, I.; et al. ERA5 Hourly Data on Single Levels from 1979 to Present. Copernicus Climate Change Service (C3S) Climate Data Store (CDS). 2018. Available online: https://cds.climate.copernicus.eu/cdsapp#!/dataset/reanalysis-era5-single-levels?tab=overview (accessed on 16 April 2021). [CrossRef]
- Illingworth, A.J.; Barker, H.W.; Beljaars, A.; Ceccaldi, M.; Chepfer, H.; Clerbaux, N.; Cole, J.; Delanoë, J.; Domenech, C.; Donovan, D.P.; et al. The EarthCARE satellite: The next step forward in global measurements of clouds, aerosols, precipitation, and radiation. Bull. Am. Meteorol. Soc. 2015, 96, 1311–1332. [Google Scholar] [CrossRef] [Green Version]
- Ehsani, M.R.; Behrangi, A.; Adhikari, A.; Song, Y.; Huffman, G.J.; Adler, R.F.; Bolvin, D.T.; Nelkin, E.J. Assessment of the Advanced Very High-Resolution Radiometer (AVHRR) for snowfall retrieval in high latitudes using CloudSat and machine learning. J. Hydrometeorol. 2021. early online release. [Google Scholar] [CrossRef]
- Rysman, J.-F.; Panegrossi, G.; Sanò, P.; Marra, A.C.; Dietrich, S.; Milani, L.; Kulie, M.S. SLALOM: An all-surfce snow water path retrieval algorithm for the GPM Microwave Imager. Remote. Sens. 2018, 10, 1278. [Google Scholar] [CrossRef] [Green Version]
- Rysman, J.-F.; Panegrossi, G.; Sanò, P.; Marra, A.C.; Dietrich, S.; Milani, L.; Kulie, M.S.; Casella, D.; Camplani, A.; Claud, C.; et al. Retrieving surface snowfall with the GPM Microwave Imager: A new module for the SLALOM algorithm. Geophys. Res. Lett. 2019, 46, 13593–13601. [Google Scholar] [CrossRef]
Figure 1.
Number of profiles in each 1° × 1° latitude–longitude grid box for the Full-Op period’s (September 2006–August 2010) ascending (a) and descending (b) orbits, and the DO-Op period’s (September 2012–August 2016) ascending (c) and descending (d) orbits. Percentage difference of the number of profiles between DO-Op and Full-Op (D−F) for ascending (e) and descending (f) orbits.

Figure 2.
Number of profiles as a function of local time by latitude for (a) Full-Op and (b) DO-Op.

Figure 3.
Snow Fraction (SF, left column) and Mean Snowfall Rate (MSR, right column) for (a–b) Full-Op, (c–d) DO-Op, (e–f) Full-Op-R.
Figure 3.
Snow Fraction (SF, left column) and Mean Snowfall Rate (MSR, right column) for (a–b) Full-Op, (c–d) DO-Op, (e–f) Full-Op-R.

Figure 4.
(a) Latitudinal 2CSP MSR (solid lines) and ERA5 mean annual snow accumulation (dashed lines); (b) difference between different 2CSP datasets (mm y−1), ERA5 is included for a trend comparison; (c) percentage difference between different 2CSP datasets, ERA5 is included for a trend comparison. For panel (c), a threshold of 45 mm y−1 (0.005 mm h−1) has been applied to the MSR values prior to the percentage calculation to avoid showing uninformative high percentage differences for minimal MSR variations.

Figure 5.
Difference between Full-Op-R and Full-Op (a) Snow Fraction (SF) and (b) Mean Snowfall Rate (MSR) and between DO-Op and Full-Op-R (c) SF and (d) MSF.
Figure 5.
Difference between Full-Op-R and Full-Op (a) Snow Fraction (SF) and (b) Mean Snowfall Rate (MSR) and between DO-Op and Full-Op-R (c) SF and (d) MSF.


Table 1.
Number of profiles for each operational period for the entire satellite spatial coverage (Global, 82S-82N), the northern hemisphere (NH, 0-82N), and the southern hemisphere (SH, 82S-0). The counts are normalized considering the missing days in each period’s dataset.
Table 1.
Number of profiles for each operational period for the entire satellite spatial coverage (Global, 82S-82N), the northern hemisphere (NH, 0-82N), and the southern hemisphere (SH, 82S-0). The counts are normalized considering the missing days in each period’s dataset.
| Orbital Track | Period | Global (× 108) | NH (× 108) | SH (× 108) |
|---|---|---|---|---|
| Total | Full-Op | 7.69 | 3.86 | 3.87 |
| Full-Op-R | 4.28 | 2.54 | 1.76 | |
| DO-Op | 4.18 | 2.47 | 1.73 | |
| Ascending | Full-Op | 3.85 | 1.93 | 1.94 |
| Full-Op-R | 3.56 | 1.93 | 1.66 | |
| DO-Op | 3.48 | 1.88 | 1.62 | |
| Descending | Full-Op | 3.85 | 1.93 | 1.94 |
| Full-Op-R | 0.72 | 0.62 | 0.10 | |
| DO-Op | 0.69 | 0.59 | 0.10 |
Table 2.
Near-global (82S-82N) 2CSP Snowfall Fraction (SF) and yearly Mean Snowfall Rates (MSR), and ERA5 mean annual snowfall accumulation for the Full-Op, DO-Op, and Full-Op-R.
Table 2.
Near-global (82S-82N) 2CSP Snowfall Fraction (SF) and yearly Mean Snowfall Rates (MSR), and ERA5 mean annual snowfall accumulation for the Full-Op, DO-Op, and Full-Op-R.
| Period | 2CSP SF (%) | 2CSP MSR (mm y−1) | ERA5 accum. (mm y−1) |
|---|---|---|---|
| Full-Op | 4.33 | 74.63 | 86.28 |
| DO-Op | 3.89 | 68.32 | 86.92 |
| Full-Op-R | 3.84 | 65.45 |
Publisher’s Note: MDPI stays neutral with regard to jurisdictional claims in published maps and institutional affiliations. |
© 2021 by the authors. Licensee MDPI, Basel, Switzerland. This article is an open access article distributed under the terms and conditions of the Creative Commons Attribution (CC BY) license (https://creativecommons.org/licenses/by/4.0/).
Share and Cite
MDPI and ACS Style
Milani, L.; Wood, N.B. Biases in CloudSat Falling Snow Estimates Resulting from Daylight-Only Operations. Remote Sens. 2021, 13, 2041. https://0-doi-org.brum.beds.ac.uk/10.3390/rs13112041
AMA Style
Milani L, Wood NB. Biases in CloudSat Falling Snow Estimates Resulting from Daylight-Only Operations. Remote Sensing. 2021; 13(11):2041. https://0-doi-org.brum.beds.ac.uk/10.3390/rs13112041
Chicago/Turabian StyleMilani, Lisa, and Norman B. Wood. 2021. "Biases in CloudSat Falling Snow Estimates Resulting from Daylight-Only Operations" Remote Sensing 13, no. 11: 2041. https://0-doi-org.brum.beds.ac.uk/10.3390/rs13112041
Note that from the first issue of 2016, this journal uses article numbers instead of page numbers. See further details here.