
Individual Tree Canopy Parameters Estimation Using UAV-Based Photogrammetric and LiDAR Point Clouds in an Urban Park


1
Department of Geomatics, Faculty of Civil Engineering, Babol Noshirvani University of Technology, Babol 4714871167, Iran
2
Centre for Urban Research, School of Global, Urban and Social Studies, RMIT University, Melbourne, VIC 3000, Australia
*
Author to whom correspondence should be addressed.
Remote Sens. 2021, 13(11), 2062; https://0-doi-org.brum.beds.ac.uk/10.3390/rs13112062
Submission received: 21 April 2021
/
Revised: 17 May 2021
/
Accepted: 20 May 2021
/
Published: 24 May 2021
(This article belongs to the Special Issue Individual Tree Detection and Characterisation from UAV Data)
Abstract
:Estimation of urban tree canopy parameters plays a crucial role in urban forest management. Unmanned aerial vehicles (UAV) have been widely used for many applications particularly forestry mapping. UAV-derived images, captured by an onboard camera, provide a means to produce 3D point clouds using photogrammetric mapping. Similarly, small UAV mounted light detection and ranging (LiDAR) sensors can also provide very dense 3D point clouds. While point clouds derived from both photogrammetric and LiDAR sensors can allow the accurate estimation of critical tree canopy parameters, so far a comparison of both techniques is missing. Point clouds derived from these sources vary according to differences in data collection and processing, a detailed comparison of point clouds in terms of accuracy and completeness, in relation to tree canopy parameters using point clouds is necessary. In this research, point clouds produced by UAV-photogrammetry and -LiDAR over an urban park along with the estimated tree canopy parameters are compared, and results are presented. The results show that UAV-photogrammetry and -LiDAR point clouds are highly correlated with R2 of 99.54% and the estimated tree canopy parameters are correlated with R2 of higher than 95%.
1. Introduction
Urban trees play a critical role in greening and sustainably managing cities [1,2,3,4]. To monitor urban trees, regular mapping is required. The traditional measurement methods for tree canopy parameters such as height, diameter, area, and volume of canopies are expensive due to time and labour especially when high accuracy is required over the area of a local government. By contrast, remotely sensed 3D mapping tree canopy methods can estimate tree canopy parameters accurately over a large area [5,6,7,8]. 3D mapping methods rely on either Light Detection And Ranging (LiDAR) or Photogrammetric 3D measurements. Both LiDAR and photogrammetric methods generate 3D point clouds which can be used to estimate required parameters through further point cloud processing.
Unmanned Aerial Vehicles (UAV) have emerged as an increasingly important new platform for 3D data collection with many applications [9]. Legal restriction on flying UAVs in Australia varies according to the weight of the craft, where the craft is flown and whether the UAV is flown recreationally or commercially. Exclusion zones exist within 5.5 km of control zones, which cover large metropolitan areas. Nonetheless, even in urban areas UAV use of more than 2 kg, such as would be typical for data acquisition, is possible for commercial operators with a remote pilot licence and a remotely piloted aircraft operated certificate. Permission for each flight has to be obtained from the Civil Aviation Safety Authority [10]. These requirements impose many hours of preparation before data acquisition can be made.
UAV data acquisition in urban areas can be useful, in some cases replacing fixed-wing aircraft capture. As the expenditure for each commercial UAV operation is lower it allows for an increased frequency of data acquisition. UAVs have been widely used for forest and urban tree inventory [11,12,13,14], urban tree canopy parameter estimation [15,16,17,18,19,20], estimation of forest canopy fuel [21] and mapping forest structure [22]. Aerial and UAV-based LiDAR data has attracted much interest for researchers in forest inventory applications [23,24,25,26,27] particularly for the corridor and utility mapping [28]. In addition to the use of mobile LiDAR for 3D forest mapping [24] the fusion of imagery and LiDAR data also has been used for 3D modelling and mapping urban tree canopies [29].
Estimation of urban tree parameters from point clouds has a more than thirty-year history. Tree canopies were initially reduced to a digital surface model using algorithms to define the ground layer from laser scanning [30]. As point clouds from buildings are distinct from tree these permitted a form of segmentation [31], later on overlapping canopies could be identified as individual tree stands by combining point clouds with other spectral information [32]. As higher resolution scans became available, especially through terrestrial laser scanning, feature extraction developed in computer science [33], could be applied to the automatic recognition of tree canopy parameters using statistical techniques such as principal component analysis [34]. Two key drivers of research can be identified over this period. One is the extraction of tree features such as canopy volume, branches and trunks to build 3D tree models [35]. The other is the extraction of tree parameters that may be used by urban foresters for assessing the ecosystem service benefits of trees such as canopy height and volume leaf area index [36,37], leaf area density distribution [38] or the hazards of potential wildfires in areas of urban interfaces [39].
Across this historical development, perennial challenges remain for 3D mapping of urban trees. These include access to trees that may be located in the private realm, which limits terrestrial laser scanning; pruning and species diversity, which limits the use of automatic feature recognition and individual tree segmentation, cost of data collection and processing and occlusion.
In the following, we contribute to the understanding of the challenges for mapping urban trees by considering the differences between point clouds that are derived from two different sources using a UAV platform, to guide the use of these collection methods. So far, we know of no study which has compared the accuracy of tree parameters derived from point clouds from two different data acquisition methods using a UAV over an urban forest. Forest structural attributes in subtropical planted forests were estimated using UAV-based photogrammetric and LiDAR point clouds in [11,26] but individual tree parameters have not been studied. However, inferences can be gained on performance, such as reduction of the standard deviation of tree height, by understanding the workflow required of UAV-derived LiDAR data and increases in point density in a forested environment [40], and on the accuracy of ALS in predicting the position of trees [41]. Given the variability of canopy shapes due to pruning and species selection in an urban environment and the essential role that leaf area has to play in delivering ecosystem services, an understanding of the limits of canopy mapping from UAVs is important for urban foresters in making a choice of which point cloud acquisition technique to use.
Our study aims to contribute to the quality of decision making by guiding the use of UAVs for data acquisition. We, therefore, compare the results from the same platform but do not ground-truth our chosen tree parameters because measuring tree canopies is a complex task in an urban environment and ground-based methods for tree canopy measurements, such as those that rely on trigonometry for measuring height, are less accurate than 3D measurement methods [42] and prone to operator error, occlusion and the effects of humidity and air temperature especially when using ultrasound [43]. Our chosen 3D measurement methods are UAV-based imagery data, which provides 3D point cloud data via a photogrammetric method along with RGB and NIR information for each point and UAV-LiDAR, which produces 3D point cloud without semantic information except for intensity [44,45,46].
The point clouds derived from UAV photogrammetric and LiDAR vary according to different aspects and several research works have been conducted for accuracy assessment of UAV-based photogrammetric and LiDAR point clouds [13,47,48]. Moreover, photogrammetric and LiDAR point clouds have been compared for many application such as change detection [49], flood mapping [50], agriculture [51,52], forestry applications [53,54,55,56,57] and urban tree species mapping [41].
This study presents the capability of LiDAR and photogrammetric acquisition-derived point clouds to estimate tree canopy parameters in a park. Our selection of this experimental site is deliberately aimed at isolating and discussing the factors that can affect tree canopy measurement from different point clouds. In particular, it compares (1) point clouds derived from LiDAR and photogrammetric source; and (2) tree parameters estimated using LiDAR and photogrammetric methods.
The remainder of this paper is organized as follows: Section 2 presents the data set and methods. Section 3 introduces the proposed comparisons of the point cloud derived from different sources along with the analysis of the results. Discussion of the obtained outcomes is presented in Section 4, and conclusions follow in Section 5.
2. Materials and Method
2.1. Study Area
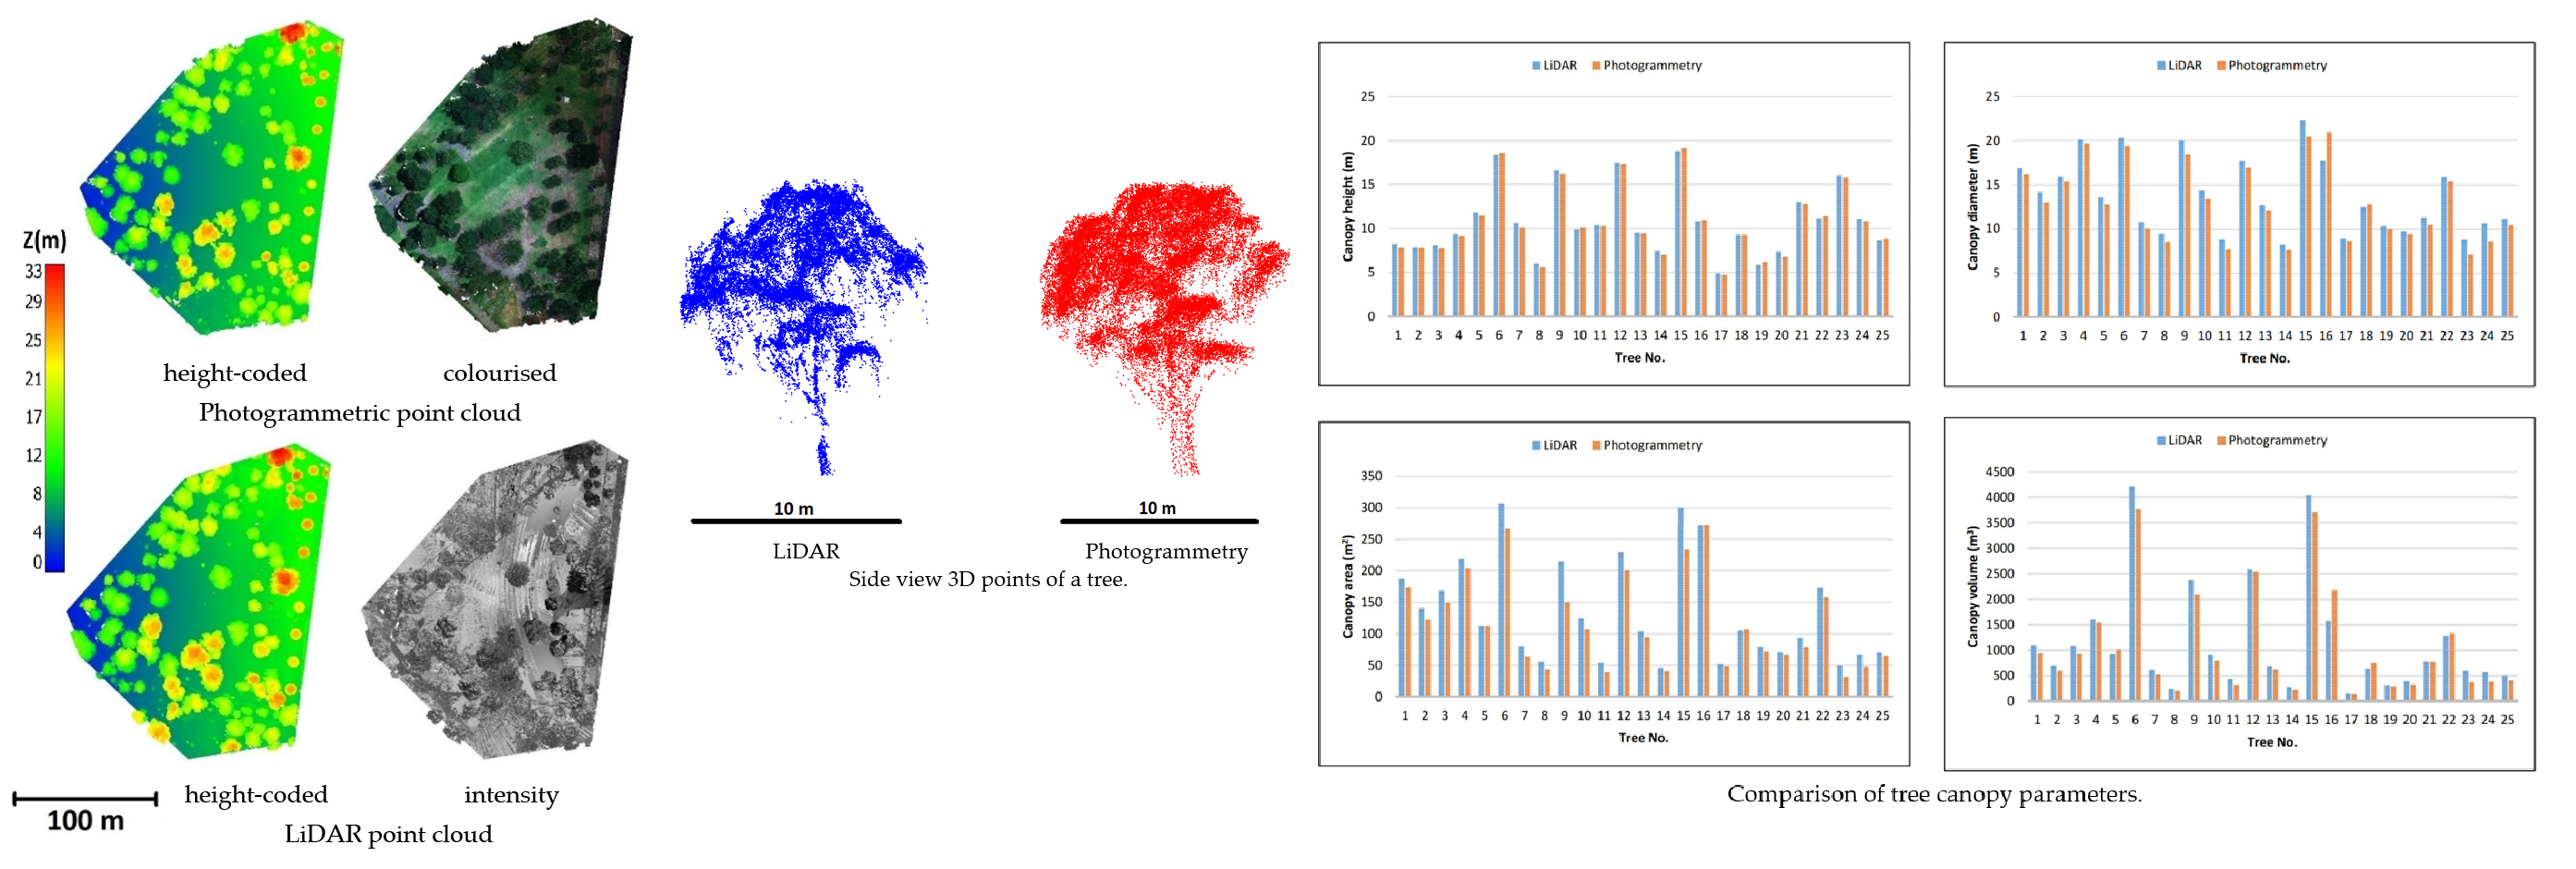
The study area (around 200 m × 250 m) covers a part of Yarra Park in Melbourne, Australia. It is limited between the latitude of 37°49′2″S and 37°49′9″S and the longitude of 144°59′9″ and 144°59′16″E and comprises Eucalyptus microcorys, Ficus macrophylla, and Ulmus procera trees. The area is not large because of the flight restrictions for UAVs in urban areas and the high expense of UAV LiDAR data collection. Figure 1 shows the study area along with the measured ground control points (GCP). Trimble R8 Global Navigation Satellite System (GNSS) receiver is used for positioning the GCPs with an accuracy of 1–2 cm through the real-time kinematic (RTK) positioning method.
2.2. Data Collection
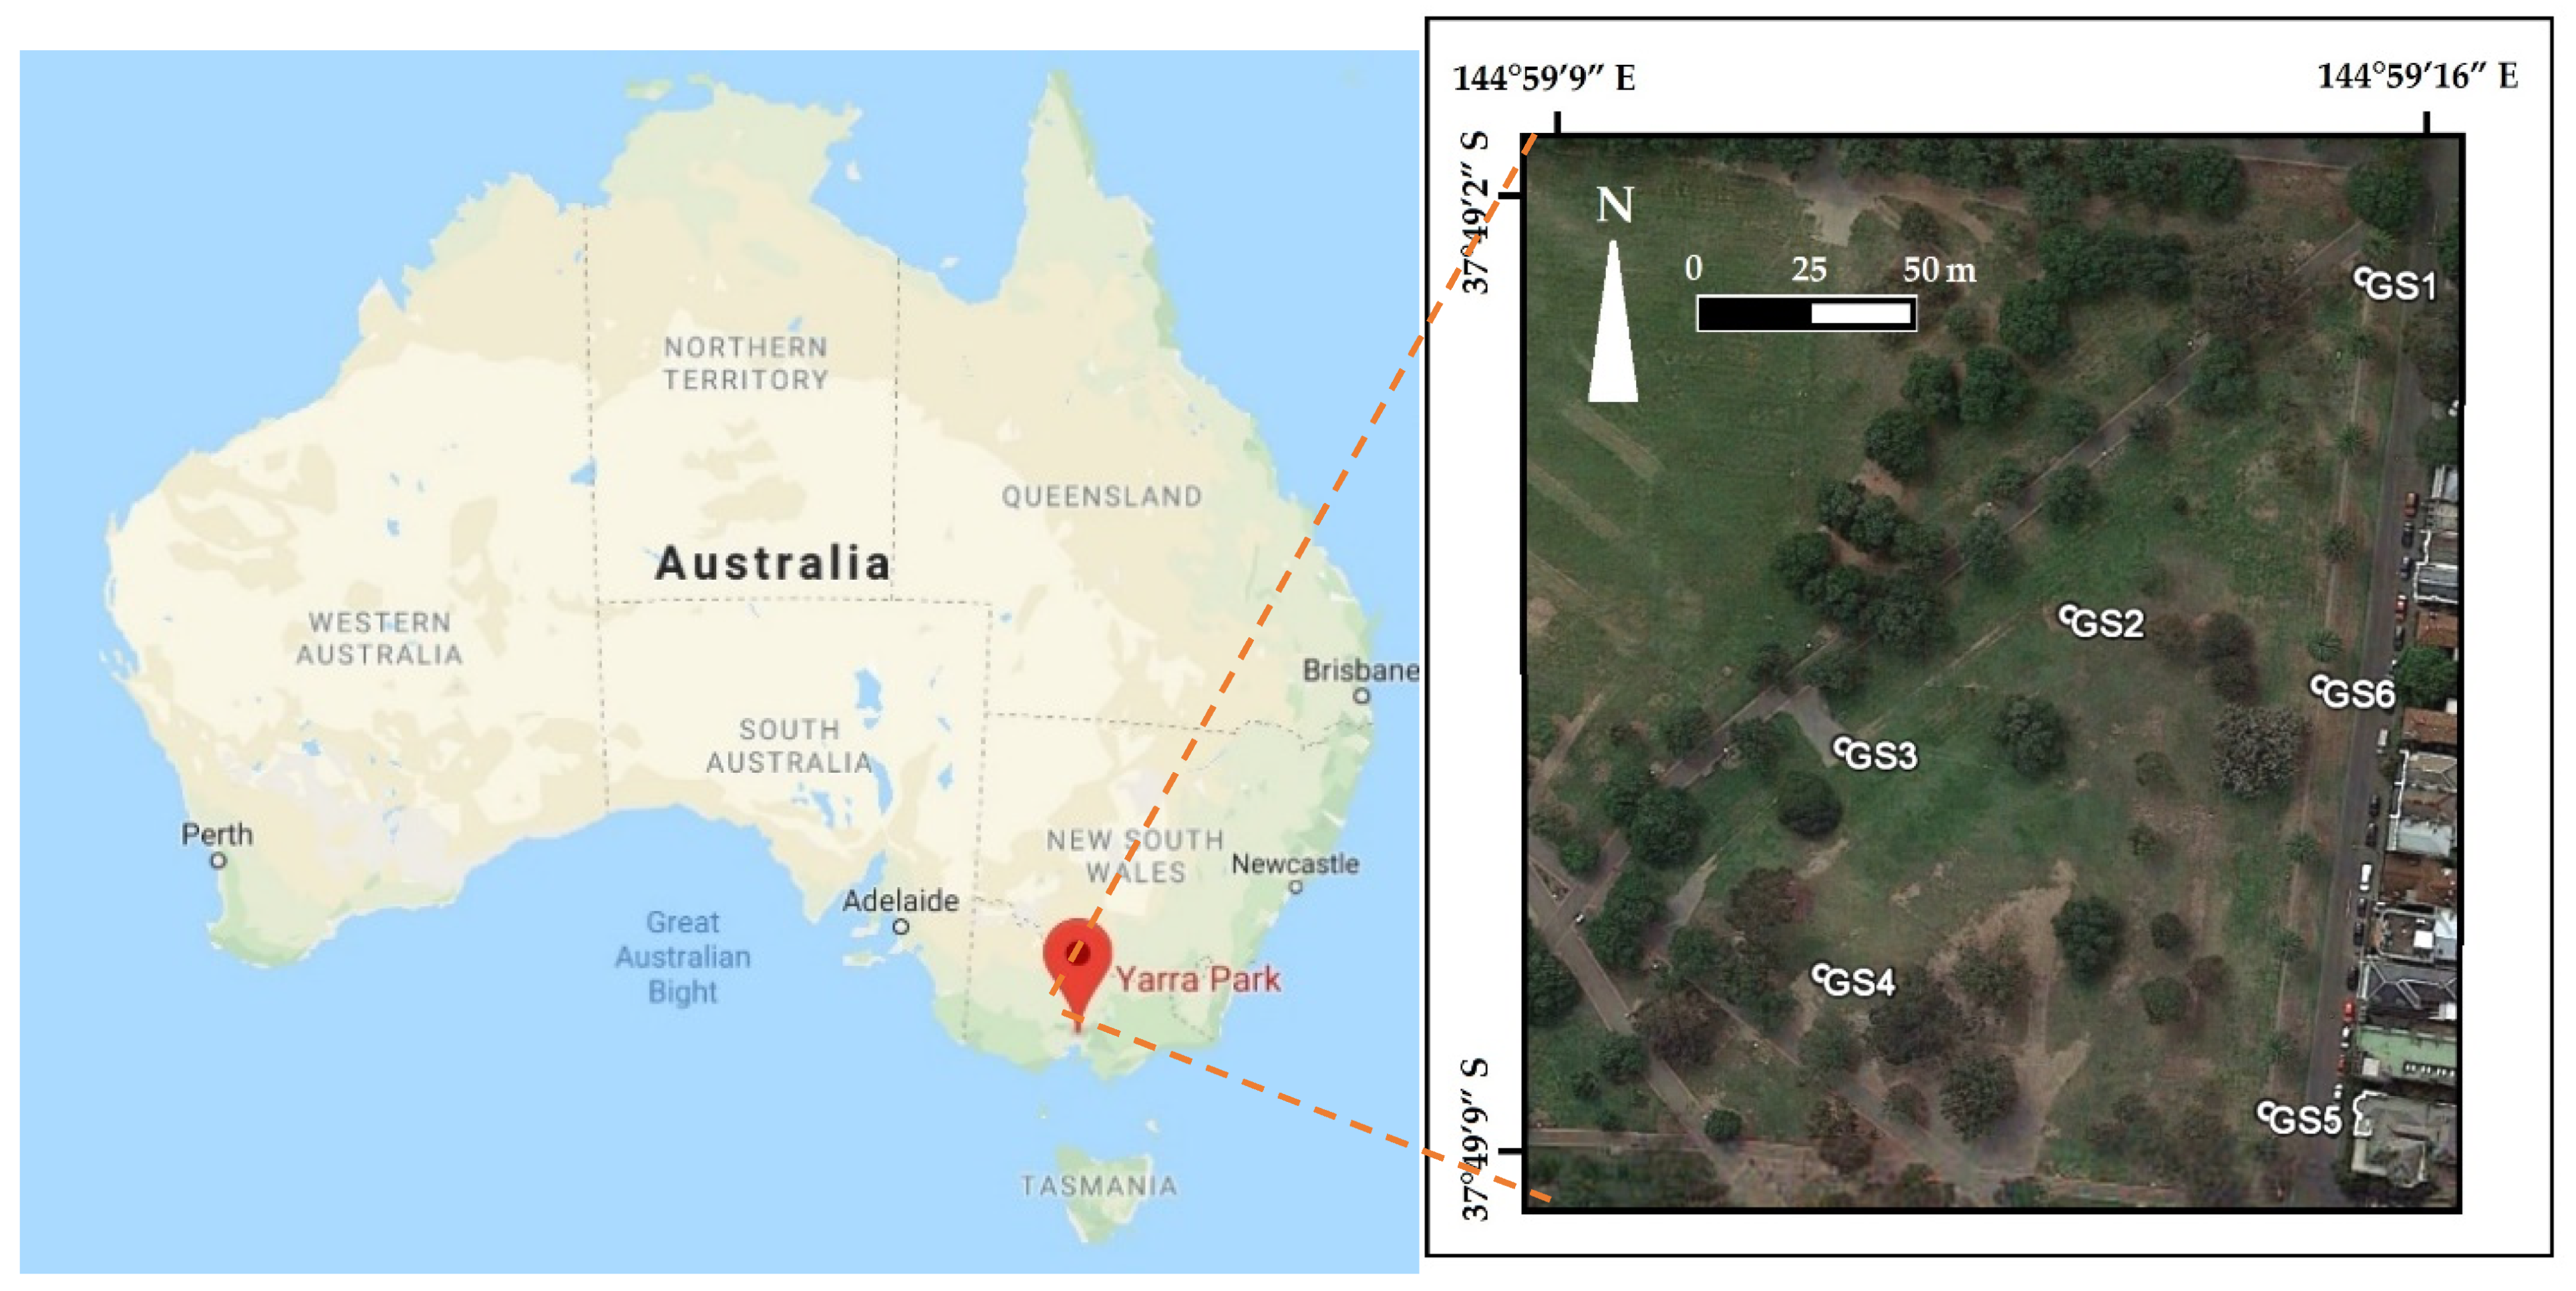
The LiDAR and imagery data were collected in 2017 using a LiDAR and imagery sensor installed on the UAV which is developed by Melbourne Unmanned Aircraft Systems Integration Platform (https://infrastructure.eng.unimelb.edu.au/unmanned-aircraft/, accessed on 1 April 2021), shown in Figure 2.
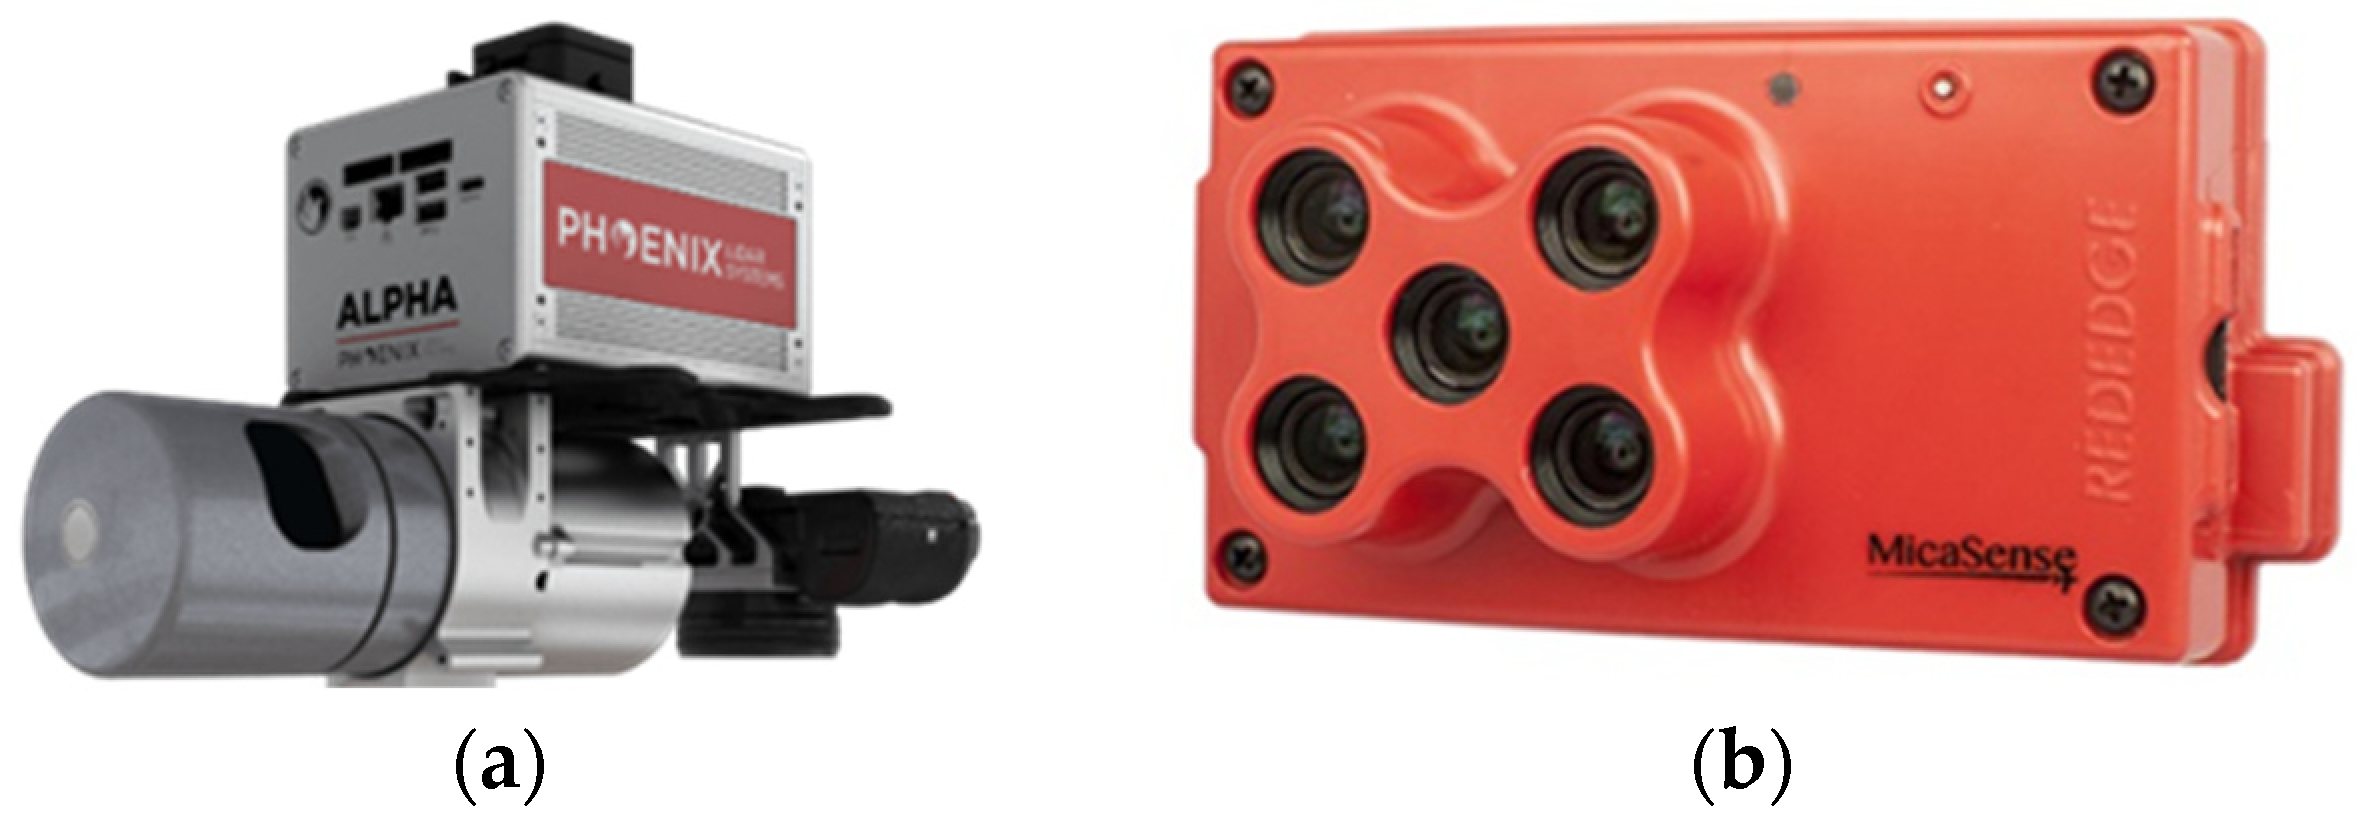
The LiDAR sensor Phoenix ALPHA AL3-32 (Figure 3a) with ranging accuracy of 35 mm in 50 m and with a scanning speed of 700,000 points per second is used for LiDAR point cloud collection. A brief technical specification of the LiDAR sensor is provided in Table 1.
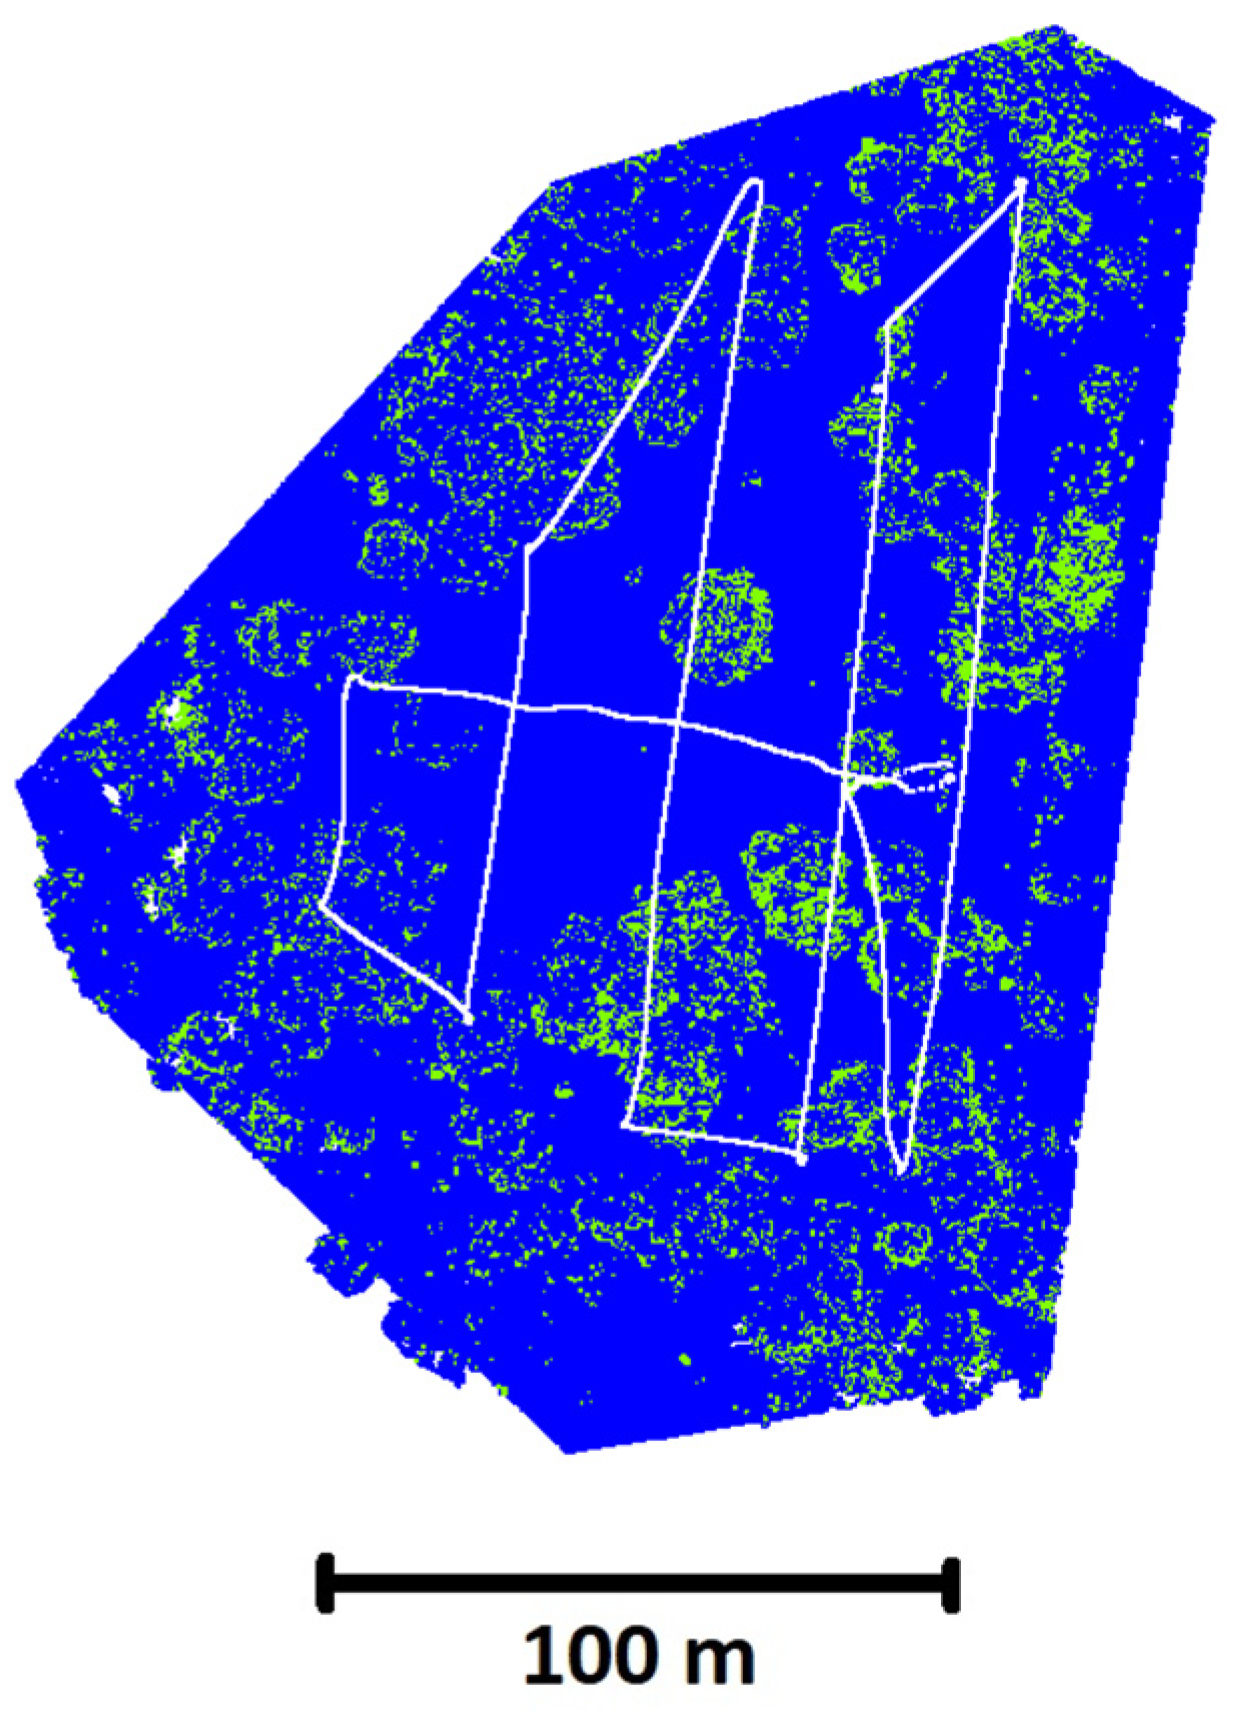
The LiDAR beams can penetrate in areas with vegetation, particularly tree areas, and provide understory information for tree canopies. The number of returns (the first and last return) is shown in Figure 4 along with the UAV trajectories. As LiDAR and imagery sensors were installed on the platform, both LiDAR scanning and imagery data were collected simultaneously.
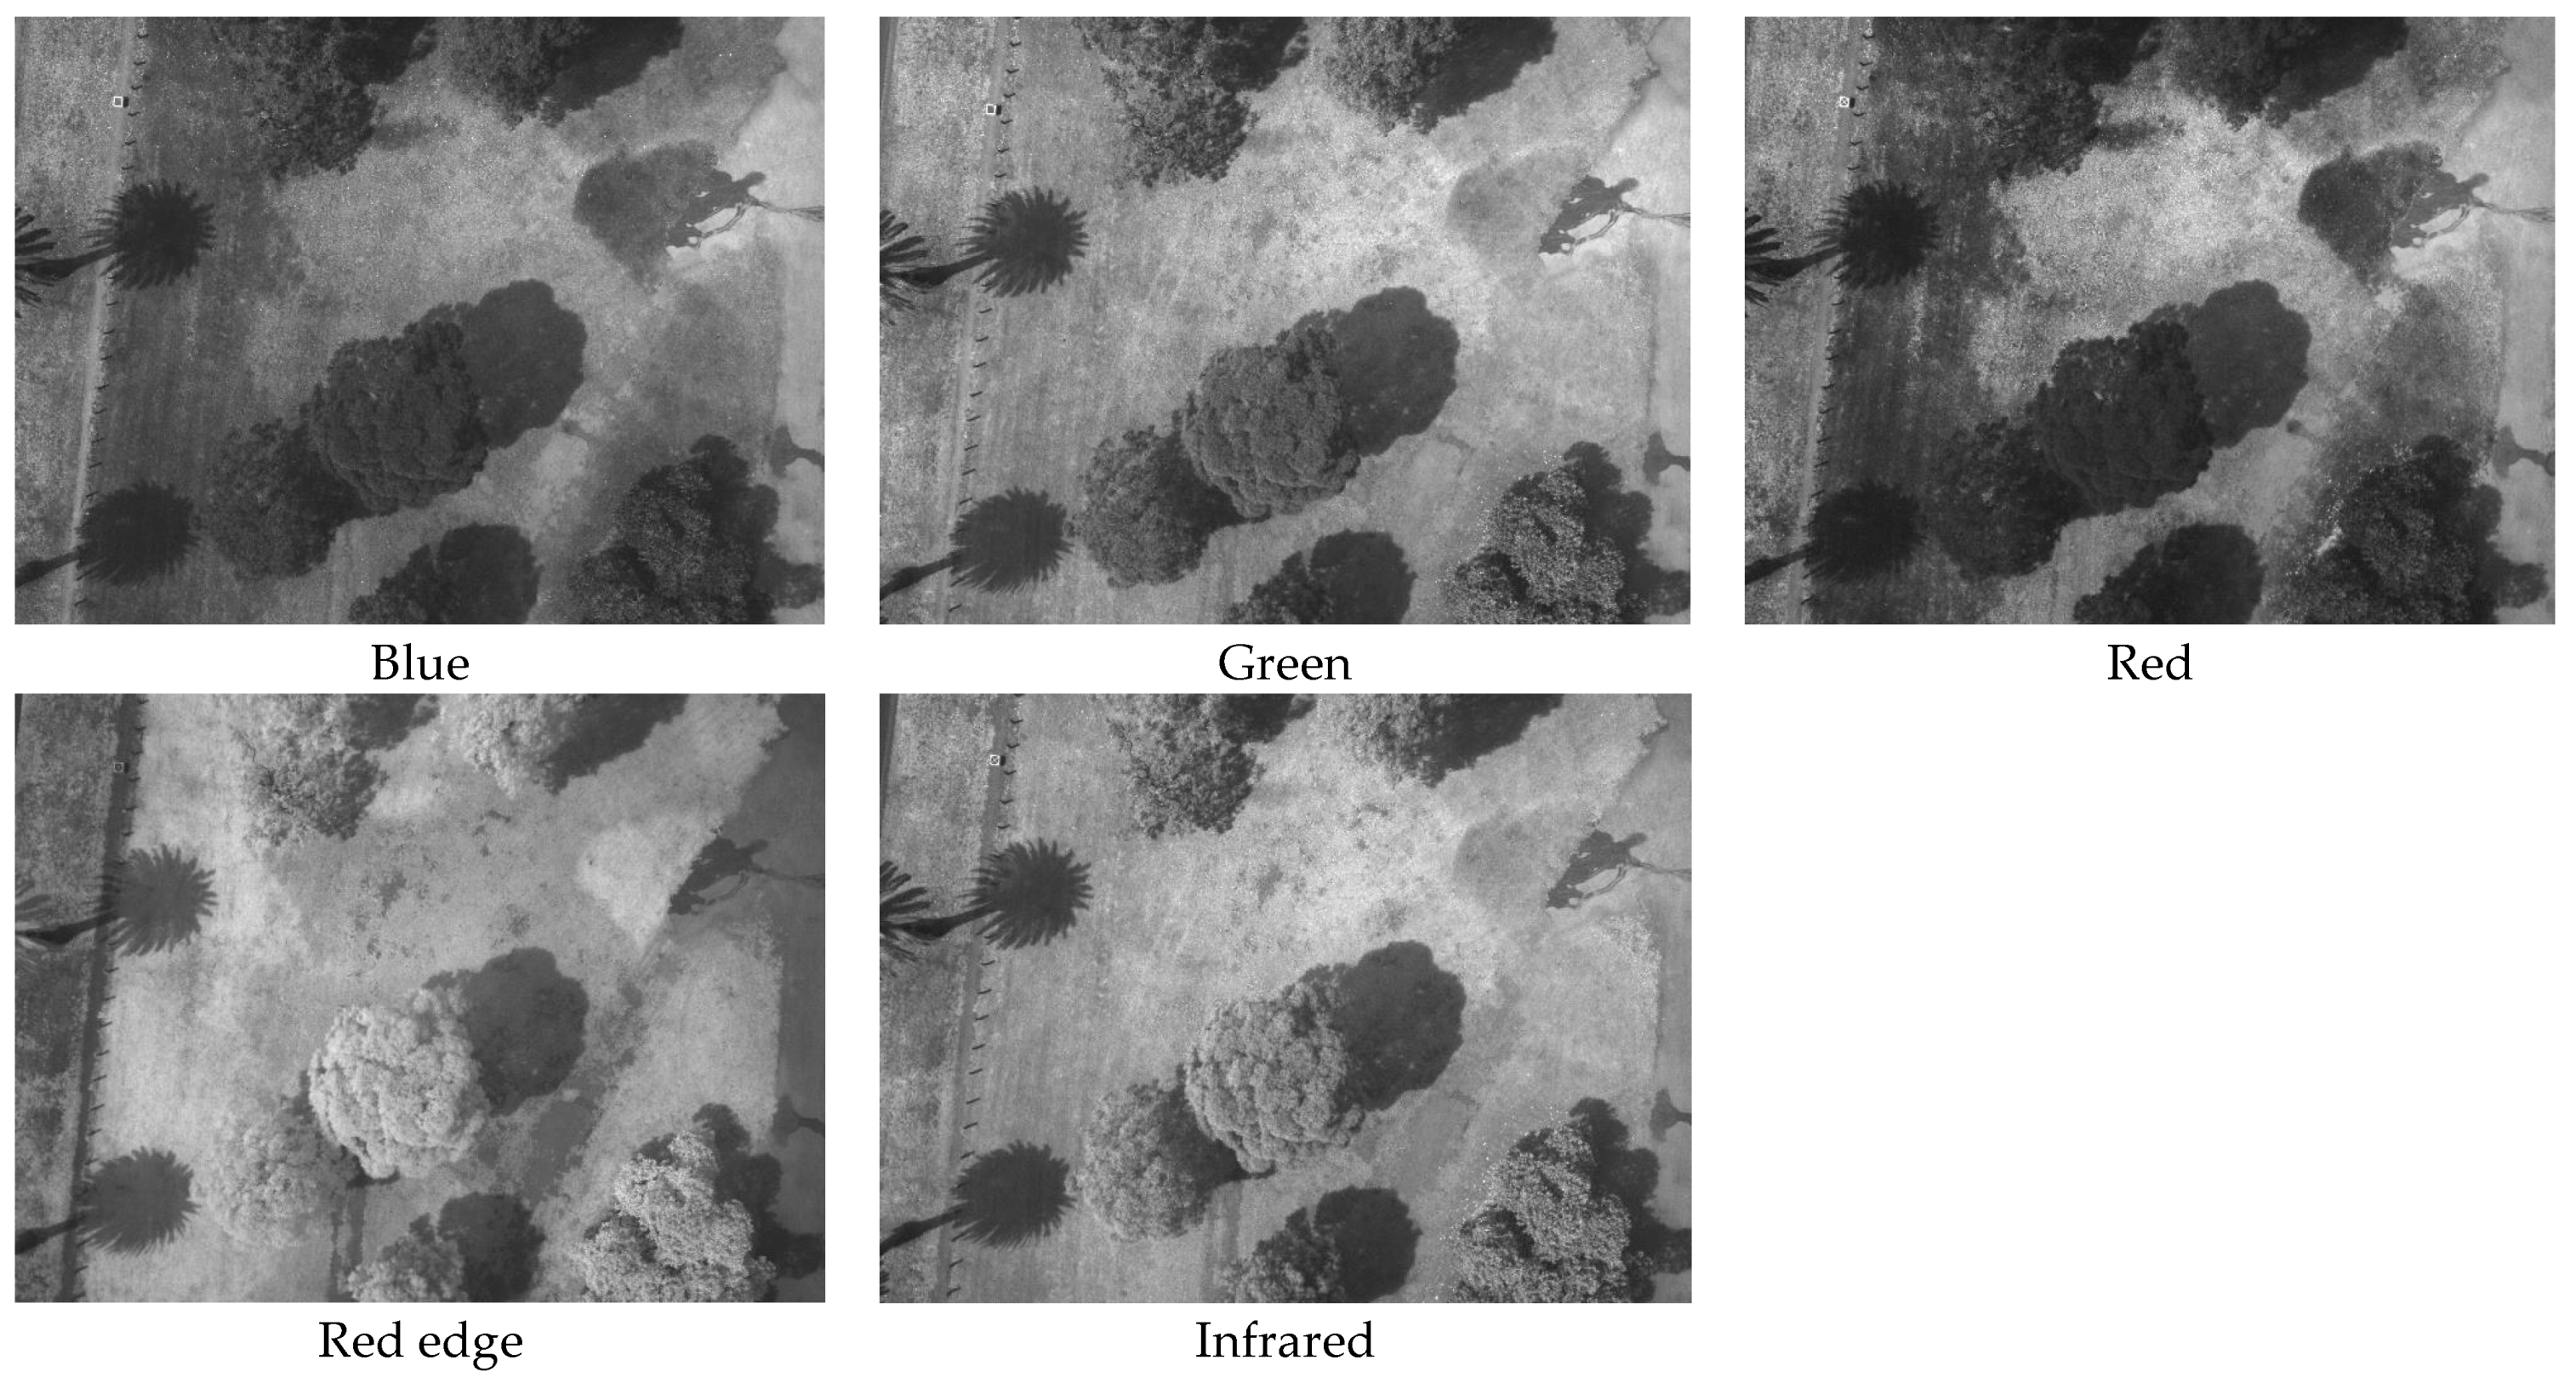
The imagery data has been captured by MicaSense RedEdge (Figure 3b) multispectral camera with 5 spectral bands (blue, green, red, red edge, near-infrared) of 960 × 1280 pixels. In total, 181 multispectral images with a spatial resolution of 8 cm ground sampled distance (GSD) at 80 m above ground level (AGL) flight with 90% overlap between the images and 70% overlap between the flight-lines were collected. Figure 5 shows one of the multispectral images and highlights that red edge and near infra-red images offer different information rather than RGB images emphasising the trees.
2.3. Data Processing
To generate the LiDAR point cloud, post-processing of LiDAR observations including ranging, position and orientation of the ranging sensor was carried out by the Phoenix software suite. First, IMU and GNSS data were combined to generate smooth and accurate flight trajectories (Figure 4). Then, calibration and coordinates of each laser return were calculated, and finally, the data from multiple flight lines were geo-referenced and the aligned data was exported in LAS format. To remove the erroneous points from the point cloud, the exported LAS file was de-noised in the CloudCompare software (www.danielgm.net/cc/, accessed on 1 April 2021).
The LiDAR point cloud includes the XYZ coordinate of points along with the intensity information which is related to surface reflectance, range, angle of incidence, etc. and is similar to the near-infrared images.
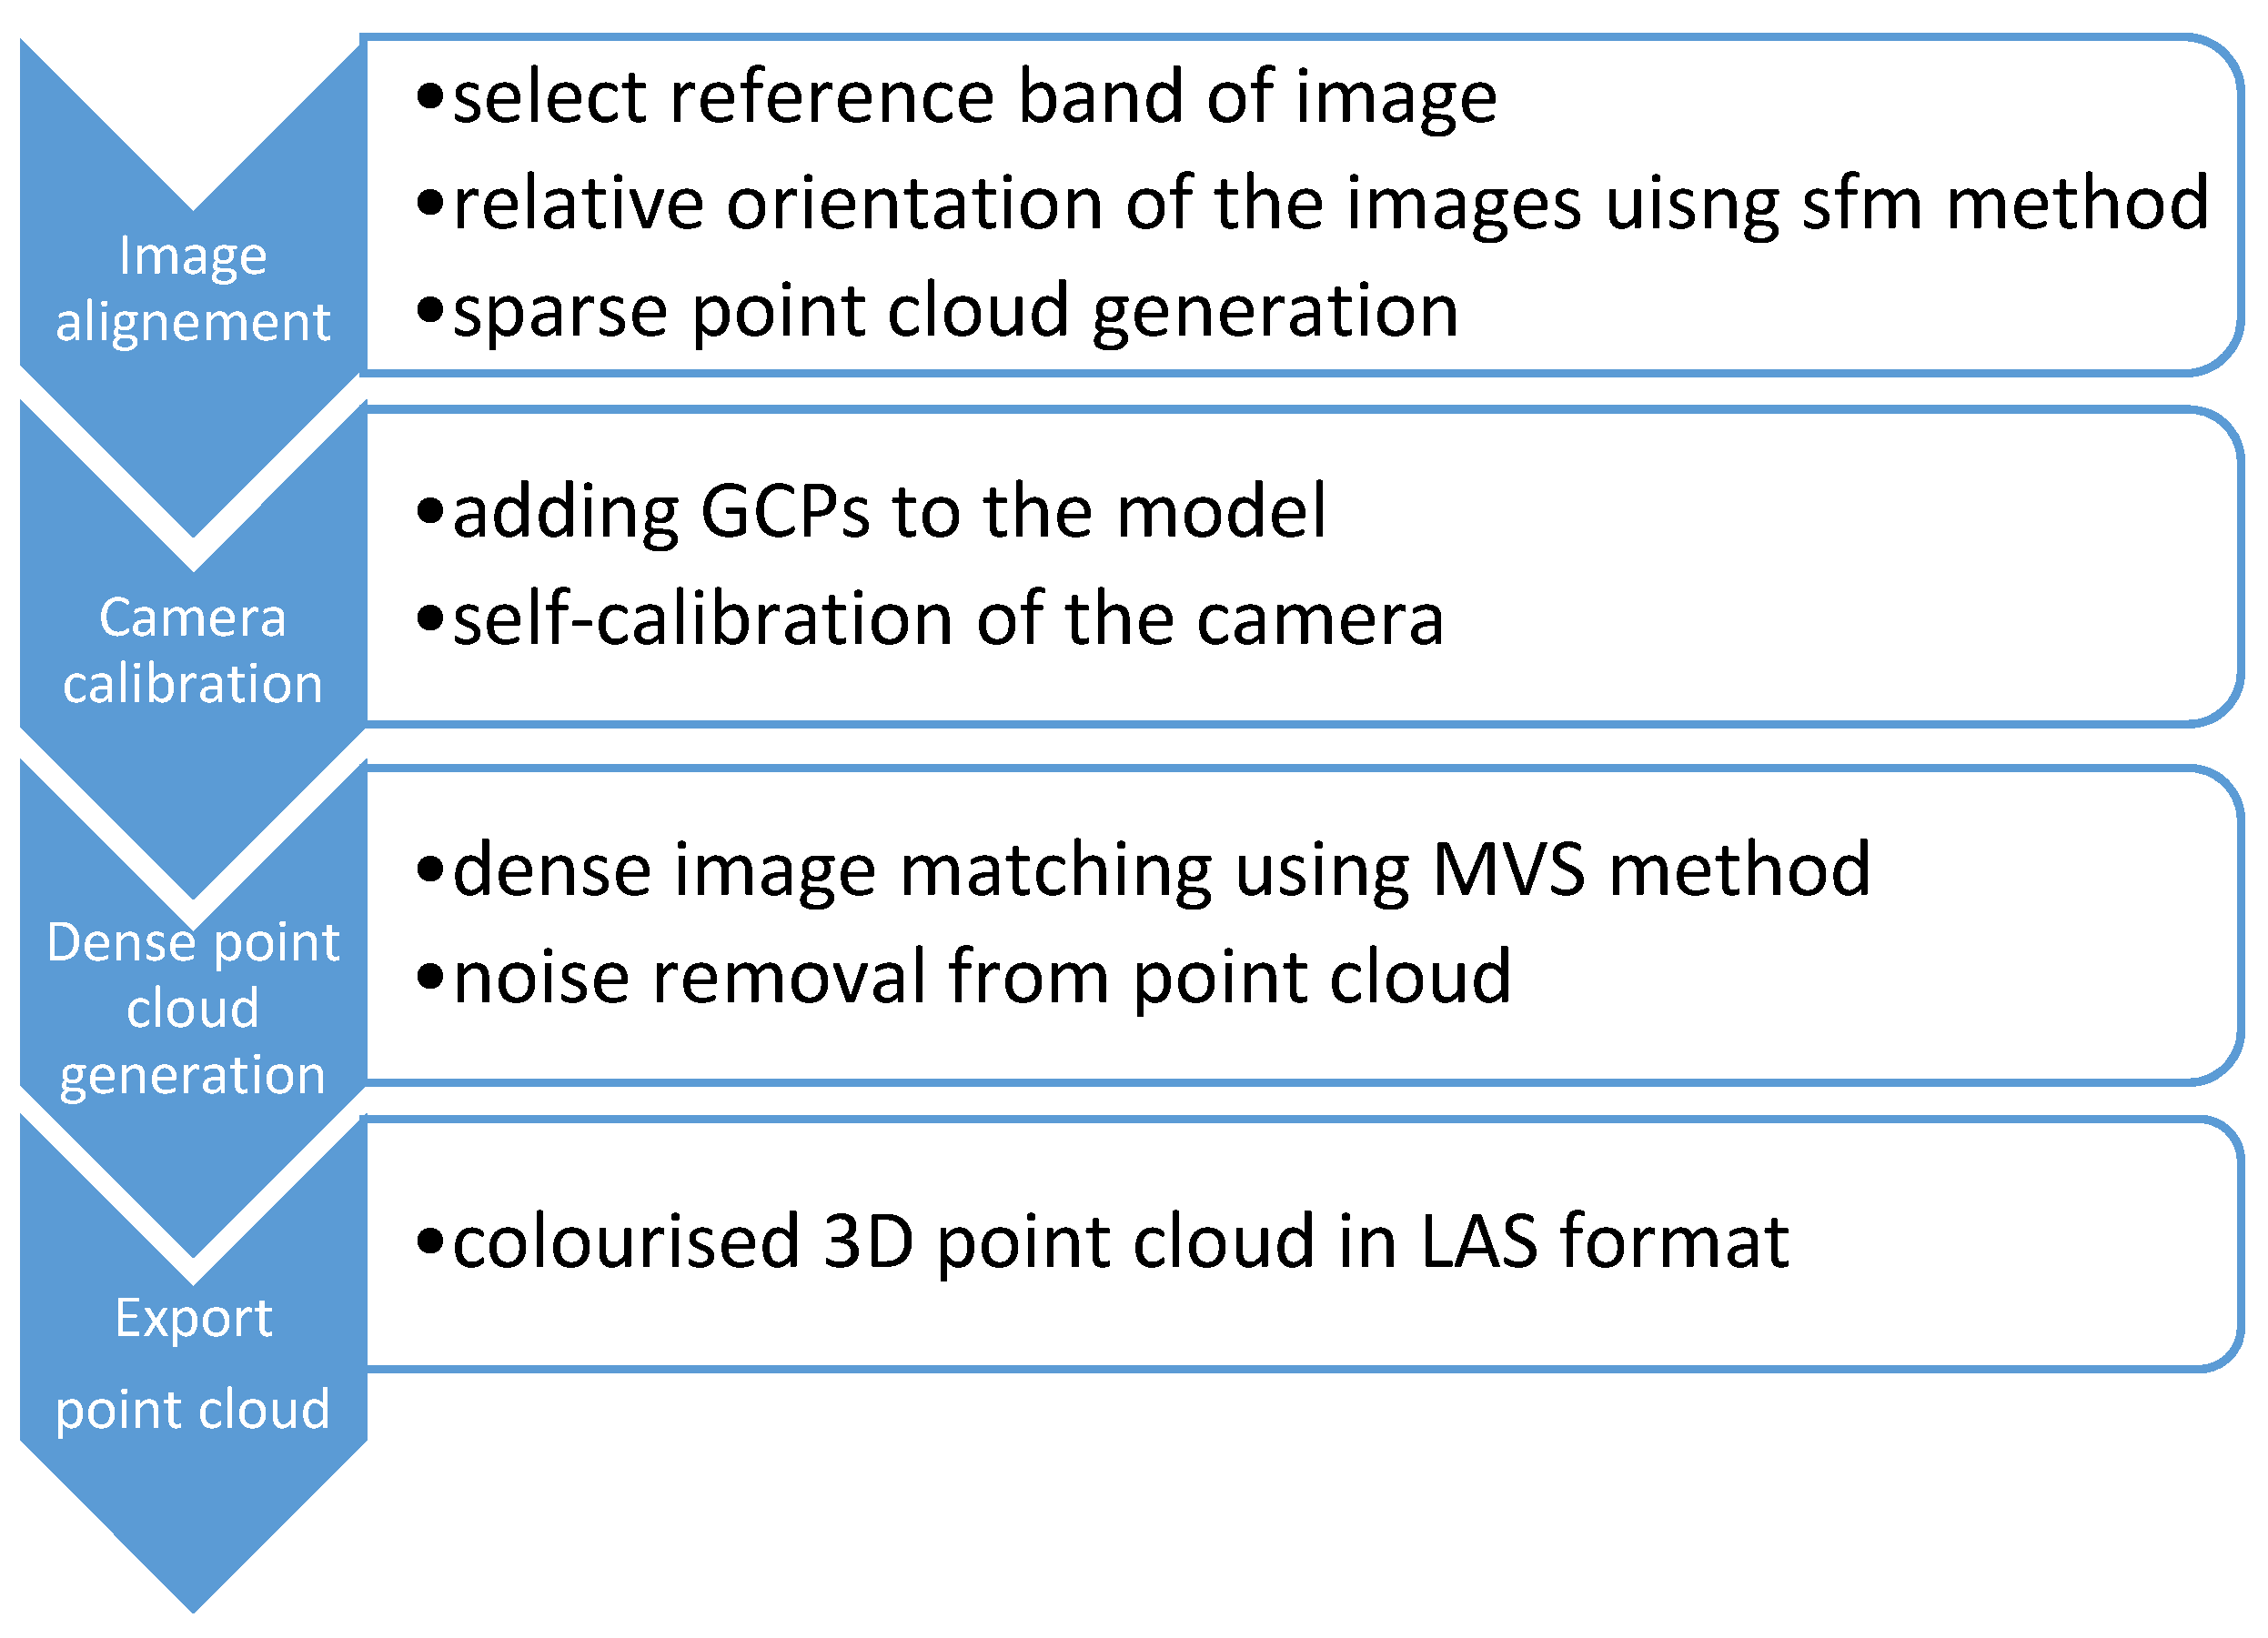
In order to create a point cloud from UAV images, photogrammetric data processing procedures such as aerotriangulation and dense cloud generation are required. The workflow of photogrammetric data processing is demonstrated in Figure 6. The aerotriangulation, self-calibration of the camera and dense cloud generation were performed using Agisoft Metashape software (www.agisoft.com, accessed on 1 April 2021) which utilises shape-from-motion (SFM) [58] and multi-view-stereo (MVS) [59] for aerotriangulation and point cloud generation, respectively. As shown in Figure 1, six control points with millimetre accuracy level have been utilised for geo-referencing the photogrammetric 3D model.
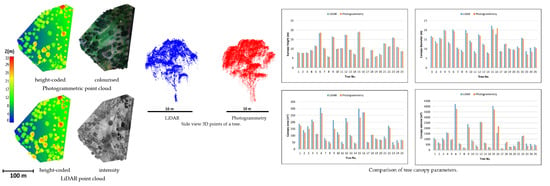
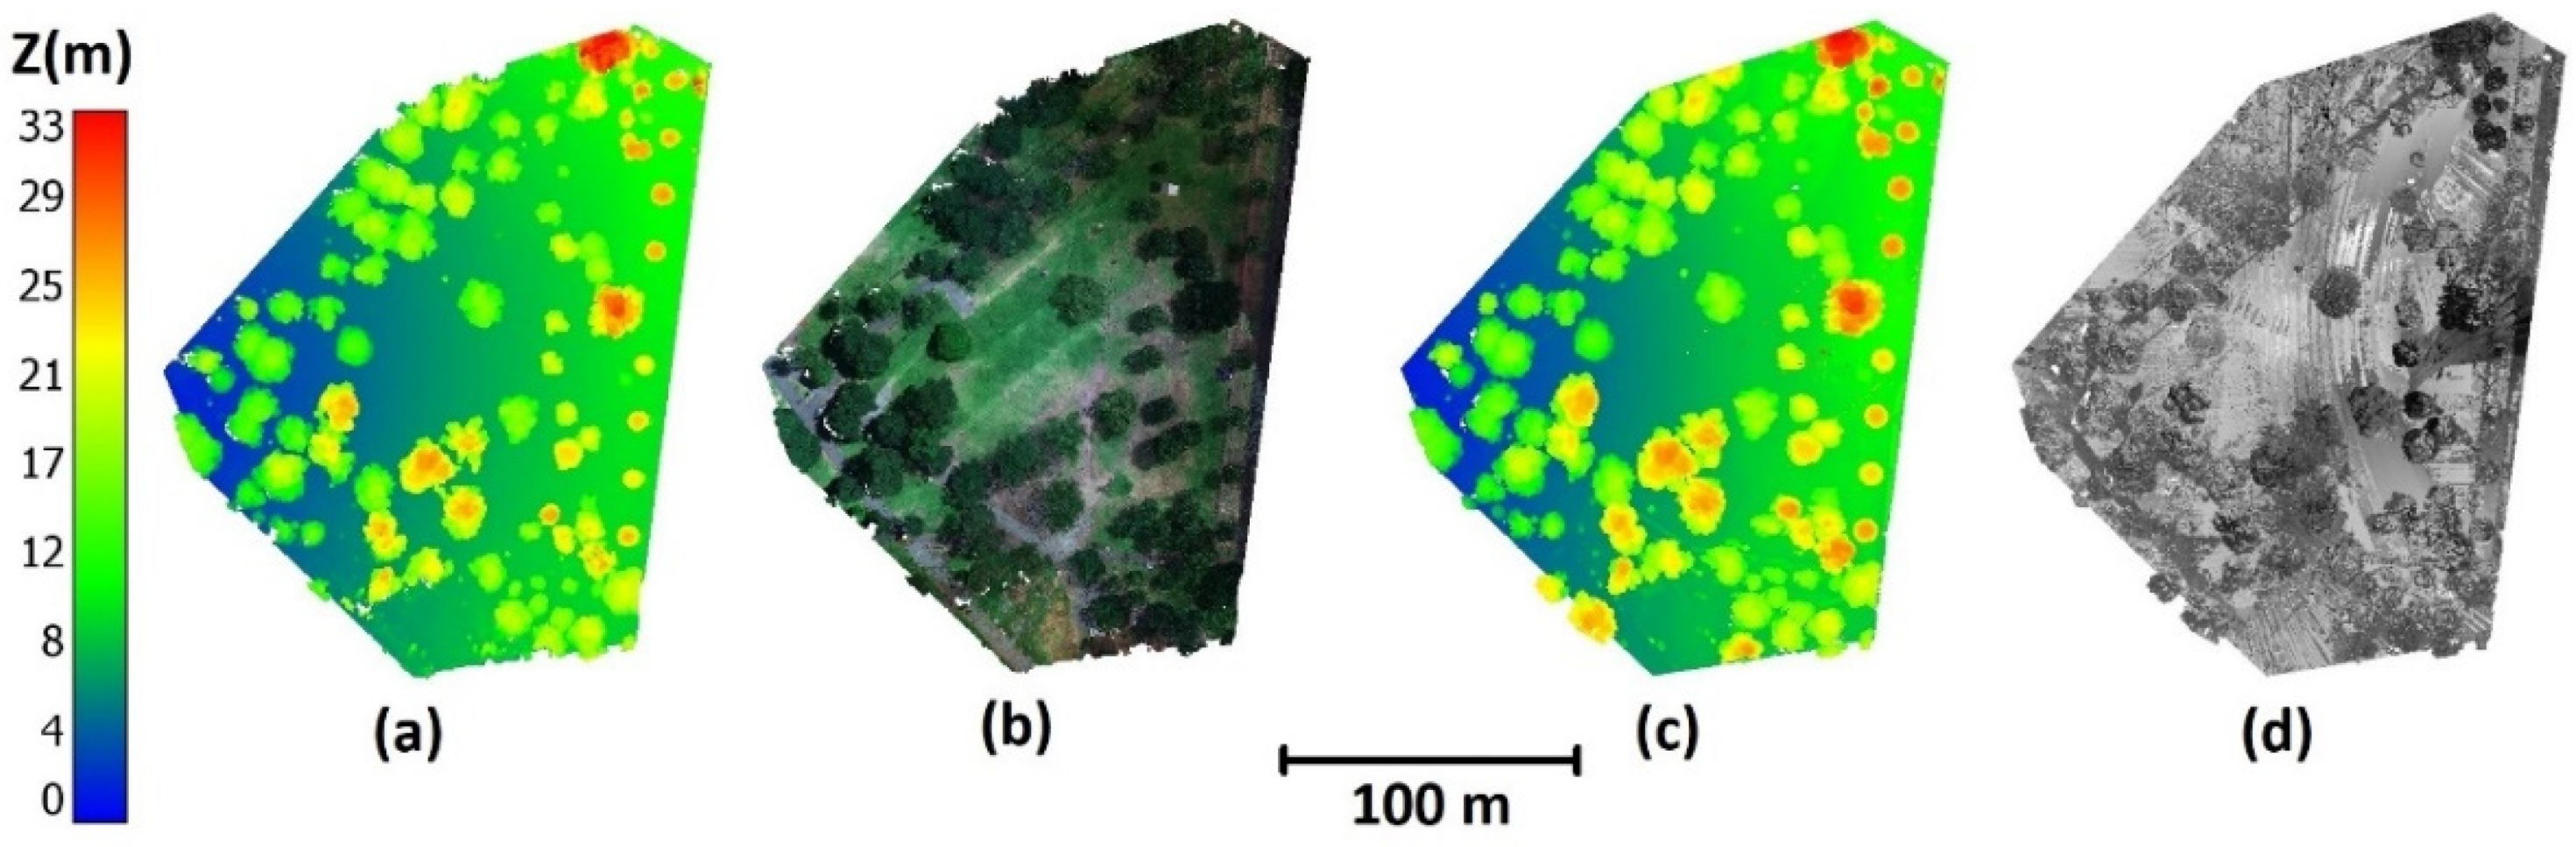
In the photogrammetric process, the colour of each image pixel was added to the point cloud to generate a colourised point cloud. Whereas, LiDAR point cloud does not provide colour information except the intensity which is a measure of return strength of laser pulse. Figure 7 depicts height coded and colourised photogrammetric point cloud, as well as, LiDAR point cloud coded by height and intensity information.
The ground points must be removed from the point clouds due to the lack of effect on the estimation of tree canopy parameters. The chosen site was flat with no man-made structures such as park benches and buildings. The cloth simulation filtering (CSF) [60] method which is implemented in CloudCompare software has been utilised to classify the point clouds into the ground and non-ground points. In applying the CSF method, cloth resolution and classification threshold are set to 2 and 0.5, respectively.
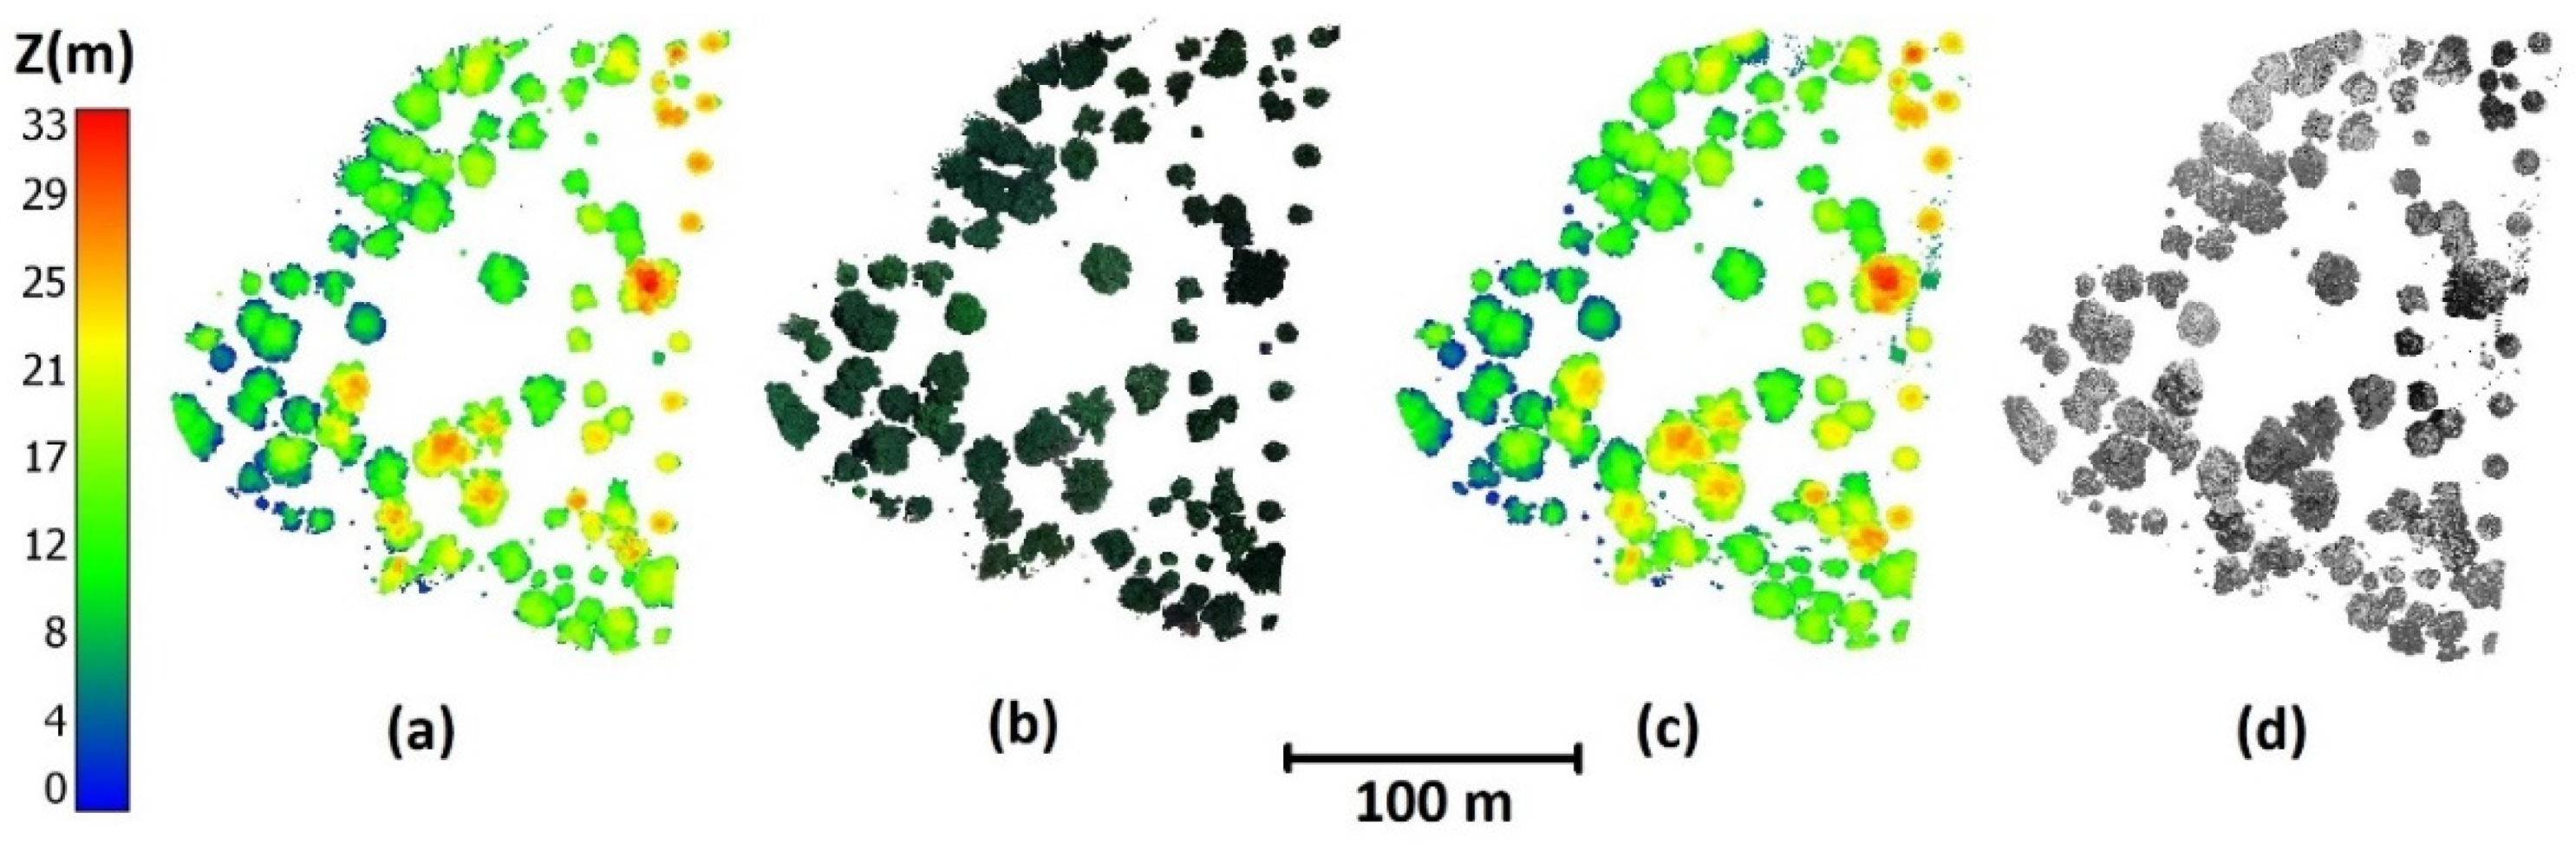
Heights of LiDAR ground and non-ground points varied for 1.700 m and 23.635 m, respectively. Similarly, heights of photogrammetric ground and non-ground points varied for 1.822 m and 23.742 m, respectively. This highlights the high correlation between two data sets however, the small difference can be due to the appearance of noise in the data sets. The non-ground photogrammetric and LiDAR point clouds, shown in Figure 8, can be used to generate the canopy height model (CHM) after subtracting the height of the ground point from the non-ground ones.
2.4. Comparison of Point Clouds
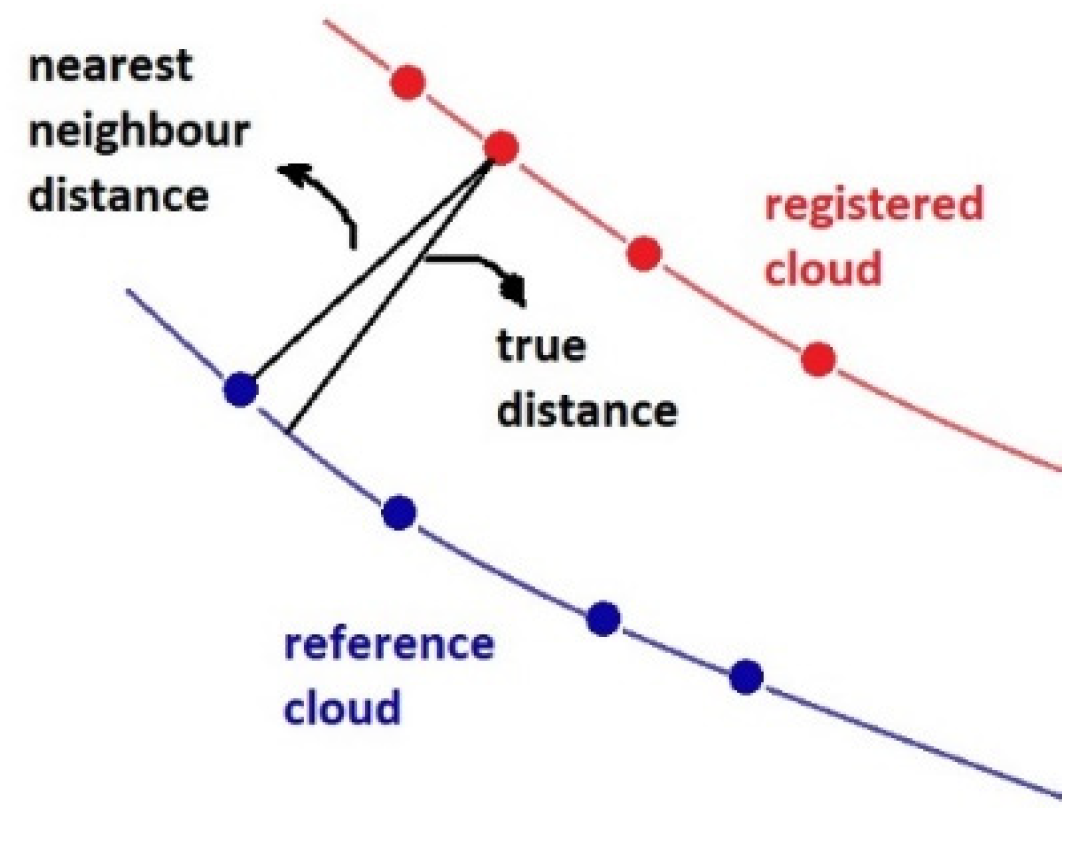
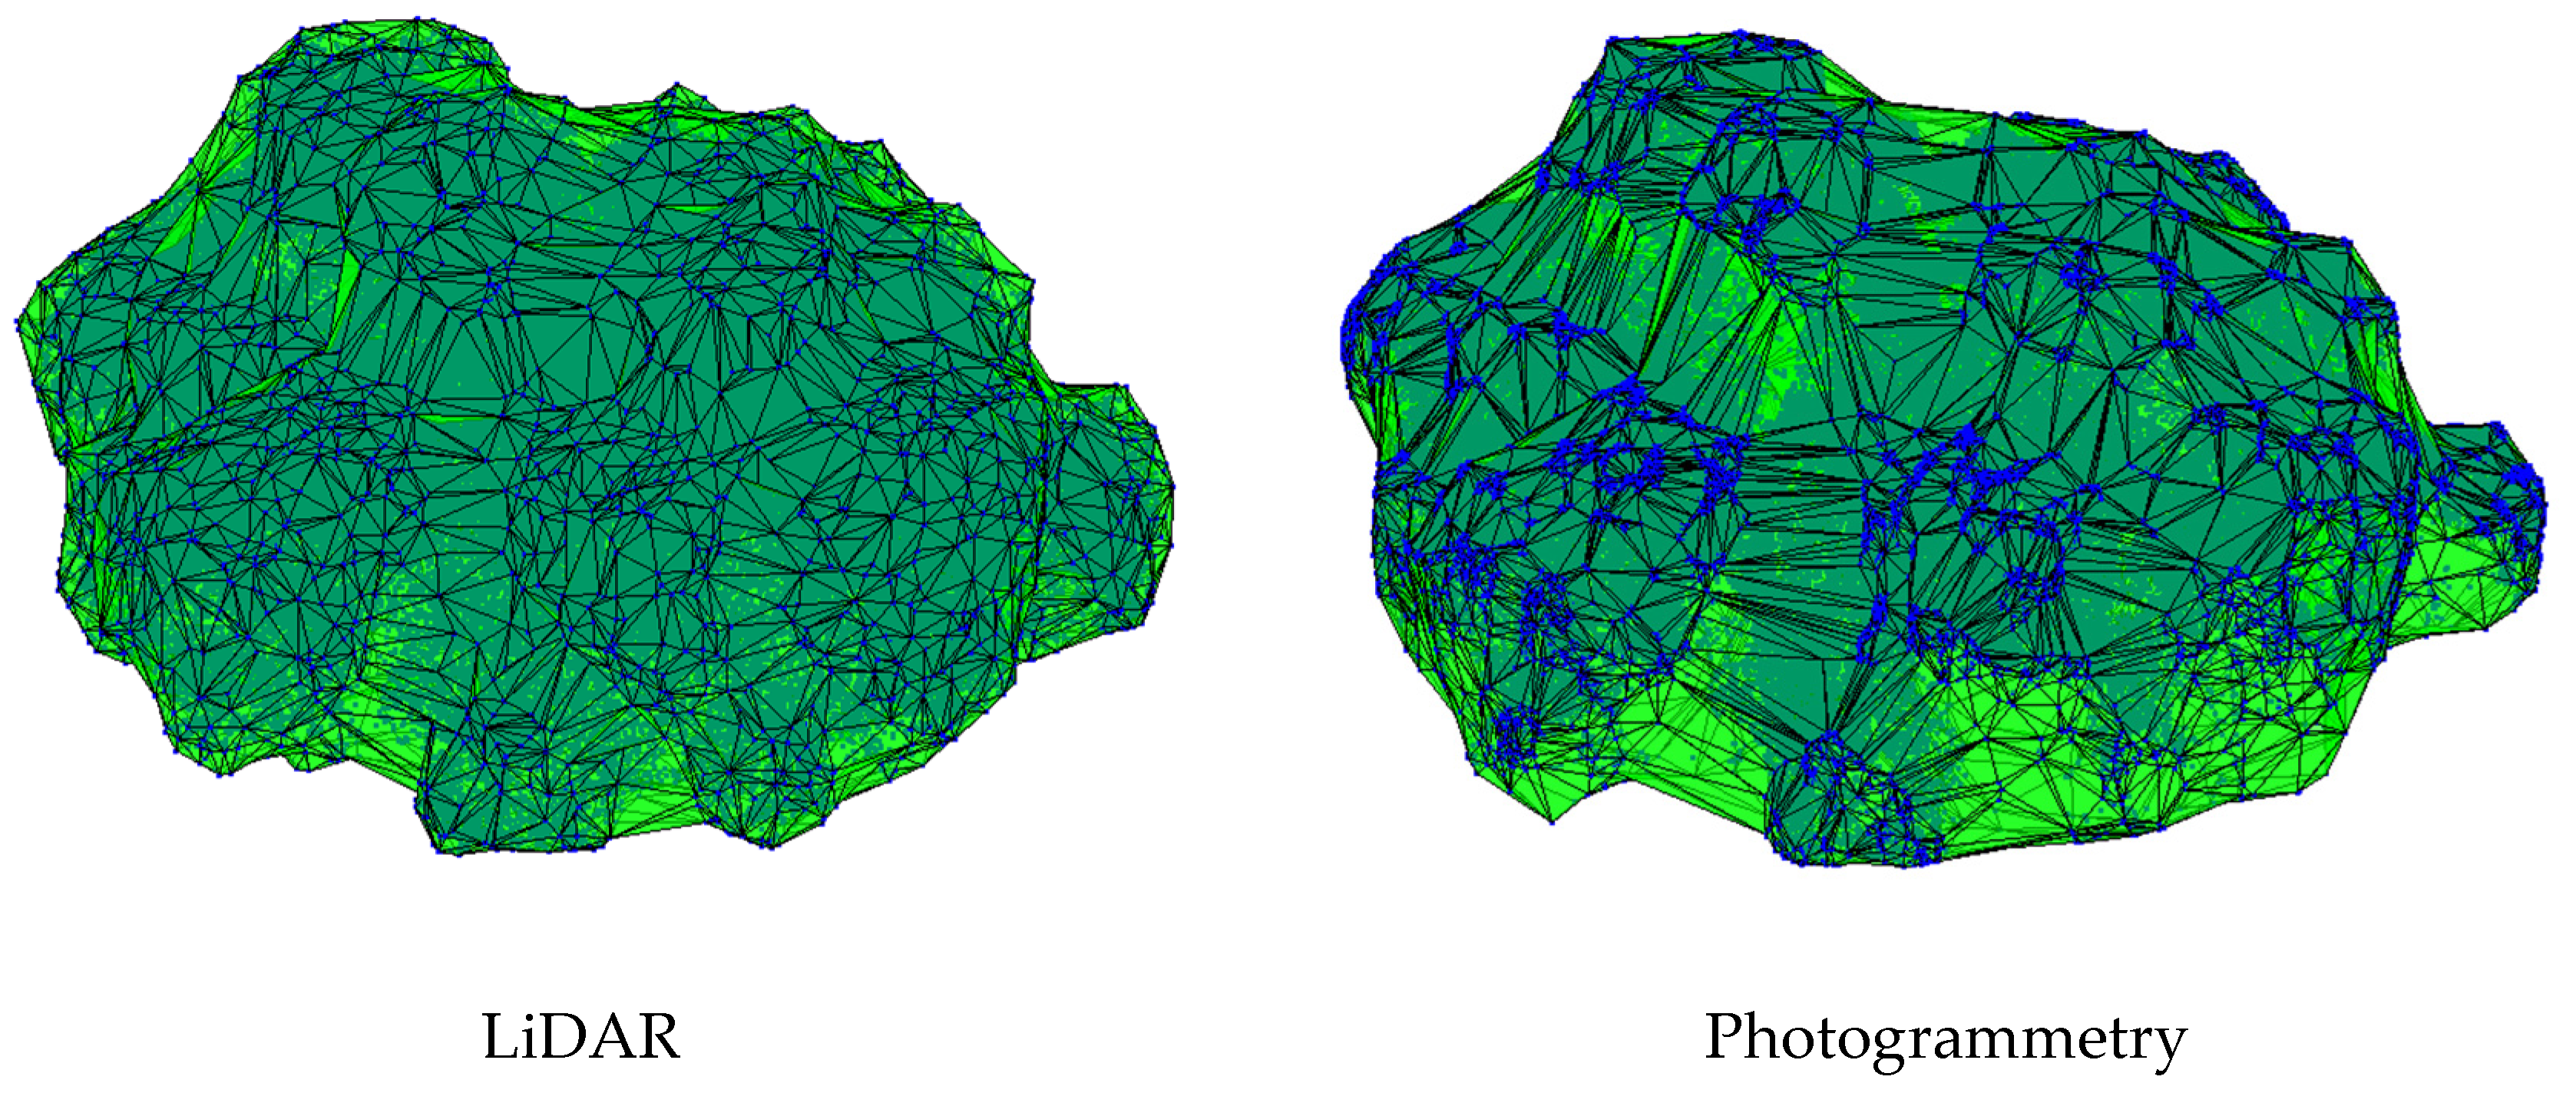
The LiDAR uses accurate RTK GNSS positioning and the photogrammetric point cloud is geo-referenced using ground control points which are measured by survey-grade GNSS, shown in Figure 1. Hence, the displacement between the point clouds is expected to be small. The distance between two points from two-point clouds is calculated via estimating the distance between the LiDAR and photogrammetric point clouds using k-nearest neighbour (k = 6) points (Figure 9). This method identifies k number of neighbour points from the photogrammetric points for each LiDAR point, and the point with minimum distance is selected to calculate the distance between the LiDAR and photogrammetric points.
Although the distance between the point clouds is very small, the iterative closest point (ICP) [61] has been exploited to estimate the displacements between the point clouds. The registered point cloud does not show significant improvement in the point cloud alignment.
2.5. Comparison of Estimated Tree Canopy Parameters
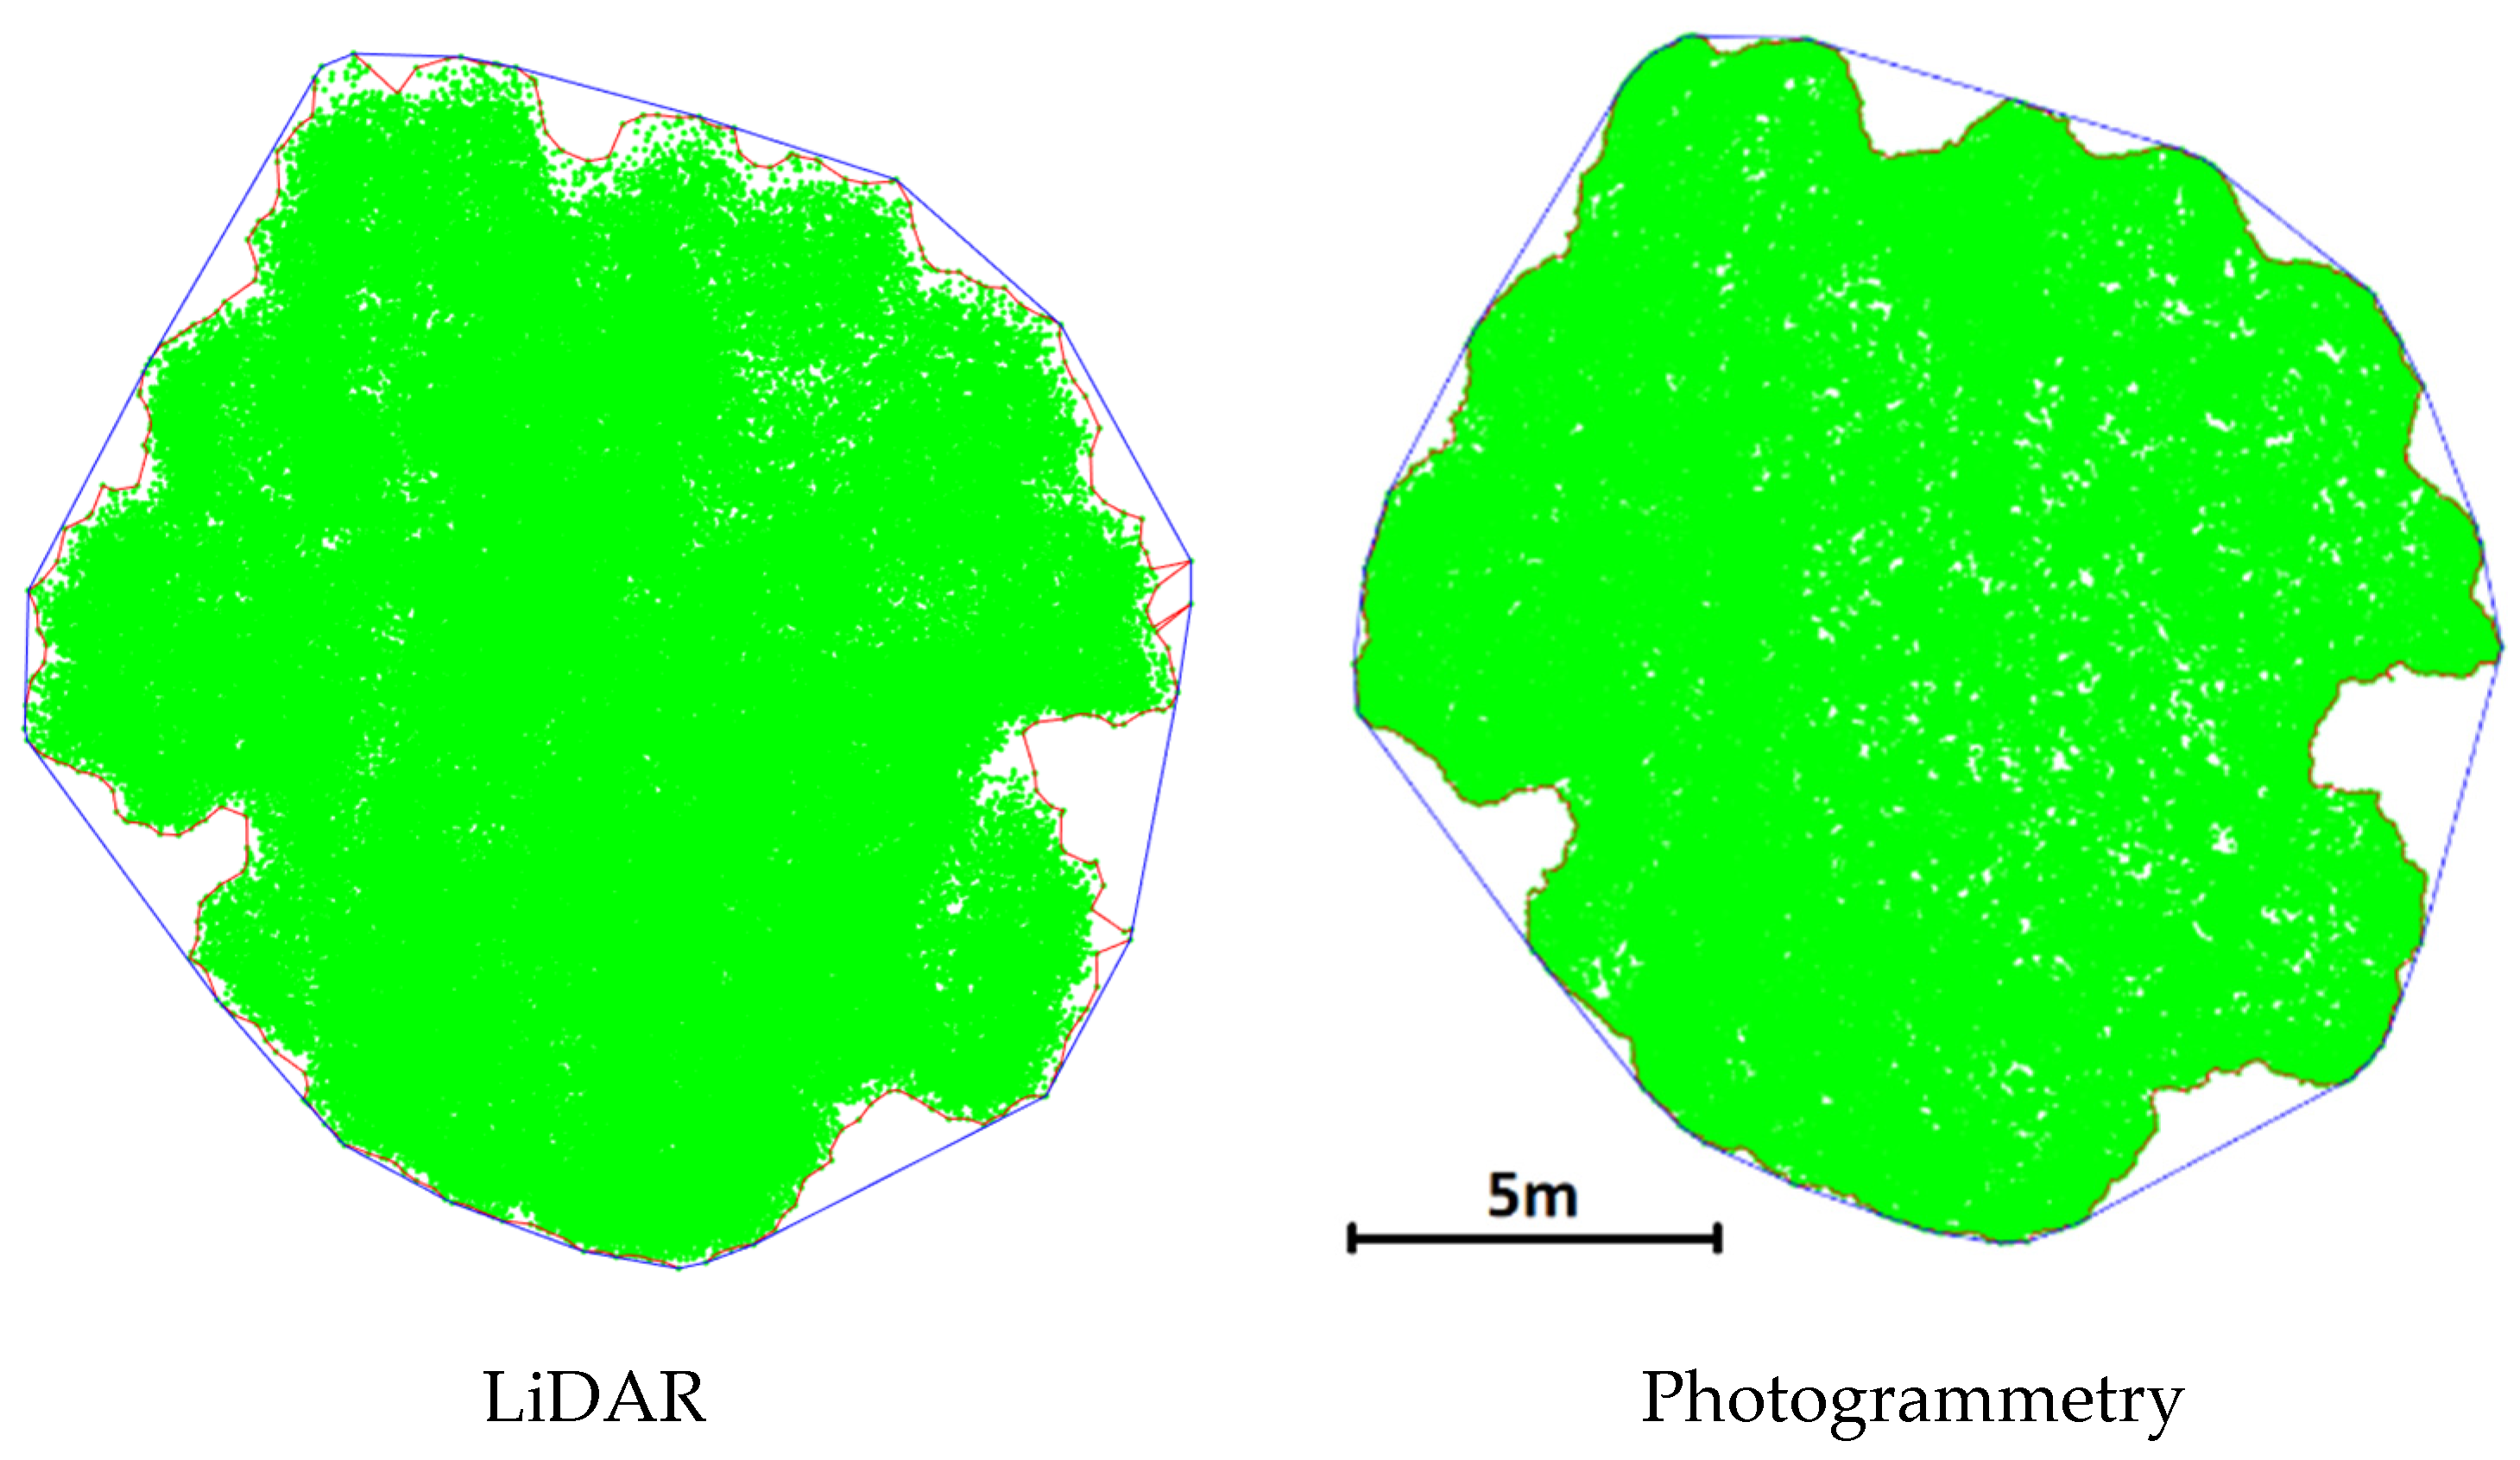
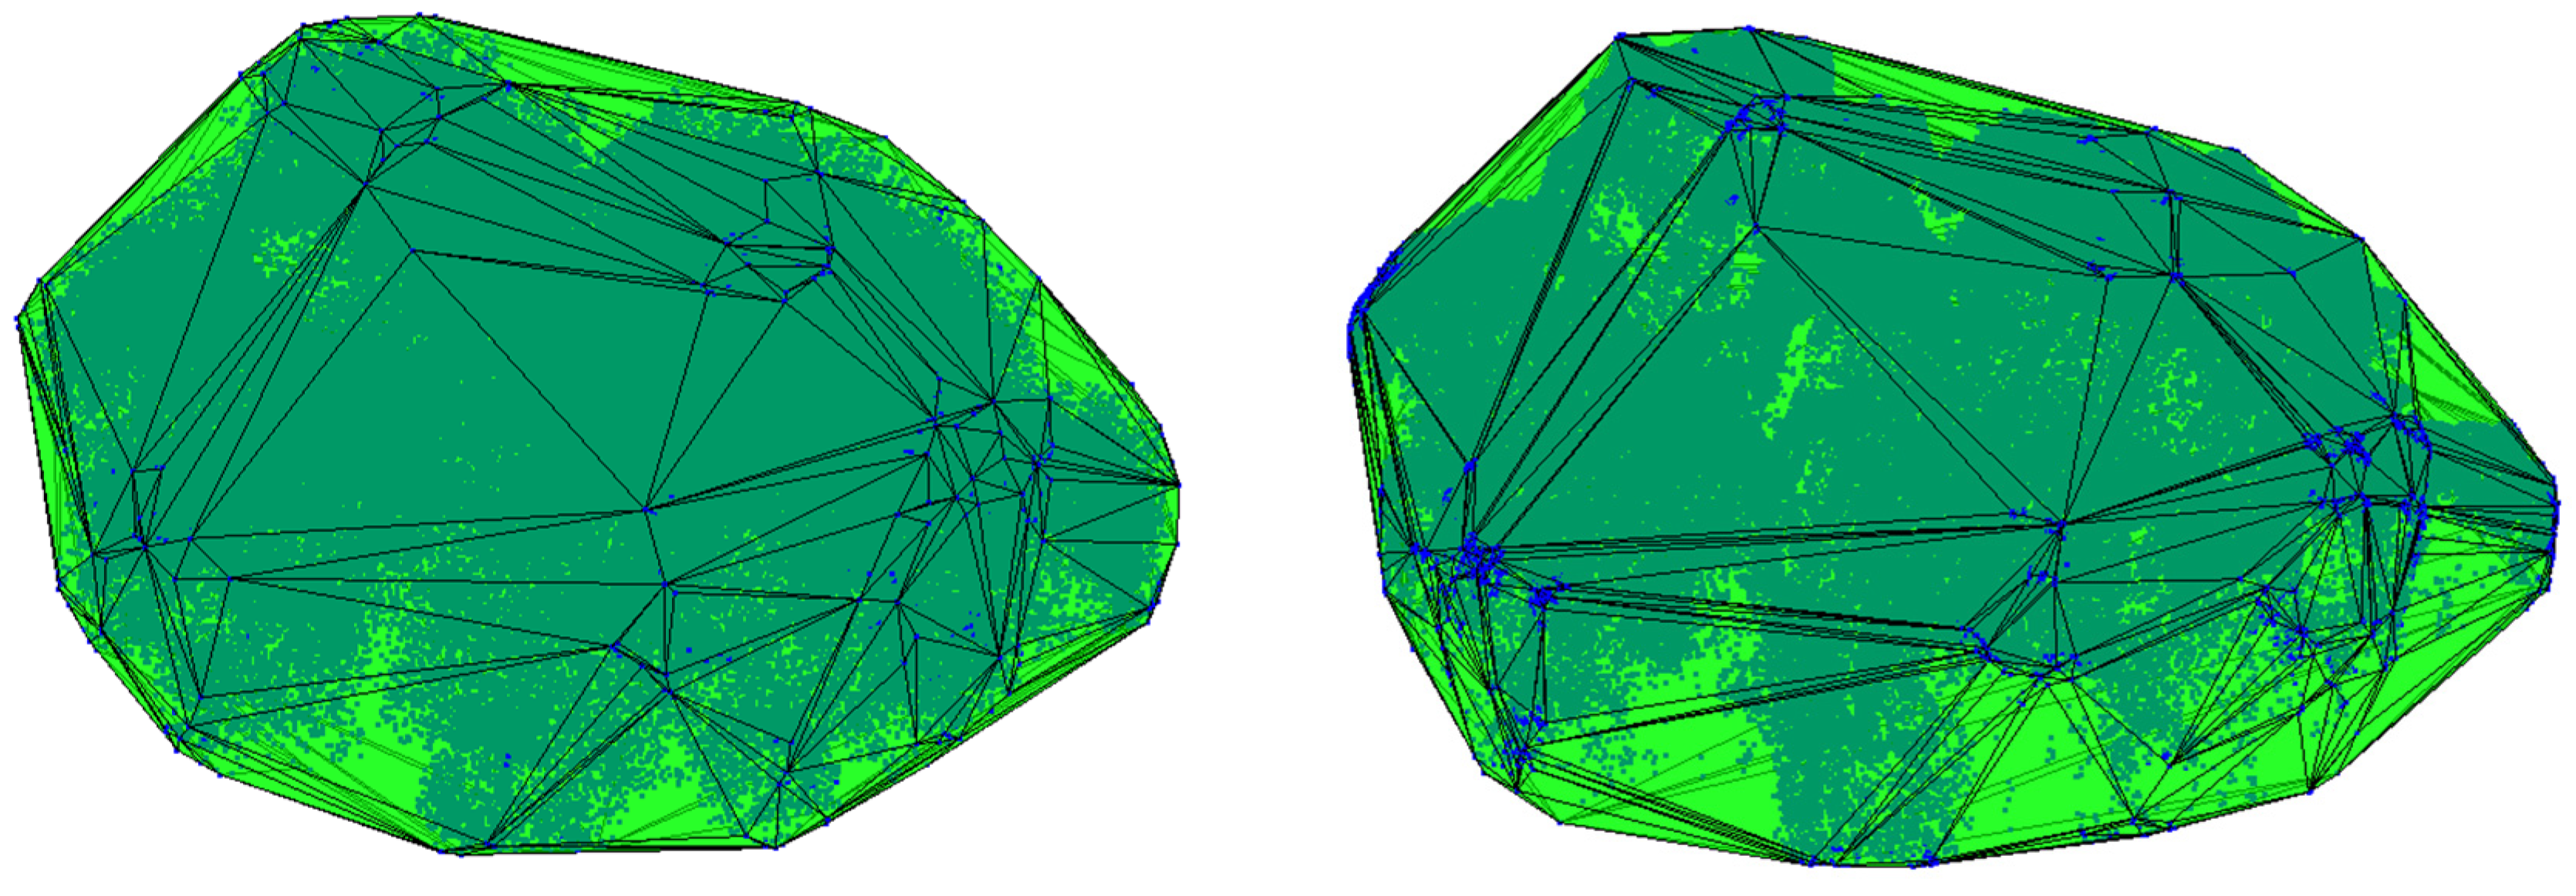
Estimation of tree canopy parameters from the point clouds depends on raster and vector data sources. Point clouds derived from raster sources depend on voxels but estimated tree parameters can vary according to the voxel size which can decrease the accuracy of the estimated tree parameters [62]. By contrast, point clouds from vector sources use the irregular triangulated network to estimate tree parameters with a higher level of accuracy but a greater cost of computation. The well-known convex and concave hull methods can be used for the area and volume of tree canopies. The tree canopy is projected to the floor to calculate the maximum diameter and area of the canopy (Figure 10). Figure 11 shows that the convex-hull method overestimates volume, however, the concave-hull method provides better fitting to the point cloud and offers more accurate and reliable results.
In this research, the max value of CHM of each tree canopy is considered as the height of tree and other tree canopy parameters including diameter, area and volume are estimated by both convex- and concave-hull methods [63]. Then, all estimated tree parameters using photogrammetric and LiDAR point clouds are compared.
3. Results
In this research, photogrammetric and LiDAR point clouds are compared in geometric and statistical aspects. Then, estimated tree canopy parameters using both point cloud sources are compared in detail.
3.1. Point Cloud Comparison
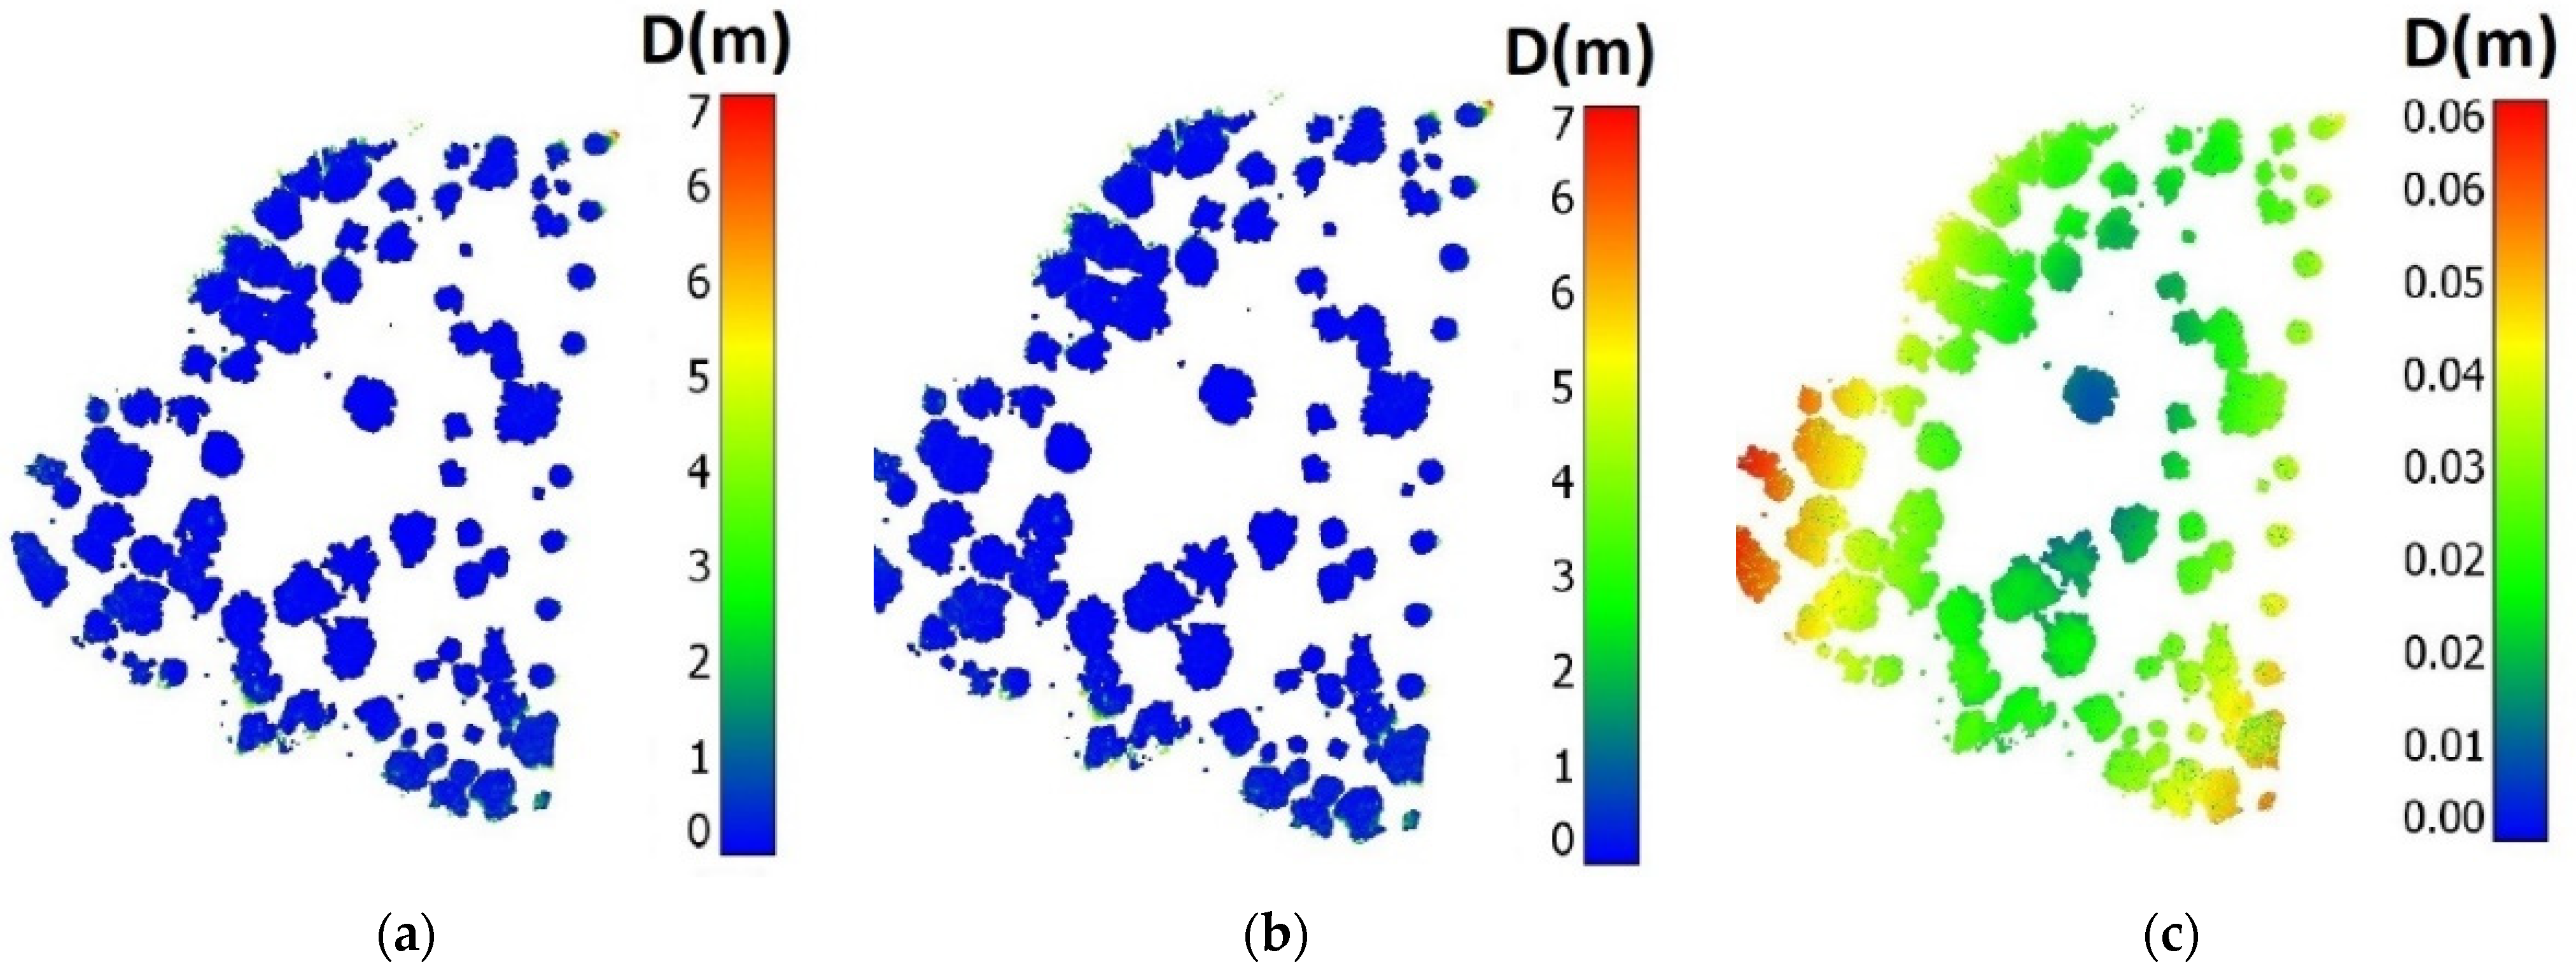
As mentioned above, k-nearest neighbour distance is used for calculating the distance between the reference and the registered point clouds. The distance between the original photogrammetric point cloud and the aligned one is less than six cm (Figure 12). Figure 12a,b show that some horizontal offset is apparent between the two-point clouds at the edge of the trees. Figure 12c shows that the point clouds from both sources are most inaccurate at the margins of the scan path. The experimental evaluation of the point clouds denotes an acceptable co-registration accuracy for the point clouds derived from different sources.
Statistical comparison of the photogrammetric and LiDAR point clouds can be conducted directly on the Z values of the point clouds as well as the derived tree parameters. In addition, statistical parameters such as min, max, mean and standard deviation (std) of the point clouds in X, Y and Z directions are presented in Table 2. The min, mean and std of Z values for both photogrammetric and LiDAR point clouds are underlined to highlight small differences between the point clouds.
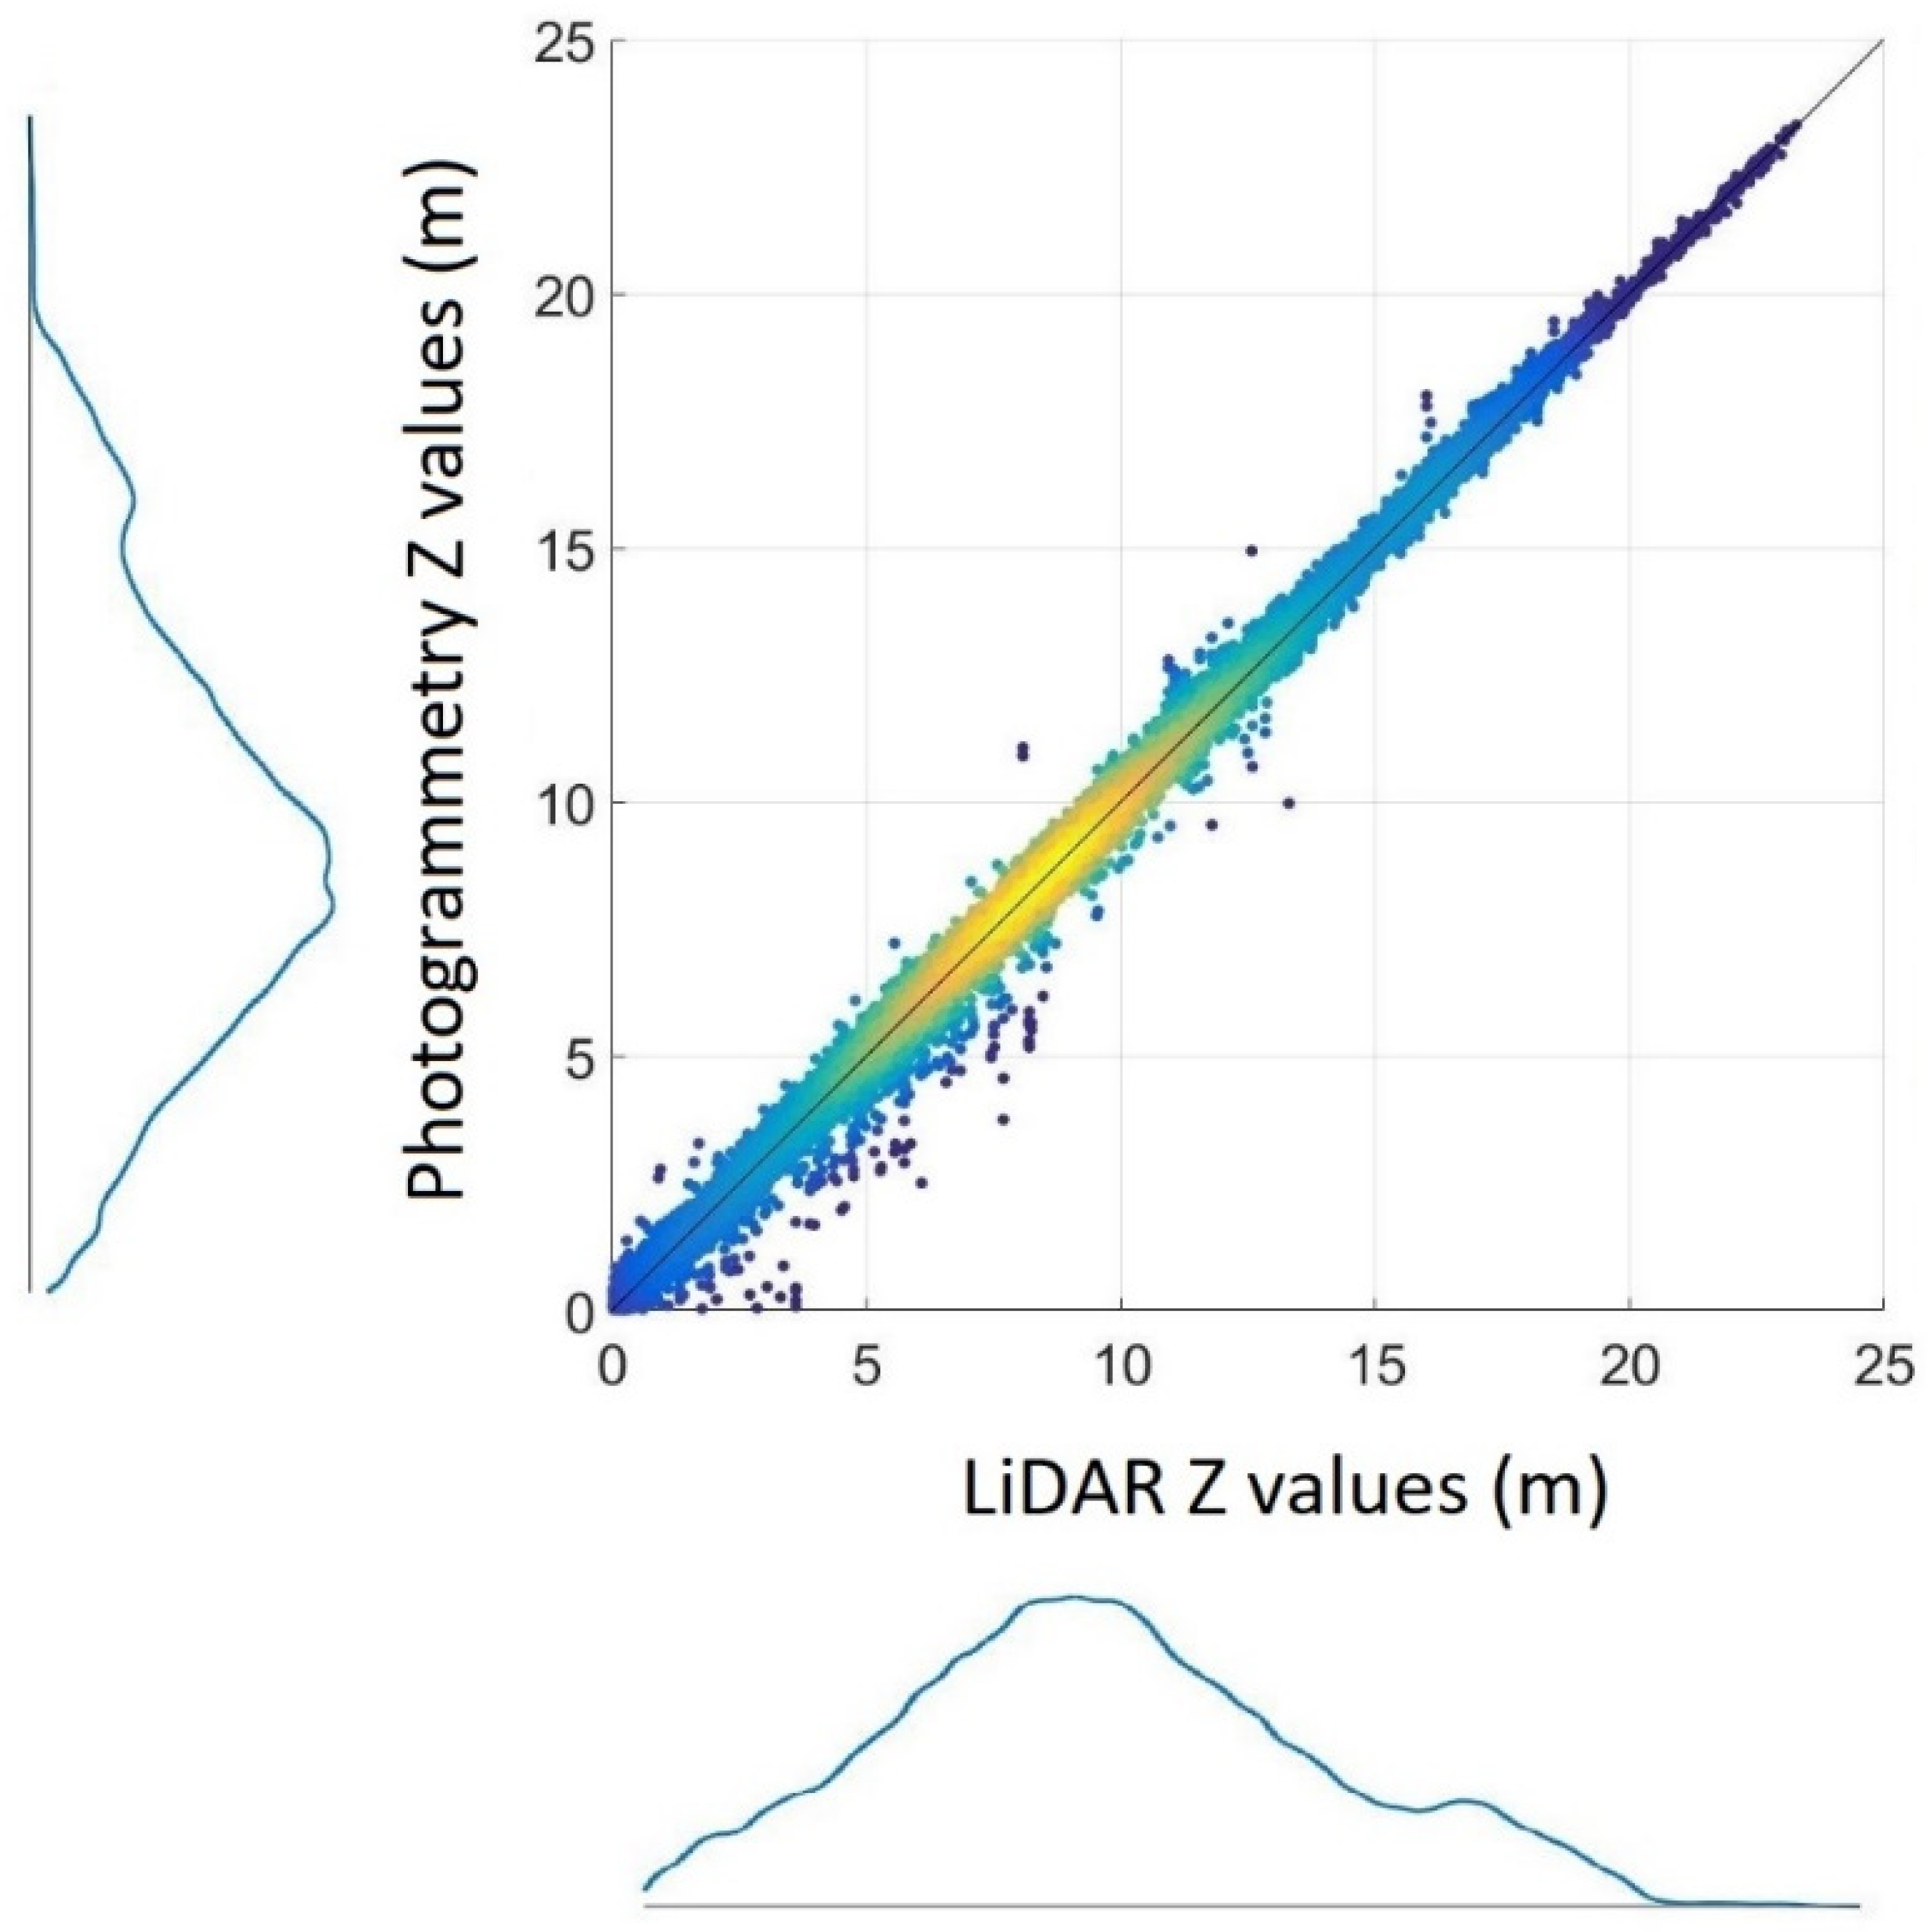
The scatterplot of Z values for photogrammetric and LiDAR point clouds along with their probability distribution functions are presented in Figure 13. As expected the point clouds derived using the different methods are highly correlated (R2 = 99.88%).
3.2. Tree Canopy Parameters Comparison
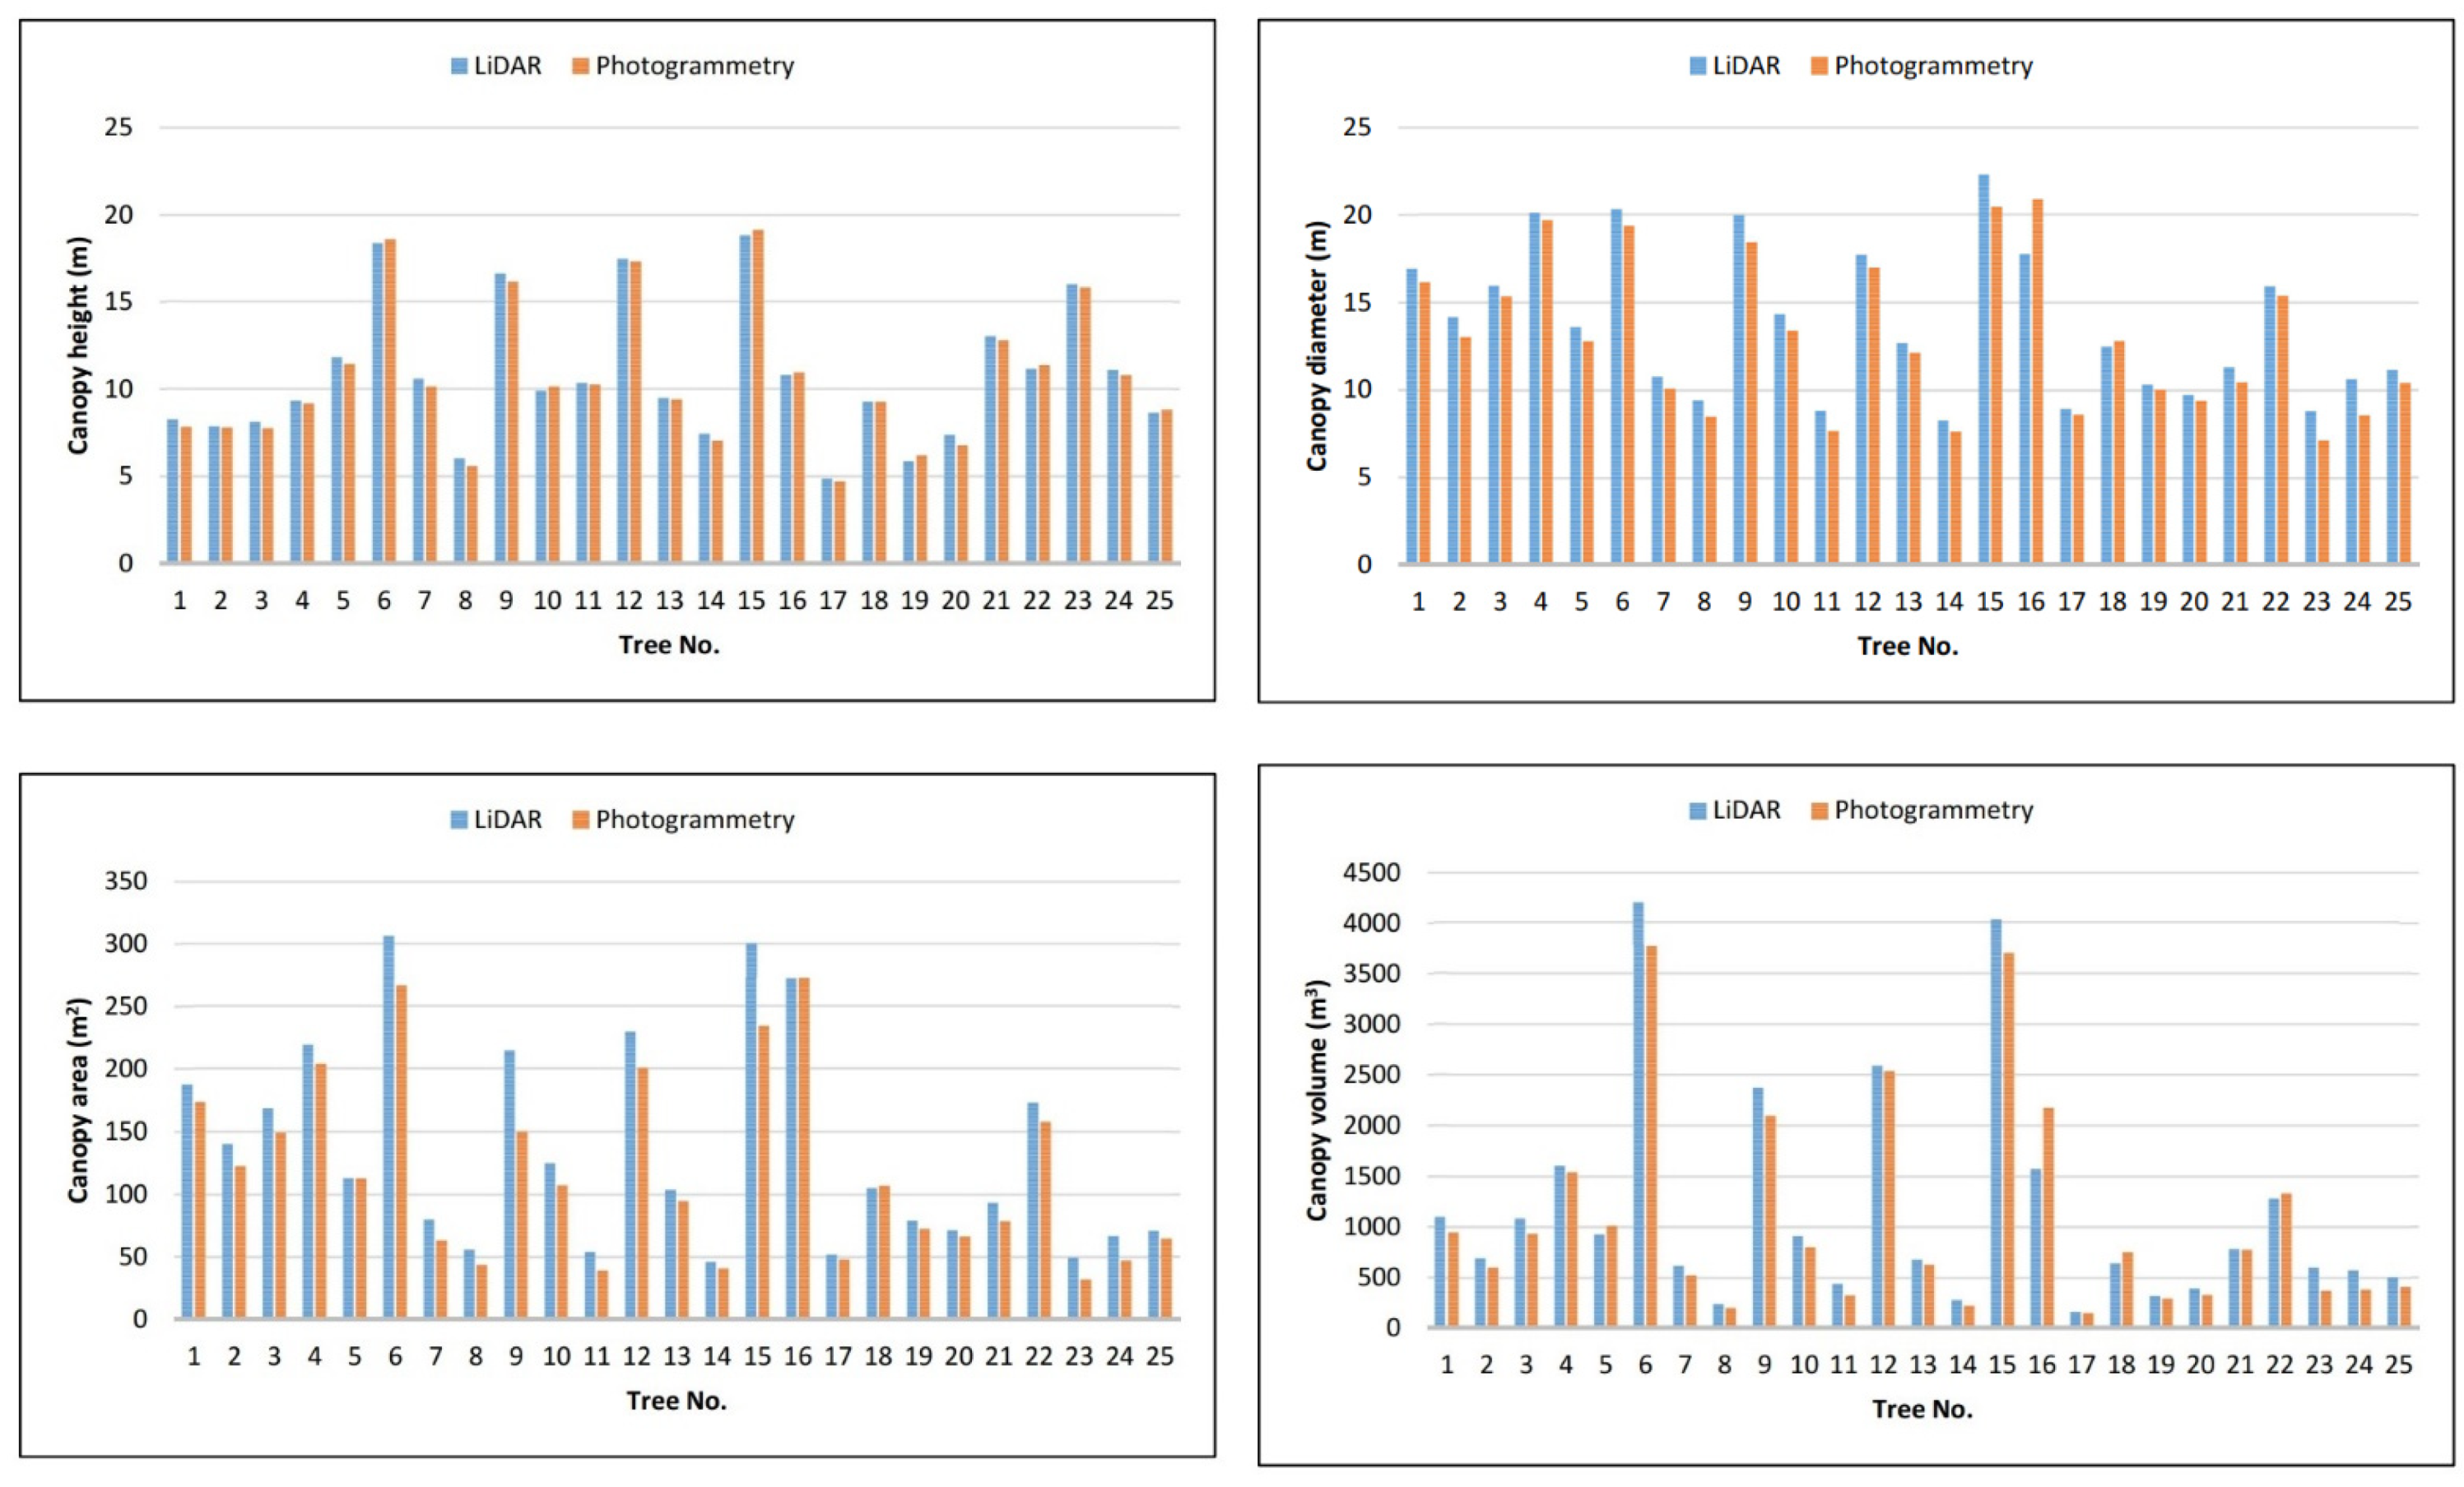
The tree canopy parameters such as height, diameter, area and concave-hull volume are presented in Figure 14 and the difference of the parameters are provided in Table 3 before being compared statistically.
Charts in Figure 14 show that for most of the stands, except 5, 6, 10, 15, 16, 18, 19, 22 and 25 photogrammetric point clouds produce a lower estimate of height, area, diameter and canopy volume. This is not surprising when considering Figure 9. These show that the photogrammetric point cloud is produced by a more regular array of points. This produces a closer fit between the points and the line of the concave hull. On the other hand, the LiDAR scans are more closely related to the leaf and branch returns that constitute the canopy, but these leave areas with lower density points that with a convex hull method produces a smoother line that appears to inflate the canopy area. A similar process is occurring for the majority of trees and parameters.
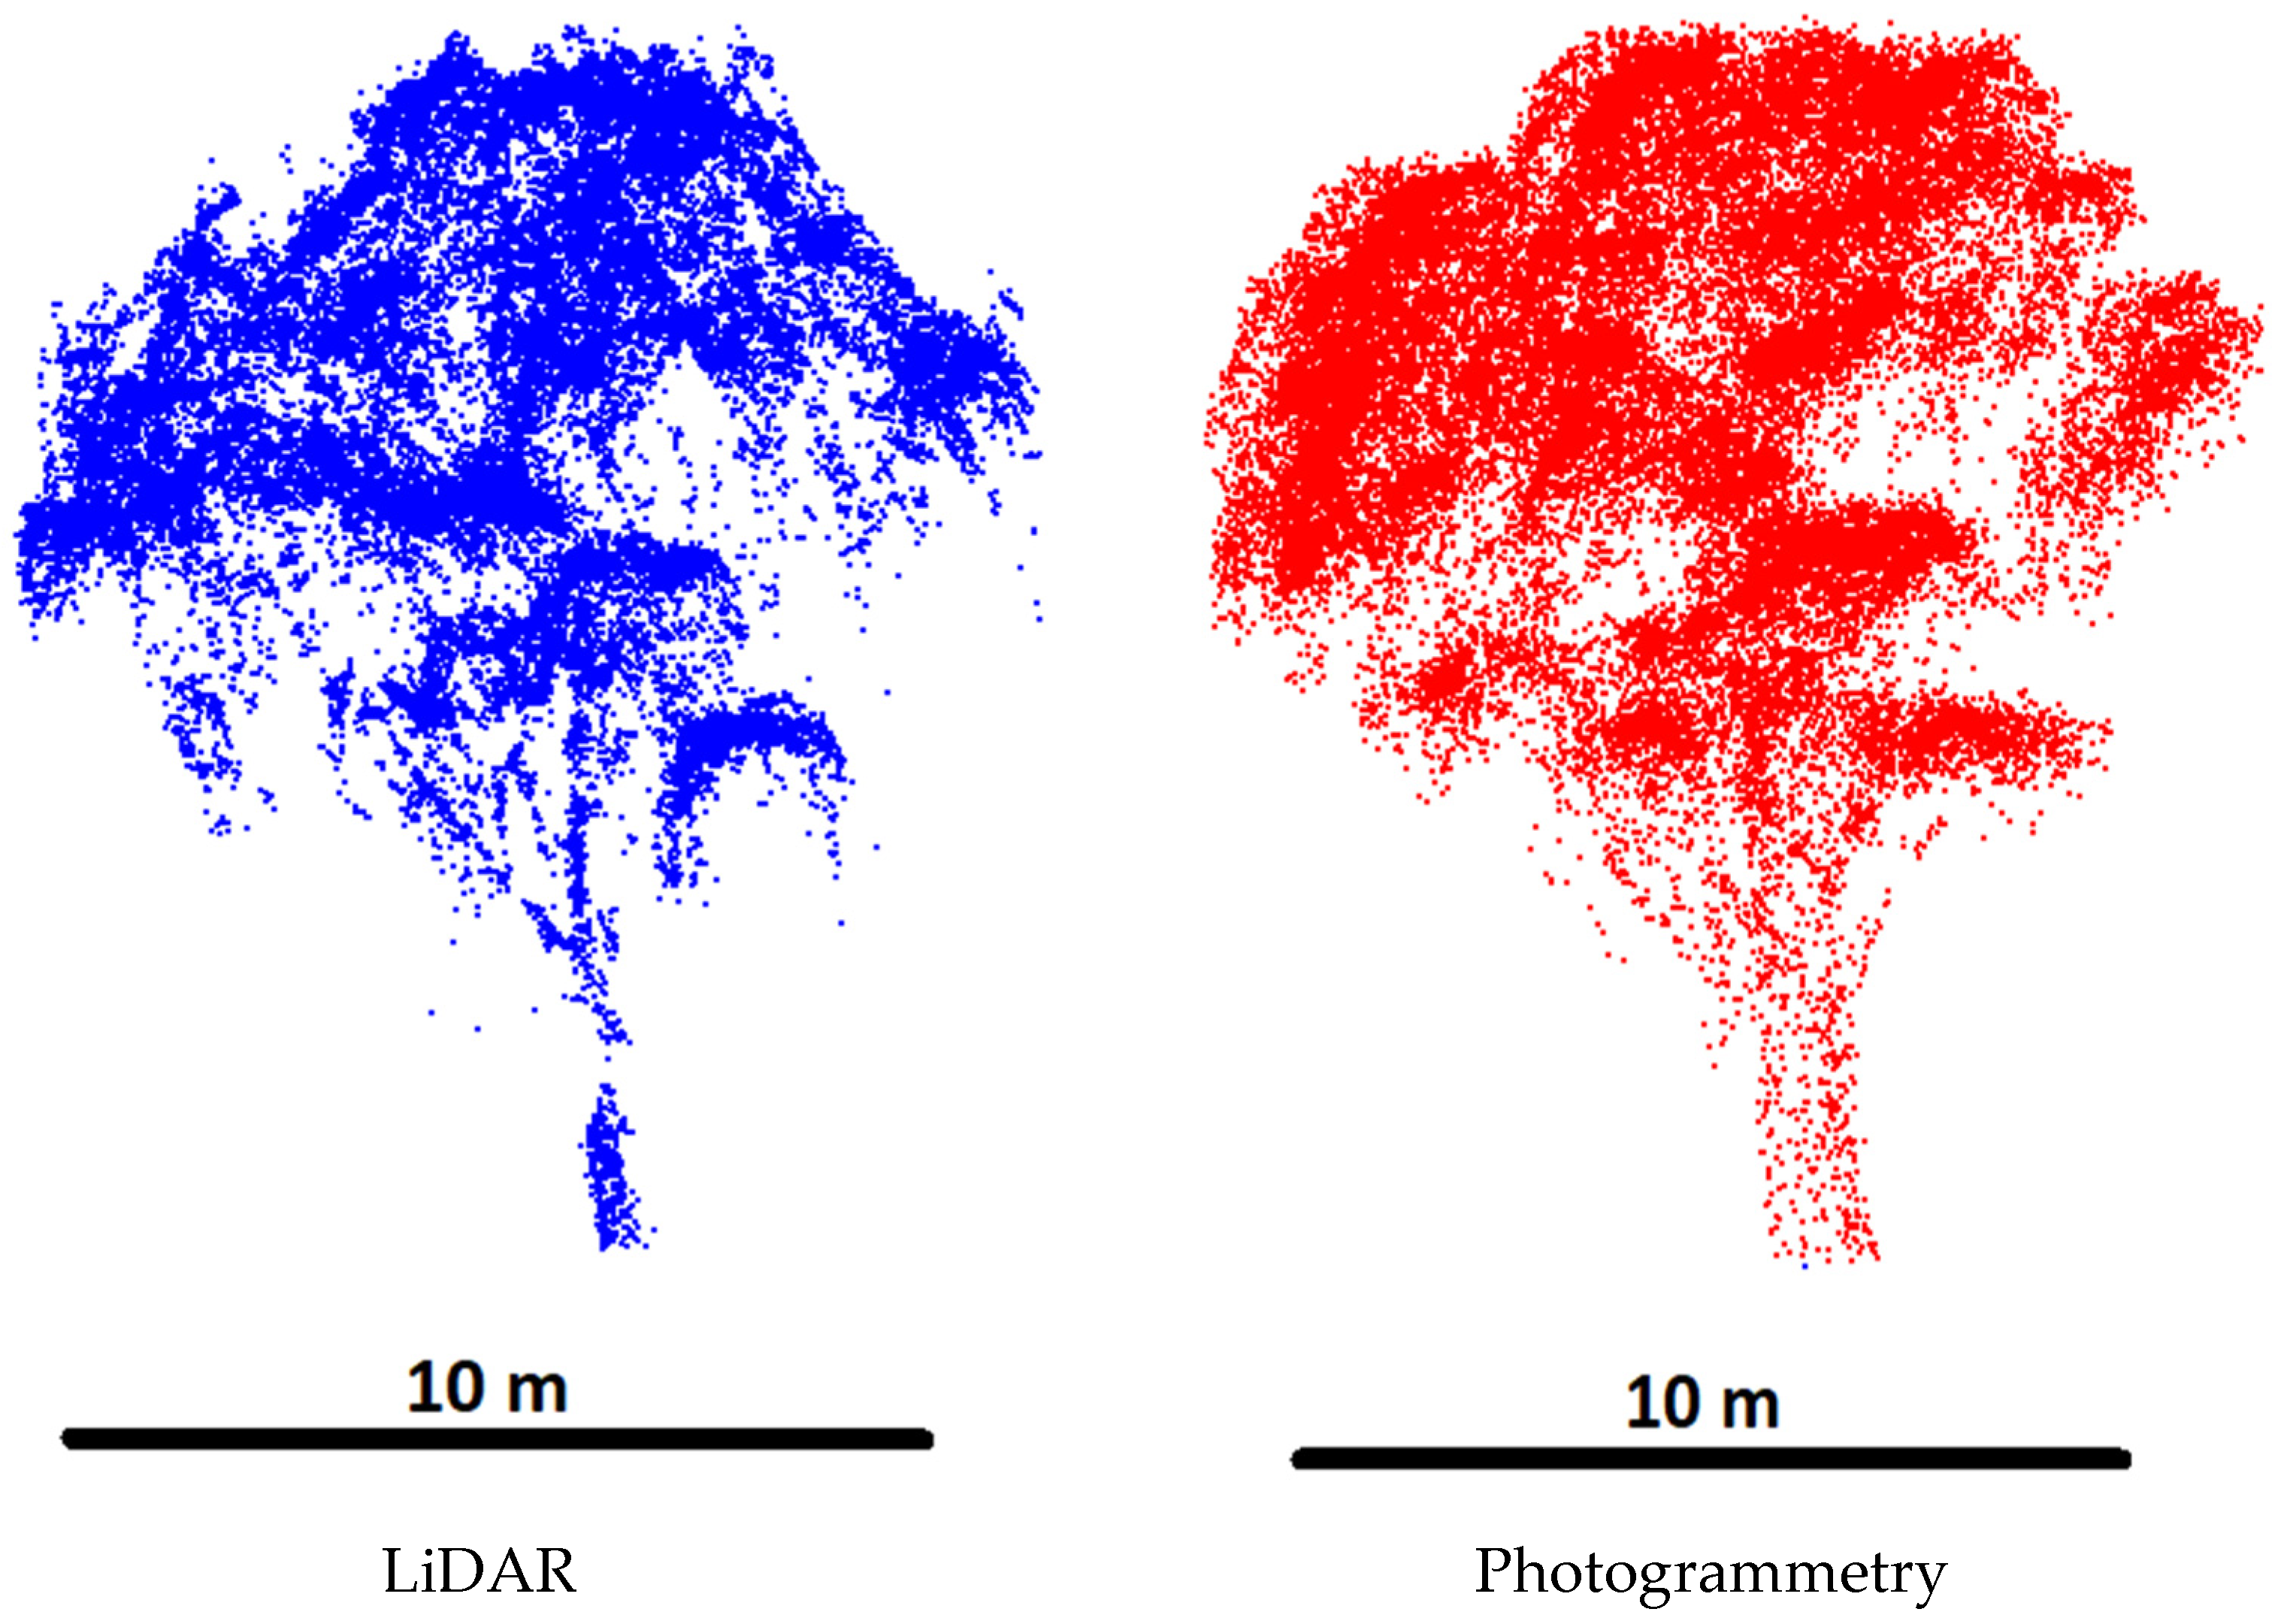
Furthermore, a side view of LiDAR and photogrammetric 3D points of a tree is presented in Figure 15 to highlight the branches of the tree.
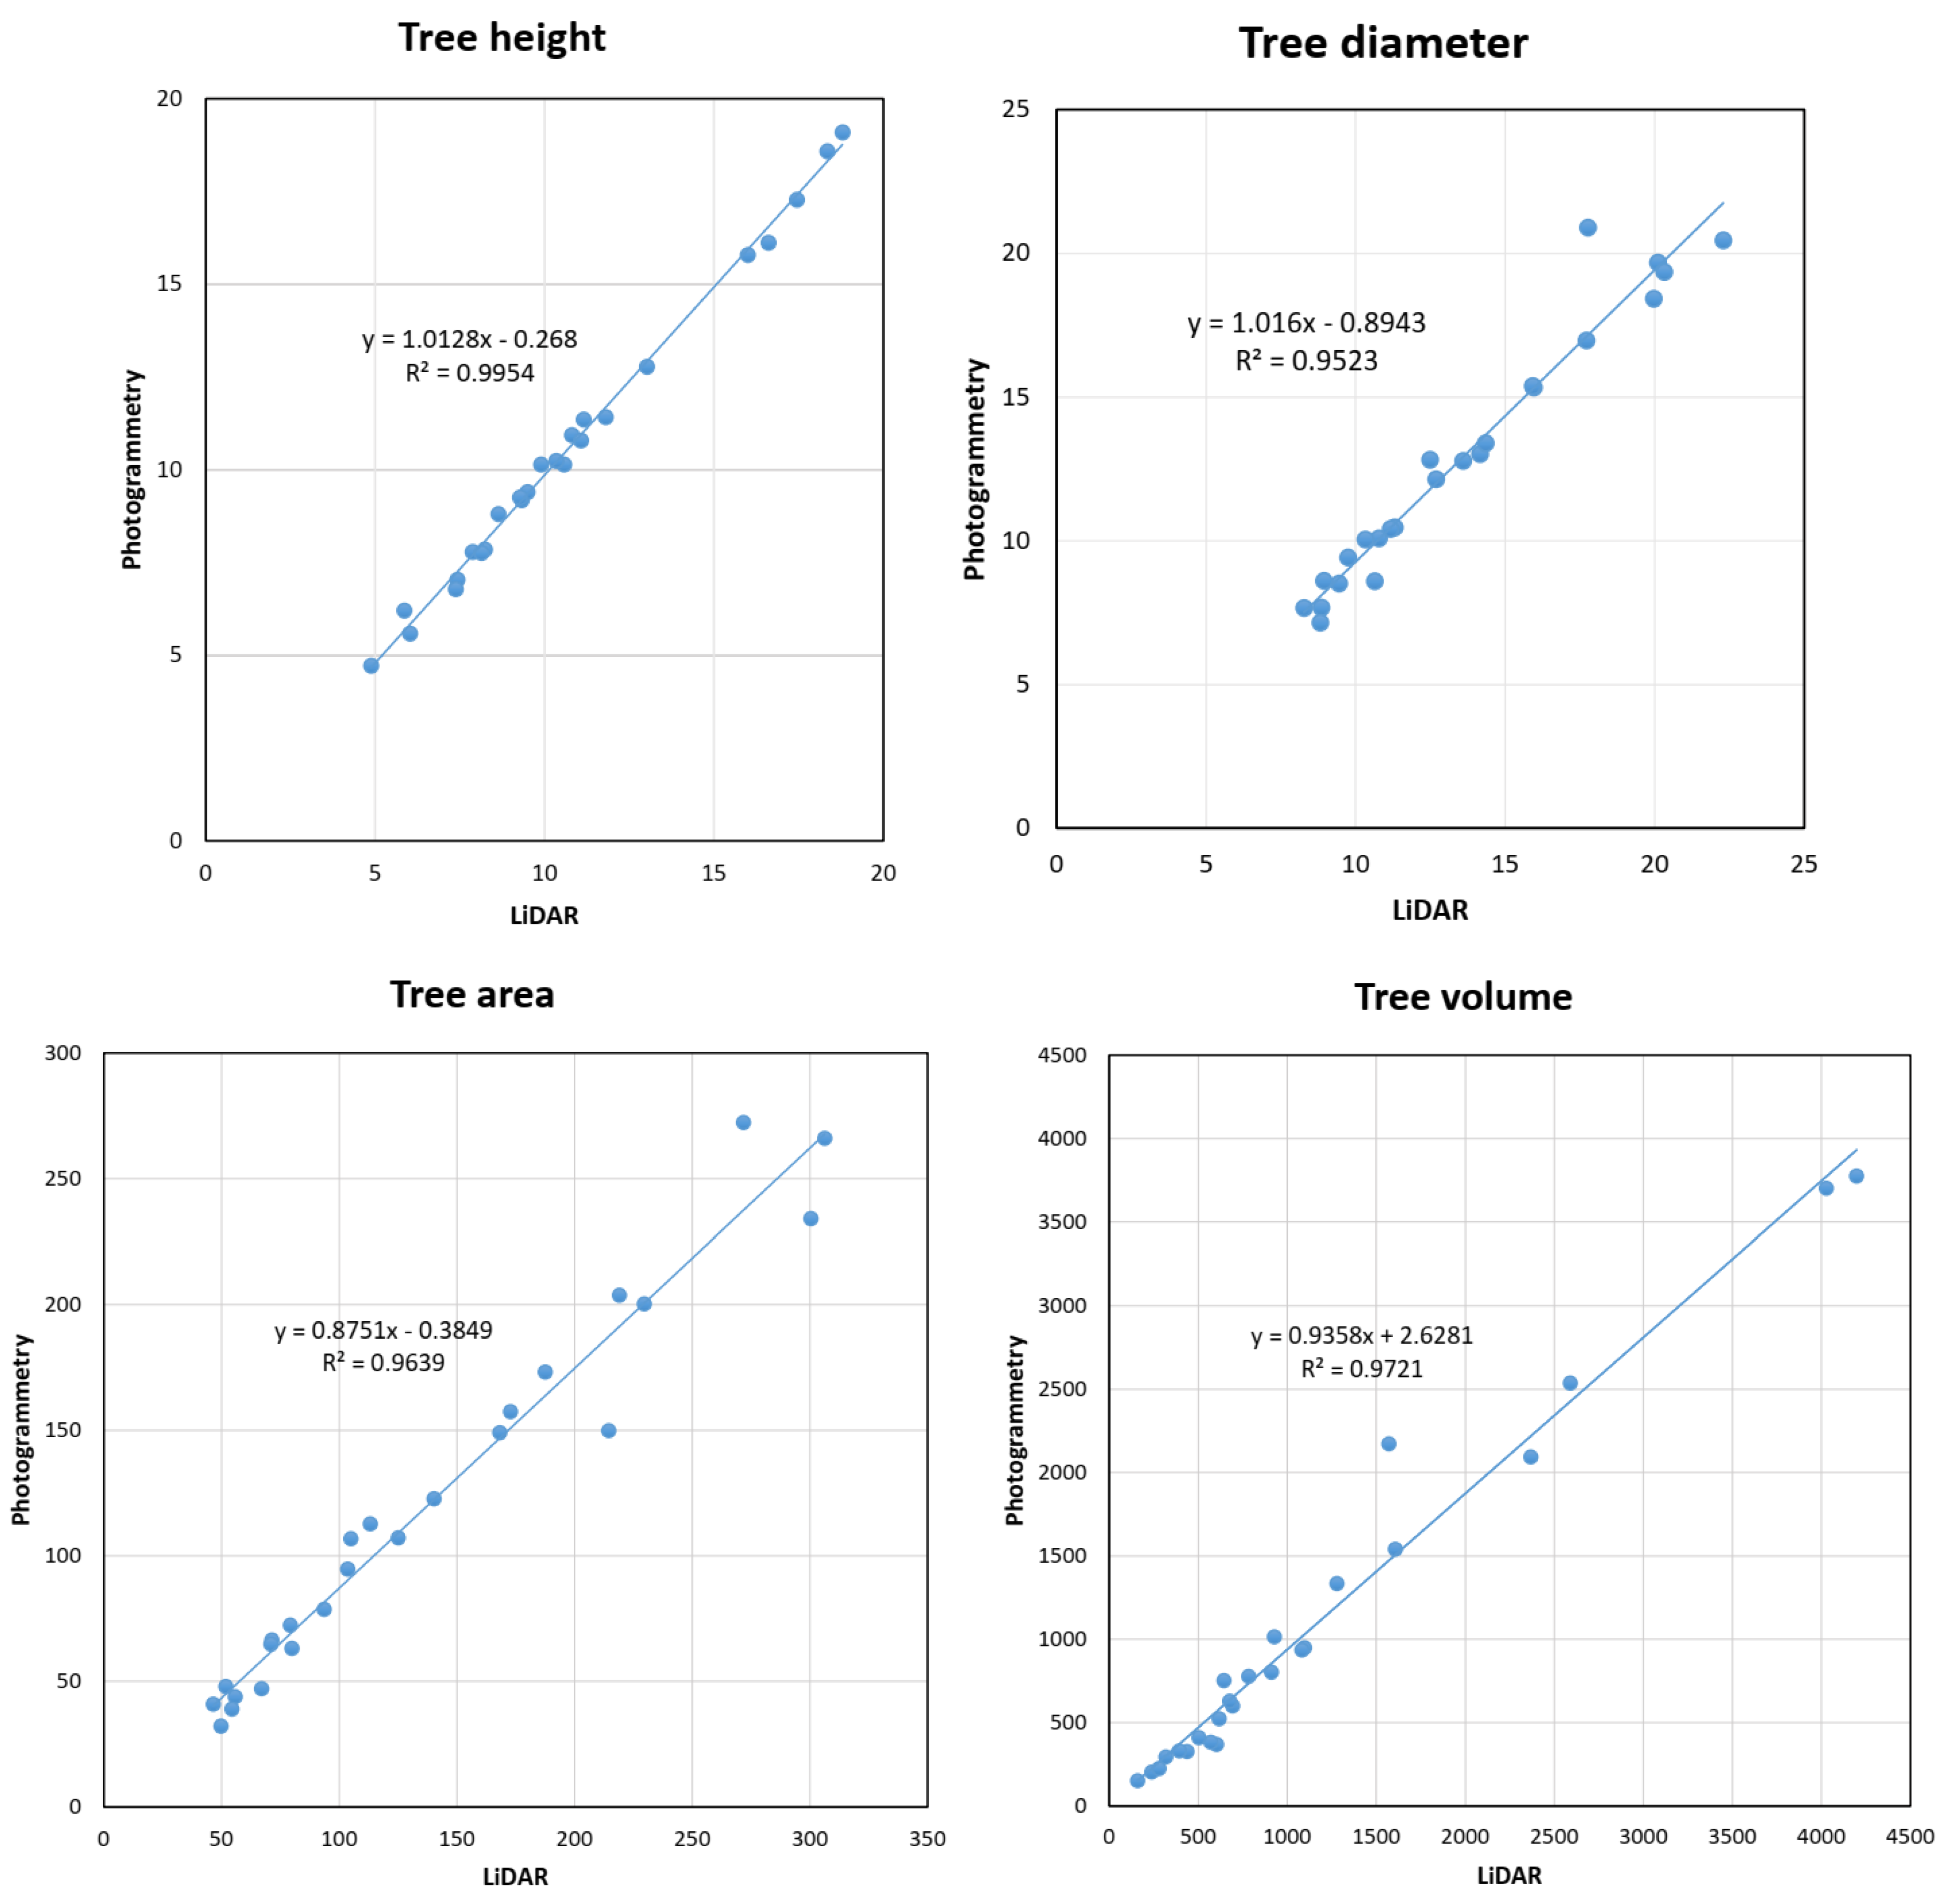
As shown in Figure 16, statistical comparison of the estimated tree parameters using photogrammetric and LiDAR point clouds yield R2 of 99.54%, 95.23%, 96.39% and 97.21% for tree canopy height, diameter, area and volume, respectively. Coefficients on the regressed relationship between LiDAR and photogrammetric point cloud-derived area shows that for each unit increase in the area the difference between the two will be a factor of 0.8751.
4. Discussion
In this research, LiDAR and photogrammetric point clouds, as well as estimated tree parameters, are compared using a UAV in an urban environment. UAVs offer an advantage for highly detailed canopy mapping over a small area allowing access to tree parameters on the public and private estate, without the need for physical on the ground access that would be required with terrestrial scanning.
The limitations of the study include the use of a small area with a limited species mix and minimal canopy overlap, but this is not unusual for an urban park. On the other hand, these limitations allow for a direct comparison of the two point clouds derived from different sensors.
The two point clouds derived from different geo-referencing methods, LiDAR (direct geo-referencing) and photogrammetry (indirect geo-referencing), were matched with minimal horizontal offset. The results confirm the literature on the understood differences between photogrammetry and LiDAR-derived 3D point clouds [64]. The LiDAR swath angle to the Z-axis is very high at the edges of the scans but ideally should be zero. Yet, a high overlap of 90% is recommended in the forestry literature for photogrammetric data because a point can only be reconstructed if three or more photos are present [65]. For both point clouds, the accuracy of the geometry of the points decreases towards the edge of the scan because photogrammetry depends on the field of view and LiDAR depends on the off-nadir scan angle.
The results demonstrate that differences in the two point clouds exist that should be considered as part of a broader consideration of which point cloud to use when deriving tree parameters. LiDAR is an active remote sensing technology in which pulses of light are emitted and received. On the other hand, photogrammetry is a passive remote sensing technology. The active technology is not affected by shadowing or occlusion of the light source as much as with the photogrammetric point clouds because passive technology relies on an external light source. This means that the depth of penetration of the canopy is different for both data sets as the signal is being received from different parts of the canopy. While LiDAR is more expensive, the penetration of the pulses into the canopy allows for tree segmentation through the use of stem information [66].
These key differences can be seen in (Figure 15). The LiDAR point cloud can more precisely identify the branches underneath the canopy than the photogrammetry point cloud. At the same time, the canopy surface appears more complex than the photogrammetry point cloud canopy surface. Therefore tree architecture or the connection between clusters of canopy and branches can be more accurately modelled using the LiDAR point cloud.
The results showed that there is no significant difference between the estimated tree parameters using LiDAR and photogrammetric point clouds. In aerial (non-UAV) surveying, photogrammetric sources are often more readily and cheaply available than LiDAR sources. Understanding that photogrammetric point clouds have the same properties as LiDAR point clouds are therefore important in different applications [64].
Notwithstanding some of the more specific applications of a LiDAR point cloud, such as stem volume estimation [67], for the collection of urban forest parameters using a UAV, the platform can be equipped with either a LiDAR scanner or camera, saving on cost but more importantly on weight, battery life and therefore the area to be covered in a survey.
Research work in [68] occurs on different platforms (not UAV) but similar to our work attempts a comparison and validation of airborne LiDAR point clouds and high-resolution satellite images for extracting useful information about trees. In a more related research work [69] to the current paper, it is shown that field measurements of tree height are very similar (R2 = 0.97) to photogrammetric generated point clouds. Therefore, we have used this reference to justify why we did not use field measurements of tree height.
Finally, it should be noted that multispectral images offer unique complementary information in addition to 3D point clouds as the photographs can be used for tree species identification. As the noise of point cloud derived from both sources can affect the estimated tree parameters, de-noising the point clouds is recommended before estimating the tree parameters. This will guarantee the accuracy of tree parameters derived from 3D point clouds.
5. Conclusions
The capabilities of photogrammetric and LiDAR point clouds for mapping urban tree canopy were analysed and compared. The research showed that the point clouds derived from both photogrammetric and LiDAR techniques are almost the same and provide similar tree characteristics. This will assist urban foresters who use a UAV for scanning canopies. By knowing that the point clouds from either sensor are the same, it will enable the UAV to be lighter and to increase its flying time. In both cases, the low altitude of the UAV leads to the obliqueness of the swath or reduces the field of view which causes the gap between the scans line. A way of compensating for this would be to fly a highly overlapping trajectory, but this may increase the overall time and cost for the scan and may be impractical considering the battery life of the UAV.
The photogrammetric technique can provide sufficient information for mapping tree canopy cover with low-cost sensors, 20 times cheaper than LiDAR sensors, and reasonable computation cost [70]. The more expensive sensors yield more defects in the case of a UAV crash. In addition, photogrammetric point clouds offer colourised point cloud which will be more beneficial in terms of visualisation and further point cloud processing. In addition, multispectral orthoimage as a photogrammetric standard product offers an invaluable source of information to identify tree species. The point clouds can be found from Supplementary Materials.
Supplementary Materials
The following are available online at https://0-www-mdpi-com.brum.beds.ac.uk/article/10.3390/rs13112062/s1.
Author Contributions
Conceptualization, E.G.P.; data curation, E.G.P.; funding acquisition, M.A.; methodology, E.G.P.; validation, E.G.P.; visualization, E.G.P.; writing—original draft, E.G.P.; writing—review and editing, M.A. All authors have read and agreed to the published version of the manuscript.
Funding
This research was supported by the Australian Research Council Discovery Project: “Seeing the good from the trees: remotely sensing the urban forest” (DP 150103135). It was also supported by BNUT/395022/1400 funding.
Data Availability Statement
The LiDAR and photogrammetric point clouds used in this research are freely available (https://susy.mdpi.com/user/manuscripts/displayFile/d71a32682356d1cece4c03b0d1688c6e/supplementary).
Conflicts of Interest
The authors declare no conflict of interest.
References
- Berland, A.; Shiflett, S.A.; Shuster, W.D.; Garmestani, A.S.; Goddard, H.C.; Herrmann, D.L.; Hopton, M.E. The role of trees in urban stormwater management. Landsc. Urban Plan. 2017, 162, 167–177. [Google Scholar] [CrossRef] [Green Version]
- Gillner, S.; Vogt, J.; Tharang, A.; Dettmann, S.; Roloff, A. Role of street trees in mitigating effects of heat and drought at highly sealed urban sites. Landsc. Urban Plan. 2015, 143, 33–42. [Google Scholar] [CrossRef]
- Matthews, T.; Lo, A.Y.; Byrne, J.A. Reconceptualizing green infrastructure for climate change adaptation: Barriers to adoption and drivers for uptake by spatial planners. Landsc. Urban Plan. 2015, 138, 155–163. [Google Scholar] [CrossRef]
- Roy, S.; Byrne, J.; Pickering, C. A systematic quantitative review of urban tree benefits, costs, and assessment methods across cities in different climatic zones. Urban For. Urban Green. 2012, 11, 351–363. [Google Scholar] [CrossRef] [Green Version]
- Giannico, V.; Lafortezza, R.; John, R.; Sanesi, G.; Pesola, L.; Chen, J. Estimating stand volume and above-ground biomass of urban forests using LiDAR. Remote Sens. 2016, 8, 339. [Google Scholar] [CrossRef] [Green Version]
- Huang, Y.; Yu, B.; Zhou, J.; Hu, C.; Tan, W.; Hu, Z.; Wu, J. Toward automatic estimation of urban green volume using airborne LiDAR data and high resolution Remote Sensing images. Front. Earth Sci. 2013, 7, 43–54. [Google Scholar] [CrossRef]
- Raciti, M.S.; Hutyra, L.R.; Newell, J.D. Mapping carbon storage in urban trees with multi-source remote sensing data: Relationships between biomass, land use, and demographics in Boston neighborhoods. Sci. Total Environ. 2014, 500, 72–83. [Google Scholar] [CrossRef] [PubMed]
- Tanhuanpää, T.; Vastaranta, M.; Kankare, V.; Holopainen, M.; Hyyppä, J.; Hyyppä, H.; Alho, P.; Raisio, J. Mapping of urban roadside trees—A case study in the tree register update process in Helsinki City. Urban For. Urban Green. 2014, 13, 562–570. [Google Scholar] [CrossRef]
- Remondino, F.; Barazzetti, L.; Nex, F.; Scaioni, M.; Sarazzi, D. UAV photogrammetry for mapping and 3d modeling—Current status and future perspectives. ISPRS Int. Arch. Photogramm. Remote Sens. Spat. Inf. Sci. 2012, 38, C22. [Google Scholar] [CrossRef] [Green Version]
- Flying Drones Commercially. 2019. Available online: https://www.casa.gov.au/standard-page/flying-drones-commercially (accessed on 1 April 2021).
- Cao, L.; Liu, H.; Fu, X.; Zhang, Z.; Shen, X.; Ruan, H. Comparison of UAV LiDAR and Digital Aerial Photogrammetry Point Clouds for Estimating Forest Structural Attributes in Subtropical Planted Forests. Forests 2019, 10, 145. [Google Scholar] [CrossRef] [Green Version]
- Ritter, B. Use of Unmanned Aerial Vehicles (UAV) for Urban Tree Inventories. Ph.D. Thesis, Clemson University, Clemson, SC, USA, 2014. Available online: https://tigerprints.clemson.edu/all_theses/1890 (accessed on 1 April 2021).
- Tomaštík, J.; Mokroš, M.; Saloň, Š.; Chudý, F.; Tunák, D. Accuracy of photogrammetric UAV-based point clouds under conditions of partially-open forest canopy. Forests 2017, 8, 151. [Google Scholar] [CrossRef] [Green Version]
- Osborn, J.; Dell, M.; Stone, C.; Iqbal, I.; Lacey, M.; Lucieer, A.; McCoull, C. Photogrammetry for Forest Inventory: Planning Guidelines. Deployment and Integration of Cost-Effective, High. Spatial Resolution, Remotely Sensed Data for the Australian Forestry Industry; Australian Government Department of Agriculture, Fisheries and Forestry (DAFF): Canberra, Australia, 2017. [Google Scholar]
- Kallimani, C. Tree Crown Shape Parameter Extraction from Airborne Photogrammetric Point Cloud. Ph.D. Thesis, WageningenUniversity, Wageningen, The Netherlands, 2016. [Google Scholar]
- Amrullah, C.; Suwardhi, D.; Meilano, I. Product accuracy effect of oblique and vertical non-metric digital camera utilization in UAV-photogrammetry to determine fault plane. ISPRS Ann. Photogramm. Remote Sens. Spat. Inf. Sci. 2016, 3, 41. [Google Scholar] [CrossRef] [Green Version]
- Birdal, A.C.; Avdan, U.; Türk, T. Estimating tree heights with images from an unmanned aerial vehicle. Geomat. Nat. Hazards Risk 2017, 8, 1144–1156. [Google Scholar] [CrossRef] [Green Version]
- Mweresa, A.I.; Odera, P.A.; Kuria, D.N.; Kenduiywo, B.K. Estimation of tree distribution and canopy heights in Ifakara, Tanzania, using unmanned aerial system (UAS) stereo imagery. Am. J. Geogr. Inf. Syst. 2017, 6, 187–200. [Google Scholar]
- Swinfield, T.; Lindsell, J.A.; Williams, J.V.; Harrison, R.D.; Agustiono; Habibi; Gemita, E.; Schönlieb, C.B.; Coomes, D.A. Accurate Measurement of Tropical Forest Canopy Heights and Aboveground Carbon Using Structure From Motion. Remote Sens. 2019, 11, 928. [Google Scholar] [CrossRef] [Green Version]
- Yilmaz, V.; Yilmaz, C.S.; Tasci, L.; Gungor, O. Determination of Tree Crown Diameters with Segmentation of a UAS-Based Canopy Height Model. IPSI Bgd Trans. Internet Res. 2017, 13, 63–67. [Google Scholar]
- Shin, P.; Sankey, T.; Moore, M.M.; Thode, A.E. Evaluating Unmanned Aerial Vehicle Images for Estimating Forest Canopy Fuels in a Ponderosa Pine Stand. Remote. Sens. 2018, 10, 1266. [Google Scholar] [CrossRef] [Green Version]
- Kuželka, K.; Surový, P. Mapping Forest Structure Using UAS inside Flight Capabilities. Sensors 2018, 18, 2245. [Google Scholar] [CrossRef] [Green Version]
- Hamraz, H.; Contreras, M.A.; Zhang, J. Vertical stratification of forest canopy for segmentation of understory trees within small-footprint airborne LiDAR point clouds. ISPRS J. Photogramm. Remote Sens. 2017, 130, 385–392. [Google Scholar] [CrossRef] [Green Version]
- Herrero-Huerta, M.; Lindenbergh, R.; Rodríguez-Gonzálvez, P. Automatic tree parameter extraction by a Mobile LiDAR System in an urban context. PLoS ONE 2018, 13, e0196004. [Google Scholar] [CrossRef] [Green Version]
- Itakura, K.; Hosoi, F. Estimation of Leaf Inclination Angle in Three-Dimensional Plant Images Obtained from Lidar. Remote Sens. 2019, 11, 344. [Google Scholar] [CrossRef] [Green Version]
- Li, J.; Yang, B.; Cong, Y.; Cao, L.; Fu, X.; Dong, Z. 3D Forest Mapping Using A Low-Cost UAV Laser Scanning System: Investigation and Comparison. Remote Sens. 2019, 11, 717. [Google Scholar] [CrossRef] [Green Version]
- Zhang, C.; Zhou, Y.; Qiu, F. Individual Tree Segmentation from LiDAR Point Clouds for Urban Forest Inventory. Remote Sens. 2015, 7, 7892–7913. [Google Scholar] [CrossRef] [Green Version]
- Chen, C.; Yang, B.; Song, S.; Peng, X.; Huang, R. Automatic Clearance Anomaly Detection for Transmission Line Corridors Utilizing UAV-Borne LIDAR Data. Remote Sens. 2018, 10, 613. [Google Scholar] [CrossRef] [Green Version]
- Parmehr, E.G.; Amati, M.; Taylor, E.J.; Livesley, S.J. Estimation of urban tree canopy cover using random point sampling and remote sensing methods. Urban For. Urban Green. 2016, 20, 160–171. [Google Scholar] [CrossRef]
- Pfeifer, N.; Reiter, T.; Briese, C.; Rieger, W. Interpolation of high quality ground models from laser scanner data in forested areas. Int. Arch. Photogramm. Remote Sens. 1999, 32, 31–36. [Google Scholar]
- Maas, H.-G. The potential of height texture measures for the segmentation of airborne laserscanner data. In Proceedings of the Fourth International Airborne Remote Sensing Conference and Exhibition/21st Canadian Symposium on Remote Sensing, Ottawa, ON, Canada, 21–24 June 1999. [Google Scholar]
- Alonzo, M.; Bookhagen, B.; Roberts, D.A. Urban tree species mapping using hyperspectral and lidar data fusion. Remote Sens. Environ. 2014, 148, 70–83. [Google Scholar] [CrossRef]
- Gumhold, S.; Wang, X.; MacLeod, R.S. Feature Extraction From Point Clouds. In Proceedings of the 10th International Meshing Roundtable, Newport Beach, CA, USA, 7–10 October 2001; pp. 293–305. [Google Scholar]
- Belton, D.; Moncrieff, S.; Chapman, J. Processing tree point clouds using Gaussian Mixture Models. ISPRS Ann. Photogramm. Remote Sens. Spat. Inf. Sci. 2013, 3, 43–48. [Google Scholar] [CrossRef] [Green Version]
- Hackenberg, J.; Spiecker, H.; Calders, K.; Disney, M.; Raumonen, P. SimpleTree—An Efficient Open Source Tool to Build Tree Models from TLS Clouds. Forests 2015, 6, 4245–4294. [Google Scholar] [CrossRef]
- Klingberg, J.; Konarska, J.; Lindberg, F.; Johansson, L.; Thorsson, S. Mapping leaf area of urban greenery using aerial LiDAR and ground-based measurements in Gothenburg, Sweden. Urban For. Urban Green. 2017, 26, 31–40. [Google Scholar] [CrossRef]
- Alonzo, M.; Bookhagen, B.; McFadden, J.P.; Sun, A.; Roberts, D.A. Mapping urban forest leaf area index with airborne lidar using penetration metrics and allometry. Remote Sens. Environ. 2015, 162, 141–153. [Google Scholar] [CrossRef]
- Oshio, H.; Asawa, T.; Hoyano, A.; Miyasaka, S. Estimation of the leaf area density distribution of individual trees using high-resolution and multi-return airborne LiDAR data. Remote Sens. Environ. 2015, 166, 116–125. [Google Scholar] [CrossRef]
- Fernández-Álvarez, M.; Armesto, J.; Picos, J. LiDAR-based wildfire prevention in WUI: The automatic detection, measurement and evaluation of forest fuels. Forests 2019, 10, 148. [Google Scholar] [CrossRef] [Green Version]
- Wallace, L.; Lucieer, C.W.; Turner, D.J.R.S. Development of a UAV-LiDAR system with application to forest inventory. Remote Sens. 2012, 4, 1519–1543. [Google Scholar] [CrossRef] [Green Version]
- Wu, J.; Yao, W.; Polewski, P. Mapping Individual Tree Species and Vitality along Urban Road Corridors with LiDAR and Imaging Sensors: Point Density versus View Perspective. Remote Sens. 2018, 10, 1403. [Google Scholar] [CrossRef] [Green Version]
- Seidel, D.; Fleck, S.; Leuschner, C.; Hammett, T. Review of ground-based methods to measure the distribution of biomass in forest canopies. Ann. Sci. 2011, 68, 225–244. [Google Scholar] [CrossRef] [Green Version]
- Liang, S.; Wang, J. Advanced Remote Sensing: Terrestrial Information Extraction and Applications; Academic Press: Cambridge, MA, USA, 2019. [Google Scholar]
- Skarlatos, D.; Vlachos, M. Vegetation removal from UAV derived DSMS, using combination of RGB and NIR imagery. ISPRS Ann. Photogramm. Remote Sens. Spat. Inf. Sci. 2018, 4, 255–262. [Google Scholar] [CrossRef] [Green Version]
- Weber, A.; Lerch, T. Point Clouds: Laser Scanning versus UAS Photogrammetry. Gim Int. Worldw. Mag. Geomat. 2018, 32, 35–38. [Google Scholar]
- Frey, J.; Kovach, K.; Stemmler, S.; Koch, B. UAV Photogrammetry of Forests as a Vulnerable Process. A Sensitivity Analysis for a Structure from Motion RGB-Image Pipeline. Remote Sens. 2018, 10, 912. [Google Scholar] [CrossRef] [Green Version]
- Pilarska, M.; Ostrowski, W.; Bakuła, K.; Górski, K.; Kurczyński, Z. The potential of light laser scanners developed for unmanned aerial vehicles-the review and accuracy. Int. Arch. Photogramm. Remote Sens. Spat. Inf. Sci. 2016, 42, 87–95. [Google Scholar] [CrossRef] [Green Version]
- Wallace, L.; Bellman, C.; Hally, B.; Hernandez, J.; Jones, S.; Hillman, S. Assessing the Ability of Image Based Point Clouds Captured from a UAV to Measure the Terrain in the Presence of Canopy Cover. Forests 2019, 10, 284. [Google Scholar] [CrossRef] [Green Version]
- Basgall, P.L.; Kruse, F.A.; Olsen, R.C. Comparison of lidar and stereo photogrammetric point clouds for change detection. In Laser Radar Technology and Applications XIX; and Atmospheric Propagation XI; Turner, M.D., Kamermanm, G.W., Thomas, L.M.W., Spillar, E.J., Eds.; International Society for Optics and Photonics: Bellingham, WA, USA, 2014. [Google Scholar]
- Izumida, A.; Uchiyama, S.; Sugai, T. Application of UAV-SfM photogrammetry and aerial lidar to a disastrous flood: Repeated topographic measurement of a newly formed crevasse splay of the Kinu River, central Japan. Nat. Hazards Earth Syst. Sci. 2017, 17, 1505. [Google Scholar] [CrossRef] [Green Version]
- Wang, Y.; Wen, W.; Wu, S.; Wang, C.; Yu, Z.; Guo, X.; Zhao, C. Maize Plant Phenotyping: Comparing 3D Laser Scanning, Multi-View Stereo Reconstruction, and 3D Digitizing Estimates. Remote Sens. 2018, 11, 63. [Google Scholar] [CrossRef] [Green Version]
- Solazzo, D.; Sankey, J.B.; Sankey, T.T.; Munson, S.M. Mapping and measuring aeolian sand dunes with photogrammetry and LiDAR from unmanned aerial vehicles (UAV) and multispectral satellite imagery on the Paria Plateau, AZ, USA. Geomorphology 2018, 319, 174–185. [Google Scholar] [CrossRef]
- Thiel, C.; Schmullius, C. Comparison of UAV photograph-based and airborne lidar-based point clouds over forest from a forestry application perspective. Int. J. Remote Sens. 2016, 38, 2411–2426. [Google Scholar] [CrossRef]
- Thiel, C.; Schmullius, C. Derivation of Forest Parameters from Stereographic UAV Data-A Comparison with Airborne LiDAR Data. In Proceedings of the Living Planet Symposium, Prague, Czech Republic, 9–13 May 2016. [Google Scholar]
- Roşca, S.; Suomalainen, J.; Bartholomeus, H.; Herold, M. Comparing terrestrial laser scanning and unmanned aerial vehicle structure from motion to assess top of canopy structure in tropical forests. Interface Focus 2018, 8, 20170038. [Google Scholar] [CrossRef]
- Mader, D.; Blaskow, R.; Westfeld, P.; Maas, H. UAV-based acquisition of 3d point cloud-A comparison of a low-cost laser scanner and SFM-tools. Int. Arch. Photogramm. Remote Sens. Spat. Inf. Sci. 2015, 40, 335. [Google Scholar] [CrossRef] [Green Version]
- Firoz, A.; Uddin, M.M.; Goparaju, L. 3D Mapping by Photogrammetry and LiDAR. For. Stud. 2018, 95, 224–234. [Google Scholar]
- Tomasi, C.; Kanade, T. Shape and motion from image streams under orthography: A factorization method. Int. J. Comput. Vis. 1992, 9, 137–154. [Google Scholar] [CrossRef]
- Hartley, R.; Zisserman, A. Multiple View Geometry in Computer Vision; Cambridge University Press: Cambridge, UK, 2001; ISBN 0521540518. [Google Scholar]
- Zhang, W.; Qi, J.; Wan, P.; Wang, H.; Xie, D.; Wang, X.; Yan, G. An Easy-to-Use Airborne LiDAR Data Filtering Method Based on Cloth Simulation. Remote Sens. 2016, 8, 501. [Google Scholar] [CrossRef]
- Besl, P.J.; McKay, N.D. Method for registration of 3-D shapes. In Sensor Fusion IV: Control Paradigms and Data Structures; International Society for Optics and Photonics: Bellingham, WA, USA, 1992. [Google Scholar]
- Soma, M.; Pimont, F.; Dupuy, J.-L. Sensitivity of voxel-based estimations of leaf area density with terrestrial LiDAR to vegetation structure and sampling limitations: A simulation experiment. Remote Sens. Environ. 2021, 257, 112354. [Google Scholar] [CrossRef]
- Preparata, F.P.; Hong, S.J. Convex hulls of finite sets of points in two and three dimensions. Commun. ACM 1977, 20, 87–93. [Google Scholar] [CrossRef]
- Filippelli, S.K.; Lefsky, M.A.; Rocca, M.E. Comparison and integration of lidar and photogrammetric point clouds for mapping pre-fire forest structure. Remote Sens. Environ. 2019, 224, 154–166. [Google Scholar] [CrossRef]
- Catalucci, S.; Marsili, R.; Moretti, M.; Rossi, G. Comparison between point cloud processing techniques. Measurement 2018, 127, 221–226. [Google Scholar] [CrossRef]
- Yao, W.; Krzystek, P.; Heurich, M. Tree species classification and estimation of stem volume and DBH based on single tree extraction by exploiting airborne full-waveform LiDAR data. Remote Sens. Environ. 2012, 123, 368–380. [Google Scholar] [CrossRef]
- Chen, Q.; Gong, P.; Baldocchi, D.; Tian, Y.Q. Estimating Basal Area and Stem Volume for Individual Trees from Lidar Data. Photogramm. Eng. Remote Sens. 2007, 73, 1355–1365. [Google Scholar] [CrossRef] [Green Version]
- Verma, N.K.; Lamb, D.W.; Reid, N.; Wilson, B. Comparison of Canopy Volume Measurements of Scattered Eucalypt Farm Trees Derived from High Spatial Resolution Imagery and LiDAR. Remote Sens. 2016, 8, 388. [Google Scholar] [CrossRef] [Green Version]
- Krause, S.; Sanders, T.G.; Mund, J.-P.; Greve, K. UAV-Based Photogrammetric Tree Height Measurement for Intensive Forest Monitoring. Remote Sens. 2019, 11, 758. [Google Scholar] [CrossRef] [Green Version]
- Drone Photogrammetry vs. LiDAR. Available online: https://wingtra.com/drone-photogrammetry-vs-lidar/ (accessed on 1 April 2021).
Figure 1.
Study area partially comprising Yarra Park, Melbourne and measured GCPs.

Figure 2.
The UAV used for data collection.

Figure 3.
LiDAR (a) and imagery (b) sensors.

Figure 4.
The LiDAR point cloud with the number of returns (blue for one return and green for two returns) along with the flight line of the UAV for data collection (in white).
Figure 4.
The LiDAR point cloud with the number of returns (blue for one return and green for two returns) along with the flight line of the UAV for data collection (in white).

Figure 5.
One of the multispectral images.

Figure 6.
Workflow of photogrammetric data processing (from image to point cloud).

Figure 7.
3D point clouds covering the test area: (a) height-coded photogrammetric point cloud; (b) colourised Photogrammetric point cloud; (c) height-coded LiDAR point cloud and (d) intensity of LiDAR point cloud.
Figure 7.
3D point clouds covering the test area: (a) height-coded photogrammetric point cloud; (b) colourised Photogrammetric point cloud; (c) height-coded LiDAR point cloud and (d) intensity of LiDAR point cloud.

Figure 8.
3D non-ground points: (a) height-coded photogrammetric point cloud; (b) colourised Photogrammetric point cloud; (c) height-coded LiDAR point cloud and (d) intensity of LiDAR point cloud.
Figure 8.
3D non-ground points: (a) height-coded photogrammetric point cloud; (b) colourised Photogrammetric point cloud; (c) height-coded LiDAR point cloud and (d) intensity of LiDAR point cloud.

Figure 9.
Calculating the distance between the point clouds using k-nearest neighbour.

Figure 10.
Comparison of different tree canopy maximum diameter area using LiDAR and photogrammetric point clouds (convex hull in red and concave hull in blue).
Figure 10.
Comparison of different tree canopy maximum diameter area using LiDAR and photogrammetric point clouds (convex hull in red and concave hull in blue).

Figure 11.
Comparison of different tree canopy parameters using LiDAR and photogrammetric point clouds, top: convex hull and bottom: concave hull.
Figure 11.
Comparison of different tree canopy parameters using LiDAR and photogrammetric point clouds, top: convex hull and bottom: concave hull.


Figure 12.
Distance between the point clouds: (a) original photogrammetric and LiDAR point clouds, (b) registered photogrammetric and LiDAR point clouds and (c) original and registered photogrammetric point clouds.
Figure 12.
Distance between the point clouds: (a) original photogrammetric and LiDAR point clouds, (b) registered photogrammetric and LiDAR point clouds and (c) original and registered photogrammetric point clouds.

Figure 13.
Scatterplot of Z values for photogrammetric and LiDAR point clouds.

Figure 14.
Comparison of tree canopy parameters.

Figure 15.
Side view of LiDAR and photogrammetric 3D points of a tree.

Figure 16.
Scatterplots of estimated tree parameters.


Table 1.
Technical specification of the LiDAR sensor.
| LiDAR Sensor | Navigation System | ||
|---|---|---|---|
| Laser Properties | Class 1, 905 nm | Constellation Support | GPS, GLONASS |
| Range min/max/Resolution | 1.0 m/120 m/2 mm | Support Alignment | Static, Kinematic, Dual-Antenna |
| Field of Range | FOV, 30° V/360° Hz | Operation Modes | Real-time, Post-Processing optional |
| Scan Rate | 700 k shots/s, | Accuracy Position | 1 cm + 1 ppm RMS horizontal |
| Scan Height | 20–60 m AGL | PP Attitude Heading | 0.009/0.017° IMU options |
Table 2.
Statistical parameters of the photogrammetric and LiDAR point clouds.
| Point Cloud | Direction | Min (m) | Mean (m) | Max (m) | Std (m) |
|---|---|---|---|---|---|
| Photogrammetry | X | 0 | 89.46 | 182.88 | 43.59 |
| Y | 0 | 103.81 | 211.07 | 51.351 | |
| Z | 0 | 9.11880 | 23.74 | 4.22 | |
| LiDAR | X | 0 | 106.97 s | 183.97 | 38.14 |
| Y | 0 | 104.33 | 208.76 | 46.66 | |
| Z | 0 | 10.17 | 24.78 | 4.20 |
Table 3.
The difference between estimated tree canopy parameters using photogrammetric and LiDAR point clouds.
Table 3.
The difference between estimated tree canopy parameters using photogrammetric and LiDAR point clouds.
| Criteria | Height (m) | Diameter (m) | Area (m2) | Volume (m3) |
|---|---|---|---|---|
| Min | 0.03 | 0.28 | 0.45 | 7.30 |
| Mean | 0.26 | 0.95 | 17.45 | 138.67 |
| Max | 0.59 | 3.13 | 66.37 | 599.19 |
| std | 0.14 | 0.65 | 17.02 | 139.65 |
| R2 | 99.54% | 95.23% | 96.39% | 97.21% |
Publisher’s Note: MDPI stays neutral with regard to jurisdictional claims in published maps and institutional affiliations. |
© 2021 by the authors. Licensee MDPI, Basel, Switzerland. This article is an open access article distributed under the terms and conditions of the Creative Commons Attribution (CC BY) license (https://creativecommons.org/licenses/by/4.0/).
Share and Cite
MDPI and ACS Style
Ghanbari Parmehr, E.; Amati, M. Individual Tree Canopy Parameters Estimation Using UAV-Based Photogrammetric and LiDAR Point Clouds in an Urban Park. Remote Sens. 2021, 13, 2062. https://0-doi-org.brum.beds.ac.uk/10.3390/rs13112062
AMA Style
Ghanbari Parmehr E, Amati M. Individual Tree Canopy Parameters Estimation Using UAV-Based Photogrammetric and LiDAR Point Clouds in an Urban Park. Remote Sensing. 2021; 13(11):2062. https://0-doi-org.brum.beds.ac.uk/10.3390/rs13112062
Chicago/Turabian StyleGhanbari Parmehr, Ebadat, and Marco Amati. 2021. "Individual Tree Canopy Parameters Estimation Using UAV-Based Photogrammetric and LiDAR Point Clouds in an Urban Park" Remote Sensing 13, no. 11: 2062. https://0-doi-org.brum.beds.ac.uk/10.3390/rs13112062
Note that from the first issue of 2016, this journal uses article numbers instead of page numbers. See further details here.