
Watershed Monitoring in Galicia from UAV Multispectral Imagery Using Advanced Texture Methods


1
Departamento de Electrónica e Computación, Universidade de Santiago de Compostela, 15782 Santiago de Compostela, Spain
2
Centro Singular de Investigación en Tecnoloxías Intelixentes, Universidade de Santiago de Compostela, 15782 Santiago de Compostela, Spain
*
Author to whom correspondence should be addressed.
Remote Sens. 2021, 13(14), 2687; https://0-doi-org.brum.beds.ac.uk/10.3390/rs13142687
Submission received: 28 May 2021
/
Revised: 1 July 2021
/
Accepted: 4 July 2021
/
Published: 8 July 2021
(This article belongs to the Special Issue Utilising Remotely Sensed Imagery for Effective Conservation and Restoration Outcomes)
Abstract
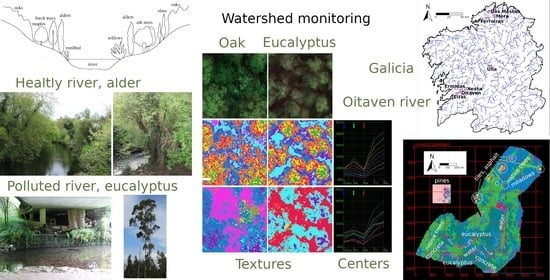
:Watershed management is the study of the relevant characteristics of a watershed aimed at the use and sustainable management of forests, land, and water. Watersheds can be threatened by deforestation, uncontrolled logging, changes in farming systems, overgrazing, road and track construction, pollution, and invasion of exotic plants. This article describes a procedure to automatically monitor the river basins of Galicia, Spain, using five-band multispectral images taken by an unmanned aerial vehicle and several image processing algorithms. The objective is to determine the state of the vegetation, especially the identification of areas occupied by invasive species, as well as the detection of man-made structures that occupy the river basin using multispectral images. Since the territory to be studied occupies extensive areas and the resulting images are large, techniques and algorithms have been selected for fast execution and efficient use of computational resources. These techniques include superpixel segmentation and the use of advanced texture methods. For each one of the stages of the method (segmentation, texture codebook generation, feature extraction, and classification), different algorithms have been evaluated in terms of speed and accuracy for the identification of vegetation and natural and artificial structures in the Galician riversides. The experimental results show that the proposed approach can achieve this goal with speed and precision.
1. Introduction
River ecosystems and their basins have been subjected to profound disturbances, mainly due to the increase in human population and consequent degradation of natural resources, therefore the protection of these ecosystems is essential. A well-functioning watershed carries out nutrient cycling, carbon storage, erosion, sedimentation, and flood control, soil formation, and water filtration. They supply drinking water, water for agriculture and manufacturing, a habitat to numerous plants and animals, as well as opportunities for recreation and the enjoyment of nature. Watershed management is the study of the soil, plant, and water resources of a catchment and the process of creating and implementing plans, programs, and projects aimed at their conservation and sustainable exploitation. Some objectives of watershed management are the protection of drinking water sources from environmental pollutants, limiting the supply of fertilizers from agricultural lands, mitigating the risk of flooding, and restoring riparian vegetation [1,2,3,4,5]. A very influential report by FAO describes the experiences from different watershed management projects conducted in several countries [6]. Figure 1, Figure 2 and Figure 3 show some examples of rivers and riparian vegetation in Galicia, their wild fauna, and threats to which they are subjected.
Remotely sensed imagery has the potential to assist watershed management. Vegetation studies in river basins have traditionally been carried out through in-situ surveys, but there is the problem that they require a large amount of work and there are also areas that are difficult to access. The use of imaging systems, whether from satellites or airplanes, facilitate the study of large areas of land [7]. However, remote sensing techniques, when applied to watersheds, present some difficulties [8]. Riparian vegetation is difficult to distinguish because of its dense distribution and similar spectral and textural characteristics of different species.
The spectral characteristics of the wetlands and riparian vegetation are determined by the composition of the plant communities, the meteorology, and the hydrological regime, which exhibit significant variability in the different locations and throughout the year. The confusion between the different cover classes can be exacerbated by the presence of topographic shadows, which are often mistaken for dark flooded surfaces. In addition, the canopy cover of coniferous forests can hide small wetlands and transition zones when viewed from above. Furthermore, the variable light and climatic conditions make it impossible to apply an automated process in a uniform way [9]. These problems are aggravated by the small percentage of the areas occupied by wetlands and riparian vegetation in the landscape, which makes the application of classification algorithms difficult due to the existence of more abundant land cover classes.
Unmanned aerial vehicles (UAV) are an efficient and low-cost method for the characterization of vegetation over large areas [10,11]. An example of UAV is shown in Figure 4. The miniaturization of high-quality sensors, such as multispectral and hyperspectral imaging systems, and the application of advanced processing algorithms makes it possible to minimize the difficulties listed above [12]. Some remote sensing methods using multispectral and hyperspectral imagery have been applied to river basin characterization on a large scale. In [13] ground-based data in conjunction with low-altitude UAV imagery was used to assess vegetation and ground cover characteristics in central Oregon, USA. Reflectance characteristics from multispectral imagery (RGB, near infrared, and red-edge wavelengths), several vegetation indices (including NDVI) and SVM supervised classification were used to estimate the canopy cover and to identify different vegetation species at the watershed.
A procedure to map riparian vegetation in the middle Rio Grande River, New Mexico, was presented in [14]. Airborne multispectral digital images and an iterative supervised classification procedure were used in that study. At each iteration, the existing signature set was used to classify the image using a maximum likelihood scheme. In [15] a classification of riparian forest species and their health condition using multi-temporal hyperspatial and light detection and ranging (LiDAR) imagery from UAVs was carried out. Different spectral, vegetation, and texture indices were used, in conjunction with a multiscale segmentation and a random-forest classifier. For its part, [16] shows how a detailed riparian vegetation mapping can be used to prioritize conservation and restoration sites around the San Rafael River, a desert river in south-eastern Utah, United States. They use multispectral satellite imagery and oblique aerial photography, in conjunction with multi-resolution image segmentation and classification rules based on object properties such as spectral reflectance, shape, size, and neighborhood relations.
Since the spectral characteristics of the different species of vegetation in the riparian zones are very similar, and also present large individual variability, techniques based on textures have been developed. Textures can be defined as the pattern of microstructures (coarseness, contrast, directionality, line-likeness, regularity, and roughness) that characterizes the image [17]. Different papers focused on the classification of vegetation species using texture features in color, multi or hyperspectral imagery can be found in the literature. The simplest methods to characterize vegetation using textures are based on color histograms, statistical measures (mean, standard deviation, skewness, kurtosis, entropy, etc.) [18,19]. Two simple methods for texture extraction, based on the analysis of patterns in the neighborhood of a pixel, are local binary pattern (LBP) and gray-level co-occurrence matrix (GLCM) [20,21].
More elaborate texture methods based on local invariant descriptors, such as speeded-Up robust features (SURF) and scale-invariant feature transform (SIFT), can also be used for characterizing vegetation species [22,23]. A classification chain based on textures may be combined with other types of features obtained by UAVs to improve the classification results. Among them are spectral features, vegetation indices, and morphological measures [18,24]. In [25] different techniques for vegetation classification in multi and hyperspectral images based on texture extraction and bag of words (BoW) are compared. The techniques are structured into three groups: codebook-based, descriptor-based, and spectrally enhanced descriptor-based groups. Finally, convolutional neural networks (CNN) can also be used to classify vegetation exploiting textures, although their computational complexity and execution times are much higher [26,27].
The main objective of this work is to monitor the river basins of Galicia, Spain, using five-band multispectral images taken by UAVs and appropriate image processing algorithms, in order to replace in-site surveys, which require an enormous amount of time and effort. The software solution presented consists of a supervised classification chain based on spatial-spectral characteristics and texture descriptors at superpixel level. Since the study is carried out on a large scale, the selected algorithms are fast and various strategies are used to reduce execution times. A previous version of this work was presented in [28].
The rest of the article is organized into four sections. Section 2 presents the methods used in this study, including the description of the proposed classification chain involving superpixel computation and texture extraction. The experimental results for the evaluation in terms of classification performance and computational cost are presented in Section 3. Then, the discussion is carried out in Section 4. Finally, Section 5 summarizes the main conclusions.
2. Materials and Methods
In this section we present the methods and procedures used for the monitorization of the river basins in Galicia.
2.1. Study Area
Galicia is a region in the north-west of Spain with Atlantic climate, mild temperatures and abundant rain most of the year, although summers can have low rainfall [29]. A map with the main rivers of this region is shown in Figure 5. In Galicia, riverside forests cover an area of 25,000 hectares with a great diversity of arboreal, shrub, and herbaceous species distributed as follows [30]:
- According to the level of water required by the trees, as observed in the cross section in Figure 6, several bands of land can be distinguished. In the first line, closer to the river, alders (Alnus glutinosa) and willows (Salix atrocinerea) can be found; followed by birch trees (Betula pendula and B. pubescens), hazelnuts (Corylus avellana), ash trees (Fraxinus angustifolia, and F. excelsior) and white maples (Acer pseudoplatanus); and further away from the river there are laurels (Laurus nobilis), oaks (Quercus robur), and elms (Ulmus minor);
- As for shrubs, there are species such as the black elderberry (Sambucus nigra) and the crawfish (Frangula alnus); climbing plants, among which ivy (Hedera helix), the honeysuckle (Lonicera periclymenun), dulcamara or devil’s grapes (Solanum dulcamara), and hops (Humulus lupulus); as well as thorny rosaceae, mainly blackberries (Rubus fruticosus);
- As for herbaceous plants, there are sedges, grasses, and reeds; ferns, mainly the royal fern (Osmunda regalis); and other vascular plants such as devil’s turnips (Oenanthe crocata), cattails (Typha latifolia), yellow lilies (Iris pseudacorus), loosestrife or puffins (Lythrum salicaria), daffodils (Narcissus cyclamineus), and spearmint (Mentha aquatica) can be found.
The natural environment of the river banks in Galicia has undergone a profound transformation due to the intense anthropic pressure that it has historically endured. The alluvial plains that originally housed phreatophyte forests have been transformed into cultivated areas and meadows and, subsequently, into pine or eucalyptus plantations. Figure 7 shows photographs of tree species typical of the riparian zones of Galicia and the invasive species pine and eucalyptus.
Pines, mainly Pinus pinaster, but also P. sylvestris, and P. pinea, are native species of the Atlantic region, but they are not typical tree species of river banks. Pines have been used for reforestation in places where they did not grow naturally for the use of wood. They replaced native oak or chestnut forests that were being cut down, and currently these conifers occupy 30% of the Galician forest area.
Eucalyptus globulus is an invasive tree in Galicia, which, due to its high expansive capacity, replaces autonomous species. It currently occupies a 20% of the Galician forest area and threatens the Atlantic forest. Eucalyptus on river banks eliminate native vegetation and change the load of leaves in rivers, providing material that is more difficult to decompose. Consequently, rivers in which there is a greater presence of eucalyptus will have a lower quality of organic matter, reducing the abundance and diversity of detritivore organisms. In addition, eucalyptus trees change the seasonality of the ecosystem, since most of their leaves fall in summer in a way that is not synchronized with the communities that feed on this matter. Eucalyptus also burns fast and easily, which favors forest fires and causes erosion and deterioration of the land. Additionally, the trend of global climate change towards drier environments could aggravate this problem, since fast-growing trees such as eucalyptus or pines consume much more water than native species. Therefore, eucalyptus trees reduce the diversity and life of river banks and increase the risk of rivers drying out in summer.
2.2. Objectives
The overall objective of this study is the classification of the vegetation in the Galician hydrographic basins, as well as the detection of natural and artificial elements up to a maximum distance of 100 m from the river. This study is part of a broader project of integrated water management in order to optimize water resources in Galicia, while preserving the balance of the natural environment and river ecosystems, respecting the achievement of the environmental objectives established for the water bodies and attending to the new scenarios determined by climate change [4]. Specifically, the aim is to easily monitor the status of Galician hydrographic basins and detect alterations, such as new constructions, felling of trees, or eucalyptus plantations and crops that could have been planted illegally. Specifically, two sub-objectives are considered:
- Detection of natural or artificial obstacles in its proximity that may modify the river bed and constructions (roads, paths, and other constructions) that may damage the ecosystem;
- Characterization of the areas covered by vegetation, in particular distinguishing between native and invasive tree species.
The identification will be carried out over five-band multispectral (RGB, red-edge, and infrared) images obtained by a UAV. The spectral characteristics of the different elements as captured by this sensor are shown in Figure 8. Specifically, the following 10 classes are considered:
- Natural elements: water, bare soil, and rocks;
- Artificial elements: asphalt, concrete, and tiles;
- Vegetation types: meadows, native trees, pines, and eucalyptus.
This class selection was made taking into account the elements present in the hydrographic basins of Galicia, as well as those that are of interest for watershed management. For example, the class “soil”, in addition to identifying rural roads, can be used to detect deforestation. In Galicia, houses usually have roofs covered with reddish tiles or made of fiber cement. The class “concrete” is used to detect this second type of roof, as well as the rest of the constructions, which are usually made of concrete. The class “asphalt” represents the roads. Regarding the types of vegetation, four classes have been selected in order to distinguish the native species from the invasive ones.
Since the multispectral signatures for the different vegetation types are very similar, the proposed method is based on the extraction of texture information from the images. Moreover, native trees have similar canopies and, hence, similar texture features, which are however different from the canopies of pines and eucalyptus. Therefore, the use of texture methods allows us to distinguish native trees from pines and eucalyptus. Fast algorithms have been selected for classifying large areas of land.
2.3. Classification Chain
The proposed classification process for monitoring riparian areas in Galicia is shown in Figure 9. It is a supervised classification procedure that requires training from samples (pixels) in which the type of material or vegetation is known. The output is a color classification map that assigns to each pixel a class label from the 10 available. The proposed classification chain includes four modules: superpixel computation, texture codebook generation, texture feature encoding, and classification.
2.3.1. Superpixel Computation
Superpixel algorithms divide the image into approximately similarly sized segments, whose shape is adapted to the characteristics of the image. In this way, sets of pixels of uniform content called superpixels are obtained. The shape regularity of the superpixels or their adaptation to the structures of the image can be adjusted usually by means of a parameter. Superpixels can be used both as an initial simplification stage in classification operations and for the detection of objects and structures. Different superpixel algorithms have been proposed, such as ETPS, seeds, ERS, QS, LSC, etc. [31]. Algorithms for generating superpixels can be broadly categorized as either graph-based or gradient ascent methods.
Graph-based algorithms tend to be slower than those of the second category (complexity ) or higher, where N is the number of pixels of the image), and frequently they do not offer an explicit control over the number of superpixels or their compactness [32]. Regarding the gradient ascent algorithms, SLIC [32] and waterpixels [33] are among the fastest ones. In both algorithms all operations are local (limited to the neighborhood of the superpixel), consisting of the calculation of distances in the case of SLIC or comparisons and propagation of labels in the case of waterpixels. Despite their simplicity, SLIC and waterpixels adhere well to boundaries and allow easy control of segment size and compactness. Both algorithms will be considered for the proposed classification chain. Examples of the segmentation maps obtained are shown in Figure 10.
2.3.2. Texture Codebook Generation
The objective of this module is to generate a codebook with a set of basic elements or primitives (called textons) that can be used to represent any texture present in the images. The design principle is to obtain a compact and discriminative codebook that allows classifying the textures with precision [26]. To obtain the dictionary elements, techniques ranging from predefined to learned ones and convolutional neural networks (CNN) can be used. Examples of techniques with predefined codebooks are LBP, GLCM, filter-based methods, and keypoint feature extractors (SURF, SIFT). On the other hand, two fast and efficient algorithms for generating a learned codebook are kmeans clustering and Gaussian mixture modeling (GMM). Dictionary elements in kmeans are the cluster centers while GMM uses both mean centers and covariances to describe the spreads of the clusters. Additionally, GMM can capture overlapping distributions in the feature space. These two algorithms and CNNs will be considered for the proposed classification chain.
2.3.3. Texture Feature Encoding
Given the generated texture codebook and an image, feature encoding represents the image based on the codebook. It is a key component that decisively influences texture classification in terms of both accuracy and speed. Three efficient feature encoding methods that will be considered are bag of words (BoW), vector of locally aggregated descriptors (VLAD), and Fisher vectors (FV). BoW builds a histogram counting the number of local features assigned to each codeword and, therefore, encodes the zero order statistics of the distribution of local descriptors. VLAD accumulates the differences of local features assigned to each codeword. Finally, FV extends the BoW by encoding higher order statistics (first and second order), including information about the fitting error [26]. The differences among the different methods is shown in Figure 11. In the present study, the texture information will be used to distinguish the different elements present in each superpixel. In Figure 12, textures corresponding to oaks, pines, and eucalyptus are shown. They present observable differences in terms of their canopy structures.
2.3.4. Classification
Once the spatial or texture features have been obtained, the final operation is classification. Three supervised classification algorithms are widely used, since they are fast and provide good results: SVM, KELM, and random forest. In the proposed classification chain, the classification is performed at superpixel level, that is, each superpixel provides a single input sample to the classifier, which can be the average of the pixels in the segment or the texture feature. As reference values for the superpixels used in training, the class of the central pixel of each segment is taken. A hierarchical scheme of three classifiers is used, since the separation between plant species is especially complicated due to their very similar spectra and individual variability. First, a separation is made into two classes: plant species and the rest. A second classifier then separates the different plant classes from each other. Finally, a third classifier performs the separation of the different non-plant classes. This is shown in detail in the diagram of Figure 9.
2.4. Datasets
With the objective of monitoring the interaction of the masses of native vegetation with artificial structures and river beds, eight locations in Galicia were studied. They were selected based on the presence of native vegetation, eucalyptus, and pines. The native vegetation, that populates areas near the water streams due to its ability to survive under unstable water conditions, includes oaks, birches, alders, and willows. Different artificial structures are also present and are identified: rooftops covered by tiles, some concrete structures, asphalt roads, stone structures, and bare soil roads. These locations correspond to stretches of the rivers Oitaven, Xesta, Eiras, Ermidas, Ferreiras, Das Mestas, Mera, and Ulla, which are marked on the map of Figure 5.
The datasets were captured by the MicaSense RedEdge multispectral camera mounted on a custom UAV. This sensor provides the blue (475 nm), green (560 nm), red (668 nm), red-edge (717 nm), and NIR (840 nm) channels. The flights were conducted during the summer months of 2018, 2019, and 2020, on sunny days around noon and early afternoon in order to minimize shadows. Each flight captured data over long distances at a height of 120 m, with a spatial resolution of 10 cm/pixel. Each dataset was built as the orthomosaic of the frames captured by the UAV, each of which is of size pixels.
The usual registration, geometric and light corrections operations were carried out. Specifically, the radiometric calibration of the sensor was carried out using the calibration panel and the irradiance sensor available in the camera. Subsequently, the images were processed with the Pix4D software. The option that allows irradiance information to be included at the time of capture was selected for correction. This software was also used to create the flight plan, carry out geometric corrections and generate the orthomosaic. As an example, Figure 13 shows the route followed by the UAV over the Oitaven river. The left part of Figure 14 displays a color composition of the datasets obtained.
The construction of accurate reference data was a long-term process, involving forestry experts and the authors of the paper. Information from vegetation inventories, field visits, and the expertise of the forestry experts, along with the analysis of canopy textures, were the main elements considered in producing the reference data. The reference maps for the rivers Oitaven, Xesta, Eiras, Ermidas, Ferreiras, Das Mestas, Mera, and Ulla can be seen in the right part of Figure 14. The characteristics of the eight datasets are detailed in Table 1.
3. Results
This section contains information about the experimental conditions, parameter selection, and classification results obtained. The experiments were carried out on a low-end PC with a dual-core Intel Pentium G3220 at 3.00 GHz and 8 GB of RAM. The code was written in C and compiled using gcc under Ubuntu 20.04. CNN code was compiled in CUDA and executed on a NVidia GeForce GTX 1050 GPU with 2 GB of memory.
Classification results in terms of overall accuracy (OA), average accuracy (AA), and execution times are presented. In all experiments, 15% training superpixels are used, as shown in the fifth column of Table 1. For each of the superpixels used in training only one reference value is used. In the test stage, the classifier provides a class per superpixel, and this class is assigned to all the pixels of the superpixel. Those pixels used during training are excluded in the accuracy calculation. The proposed classification chain was run on the eight datasets, classifying superpixels of riparian tree crowns and artificial and natural elements into 10 classes.
3.1. Algorithm Comparison
The aim of the first set of experiments is to analyze how the different algorithms influence the classification accuracies and the execution times. Table 2 shows the results of the available alternatives for each module using the Oitaven dataset with 15% of training superpixels. The best accuracy results were obtained for the WP, GMM, FV, and KELM algorithms, which are considered the base chain. The rest of the measurements were taken substituting the indicated algorithm in the base chain.
For the superpixel computation module the algorithm that provides the best results in terms of classification accuracy is waterpixels followed by SLIC, both with similar execution times. In both cases, the algorithms have been configured to provide segments with a side length of 20 pixels. However, the sizes provided by the algorithms are approximate, since the assignment of pixels to superpixels depends on the structures of the image. Besides, the SLIC algorithm contains a disconnected region correction stage, while watershed tends to over-segment. To avoid these problems, both algorithms include a segment aggregation stage that requires the superpixels to contain a minimum of 100 pixels. In our experiments, the precision results provided by waterpixels were better than those of SLIC, due to the fact that, in the former, the segments effectively generated were closer to the requested size. Alternatively, other superpixel algorithms, such as ETPS, could be used in this module, but they have a higher computational complexity, which is a problem given the large size of the images used.
Regarding the texture codebook generation module, the best results were obtained by the GMM clustering algorithm, followed by kmeans. GMM builds the codebook from the pixel values using Gaussian distributions that take the mean and deviation as parameters, while in kmeans the codebook is generated, taking into account only the cluster centers. Therefore, kmeans only considers spherical clusters, while GMM can be adjusted to elliptic clusters. Another implication of its covariance structure is that GMM allows a point to belong to each cluster to a different degree, while in kmeans a point belongs to one and only one cluster. For the row “none” in the table, no codebook was generated, so for the characterization of the segments in the next module, the averages of the values of the segment pixels contained within a median absolute deviation (MAD) were used.
In any case, for the construction of the codebook, it is not necessary to use all the pixels of the dataset, which would take excessive computation time. It is enough to consider a representative set of pixels that captures the variation present in the dataset. For GMM a subset of 10,000 pixels was used, while for kmeans 100,000 pixels were necessary to obtain similar results. This is the reason why kmeans took a longer execution time than GMM. In general, the higher the number of clusters, the higher the classification precision, but the execution time also increases. In our case, 80 clusters were computed for both algorithms.
Regarding the texture feature encoding module, five algorithms were considered: MAD, BoW kmeans, BoW GMM, VLAD, and FV. The simplest algorithm is MAD, which calculates the average of the pixels within each superpixel. On the other hand, the algorithm that provided the best results was FV, followed by VLAD. On the contrary, the worst results were provided by the two versions of BoW. BoW counts the number of local features assigned to each codeword (zero order statistics of the distribution), while VLAD accumulates the differences of local features assigned to each codeword (first order statistics) and FV encodes the first and second order statistics. Encoding a larger amount of information increases the accuracy of the classification, but it also increases the execution time. Thus, the fastest algorithm is MAD, while the slowest algorithms are those based on GMM, that is, BoW GMM, and FV. None of these texture feature encoding algorithms require the setting of any relevant parameter.
Finally, for the classification module four algorithms were tested: SVM, KELM, random forest, and CNN. The best results were provided by KELM and SVM. These two classifiers are kernel-type algorithms that map the data to a larger feature space. In our experiments, an RBF kernel with and was used for both classifiers. On the other hand, the final classification accuracies obtained by random forest were slightly worse. For its part, CNN does not require the texture generation and encoding modules, but due to its computational requirements the execution was carried out on a GPU. In our case, the CNN is composed of a convolutional layer and two directly connected layers. For the convolutional layer, five filters of size , max-pooling of factor 2 and sigmoid activation function were used, while the directly connected hidden layer contains 100 neurons and sigmoid activation functions. The precision values obtained by the CNN were not remarkable since this type of algorithms require a fairly large training set to provide good results. Regarding the execution times, the best values were obtained by SVM followed by random forest.
3.2. Classification Performance
In the next experiments, the proposed classification chain was run on the eight datasets. Three types of algorithm chains were considered: faster algorithms, those with the best classification accuracies, and a deep-learning one. The fastest chain is made up of the SLIC + MAD + SVM algorithms, the chain with better accuracy is WP + FV + 3KELM (the notation refers to using a hierarchy of three classifiers, as shown in Figure 9, otherwise only one classifier is used), while the deep-learning chain consists of WP + CNN. Table 3 shows the classification accuracies and execution times obtained for each chain. In all experiments, 15% of training superpixels were used in each dataset. The average accuracies for the eight datasets were AA = 87.79 and OA = 66.68 for the fastest chain, AA = 92.65 and OA = 80.39 for the most accurate chain, and AA = 89.67 and OA = 73.45 for the CNN chain. The AA values obtained are lower than those of OA, because some classes contain a very small number of labeled segments, resulting in lower accuracy results. Regarding execution times, the average values were , , and s, for the corresponding three chains. It should be noted that the very long execution time of 2312 s obtained for the Mera dataset (the largest one) was due to the fact that the computer RAM was not enough for the execution of the program and the swap memory in the SSD unit had to be used.
Finally, Table 4 shows disaggregated data for three of the datasets with the best accuracy chain (WP + FV + 3KELM). It shows the accuracy results, as well as the number of superpixels used for each one of the 10 classes. In general, the accuracies obtained for all the classes are similar, except for those in which very few training superpixels are available. These small classes also make the AA values lower than the OA ones.
Once the classification maps are obtained, colors assigned to superpixels allow the identification of the different elements in the river basin. In our case, the objective is the detection of constructions (buildings, roads, paths, etc.) in the proximity of the river, as well as the characterization of the areas covered by vegetation, in particular distinguishing between native and invasive tree species. Some examples are illustrated in Figure 15, where the areas covered by artificial elements and the different types of vegetation are easily identifiable.
4. Discussion
Accurate regional-scale maps of wetlands and riparian areas are essential for targeting conservation and monitoring efforts. UAV technology provides a fast and cost-effective method for forest cover assessment and species classification [10,11]. It also allows detecting situations that threaten the ecosystem, such as altered flow regime, fish passage barriers, habitat loss, and non-native vegetation. For the processing of the captured images, depending on the conditions and requirements of the study, different methods and algorithms have been developed.
In some case studies, when high resolution images are available, the use of traditional indices, such as NDVI and others may be sufficient [12]. In other cases, the analysis of the spectral ranges can produce a subdivision in cover classes that allows distinguishing specific tree species [13]. If a classification at the pixel level is not enough, spectral-spatial techniques can be applied [34]. In other studies, the canopy height model, which provides an estimation of dendrometric and structural features of the vegetation can be useful [15,24].
The approach presented in this paper has the advantage of ease of implementation and low cost, since medium-sized UAVs and multispectral sensors can be used. The algorithms used have been selected for their favorable relationship between precision, computational resource consumption, and execution time. Given the type of sensor, the path followed by the UAV and the fact that the vegetation is dense and compact, which makes it difficult to delimit individual trees, it has not been possible to use the canopy height model. On the other hand, the spectral ranges of the different tree species are very similar and largely overlap. In small scenarios, these issues could be sufficiently compensated with very high resolution, but this is hardly applicable to large areas.
Taking these limitations into account, a classification based on textures has been used in this study. Although the canopy structure of the different native species (alders, willows, birches, oaks, etc.) is very similar, they are easily distinguishable from pines and eucalyptus. This facilitates the identification of the areas occupied by these invasive species. It was necessary to carry out field visits to identify the tree species and build the reference maps.
For the detection of objects and structures in images, different algorithms based on textures have been proposed in the literature. These range from the most basic ones that use very simple features [18] to the most advanced ones based on BoW, keypoints, or CNNs [25,26]. LBP and GLCM [35] are two simple methods for texture extraction that use information from the neighborhood of a pixel. They are also very fast methods, since they do not require the codebook generation stage. However, in these algorithms the extraction is carried out in predetermined locations, so they are only suitable for detecting objects whose textures have regular patterns. In our case, the vegetation contains very irregular texture patterns and the precision results obtained with these two methods have been low. More advanced methods for the extraction of information in the neighborhood of a pixel are based on the detection of keypoints and the construction of invariant descriptors, among which SURF and SIFT stand out [22]. However, the construction of the descriptors is a costly process which must be done in multiple positions within each superpixel. In this study we have evaluated several BoW-based methods, including VLAD and FV for the characterization of vegetation.
For the classification of an image using textures it is necessary to delimit regions on which the texture features are computed. This is usually done using patches, segments, or objects, often through multi-resolution techniques [15]. The procedure used in this study is based on the generation of superpixels. Among the many superpixel algorithms that have been proposed in the literature, we have evaluated SLIC and WP, which provide very good results with short computation times.
Another advantage of our method is that, due to the limited resources it requires, it should be applicable to larger areas than those considered in this work. As we have indicated, the selected superpixel algorithms require only local operations, so they are easily scalable. As for the texture codebook generation stage, it only requires a set of pixels that captures the variability of the dataset, so it displays a low dependence on the dataset size. The same happens with the training stage in the classification. Finally, texture feature encoding and testing stages can be performed independently for each of the superpixels.
The method could be adapted to other regions in which the monitoring of the interaction between the natural environment and human activities is required. Specifically, it would be applicable to the detection of invasive species, felling of trees, new constructions, or crops in other ecosystems. One of the advantages of the method is that it separates the detection of the vegetation from the rest of the natural and artificial elements present on the ground. In the case of the latter, their detection does not usually pose a problem, since they usually present quite different spectral signatures and textures. For the selection of the vegetation classes, the patterns of their textures should be taken into account so that their separation is feasible, considering the type of sensor and the spatial resolution used.
If the amount of computational resources is not a problem, it should be noted that some parameters could be adjusted to improve accuracy or speed, but not both at the same time. Among them are the number of centers in k-means and GMM, and the number of trees in random forest. Regarding the superpixel generation stage, other algorithms could be used. For example ETPS, which in many cases generates superpixels with better adhesion. For the texture stage, methods based on the detection of keypoints and the construction of descriptors could be considered. Finally, if powerful GPUs are available, deeper neural networks could also be used for texture extraction. Additionally, to increase precision, spatial processing algorithms could be included, such as extended morphological or attribute profiles [36], performing a fusion with the texture branch. However, these algorithms based on morphological operations or attributes greatly increase the processing time and the required storage space.
Since one of the limitations of this study is the low spectral resolution of the multispectral sensor, which limits the identification of vegetation species, the use of a hyperspectral sensor on board the UAV should improve the results. However, the use of hyperspectral imagery has the disadvantage of significantly increasing the size of the datasets, which for large areas of land implies huge storage spaces and longer execution times [37].
In relation to the detection of the river course in the images, it must be taken into account that often the vegetation in the riparian zones of Galicia completely hides the river when viewed from above. Additionally, in summer, some parts of the river dry up and leave rocks or bare soil uncovered. In such cases, the river channel appears fragmented. To solve this issue, algorithms for the repair of partial occlusions in topographic data could be added [38].
5. Conclusions
In this article a method based on UAVs and multispectral images for monitoring watershed areas in Galicia, Spain, was presented. It was designed with the specific aim of identifying areas occupied by invasive tree species, as well as detect man-made structures that occupy the river basin. Since the different species of vegetation have a very similar spectra, a procedure based on advanced texture methods was used.
The extraction of spatial information is carried out from the original image through segmentation based on superpixels and textures. Segmentation generates homogeneous segments or superpixels in the image. On the other hand, for each superpixel, its texture is characterized by a feature encoding algorithm based on the content of each segment. This information is used in a hierarchical classification structure to initially separate the artificial and natural structures from the plant species. Subsequently, the different types of structures and the different plant species are classified separately.
For the proposed classification chain, fast and efficient algorithms have been selected in order to process large areas of land. The output is a classification map where the areas covered by artificial elements and the different types of vegetation are easily identifiable. The experimental results over Galician riversides show that the proposed scheme is suitable for monitoring the natural environment in watershed ecosystems.
Author Contributions
Conceptualization, F.A. and D.B.H.; methodology, F.A., D.B.H., and P.Q.-B.; software, F.A. and P.Q.-B.; validation, F.A., D.B.H., A.S.G., and P.Q.-B.; investigation, F.A., D.B.H., A.S.G., and P.Q.-B.; data curation, A.S.G. and P.Q.-B.; writing, F.A. and D.B.H.; visualization, P.Q.-B.; supervision, F.A. and D.B.H. All authors have read and agreed to the published version of the manuscript.
Funding
This work was supported in part by the Civil Program UAVs Initiative, promoted by the Xunta de Galicia and developed in partnership with the Babcock company to promote the use of unmanned technologies in civil services. We also have to acknowledge the support by the Ministerio de Ciencia e Innovación, Government of Spain (grant number PID2019-104834GB-I00), and Consellería de Educación, Universidade e Formación Profesional (grant number ED431C 2018/19, and accreditation 2019–2022 ED431G-2019/04). All are co-funded by the European Regional Development Fund (ERDF).
Institutional Review Board Statement
Not applicable.
Informed Consent Statement
Not applicable.
Data Availability Statement
Restrictions apply to the availability of the data used in this study. Datasets are the property of Babcock International and are used with permission.
Acknowledgments
The authors would like to thank Aguas de Galicia from Xunta de Galicia for the support in the construction of the reference information for the multispectral images, in particular to Raquel Piñeiro and Mónica Velo.
Conflicts of Interest
The authors declare no conflict of interest. The funders had no role in the design of the study; in the collection, analyses or interpretation of data; in the writing of the manuscript, or in the decision to publish the results.
Abbreviations
The following abbreviations are used in this manuscript:
| AA | Average Accuracy |
| Acc | Accuracy |
| BoW | Bag of Words |
| CNN | Convolutional Neural Network |
| CUDA | Compute Unified Device Architecture |
| ERS | Entropy Rate Superpixels |
| ETPS | Extended Topology Preserving Segmentation |
| FV | Fisher Vectors |
| GLCM | Gray-Level Co-occurrence Matrix |
| GMM | Gaussian Mixture Modeling |
| GPU | Graphics Processing Unit |
| KELM | Kernel Extreme Learning Machine |
| LBP | Local Binary Pattern |
| LiDAR | Light Detection and Ranging |
| LSC | Linear Spectral Clustering |
| MAD | Median Absolute Deviation |
| NIR | Near InfraRed |
| NDVI | Normalized Difference Vegetation Index |
| OA | Overall Accuracy |
| QS | Quick Shift |
| RF | Random Forest |
| SIFT | Scale-Invariant Feature Transform |
| SLIC | Simple Linear Iterative Clustering |
| SP | SuperPixel |
| SSD | Solid-State Drive |
| SURF | Speeded Up Robust Features |
| SVM | Support Vector Machine |
| UAV | Unmanned Aerial Vehicle |
| VLAD | Vector of Locally Aggregated Descriptors |
| WP | WaterPixels |
References
- Sustainable Forest Management (SFM) Toolbox, Food and Agriculture Organization of the United Nations (FAO). Available online: http://www.fao.org/sustainable-forest-management/toolbox/modules/watershed-management/basic-knowledge/en/ (accessed on 13 May 2021).
- Watershed Conservation Resource Center. Available online: https://www.watershedconservation.org (accessed on 13 May 2021).
- Aguas de Galicia. Available online: https://augasdegalicia.xunta.gal (accessed on 13 May 2021). (In Spanish and Galician).
- Innovaugas 4.0, Gestión Avanzada de los Recursos Hídricos Gallegos. Available online: https://innovaugas.xunta.gal/ (accessed on 13 May 2021). (In Spanish).
- Story, P.A.; Forsyth, D.R. Watershed conservation and preservation: Environmental engagement as helping behavior. J. Environ. Psychol. 2008, 28, 305–317. [Google Scholar] [CrossRef]
- Heal, K. Watershed management in action. Lessons learned from fao field projects. Mt. Res. Dev. 2019, 39, M5–M6. Available online: http://www.fao.org/3/i8087en/i8087en.pdf (accessed on 27 June 2021). [CrossRef] [Green Version]
- Gibbons, P.; Freudenberger, D. An overview of methods used to assess vegetation condition at the scale of the site. Ecol. Manag. Restor. 2006, 7, S10–S17. [Google Scholar] [CrossRef]
- Ren, L.; Liu, Y.; Zhang, S.; Cheng, L.; Guo, Y.; Ding, A. Vegetation Properties in Human-Impacted Riparian Zones Based on Unmanned Aerial Vehicle (UAV) Imagery: An Analysis of River Reaches in the Yongding River Basin. Forests 2021, 12, 22. [Google Scholar] [CrossRef]
- Baena, S.; Moat, J.; Whaley, O.; Boyd, D.S. Identifying species from the air: UAVs and the very high resolution challenge for plant conservation. PLoS ONE 2017, 12, e0188714. [Google Scholar] [CrossRef] [Green Version]
- Torresan, C.; Berton, A.; Carotenuto, F.; Di Gennaro, S.F.; Gioli, B.; Matese, A.; Miglietta, F.; Vagnoli, C.; Zaldei, A.; Wallaceet, L. Forestry applications of UAVs in Europe: A review. Int. J. Remote Sens. 2017, 38, 2427–2447. [Google Scholar] [CrossRef]
- Berie, H.T.; Burud, I. Application of unmanned aerial vehicles in earth resources monitoring: Focus on evaluating potentials for forest monitoring in Ethiopia. Eur. J. Remote Sens. 2018, 51, 326–335. [Google Scholar] [CrossRef] [Green Version]
- Gini, R.; Passoni, D.; Pinto, L.; Sona, G. Use of unmanned aerial systems for multispectral survey and tree classification: A test in a park area of northern Italy. Eur. J. Remote Sens. 2014, 47, 251–269. [Google Scholar] [CrossRef]
- Durfee, N.; Ochoa, C.G.; Mata-Gonzalez, R. The use of low-altitude UAV imagery to assess western juniper density and canopy cover in treated and untreated stands. Forests 2019, 10, 296. [Google Scholar] [CrossRef] [Green Version]
- Akasheh, O.Z.; Neale, C.M.U.; Jayanthi, H. Detailed mapping of riparian vegetation in the middle Rio Grande River using high resolution multi-spectral airborne remote sensing. J. Arid Environ. 2008, 72, 1734–1744. [Google Scholar] [CrossRef]
- Michez, A.; Piégay, H.; Lisein, J.; Claessens, H.; Lejeune, P. Classification of riparian forest species and health condition using multi-temporal and hyperspatial imagery from unmanned aerial system. Environ. Monit. Assess 2016, 188, 146. [Google Scholar] [CrossRef] [Green Version]
- Macfarlane, W.M.; McGinty, C.M.; Laub, B.G.; Gifford, S.J. High-resolution riparian vegetation mapping to prioritize conservation and restoration in an impaired desert river. Restor. Ecol. 2017, 25.3, 333–341. [Google Scholar] [CrossRef]
- Humeau-Heurtier, A. Texture Feature Extraction Methods: A Survey. IEEE Access 2019, 7, 8975–9000. [Google Scholar] [CrossRef]
- Harris, D.; Vlok, J.; van Niekerk, A. Regional mapping of spekboom canopy cover using very high resolution aerial imagery. J. Appl. Remote Sens. 2018, 12, 046022. [Google Scholar] [CrossRef] [Green Version]
- Zhang, L.; Verma, B. Class-Semantic Textons with Superpixel Neighborhoods for Natural Roadside Vegetation Classification. In Proceedings of the International Conference on Digital Image Computing: Techniques and Applications (DICTA), Adelaide, Australia, 23–25 November 2015; IEEE: Los Alamitos, CA, USA, 2016; pp. 1–8. [Google Scholar]
- Yuan, X.; Tian, J.; Cerra, D.; Meynberg, O.; Kempf, C.; Reinartz, P. Tree Species Classification by Fusing of Very High-resolution Hyperspectral Images and 3K-DSM. In Proceedings of the 9th Workshop on Hyperspectral Image and Signal Processing: Evolution in Remote Sensing (WHISPERS), Amsterdam, The Netherlands, 23–26 September 2018; IEEE: Los Alamitos, CA, USA, 2018; pp. 1–5. [Google Scholar]
- Feng, Q.; Liu, J.; Gong, J. UAV remote sensing for urban vegetation mapping using random forest and texture analysis. Remote Sens. 2015, 7, 1074–1094. [Google Scholar] [CrossRef] [Green Version]
- Campos, Y.; Rodner, E.; Denzler, J.; Sossa, H.; Pajares, G. Vegetation segmentation in cornfield images using Bag of Words. In Advanced Concepts for Intelligent Vision Systems, Proceedings of the International Conference on Advanced Concepts for Intelligent Vision Systems, Lecce, Italy, 24–27 October 2016; Springer: Berlin/Heidelberg, Germany, 2016; pp. 193–204. [Google Scholar]
- Suh, H.K.; Hofstee, J.W.; IJsselmuiden, J.; van Henten, E.J. Sugar beet and volunteer potato classification using Bag-of-Visual-Words model, Scale-Invariant Feature Transform, or Speeded Up Robust Feature descriptors and crop row information. Biosyst. Eng. 2018, 166, 210–226. [Google Scholar] [CrossRef] [Green Version]
- Oldeland, J.; Große-Stoltenberg, A.; Naftal, L.; Strohbach, B.J. The potential of UAV derived image features for discriminating savannah tree species. In The Roles of Remote Sensing in Nature Conservation; Ricardo Díaz-Delgado, R., Lucas, R., Hurford, C., Eds.; Springer: Berlin/Heidelberg, Germany, 2017; pp. 183–201. [Google Scholar]
- Rey, S.R.; Blanco, D.B.; Argüello, F. Texture Extraction Techniques for the Classification of Vegetation Species in Hyperspectral Imagery: Bag of Words Approach Based on Superpixels. Remote Sens. 2020, 12, 2633. [Google Scholar]
- Liu, L.; Chen, J.; Fieguth, P.; Zhao, G.; Chellappa, R.; Pietikäinen, M. From BoW to CNN: Two decades of texture representation for texture classification. Int. J. Comput. Vis. 2019, 127, 74–109. [Google Scholar] [CrossRef] [Green Version]
- Kentsch, S.; Cabezas, M.; Tomhave, L.; Groß, J.; Burkhard, B.; Lopez Caceres, M.L.; Waki, K.; Diez, Y. Analysis of UAV-Acquired Wetland Orthomosaics Using GIS, Computer Vision, Computational Topology and Deep Learning. Sensors 2021, 2, 471. [Google Scholar] [CrossRef]
- Bascoy, P.G.; Garea, A.S.; Heras, D.B.; Argüello, F.; Ordóñez, A. Texture-based analysis of hydrographical basins with multispectral imagery. In Proceedings of the Remote Sensing for Agriculture, Ecosystems, and Hydrology XXI, Strasbourg, France, 9–12 September 2019. [Google Scholar]
- Freire Boado, M.Á.; Guitián Rivera, L. Caracterización de la vegetación en los ambientes ribereños del curso medio del río Ulla. Xeogr. Rev. Xeogr. Territ. Medio Ambiente 2005, 5, 61–83. (In Spanish) [Google Scholar]
- La vegetación en los Bosques de Rivera Gallegos. Available online: https://www.parqueforestaldesantiago.org/es/bosques-de-ribera/la-vegetacion-de-ribeira-en-galicia/ (accessed on 13 May 2021). (In Spanish).
- Stutz, D.; Hermans, A.; Leibe, B. Superpixels: An evaluation of the state-of-the-art. Comput. Vis. Image Underst. 2018, 166, 1–27. [Google Scholar] [CrossRef] [Green Version]
- Achanta, R.; Shaji, A.; Smith, K.; Lucchi, A.; Fua, P.; Süsstrunk, S. SLIC superpixels compared to state-of-the-art superpixel methods. IEEE Trans. Pattern Anal. Mach. Intell. 2012, 34, 2274–2282. [Google Scholar] [CrossRef] [PubMed] [Green Version]
- Machairas, V.; Faessel, M.; Cárdenas-Peña, D.; Chabardes, T.; Walter, T.; Decencière, E. Waterpixels. IEEE Trans. Image Process. 2015, 24, 3707–3716. [Google Scholar] [CrossRef] [Green Version]
- Cheng, K.; Wang, J. Forest type classification based on integrated spectral-spatial-temporal features and random forest algorithm—A case study in the qinling mountains. Forests 2019, 10, 559. [Google Scholar] [CrossRef]
- Kwak, G.-H.; Park, N.-W. Impact of texture information on crop classification with machine learning and UAV images. Appl. Sci. 2019, 9, 643. [Google Scholar] [CrossRef] [Green Version]
- Dalla Mura, M.; Benediktsson, J.A.; Waske, B.; Bruzzone, L. Extended profiles with morphological attribute filters for the analysis of hyperspectral data. Int. J. Remote Sens. 2010, 31, 5975–5991. [Google Scholar] [CrossRef]
- Govender, M.; Chetty, K.; Naiken, V.; Bulcock, H. A comparison of satellite hyperspectral and multispectral remote sensing imagery for improved classification and mapping of vegetation. Water SA 2008, 34, 147–154. [Google Scholar] [CrossRef] [Green Version]
- O’Donoghue, D.; Loughlin, A. Using Context to Repair Partial Occlusions in Topographic Data. In Proceedings of the Geographical Information Science Research Conference UK (GISRUK), Norwich, UK, 28–30 April 2004; Norwich University: Norwich, UK, 2014; pp. 15–18. [Google Scholar]
Figure 1.
Photographs of rivers and riparian vegetation in Galicia, Spain, taken in spring 2021.

Figure 2.
Although transformed by human activity, many riparian areas conserve a part of their wild animals: great tit (Parus major), European robin (Erithacus rubecula), whinchat (Saxicola rubetra), and common blackbird (Turdus merula) (Santiago de Compostela, Spain).
Figure 2.
Although transformed by human activity, many riparian areas conserve a part of their wild animals: great tit (Parus major), European robin (Erithacus rubecula), whinchat (Saxicola rubetra), and common blackbird (Turdus merula) (Santiago de Compostela, Spain).

Figure 3.
Threats to riparian zones include obstacles in the course of the river, pollution, deforestation, and eucalyptus plantations (Santiago de Compostela, Spain).
Figure 3.
Threats to riparian zones include obstacles in the course of the river, pollution, deforestation, and eucalyptus plantations (Santiago de Compostela, Spain).

Figure 4.
A UAV like the one used in this study.

Figure 5.
Map of the main rivers of Galicia, Spain, showing the areas studied in this work (data from https://sig.mapama.gob.es/id_tax/ (accessed on 13 May 2021)).
Figure 5.
Map of the main rivers of Galicia, Spain, showing the areas studied in this work (data from https://sig.mapama.gob.es/id_tax/ (accessed on 13 May 2021)).

Figure 6.
Cross section of a river basin showing riparian vegetation in Galicia.

Figure 7.
Tree species present in the riparian zones of Galicia. Top: alder (Alnus glutinosa), large gray willow (Salix atrocinerea), silver birch (Betula pendula), and white maple (Acer pseudoplatanus). Bottom: common oak (Quercus robur), elm (Ulmus minor), and the invasive species maritime pine (Pinus pinaster) and Eucalyptus globulus.

Figure 8.
Five-band multispectral characteristics of the elements considered in this study. Top: Average spectrum of the non-vegetation and vegetation classes. Bottom: Mean value, standard deviation, and spectrum range of two specific classes, native trees and pines.
Figure 8.
Five-band multispectral characteristics of the elements considered in this study. Top: Average spectrum of the non-vegetation and vegetation classes. Bottom: Mean value, standard deviation, and spectrum range of two specific classes, native trees and pines.

Figure 9.
Diagram of the classification chain used in this study.

Figure 10.
Examples of superpixel computation with segments of an approximate length of 20 pixels using SLIC and waterpixels segmentation algorithms.
Figure 10.
Examples of superpixel computation with segments of an approximate length of 20 pixels using SLIC and waterpixels segmentation algorithms.

Figure 11.
Comparison of three texture feature encoding methods: BoW counts the number of local features assigned to each codeword (zero order statistics of the distribution), VLAD computes the mean of feature vectors assigned to each codeword (first order statistic), while FV encodes first and second order statistics.

Figure 12.
Examples of texture codebook generation. Top: oak, eucalyptus, and pine canopies, and mean of their spectral signatures. Middle: clusterization and spectral signatures of the centers using kmeans with eight classes. Bottom: clusterization and spectral signatures of the centers using GMM with eight classes.

Figure 13.
Fight plan for the Oitaven river. The path followed by the UAV is shown with a solid red line and the position of the frames captured by the UAV with red markers. The control points were placed roughly at the corners of the planned route before the flight.
Figure 13.
Fight plan for the Oitaven river. The path followed by the UAV is shown with a solid red line and the position of the frames captured by the UAV with red markers. The control points were placed roughly at the corners of the planned route before the flight.

Figure 14.
Multispectral datasets (color composite and reference data) used in this study: Oitaven, Xesta, Eiras, Ermidas, Ferreiras, Das Mestas, Mera, and Ulla rivers.
Figure 14.
Multispectral datasets (color composite and reference data) used in this study: Oitaven, Xesta, Eiras, Ermidas, Ferreiras, Das Mestas, Mera, and Ulla rivers.

Figure 15.
Classification results for the Oitaven and Ermidas datasets, where artificial elements and areas covered by invasive tree species are easily identifiable.
Figure 15.
Classification results for the Oitaven and Ermidas datasets, where artificial elements and areas covered by invasive tree species are easily identifiable.


Table 1.
Datasets used in this study. The column “Pixels” indicates the number of data values in the dataset, while the column “Superpixels” indicates the number of superpixels containing data values, those that are available in the reference data, and those used for training.
Table 1.
Datasets used in this study. The column “Pixels” indicates the number of data values in the dataset, while the column “Superpixels” indicates the number of superpixels containing data values, those that are available in the reference data, and those used for training.
| Dataset | Location | Size | Pixels | Superpixels |
|---|---|---|---|---|
| Oitaven | 422215.48N 82547.07W | 6722 × 6689 (760 × 760 m) | 22.04 M | 78,383/21,650/3242 |
| Xesta | 422334.95N 82121.23W | 17,202 × 3848 (1945 × 435 m) | 40.00 M | 149,727/61,394/9207 |
| Eiras | 422045.26N 83010.81W | 18,221 × 5176 (2260 × 660 m) | 38.35 M | 142,110/15,435/2309 |
| Ermidas | 422248.43N 82453.36W | 18,972 × 11,924 (2190 × 1390 m) | 65.56 M | 248,742/23,188/3474 |
| Ferreiras | 433246.96N 75716.66W | 9219 × 9335 (740 × 750 m) | 40.19 M | 156,331/54,564/8181 |
| Das Mestas | 433830.24N 75844.08W | 9040 × 4915 (920 × 510 m) | 27.17 M | 107,979/39,229/5882 |
| Mera | 433431.15N 75234.81W | 22,116 × 10,718 (2770 × 1370 m) | 99.24 M | 397,799/59,989/8995 |
| Ulla | 424914.32N 7545.29W | 16,555 × 4220 (1420 × 380 m) | 46.01 M | 197,094/1461/217 |
Table 2.
Classification accuracies and execution times obtained by the different algorithm alternatives for each module. The Oitaven dataset and 15% training superpixels were used in the experiments. Execution times are indicated in seconds (the time with an asterisk indicates that the corresponding algorithm was run on a GPU).
| Module | Algorithm | OA | AA | t |
|---|---|---|---|---|
| Superpixel | SLIC | 91.75 | 83.56 | 26 |
| WP | 93.03 | 87.18 | 28 | |
| Texture | None | 82.71 | 71.86 | 0 |
| Codebook | kmeans | 91.81 | 84.72 | 30 |
| Generation | GMM | 93.03 | 87.18 | 7 |
| MAD | 82.71 | 71.86 | 2 | |
| Texture | BoW kmeans | 82.39 | 72.16 | 15 |
| Feature | BoW GMM | 80.12 | 62.99 | 50 |
| Encoding | VLAD | 91.81 | 84.72 | 18 |
| FV | 93.03 | 87.18 | 73 | |
| SVM | 92.51 | 86.00 | 45 | |
| Classifier | KELM | 93.03 | 87.18 | 92 |
| RF | 86.48 | 75.62 | 55 | |
| CNN | 88.93 | 80.08 | 179 * |
Table 3.
Classification accuracies and execution times obtained by three algorithm chains: fast (SLIC + MAD + SVM), high accuracy (WP + FV + 3KELM), and deep-learning (WP + CNN). Results are for 15% of training superpixels and execution times displayed in seconds (t* indicates that the CNN was run on a GPU).
| SLIC + MAD + SVM | WP + FV + 3KELM | WP + CNN | |||||||
|---|---|---|---|---|---|---|---|---|---|
| Dataset | OA | AA | t | OA | AA | t | OA | AA | t* |
| Oitaven | 83.80 | 70.34 | 34 | 93.03 | 87.18 | 217 | 88.93 | 80.08 | 224 |
| Xesta | 91.89 | 65.44 | 59 | 96.18 | 81.88 | 701 | 94.47 | 73.17 | 573 |
| Eiras | 89.82 | 60.33 | 74 | 94.45 | 77.58 | 330 | 91.45 | 62.84 | 236 |
| Ermidas | 87.16 | 66.53 | 562 | 94.76 | 87.42 | 981 | 92.11 | 82.27 | 635 |
| Ferreiras | 86.78 | 65.11 | 80 | 90.27 | 74.69 | 705 | 86.53 | 68.75 | 541 |
| Das Mestas | 87.28 | 71.16 | 41 | 89.27 | 82.35 | 381 | 86.06 | 75.39 | 378 |
| Mera | 81.64 | 51.65 | 673 | 87.65 | 63.98 | 2312 | 82.19 | 54.97 | 1185 |
| Ulla | 93.94 | 82.85 | 68 | 95.56 | 88.04 | 250 | 95.61 | 90.10 | 103 |
| Average | 87.79 | 66.68 | 199 | 92.65 | 80.39 | 735 | 89.67 | 73.45 | 484 |
Table 4.
Disaggregated data for the Oitaven, Eiras and Ermidas datasets using the WP+FV+3KELM chain and 15% of training superpixels. For each class, the number of superpixels with reference data, the superpixels used for training, and the accuracies obtained are indicated.
Table 4.
Disaggregated data for the Oitaven, Eiras and Ermidas datasets using the WP+FV+3KELM chain and 15% of training superpixels. For each class, the number of superpixels with reference data, the superpixels used for training, and the accuracies obtained are indicated.
| Oitaven | Eiras | Ermidas | |||||||
|---|---|---|---|---|---|---|---|---|---|
| Class | SP | Train | Acc. | SP | Train | Acc. | SP | Train | Acc. |
| 1-Water | 912 | 136 | 96.62 | 1929 | 289 | 98.57 | 447 | 67 | 84.25 |
| 2-Bare soil | 484 | 72 | 78.41 | 424 | 63 | 71.71 | 472 | 70 | 80.77 |
| 3-Rock | 349 | 52 | 75.46 | 726 | 108 | 88.54 | 747 | 112 | 79.44 |
| 4-Asphalt | 128 | 19 | 85.53 | 233 | 34 | 89.92 | 2418 | 362 | 94.78 |
| 5-Concrete | 458 | 68 | 77.85 | 111 | 16 | 64.22 | 95 | 14 | 73.55 |
| 6-Tiles | 294 | 44 | 83.03 | 29 | 4 | 63.25 | 453 | 67 | 95.24 |
| 7-Meadows | 6898 | 1034 | 95.18 | 2989 | 448 | 90.98 | 10413 | 1561 | 98.22 |
| 8-Native trees | 7573 | 1135 | 94.65 | 8604 | 1290 | 97.96 | 3154 | 473 | 93.59 |
| 9-Pines | 955 | 143 | 96.48 | 351 | 52 | 65.05 | 800 | 120 | 81.00 |
| 10-Eucalyptus | 3599 | 539 | 88.58 | 39 | 5 | 45.55 | 4189 | 628 | 93.34 |
| OA = 93.03, AA = 87.18 | OA = 94.45, AA = 77.58 | OA = 94.76, AA = 87.42 | |||||||
Publisher’s Note: MDPI stays neutral with regard to jurisdictional claims in published maps and institutional affiliations. |
© 2021 by the authors. Licensee MDPI, Basel, Switzerland. This article is an open access article distributed under the terms and conditions of the Creative Commons Attribution (CC BY) license (https://creativecommons.org/licenses/by/4.0/).
Share and Cite
MDPI and ACS Style
Argüello, F.; Heras, D.B.; Garea, A.S.; Quesada-Barriuso, P. Watershed Monitoring in Galicia from UAV Multispectral Imagery Using Advanced Texture Methods. Remote Sens. 2021, 13, 2687. https://0-doi-org.brum.beds.ac.uk/10.3390/rs13142687
AMA Style
Argüello F, Heras DB, Garea AS, Quesada-Barriuso P. Watershed Monitoring in Galicia from UAV Multispectral Imagery Using Advanced Texture Methods. Remote Sensing. 2021; 13(14):2687. https://0-doi-org.brum.beds.ac.uk/10.3390/rs13142687
Chicago/Turabian StyleArgüello, Francisco, Dora B. Heras, Alberto S. Garea, and Pablo Quesada-Barriuso. 2021. "Watershed Monitoring in Galicia from UAV Multispectral Imagery Using Advanced Texture Methods" Remote Sensing 13, no. 14: 2687. https://0-doi-org.brum.beds.ac.uk/10.3390/rs13142687
Note that from the first issue of 2016, this journal uses article numbers instead of page numbers. See further details here.