
Development of a Flash Flood Confidence Index from Disaster Reports and Geophysical Susceptibility

 , , and
Abstract
:1. Introduction
1.1. Historical Data for Disaster Events
1.2. Flash Flood as a Disaster Subtype
1.3. An Index for Flood Type Classification
2. Materials and Methods
2.1. Step 1—Identification and Compilation of Historical Data
2.1.1. Text-Based Data
2.1.2. Geophysical Data
2.2. Step 2—Development of a Flash Flood Confidence Index (FFCI)
2.3. Step 3—Enhancement of the Index Using Location and Geophysical Susceptibility Data
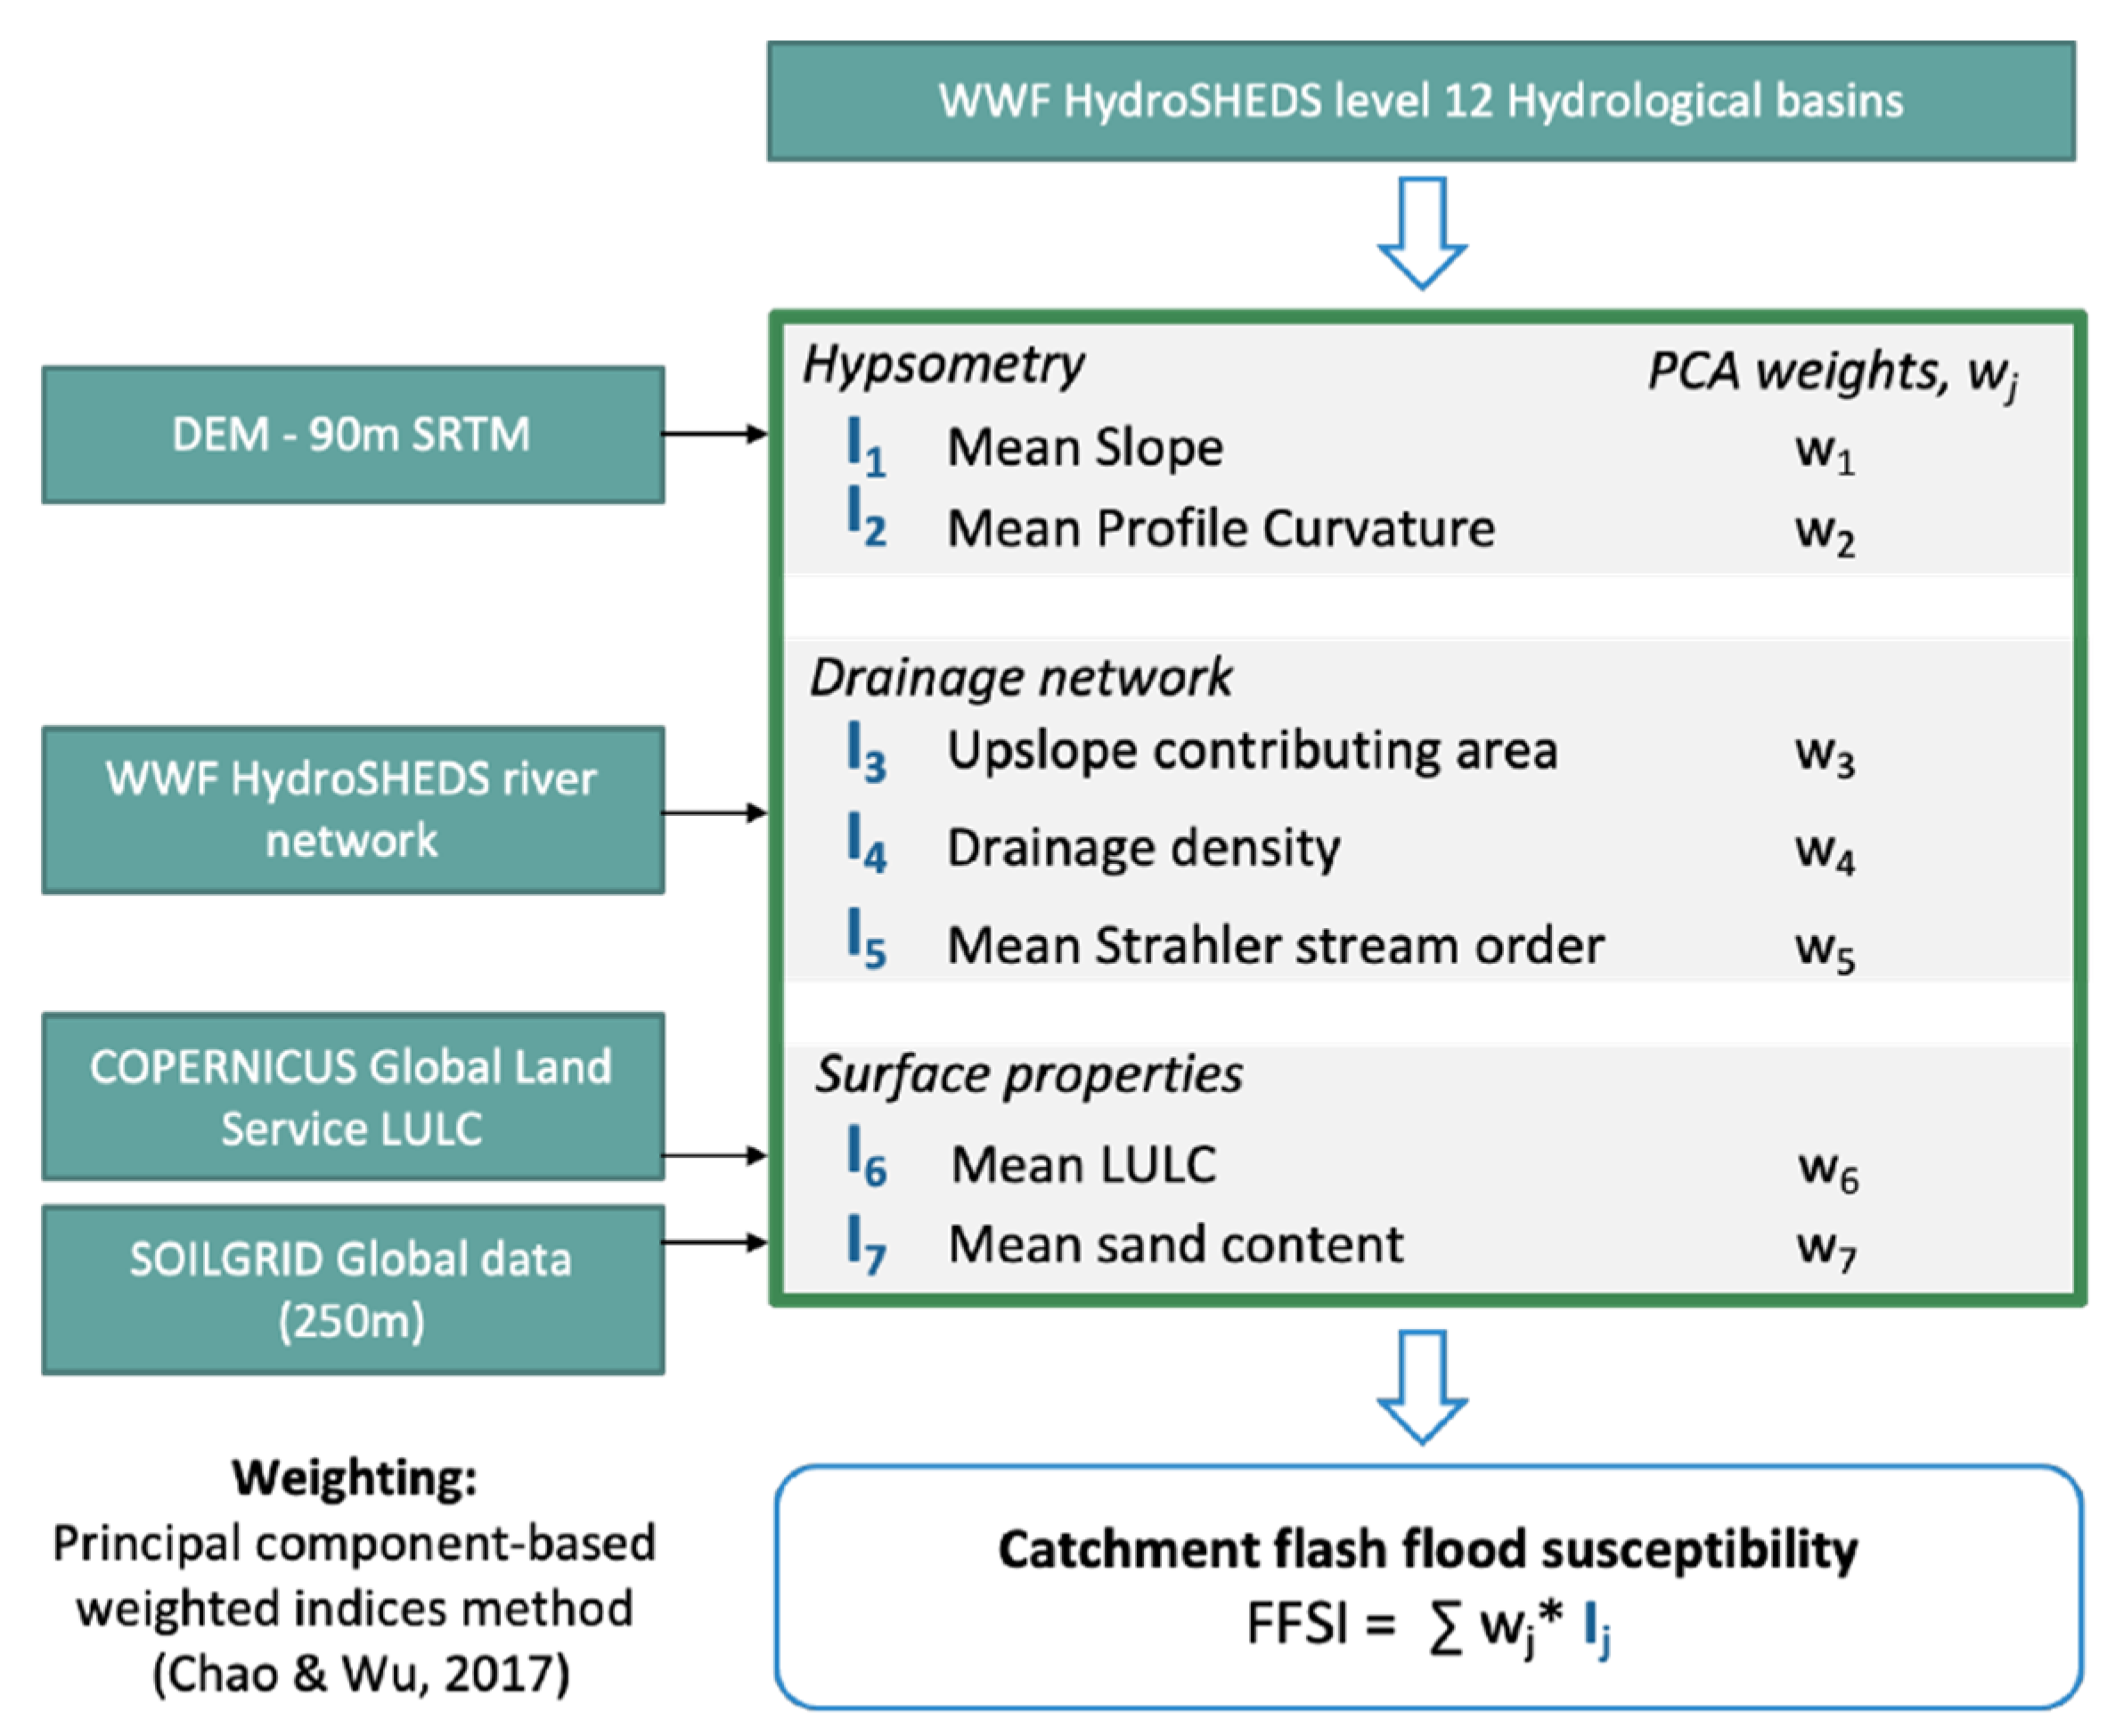
2.3.1. Flash-Food Susceptibility Index (FFSI) Development
2.3.2. Enhanced FFCI (eFFCI): FFCI Coupled with FFSI
3. Results
3.1. Building an Historical Dataset for Ecuador
3.2. Application of Flash Flood Confidence Index (FFCI) for Ecuador
3.3. Application of Enhanced FFCI (eFFCI) for Ecuador
3.3.1. FFSI
3.3.2. eFFCI
4. Discussion
4.1. Interpretation of the FFCI
4.2. Benefit of FFCI
4.3. Limitations
4.4. Recommendations
5. Conclusions
Author Contributions
Funding
Data Availability Statement
Acknowledgments
Conflicts of Interest
Appendix A

| Copernicus LULC Discrete Classes | Classification (Values Increase with Increased Flash Flood Susceptibility) |
|---|---|
| Closed forest | 1 |
| Open forest | 2 |
| Snow and ice | 3 |
| Shrubs | 3 |
| Moss and lichen | 3 |
| Herbaceous wetland | 4 |
| Herbaceous vegetation | 5 |
| CroplandCropland | 6 |
| Bare/sparse vegetation | 7 |
| Urban/Built-up | 8 |
References
- Field, C.B.; Barros, V.; Stocker, T.F.; Dahe, Q. Managing the Risks of Extreme Events and Disasters to Advance Climate Change Adaptation: Special Report of the Intergovernmental Panel on Climate Change (IPCC); Cambridge University Press: Cambridge, UK, 2012; ISBN 9781107025066. [Google Scholar]
- Hoeppe, P. Trends in Weather Related Disasters—Consequences for Insurers and Society. Weather Clim. Extrem. 2015, 11, 70–79. [Google Scholar] [CrossRef] [Green Version]
- Opolot, E. Application of Remote Sensing and Geographical Information Systems in Flood Management: A Review. Res. J. Appl. Sci. Eng. Technol. 2013, 6, 1884–1894. [Google Scholar] [CrossRef]
- WMO. Flash Flood Guidance System (FFGS); WMO: Geneva, Switzerland, 2016; pp. 1–4. [Google Scholar]
- Nielsen, M.; Greatrex, H.; Kruczkiewicz, A. A Systematic Review of Flash Flood Risk, Vulnerability and Impact. In Proceedings of the 100th American Meteorological Society Annual Meeting, Boston, MA, USA, 16 January 2020. [Google Scholar]
- Calianno, M.; Ruin, I.; Gourley, J.J. Supplementing Flash Flood Reports with Impact Classifications. J. Hydrol. 2013, 477, 1–16. [Google Scholar] [CrossRef]
- Archer, D.R.; Fowler, H.J. Characterising Flash Flood Response to Intense Rainfall and Impacts Using Historical Information and Gauged Data in Britain. J. Flood Risk Manag. 2018, 11, S121–S133. [Google Scholar] [CrossRef]
- Archer, D.; O’Donnell, G.; Lamb, R.; Warren, S.; Fowler, H.J. Historical Flash Floods in England: New Regional Chronologies and Database. J. Flood Risk Manag. 2019, 12, 1–14. [Google Scholar] [CrossRef]
- Kordopatis-Zilos, G.; Papadopoulos, S.; Kompatsiaris, Y. Geotagging Social Media Content with a Refined Language Modelling Approach. In Proceedings of the Pacific-Asia Workshop on Intelligence and Security Informatics; Springer: Berlin/Heidelberg, Germany, 2015; pp. 21–40. [Google Scholar]
- De Bruijn, J.; de Moel, H.; Jongman, B.; Wagemaker, J.; Aerts, J.C.J.H. TAGGS: Grouping Tweets to Improve Global Geotagging for Disaster Response. Nat. Hazards Earth Syst. Sci. Discuss. 2017, 1–22. [Google Scholar] [CrossRef]
- Rosser, J.F.; Leibovici, D.G.; Jackson, M.J. Rapid Flood Inundation Mapping Using Social Media, Remote Sensing and Topographic Data. Nat. Hazards 2017, 87, 103–120. [Google Scholar] [CrossRef] [Green Version]
- Ogie, R.I.; Clarke, R.J.; Forehead, H.; Perez, P. Crowdsourced Social Media Data for Disaster Management: Lessons from the PetaJakarta.Org Project. Comput. Environ. Urban Syst. 2019, 73, 108–117. [Google Scholar] [CrossRef]
- Jackson, M.; Mcinerney, B.; Smith, G. The Flash Flood Monitoring and Prediction (FFMP) Program. 2005. Available online: https://www.nws.noaa.gov/mdl/ffmp/ffmp99AMS.htm (accessed on 15 June 2021).
- Kruczkiewicz, A.; McClain, S.; Bell, V.; Warrick, O.; Bazo, J.; Mason, J.; Vergara, H.; Horna, N. Earth Observations for Anticipatory Action: Case Studies in Hydrometeorological Hazards. In Earth Observation for Flood Applications; Elsevier: Amsterdam, The Netherlands, 2021; pp. 237–253. [Google Scholar]
- Galbusera, L.; Giannopoulos, G. On Input-Output Economic Models in Disaster Impact Assessment. Int. J. Disaster Risk Reduct. 2018, 30, 186–198. [Google Scholar] [CrossRef]
- Henstra, D.; Minano, A.; Thistlethwaite, J. Communicating Disaster Risk? An Evaluation of the Availability and Quality of Flood Maps. Nat. Hazards Earth Syst. Sci. 2019, 19, 313–323. [Google Scholar] [CrossRef] [Green Version]
- Orimoloye, I.R.; Ekundayo, T.C.; Ololade, O.O.; Belle, J.A. Systematic Mapping of Disaster Risk Management Research and the Role of Innovative Technology. Environ. Sci. Pollut. Res. 2020, 2011. [Google Scholar] [CrossRef]
- Schreider, S.Y.; Smith, D.I.; Jakeman, A.J. Climate Change Impacts on Urban Flooding. Clim. Chang. 2000, 47, 91–115. [Google Scholar] [CrossRef]
- Ranger, N.; Hallegatte, S.; Bhattacharya, S.; Bachu, M.; Priya, S.; Dhore, K.; Rafique, F.; Mathur, P.; Naville, N.; Henriet, F.; et al. An Assessment of the Potential Impact of Climate Change on Flood Risk in Mumbai. Clim. Chang. 2011, 104, 139–167. [Google Scholar] [CrossRef] [Green Version]
- Zhang, Y.; Wang, Y.; Chen, Y.; Liang, F.; Liu, H. Assessment of Future Flash Flood Inundations in Coastal Regions under Climate Change Scenarios—A Case Study of Hadahe River Basin in Northeastern China. Sci. Total Environ. 2019, 693, 133550. [Google Scholar] [CrossRef]
- Gallagher, J. American Economic Association Learning about an Infrequent Event: Evidence from Flood Insurance Take-Up in the United States. Am. Econ. J. Appl. Econ. 2014, 6, 206–233. [Google Scholar] [CrossRef] [Green Version]
- Bakkensen, L.A.; Shi, X.; Zurita, B.D. The Impact of Disaster Data on Estimating Damage Determinants and Climate Costs. Econ. Disasters Clim. Chang. 2018, 2, 49–71. [Google Scholar] [CrossRef]
- Barabadi, A.; Ayele, Y.Z. Post-Disaster Infrastructure Recovery: Prediction of Recovery Rate Using Historical Data. Reliab. Eng. Syst. Saf. 2018, 169, 209–223. [Google Scholar] [CrossRef]
- Van Westen, C. Remote Sensing for Natural Disaster Management. Int. Arch. Photogramm. Remote Sens. Spat. Inf. Sci. ISPRS Arch. 2000, 33, 1609–1617. [Google Scholar]
- Eguchi, R.T.; Huyck, C.K.; Ghosh, S.; Adams, B.J. The Application of Remote Sensing Technologies for Disaster Management. In Proceedings of the 14th World Conference on Earthquake Engineering, Beijing, China, 12 October 2008. [Google Scholar]
- Joyce, K.E.; Belliss, S.E.; Samsonov, S.V.; McNeill, S.J.; Glassey, P.J. A Review of the Status of Satellite Remote Sensing and Image Processing Techniques for Mapping Natural Hazards and Disasters. Prog. Phys. Geogr. 2009, 33, 183–207. [Google Scholar] [CrossRef] [Green Version]
- Bucherie, A.; Ayala, F.; Kruczkiewicz, A. Ecuador Historical Flood Occurrences and Impacts Dataset with Flash Flood Confidence Index (2007–2020). Zenodo 2021. [Google Scholar] [CrossRef]
- Sanyal, J.; Lu, X.X. Application of Remote Sensing in Flood Management with Special Reference to Monsoon Asia: A Review. Nat. Hazards 2004, 33, 283–301. [Google Scholar] [CrossRef]
- Goddard, L.; Aitchellouche, Y.; Baethgen, W.; Dettinger, M.; Graham, R.; Hayman, P.; Kadi, M.; Martínez, R.; Meinke, H.; Conrad, E. Providing Seasonal-to-Interannual Climate Information for Risk Management and Decision-Making. Procedia Environ. Sci. 2010, 1, 81–101. [Google Scholar] [CrossRef] [Green Version]
- Riede, F. Towards a Science of Past Disasters. Nat. Hazards 2014, 71, 335–362. [Google Scholar] [CrossRef]
- Mason, S.J.; Kruckiewicz, A.; Ceccato, P.; Crawford, A. Accessing and Using Climate Data and Information in Fragile, Data-Poor States; Columbia University: New York, NY, USA, 2015. [Google Scholar]
- Norris, F.H. Disaster Research Methods: Past Progress and Future Directions. J. Trauma. Stress Off. Publ. Int. Soc. Trauma. Stress Stud. 2006, 19, 173–184. [Google Scholar] [CrossRef] [PubMed]
- Dilley, M. Setting Priorities: Global Patterns of Disaster Risk. Philos. Trans. R. Soc. A Math. Phys. Eng. Sci. 2006, 364, 2217–2229. [Google Scholar] [CrossRef]
- Malilay, J.; Heumann, M.; Perrotta, D.; Wolkin, A.F.; Schnall, A.H.; Podgornik, M.N.; Cruz, M.A.; Horney, J.A.; Zane, D.; Roisman, R.; et al. The Role of Applied Epidemiology Methods in the Disaster Management Cycle. Am. J. Public Health 2014, 104, 2092–2102. [Google Scholar] [CrossRef]
- Tschoegl, L.; Below, R.; Guha-Sapir, D. An Analytical Review of Selected Data Sets on Natural Disasters and Impacts UNDP/CRED Workshop on Improving Compilation of Reliable Data on Disaster Occurrence and Impact; Centre for Research on the Epidemiology of Disasters: Louvain, Belgium, 2006. [Google Scholar]
- Dolinskaya, I.S.; Shi, Z.E.; Smilowitz, K.R.; Ross, M. Decentralized Approaches to Logistics Coordination in Humanitarian Relief. In Proceedings of the IIE Annual Conference; Institute of Industrial and Systems Engineers (IISE): Peachtree Corners, GA, USA, 2011; p. 1. [Google Scholar]
- Panwar, V.; Sen, S. Disaster Damage Records of EM-DAT and DesInventar: A Systematic Comparison. Econ. Disasters Clim. Chang. 2020, 4, 295–317. [Google Scholar] [CrossRef]
- Pinos, J.; Orellana, D.; Timbe, L. Assessment of Microscale Economic Flood Losses in Urban and Agricultural Areas: Case Study of the Santa Bárbara River, Ecuador. Nat. Hazards 2020, 103, 2323–2337. [Google Scholar] [CrossRef]
- Pekel, J.-F.; Cottam, A.; Gorelick, N.; Belward, A.S. High-Resolution Mapping of Global Surface Water and Its Long-Term Changes. Nature 2016, 540, 418–422. [Google Scholar] [CrossRef]
- Skakun, S.; Kussul, N.; Shelestov, A.; Kussul, O. Flood Hazard and Flood Risk Assessment Using a Time Series of Satellite Images: A Case Study in Namibia. Risk Anal. 2014, 34, 1521–1537. [Google Scholar] [CrossRef] [PubMed]
- Brakenridge, G.R.; Syvitski, J.P.M.; Overeem, I.; Higgins, S.A.; Kettner, A.J.; Stewart-Moore, J.A.; Westerhoff, R. Global Mapping of Storm Surges and the Assessment of Coastal Vulnerability. Nat. Hazards 2013, 66, 1295–1312. [Google Scholar] [CrossRef]
- Nie, Y.; Liu, Q.; Wang, J.; Zhang, Y.; Sheng, Y.; Liu, S. An Inventory of Historical Glacial Lake Outburst Floods in the Himalayas Based on Remote Sensing Observations and Geomorphological Analysis. Geomorphology 2018, 308, 91–106. [Google Scholar] [CrossRef]
- Noy, I. Natural Disasters in the Pacific Island Countries: New Measurements of Impacts. Nat. Hazards 2016, 84, 7–18. [Google Scholar] [CrossRef]
- Ma, M.; He, B.; Wan, J.; Jia, P.; Guo, X.; Gao, L.; Maguire, L.W.; Hong, Y. Characterizing the Flash Flooding Risks from 2011 to 2016 over China. Water 2018, 10, 704. [Google Scholar] [CrossRef] [Green Version]
- Gourley, J.J.; Flamig, Z.L.; Vergara, H.; Kirstetter, P.E.; Clark, R.A.; Argyle, E.; Arthur, A.; Martinaitis, S.; Terti, G.; Erlingis, J.M.; et al. The Flash Project Improving the Tools for Flash Flood Monitoring and Prediction across the United States. Bull. Am. Meteorol. Soc. 2017, 98, 361–372. [Google Scholar] [CrossRef]
- Paprotny, D.; Morales-Nápoles, O.; Jonkman, S.N. HANZE: A Pan-European Database of Exposure to Natural Hazards and Damaging Historical Floods since 1870. Earth Syst. Sci. Data 2018, 10, 565–581. [Google Scholar] [CrossRef] [Green Version]
- Gourley, J.J.; Hong, Y.; Flamig, Z.L.; Arthur, A.; Clark, R.; Calianno, M.; Ruin, I.; Ortel, T.; Wieczorek, M.E.; Kirstetter, P.E.; et al. A Unified Flash Flood Database across the United States. Bull. Am. Meteorol. Soc. 2013, 94, 799–805. [Google Scholar] [CrossRef] [Green Version]
- Emmer, A.; Vilímek, V.; Huggel, C.; Klimeš, J.; Schaub, Y. Limits and Challenges to Compiling and Developing a Database of Glacial Lake Outburst Floods. Landslides 2016, 13, 1579–1584. [Google Scholar] [CrossRef]
- Haltas, I.; Yildirim, E.; Oztas, F.; Demir, I. A Comprehensive Flood Event Specification and Inventory: 1930–2020 Turkey Case Study. Int. J. Disaster Risk Reduct. 2020, 56, 102086. [Google Scholar] [CrossRef]
- Zêzere, J.L.; Pereira, S.; Tavares, A.O.; Bateira, C.; Trigo, R.M.; Quaresma, I.; Santos, P.P.; Santos, M.; Verde, J. DISASTER: A GIS Database on Hydro-Geomorphologic Disasters in Portugal. Nat. Hazards 2014, 72, 503–532. [Google Scholar] [CrossRef]
- Du, S.; Gu, H.; Wen, J.; Chen, K.; Van Rompaey, A. Detecting Flood Variations in Shanghai over 1949–2009 with Mann-Kendall Tests and a Newspaper-Based Database. Water 2015, 7, 1808–1824. [Google Scholar] [CrossRef] [Green Version]
- Panwar, V.; Sen, S. Economic Impact of Natural Disasters: An Empirical Re-Examination. Margin J. Appl. Econ. Res. 2019, 13, 109–139. [Google Scholar] [CrossRef]
- Stäubli, A.; Nussbaumer, S.U.; Allen, S.K.; Huggel, C.; Arguello, M.; Costa, F.; Hergarten, C.; Martínez, R.; Soto, J.; Vargas, R. Analysis of weather-and climate-related disasters in mountain regions using different disaster databases. In Climate Change, Extreme Events and Disaster Risk Reduction; Springer: Berlin/Heidelberg, Germany, 2018; pp. 17–41. [Google Scholar]
- Paprotny, D.; Kreibich, H.; Morales-Nápoles, O.; Wagenaar, D.; Castellarin, A.; Carisi, F.; Bertin, X.; Merz, B.; Schröter, K. A Probabilistic Approach to Estimating Residential Losses from Different Flood Types; Springer: Dordrecht, The Netherlands, 2021; Volume 105, ISBN 0123456789. [Google Scholar]
- Nauman, C.; Anderson, E.; de Perez, E.C.; Kruczkiewicz, A.; McClain, S.; Markert, A.; Griffin, R.; Suarez, P. Perspectives on Flood Forecast-Based Early Action and Opportunities for Earth Observations. J. Appl. Remote Sens. 2021, 15, 32002. [Google Scholar] [CrossRef]
- Adelekan, I.O. Vulnerability Assessment of an Urban Flood in Nigeria: Abeokuta Flood 2007. Nat. Hazards 2011, 56, 215–231. [Google Scholar] [CrossRef]
- Tingsanchali, T. Urban Flood Disaster Management. Procedia Eng. 2012, 32, 25–37. [Google Scholar] [CrossRef] [Green Version]
- Archer, D.R. Seasonality Of Flooding and the Assessment of Seasonal Flood Risk. In Proceedings of the Institution of Civil Engineers; Campbell, I.M., Ed.; Institution of Civil Engineers: London, UK, 1981; pp. 1023–1035. [Google Scholar]
- Brakenridge, G.R.; Anderson, E.; Nghiem, S.V.; Caquard, S.; Shabaneh, T. Flood Warnings, Flood Disaster Assessments, and Flood Hazard Reduction: The Roles of Orbital Remote Sensing. In Proceedings of the 30th International Symposium on Remote Sensing of Environment, Honolulu, HI, USA, 10–14 November 2003. [Google Scholar]
- Sankarasubramanian, A.; Lall, U. Flood Quantiles in a Changing Climate: Seasonal Forecasts and Causal Relations. Water Resour. Res. 2003, 39, 1–12. [Google Scholar] [CrossRef] [Green Version]
- Forster, S.; Kuhlmann, B.; Lindenschmidt, K.E.; Bronstert, A. Assessing Flood Risk for a Rural Detention Area. Nat. Hazards Earth Syst. Sci. 2008, 8, 311–322. [Google Scholar] [CrossRef]
- Vinet, F.; Lumbroso, D.; Defossez, S.; Boissier, L. A Comparative Analysis of the Loss of Life during Two Recent Floods in France: The Sea Surge Caused by the Storm Xynthia and the Flash Flood in Var. Nat. Hazards 2012, 61, 1179–1201. [Google Scholar] [CrossRef]
- Pekar, V.; Binner, J.; Najafi, H.; Hale, C.; Schmidt, V. Early Detection of Heterogeneous Disaster Events Using Social Media. J. Assoc. Inf. Sci. Technol. 2020, 71, 43–54. [Google Scholar] [CrossRef]
- Ashktorab, Z.; Brown, C.; Nandi, M.; Culotta, A. Tweedr: Mining Twitter to Inform Disaster Response. In Proceedings of the ISCRAM; Citeseer: Princeton, NJ, USA, 2014; pp. 269–272. [Google Scholar]
- To, H.; Agrawal, S.; Kim, S.H.; Shahabi, C. On Identifying Disaster-Related Tweets: Matching-Based or Learning-Based? In Proceedings of the 2017 IEEE Third International Conference on Multimedia Big Data (BigMM), Laguna Hills, CA, USA, 19–21 April 2017; pp. 330–337. [Google Scholar]
- Jongman, B.; Wagemaker, J.; Romero, B.R.; De Perez, E.C. Early Flood Detection for Rapid Humanitarian Response: Harnessing near Real-Time Satellite and Twitter Signals. ISPRS Int. J. Geo-Inf. 2015, 4, 2246–2266. [Google Scholar] [CrossRef] [Green Version]
- Rudra, K.; Ghosh, S.; Ganguly, N.; Goyal, P.; Ghosh, S. Extracting Situational Information from Microblogs during Disaster Events: A Classification-Summarization Approach. In Proceedings of the 24th ACM international on Conference on Information and Knowledge Management, Melbourne, Australia, 18–23 October 2015; pp. 583–592. [Google Scholar]
- Cervone, G.; Sava, E.; Huang, Q.; Schnebele, E.; Harrison, J.; Waters, N. Using Twitter for Tasking Remote-Sensing Data Collection and Damage Assessment: 2013 Boulder Flood Case Study. Int. J. Remote Sens. 2016, 37, 100–124. [Google Scholar] [CrossRef]
- Imran, M.; Ofli, F.; Caragea, D.; Torralba, A. Using AI and Social Media Multimodal Content for Disaster Response and Management: Opportunities, Challenges, and Future Directions. Inf. Process. Manag. 2020, 57, 1–9. [Google Scholar] [CrossRef]
- Stahl, K.; Kohn, I.; Blauhut, V.; Urquijo, J.; De Stefano, L.; Acácio, V.; Dias, S.; Stagge, J.H.; Tallaksen, L.M.; Kampragou, E.; et al. Impacts of European Drought Events: Insights from an International Database of Text-Based Reports. Nat. Hazards Earth Syst. Sci. 2016, 16, 801–819. [Google Scholar] [CrossRef] [Green Version]
- Li, T.; Xie, N.; Zeng, C.; Zhou, W.; Zheng, L.; Jiang, Y.; Yang, Y.; Ha, H.-Y.; Xue, W.; Huang, Y. Data-Driven Techniques in Disaster Information Management. ACM Comput. Surv. 2017, 50, 1–45. [Google Scholar] [CrossRef]
- Below, R.; Grover-Kopec, E.; Dilley, M. Documenting Drought-Related Disasters: A Global Reassessment. J. Environ. Dev. 2007, 16, 328–344. [Google Scholar] [CrossRef]
- Hristidis, V.; Chen, S.C.; Li, T.; Luis, S.; Deng, Y. Survey of Data Management and Analysis in Disaster Situations. J. Syst. Softw. 2010, 83, 1701–1714. [Google Scholar] [CrossRef]
- Yu, M.; Yang, C.; Li, Y. Big Data in Natural Disaster Management: A Review. Geosciences 2018, 8, 165. [Google Scholar] [CrossRef] [Green Version]
- Sasaki, D.; Ono, Y. Overview of the Special Issue on the Development of Disaster Statistics. J. Disaster Res. 2018, 13, 1002–1006. [Google Scholar] [CrossRef]
- Brakenridge, R.G.; Karnes, D. The Dartmouth Flood Observatory: An Electronic Research Tool and Electronic Archive for Investigations of Extreme Flood Events. Geosci. Inf. Soc. Proc. 1996, 27, 31–36. [Google Scholar]
- Guha-Sapir, D. EM-DAT: The Emergency Events Database–Université Catholique de Louvain (UCL)–CRED; EM-DAT: Brussels, Belgium, 2017. [Google Scholar]
- Council, N.R. Facing Hazards and Disasters: Understanding Human Dimensions; National Academies Press: Washington, DC, USA, 2006; ISBN 0309101786. [Google Scholar]
- Kar-Purkayastha, I.; Clarke, M.; Murray, V. Dealing with Disaster Databases—What Can We Learn from Health and Systematic Reviews? PLoS Curr. 2011, 1–14. [Google Scholar] [CrossRef]
- Li, G.; Zhao, J.; Murray, V.; Song, C.; Zhang, L. Gap Analysis on Open Data Interconnectivity for Disaster Risk Research. Geo-Spat. Inf. Sci. 2019, 22, 45–58. [Google Scholar] [CrossRef] [Green Version]
- Goodchild, M.F.; Glennon, J.A. Crowdsourcing Geographic Information for Disaster Response: A Research Frontier. Int. J. Digit. Earth 2010, 3, 231–241. [Google Scholar] [CrossRef]
- Schempp, T.; Zhang, H.; Schmidt, A.; Hong, M.; Akerkar, R. A Framework to Integrate Social Media and Authoritative Data for Disaster Relief Detection and Distribution Optimization. Int. J. Disaster Risk Reduct. 2019, 39, 101143. [Google Scholar] [CrossRef]
- Berthier, E.; Arnaud, Y.; Vincent, C.; Rémy, F. Biases of SRTM in High-Mountain Areas: Implications for the Monitoring of Glacier Volume Changes. Geophys. Res. Lett. 2006, 33, 1–5. [Google Scholar] [CrossRef]
- Lombardi, A.; Colaiuda, V.; Verdecchia, M.; Tomassetti, B. User-Oriented Hydrological Indices for Early Warning Systems with Validation Using Post-Event Surveys: Flood Case Studies in the Central Apennine District. Hydrol. Earth Syst. Sci. 2021, 25, 1969–1992. [Google Scholar] [CrossRef]
- Kobiyama, M.; Goerl, R.F. Quantitative Method to Distinguish Flood and Flash Flood as Disasters. SUISUI Hydrol. Res. Lett. 2007, 1, 11–14. [Google Scholar] [CrossRef] [Green Version]
- Costache, R.; Tien Bui, D. Identification of Areas Prone to Flash-Flood Phenomena Using Multiple-Criteria Decision-Making, Bivariate Statistics, Machine Learning and Their Ensembles. Sci. Total Environ. 2020, 712. [Google Scholar] [CrossRef]
- Saharia, M.; Kirstetter, P.E.; Vergara, H.; Gourley, J.J.; Hong, Y. Characterization of Floods in the United States. J. Hydrol. 2017, 548, 524–535. [Google Scholar] [CrossRef]
- Smith, G. Flash Flood Potential: Determining the Hydrologic Response of FFMP Basins to Heavy Rain by Analysing Their Physiographic Characteristics. 2003. Available online: http//www.cbrfc.noaa.gov/papers/ffp_wpap.pdf (accessed on 15 June 2021).
- de Bruijn, J.A.; de Moel, H.; Weerts, A.H.; de Ruiter, M.C.; Basar, E.; Eilander, D.; Aerts, J.C.J.H. Improving the Classification of Flood Tweets with Contextual Hydrological Information in a Multimodal Neural Network. Comput. Geosci. 2020, 140, 104485. [Google Scholar] [CrossRef]
- Bui, D.T.; Ngo, P.T.T.; Pham, T.D.; Jaafari, A.; Minh, N.Q.; Hoa, P.V.; Samui, P. A Novel Hybrid Approach Based on a Swarm Intelligence Optimized Extreme Learning Machine for Flash Flood Susceptibility Mapping. Catena 2019, 179, 184–196. [Google Scholar] [CrossRef]
- Khosravi, K.; Pham, B.T.; Chapi, K.; Shirzadi, A.; Shahabi, H.; Revhaug, I.; Prakash, I.; Tien Bui, D. A Comparative Assessment of Decision Trees Algorithms for Flash Flood Susceptibility Modeling at Haraz Watershed, Northern Iran. Sci. Total Environ. 2018, 627, 744–755. [Google Scholar] [CrossRef] [PubMed]
- Janizadeh, S.; Avand, M.; Jaafari, A.; Van Phong, T.; Bayat, M.; Ahmadisharaf, E.; Prakash, I.; Pham, B.T.; Lee, S. Prediction Success of Machine Learning Methods for Flash Flood Susceptibility Mapping in the Tafresh Watershed, Iran. Sustainability 2019, 11, 5426. [Google Scholar] [CrossRef] [Green Version]
- Mahmood, S.; Rahman, A.U. Flash Flood Susceptibility Modeling Using Geo-Morphometric and Hydrological Approaches in Panjkora Basin, Eastern Hindu Kush, Pakistan. Environ. Earth Sci. 2019, 78, 1–16. [Google Scholar] [CrossRef]
- Doswell, C.A.; Brooks, H.E.; Maddox, R.A. Flash Flood Forecasting: An Ingredients-Based Methodology. Weather Forecast. 1996, 11, 560–581. [Google Scholar] [CrossRef]
- Plate, E.J. Flood Risk and Flood Management. J. Hydrol. 2002, 267, 2–11. [Google Scholar] [CrossRef]
- Borga, M.; Anagnostou, E.N.; Blöschl, G.; Creutin, J.D. Flash Flood Forecasting, Warning and Risk Management: The HYDRATE Project. Environ. Sci. Policy 2011, 14, 834–844. [Google Scholar] [CrossRef]
- Azmeri; Hadihardaja, I.K.; Vadiya, R. Identification of Flash Flood Hazard Zones in Mountainous Small Watershed of Aceh Besar Regency, Aceh Province, Indonesia. Egypt. J. Remote Sens. Sp. Sci. 2016, 19, 143–160. [Google Scholar] [CrossRef] [Green Version]
- Saharia, M.; Kirstetter, P.-E.; Vergara, H.; Gourley, J.J.; Hong, Y.; Giroud, M. Mapping Flash Flood Severity in the United States. J. Hydrometeorol. 2017, 18, 397–411. [Google Scholar] [CrossRef]
- Oruonye, E. Morphometry and Flood in Small Drainage Basin: Case Study of Mayogwoi River Basin in Jalingo, Taraba State Nigeria. J. Geogr. Environ. Earth Sci. Int. 2016, 5, 1–12. [Google Scholar] [CrossRef]
- Pham, B.T.; Avand, M.; Janizadeh, S.; Phong, T.V.; Al-Ansari, N.; Ho, L.S.; Das, S.; Le, H.V.; Amini, A.; Bozchaloei, S.K.; et al. GIS Based Hybrid Computational Approaches for Flash Flood Susceptibility Assessment. Water 2020, 12, 683. [Google Scholar] [CrossRef] [Green Version]
- Ullah, K.; Zhang, J. GIS-Based Flood Hazard Mapping Using Relative Frequency Ratio Method: A Case Study of Panjkora River Basin, Eastern Hindu Kush, Pakistan. PLoS ONE 2020, 15, e0229153. [Google Scholar] [CrossRef] [Green Version]
- Wood, E.F.; Roundy, J.K.; Troy, T.J.; Van Beek, L.P.H.; Bierkens, M.F.P.; Blyth, E.; de Roo, A.; Döll, P.; Ek, M.; Famiglietti, J. Hyperresolution Global Land Surface Modeling: Meeting a Grand Challenge for Monitoring Earth’s Terrestrial Water. Water Resour. Res. 2011, 47. [Google Scholar] [CrossRef]
- El Shamy, I.Z. Recent Recharge and Flash Flooding Opportunities in the Eastern Desert, Egypt. Ann. Geol. Surv. Egypt 1992, 18, 323–334. [Google Scholar]
- Youssef, A.M.; Pradhan, B.; Gaber, A.F.D.; Buchroithner, M.F. Geomorphological Hazard Analysis along the Egyptian Red Sea Coast between Safaga and Quseir. Nat. Hazards Earth Syst. Sci. 2009, 9, 751–766. [Google Scholar] [CrossRef]
- Farhan, Y.; Anaba, O.; Salim, A. Morphometric Analysis and Flash Floods Assessment for Drainage Basins of the Ras En Naqb Area, South Jordan Using GIS. J. Geosci. Environ. Prot. 2016, 4, 9–33. [Google Scholar] [CrossRef] [Green Version]
- Stamataki, I. Experimental and Numerical Investigation of Flash Floods and Their Interaction with Urban Settlements. Ph.D. Thesis, University of Bath, Bath, UK, 2020. [Google Scholar]
- Jarvis, A.; Reuter, H.; Nelson, A.; Guevara, E. Hole-Filled SRTM for the Globe Version 3, from the CGIAR-CSI SRTM 90m Database. 2008. Available online: http//srtm.csi.cgiar.org (accessed on 15 June 2021).
- Majure, J.J.; Eash, D.A. An Automated Method to Quantify Physical Basin Characteristics. In Proceedings of the US Geological Survey Toxic Substances Hydrology Program, Abstracts of the Technical Meeting, Monterrey, CA, USA, 11–15 March 1991; pp. 88–91. [Google Scholar]
- Zevenbergen, L.W.; Thorne, C.R. Quantitative Analysis of Land Surface Topography. Earth Surf. Process. Landforms 1987, 12, 47–56. [Google Scholar] [CrossRef]
- Evans, S. General Geomorphometry, Derivatives of Altitude, and Descriptive Statistics. In Spatial Analysis in Geomorphology; Chorley, R.J., Ed.; Routledge: London, UK, 1972; pp. 17–90. [Google Scholar]
- Costache, R.; Zaharia, L. Flash-Flood Potential Assessment and Mapping by Integrating the Weights-of-Evidence and Frequency Ratio Statistical Methods in GIS Environment—Case Study: Bâsca Chiojdului River Catchment (Romania). J. Earth Syst. Sci. 2017, 126, 1–19. [Google Scholar] [CrossRef]
- Lehner, B.; Verdin, K.; Jarvis, A. New Global Hydrography Derived From Spaceborne Elevation Data. Eos Trans. Am. Geophys. Union 2008, 89, 93–94. [Google Scholar] [CrossRef]
- Lehner, B.; Grill, G. Global River Hydrography and Network Routing: Baseline Data and New Approaches to Study the World’s Large River Systems. Hydrol. Process. 2013, 27, 2171–2186. [Google Scholar] [CrossRef]
- Gray, D.M. Interrelationships of Watershed Characteristics. J. Geophys. Res. 1961, 66, 1215–1223. [Google Scholar] [CrossRef]
- Patton, P.C.; Baker, V.R. Morphometry and Floods in Small Drainage Basins Subject to Diverse Hydrogeomorphic Controls. Water Resour. Res. 1976, 12, 941–952. [Google Scholar] [CrossRef] [Green Version]
- Faniran, A. The Index of Drainage Intensity—A Provisional New Drainage Factor. Aust. J. Sci. 1968, 31, 328–330. [Google Scholar]
- Strahler, A.N. Quantitative Analysis of Watershed Geomorphology. Eos Trans. Am. Geophys. Union 1957, 38, 913–920. [Google Scholar] [CrossRef] [Green Version]
- Morisawa, M.E. Quantitative Geomorphology of Some Watersheds in the Appalachian Plateau. Geol. Soc. Am. Bull. 1962, 73, 1025–1046. [Google Scholar] [CrossRef]
- Hengl, T.; Mendes de Jesus, J.; Heuvelink, G.B.M.; Ruiperez Gonzalez, M.; Kilibarda, M.; Blagotić, A.; Shangguan, W.; Wright, M.N.; Geng, X.; Bauer-Marschallinger, B.; et al. SoilGrids250m: Global Gridded Soil Information Based on Machine Learning. PLoS ONE 2017, 12, e0169748. [Google Scholar] [CrossRef] [PubMed] [Green Version]
- Tincu, R.; Lazar, G.; Lazar, I. Modified Flash Flood Potential Index in Order to Estimate Areas with Predisposition to Water Accumulation. Open Geosci. 2018, 10, 593–606. [Google Scholar] [CrossRef]
- Buchhorn, M.; Lesiv, M.; Tsendbazar, N.-E.; Bertels, L.; Smets, B. Copernicus Global Land Cover Layers—Collection 2. Remote Sens. 2020, 12, 1044. [Google Scholar] [CrossRef] [Green Version]
- Tellman, B.; Saiers, J.E.; Cruz, O.A.R. Quantifying the Impacts of Land Use Change on Flooding in Data-Poor Watersheds in El Salvador with Community-Based Model Calibration. Reg. Environ. Chang. 2016, 16, 1183–1196. [Google Scholar] [CrossRef]
- Boscarello, L.; Ravazzani, G.; Cislaghi, A.; Mancini, M. Regionalization of Flow-Duration Curves through Catchment Classification with Streamflow Signatures and Physiographic–Climate Indices. J. Hydrol. Eng. 2016, 21, 5015027. [Google Scholar] [CrossRef]
- Sawicz, K.; Wagener, T.; Sivapalan, M.; Troch, P.A.; Carrillo, G. Catchment Classification: Empirical Analysis of Hydrologic Similarity Based on Catchment Function in the Eastern USA. Hydrol. Earth Syst. Sci. 2011, 15, 2895–2911. [Google Scholar] [CrossRef] [Green Version]
- Yadav, M.; Wagener, T.; Gupta, H. Regionalization of Constraints on Expected Watershed Response Behavior for Improved Predictions in Ungauged Basins. Adv. Water Resour. 2007, 30, 1756–1774. [Google Scholar] [CrossRef]
- Kienzle, S. The Effect of DEM Raster Resolution on First Order, Second Order and Compound Terrain Derivatives. Trans. GIS 2004, 8, 83–111. [Google Scholar] [CrossRef]
- Schmidt, J.; Evans, I.S.; Brinkmann, J. Comparison of Polynomial Models for Land Surface Curvature Calculation. Int. J. Geogr. Inf. Sci. 2003, 17, 797–814. [Google Scholar] [CrossRef]
- Yamazaki, D.; O’Loughlin, F.; Trigg, M.A.; Miller, Z.F.; Pavelsky, T.M.; Bates, P.D. Development of the Global Width Database for Large Rivers. Water Resour. Res. 2014, 50, 3467–3480. [Google Scholar] [CrossRef]
- Jacinto, R.; Grosso, N.; Reis, E.; Dias, L.; Santos, F.D.; Garrett, P. Continental Portuguese Territory Flood Susceptibility Index—Contribution to a Vulnerability Index. Nat. Hazards Earth Syst. Sci. 2015, 15, 1907–1919. [Google Scholar] [CrossRef] [Green Version]
- Manfreda, S.; Samela, C.; Gioia, A.; Consoli, G.G.; Iacobellis, V.; Giuzio, L.; Cantisani, A.; Sole, A. Flood-Prone Areas Assessment Using Linear Binary Classifiers Based on Flood Maps Obtained from 1D and 2D Hydraulic Models. Nat. Hazards 2015, 79, 735–754. [Google Scholar] [CrossRef]
- Samela, C.; Manfreda, S.; Paola, F.D.; Giugni, M.; Sole, A.; Fiorentino, M. DEM-Based Approaches for the Delineation of Flood-Prone Areas in an Ungauged Basin in Africa. J. Hydrol. Eng. 2016, 21, 06015010. [Google Scholar] [CrossRef]
- Abdelkareem, M. Targeting Flash Flood Potential Areas Using Remotely Sensed Data and GIS Techniques. Nat. Hazards 2017, 85, 19–37. [Google Scholar] [CrossRef]
- Das, S. Geospatial Mapping of Flood Susceptibility and Hydro-Geomorphic Response to the Floods in Ulhas Basin, India. Remote Sens. Appl. Soc. Environ. 2019, 14, 60–74. [Google Scholar] [CrossRef]
- Yang, Q.; Zhang, S.; Dai, Q.; Yao, R. Improved Framework for Assessing Vulnerability to Different Types of Urban Floods. Sustainability 2020, 12, 7668. [Google Scholar] [CrossRef]
- Gaume, E.; Bain, V.; Bernardara, P.; Newinger, O.; Barbuc, M.; Bateman, A.; Blaškovičová, L.; Blöschl, G.; Borga, M.; Dumitrescu, A.; et al. A Compilation of Data on European Flash Floods. J. Hydrol. 2009, 367, 70–78. [Google Scholar] [CrossRef] [Green Version]
- Nardo, M.; Saisana, M. OECD/JRC Handbook on Constructing Composite Indicators. Putting Theory into Practice; Institute for the Protection and Security of the Citizen: Brussels, Belgium, 2008; pp. 1–16. [Google Scholar]
- Zogg, J.; Deitsch, K. The Flash Flood Potential Index at Weather Forecast Office (WFO) Des Moines, Iowa; National Oceanic and Atmospheric Administration: Silver Spring, MD, USA, 2013.
- Karmokar, S.; De, M. Flash Flood Risk Assessment for Drainage Basins in the Himalayan Foreland of Jalpaiguri and Darjeeling Districts, West Bengal. Model. Earth Syst. Environ. 2020, 6, 2263–2289. [Google Scholar] [CrossRef]
- Rogelis, M.C.; Werner, M. Regional Debris Flow Susceptibility Analysis in Mountainous Peri-Urban Areas through Morphometric and Land Cover Indicators. Nat. Hazards Earth Syst. Sci. 2014, 14, 3043–3064. [Google Scholar] [CrossRef] [Green Version]
- Chao, Y.S.; Wu, C.J. Principal Component-Based Weighted Indices and a Framework to Evaluate Indices: Results from the Medical Expenditure Panel Survey 1996 to 2011. PLoS ONE 2017, 12, e183997. [Google Scholar] [CrossRef] [PubMed]
- Krishnan, V. Constructing an Area-Based Socioeconomic Index: A Principal Components Analysis Approach; University of Alberta: Edmonton, AB, Canada, 2010. [Google Scholar]
- Maadooliat, M.; Huang, J.Z.; Hu, J. Integrating Data Transformation in Principal Components Analysis. J. Comput. Graph. Stat. 2015, 24, 84–103. [Google Scholar] [CrossRef] [PubMed] [Green Version]
- Azami, N.I.A.; Yusoff, N.; Ku-Mahamud, K.R. Effect of Fuzzy Discretization in the Association Performance With Continuous Attributes. In Proceedings of the 6th International Conference on Computing & Informatics, Kuala Lumpur, Malaysia, 25–27 April 2017; pp. 29–36. [Google Scholar]
- Dougherty, J.; Kohavi, R.; Sahami, M. Supervised and Unsupervised Discretization of Continuous Features; Morgan Kaufmann Publishers, Inc.: Burlington, MA, USA, 1995. [Google Scholar]
- Papathoma-Köhle, M.; Schlögl, M.; Fuchs, S. Vulnerability Indicators for Natural Hazards: An Innovative Selection and Weighting Approach. Sci. Rep. 2019, 9, 1–14. [Google Scholar] [CrossRef]
- Tang, Z.; Zhang, H.; Yi, S.; Xiao, Y. Assessment of Flood Susceptible Areas Using Spatially Explicit, Probabilistic Multi-Criteria Decision Analysis. J. Hydrol. 2018, 558, 144–158. [Google Scholar] [CrossRef]
- Murray, S.J.; Smith, A.D.; Phillips, J.C. A Modified Flood Severity Assessment for Enhanced Decision Support: Application to the Boscastle Flash Flood of 2004. Weather Forecast. 2012, 27, 1290–1297. [Google Scholar] [CrossRef] [Green Version]
- Morán-Tejeda, E.; Bazo, J.; López-Moreno, J.I.; Aguilar, E.; Azorín-Molina, C.; Sanchez-Lorenzo, A.; Martínez, R.; Nieto, J.J.; Mejía, R.; Martín-Hernández, N.; et al. Climate Trends and Variability in Ecuador (1966–2011). Int. J. Climatol. 2016, 36, 3839–3855. [Google Scholar] [CrossRef] [Green Version]
- Hidalgo-Bastidas, J.P.; Boelens, R. The Political Construction and Fixing of Water Overabundance: Rural–Urban Flood-Risk Politics in Coastal Ecuador. Water Int. 2019, 44, 169–187. [Google Scholar] [CrossRef] [Green Version]
- Beck, H.E.; Zimmermann, N.E.; McVicar, T.R.; Vergopolan, N.; Berg, A.; Wood, E.F. Present and Future Köppen-Geiger Climate Classification Maps at 1-Km Resolution. Sci. Data 2018, 5, 1–12. [Google Scholar] [CrossRef] [PubMed] [Green Version]
- Cristina Recalde-Coronel, G.; Barnston, A.G.; Muñoz, Á.G. Predictability of December-April Rainfall in Coastal and Andean Ecuador. J. Appl. Meteorol. Climatol. 2014, 53, 1471–1493. [Google Scholar] [CrossRef] [Green Version]
- Baermo, A.; Saari, P. National Communication Republic of Ecuador: Climate Change. 2000. Available online: https://unfccc.int/resource/docs/natc/ecunc1.pdf (accessed on 15 June 2021).
- UNDRR DesInventar. Available online: www.desinventar.net (accessed on 15 June 2021).
- De Moel, H.; Jongman, B.; Kreibich, H.; Merz, B.; Penning-Rowsell, E.; Ward, P.J. Flood Risk Assessments at Different Spatial Scales. Mitig. Adapt. Strateg. Glob. Chang. 2015, 20, 865–890. [Google Scholar] [CrossRef] [PubMed] [Green Version]
- Grimm, N.B.; Fisher, S.G. Stability of Periphyton and Macroinvertebrates to Disturbance by Flash Floods in a Desert Stream. J. N. Am. Benthol. Soc. 1989, 8, 293–307. [Google Scholar] [CrossRef]
- McPhillips, L.E.; Chang, H.; Chester, M.V.; Depietri, Y.; Friedman, E.; Grimm, N.B.; Kominoski, J.S.; McPhearson, T.; Méndez-Lázaro, P.; Rosi, E.J.; et al. Defining Extreme Events: A Cross-Disciplinary Review. Earth’s Future 2018, 6, 441–455. [Google Scholar] [CrossRef]
- Foody, G.M.; Ghoneim, E.M.; Arnell, N.W. Predicting Locations Sensitive to Flash Flooding in an Arid Environment. J. Hydrol. 2004, 292, 48–58. [Google Scholar] [CrossRef]
- Abdel Hamid, H.T.; Wenlong, W.; Qiaomin, L. Environmental Sensitivity of Flash Flood Hazard Using Geospatial Techniques. Glob. J. Environ. Sci. Manag. 2020, 6, 31–46. [Google Scholar] [CrossRef]
- Bucherie, A.; Kruczkiewicz, A. Ecuador Flash Flood Susceptibility Index (FFSI) Based on Catchment Hypsometry, Drainage and Surface Characteristics. Zenodo 2021. [Google Scholar] [CrossRef]
- Opper, S.; Cinque, P.; Daviesc, B. Timeline Modelling of Flood Evacuation Operations. Procedia Eng. 2010, 3, 175–187. [Google Scholar] [CrossRef] [Green Version]
- Buchanan, M.K.; Kopp, R.E.; Oppenheimer, M.; Tebaldi, C. Allowances for Evolving Coastal Flood Risk under Uncertain Local Sea-Level Rise. Clim. Chang. 2016, 137, 347–362. [Google Scholar] [CrossRef] [Green Version]
- Haynes, K.; Coates, L.; Leigh, R.; Handmer, J.; Whittaker, J.; Gissing, A.; McAneney, J.; Opper, S. “Shelter-in-Place” vs. Evacuation in Flash Floods. Environ. Hazards 2009, 8, 291–303. [Google Scholar] [CrossRef]
- Starbuck, W.H. Perspective—Cognitive Reactions to Rare Events: Perceptions, Uncertainty, and Learning. Organ. Sci. 2009, 20, 925–937. [Google Scholar] [CrossRef]
- Ramos, M.H.; Mathevet, T.; Thielen, J.; Pappenberger, F. Communicating Uncertainty in Hydro-Meteorological Forecasts: Mission Impossible? Meteorol. Appl. 2010, 17, 223–235. [Google Scholar] [CrossRef]
- Kellens, W.; Terpstra, T.; De Maeyer, P. Perception and Communication of Flood Risks: A Systematic Review of Empirical Research. Risk Anal. 2013, 33, 24–49. [Google Scholar] [CrossRef] [PubMed] [Green Version]
- Fuchs, S.; Karagiorgos, K.; Kitikidou, K.; Maris, F.; Paparrizos, S.; Thaler, T. Flood Risk Perception and Adaptation Capacity: A Contribution to the Socio-Hydrology Debate. Hydrol. Earth Syst. Sci. 2017, 21, 3183–3198. [Google Scholar] [CrossRef] [Green Version]
- Kruczkiewicz, A.; Klopp, J.; Fisher, J.; Mason, S.; McClain, S.; Sheekh, N.M.; Moss, R.; Parks, R.M.; Braneon, C. Opinion: Compound Risks and Complex Emergencies Require New Approaches to Preparedness. Proc. Natl. Acad. Sci. USA 2021, 118, 1–5. [Google Scholar] [CrossRef] [PubMed]
- Mitchell, T.; Jones, L.; Lovell, E.; Comba, E. Disaster Risk Management in Post-2015 Development Goals: Potential Targets and Indicators; Overseas Development Institute (ODI): London, UK, 2013. [Google Scholar]
- Liu, C.; Guo, L.; Ye, L.; Zhang, S.; Zhao, Y.; Song, T. A Review of Advances in China’s Flash Flood Early-Warning System. Nat. Hazards 2018, 92, 619–634. [Google Scholar] [CrossRef] [Green Version]
- Mohanty, A.; Hussain, M.; Mishra, M.; Kattel, D.B.; Pal, I. Exploring Community Resilience and Early Warning Solution for Flash Floods, Debris Flow and Landslides in Conflict Prone Villages of Badakhshan, Afghanistan. Int. J. Disaster Risk Reduct. 2019, 33, 5–15. [Google Scholar] [CrossRef]
- Kundzewicz, Z.W.; Kanae, S.; Seneviratne, S.I.; Handmer, J.; Nicholls, N.; Peduzzi, P.; Mechler, R.; Bouwer, L.M.; Arnell, N.; Mach, K.; et al. Le Risque d’inondation et Les Perspectives de Changement Climatique Mondial et Régional. Hydrol. Sci. J. 2014, 59, 1–28. [Google Scholar] [CrossRef] [Green Version]
- Khajehei, S.; Ahmadalipour, A.; Shao, W.; Moradkhani, H. A Place-Based Assessment of Flash Flood Hazard and Vulnerability in the Contiguous United States. Sci. Rep. 2020, 10, 1–12. [Google Scholar] [CrossRef] [PubMed] [Green Version]
- Girvetz, E.H.; Gray, E.; Tear, T.H.; Brown, M.A. Bridging Climate Science to Adaptation Action in Data Sparse Tanzania. Environ. Conserv. 2014, 41, 229–238. [Google Scholar] [CrossRef]
- Dinku, T.; Funk, C.; Peterson, P.; Maidment, R.; Tadesse, T.; Gadain, H.; Ceccato, P. Validation of the CHIRPS Satellite Rainfall Estimates over Eastern Africa. Q. J. R. Meteorol. Soc. 2018, 144, 292–312. [Google Scholar] [CrossRef] [Green Version]
- Rahmati, O.; Darabi, H.; Haghighi, A.T.; Stefanidis, S.; Kornejady, A.; Nalivan, O.A.; Bui, D.T. Urban Flood Hazard Modeling Using Self-Organizing Map Neural Network. Water 2019, 11, 2370. [Google Scholar] [CrossRef] [Green Version]
- Giovannettone, J.; Sangameswaran, S.; Maderia, C.; Batten, B. Spatial Analysis of Flood Susceptibility Throughout Currituck County, North Carolina. J. Hydrol. Eng. 2020, 25, 05020021. [Google Scholar] [CrossRef]


| Categories (and Subcategories) | Keywords | Score |
|---|---|---|
| A- Meteorological | ||
| A.1- Heavy precipitation | Strong, intense, heavy precipitation and rainfall, stormy rain | 2 |
| A.2- Short duration precipitation | Precipitation of a few hours, occurring at a specific moment of the day (morning, afternoon, evening, night …) | 3 |
| B- Hydrological | ||
| B.1- Small stream overflow | Overflowing of streams, ravines, gullies | 4 |
| B.2- Artificial waterways overflow | Ditch, canals, Irrigation channels, gutters, artificial waterways | 1 |
| B.3- River bank failure | Failure, rupture of river banks | 4 |
| B.4- Surface runoff | Mudflow, superficial, surface water, running water | 6 |
| C- Environmental | ||
| C.1- Urban | Flooded streets, blocked drainage systems, sewage systems issues | 1 |
| C.2- Slope | Water coming from the hills, steep terrain | 5 |
| D- Flood dynamics | ||
| D.1- Strong current | Strong, fast moving water, torrential currents, dragging force, sweeping away, collapsing walls, destructive, dangerous events | 7 |
| D.2- Short-duration flood | Flash, unexpected, water level quickly returning to normal, water evacuated within a few hours | 7 |
| Indicators | Data Source | Description | |
|---|---|---|---|
| Hypsometry | Mean slope (deg) | Global SRTM 90 m Digital Elevation Model (DEM) v4.1 [107] | The mean slope is an indication of the flashiness of a watershed, proportional to the flood susceptibility [108]. The slope is computed in degrees from the DEM using 2nd degree polynomial adjustment algorithm [109]. |
| Mean profile curvature (1/m) | The profile curvature of a terrain is the rate of change of the slope gradient in the direction of steepest slope [110,111]. Negative profile curvatures (convex landforms), also related to erosion-dominated landscapes, are indicative of surface runoff and torrential flood. | ||
| Drainage network | Upslope contributing area (km2) | WWF HydroSHEDS v1 global datasets (15 arc-seconds resolution): level 12 hydrological basins [112] and river routing network datasets [113]. | The contributing area of a river point is correlated with its discharge potential [114]. The Upslope contributing area [112] is used to differentiate the upstream to more downstream catchment position within a country, and therefore guide the type of flood behavior to expect (from short onset flash floods to long onset riverine floods). |
| Drainage density Dd (km−1) | The drainage density Dd (Km−1) is a measure of the cumulative river length over the catchment area. This has a direct correlation with runoff potential, and therefore indirect correlation with infiltration rate [115,116]. | ||
| Mean Strahler stream order | The Strahler hierarchical river stream order [117], averaged across catchment, provides an indication of the basin mean stream order. A lower basin order corresponds to a higher proportion of small streams, and therefore higher flash flood potential [115,118]. | ||
| Surface properties | Sand content | ISRIC SoilGrids global dataset [119]. Sand fraction 250 m resolution product of the 0–5 cm depth. | Sand content is used as a proxy for infiltration potential of soils. The infiltration rate decreases with decreasing sand content, increasing runoff and flash flood susceptibility [88,120] |
| Land use and land cover (LULC) | Copernicus Global Land Operations, derived from PROBA-V satellite observations, at 100 m [121]. | LULC directly impacts runoff generation and behavior [88,120,122]. Discrete LULC classes are reclassified into flash flood susceptibility scores from 1 to 8, depending on potential to influence surface runoff. Closed forest = score of 1, urban environment = score of 8. (see Appendix A for more details) |
| Dataset Name | DesInventar | SNGRE | Derived Dataset |
|---|---|---|---|
| Time range | 2007–2019 | 2014–2019 | 2007–2019 |
| Number of reports | 2859 | 2207 | 3365 |
| Spatial resolution characteristics |
|
|
|
| Flood and impact description | Yes | Yes | Yes |
| No. Identifiers | 0 | 1 | 2 | 3 | 4 | 5 | 6 |
|---|---|---|---|---|---|---|---|
| No. reports | 1033 | 1163 | 849 | 237 | 73 | 9 | 1 |
| FFCI | 0 | 1 | 2 | 3 | 4 | 5 | 6 | 7 | 8 | 9 | 10 |
|---|---|---|---|---|---|---|---|---|---|---|---|
| No. reports | 1033 | 155 | 596 | 259 | 137 | 385 | 180 | 158 | 72 | 141 | 249 |
| % => FFCI | - | 100 | 93 | 68 | 57 | 51 | 34 | 27 | 20 | 17 | 11 |
| Categories | Hypsometry | Drainage Network | Surface Properties | ||||
|---|---|---|---|---|---|---|---|
| Indicators (Ij) | 1 Mean slope | 2 Mean profile curvature | 3 Upslope contributing area | 4 Drainage density | 5 Mean Strahler stream order | 6 Mean LULC | 7 Sand content |
| PCA resulting weights (wj) | 0.18 | 0.10 | 0.18 | 0.20 | 0.14 | 0.12 | 0.08 |
| eFFCI | 0 | 1 | 2 | 3 | 4 | 5 | 6 | 7 | 8 | 9 | 10 |
|---|---|---|---|---|---|---|---|---|---|---|---|
| No. reports | - | 68 | 432 | 227 | 236 | 307 | 256 | 222 | 150 | 163 | 271 |
| % => eFFCI | - | 100 | 97 | 79 | 69 | 59 | 46 | 35 | 25 | 19 | 12 |
Publisher’s Note: MDPI stays neutral with regard to jurisdictional claims in published maps and institutional affiliations. |
© 2021 by the authors. Licensee MDPI, Basel, Switzerland. This article is an open access article distributed under the terms and conditions of the Creative Commons Attribution (CC BY) license (https://creativecommons.org/licenses/by/4.0/).
Share and Cite
Kruczkiewicz, A.; Bucherie, A.; Ayala, F.; Hultquist, C.; Vergara, H.; Mason, S.; Bazo, J.; de Sherbinin, A. Development of a Flash Flood Confidence Index from Disaster Reports and Geophysical Susceptibility. Remote Sens. 2021, 13, 2764. https://0-doi-org.brum.beds.ac.uk/10.3390/rs13142764
Kruczkiewicz A, Bucherie A, Ayala F, Hultquist C, Vergara H, Mason S, Bazo J, de Sherbinin A. Development of a Flash Flood Confidence Index from Disaster Reports and Geophysical Susceptibility. Remote Sensing. 2021; 13(14):2764. https://0-doi-org.brum.beds.ac.uk/10.3390/rs13142764
Chicago/Turabian StyleKruczkiewicz, Andrew, Agathe Bucherie, Fernanda Ayala, Carolynne Hultquist, Humberto Vergara, Simon Mason, Juan Bazo, and Alex de Sherbinin. 2021. "Development of a Flash Flood Confidence Index from Disaster Reports and Geophysical Susceptibility" Remote Sensing 13, no. 14: 2764. https://0-doi-org.brum.beds.ac.uk/10.3390/rs13142764