Article

Observation of Cloud Base Height and Precipitation Characteristics at a Polar Site Ny-Ålesund, Svalbard Using Ground-Based Remote Sensing and Model Reanalysis

1
National Centre for Polar and Ocean Research, Ministry of Earth Sciences, Goa 403804, India
2
Indian Institute of Technology, Bhubaneswar, Odisha 752050, India
3
School of Earth, Ocean, and Atmospheric Sciences, Goa University, Goa 403206, India
*
Author to whom correspondence should be addressed.
Remote Sens. 2021, 13(14), 2808; https://0-doi-org.brum.beds.ac.uk/10.3390/rs13142808
Submission received: 30 April 2021 / Revised: 27 June 2021 / Accepted: 30 June 2021 / Published: 17 July 2021
(This article belongs to the Special Issue Remote Sensing of Precipitation at the Mid- to High-Latitudes)

Abstract

:
Clouds play a significant role in regulating the Arctic climate and water cycle due to their impacts on radiative balance through various complex feedback processes. However, there are still large discrepancies in satellite and numerical model-derived cloud datasets over the Arctic region due to a lack of observations. Here, we report observations of cloud base height (CBH) characteristics measured using a Vaisala CL51 ceilometer at Ny-Ålesund, Svalbard. The study highlights the monthly and seasonal CBH characteristics at the location. It is found that almost 40% of the lowest CBHs fall within a height range of 0.5–1 km. The second and third cloud bases that could be detected by the ceilometer are mostly concentrated below 3 km during summer but possess more vertical spread during the winter season. Thin and low-level clouds appear to be dominant during the summer. Low-level clouds are found to be dominant and observed in 76% of cases. The mid and high-level clouds occur in ~16% and ~7% of cases, respectively. Further, micro rain radar (MRR2) observed enhanced precipitation and snowfall events during the winter and spring which are found to be associated with the lowest CBHs within 2 km from the ground. The frontal process associated with synoptic-scale meteorological conditions explains the variabilities in CBH and precipitation at the observation site when compared for two contrasting winter precipitation events. The findings of the study could be useful for model evaluation of cloud precipitation relationships and satellite data validation in the Arctic environment.

Graphical Abstract

1. Introduction

It is now well established that the Arctic is warming at a much faster rate than the rest of the globe, a phenomenon popularly known as “Arctic Amplification” (AA) [1,2,3]. Although most of the climate models capture this amplified warming in the Arctic [4], there is considerable inconsistency about the magnitude of the warming among those models [1,5]. A significant amount of this could result from the poor understanding or representation of different feedback processes in the climate models [6,7,8,9]. Further, accelerated warming has made the interactions between the Arctic cryospheric components more complex, drawing wide scientific attention. Several studies have pointed out the important roles played by the processes such as sea ice-albedo [10,11], aerosols [12], and heat and moisture transports [13,14] in AA. Apart from these, clouds also are known as significant contributors to AA [15]. Studies suggest that the improper representation of the cloud feedback in the models can be a major source of uncertainty, particularly in the polar regions [8,9]. Clouds and precipitation are crucial factors of the atmospheric hydrological cycle, which have large impacts on the atmospheric radiation budget and surface mass balance in the Arctic [16,17,18,19,20]. Further, clouds have been identified as one of the major contributors to the wintertime warming in the Arctic due to their positive radiative effect [21,22]. However, the present knowledge on the behaviour of these parameters and their climatic impacts is not complete despite their defining role in Arctic climate [23]. From the available datasets, it is known that the Arctic is mostly cloudy and has a distinct annual cycle of cloudiness [24,25]. A study by Eastman and Warren [26] used long-term records of both satellite and ground-based observations for the Arctic region and found considerable disagreement among them in terms of the seasonal trend and interannual variabilities. Thus, while observations could serve as a way to get a proper representation of cloud physics and parameterization in climate models, the observations from satellite and ground-based platforms have their own merits and demerits [23,27,28]. Satellite-derived cloud properties exhibit disagreement between datasets from different platforms due to the differences in sensor-specific cloud retrieval algorithms. Again, low thermal contrasts between clouds and underlying surfaces add more uncertainties to the datasets [27,29]. In addition to that, the low temporal resolutions of satellite datasets limit a detailed investigation of the short-term changes in cloud properties. Thus, a ground-based remote sensing approach of cloud measurements can reduce the uncertainties in cloud observations with more accurate information.
The limitations discussed above justify the importance of a surface-based remote sensing approach to study clouds, especially over polar regions. By keeping these points in view, we use Vaisala Ceilometer (CL51) to study the cloud base height (CBH) behaviour over an Arctic site, Ny-Ålesund, Svalbard (Figure 1). The ceilometer is mainly designed to get more accurate CBH detection [30,31,32,33]. The ceilometer is limited to point observation but with better accuracy over climate models and higher temporal and vertical resolution over satellite datasets [27]. Given the limitations of ceilometer in the estimation of horizontal extent, cloud top height and cloud thickness, it is necessary to complement the ceilometer observations with other ground-based or satellite observations for detailed information on cloud characteristics [34,35,36,37].
Ny-Ålesund is located on the west coast of Svalbard, next to the fjord, the ocean and the mountains. Due to such geographical position, its atmosphere is influenced mainly by the diabatic heating of warm ocean and nearby orographic features [28,38,39]. Further, the Svalbard region also exhibits major heat and moisture advection from the lower latitudes. The warm North Atlantic current and the frequent storm tracks bring significant oceanic and atmospheric heat, moisture into the region and potentially interact with the local meteorological conditions such as cloud, precipitation characteristics, etc. It is to be noted that only a few cloud-related studies have been conducted over this high latitude polar site [40]. Using a micropulse lidar, Shupe et al. [41] obtained the cloud statistics over the study area. The relationships between cloud fraction and surface radiation fluxes have been studied by Yeo et al. [42]. Recently, using lidar–radar synergy, the vertical cloud structure has been investigated by Nomokonova et al. [40]. A recent study by Maturilli et al. [27] showed the long-term CBH characteristics over Ny-Ålesund. However, their study mainly focuses on the monthly and annual mean and median of CBH distributions and related changes to radiation.
In this study, we report further CBH characteristics as observed from ground-based observations at Ny-Ålesund. In addition to that, we use precipitation observations from a Micro Rain Radar (MRR2) at the same observation site and have attempted to identify if any relationship persists between the observed CBH and precipitation intensity. Additionally, the possible roles of synoptic-scale meteorology and atmospheric features to precipitation and cloud changes are elucidated. The findings of the study could be useful to validate and assess the performance of numerical models, particularly in the context of cloud representations in and parametrization.
Section 2 describes the instruments, datasets and their retrieval methods. Analyses of the ceilometer (CL51) CBHs and Micro rain Radar precipitation are elaborated in Section 3. Section 4 summarizes the results.

2. Data and Methodology

2.1. Ceilometer and Cloud Base Height

A Vaisala CL51 laser ceilometer is installed on the roof of Gruvebadet building (78.91°N, 11.89°E, 40 m elevation above sea level (asl)) at Ny-Ålesund, Svalbard (Figure 1). The Gruvebadet atmospheric laboratory is located about one kilometre south of Ny-Ålesund and is dedicated to various atmospheric measurements.
The instrument uses the LIDAR (LIght Detection and Ranging) technology to determine the CBH. It emits short, powerful laser pulses in a vertical direction and by analysing the vertical profile of the reflection of light (backscatter) caused by clouds, precipitation, or other obscuration, CBH is determined. The instrument initially sends a pulsed laser beam vertically to the atmosphere, where light interacts with air molecules and particles. The resulting backscatter profile is stored and processed using the algorithm provided by Vaisala (https://www.epa.gov/sites/production/files/2021-03/ceilometer_sop_cl51.docx, (accessed on 1 March 2021)) for CBH detection. By detecting the run-time of the return signal/scattered radiation, the ceilometer identifies the lowest altitude of a cloud base with higher particle backscatter characteristics. The CL51 ceilometer operates at a central wavelength of 910 nm. It has a more powerful laser and smaller beam divergence source than its previous versions. This enables CL51 to measure cloud base at up to 15 km. The vertical and temporal resolutions are set at 10 m and 6 s respectively for the present analysis. For CL51, if the lower cloud layer is optically thin enough to allow the backscattered light from the upper cloud layer, it is possible to detect up to three cloud layers. The detailed specifications of the instrument are provided in Table 1.
The instrument is in operation since Spring 2015, as part of the Indian Arctic Programme with some intermediate data gaps due to technical and logistical issues. In this study, for monthly statistics, we used the months with more than 70% of days with records from April 2015 to October 2017 (Figure 2). This has allowed us to cover a full calendar year with more than 70% data in each month. Note that we have two full-month records for April, September and October during the study period, i.e., April 2016 and 2017 and September and October in 2015 and 2017. Averaged values for those months are used for their corresponding monthly statistics. The original ceilometer data are recorded at a temporal resolution of 6s and converted to netCDF files using the software “cl2nc” (https://github.com/peterkuma/cl2nc, (accessed on 1 May 2020)). Monthly mean CBH values are computed by averaging the daily mean values. Due to discontinuity and a short period of a data record, the interannual variations cannot be captured; however, the average monthly records help get a general feature of the corresponding period.

2.2. Precipitation from Micro Rain Radar (MRR2)

The precipitation dataset is collected using a K-band Micro Rain Radar (MRR2), which provides complete Doppler spectra of hydrometeors [43,44,45]. The MRR2 signal is transmitted vertically into the atmosphere, where a small portion is scattered back to the antenna from raindrops or other forms of precipitation. Due to the raindrops’ falling velocity, there is a frequency deviation between the transmitted and the received signal (Doppler frequency). The MRR2 derives profiles of drop size distributions and rain parameters from measured spectral power backscatter intensity. The specifications of MRR2 used for this study are provided in Table 2. It should be noted that the precipitation rate derived by MRR2 is valid for liquid precipitation only. Distinguishing between rain and snow events is not very straightforward and beyond the scope of this study. For simplicity, we used daily averaged surface temperature observations (eklima.met.no) at the location and assumed precipitation with a surface temperature higher than −2 °C as liquid and snow otherwise.
The IMProToo software (https://github.com/maahn/IMProToo, (accessed on 1 May 2020)) which is designed for snowfall observation with MRR is used for this purpose. The snowfall rates for the corresponding days are then derived using the following Equation.
Z e = a S b
where Ze is equivalent reflectivity in dBz, S is snowfall intensity in mm/h and a and b are constants set as 19.66 and 1.74 respectively [46].

2.3. Radiosonde Measurements

The Alfred Wegener Institute (AWI) provides radiosonde data dating from 1991 from Ny-Ålesund, Svalbard (Latitude—78.92, Longitude—11.93) [47,48]. In this study, we analysed 12 UTC soundings taken using the Vaisala RS92 radiosonde for the days with contrasting precipitation (https://0-doi-org.brum.beds.ac.uk/10.1594/PANGAEA.875196, (accessed on 15 February 2021)). The data are homogenized by applying the correction methods proposed by Miloshevich et al. [49] and interpolated on a regular altitude grid with 50 m vertical resolution in the lower 10 km altitude and 100 m vertical resolution above, up to a maximum altitude of 30 km. The accuracy ranges of air temperature and relative humidity are ±0.1 K and ±1%, respectively.

2.4. ERA-5 Reanalysis

The reanalysis datasets are widely used for climate monitoring and applications. The ERA5 is a new global reanalysis provided by ECMWF and released in 2017 [50]. The horizontal resolution of ERA5 is ~31 km, and there are 137 model levels (up to 0.01 hPa). ERA5 uses the IFS Cy41r2 4D-Var assimilation system (https://confluence.ecmwf.int//pages/viewpage.action?pageId=74764925, (accessed on 1 February 2020)). The ERA-5 datasets have been shown to perform relatively better than other reanalysis products compared over the Arctic [51]. We used various meteorological parameters like winds, mean sea level pressure, rainfall and temperature to investigate their roles in the observed precipitation and cloud dynamics.

3. Results and Discussion

3.1. CBH Characteristics at Ny-Ålesund

In this section, we focus on the CBH observations. The data analysis is performed for CBH characteristics, cloud occurrences, and height distributions on a monthly and seasonal scale. The cloud occurrence is defined as follows.
C l o u d   o c c u r r e n c e = N u m b e r   o f   r e c o r d s   w i t h   d e t e c t e d   l o w e s t   C B H T o t a l   n u m b e r   o f   r e c o r d s
The cloud occurrence is expressed in percentage and is shown as a solid black line in Figure 3 on a monthly timescale. The ratio achieves its maxima during August with more than 80% cloud occurrences. On the other hand, minimum cloudiness is observed during April with a minimum value (~55%). We further analyzed the seasonal average of cloud occurrence depicted as black bars in the bottom panel of Figure 3. It may be noted that the average cloud occurrence is maximum during the autumn season followed by the summer. We observe a minimum average cloud occurrence during the spring season.
These results are comparable to the ground-based in-situ observation using micropulse lidar at Ny-Ålesund [25]. Further, satellite observations of cloudiness north of 80 °N [52] and the climatology of Arctic cloud [53] also follow a similar pattern as found in ceilometer measurements from Ny-Ålesund. It is to be noted that Shupe et al. [25] found that the summertime increase in cloudiness is consistent with the increase in relative humidity in the atmosphere. Moreover, they also found that Ny-Ålesund has a lesser seasonal variation in cloudiness (24%) compared to other stations around the Arctic due to relatively small seasonal variation in meteorological parameters. Our observations from the ceilometer are consistent with their findings, which show a maximum of 83% of cloud occurrences during autumn (SON), while the spring (MAM) has minimum cloud occurrences of 59%. The nature of the annual cycle found in our observation mostly follows a similar pattern from long-term in-situ observation at Ny-Ålesund [25,27] and also the climatology of Arctic clouds [53].
The red line in the top panel of Figure 3 shows the estimates of the probabilities of detection of monthly CBH2 (in percentage) and given by the following Equation.
p C B H 2 = N u m b e r s   o f   s e c o n d   C B H   d e t e c t e d N u m b e r s   o f   l o w e s t   C B H   r e c o r d s
As is shown in the figure, the lowest level of cloud thickness attends the maximum values during the summer months, whereas the minimum during the winter months, followed by spring. Higher values during the summer indicate the fact that during the summer months the lowest level clouds are thinner than other seasons, allowing the ceilometer signal to detect the second cloud base. The seasonal mean estimates for the probability of detection CBH2 are maximum for JJA and SON (4.96% and 4.62%) respectively and minimum for DJF and MAM (2.14% and 2.69%). The CBH3 detection also follows similar seasonal pattern like CBH2 with a lesser magnitude (0.98%, 0.74%, 1.78% and 1.63% for DJF, MAM, JJA, And SON seasons respectively)

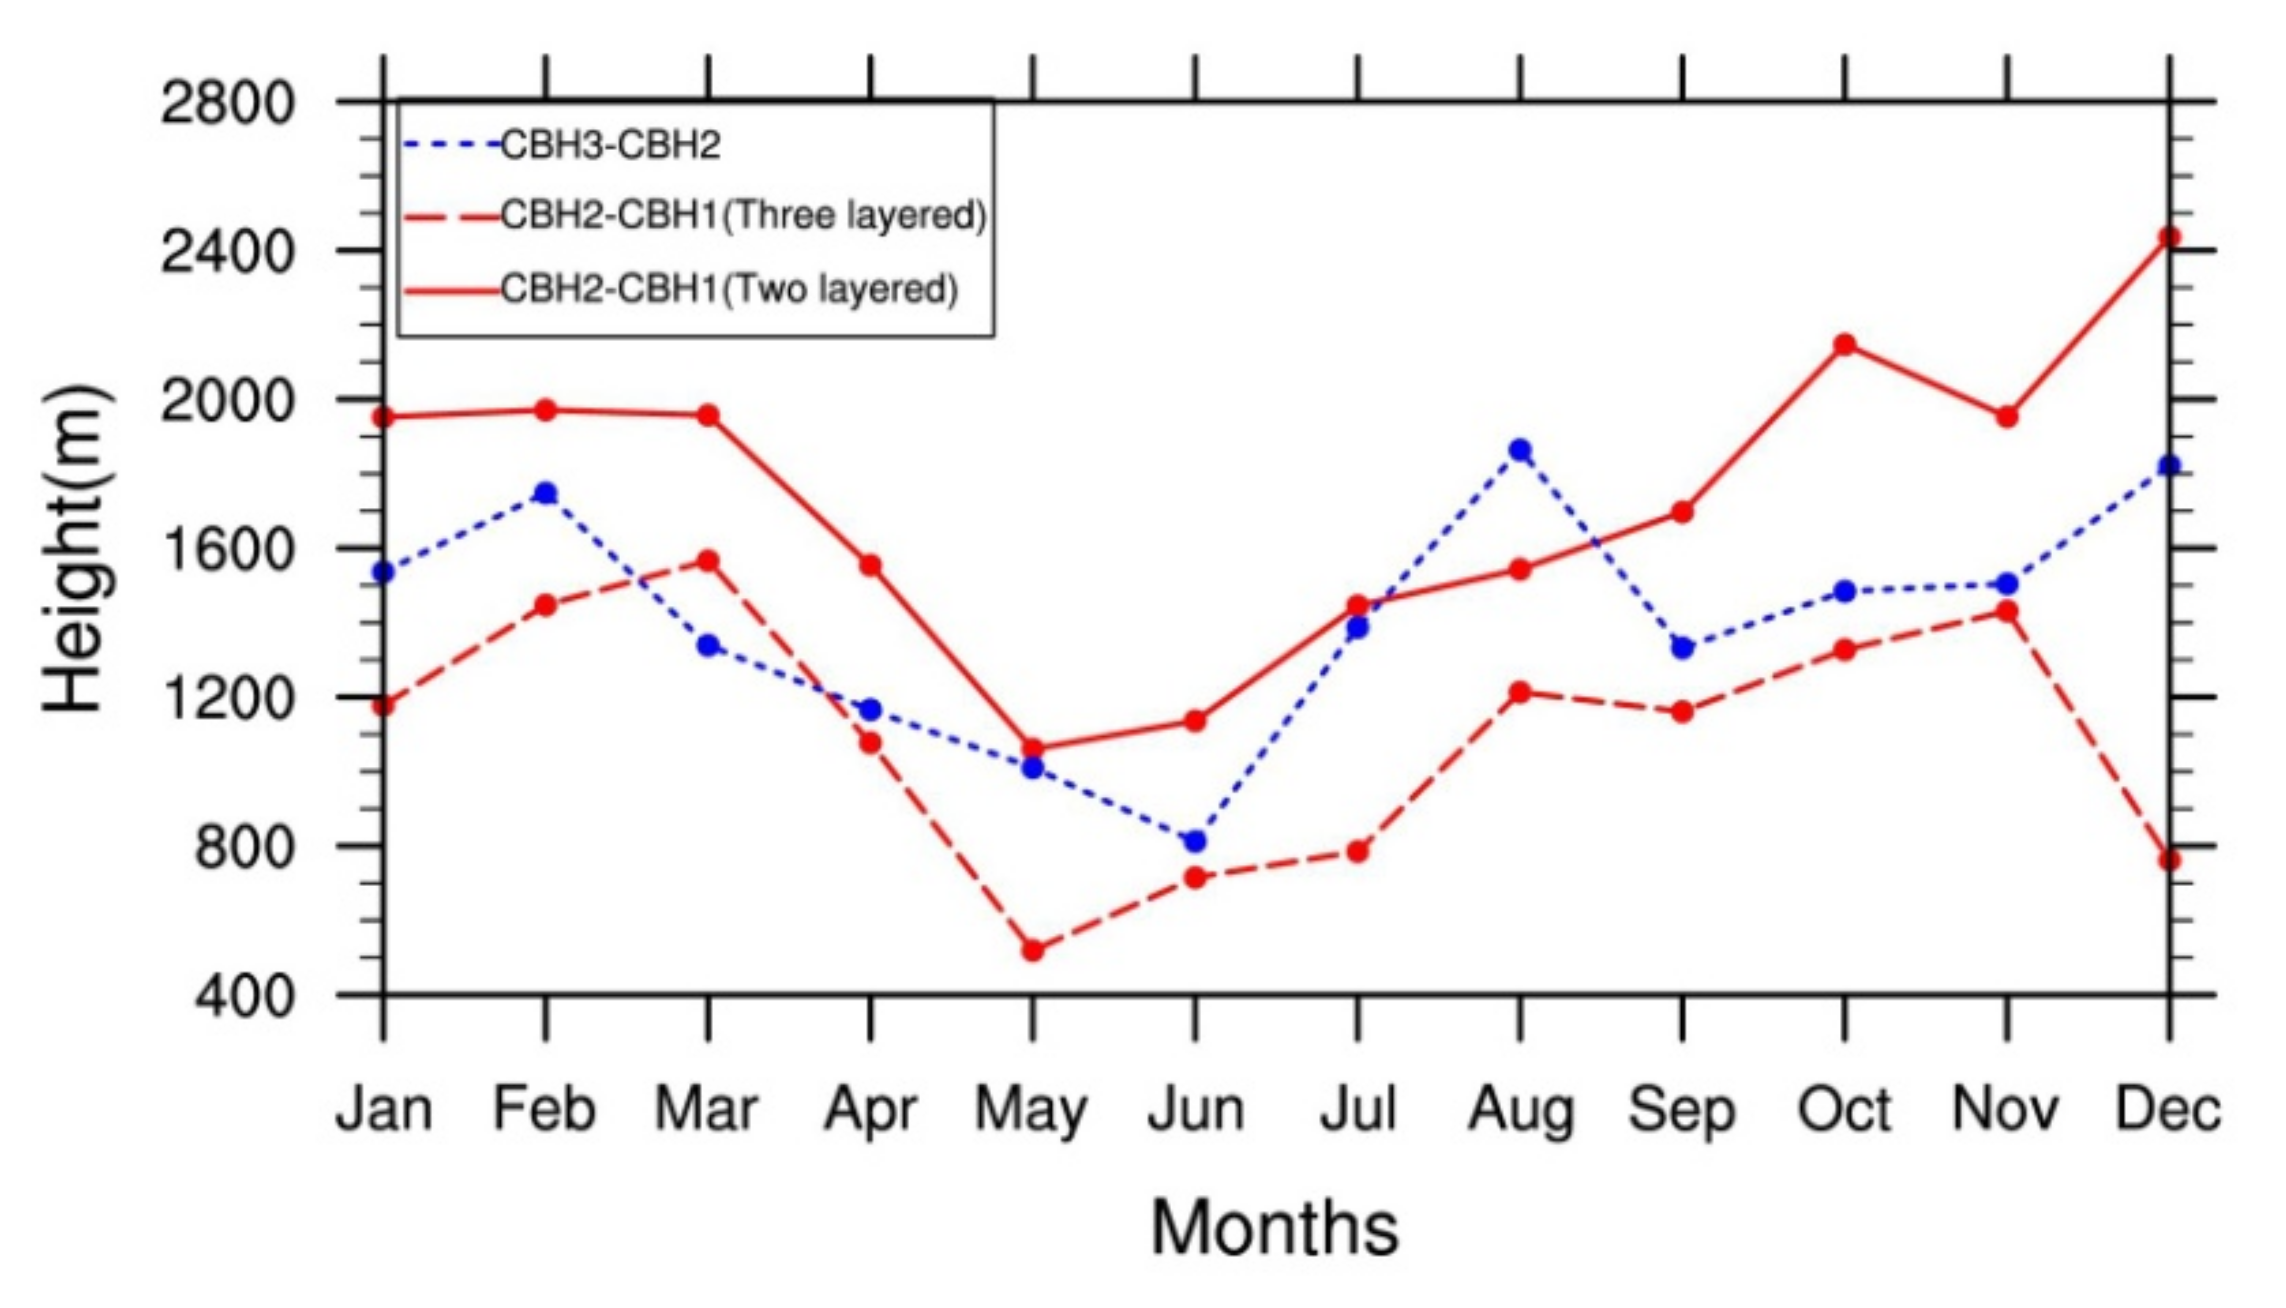
3.2. Monthly Mean Cloud Heights

Figure 4 depicts the monthly mean CBHs detected by the ceilometer. The monthly average of the lowest CBH exhibits a distinct seasonal cycle at Ny-Ålesund with a summer minimum and winter maximum. Additionally, a seasonal cycle is present in all three layers of CBHs. Results reveal that the second and third layer CBHs being minimum in the early summer and maximum during autumn and winter.
The seasonal cycle of the lowest CBH as found here is consistent with the findings in Shupe et al., 2011. The summer mean (JJA) lowest CBH is found at an altitude of 1179 m whereas, for autumn (SON), winter (DJF) and spring (MAM) are 1848 m, 2340 m, and 1462 m respectively. All the cloud heights exhibit two maxima (one during the winter and another during the autumn) with minimum values during early summer. One might assume the dominance of low clouds during these periods based on the CBH characteristics. On the other hand, the two maxima observed during late winter and autumn could be associated with mid and high-level clouds. We discussed the nature of high and low clouds in the next section separately.

3.3. Monthly Cloud Characteristics

Figure 5 shows the seasonal cycle of low (lowest CBH < 2000 m), mid (2000 m < lowest CBH < 5000 m) and high (lowest CBH > 5000 m) clouds. As expected from Figure 4, occurrences of low clouds attend maxima during summer and minimum in winter months. In contrast, the mid and high-level clouds show an opposite seasonal cycle with a minimum in summer and a maximum during winter. These characteristics are consistent with the observations from Huschke (1969). Among all the CBH detection records, low-level clouds are found in 76.2% of cases, while mid and high-level clouds occur in 16.2% and 7.6% of cases, respectively. The predominant presence of low-level clouds and their maximum occurrence in summer is also found over the Arctic and confirmed by both the observations and modelling studies [20,26].
Figure 6 depicts the height distributions of three layers of cloud bases for the four seasons. The autumn and spring seasons appear to exhibit a similar pattern with a homogenous distribution along with the height ranges. The lowest CBH is found at 0.5–1 km height most of the time in these seasons while the third and highest CBH detected by ceilometer occurs mostly at 2.5–3 km height. However, beyond 4 km height, the highest CBH is found in autumn compared to spring. The summer and winter months show distinct differences in height distributions of the three cloud bases. Increased presence (~30%) of the lowest cloud bases below 0.5 km can be noted in summer compared to in winter (<10%). On the other hand, the maximum (approximately 40%) lowest cloud base is found at a height range of 0.5–1 km in all four seasons. The second and third cloud bases are more concentrated below 3 km and rare occurrences beyond 3 km during summer. In contrast, during winter, the second and third cloud bases have more vertical spreads, with the third cloud base having a distinct maximum occurrence at 3.5–4 km.
The second or third CBH detection probabilities are mainly dependent on the thickness/opacity of the lowest CBH. It can be noticed that the percentage of detection of second or third CBH attends maximum during the summer, indicating the fact that summer clouds are thinner than other seasons at Ny-Ålesund. These thin clouds in summer are again mainly at a low level, as more than 80% of the summer clouds are at a low level as can be seen in Figure 5. The liquid containing thin, low-level clouds in summer has notable implications due to their strong radiative effects, which warm the surface temperature [54,55].
Figure 6 also suggests that the distance between consecutive cloud bases also increases in winter. To get a precise estimate of that, we show the distance between the cloud bases in Figure 7. Distance between the first and second CBH in both the cases with two and three layers detected by ceilometer is minimum during May-June and maximum in winter and early spring (March-April) months. Additionally, they are closer to each other when there are three-layered clouds compared to the cases with two-layered clouds. In three-layered systems, the distance between the third and second CBH is maximum during the late summer.

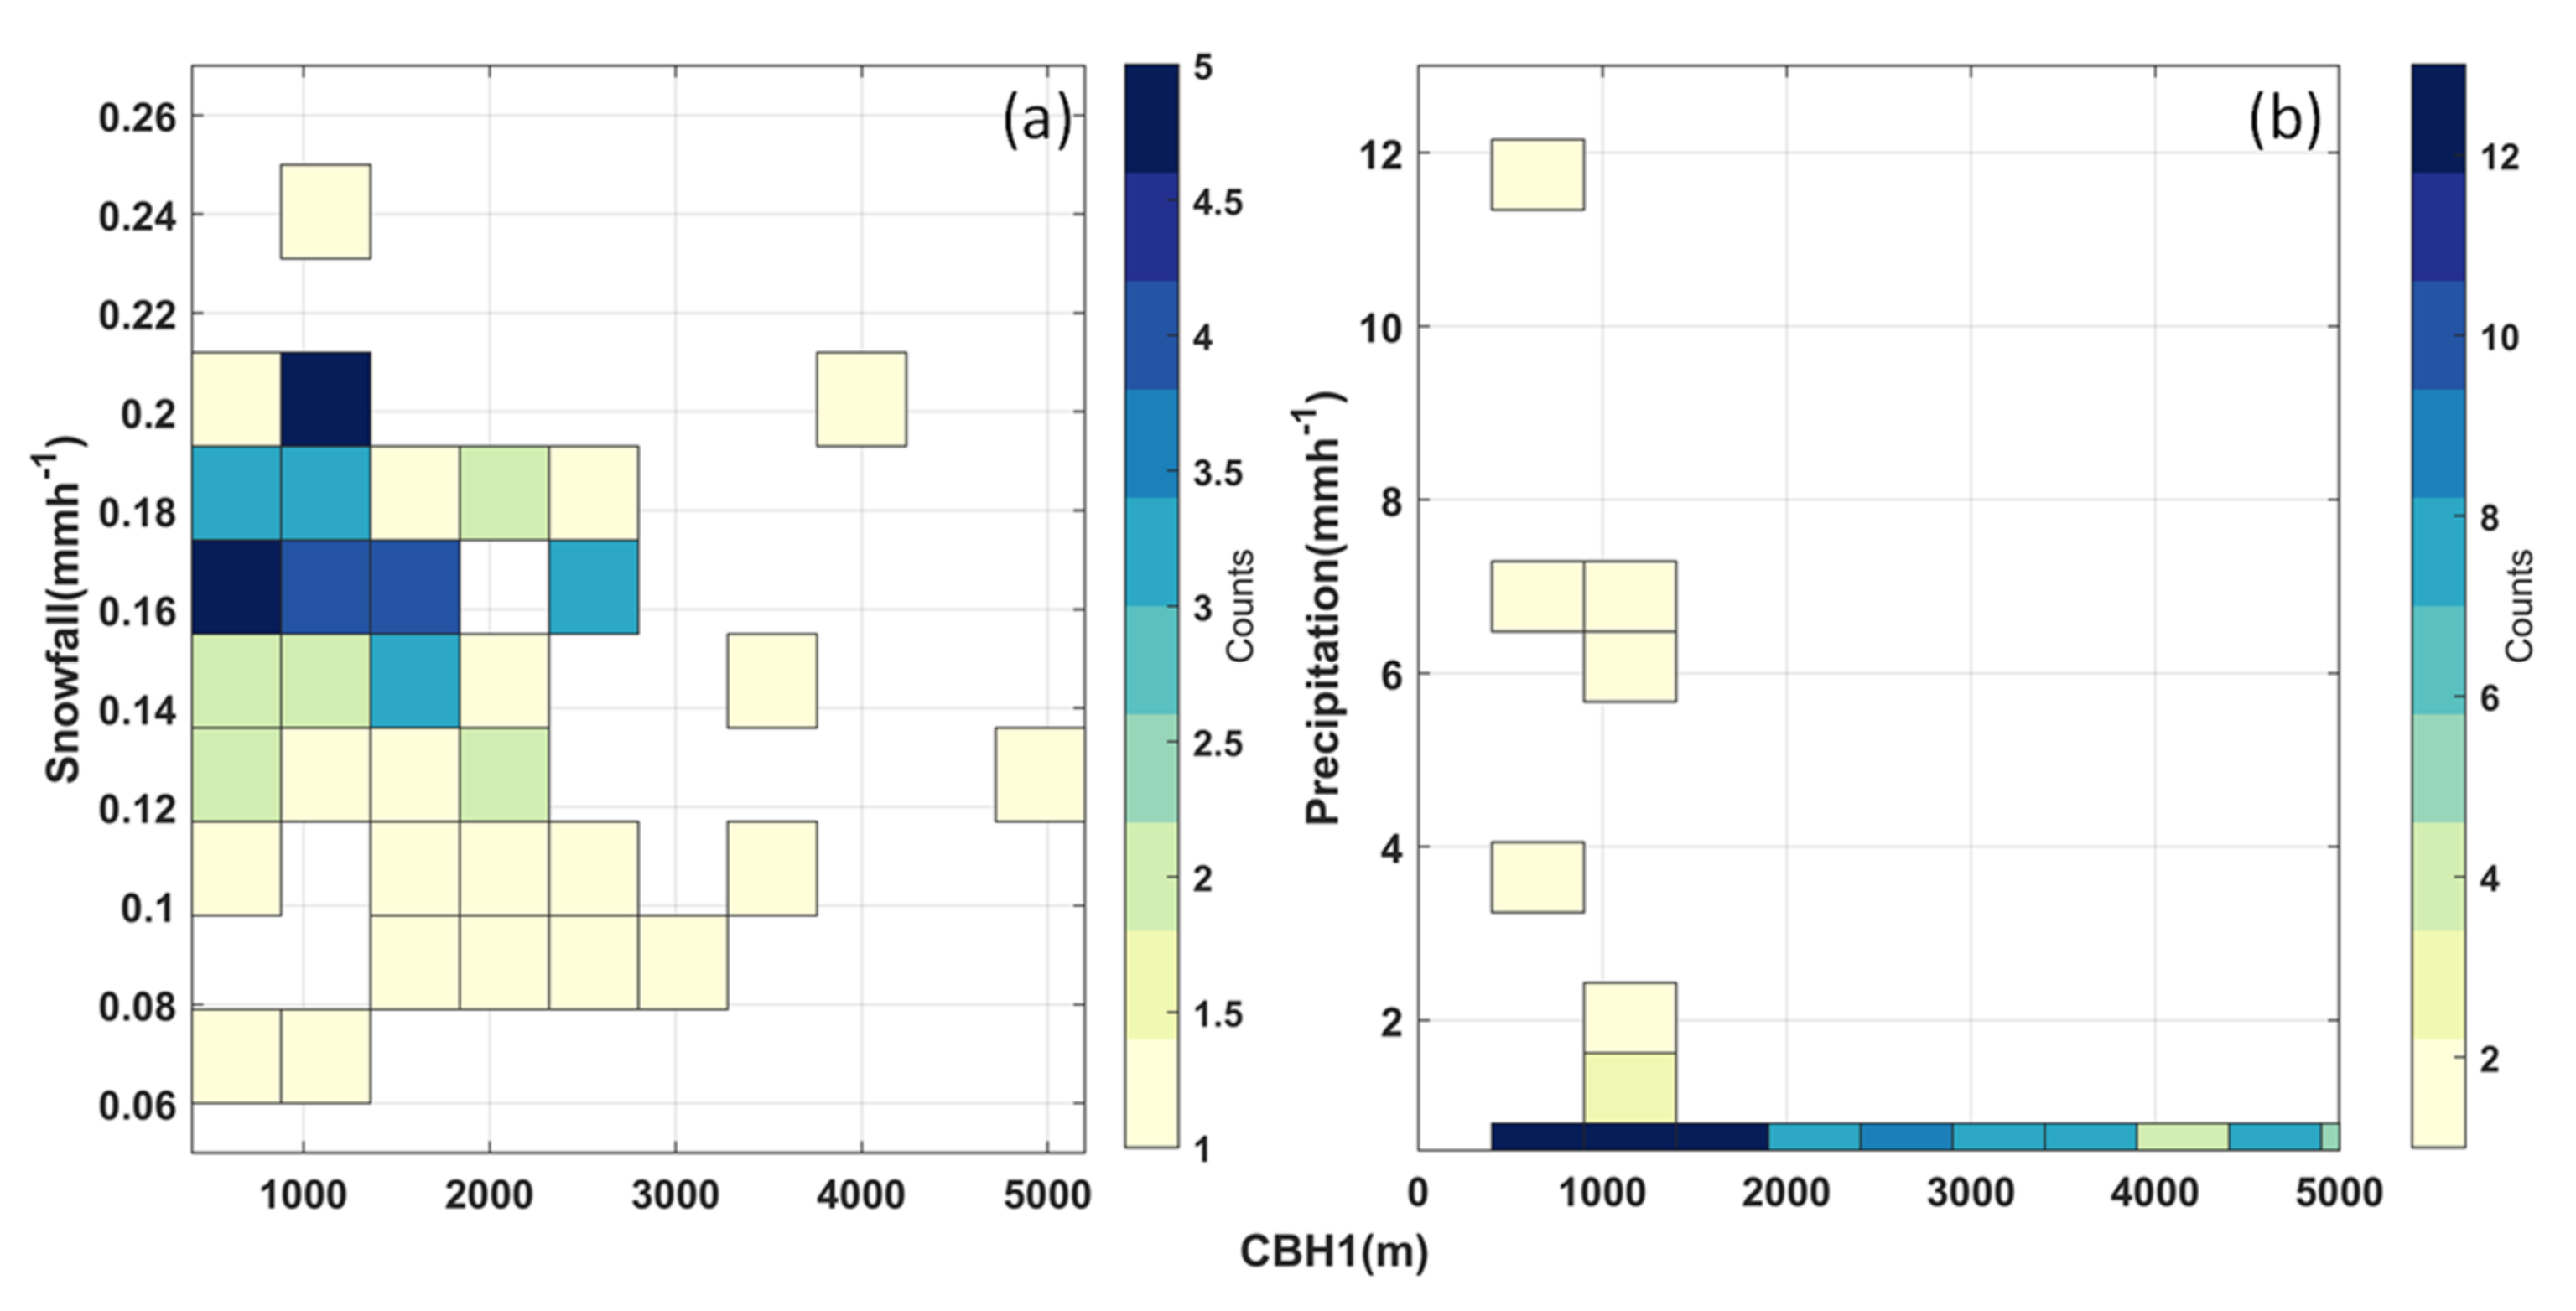
3.4. Cloud Base Heights and Precipitation Relationships

The precipitation occurs in both solid and liquid forms over Ny-Ålesund. To understand the relationship between cloud heights and precipitation, we investigated the radar reflectivity between December 2015 and May 2016, recorded the study location. Note that the MRR2 retrieved precipitation and snow rates are directly proportional to the radar reflectivity [46]. The daily average CBHs are depicted over the radar reflectivity (at 200 m, the third vertical layer of MRR2 measurements are used as lower layers could potentially have large noise) for the same period. Note that the events are highlighted (colour shaded in Figure 8), where daily reflectivity is greater than 1 dBz. Few events are also observed with a reflectivity higher than 5 dBz. Those events are mostly associated with the days of moderate to heavy precipitations at the study location. It is clear from the figure that all the highlighted precipitation events are associated with the first cloud base heights (CBH1), mostly less than 2000 m.
In addition to that, the second cloud base heights (CBH2) are also remarkably low for the precipitation events. Additionally, the absence of third cloud base heights (CBH3) is observed for heavy precipitation events in early spring (25 and 27th March 2016). These findings highlight the fact that the particular heavy precipitation events were associated with optically thick and low clouds. To investigate the relationship between precipitation and cloud base, we present the joint distributions of the CBH1 to the precipitation intensities in Figure 9.
The joint histogram plot (Figure 9) outlines the distributions of CBH1 and MRR2 precipitation (both liquid and snow) events during the above-mentioned period. It may be noted that the occurrence (counts) of base heights below 1500–2000 m are relatively larger. On the other hand, frequencies for cloud base heights of more than 4000 m are observed to a lesser extent. The finding signifies the dominance of low clouds and their relation with precipitation (liquid) and snowfall intensities over the study area for the discussed period.
The precipitation (liquid) intensities fall within the broad ranges (Figure 9b) with a maximum ~12 mmh−1. It is interesting to note that the moderate to heavy precipitation events (precipitation > 2 mmh−1) are remarkably falling in the region of lower CBH1. The snowfall intensity (Figure 9a) follows similar nature to that of liquid precipitation with maximum counts for CBH1 below 2000 m.

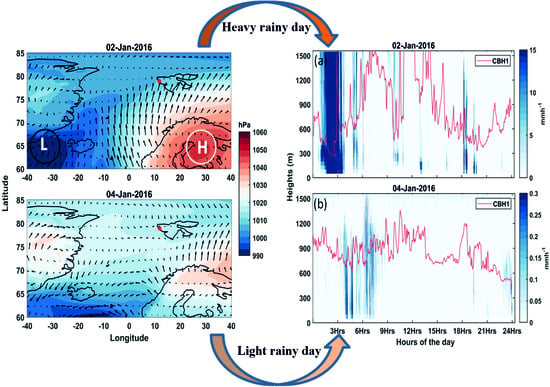
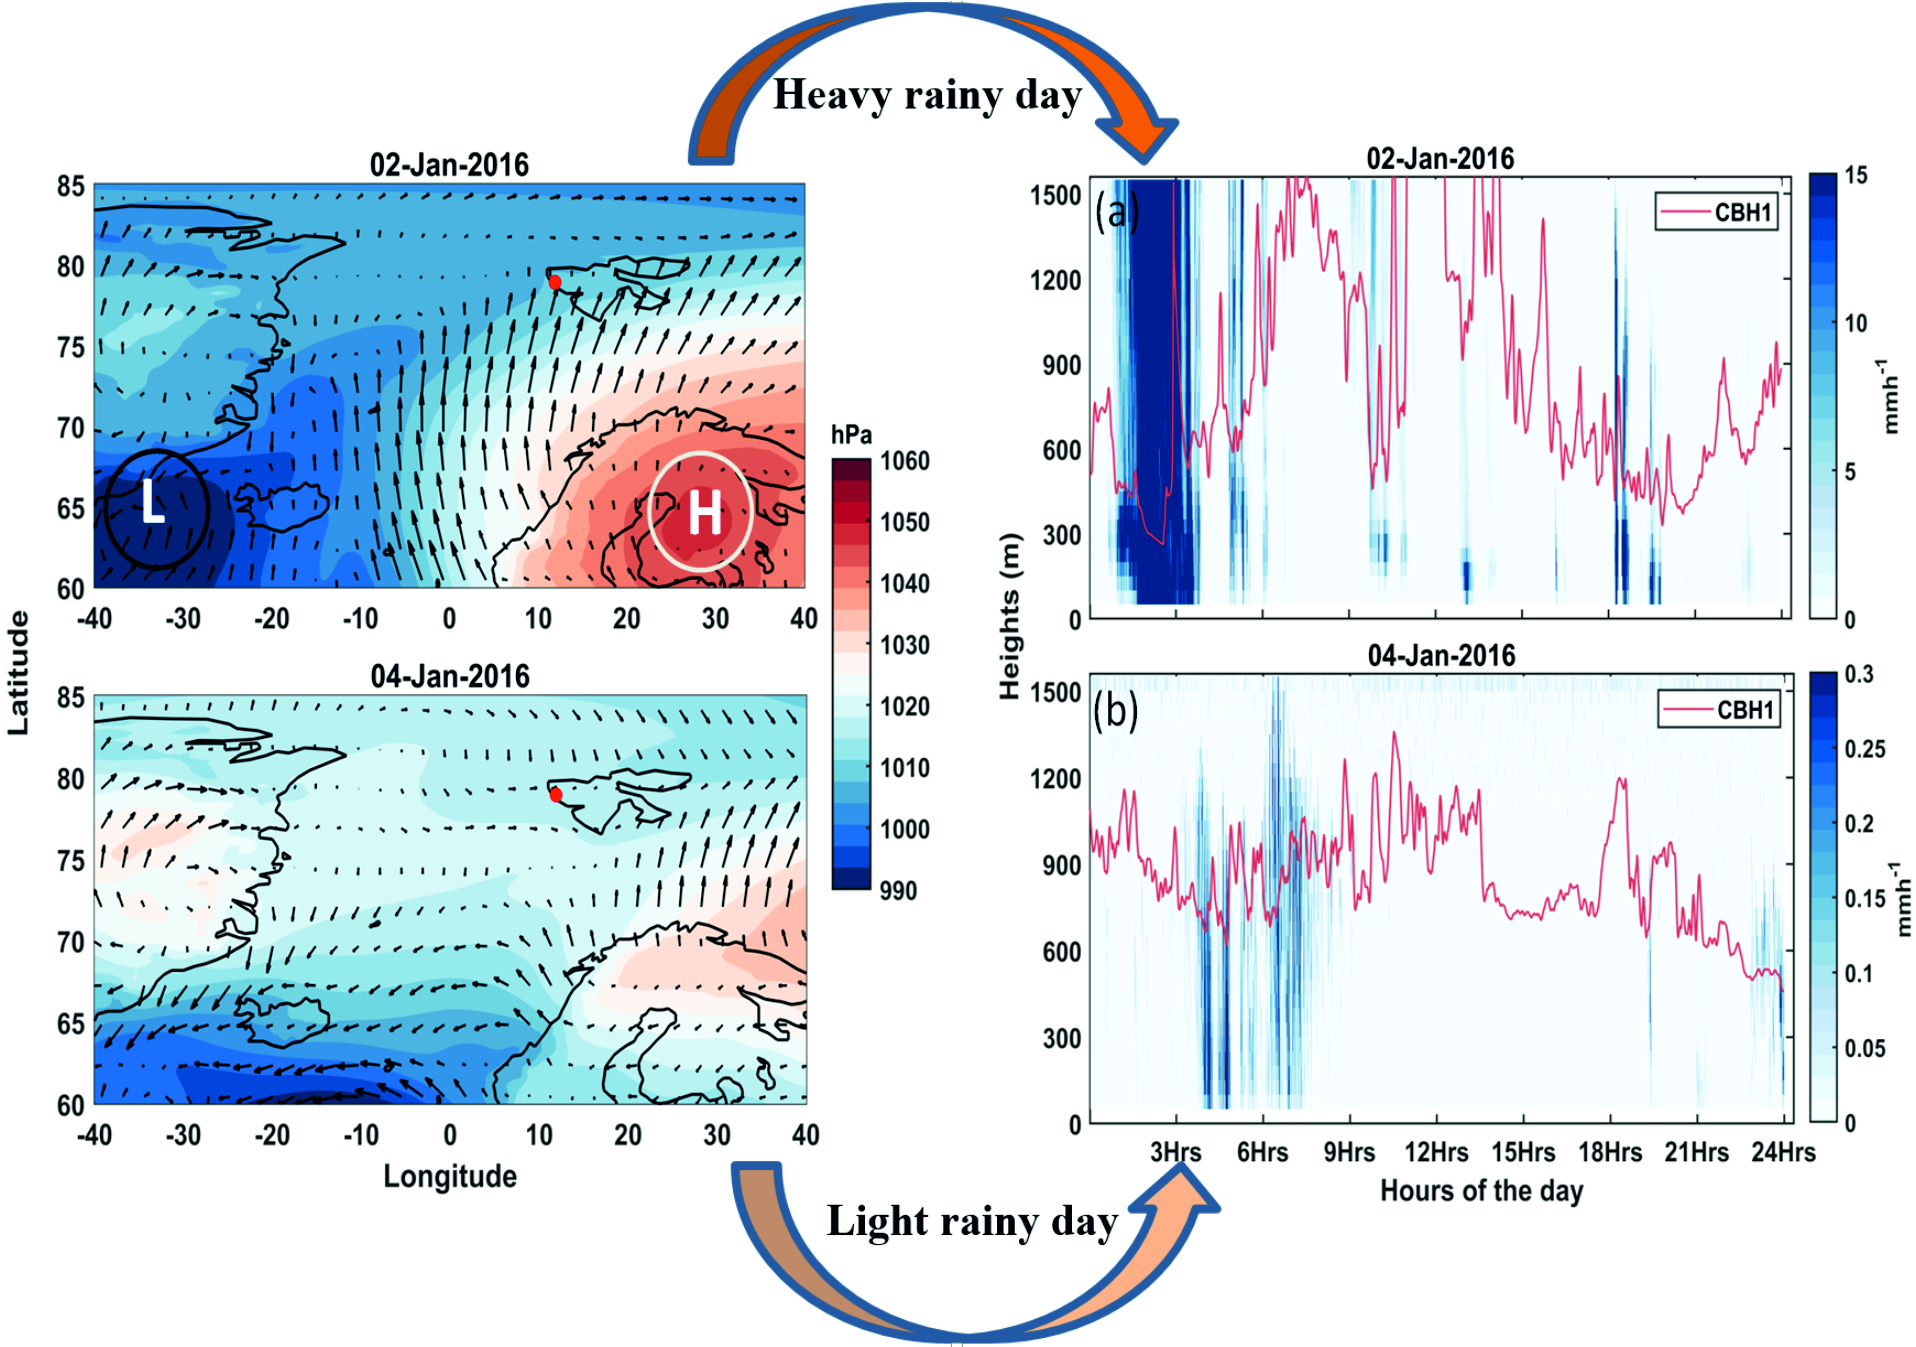
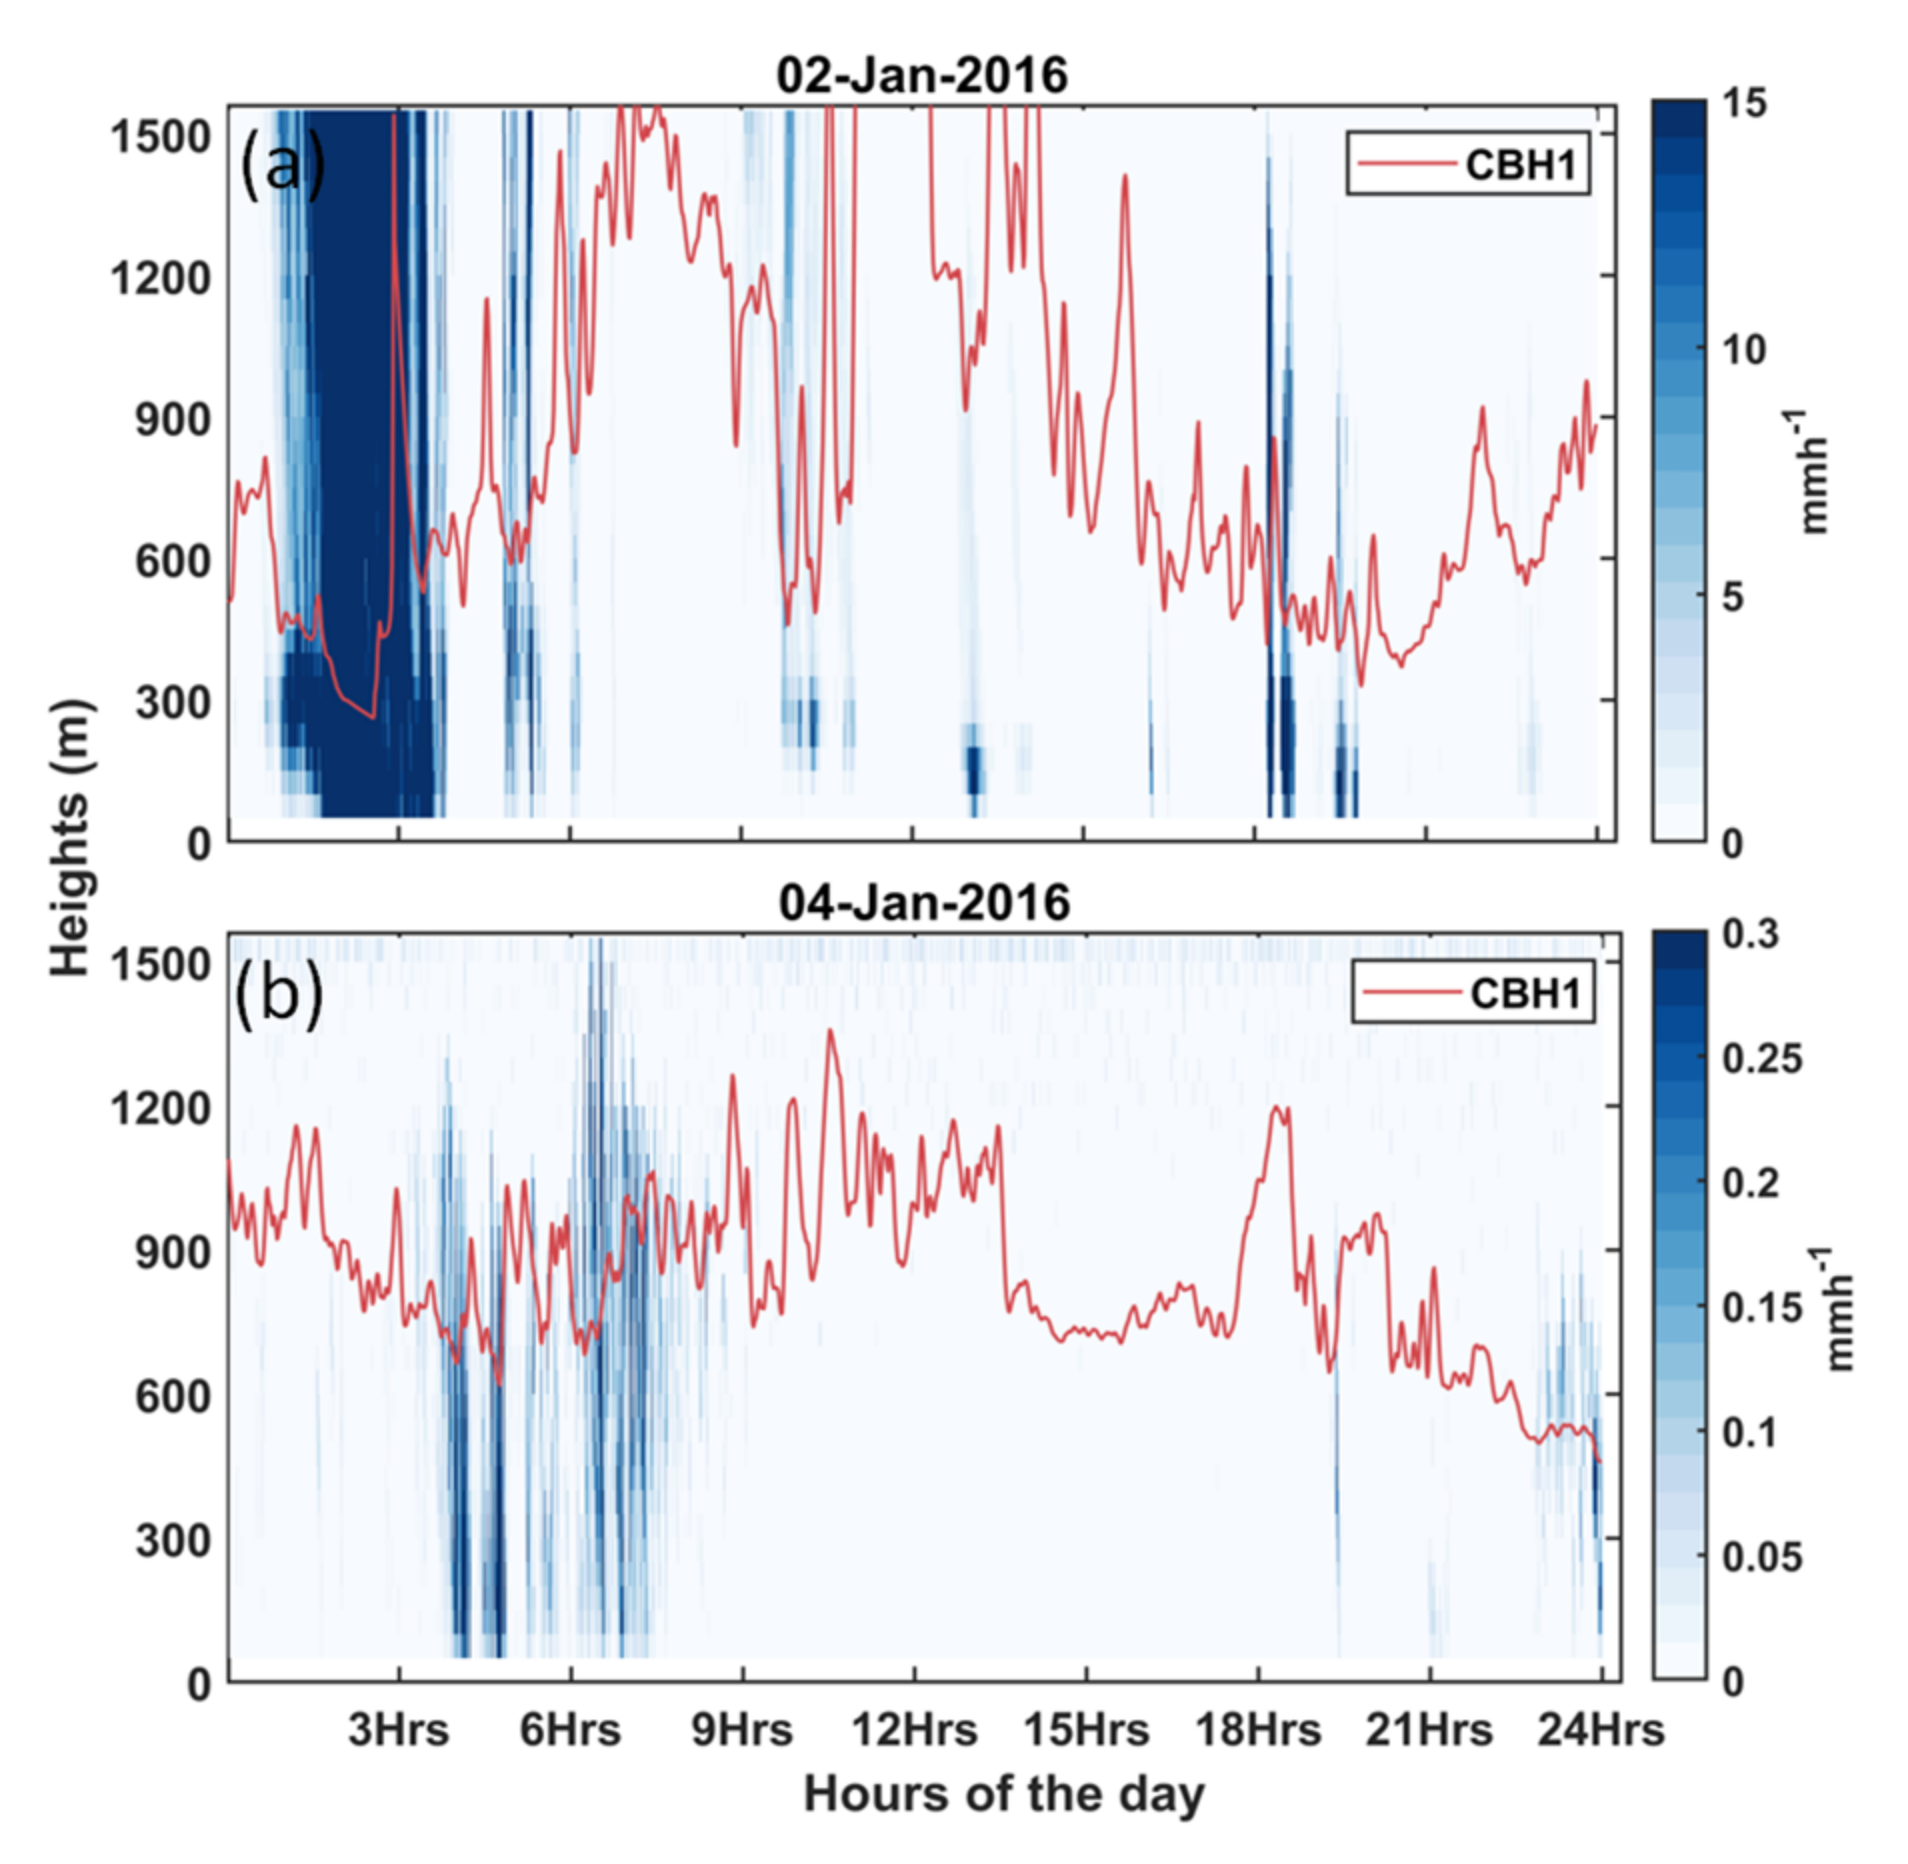
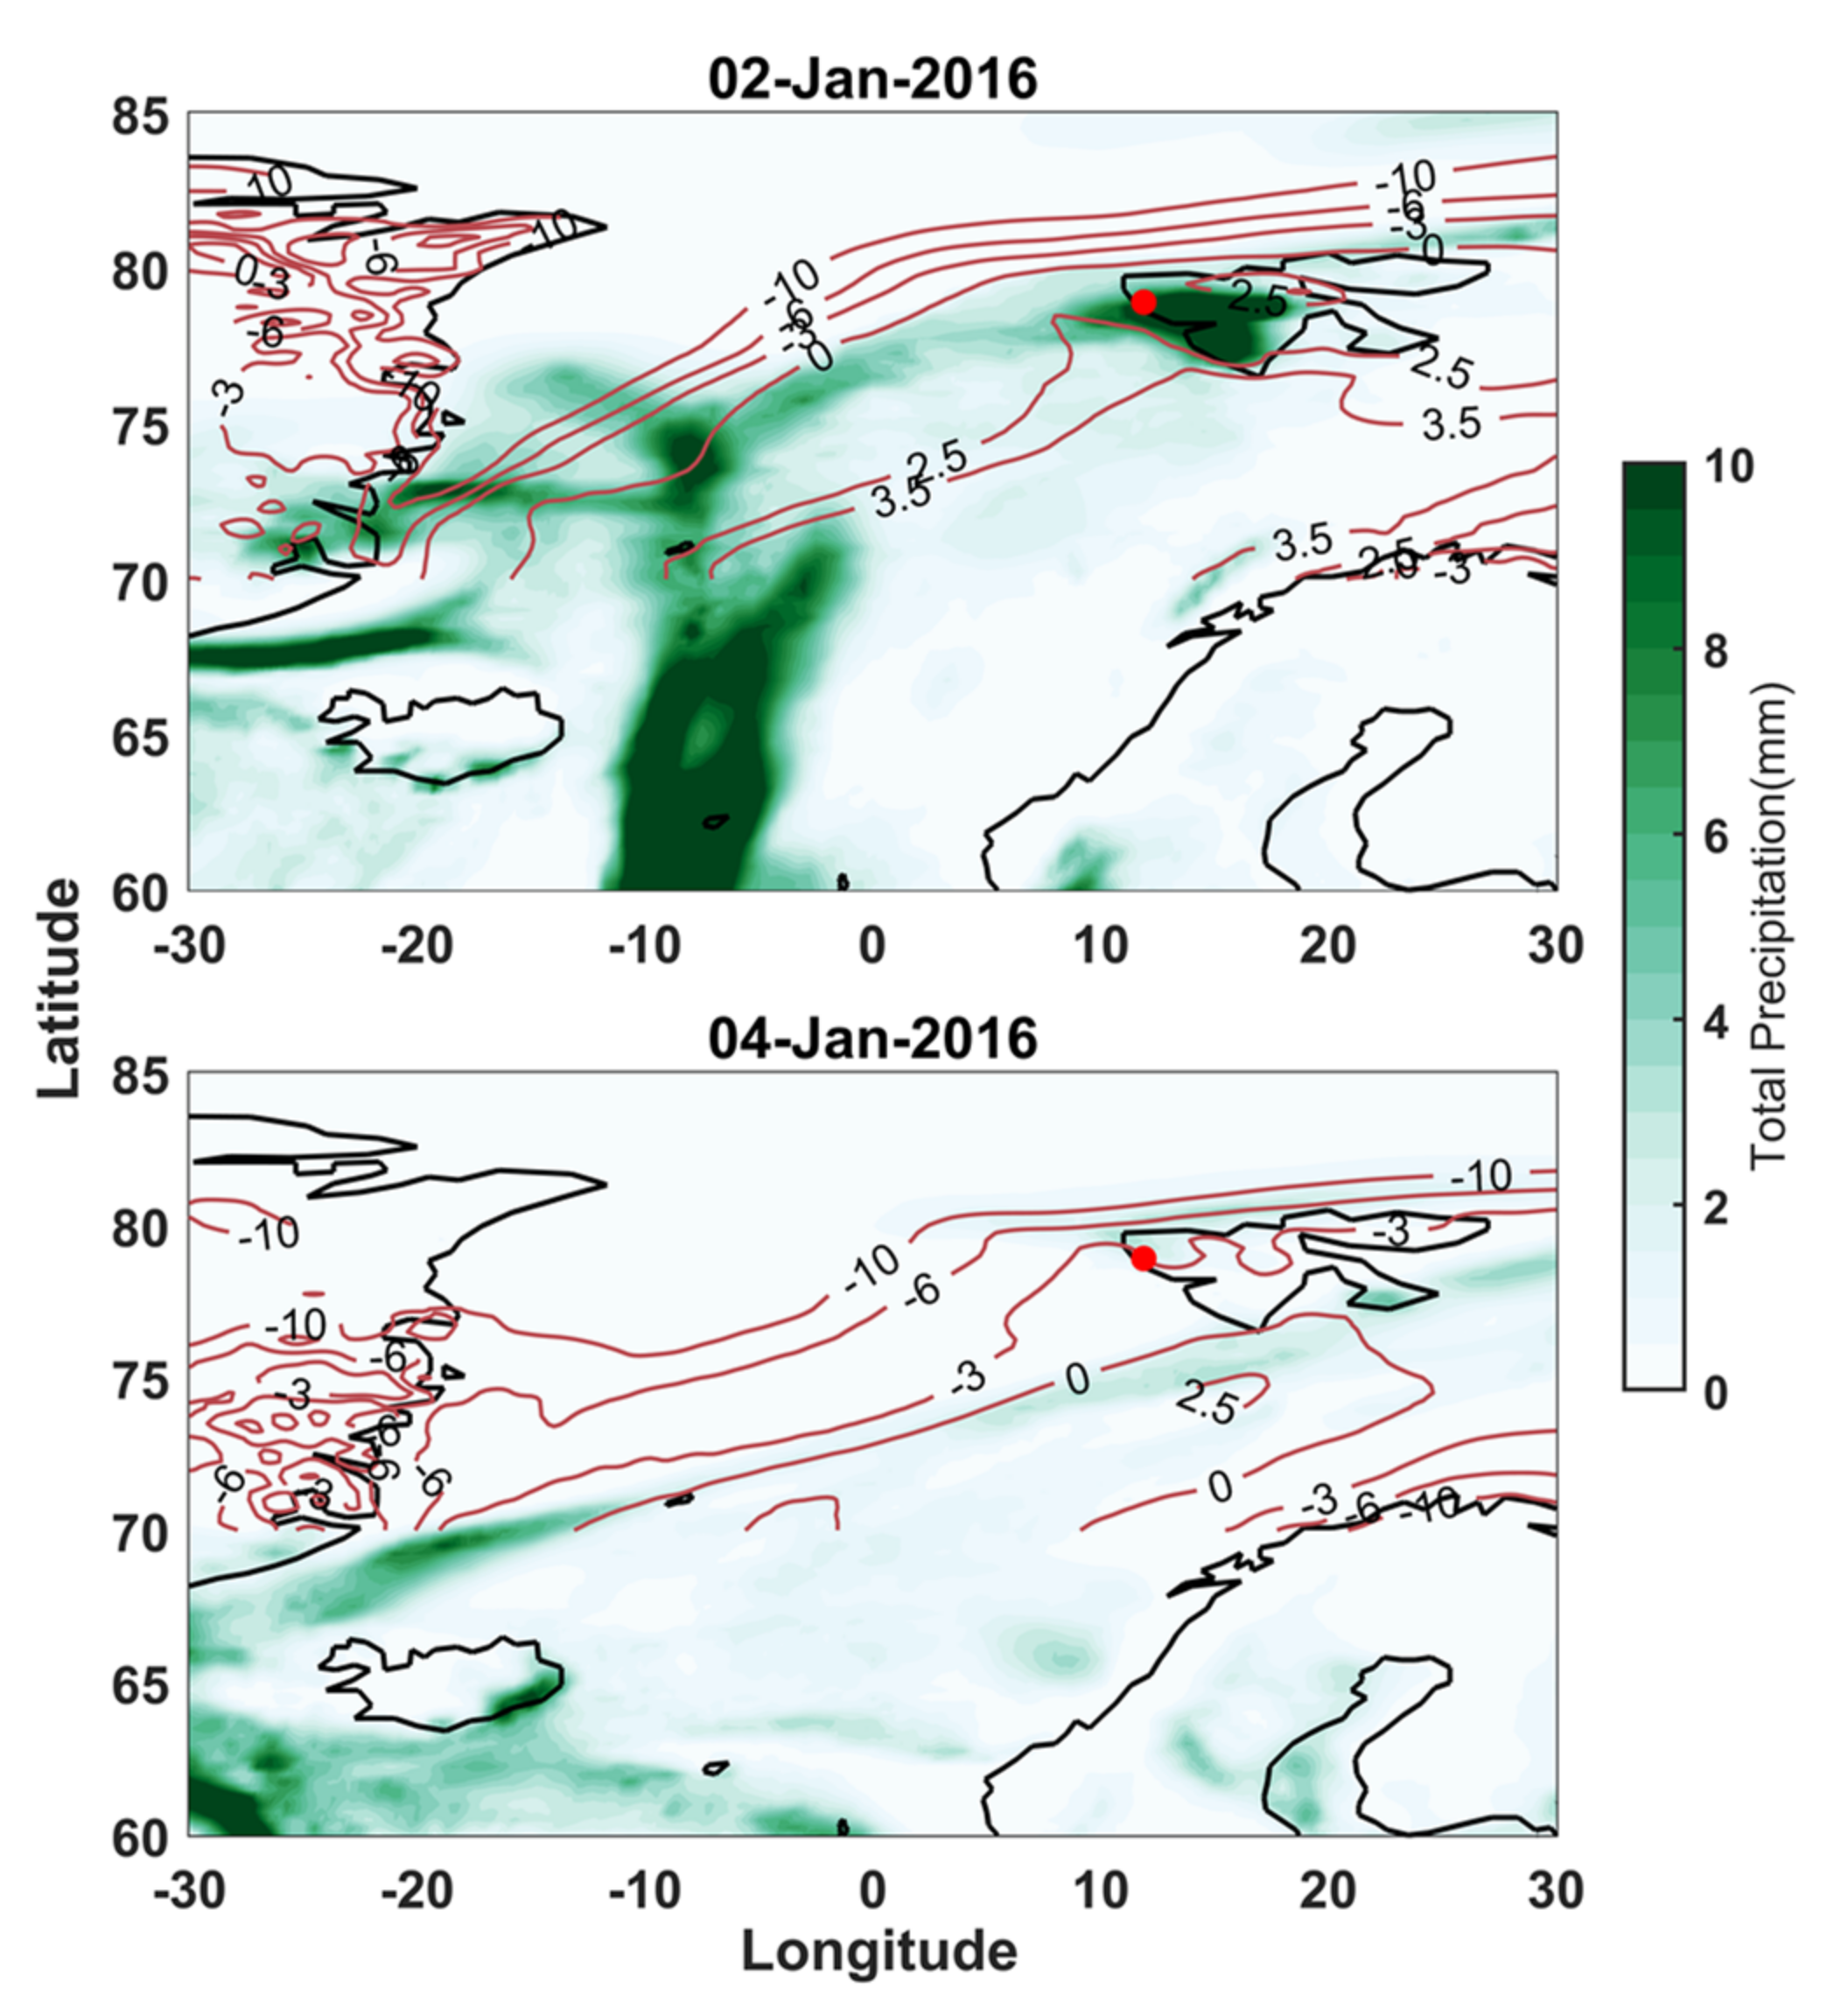
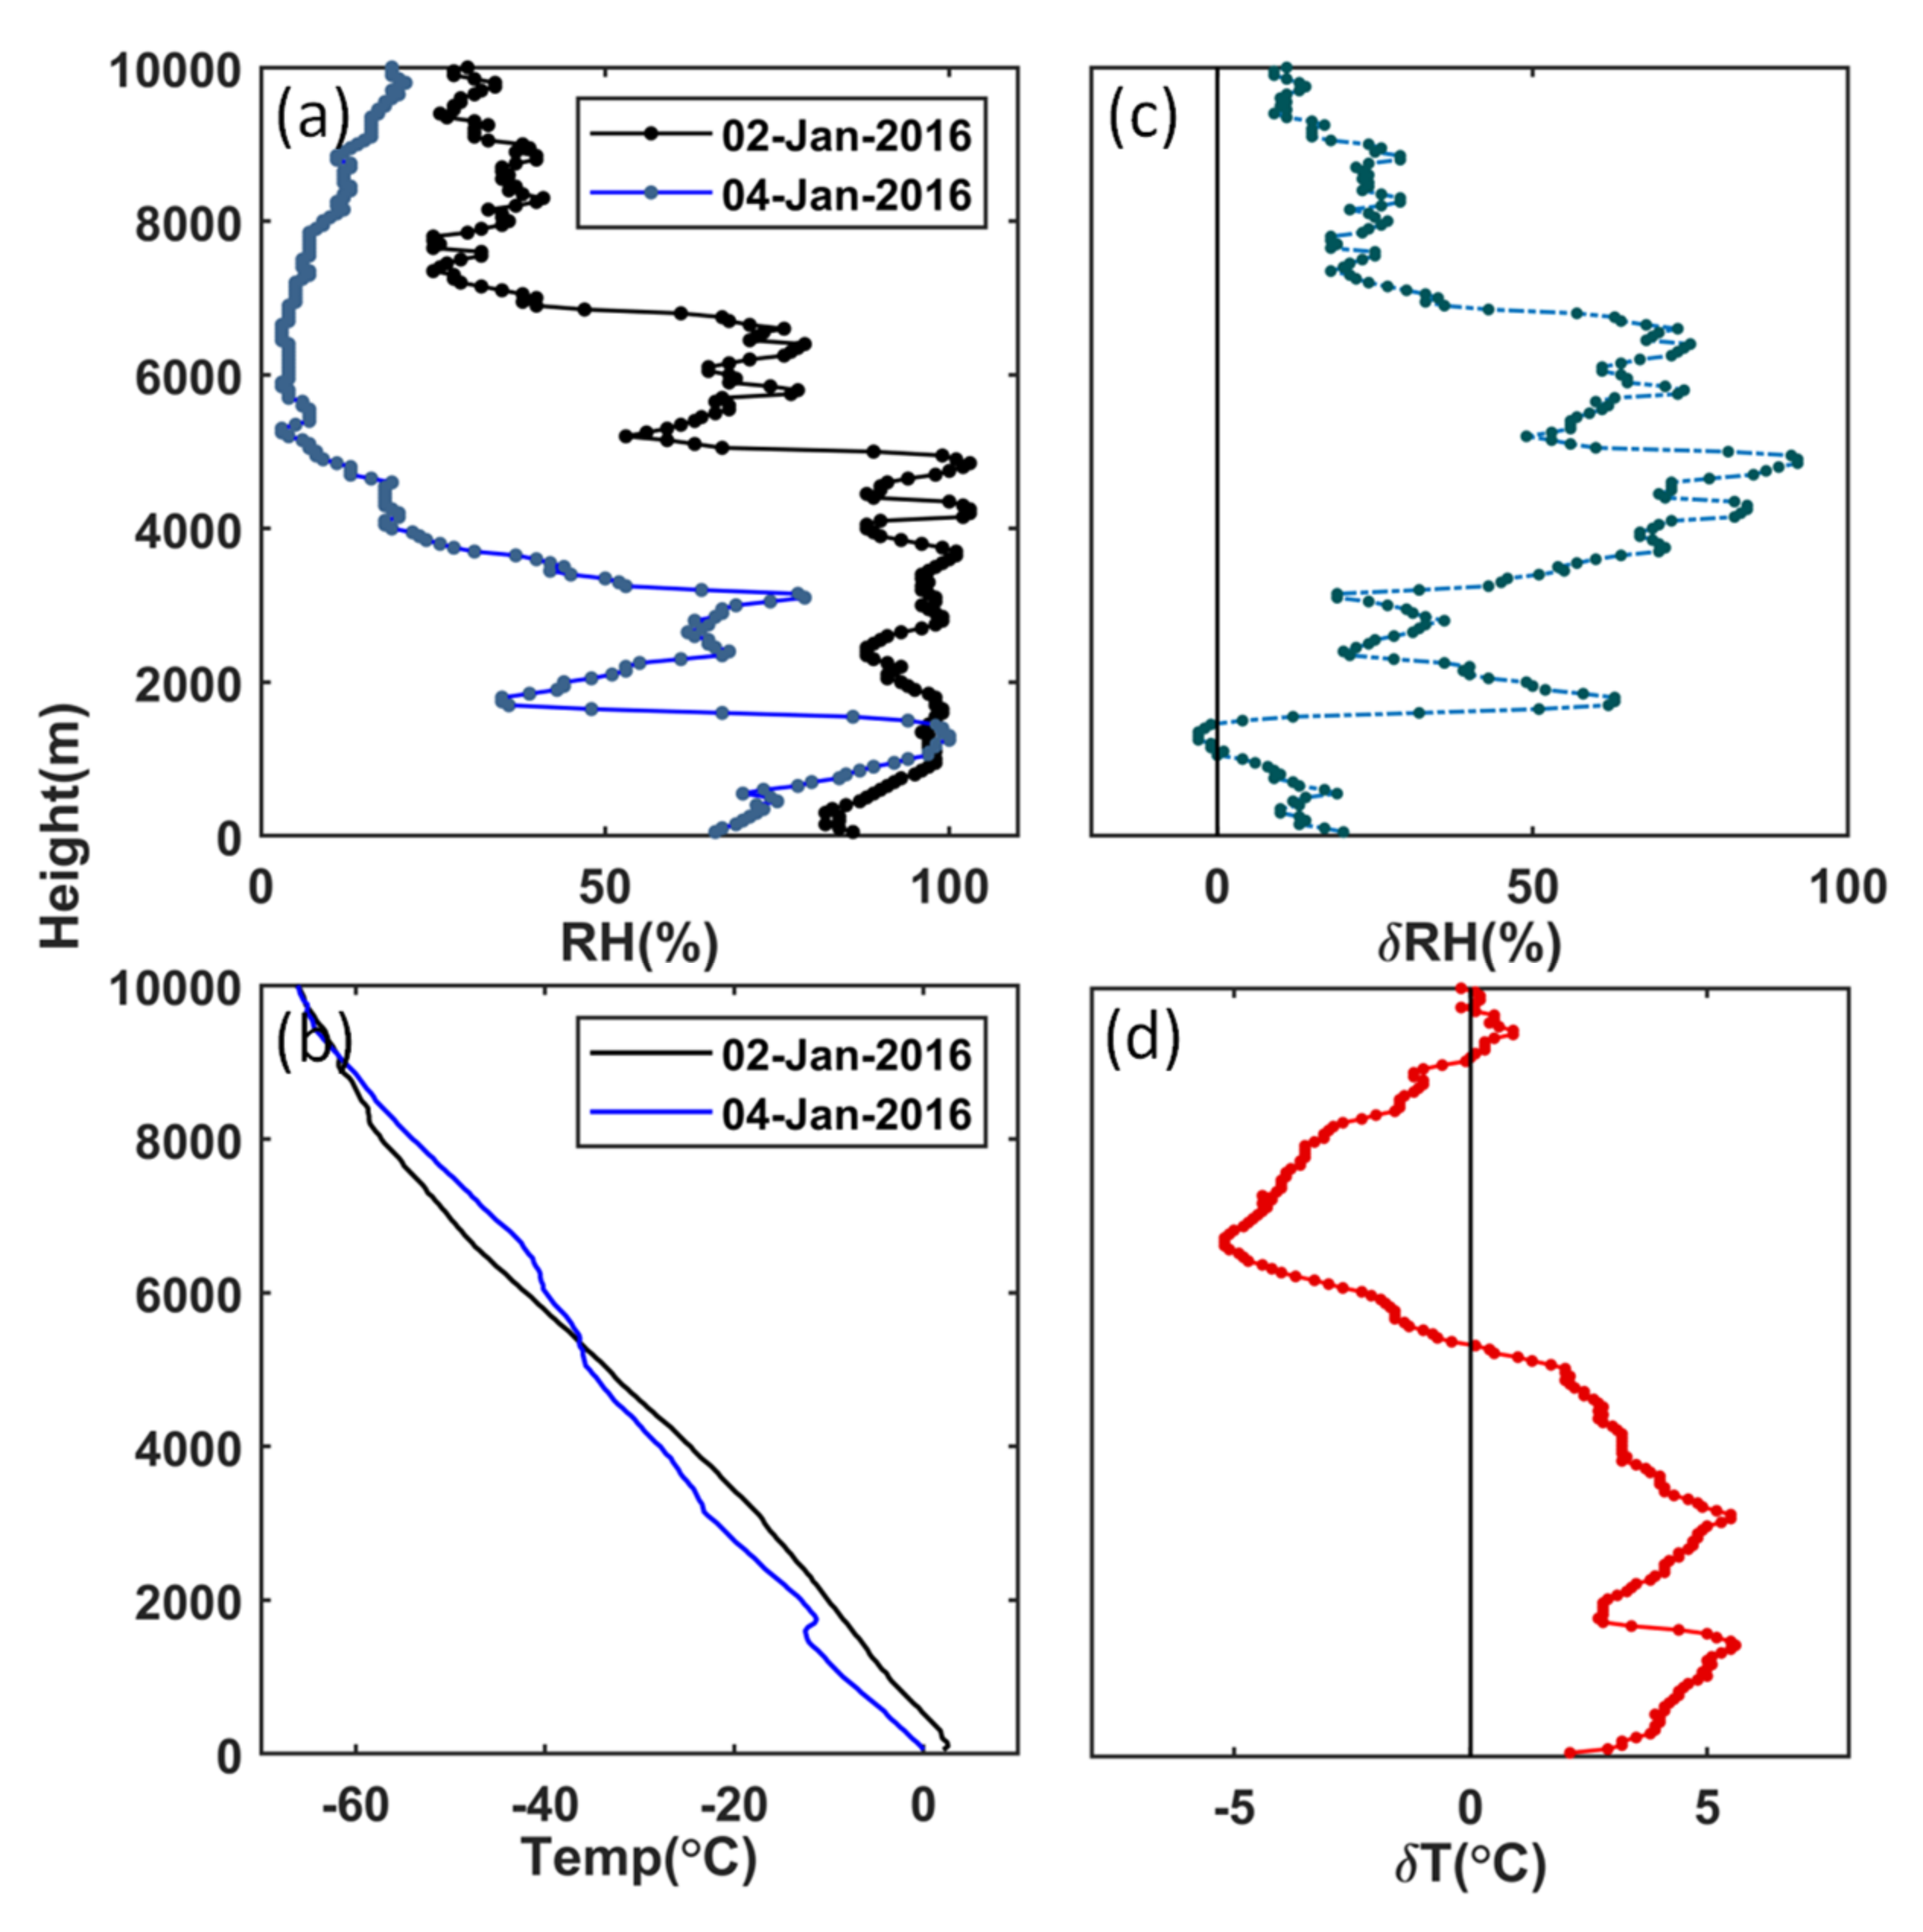
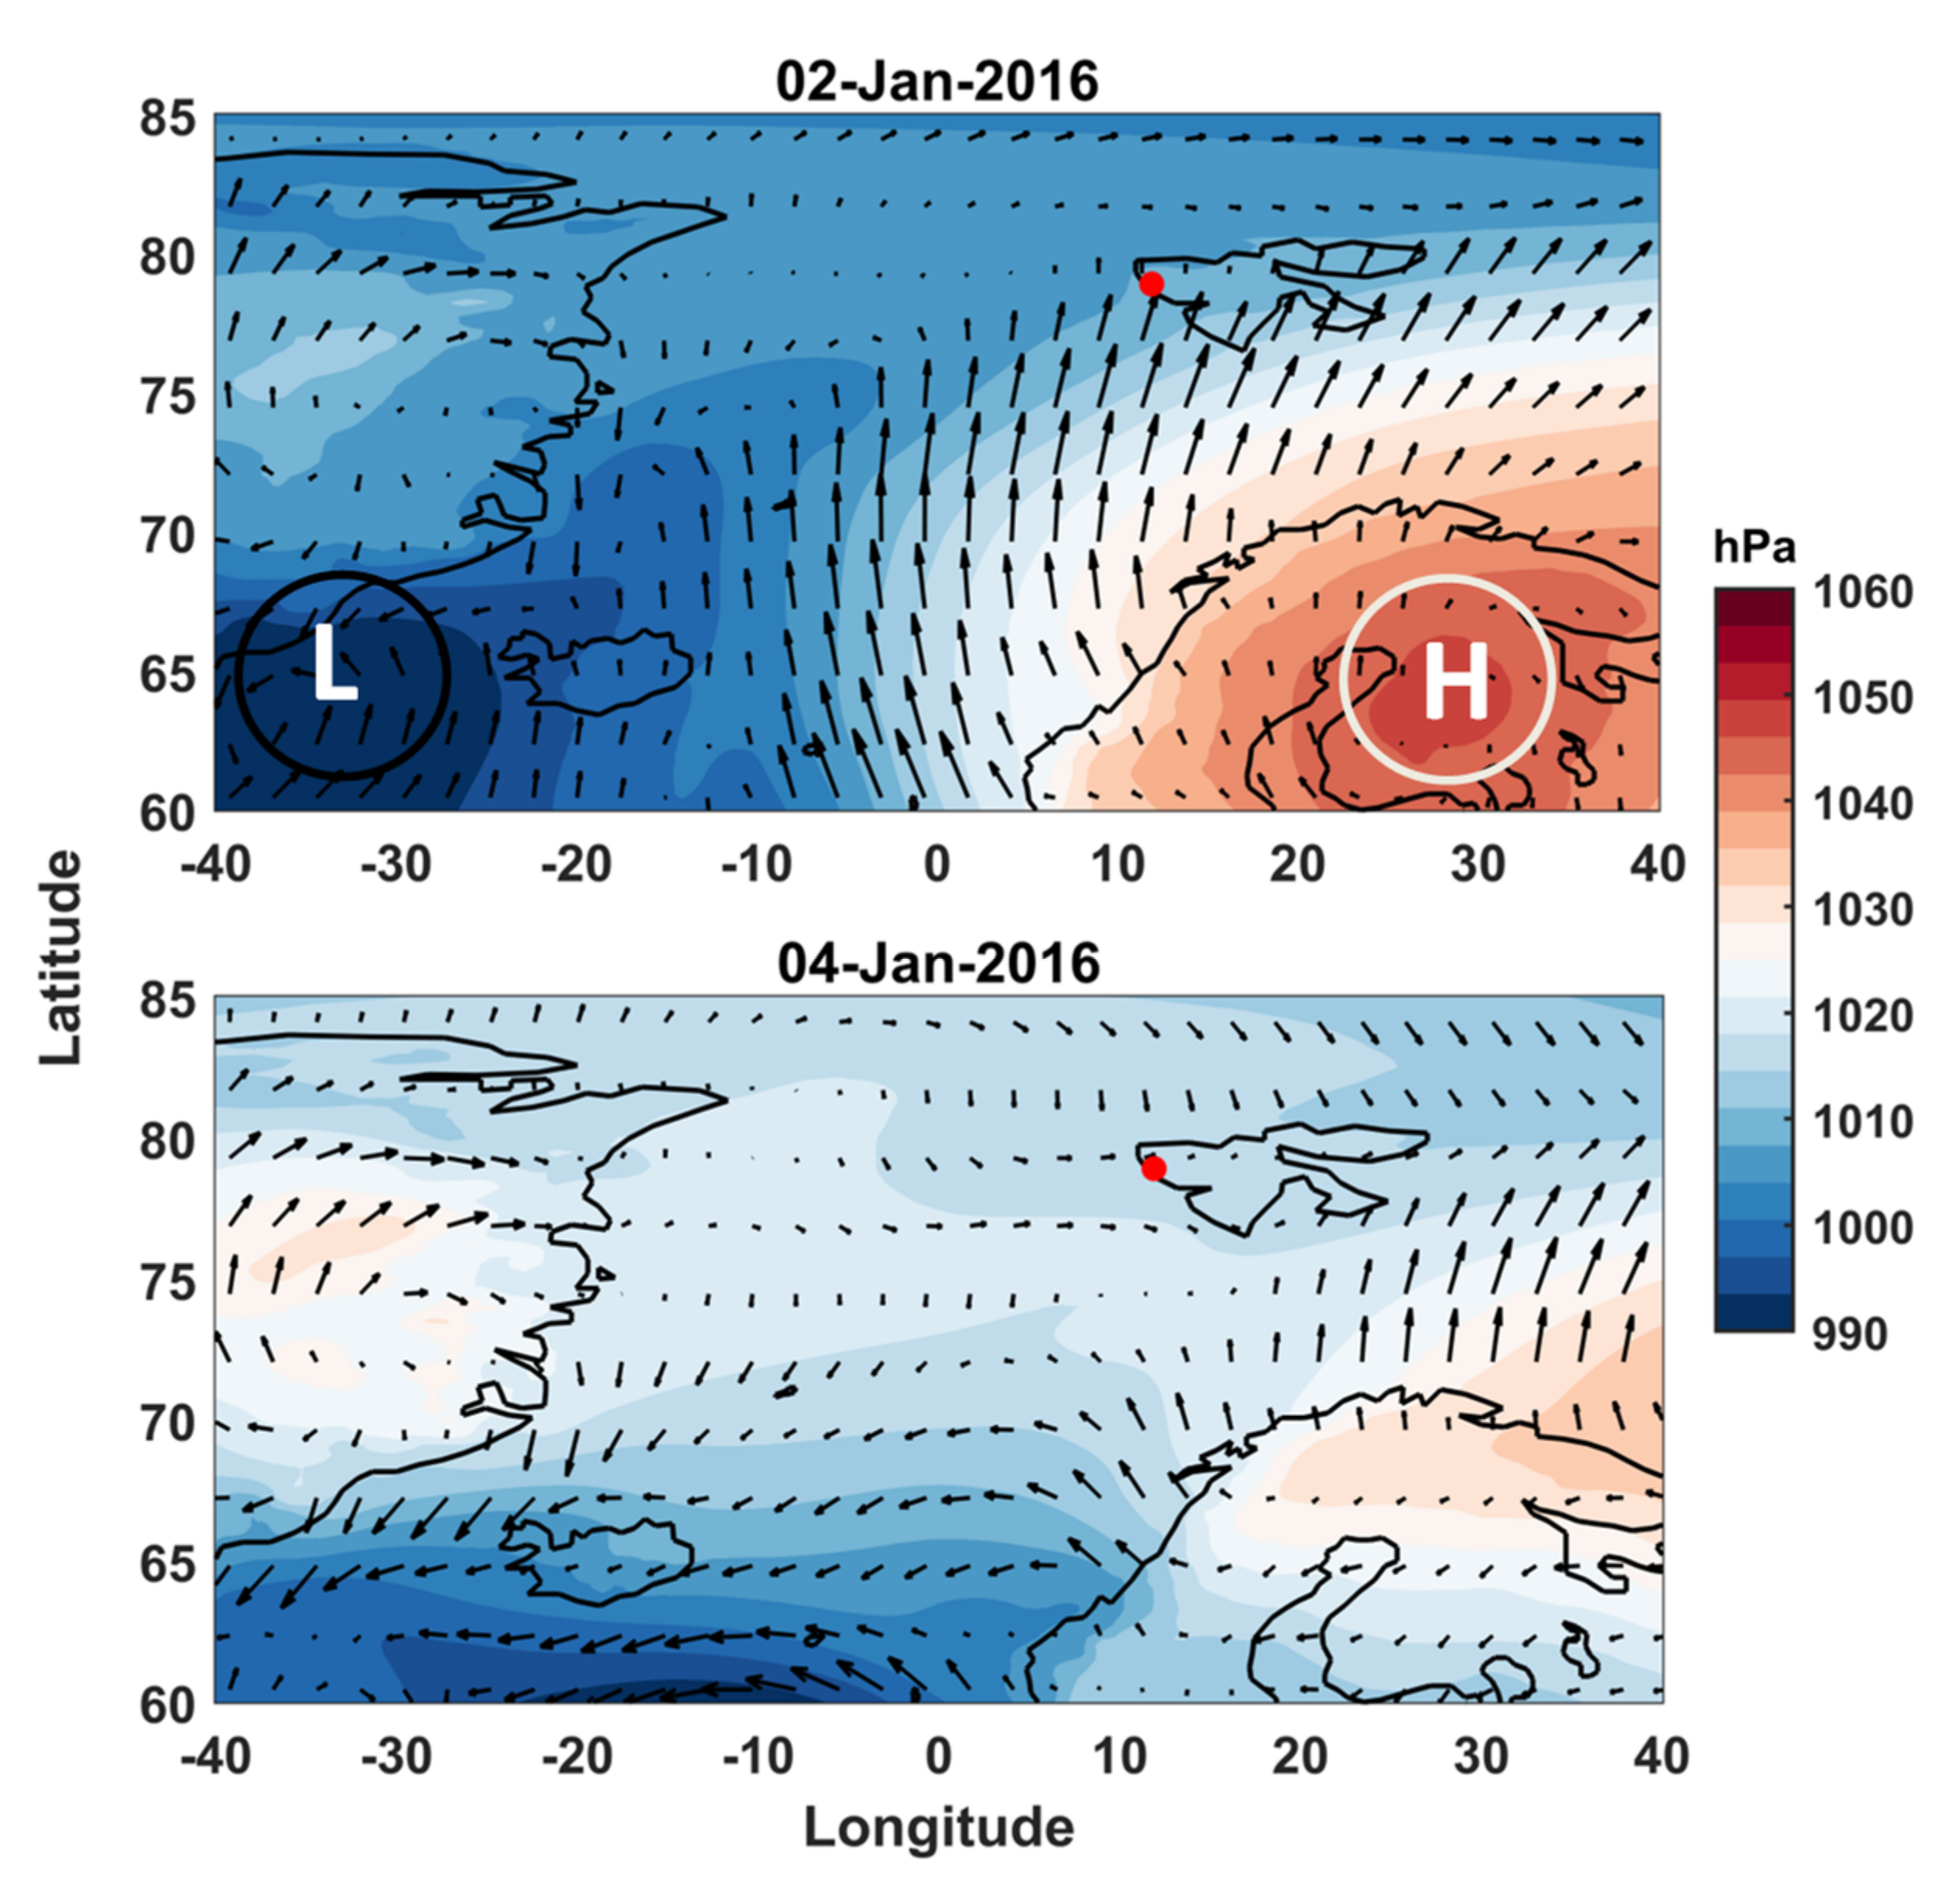
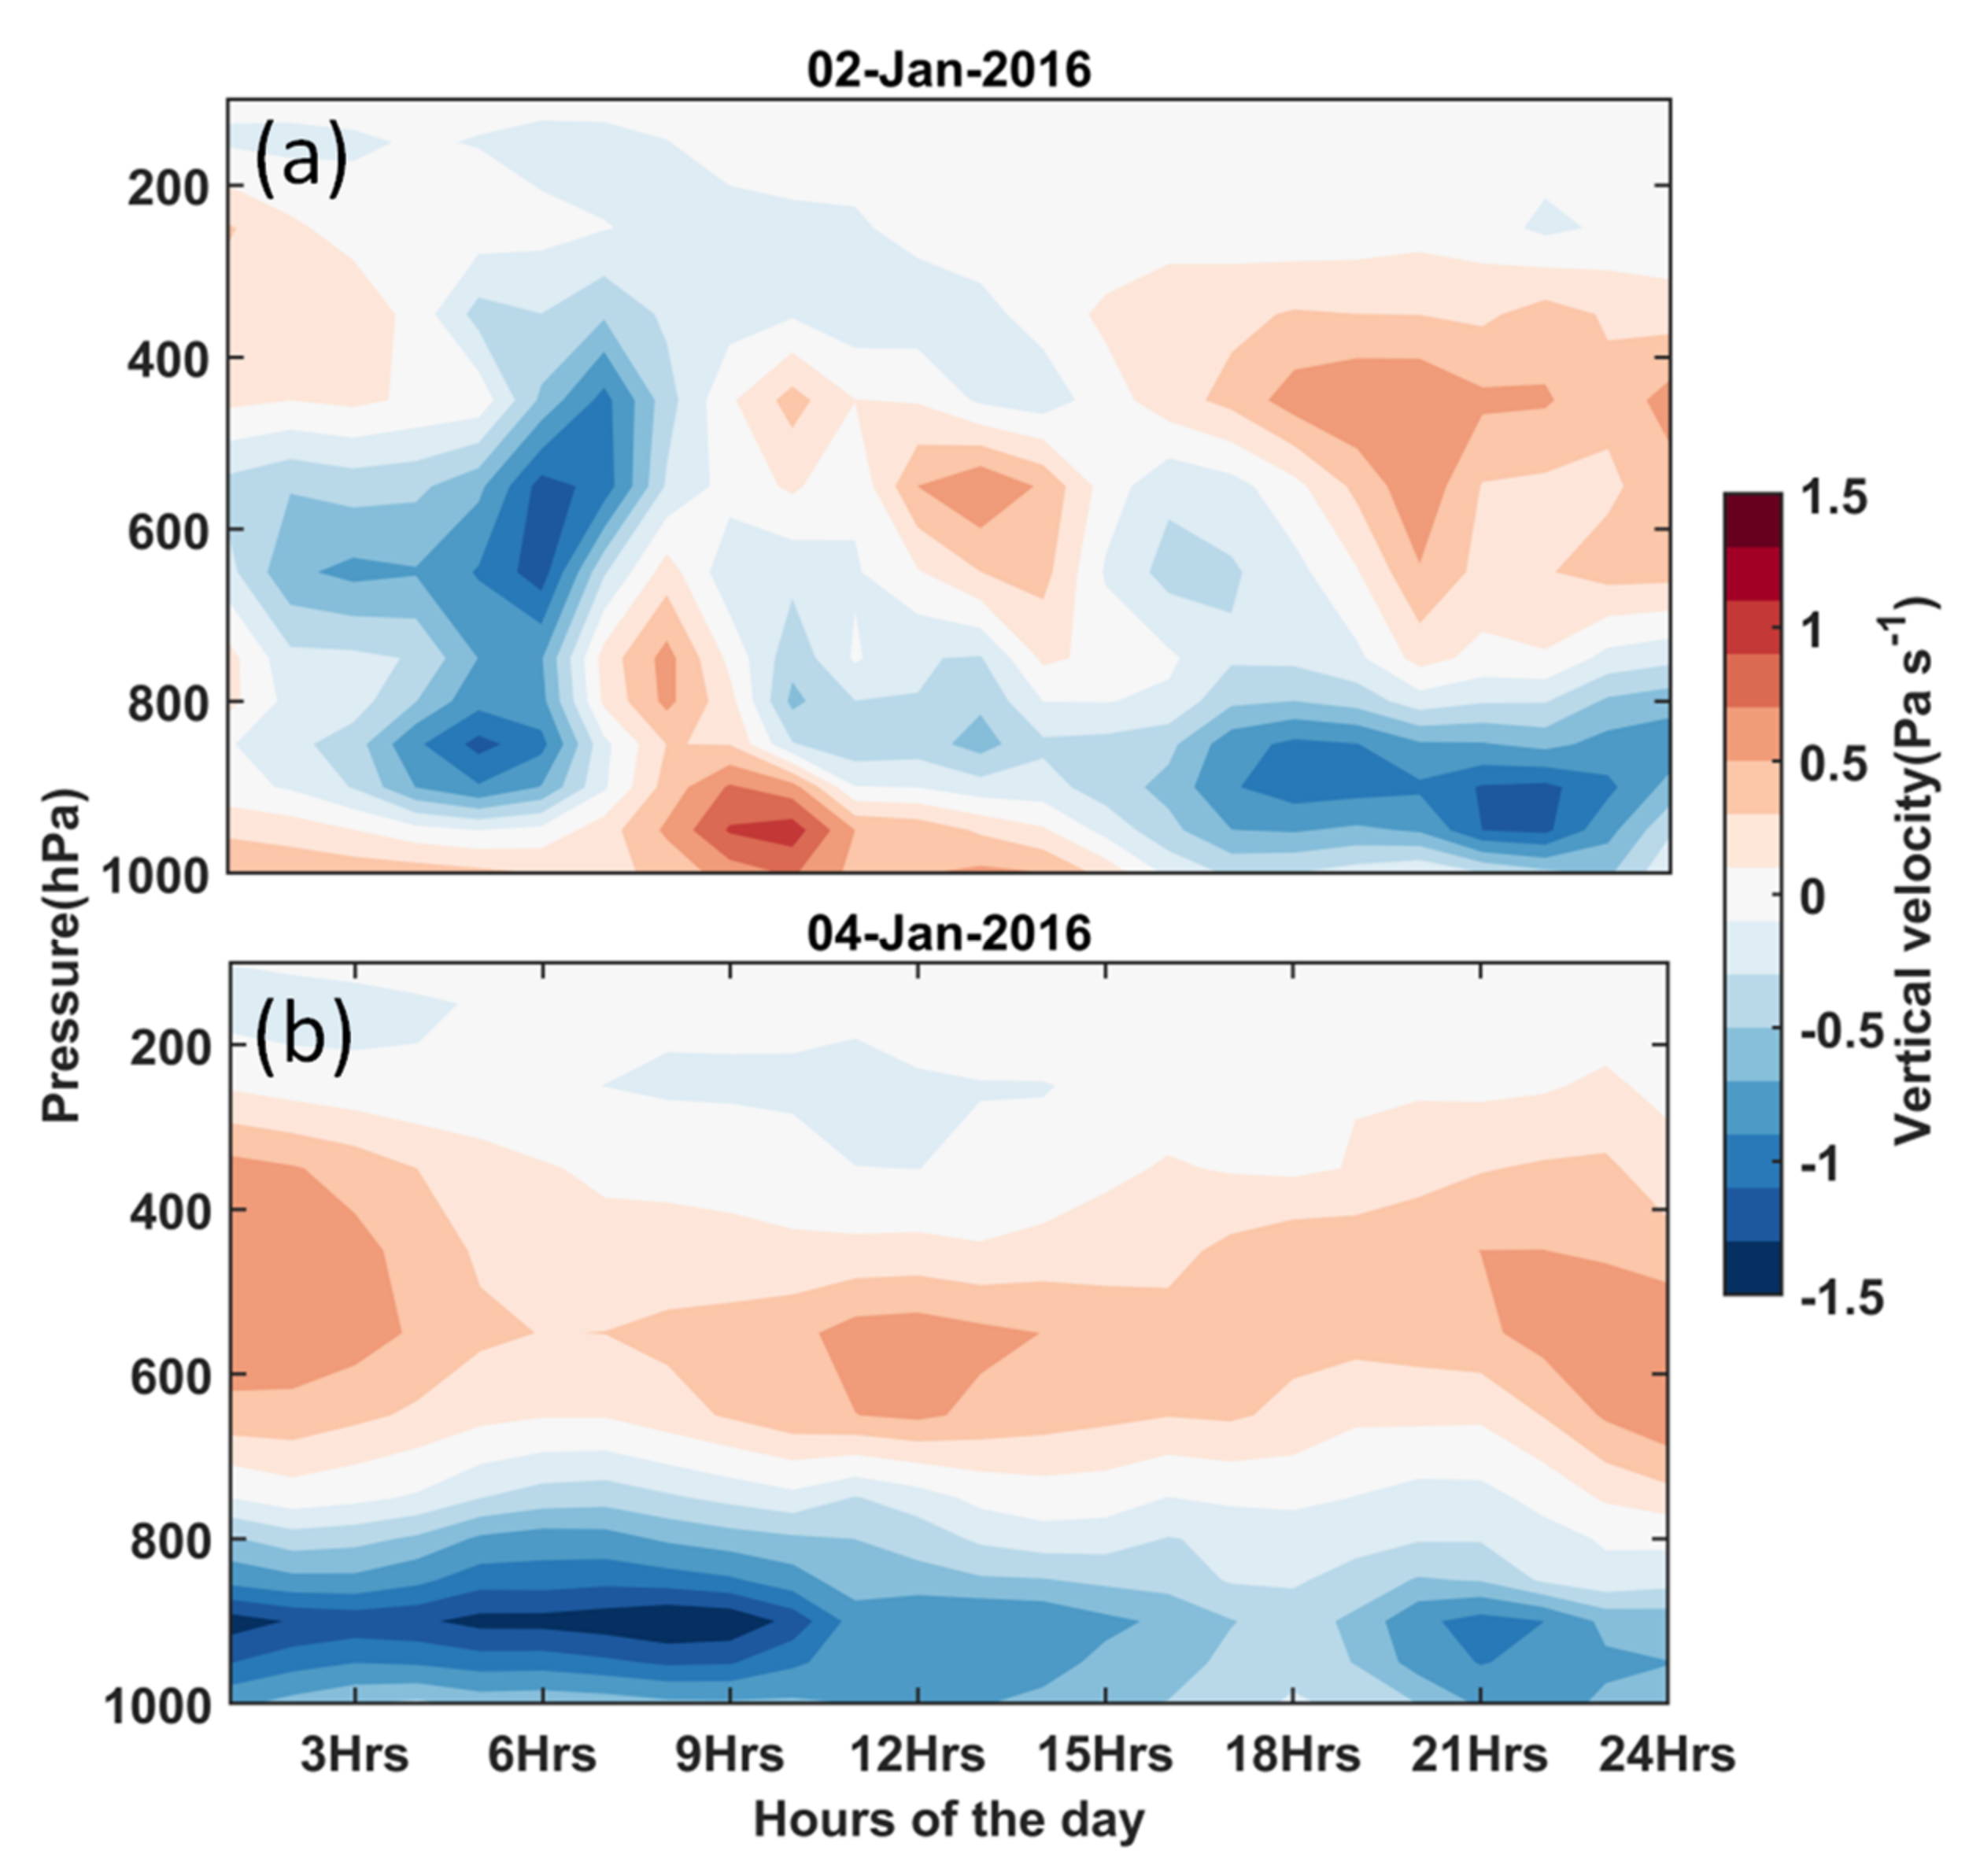
3.5. A Case Study of Two Contrasting Winter Precipitation Events

The CBH1 and precipitation datasets with high temporal resolution (1-min interval) are analyzed on two different days to investigate the relationship between the lowest cloud base height and precipitation. The top panel of Figure 10 depicts the precipitation from a comparatively heavy rainy day (2 January 2016), and the bottom panel shows precipitation for a light rainy day (4 January 2016).
The red line on both these panels represents CBH1 heights for the respective days. It may be noticed that there are clear updrafts and downdrafts (vertical movements) in CBH during pre and post-precipitation spells. Such height variations in cloud bases are observed both for heavy (top, Figure 10) and light precipitation intensities (bottom, Figure 10), however a maximum vertical movement in the CBH is seen for the former case. It may be noted that the CBHs are closer to the surface for higher precipitation intensities. On the other hand, the CBHs possess comparatively higher heights for moderate and no precipitation periods. These observations imply that stronger updrafts/downdrafts (turbulences) are associated with heavy precipitation events compared to moderate and light precipitation. Such results could directly be linked with meteorology and associated environmental conditions. Past studies point towards synoptic scale meteorology to play a significant role in the cloud variabilities [56] and precipitation [57] over regions of the Arctic and Svalbard. The recent findings [27] show the variations in winter CBHs over Ny Ålesund as a response to cyclonic/frontal activities due to advection of warm air and longwave induced local warming (due to cloud radiative forcing). Therefore, the possible roles of meteorological conditions to the observed cloud/precipitation variabilities in this study are investigated and outlined in the subsequent section.

3.6. Roles of Meteorological Conditions

The Surface temperatures (as contours) are overlaid on the top of total accumulated precipitation (Figure 11) for those two different rainfall events, as explained in the previous section. The magnitudes of reanalysis-based precipitation also support the occurrence of heavy rain during 2 January 2016 (heavy rainy day in MRR data) over the Ny-Ålesund and adjacent oceanic regions. Interestingly, the surface temperature was relatively warmer (~2.5 °C) over the station during the heavy rainy day.
A strong north–south temperature gradient (top panel, Figure 11) was observed during the heavy rainy day, which points towards the presence of frontal system/activity. On the other hand, the temperature was reduced by more than 5 °C within the two days and was ~−3 °C over the station location during 4 January 2016 (light rainy day), followed by more negative temperature contours north and south to the observation site. Such sudden changes in local weather within short periods could be a response to the synoptic-scale weather system.
The radiosonde profiles in Figure 12 delineate the contrasting vertical profiles of temperature and relative humidity in the atmospheric column for those two rainy events. The heavy rainy day witnessed relatively higher relative humidity values from the surface to mid-troposphere, whereas the atmosphere was relatively drier during the less rainy day. The difference between column relative humilities (Figure 12c) is quite large (~40%) for the heavy rainy day compared to the light rainy day. Additionally, the temperature differences are even noticeably high (>3–5 °C). However, the temperature difference (negative) in the upper troposphere suggests strong mid-tropospheric warming for the less rainy day. Note that the relative humidity is a function of actual water vapour, temperature and barometric pressure. Hence, observed changes in the RH, rainfall and could be possibly due to the combined effects change in the meteorological parameters.
The surface pressure and circulation pattern are analyzed and shown in Figure 13. The results provide evidence that the rainfall during the heavy rainy day was more likely a response to circulation changes.
The synoptic circulation pattern during 2 January 2016 shows a dipolar pressure pattern (High over regions of Europe and low over the coast of Greenland). Moreover, an extended low-pressure system was observed over large areas of the North Atlantic, including Svalbard. Such patterns favoured south-easterly winds to blow from lower latitudes (overlaid in Figure 13). These warm, moisture-laden winds might have helped in the development of a warm front, followed by heavy precipitation. On the contrary, the dipole pattern diminished within a day and the station location witnessed moderately higher pressure. The winds during the less rainy day were mostly dry and north-westerly, blowing from higher latitudes. These effects were also visible in surface and upper air temperature (Figure 11 and Figure 12) and relative humidity.
We further looked into the convective activities during these two contrasting rainfall events. The time height plot for pressure vertical velocities (Figure 14) shows substantial updrafts at the surface both for heavy and less rainy days.
Particularly during the heavy rainy day, the updrafts (negative vertical velocities) were predominant around 3–7 h and 18–24 h (Figure 14a).
In synoptic meteorology, the downdrafts dominate during precipitation, and updrafts take place mostly before or after a precipitation event. The MRR derived maximum rainfall (Figure 10 top panel) also coincides with the maximum downdraft of the heavy rainy day followed by moderate updraft. The vertical extent of pressure velocity is more profound in the atmospheric column during the heavy rainy day which supports the updraft/downdraft strength. The other favorable conditions (moisture-laden south-easterly winds and warm surface temperature, frontal system) could have favoured the heavy precipitation and changes in the observed cloud heights on 2 January 2016. On the contrary, the relatively warmer upper atmosphere (Figure 12d) during 4 January 2020 may have suppressed the updraft by making the atmosphere drier compared to more rainy days (in Figure 14b), where strong positive vertical velocities (downdrafts) are dominant in the mid-tropospheric level (300–600 hPa).

4. Conclusions

Clouds are known to be one of the key contributors to Arctic amplification [6,9]. Depending on the micro and macrophysical properties, clouds play crucial roles in radiation, surface energy and water balances. Further, frequencies of cloud occurrences control the weather and climate over a particular region. Here, we present features including annual cycle, vertical distribution and occurrences of different cloud bases found in an Arctic site Ny-Ålesund, Svalbard using ground-based remote sensing observations using a Vaisala CL51 ceilometer. It is important to note that there are limitations in extending these results to general seasonal characteristics due to the limited period of cloud measurements. We also investigated precipitation events captured by MRR2 and tried to establish their links to cloud base heights characteristics and synoptic scale meteorology. In summary, we come up with the following conclusions.
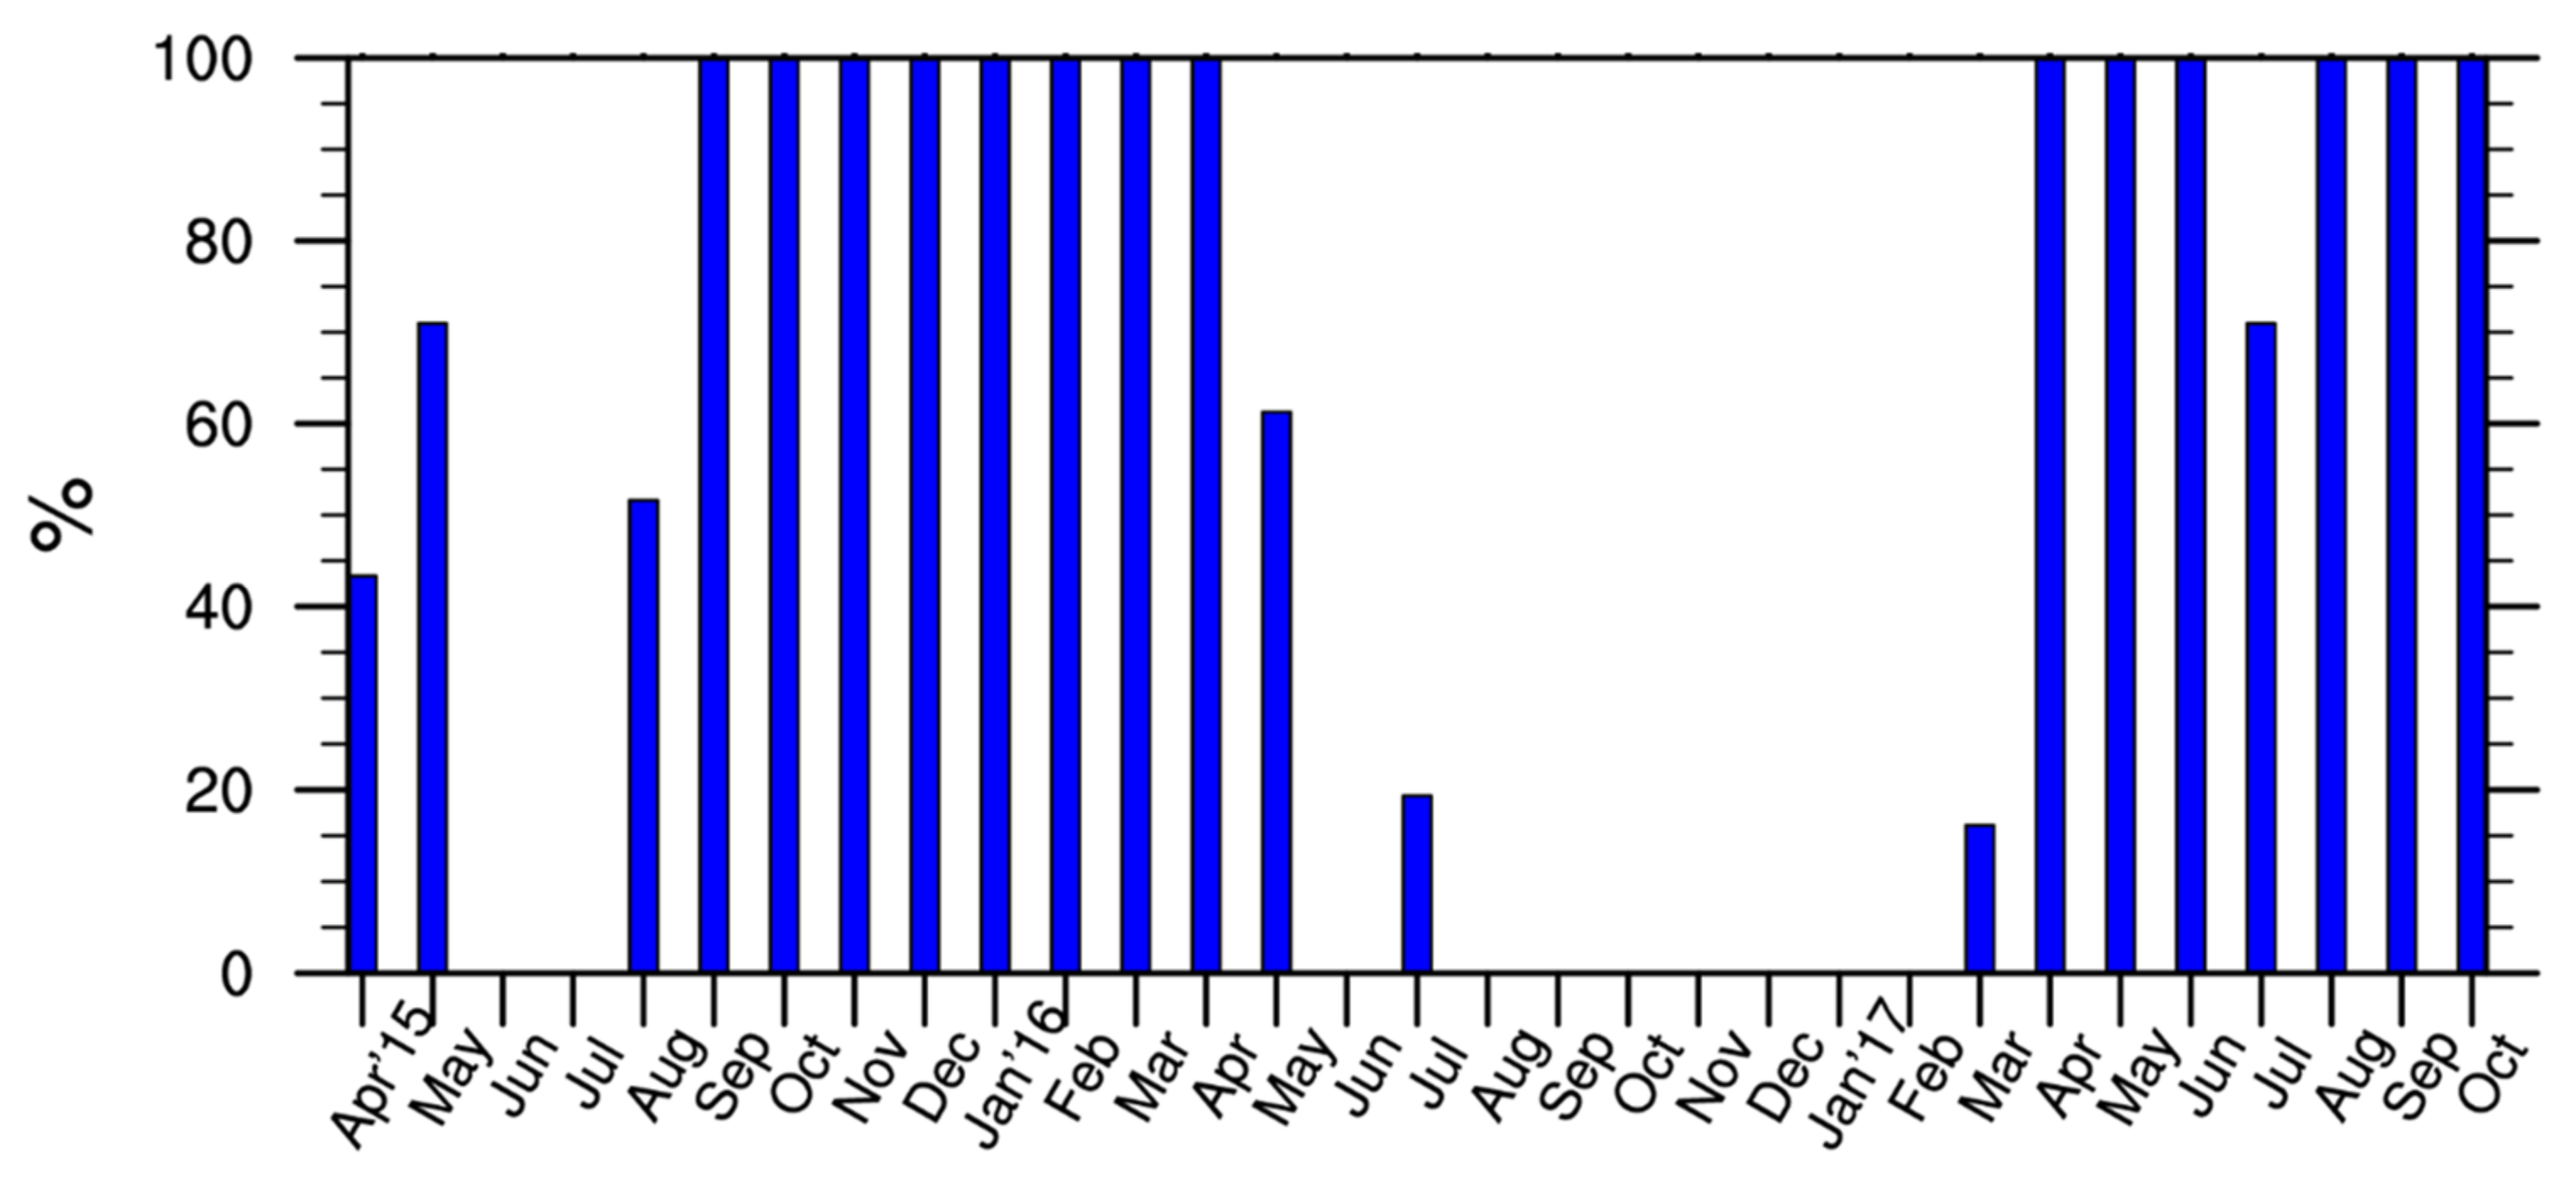
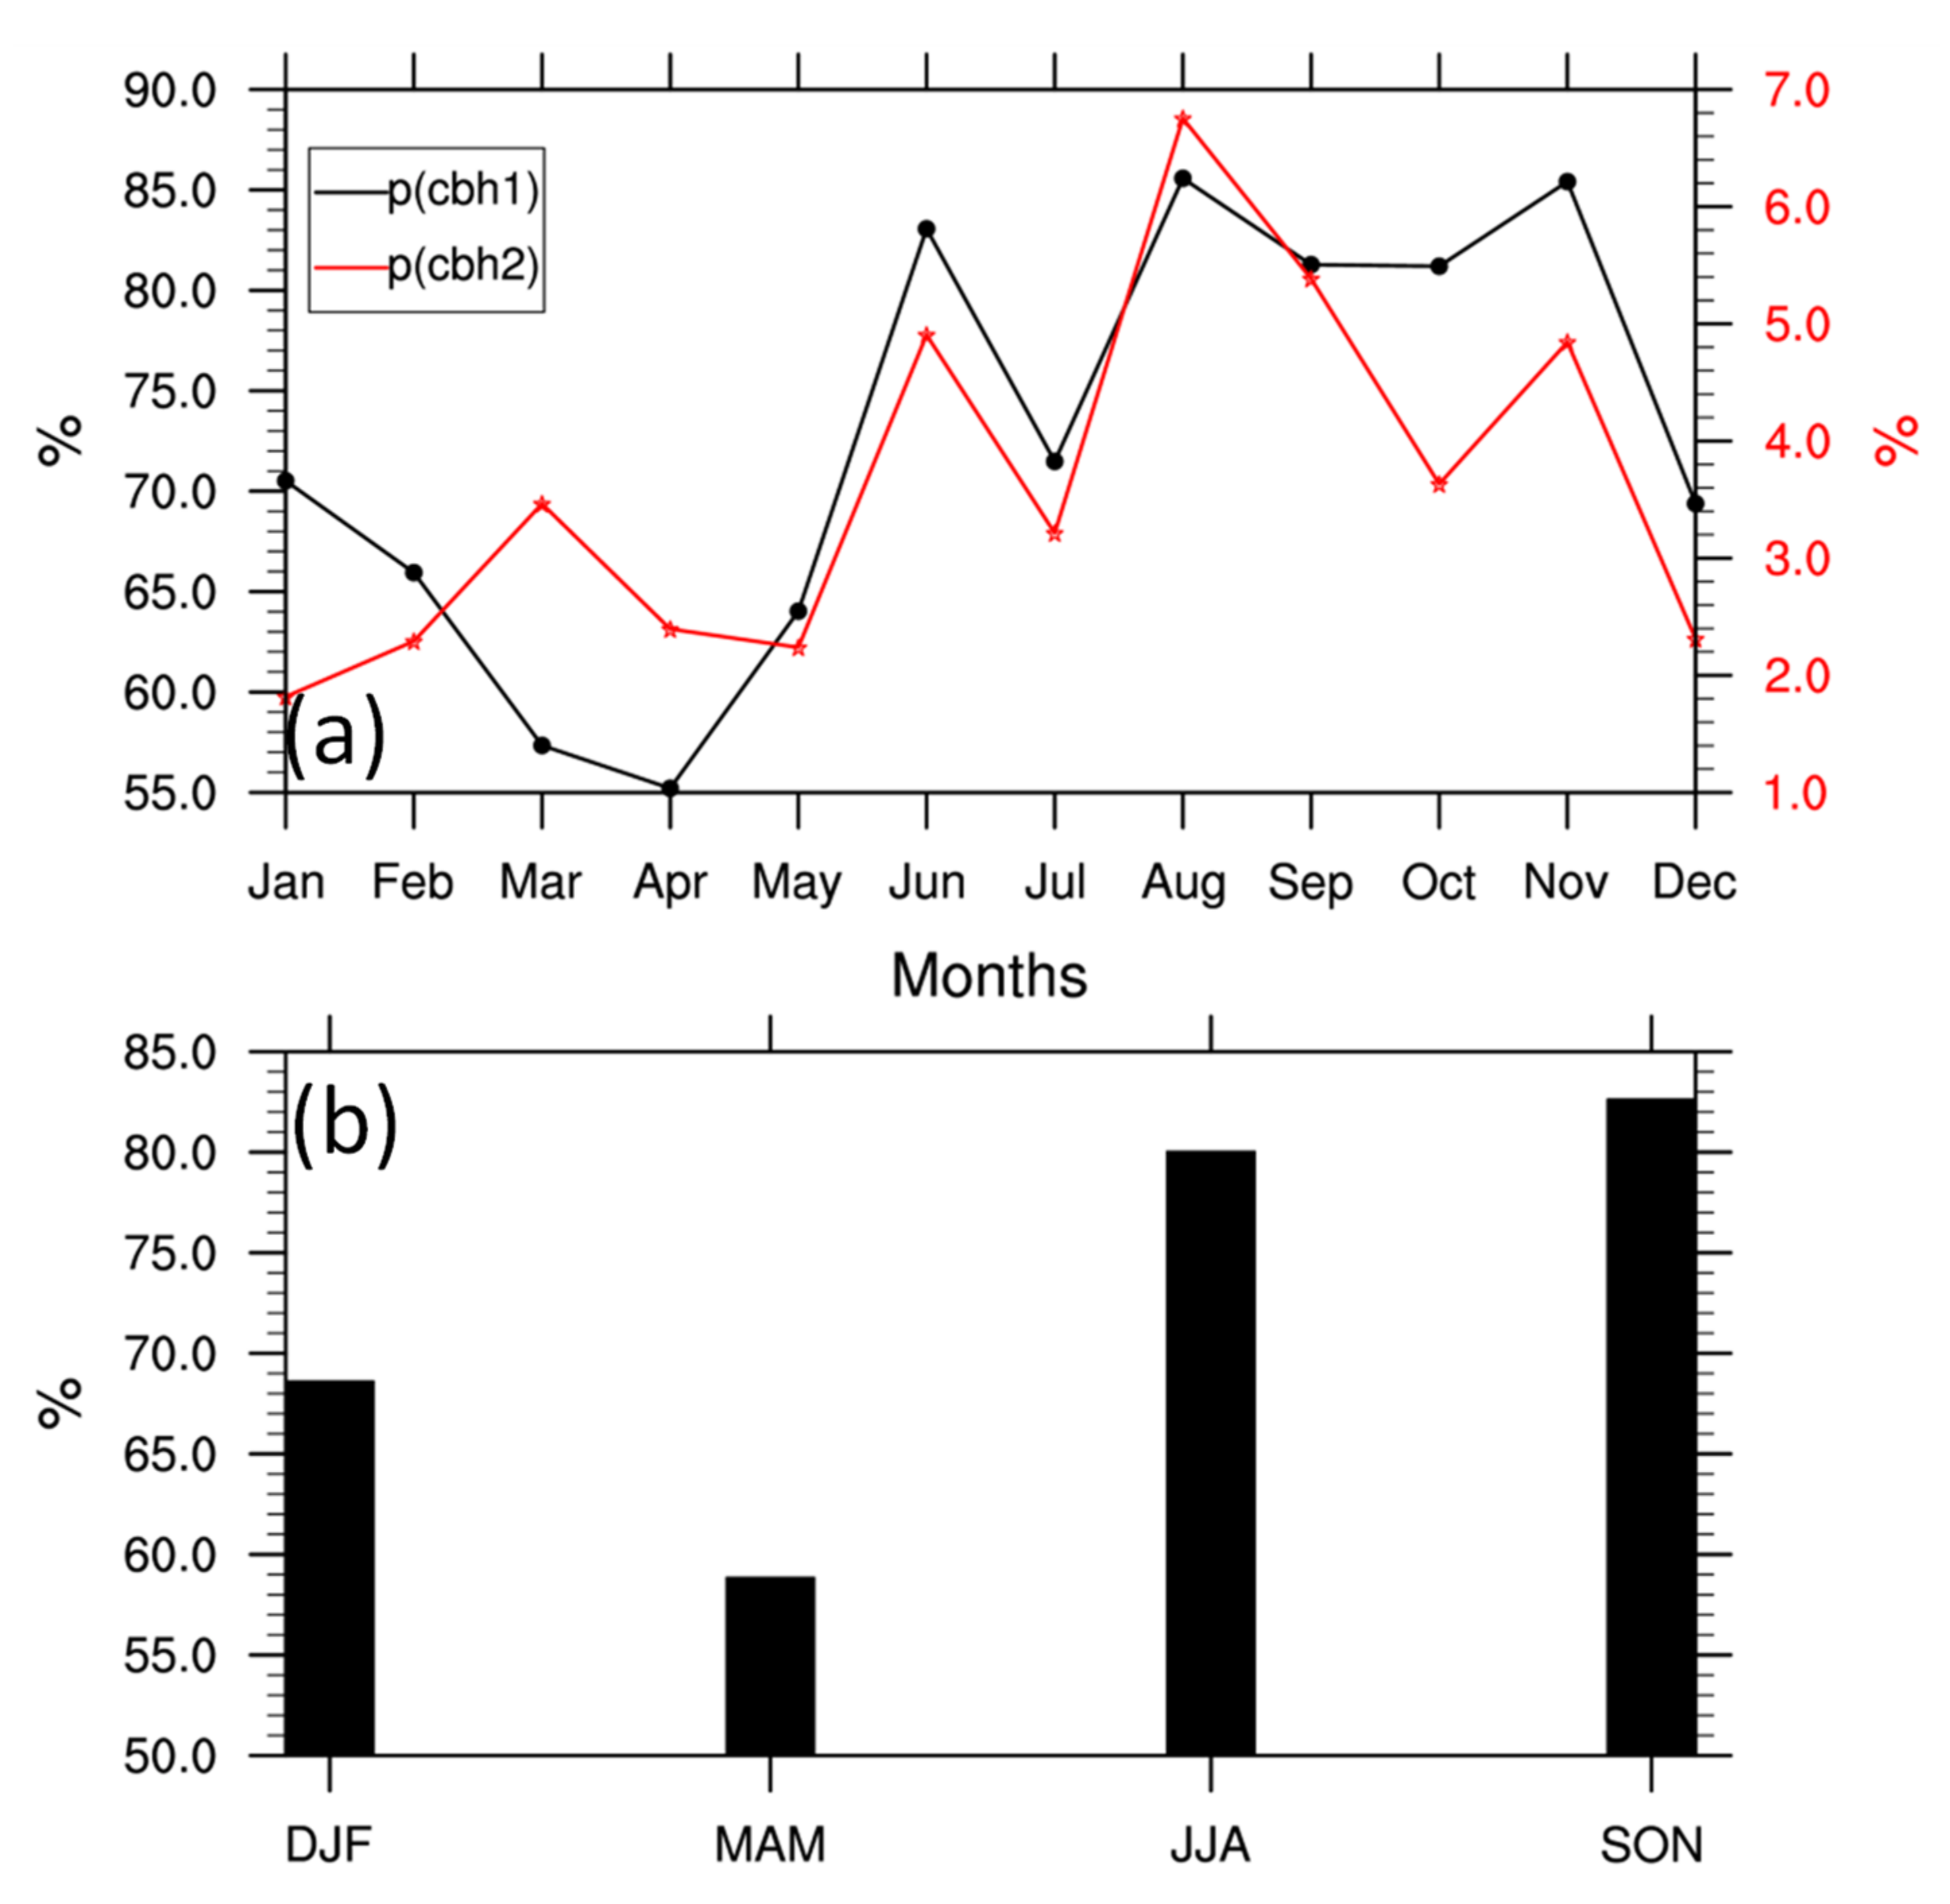
  • The summer and autumn seasons have the most cloud occurrences (>80%), while the spring season has the least cloud occurrences (~59%) at Ny-Ålesund. Within a year, the august month attends maximum cloud occurrences (>90%) while April shows the minimum values (~55%).
  • The probability of CBH2 attends its maximum value in the summer and minimum in the spring. Summer values are higher, meaning the lowest level clouds are thinner than in other seasons.
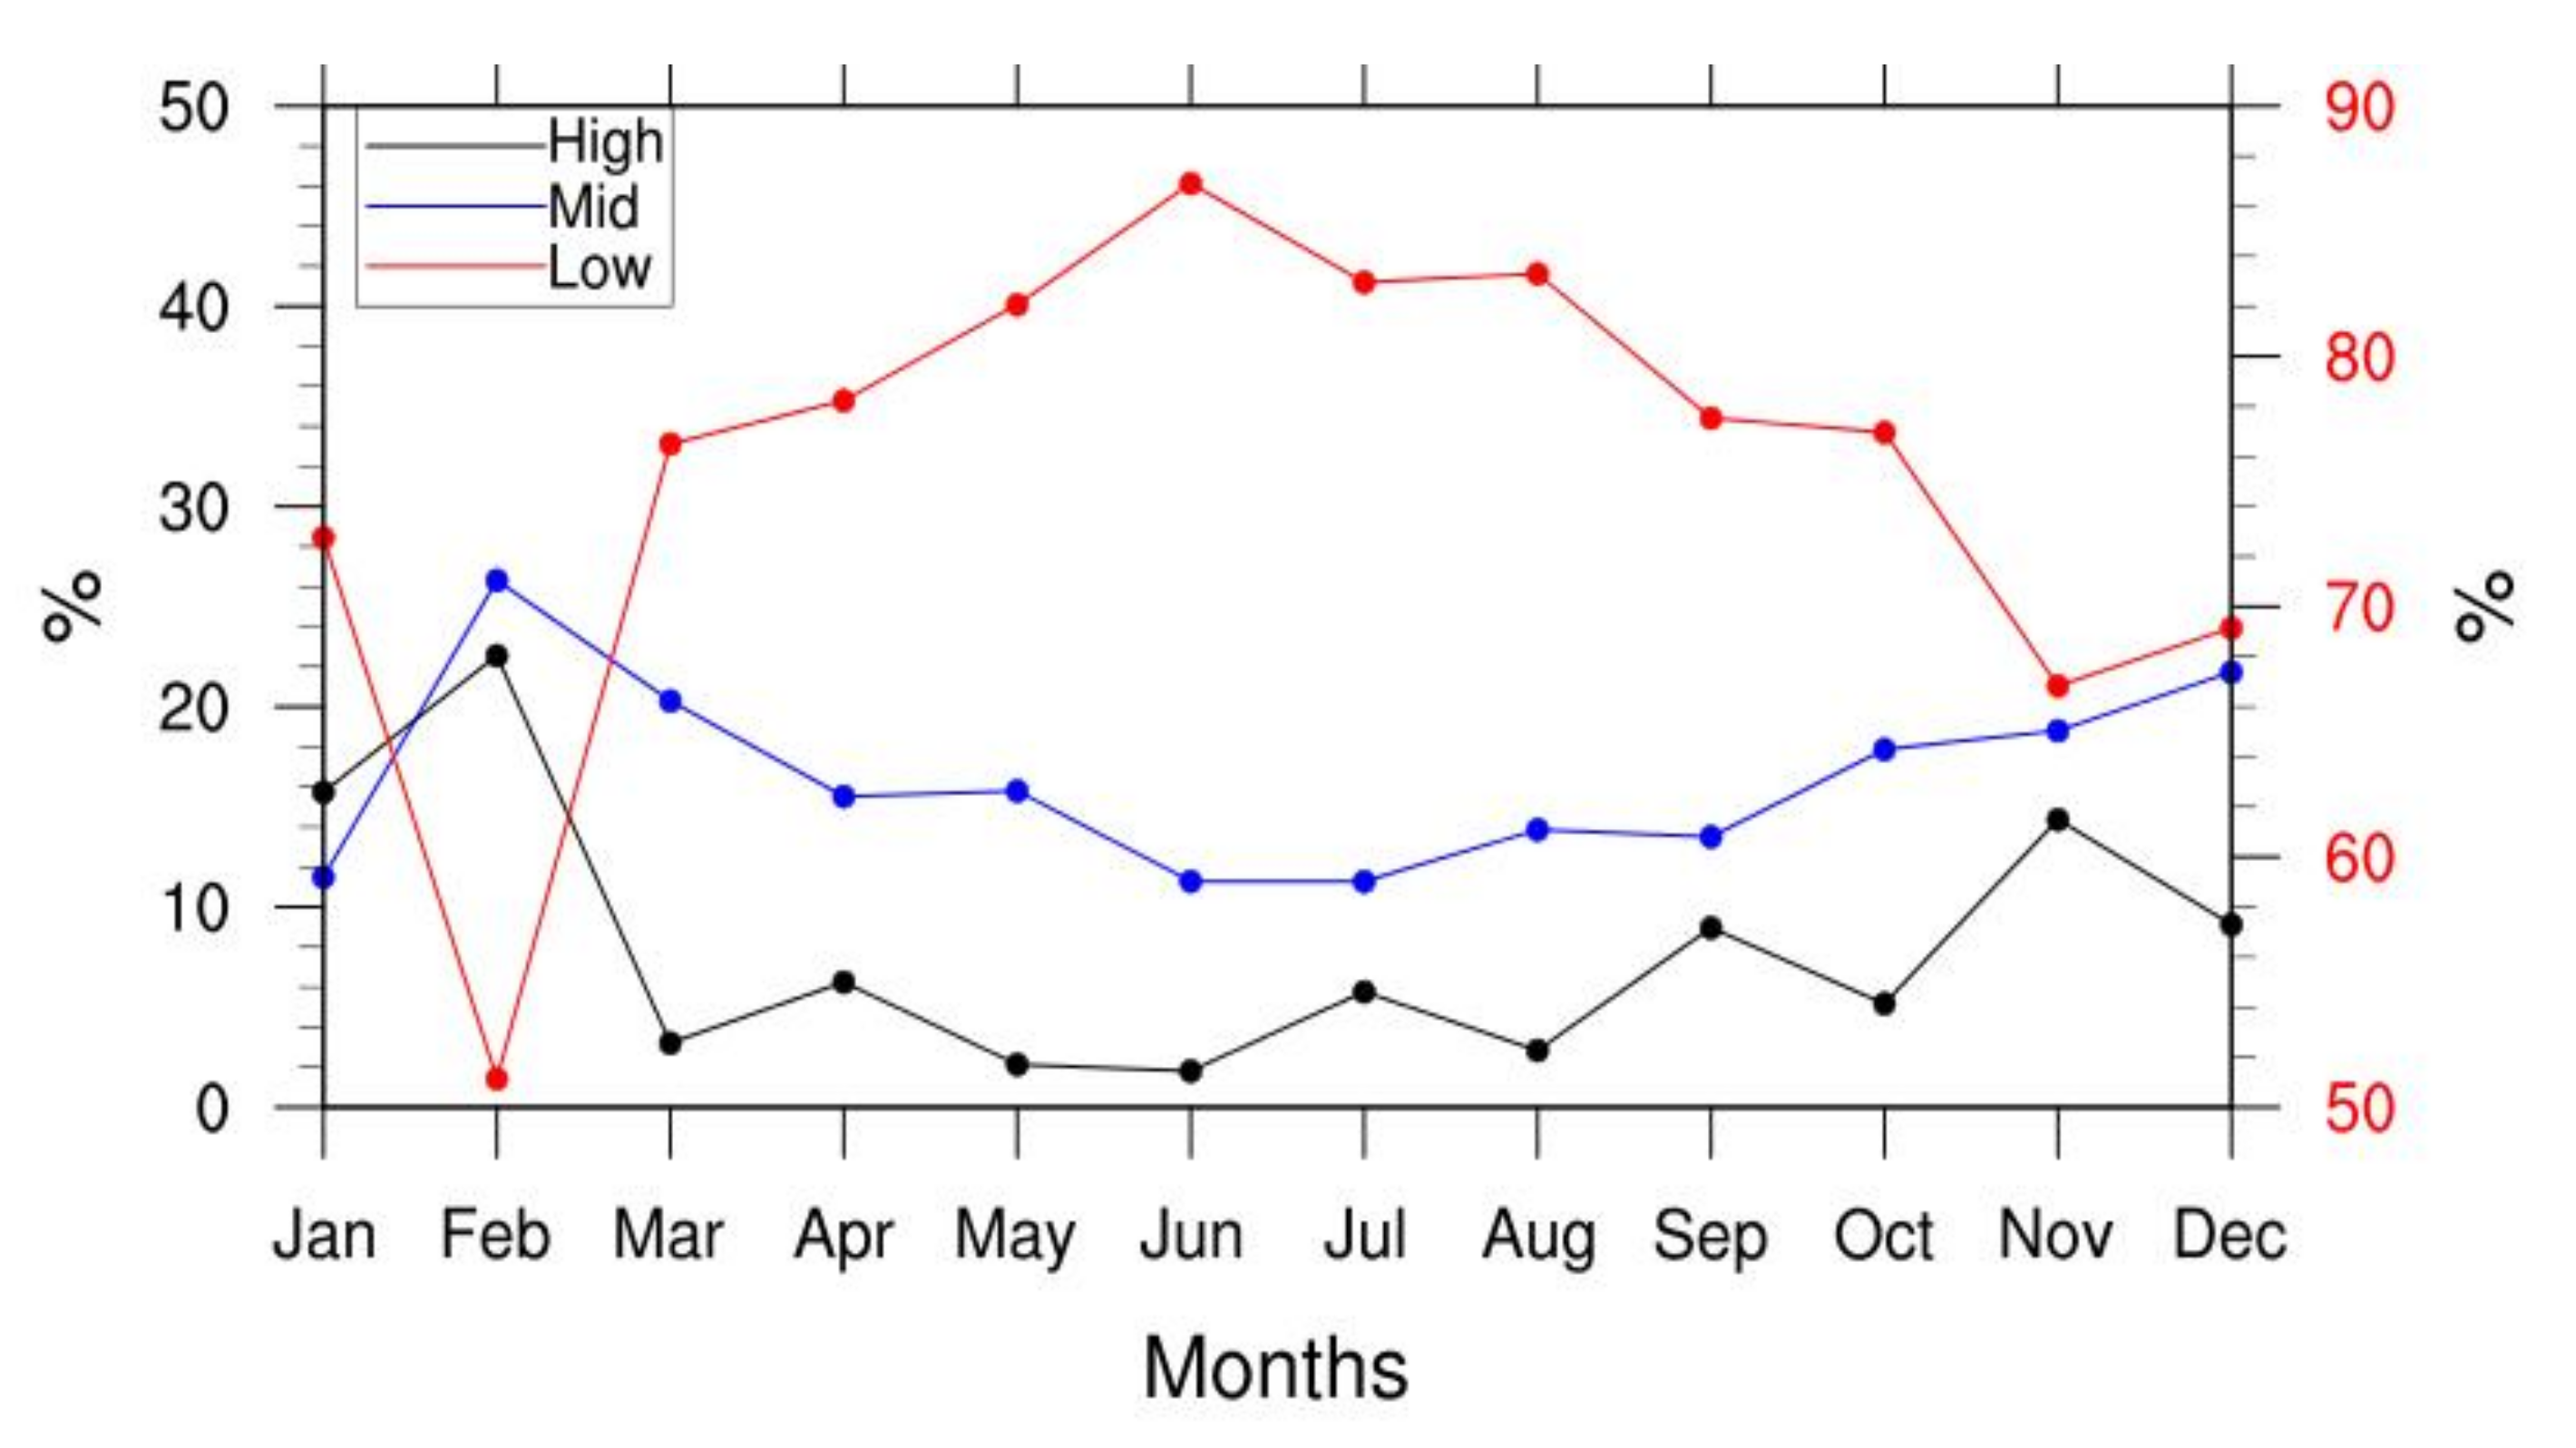
  • Low-level clouds are present in 76.2% of CBH detection cases, whereas mid and high-level clouds are found in 16.2% and 7.6% of cases, respectively.
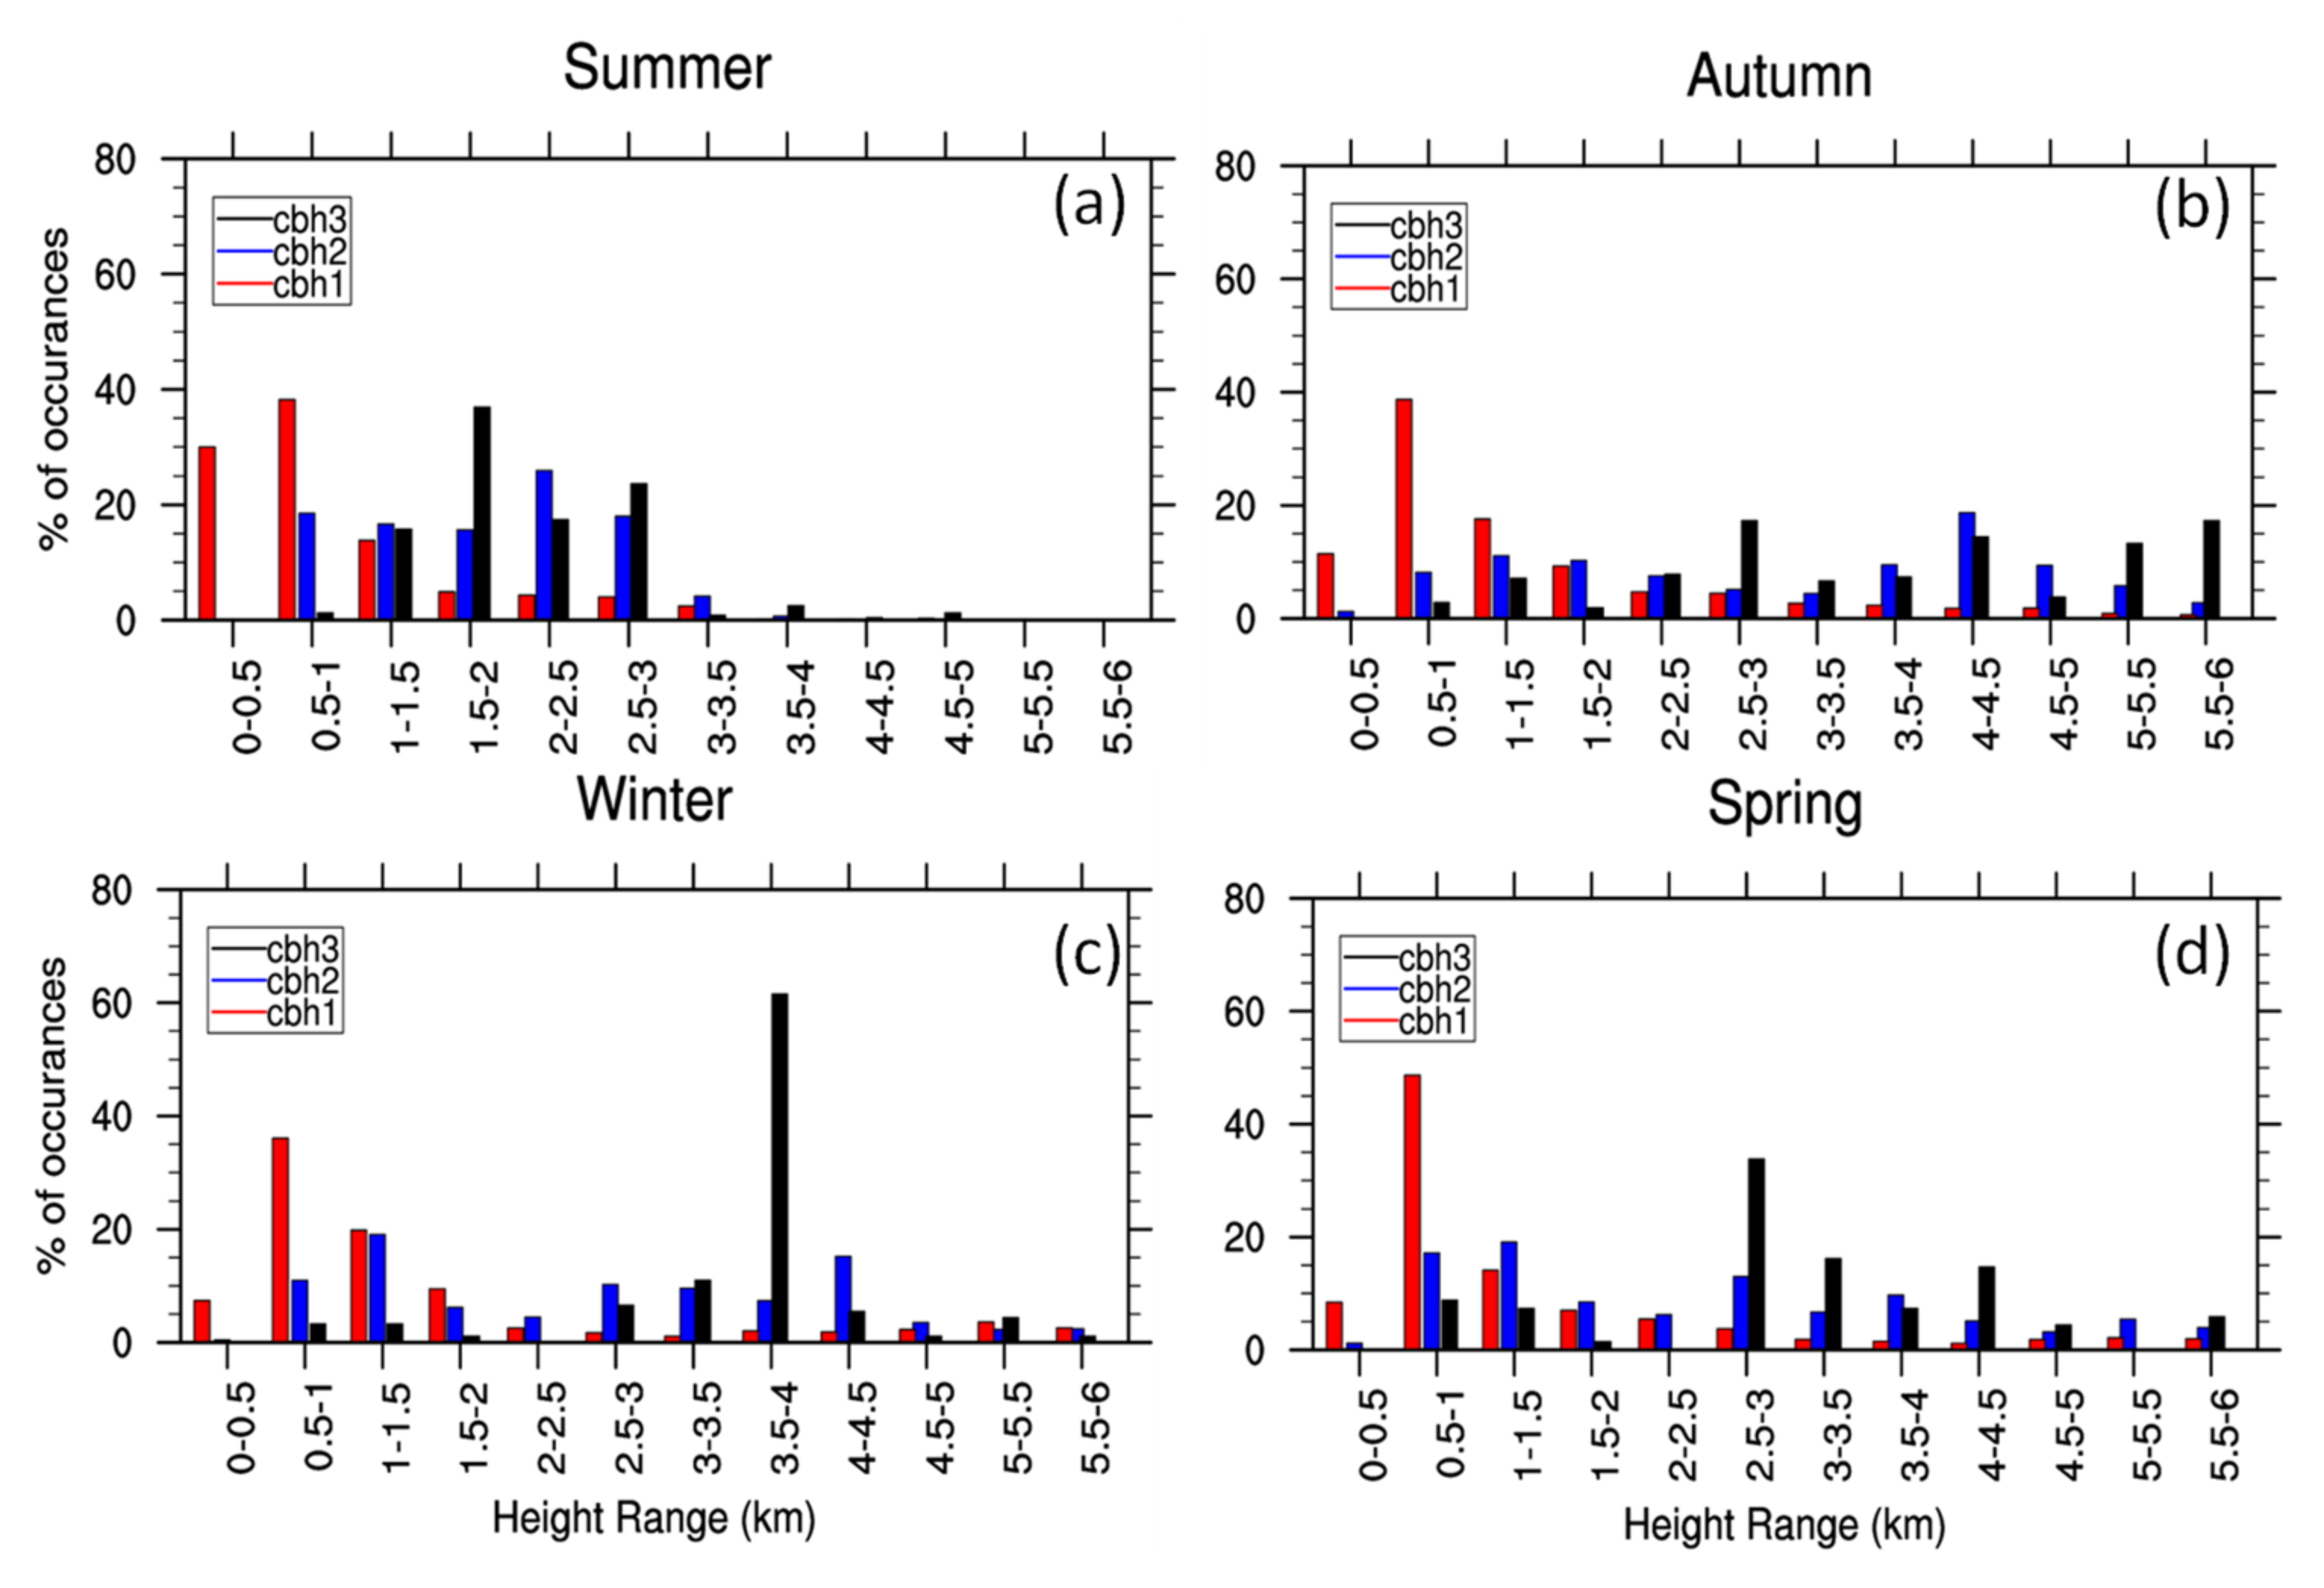
  • The maximum (approximately 40%) lowest cloud base is found at a height range of 0.5–1 km in all four seasons. An increased presence of the lowest cloud bases below 0.5 km can be noted in summer (~30%) compared to in winter (<10%).
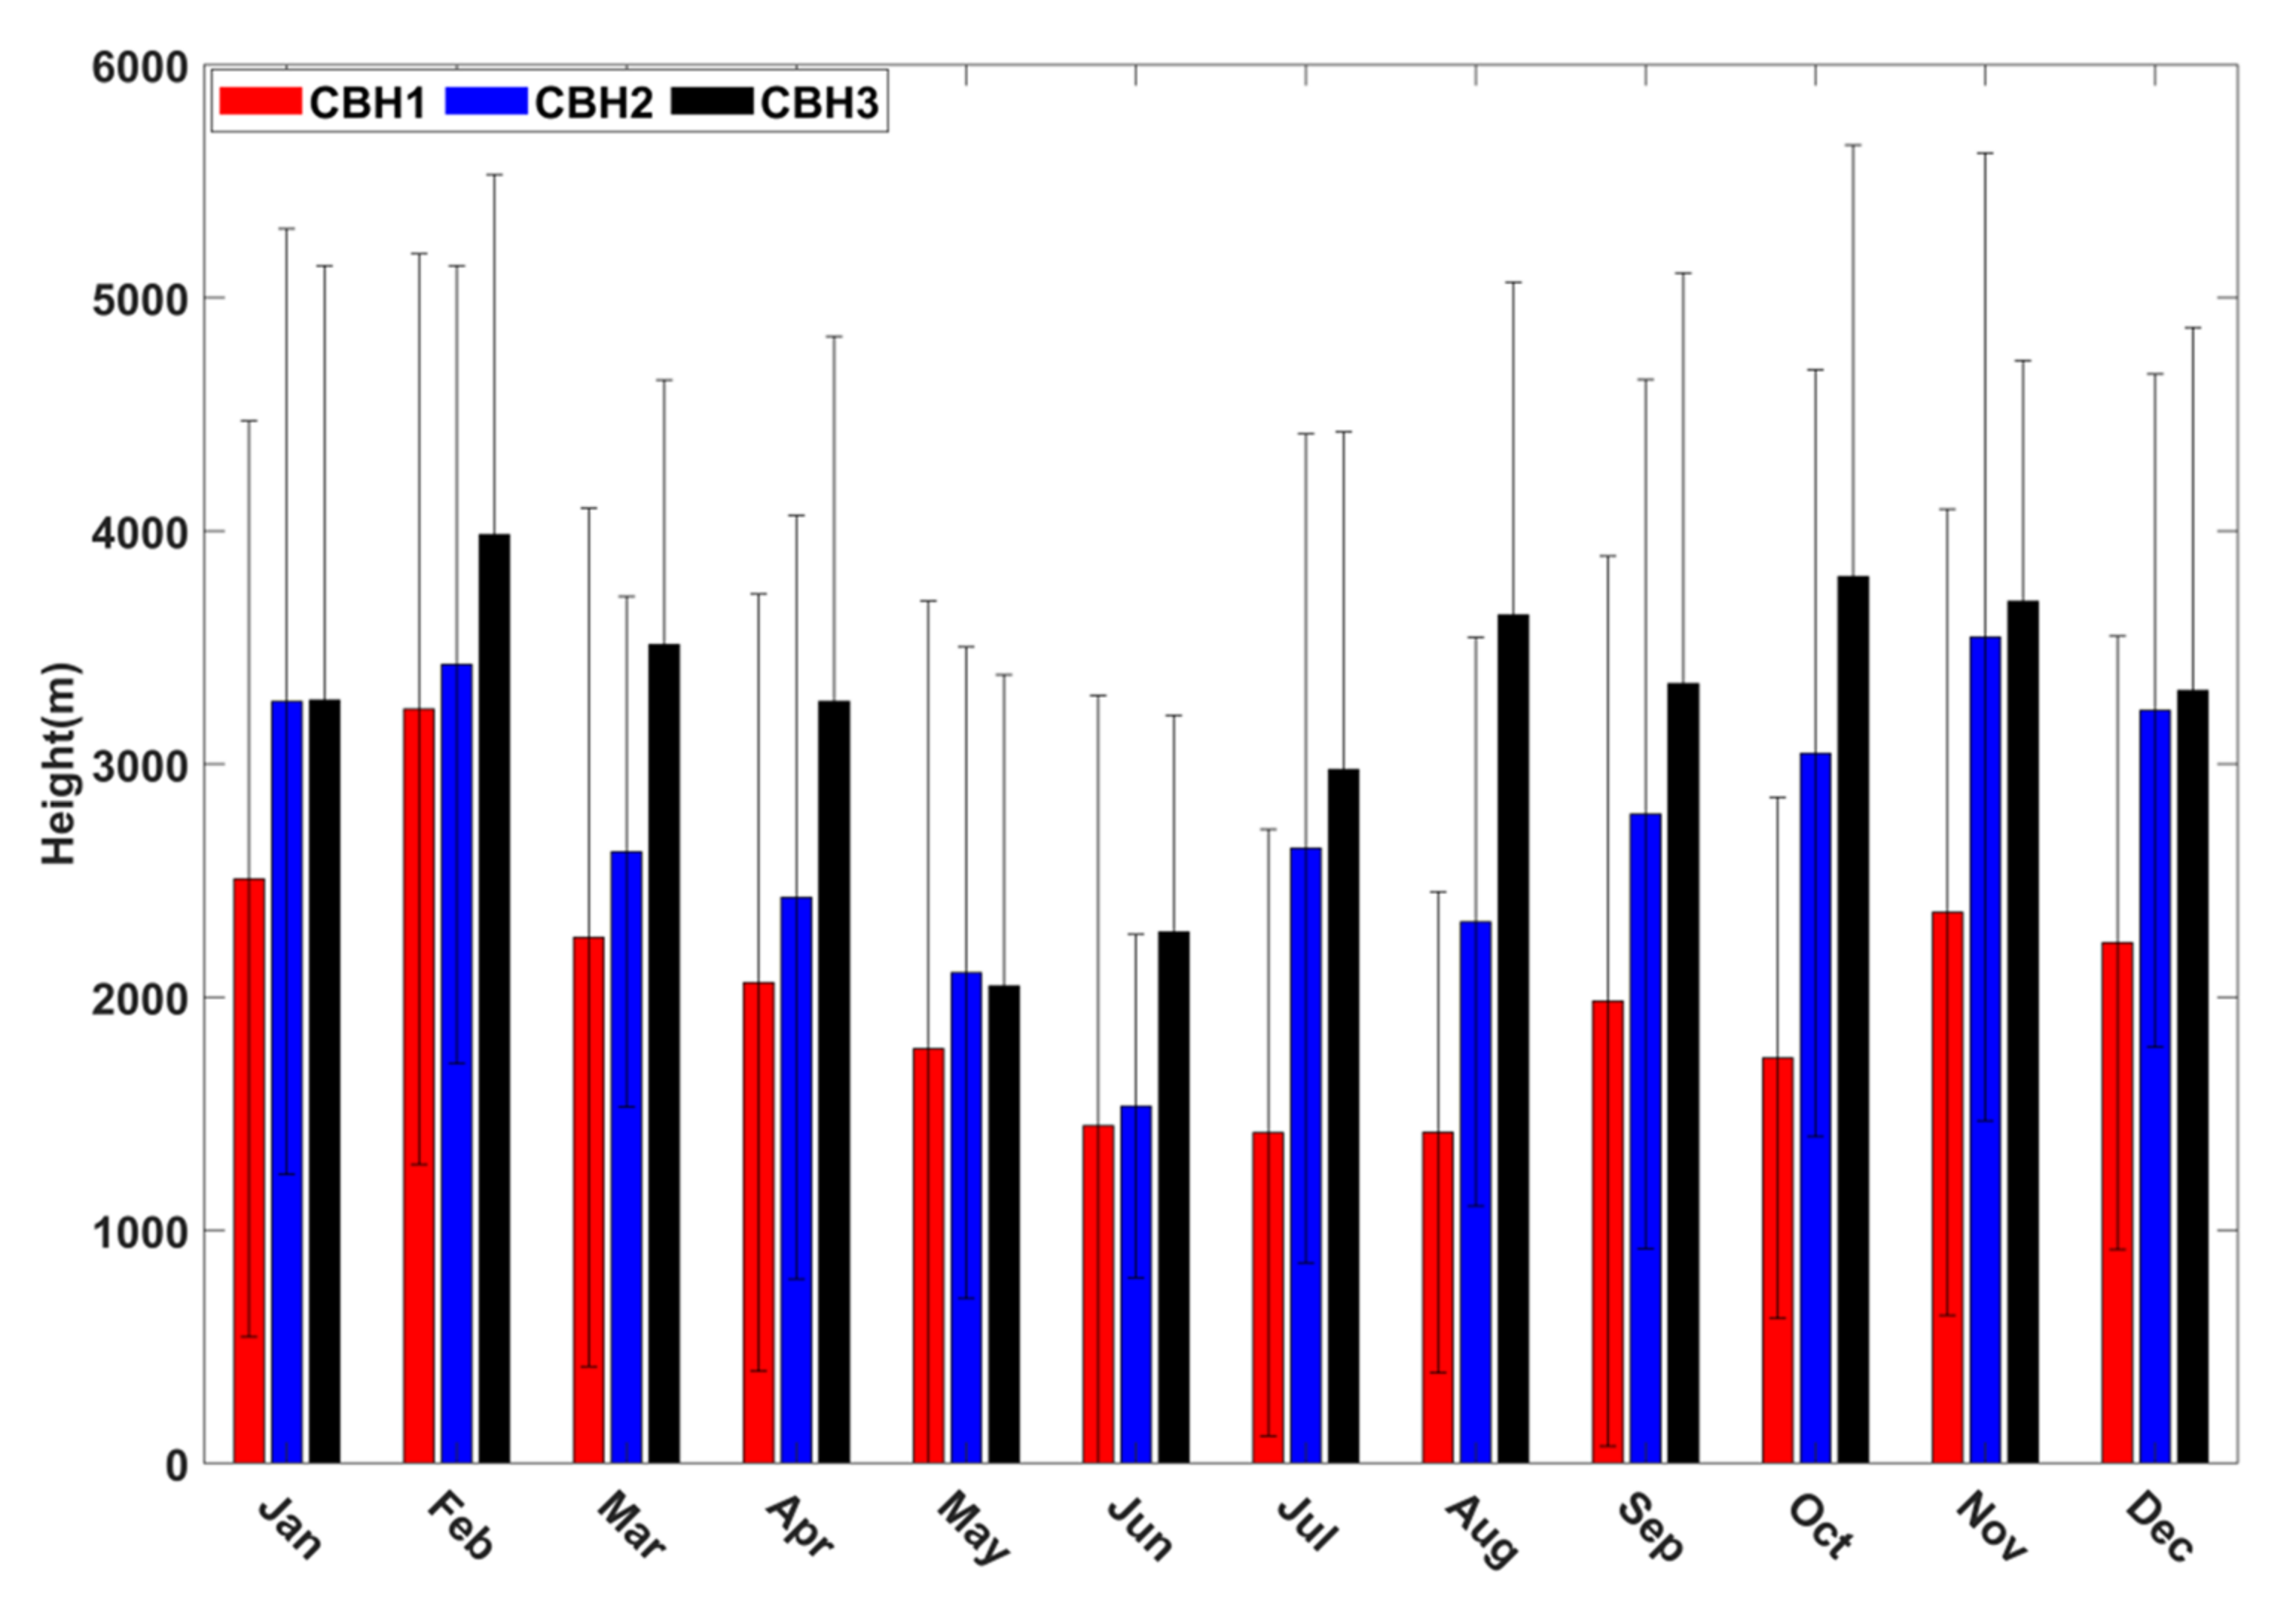
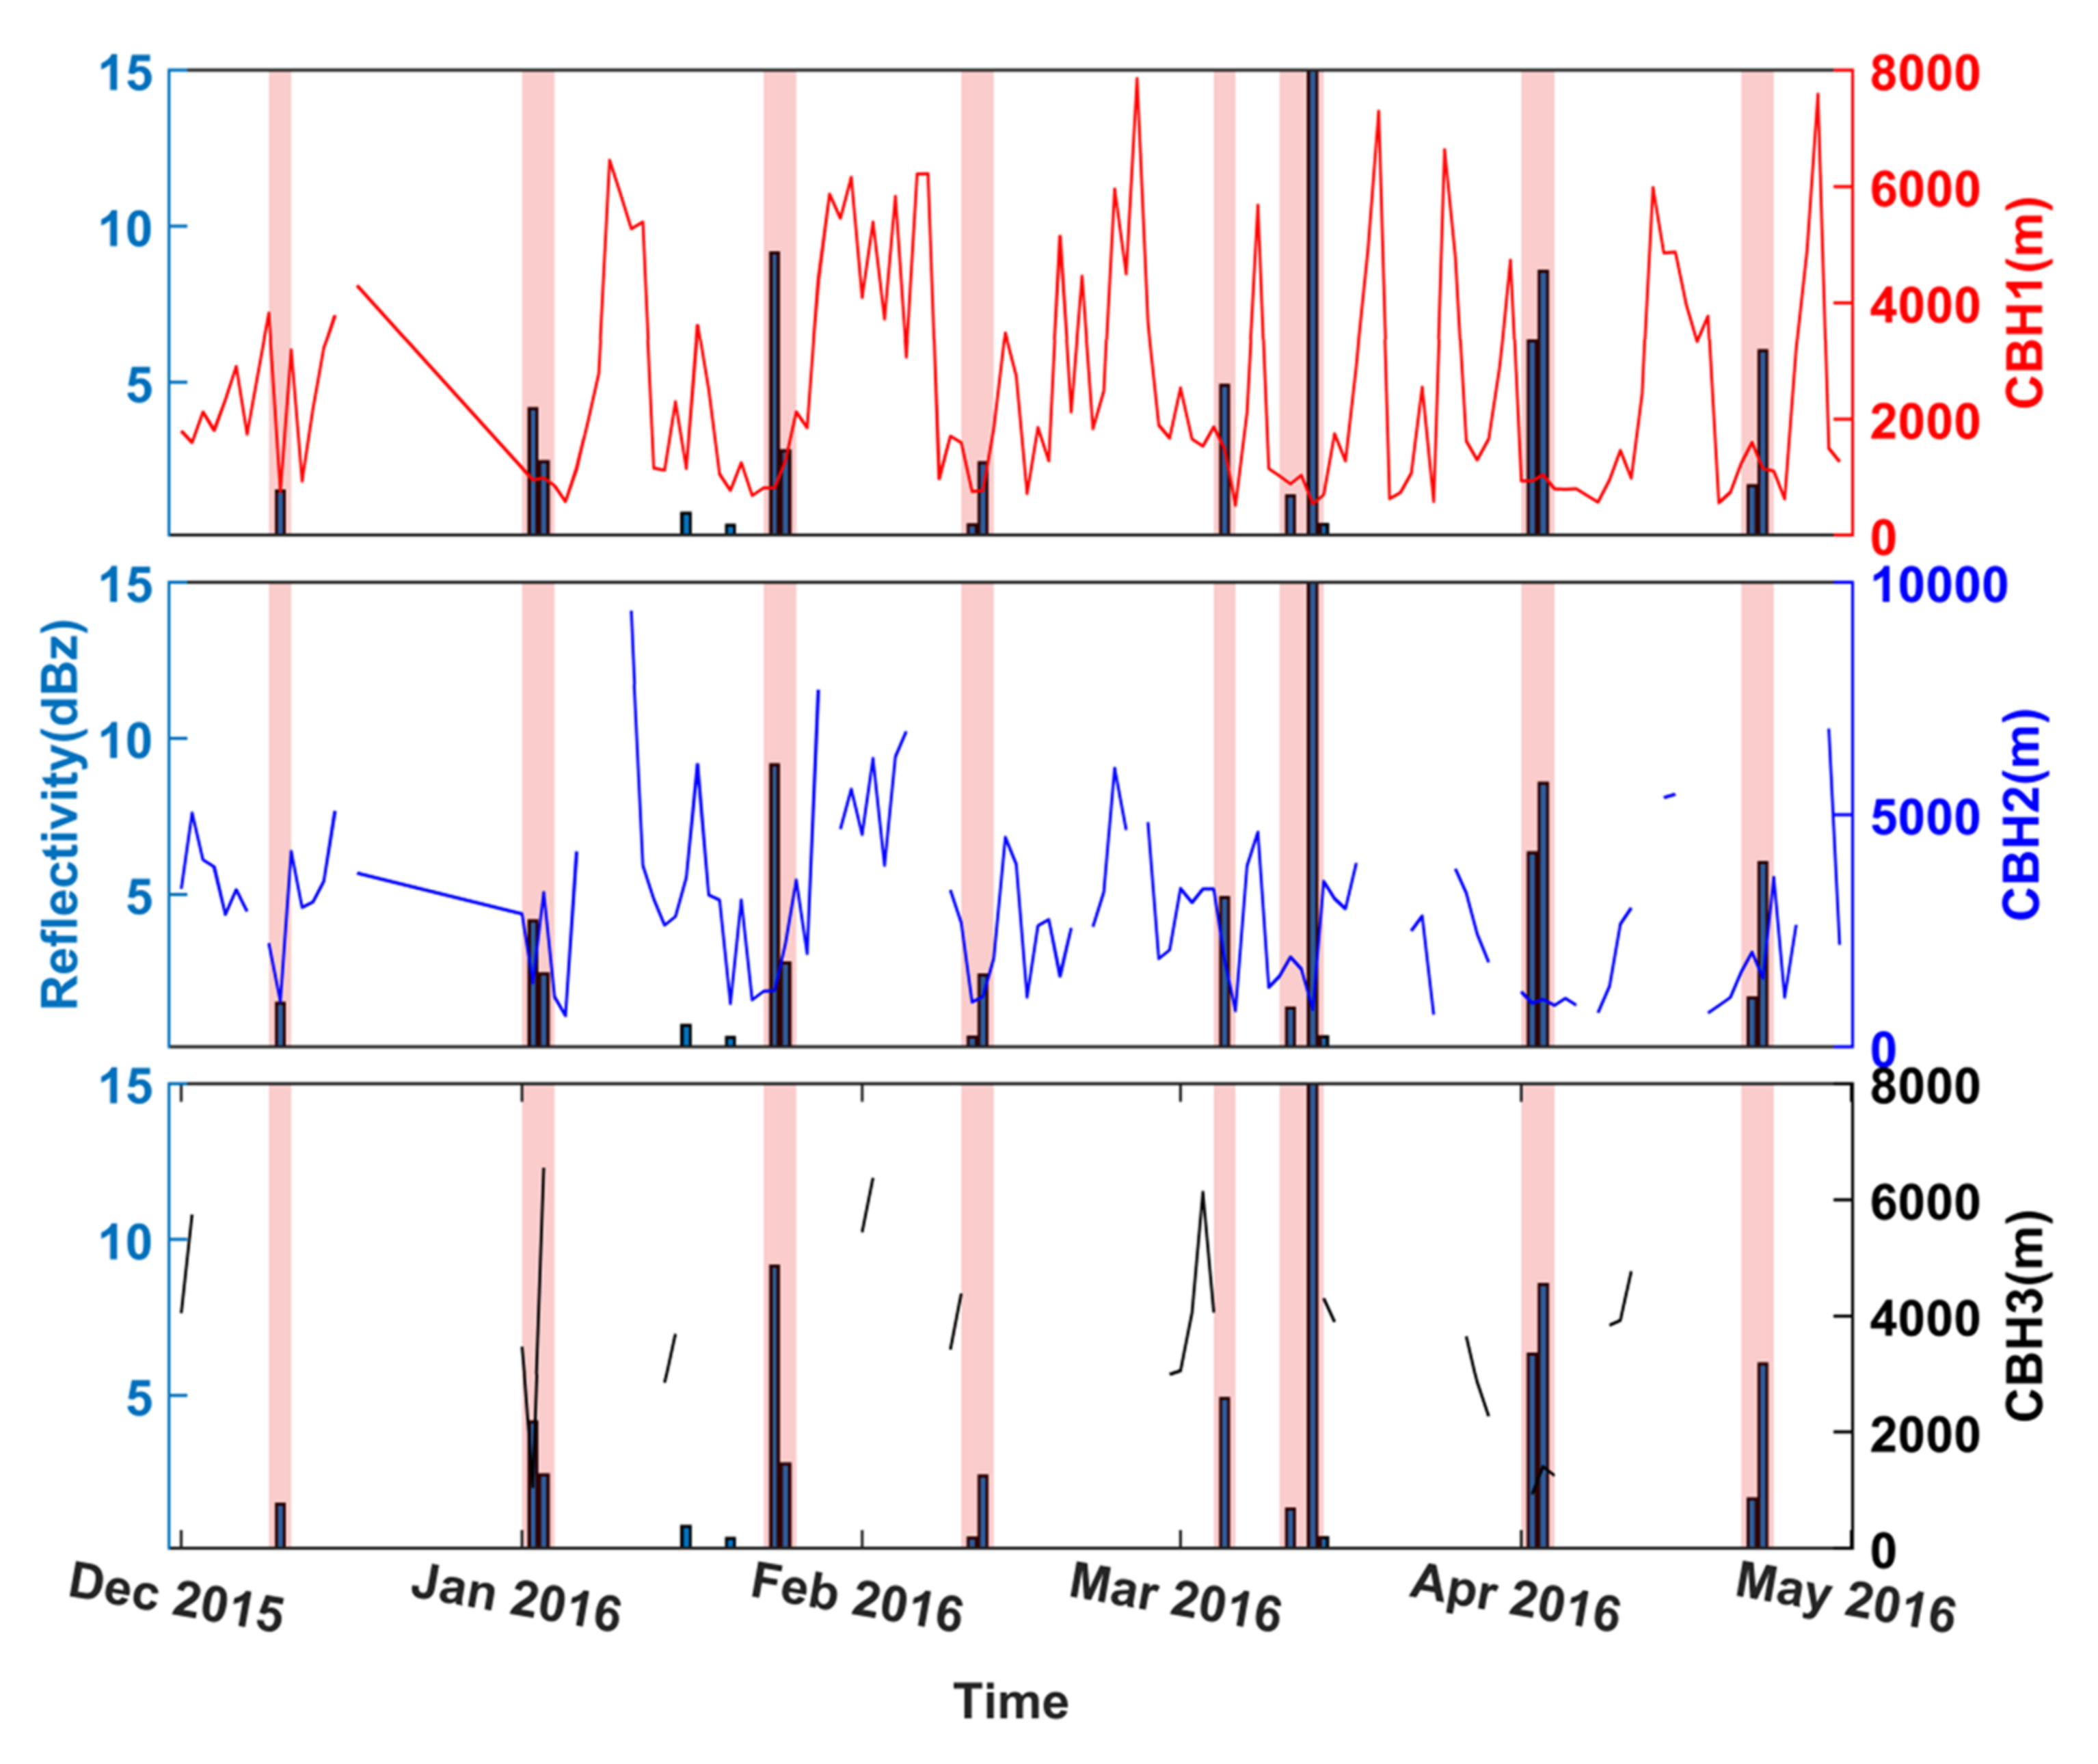
  • Vertically averaged daily precipitation intensities (liquid and solid) are found to exhibit various ranges with a maximum value ~12 mmh−1. Our observations show that most of these high precipitation events are linked to low clouds (CBH1 < 2000 m).
  • Distinct vertical movements (updrafts/downdrafts) in the first cloud base were observed during two different (heavy and light) wintertime precipitation events. Along with local atmospheric state variables (temperature and humidity), the intensities of precipitation and cloud movements were linked to frontal activities connected to synoptic scale meteorology.

Author Contributions

A.A., S.C. and N.M. designed the research; A.A., S.C. and M.P.S. analyzed the data; A.A. and S.C. wrote the manuscript; N.M., M.P.S. and A.R. revised the manuscript. All authors have read and agreed to the published version of the manuscript.

Funding

This research received no external funding. The APC (if any) is funded by ESSO-NCPOR (https://ncpor.res.in/, accessed on 1 March 2021).

Data Availability Statement

All the ground-based observational data used in this study can be obtained from the corresponding author upon request. The ERA5 datasets are freely available (https://www.ecmwf.int/en/forecasts/datasets/reanalysis-datasets/era5, accessed on 1 March 2021). The radiosonde datasets can be availed upon request to Alfred Wegener Institute. The meteorological datasets be obtained from eklima.met.no.

Acknowledgments

The authors acknowledge Director, NCPOR, for supporting the study. Kings Bay AS is acknowledged for providing the logistics support to set up the observatory at Ny-Ålesund. The authors are thankful to ECMWF for providing open access to ERA-5 datasets. The Alfred Wegener Institute (AWI) is acknowledged for providing radiosonde data (https://0-doi-org.brum.beds.ac.uk/10.1594/PANGAEA.875196, accessed on 1 March 2021). NCPOR is an autonomous institute fully funded by the Ministry of Earth Sciences, Govt. Of India. This is NCPOR Contribution number J-21/2021-22.

Conflicts of Interest

The authors declare no conflict of interest.

References

  1. Holland, M.M.; Bitz, C.M. Polar amplification of climate change in coupled models. Clim. Dyn. 2003, 21, 221–232. [Google Scholar] [CrossRef]
  2. Serreze, M.C.; Barry, R.G. Processes and impacts of Arctic amplification: A research synthesis. Glob. Planet. Chang. 2011, 77, 85–96. [Google Scholar] [CrossRef]
  3. Graff, L.S.; Iversen, T.; Bethke, I.; Debernard, J.B.; Seland, Ø.; Bentsen, M.; Kirkevåg, A.; Li, C.; Olivié, D.J.L. Arctic amplification under global warming of 1.5 and 2 °C in NorESM1-Happi. Earth Syst. Dyn. 2019, 10, 569–598. [Google Scholar] [CrossRef] [Green Version]
  4. Cohen, J.; Zhang, X.; Francis, J.; Jung, T.; Kwok, R.; Overland, J.; Tayler, P.C.; Lee, S.; Laliberte, F.; Feldstein, S.; et al. Arctic change and possible influence on mid-latitude climate and weather: A US CLIVAR White Paper. US CLIVAR Rep. 2018, 41. [Google Scholar] [CrossRef]
  5. Svensson, G.; Karlsson, J. On the arctic wintertime climate in global climate models. J. Clim. 2011, 24, 5757–5771. [Google Scholar] [CrossRef]
  6. Curry, J.A.; Rossow, W.B.; Randall, D.; Schramm, J.L. Overview of arctic cloud and radiation characteristics. J. Clim. 1996, 9, 1731–1764. [Google Scholar] [CrossRef] [Green Version]
  7. Flato, G.; Marotzke, J.; Abiodun, B.; Braconnot, P.; Chou, S.C.; Collins, W.; Cox, P.; Driouech, F.; Emori, S.; Eyring, V.; et al. Evaluation of Climate Models. In Climate Change 2013: The Physical Science Basis. Contribution of Working Group I to the Fifth Assessment Report of the Intergovernmental Panel on Climate Change; Cambridge University Press: Cambridge, UK, 2013; pp. 741–866. [Google Scholar] [CrossRef] [Green Version]
  8. Kay, J.E.; L’Ecuyer, T.; Chepfer, H.; Loeb, N.; Morrison, A.; Cesana, G. Recent Advances in Arctic Cloud and Climate Research. Curr. Clim. Chang. Rep. 2016, 2, 159–169. [Google Scholar] [CrossRef] [Green Version]
  9. Goosse, H.; Kay, J.E.; Armour, K.C.; Bodas-Salcedo, A.; Chepfer, H.; Docquier, D.; Jonko, A.; Kushner, P.J.; Lecomte, O.; Massonnet, F.; et al. Quantifying climate feedbacks in polar regions. Nat. Commun. 2018, 9, 1919. [Google Scholar] [CrossRef] [PubMed]
  10. Dai, A.; Luo, D.; Song, M.; Liu, J. Arctic amplification is caused by sea-ice loss under increasing CO2. Nat. Commun. 2019, 10, 121. [Google Scholar] [CrossRef] [Green Version]
  11. Screen, J.A.; Simmonds, I. The central role of diminishing sea ice in recent Arctic temperature amplification. Nature 2010, 464. [Google Scholar] [CrossRef] [PubMed] [Green Version]
  12. Lambert, F.; Kug, J.-S.; Park, R.J.; Mahowald, N.; Winckler, G.; Abe-Ouchi, A.; O’ishi, R.; Takemura, T.; Lee, J.-H. The role of mineral-dust aerosols in polar temperature amplification. Nat. Clim. Chang. 2013, 3. [Google Scholar] [CrossRef]
  13. Alexeev, V.A.; Jackson, C.H. Polar amplification: Is atmospheric heat transport important? Clim. Dyn. 2013, 41, 533–547. [Google Scholar] [CrossRef]
  14. Cai, M. Dynamical amplification of polar warming. Geophys. Res. Lett. 2005, 32, L22710. [Google Scholar] [CrossRef]
  15. Huang, Y.; Dong, X.; Bailey, D.A.; Holland, M.M.; Xi, B.; DuVivier, A.K.; Kay, J.E.; Landrum, L.L.; Deng, Y. Thicker Clouds and Accelerated Arctic Sea Ice Decline: The Atmosphere-Sea Ice Interactions in Spring. Geophys. Res. Lett. 2019, 46, 6980–6989. [Google Scholar] [CrossRef] [Green Version]
  16. Bennartz, R.; Shupe, M.D.; Turner, D.D.; Walden, V.P.; Steffen, K.; Cox, C.J.; Kulie, M.S.; Miller, N.B.; Pettersen, C. July 2012 Greenland melt extent enhanced by low-level liquid clouds. Nature 2013, 496, 83–86. [Google Scholar] [CrossRef]
  17. Cox, C.J.; Uttal, T.; Long, C.N.; Stone, R.S.; Shupe, M.D.; Starkweather, S. The role of springtime arctic clouds in determining autumn sea ice extent. J. Clim. 2016, 29, 6581–6596. [Google Scholar] [CrossRef]
  18. Liu, Y.; Key, J.R. Assessment of arctic cloud cover anomalies in atmospheric reanalysis products using satellite data. J. Clim. 2016, 29, 6065–6083. [Google Scholar] [CrossRef]
  19. Ramanathan, V.; Cess, R.D.; Harrison, E.F.; Minnis, P.; Barkstrom, B.R.; Ahmad, E.; Hartmann, D. Cloud-radiative forcing and climate: Results from the earth radiation budget experiment. Science 1989, 243, 57–63. [Google Scholar] [CrossRef] [Green Version]
  20. Vavrus, S.; Holland, M.M.; Bailey, D.A. Changes in Arctic clouds during intervals of rapid sea ice loss. Clim. Dyn. 2011, 36, 1475–1489. [Google Scholar] [CrossRef] [Green Version]
  21. Cronin, T.W.; Tziperman, E. Low clouds suppress Arctic air formation and amplify high-latitude continental winter warming. Proc. Natl. Acad. Sci. USA 2015, 112, 11490–11495. [Google Scholar] [CrossRef] [Green Version]
  22. Gong, T.; Feldstein, S.; Lee, S. The role of downward infrared radiation in the recent arctic winter warming trend. J. Clim. 2017, 30, 4937–4949. [Google Scholar] [CrossRef]
  23. Vihma, T.; Screen, J.; Tjernström, M.; Newton, B.; Zhang, X.; Popova, V.; Deser, C.; Holland, M.; Prowse, T. The atmospheric role in the Arctic water cycle: A review on processes, past and future changes, and their impacts. J. Geophys. Res. G Biogeosci. 2016, 121, 586–620. [Google Scholar] [CrossRef] [Green Version]
  24. Intrieri, J.M.; Shupe, M.D.; Uttal, T.; McCarty, B.J. An annual cycle of Arctic cloud characteristics observed by radar and lidar at SHEBA. J. Geophys. Res. Ocean. 2002, 107. [Google Scholar] [CrossRef]
  25. Shupe, M.D. Clouds at arctic atmospheric observatories. Part II: Thermodynamic phase characteristics. J. Appl. Meteorol. Climatol. 2011, 50, 645–661. [Google Scholar] [CrossRef]
  26. Eastman, R.; Warren, S.G. Arctic Cloud Changes from Surface and Satellite Observations. J. Clim. 2010, 23, 4233–4242. [Google Scholar] [CrossRef] [Green Version]
  27. Maturilli, M.; Ebell, K. Twenty-five years of cloud base height measurements by ceilometer in Ny-Ålesund, Svalbard. Earth Syst. Sci. Data 2018, 10, 1451–1456. [Google Scholar] [CrossRef] [Green Version]
  28. Mioche, G.; Jourdan, O.; Ceccaldi, M.; Delanoë, J. Variability of mixed-phase clouds in the Arctic with a focus on the Svalbard region: A study based on spaceborne active remote sensing. Atmos. Chem. Phys. 2015, 15, 2445–2461. [Google Scholar] [CrossRef] [Green Version]
  29. Chernokulsky, A.; Mokhov, I.I. Climatology of total cloudiness in the arctic: An intercomparison of observations and reanalyses. Adv. Meteorol. 2012, 2012. [Google Scholar] [CrossRef]
  30. Costa-Surós, M.; Calbó, J.; González, J.A.; Martin-Vide, J. Behavior of cloud base height from ceilometer measurements. Atmos. Res. 2013, 127, 64–76. [Google Scholar] [CrossRef] [Green Version]
  31. Liu, L.; Sun, X.J.; Liu, X.C.; Gao, T.C.; Zhao, S.J. Comparison of cloud base height derived from a ground-based infrared cloud measurement and two ceilometers. Adv. Meteorol. 2015, 2015. [Google Scholar] [CrossRef] [Green Version]
  32. Morris, V.R. Ceilometer Instrument Handbook; DOE Office of Science Atmospheric Radiation Measurement (ARM) User Facility (United States); US department of Energy: Washington, DC, USA, 2016. [Google Scholar]
  33. Protat, A.; Armstrong, A.; Haeffelin, M.; Morille, Y.; Pelon, J.; Delanoë, J.; Bouniol, D. Impact of conditional sampling and instrumental limitations on the statistics of cloud properties derived from cloud radar and lidar at SIRTA. Geophys. Res. Lett. 2006, 33. [Google Scholar] [CrossRef]
  34. Berendes, T.A.; Berendes, D.A.; Welch, R.M.; Dutton, E.G.; Uttal, T.; Clothiaux, E.E. Cloud cover comparisons of the MODIS daytime cloud mask with surface instruments at the north slope of Alaska ARM site. IEEE Trans. Geosci. Remote Sens. 2004, 42, 2584–2593. [Google Scholar] [CrossRef]
  35. Meerkötter, R.; Zinner, T. Satellite remote sensing of cloud base height for convective cloud fields: A case study. Geophys. Res. Lett. 2007. [Google Scholar] [CrossRef] [Green Version]
  36. Sharma, S.; Vaishnav, R.; Shukla, M.V.; Kumar, P.; Kumar, P.; Thapliyal, P.K.; Lal, S.; Acharya, Y.B. Evaluation of cloud base height measurements from Ceilometer CL31 and MODIS satellite over Ahmedabad, India. Atmos. Meas. Tech. 2016, 9, 711–719. [Google Scholar] [CrossRef] [Green Version]
  37. Khlopenkov, K.V.; Spangenberg, D.A.; Smith, W.L. Fusion of surface ceilometer data and satellite cloud retrievals in 2D mesh interpolating model with clustering. In Proceedings of the Remote Sensing of Clouds and the Atmosphere XXIV; Comerón, A., Kassianov, E.I., Schäfer, K., Picard, R.H., Weber, K., Singh, U.N., Eds.; SPIE: Washington, DC, USA, 2019; Volume 11152, p. 49. [Google Scholar]
  38. Maturilli, M.; Kayser, M. Arctic warming, moisture increase and circulation changes observed in the Ny-Ålesund homogenized radiosonde record. Theor. Appl. Climatol. 2017, 130. [Google Scholar] [CrossRef] [Green Version]
  39. Serreze, M.C.; Barrett, A.P.; Cassano, J.J. Circulation and surface controls on the lower tropospheric air temperature field of the Arctic. J. Geophys. Res. Atmos. 2011, 116. [Google Scholar] [CrossRef]
  40. Nomokonova, T.; Ebell, K.; Löhnert, U.; Maturilli, M.; Ritter, C.; O’Connor, E. Statistics on clouds and their relation to thermodynamic conditions at Ny-Ålesund using ground-based sensor synergy. Atmos. Chem. Phys. 2019, 19, 4105–4126. [Google Scholar] [CrossRef] [Green Version]
  41. Shupe, M.D.; Walden, V.P.; Eloranta, E.; Uttal, T.; Campbell, J.R.; Starkweather, S.M.; Shiobara, M. Clouds at Arctic atmospheric observatories. Part I: Occurrence and macrophysical properties. J. Appl. Meteorol. Climatol. 2011, 50, 626–644. [Google Scholar] [CrossRef] [Green Version]
  42. Yeo, H.; Park, S.J.; Kim, B.M.; Shiobara, M.; Kim, S.W.; Kwon, H.; Kim, J.H.; Jeong, J.H.; Park, S.S.; Choi, T. The observed relationship of cloud to surface longwave radiation and air temperature at Ny-Ålesund, Svalbard. Tellus B Chem. Phys. Meteorol. 2018, 70. [Google Scholar] [CrossRef] [Green Version]
  43. Fraile, R.; Castro, A.; González-Colino, M.; Alonso-Blanco, E.; Fernández-Raga, M.; Palencia, C.; Calvo, A.I. Vertical raindrop size distribution in central Spain: A case study. Adv. Meteorol. 2015, 2015. [Google Scholar] [CrossRef] [Green Version]
  44. Zhou, L.; Dong, X.; Fu, Z.; Wang, B.; Leng, L.; Xi, B.; Cui, C. Vertical Distributions of Raindrops and Z-R Relationships Using Microrain Radar and 2-D-Video Distrometer Measurements During the Integrative Monsoon Frontal Rainfall Experiment (IMFRE). J. Geophys. Res. Atmos. 2020, 125. [Google Scholar] [CrossRef] [Green Version]
  45. Wang, H.; Lei, H.; Yang, J. Microphysical processes of a stratiform precipitation event over eastern China: Analysis using micro rain radar data. Adv. Atmos. Sci. 2017, 34, 1472–1482. [Google Scholar] [CrossRef]
  46. Maahn, M.; Burgard, C.; Crewell, S.; Gorodetskaya, I.V.; Kneifel, S.; Lhermitte, S.; Van Tricht, K.; van Lipzig, N.P.M. How does the spaceborne radar blind zone affect derived surface snowfall statistics in polar regions? J. Geophys. Res. 2014, 119, 13604–13620. [Google Scholar] [CrossRef] [Green Version]
  47. Maturilli, M.; Kayser, M. Homogenized Radiosonde Record at Station Ny-Ålesund, Spitsbergen, 1993–2014. 2016. Available online: https://doi.pangaea.de/10.1594/PANGAEA.845373 (accessed on 1 March 2021).
  48. Vassel, M.; Ickes, L.; Maturilli, M.; Hoose, C. Classification of Arctic multilayer clouds using radiosonde and radar data in Svalbard. Atmos. Chem. Phys. 2019, 19, 5111–5126. [Google Scholar] [CrossRef] [Green Version]
  49. Miloshevich, L.M.; Paukkunen Vaisala, A.; Helsinki, O.; Oltmans, S.J. Development and Validation of a Time-lag Correction for Vaisala Radiosonde Humidity Measurements. J. Atmos. Ocean. Technol. 2004, 21, 1305–1327. [Google Scholar] [CrossRef]
  50. Hersbach, H.; Bell, B.; Berrisford, P.; Hirahara, S.; Horányi, A.; Muñoz-Sabater, J.; Nicolas, J.; Peubey, C.; Radu, R.; Schepers, D.; et al. The ERA5 global reanalysis. Q. J. R. Meteorol. Soc. 2020, 146, 1999–2049. [Google Scholar] [CrossRef]
  51. Graham, R.M.; Hudson, S.R.; Maturilli, M. Improved Performance of ERA5 in Arctic Gateway Relative to Four Global Atmospheric Reanalyses. Geophys. Res. Lett. 2019, 46, 6138–6147. [Google Scholar] [CrossRef] [Green Version]
  52. Wang, X.; Key, J.R. Arctic surface, cloud, and radiation properties based on the AVHRR polar pathfinder dataset. Part II: Recent trends. J. Clim. 2005, 18, 2575–2593. [Google Scholar] [CrossRef]
  53. Warren, S.G.; Hahn, C.J.; London, J.; Chervin, R.M.; Jenne, R.L. Global Distribution of Total Cloud Cover and Cloud Type Amounts over the Ocean; National Center for Atmospheric Research: Boulder, CO, USA, 1988. [Google Scholar]
  54. Shupe, M.D.; Intrieri, J.M. Cloud radiative forcing of the Arctic surface: The influence of cloud properties, surface albedo, and solar zenith angle. J. Clim. 2004, 17, 616–628. [Google Scholar] [CrossRef]
  55. Ebell, K.; Nomokonova, T.; Maturilli, M.; Ritter, C. Radiative effect of clouds at ny-Ålesund, svalbard, as inferred from ground-based remote sensing observations. J. Appl. Meteorol. Climatol. 2020, 59, 3–22. [Google Scholar] [CrossRef] [Green Version]
  56. Láska, K.; Chládová, Z.; Ambrožová, K.; Husák, J. Cloudiness and weather variation in central Svalbard in July 2013 as related to atmospheric circulation. Czech Polar Rep. 2013, 3, 184–195. [Google Scholar] [CrossRef]
  57. Nuncio, M.; Chatterjee, S.; Satheesan, K.; Chenoli, S.N.; Subeesh, M.P. Temperature and precipitation during winter in NyÅlesund, Svalbard and possible tropical linkages. Tellus A Dyn. Meteorol. Oceanogr. 2020, 72, 1–15. [Google Scholar] [CrossRef] [Green Version]
Figure 1. Geographical topographic map of Svalbard. The red triangle mark represents the location of the ceilometer and MRR2 observation site.
Remotesensing 13 02808 g001
Figure 2. Percentage of days in the corresponding month for which ceilometer data are available. Note that months with more than 70% days of data are used for the analysis.
Remotesensing 13 02808 g002
Figure 3. (a) Annual cycle of the cloud occurrence (black, in percentage) and probability of detection CBH2 (red line) in percentage. (b) Seasonal average of cloud occurrence in percentage.
Remotesensing 13 02808 g003
Figure 4. Monthly mean CBH heights for the three layers detected by the ceilometer. The error bars indicate one standard deviation value.
Remotesensing 13 02808 g004
Figure 5. Monthly mean cycle of low (red, lowest CBH < 2000 m), mid (blue, 2000 m < lowest CBH < 5000 m) and high (black, lowest CBH > 5000 m) clouds expressed in percentage. The left Y-axis refers to the mid and high-level clouds and the right Y-axis for low-level clouds.
Remotesensing 13 02808 g005
Figure 6. Height distributions of three cloud bases detected by ceilometer for June 2017 (Summer), October 2015 and 2017 (Autumn), January 2016 (Winter), April 2016 and 2017 (Spring). The Y-axis shows the percentage of occurrences at different height ranges shown in X axis.
Remotesensing 13 02808 g006
Figure 7. Distance between consecutive cloud base heights. The blue line shows the distance between the highest and middle CBH. The solid red line indicates the difference between the middle and the lowest CBH in the case of two-layered cloud systems as detected by the ceilometer, while the dashed red line indicates the same but for three-layered cloud cases.
Remotesensing 13 02808 g007
Figure 8. Radar reflectivity (dBz) from MRR2 vs. cloud base heights (meter) derived from ceilometer. The pink shaded regions represent moderate to heavy precipitation events.
Remotesensing 13 02808 g008
Figure 9. Joint histogram plots for (a) CBH1 vs. snowfall rate and (b) CBH1 vs. precipitation for the periods the same as Figure 8. The colour bar indicates the bin counts for each variable.
Remotesensing 13 02808 g009
Figure 10. Relationships between CBH1 vs. precipitation intensity for (a) heavy rainy day and (b) light rainy day.
Remotesensing 13 02808 g010
Figure 11. The ERA5 Surface air temperature overlaid on accumulated precipitation for a heavy rainy day (top panel) and a light rainy day (bottom panel). The red mark is assigned for the station location.
Remotesensing 13 02808 g011
Figure 12. Vertical profiles of temperature and humidity (a,b) and their differences (c,d) for the heavy rainy day and light rainy day.
Remotesensing 13 02808 g012
Figure 13. The ERA5 850 hPa winds overlaid on mean sea level pressure (MSLP) for a heavy rainy day (top panel) and light rainy day (bottom panel). The red mark is assigned for the station location.
Remotesensing 13 02808 g013
Figure 14. The ERA5 time-height plot for (a) heavy rainy day and (b) light rainy day.
Remotesensing 13 02808 g014
Table 1. The CL51 ceilometer specifications.
PropertiesTechnical Specifications
Wavelength (nm)910 ± 10
Vertical resolution (m)10 m
Temporal resolution (s)6 s
Vertical limit (m)Up to 3 cloud base heights (CBHs)
Transmitterpulsed
Peak power (Watt)27
Pulse repetition frequency (kHz)6.5
Detection range (km)~15 km
Table 2. The micro rain radar (MRR2) specifications.
PropertiesTechnical Specifications
Frequency of operation K-Band (~24 GHz)
Working method Doppler’s principle
Sampling Frequency 125 kHz
TransmitterContinuous
Vertical resolution >10 m
Velocity resolution0.188 m/s
Nyquist Velocity Range0–12.3 m/s
Detection range (m)50–6000 m
Publisher’s Note: MDPI stays neutral with regard to jurisdictional claims in published maps and institutional affiliations.

