Technical Note

Preliminary Application of Ground-Penetrating Radar for Reconstruction of Root System Architecture in Moso Bamboo

1
State Key Laboratory of Subtropical Silviculture, Zhejiang A & F University, Lin’an 311300, China
2
Zhejiang Provincial Collaborative Innovation Center for Bamboo Resources and High-Efficiency Utilization, Zhejiang A & F University, Lin’an 311300, China
3
Key Laboratory of Carbon Cycling in Forest Ecosystems and Carbon Sequestration of Zhejiang Province, Zhejiang A & F University, Lin’an 311300, China
4
School of Environmental and Resources Science, Zhejiang A & F University, Lin’an 311300, China
*
Author to whom correspondence should be addressed.
These authors contributed equally to this work.
Remote Sens. 2021, 13(14), 2816; https://0-doi-org.brum.beds.ac.uk/10.3390/rs13142816
Submission received: 18 June 2021 / Revised: 9 July 2021 / Accepted: 13 July 2021 / Published: 17 July 2021
(This article belongs to the Special Issue Advanced Ground Penetrating Radar Theory and Applications)

Abstract

:
Root system architecture (RSA) refers to the geometric features and topology of the root system. Ground-penetrating radar (GPR) is a possible method of RSA reconstruction. However, because the topology of the root system is not directly accessible by GPR, GPR-based reconstruction must be complemented by manual connection of root points, resulting in limited accuracy. In this study, we used both GPR and direct excavation to obtain 3D coordinates (XYZ coordinates) and diameters of moso bamboo rhizomes on an orthogonal grid. A score function for selecting the best-connected root points was developed using rhizome diameter, depth, extension angle, and measured line spacing, which was then used to recover the topology of discrete root points. Based on the recovered topology, the 3D RSA of the rhizomes was reconstructed using a smoothing function. Based on the excavation data, the reconstructed RSA was generally consistent with the measured RSA, with 78.13% of root points correctly connected. The reconstructed RSA based on GPR data thus provided a rough approximation of the measured RSA, with errors arising due to missing root points and rhizome displacement. The proposed algorithm for reconstructing 3D RSA further enriches the application of ground-penetrating radar to root detection.

Graphical Abstract

1. Introduction

Coarse roots (diameter ≥ 5 mm) are essential for a wide variety of plant processes, including anchoring and supporting the plant, absorbing and transporting nutrients and water, and storing products of photosynthesis [1,2]. Recently, the important role of coarse roots in below-ground, long-term carbon sequestration has gradually been gaining recognition [3,4,5]. The spatial distribution of roots throughout the soil profile, including the geometry and spatial topology of the root system, is referred to as root system architecture (RSA) [6,7]. Differences in RSA can have a remarkable impact on the efficiency of physiological functions such as water and nutrient uptake, plant productivity, root carbon storage capacity, and plant tolerance to abiotic stresses [8,9,10,11,12]. However, in most cases, the study of RSA in the field is typically difficult due to the opacity and complexity of the soil media.
Traditionally, RSAs have been analysed using destructive methods, such as excavation. Although these methods can provide direct, reliable information, they are extremely time- and labour-intensive and may destroy the RSA, which may lead to inaccurate results [13,14,15]. Over the last two decades, digitization programs have been developed in order to reconstruct detailed RSA profiles of coarse root systems, including multi-scale tree graphs (MTGs) and AMAPmod software [16,17]. High-resolution laser scanners have facilitated the study of RSA [18,19]. However, these methods are still limited by the need for excavation.
Moso bamboo (Phyllostachys pubescens) is a clonal plant and an important economic plant and biological resource in southern China [20]. Moso bamboo has a high carbon storage capacity and high erosion resistance, meaning that it plays an important role in mitigating climate change and preventing soil erosion [21,22,23]. Figure 1 illustrates the monopodial rhizome system of moso bamboo. The rhizome divides rapidly and expansively, generating lateral shoots that develop into new rhizomes or new bamboo shoots [24,25]. After the above-ground bamboo is removed, rhizomes can survive for many years, forming a stable under-ground network system [25,26]. Therefore, the rhizome system is crucial for clonal growth and for the spatial distribution and management of the above-ground biomass in moso bamboo. However, field studies on moso bamboo rhizome systems are scarce due to methodological limitations.
To date, non-invasive geophysical techniques have led to some progress in the study of coarse roots in the field [27,28]. Ground-penetrating radar (GPR) is a well-established, non-destructive geophysical technique used widely for in-situ detection of coarse roots [29,30,31,32,33,34,35,36]. However, GPR cannot estimate topological relationships between root points. Therefore, previous GPR-based reconstructions of RSA relied primarily on the operator’s personal experience in manually connecting root points between adjacent radar profiles, an approach which does not consider the ecological characteristics of the plant root system [19,37,38]. Thus, connecting root points scattered across different radar profiles as accurately as possible is the key to accurate GPR-based RSA reconstruction. Recently, Wu et al. [38] developed an algorithm for reconstructing root system topology using radar data collected from concentric scan survey lines, and successfully reconstructed the 3D RSA of a shrub (Caragana microphylla) in the field. However, their algorithm is not applicable to radar data collected from orthogonal grid scan lines. In addition, Ohashi et al. [39] claimed that an algorithm they employed for the reconstruction of 3D RSA based on root point 3D coordinates (XYZ coordinates) and root diameter was suitable for use with GPR. However, this algorithm has not been validated with GPR data. Currently, most GPR-based RSA reconstructions are of single trees and shrubs, and there are no field records regarding the use of this technique used on clonal plants.
In the present study, we therefore aimed to conduct an in-situ survey of moso bamboo rhizomes using GPR, and corroborate the results of this with data obtained from direct excavation of the rhizome system. The objectives of this study were as follows: (1) to explore the feasibility of GPR for moso bamboo rhizome detection; (2) to develop an algorithm for 3D RSA reconstruction based on GPR data collected from orthogonal survey grid lines; and (3) to assess the accuracy of the 3D RSA reconstruction in terms of root point connectivity, total length, volume, and biomass. Our model enables the application of GPR to clonal plant root systems. Quantitative parameters such as rhizome diameter, depth, length, branching pattern, extension angle, and biomass obtained from GPR data can also be used to investigate inter- or intraspecific competition in plant root systems, relationships between root systems and soil nutrients, and the linkage between under-ground and above-ground plant system.

2. Materials and Methods

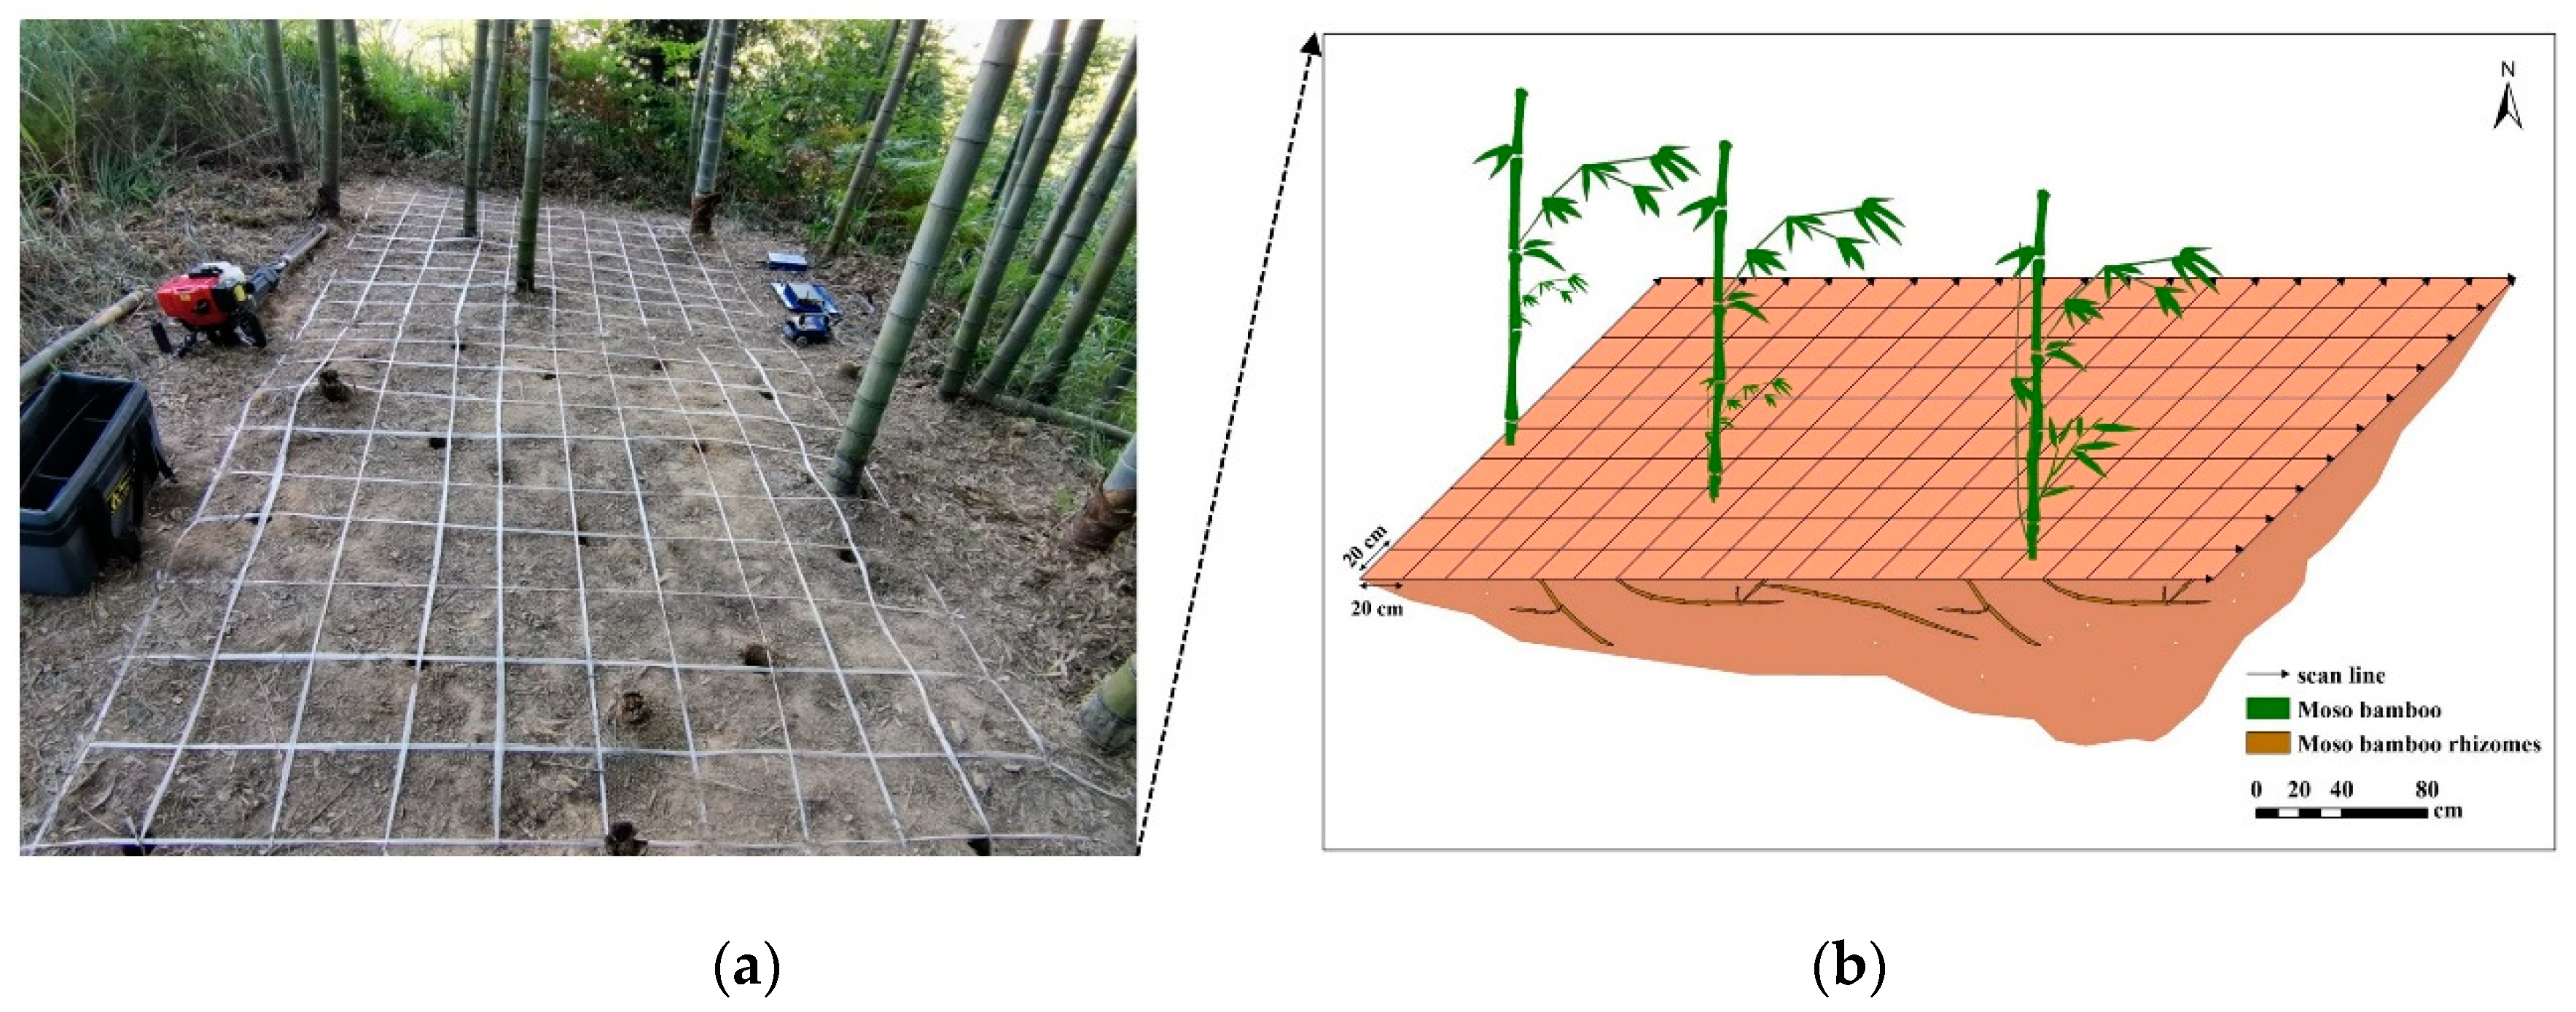
2.1. Study Area and Experimental Design
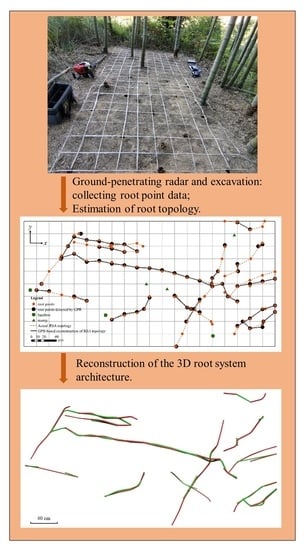
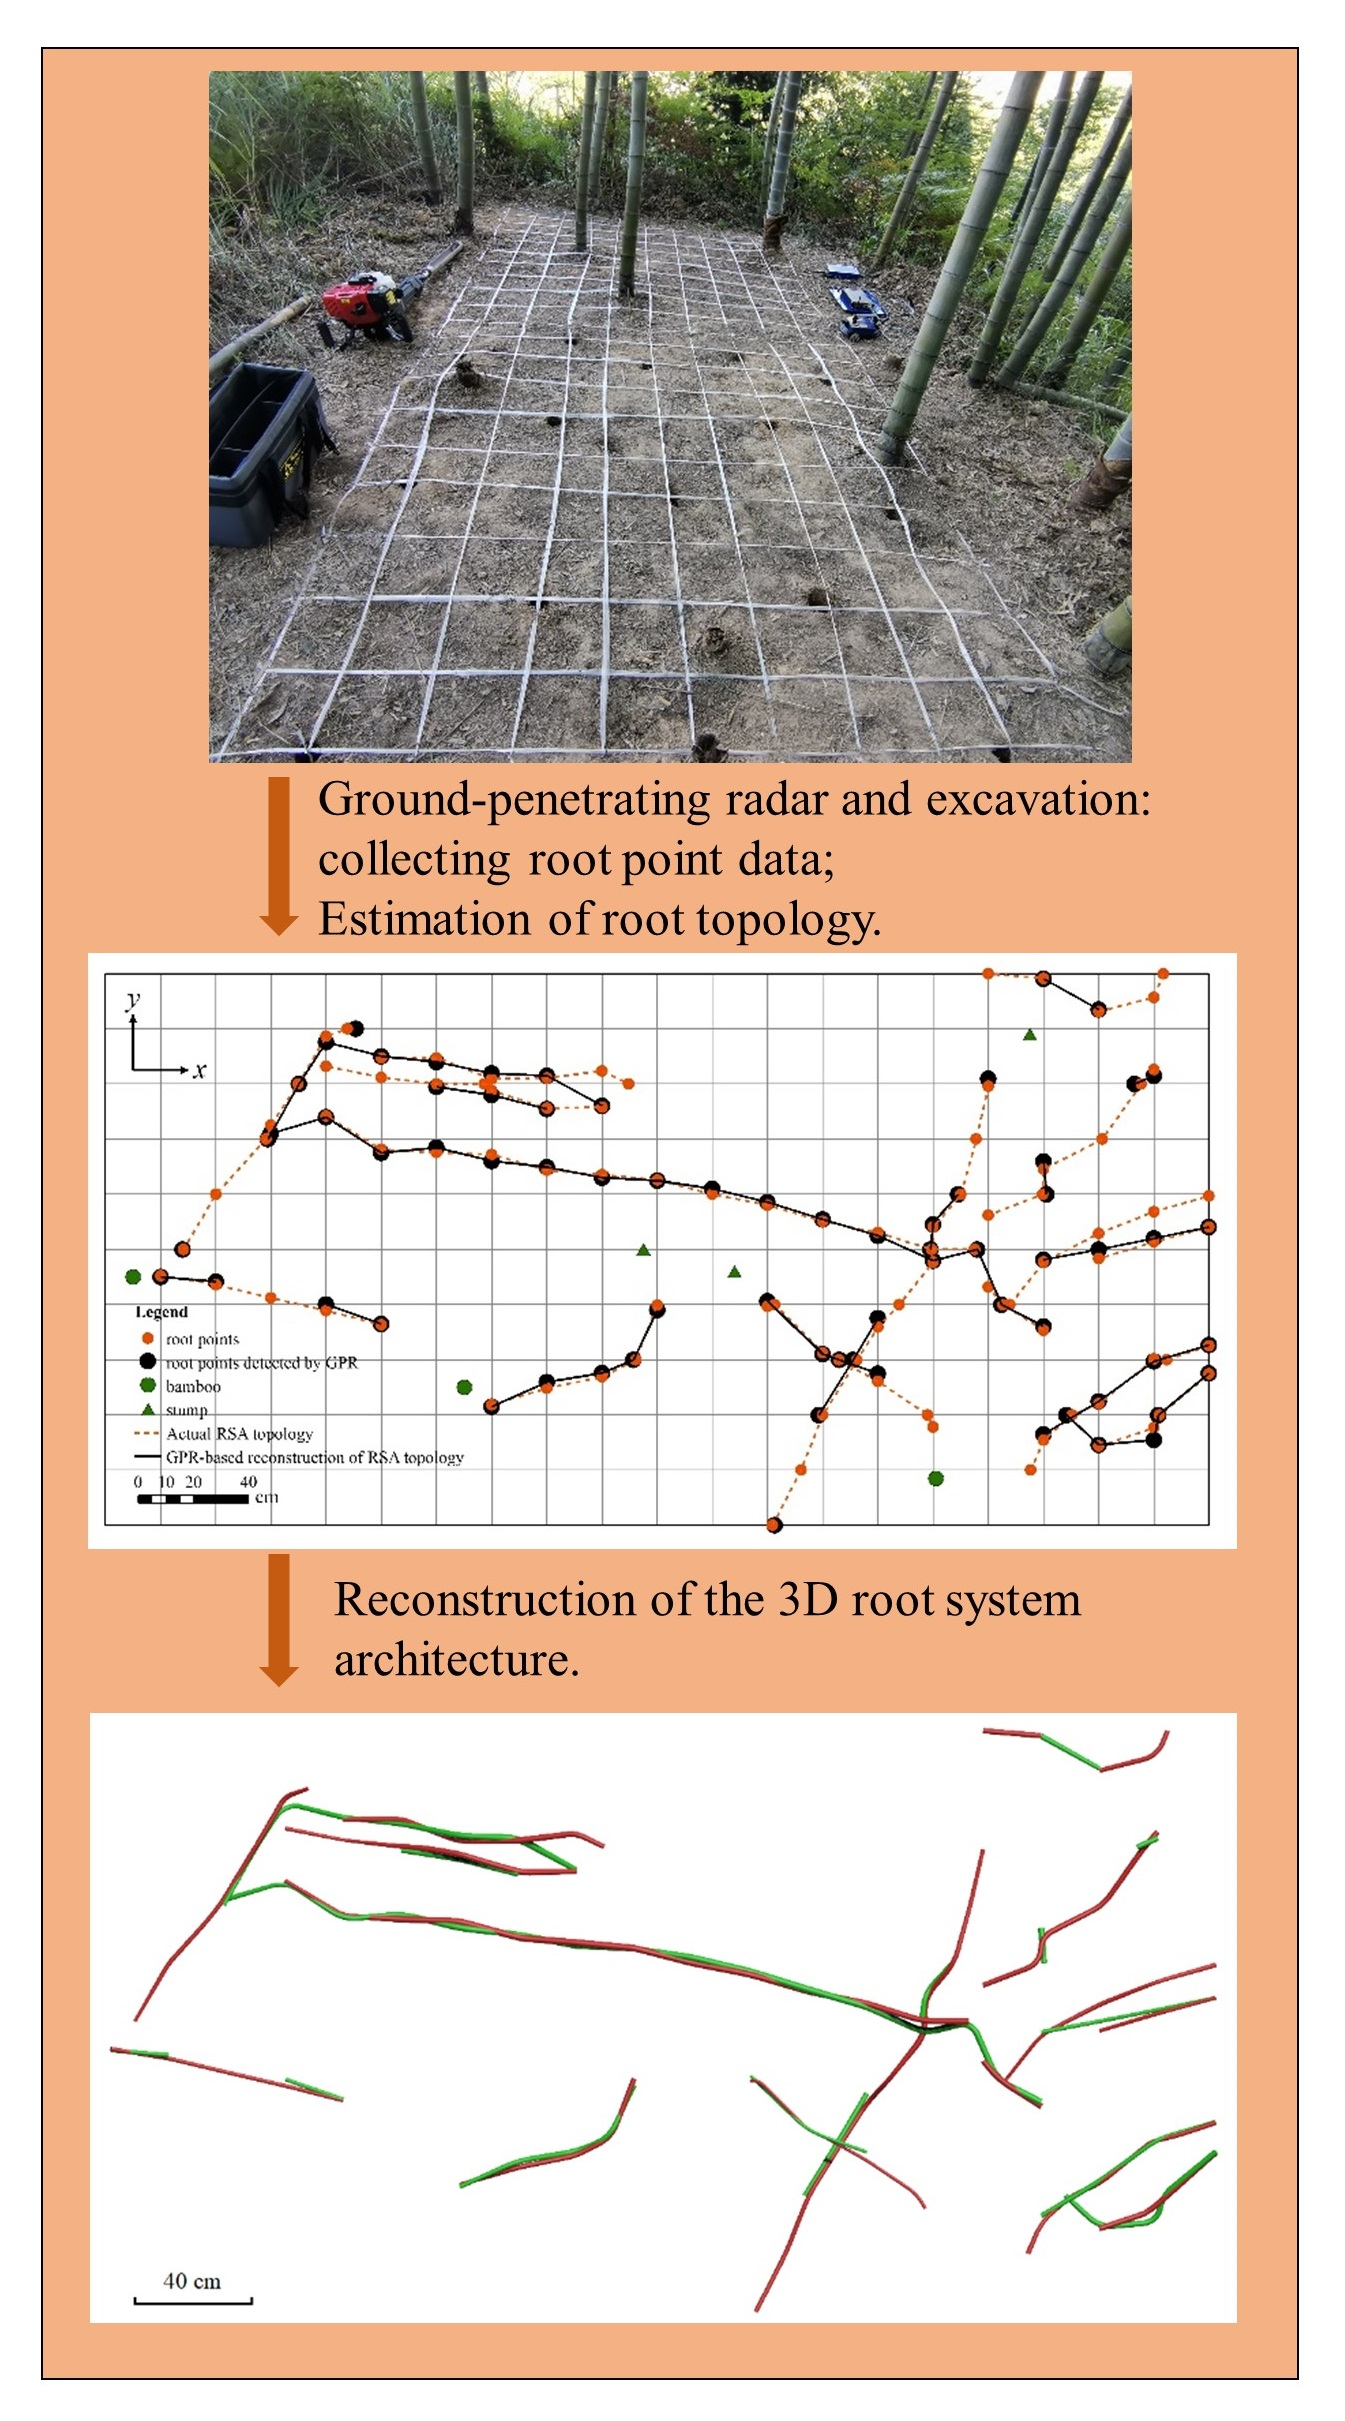
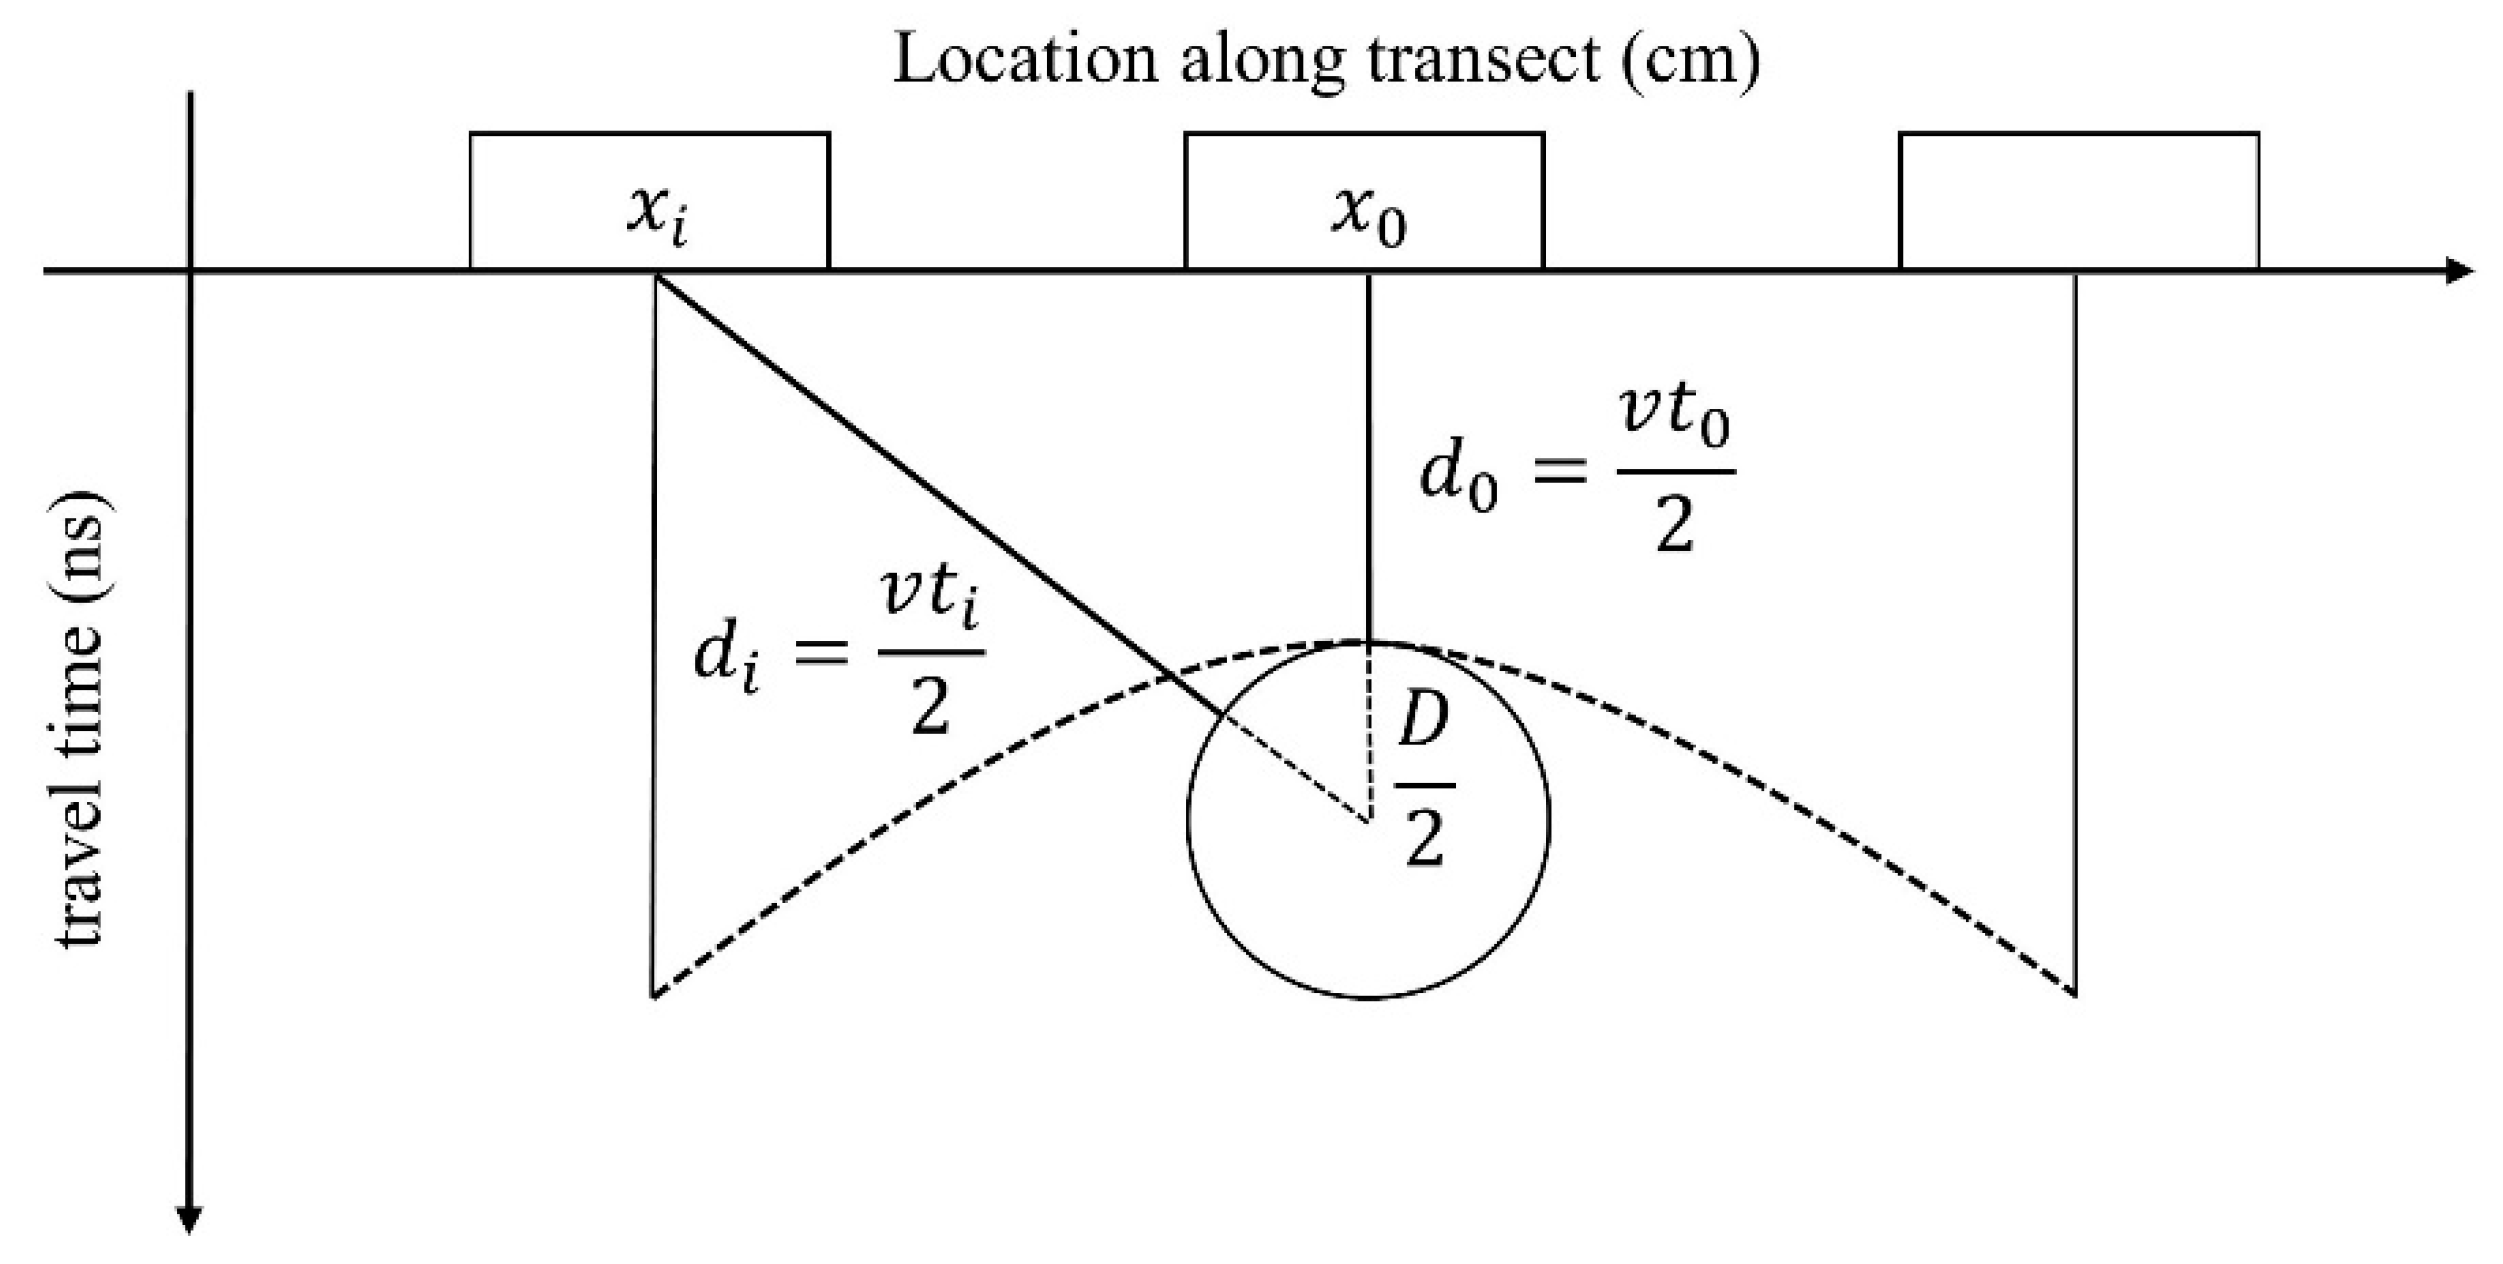
In August 2020, we established a 2 × 4 m sample plot on a 10-year-old moso bamboo plantation in Yanjia Village, Lin’an City, Zhejiang Province, China (119°29′55.6″E, 30°10′29.7″N). Six bamboo plants (including three felled bamboos) occurred on the plot, with an average diameter at breast height of 7.19 cm. To enable the use of GPR in order to detect the rhizomes of these bamboo plants, the plot was uniformly divided into two 2 × 2 m subplots, A and B (Figure 2).
Scan lines were established at 20-cm intervals in both X and Y directions, and marked with ropes to form an orthogonal survey grid (Figure 3). After the careful removal of detritus from the plot, rhizomes (diameter ≥ 5 mm) were detected using a field-portable ground-penetrating radar (GPR) system (GEOTECH Company; Moscow, Russia) with a 1200 MHz antenna. A total of 43 radar raw images were acquired. The plot was then archaeologically excavated to a depth of 50 cm following completion of the GPR scan, and the spatial position information and the diameter of all root points (rhizome diameter ≥ 5 mm) that intersected with the scan lines were recorded. All rhizomes in the sample plot were then placed in plastic valve bags and immediately sent to the laboratory. The total volume of the rhizomes was determined using the drainage method, and the total length of the rhizomes was measured using a tape measure. In addition, the total biomass and mean biomass density of the rhizomes were determined using the drying method. Soil samples were collected from three soil layers (0–10 cm, 10–30 cm, and 30–50 cm deep) using the core method. The water content of both soil and rhizomes were were determined by drying at 80 °C to a constant weight.

2.2. Radar Analysis

All radar raw geo-imaging data were processed using the ReflexW 7.2 software (Sandmeier Geophysical Research; Karlsruhe, Germany). Processing operations included subtracting the mean dewow, bandpass frequency, time varying gain, background removal, and static correction from the radar images. The root point information was obtained from the reflection hyperbolas generated in the pre-processed radar profiles (Figure 4); the vertex of the hyperbola is often defined as the spatial location of the coarse root [27,40,41]. Rhizome diameter was estimated using the hyperbolic model approach described by Ristic et al. [42] and the analysis performed in MATLAB 2018a software.
A simple schematic representation of the principle of estimating rootstock diameter using the hyperbolic model is provided in Figure 5. The relationship between the diameter of the rhizome and the hyperbola identified from the radar profile is as follows:
( D 2 + d i ) 2 = ( D 2 + d 0 ) 2 + ( x 0 x i ) 2
where D is the rhizome diameter; d 0 is the distance from the antenna centre at position x 0 (the distance at which it is directly above the axis of the rhizome), and d i is the distance from the antenna centre to the rhizome at an arbitrary position x i .
The arbitrary distance from the centre of antenna to the rhizome d i can be expressed using the electromagnetic wave propagation velocity ( v ) and the two-way travel time of the reflected electromagnetic wave ( t i ) as d i = ( v t i ) / 2 , i.e., the relative rhizome depth d 0 may be expressed as d 0 = ( v t 0 ) / 2 . Therefore, Expression 1 can be written as a function of D , v , x 0 , and t 0 as follows:
t i = 2 v ( ( v t 0 2 + D 2 ) 2 + ( x 0 x i ) 2 D 2 )
Using Expression 2, it is possible to rearrange the hyperbolic equation into the canonical hyperbolic equation, with ( x 0 , D / v ) as the centre. The canonical hyperbolic equation is as follows:
( t i + D v ) 2 ( t 0 + D v ) 2 ( x 0 x i ) 2 ( v t 0 2 + D 2 ) 2 = 1
In Expression 3, each pair of raw data ( x i ,   t i ) can be obtained from the extracted hyperbola. The optimal v and D can be simultaneously estimated using the Levenberg–Marquardt algorithm in a MATLAB environment.

2.3. 3D RSA Reconstruction
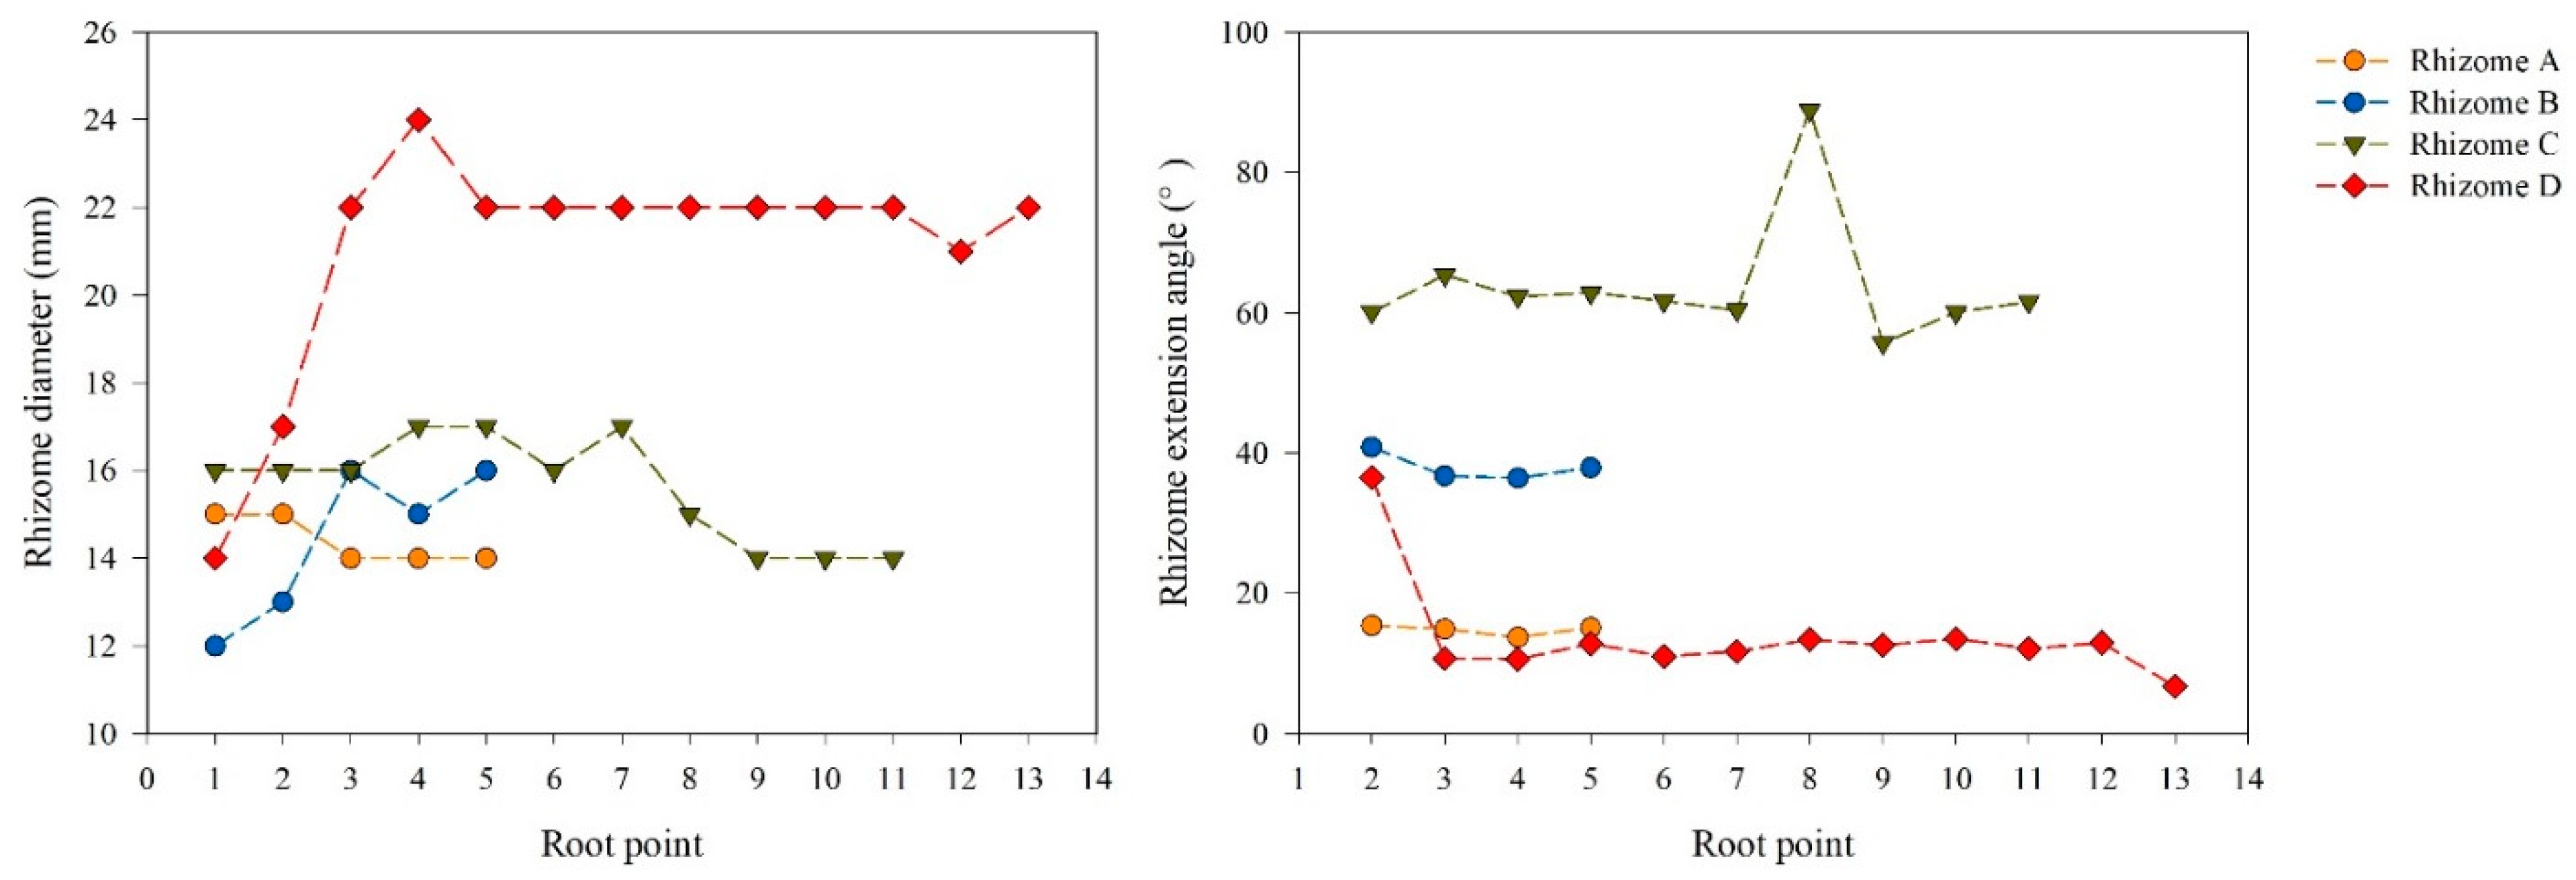
The biological characteristics of trees should be considered when reconstructing 3D RSA. Moso bamboo rhizomes have unique biological characteristics compared to other trees: the rhizomes have a particular growth direction during extension, there is no significant variation in diameter or thickness across the length of the root in mature rhizomes [43,44], and rhizomes vary in the depth at which they occur in the soil. Therefore, we established a score function based on the characteristics of the rhizome diameter ( D ), rhizome depth ( S D ), and rhizome extension angle ( θ ), to reconstruct the topology of the rhizomes, and the RSA was reconstructed from this topology.
Figure 6a is a simple schematic diagram that illustrates the principle of connecting root points. All root points are labeled as P n ( D n ,   S D n ) , where D n is the diameter of the n t h root point and S D n is the depth of the n t h root point. The rhizome extension angle ( θ n ) is calculated as the angle between the line formed by the candidate root point, starting root point, and x-direction was calculated. Important biological characteristics of the roots, such as the guerrilla growth pattern, the difference in the angle ( θ n ), the difference in the diameter ( D n ), and the difference in the depth ( S D n ), were used to construct the root point score function. These characteristics were calculated as follows:
θ n = | θ n + 1 θ n | ,   n 2
D n = | D n + 1 D n | ,   n 1
S D n = | S D n + 1 S D n | ,   n 1
where n is the n t h root point.
To enable intuitive understanding of the contribution of each factor ( D n , S D n , and θ n ) to the scoring function, the scores for each factor were quantified based on a set of scoring rules. The scoring rules for D n , S D n , and θ n are as follows:
  • D n scoring ( S D n ): Due to the insignificant change in diameter in mature rhizomes, D n ( 0 D n 5   mm ) is divided into five classes, such that higher values of D n are represented by lower classes. A score of ten represents the highest class, with subsequent classes represented by subtracting increments of two from the score. If D n > 5   mm , the score is zero.
  • S D n scoring ( S S D n ): Similarly, S D n ( 0 S D n 10   cm ) is divided into ten classes, with higher classes representing lower values of S D n . A score of ten represents the highest class, with one subtracted from the score for each class below this maximum score. If S D n > 10   cm , the score is zero.
  • θ n scoring ( S θ n ): Due to the insignificant variation in rhizome growth direction, changes in rhizome growth direction between 0° and 45° are divided into ten classes, such that every increment of 4.5° represents a score class. Higher values of θ n are represented by lower classes. A score of ten represents the highest class, with one subtracted from the score for each subsequent class. If θ n > 45 ° , the score assigned is −4, which counteracts the contribution of the D and S D scores to the overall root point score function.
The GPR and excavation data were analysed using this algorithm in order to reconstruct the 3D RSA of the rhizomes. The algorithm was executed using the open-source software Python 3.7 software. Figure 6b shows the full root point connection algorithm, which can be divided into the following steps:
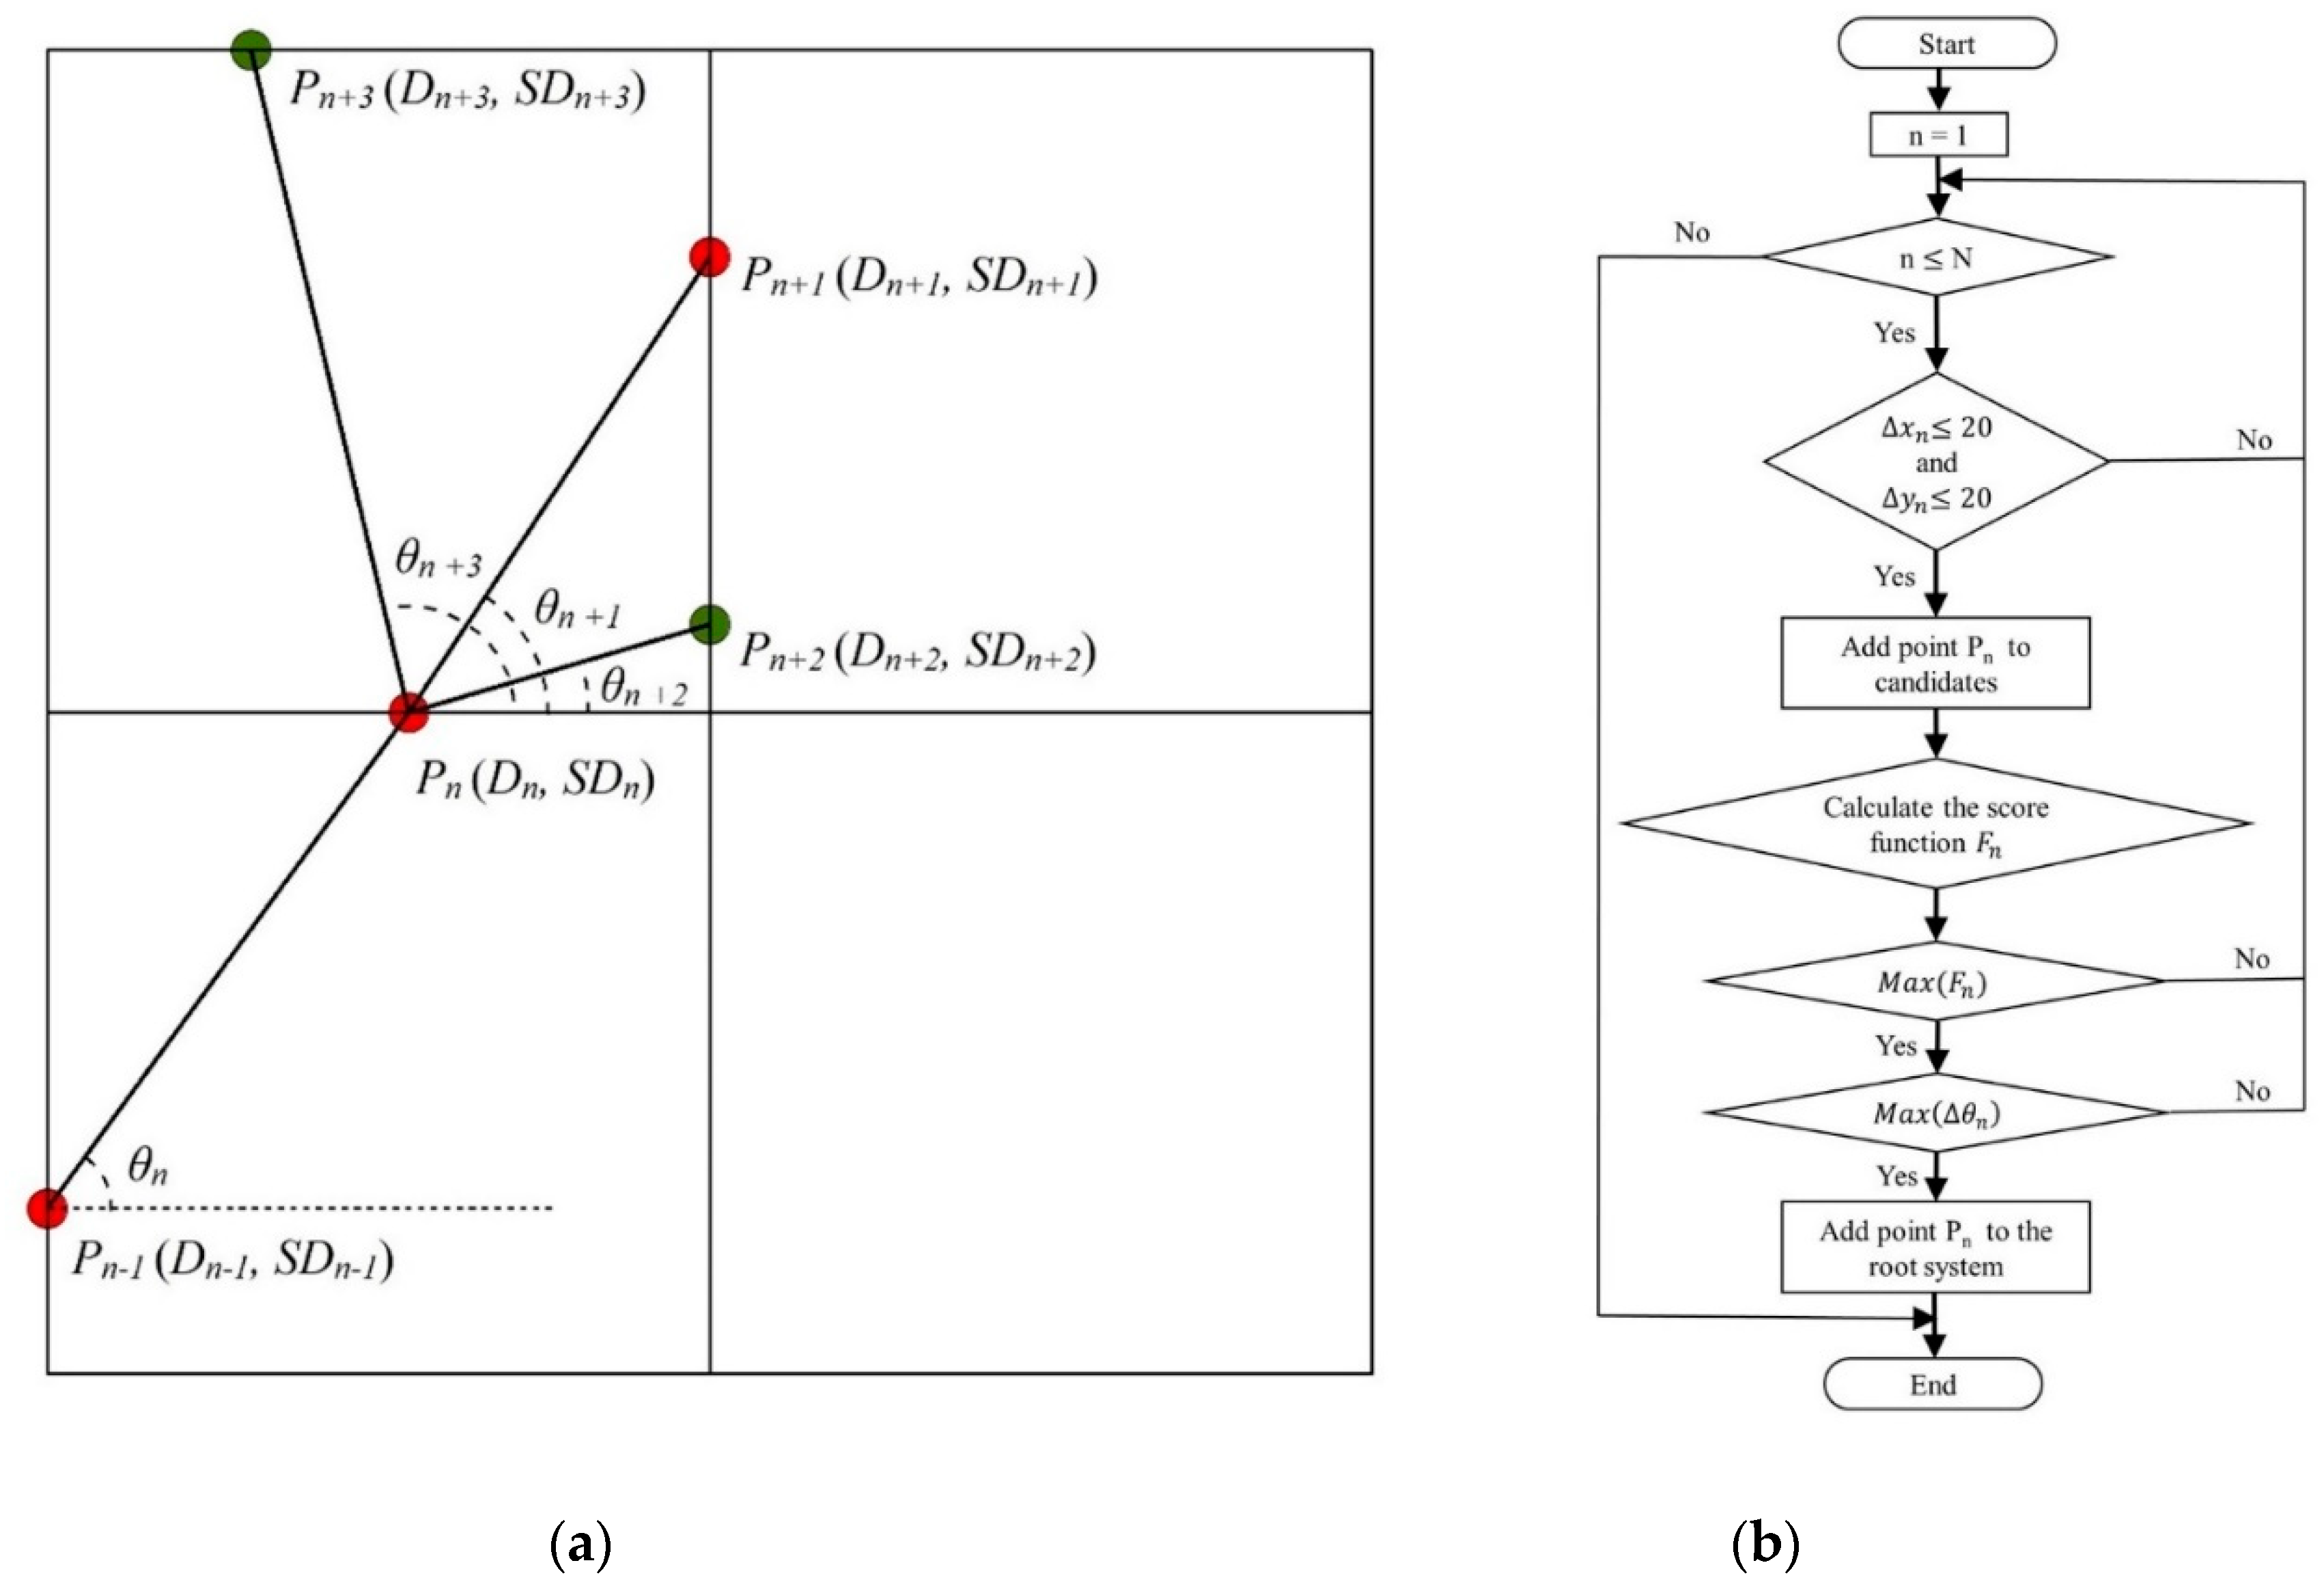
  • Determine the starting root point. Arrange all root points in ascending order based on x-direction. The first occurring root point serves as the initial root point of the root system;
  • Establish candidate root points. Calculate the distance between each root point and the starting root point in the x-direction ( x n ) and the y-direction ( y n ). Search along in the x-direction from the origin. If x n ≤ 20 cm and y n ≤ 20 cm, these points are included as candidate root points;
  • Determine the n t h (n ≥ 2) root point. The score of each candidate root point is calculated using the score function. The root point with the highest score is considered the best-connected root point, while the other root points are involved in the reconstruction of the next root system topology. If the highest score is held by more than one root point, the root point with the lowest θ n is considered to be the best-connected. The score function ( F n ) for each candidate point is as follows:
    F n = { b S D n + c S S D n ,   n = 2 ;   b ,   c [ 0 ,   1 ]     a S θ n + b S D n + c S S D n ,   n > 2 ;   a ,   b ,   c [ 0 ,   1 ]
    where n is the n t h root point, and a, b, and c are the weight parameters. Note that θ n is not used to calculate the score of the second candidate root point;
  • Repeat step three until the reconstruction of the topology of the root system is complete. It should be noted that the root point identified as the best-connected of this root system is no longer involved in the reconstruction of the next root system;
  • Repeat steps one to four until all root system topologies are reconstructed.
Following recovery of the root system topology using this algorithm, 3D RSA was reconstructed using the 3D MAX 2016 software (Autodesk Inc.; San Rafael, CA, USA). At this stage, each reconstructed rhizome branch was determined by directly connecting the root points with straight lines. The connections between root points along the same rhizome branch are modelled using a smoothing function, which estimates a more gradual transition between the diameters of adjacent rhizomes [38].

2.4. Evaluation of the 3D RSA Reconstructed

Both quantitative and qualitative topological analysis methods were used to evaluate the accuracy of the reconstructed 3D RSA. The accuracy of the model was evaluated based on the number and spatial positions of the root point connections, as well as the total length, total volume, and total biomass of the reconstructed 3D RSA. In addition, the reconstructed RSA based on the GPR data was also assessed qualitatively, taking into consideration the deformation of the rhizomes caused by the excavation process. The rhizomes do not tend to vary much in extension diameter or angle from root point to root point, or across their entire length (i.e., they tend to grow in a uniform direction and are the same thickness throughout) (Figure 7), and thus, the rhizomes formed by each of the connected root points can be considered cylindrical. Thus, the total length, volume, and biomass of the rhizome architecture can be estimated using the following equations:
l i = ( x i + 1 x i ) 2 + ( y i + 1 y i ) 2 + ( z i + 1 z i ) 2
L = l i
V = 1 4 π D ι ¯ 2 l i
W = 1 4 π D ι ¯ 2 l i ρ
where i and i + 1 are the two interconnected root points, l i is the length of two interconnected root points, L is the estimated total root length, V is the estimated total volume, W is the estimated total biomass, and ρ is the average density of rhizome biomass (0.7795 g/cm−3 in this study).
The accuracy of RSA reconstruction based on GPR is influenced by the localisation accuracy of the GPR on the rhizomes. The localisation accuracy of GPR detection of the root system was evaluated using the root mean square error (RMSE), which is calculated as follows:
R M S E = n = 1 N ( ( x n x n ¯ ) 2 + ( y n y n ¯ ) 2 + ( z n z n ¯ ) 2 ) N
where ( x n ,   y n ,   z n ) is the 3D coordinate of the n t h measured root point, ( x n ¯ ,   y n ¯ ,   z n ¯ ) is the GPR-based 3D coordinate of the n t h measured root point, and N is the total number of root points.
In addition, we found that the accuracy of the reconstructed RSA depends on the three weighting parameters, a, b, and c. In order to determine the best score function ( F n ), different values of a, b, and c were tested. Table 1 shows the results of these tests. The best score function ( F n ) was obtained when a, b, and c were set at 0.6, 0.2, and 0.2, respectively. Table 1 also shows that rhizome extension angle ( θ ) was the main factor influencing correct connection of the root point. Therefore, it is appropriate to select the root point with the smallest θ n as the best-connected root point when more than one root point receives the highest score based on the score function.

3. Results

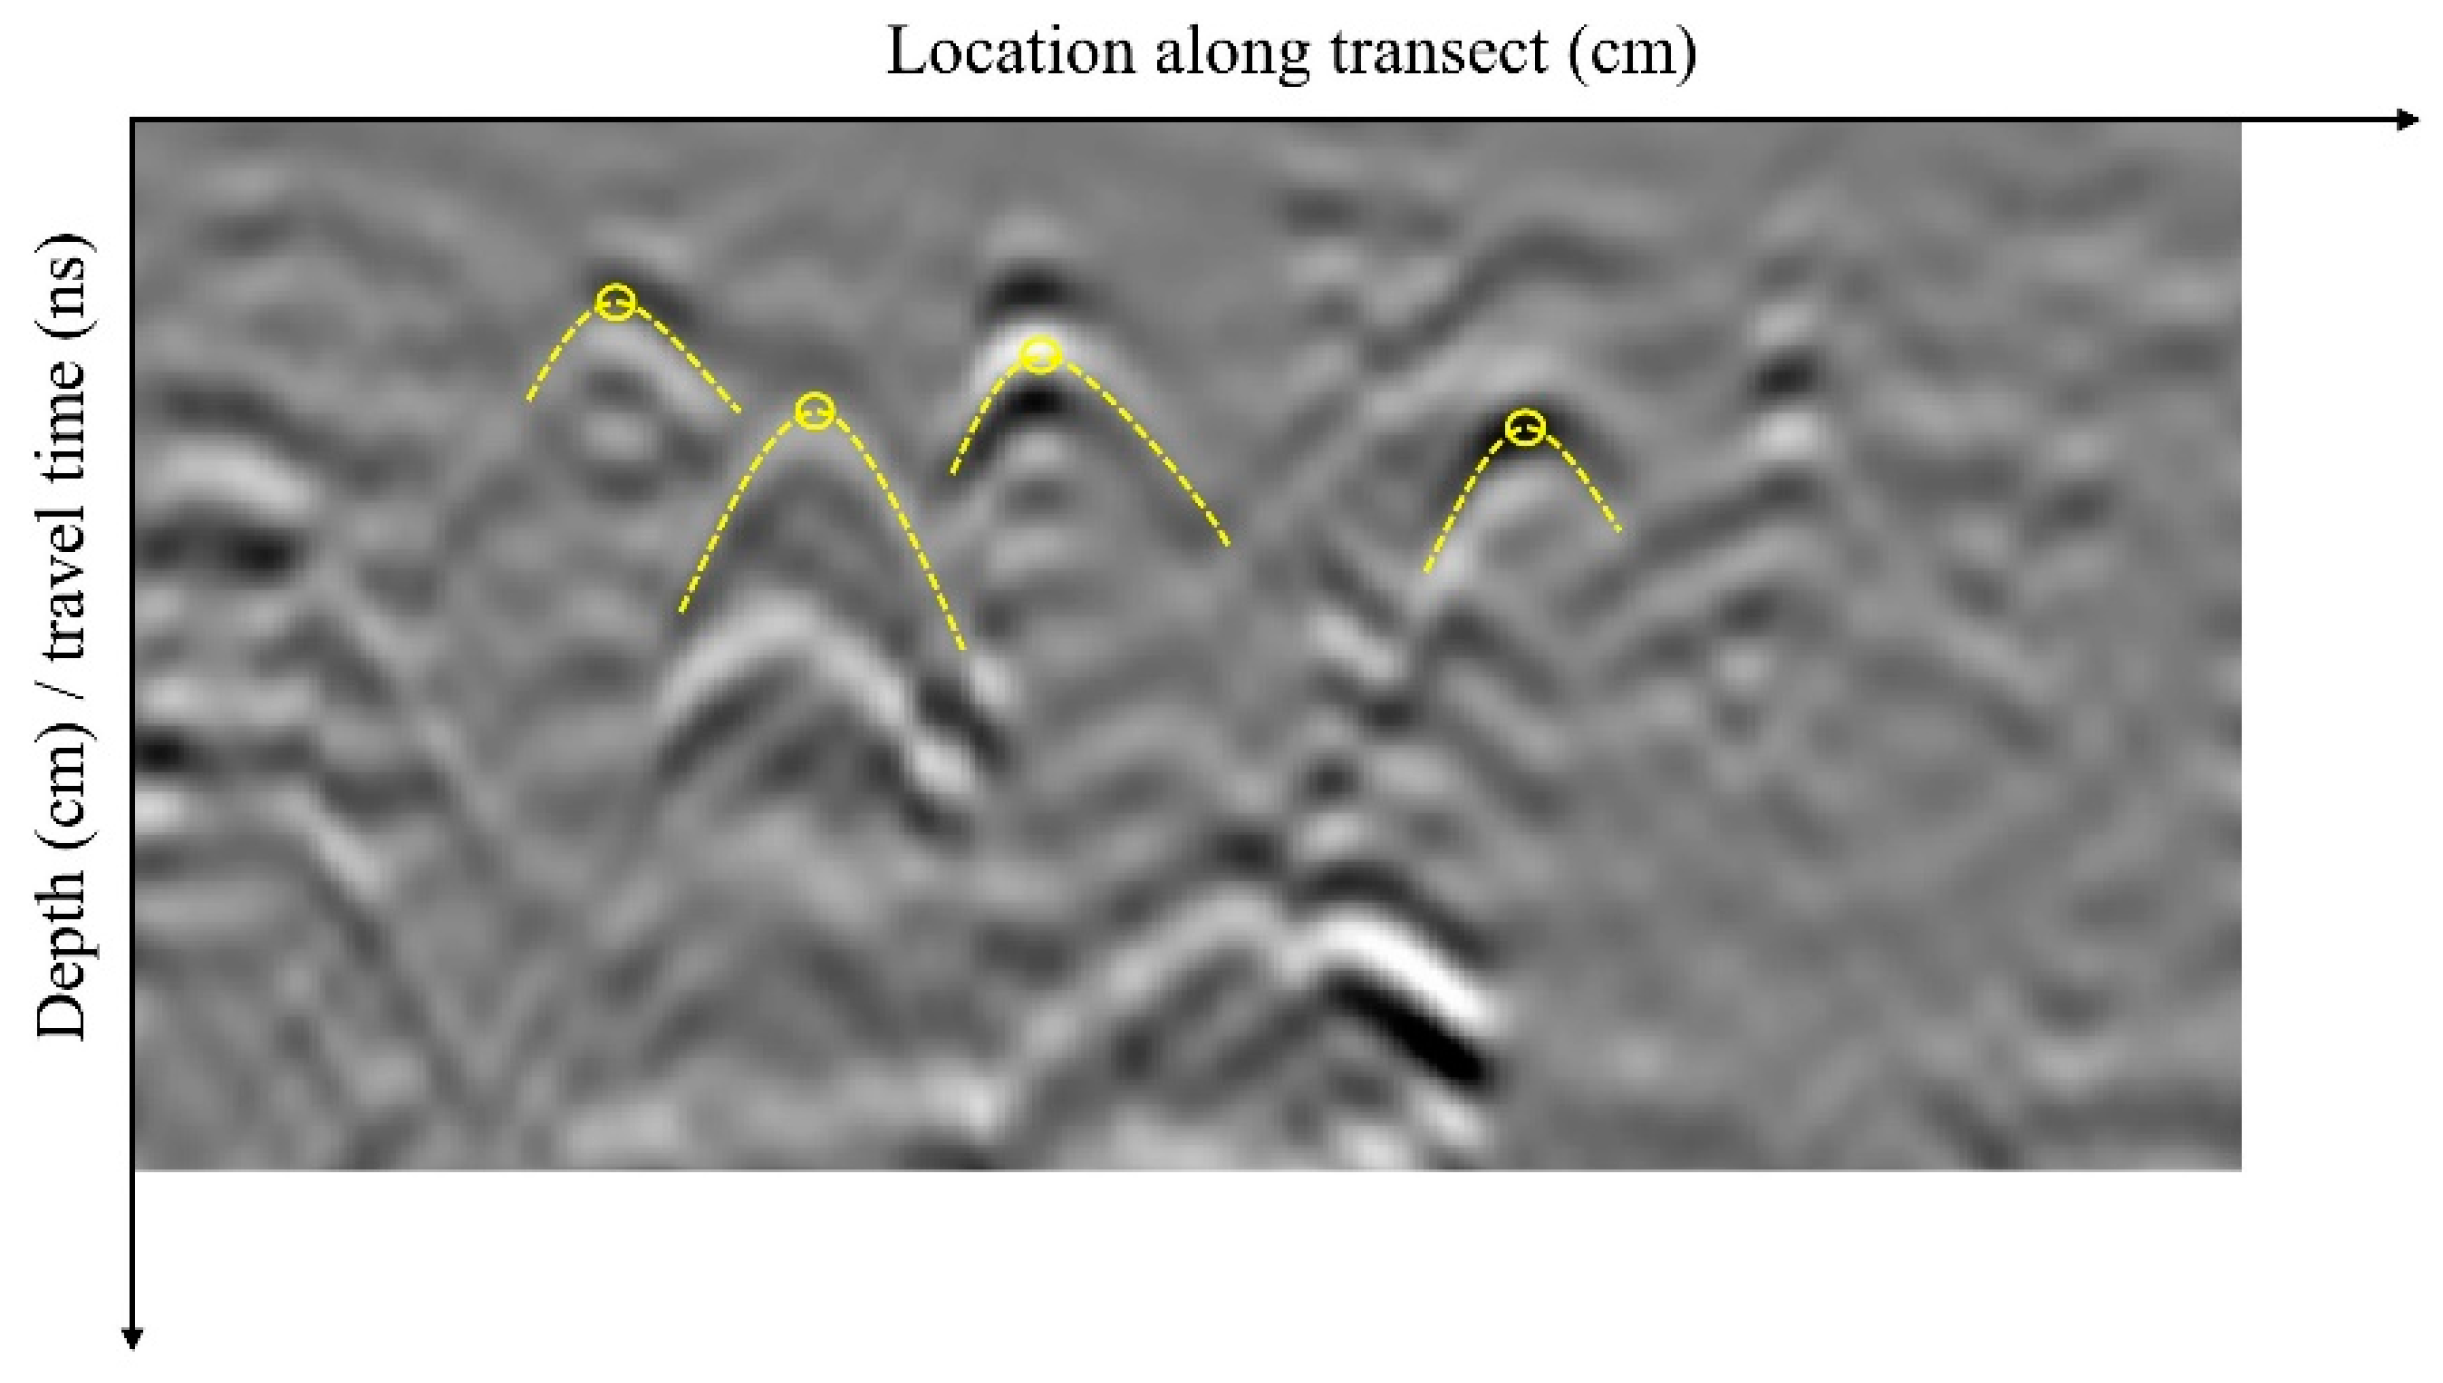
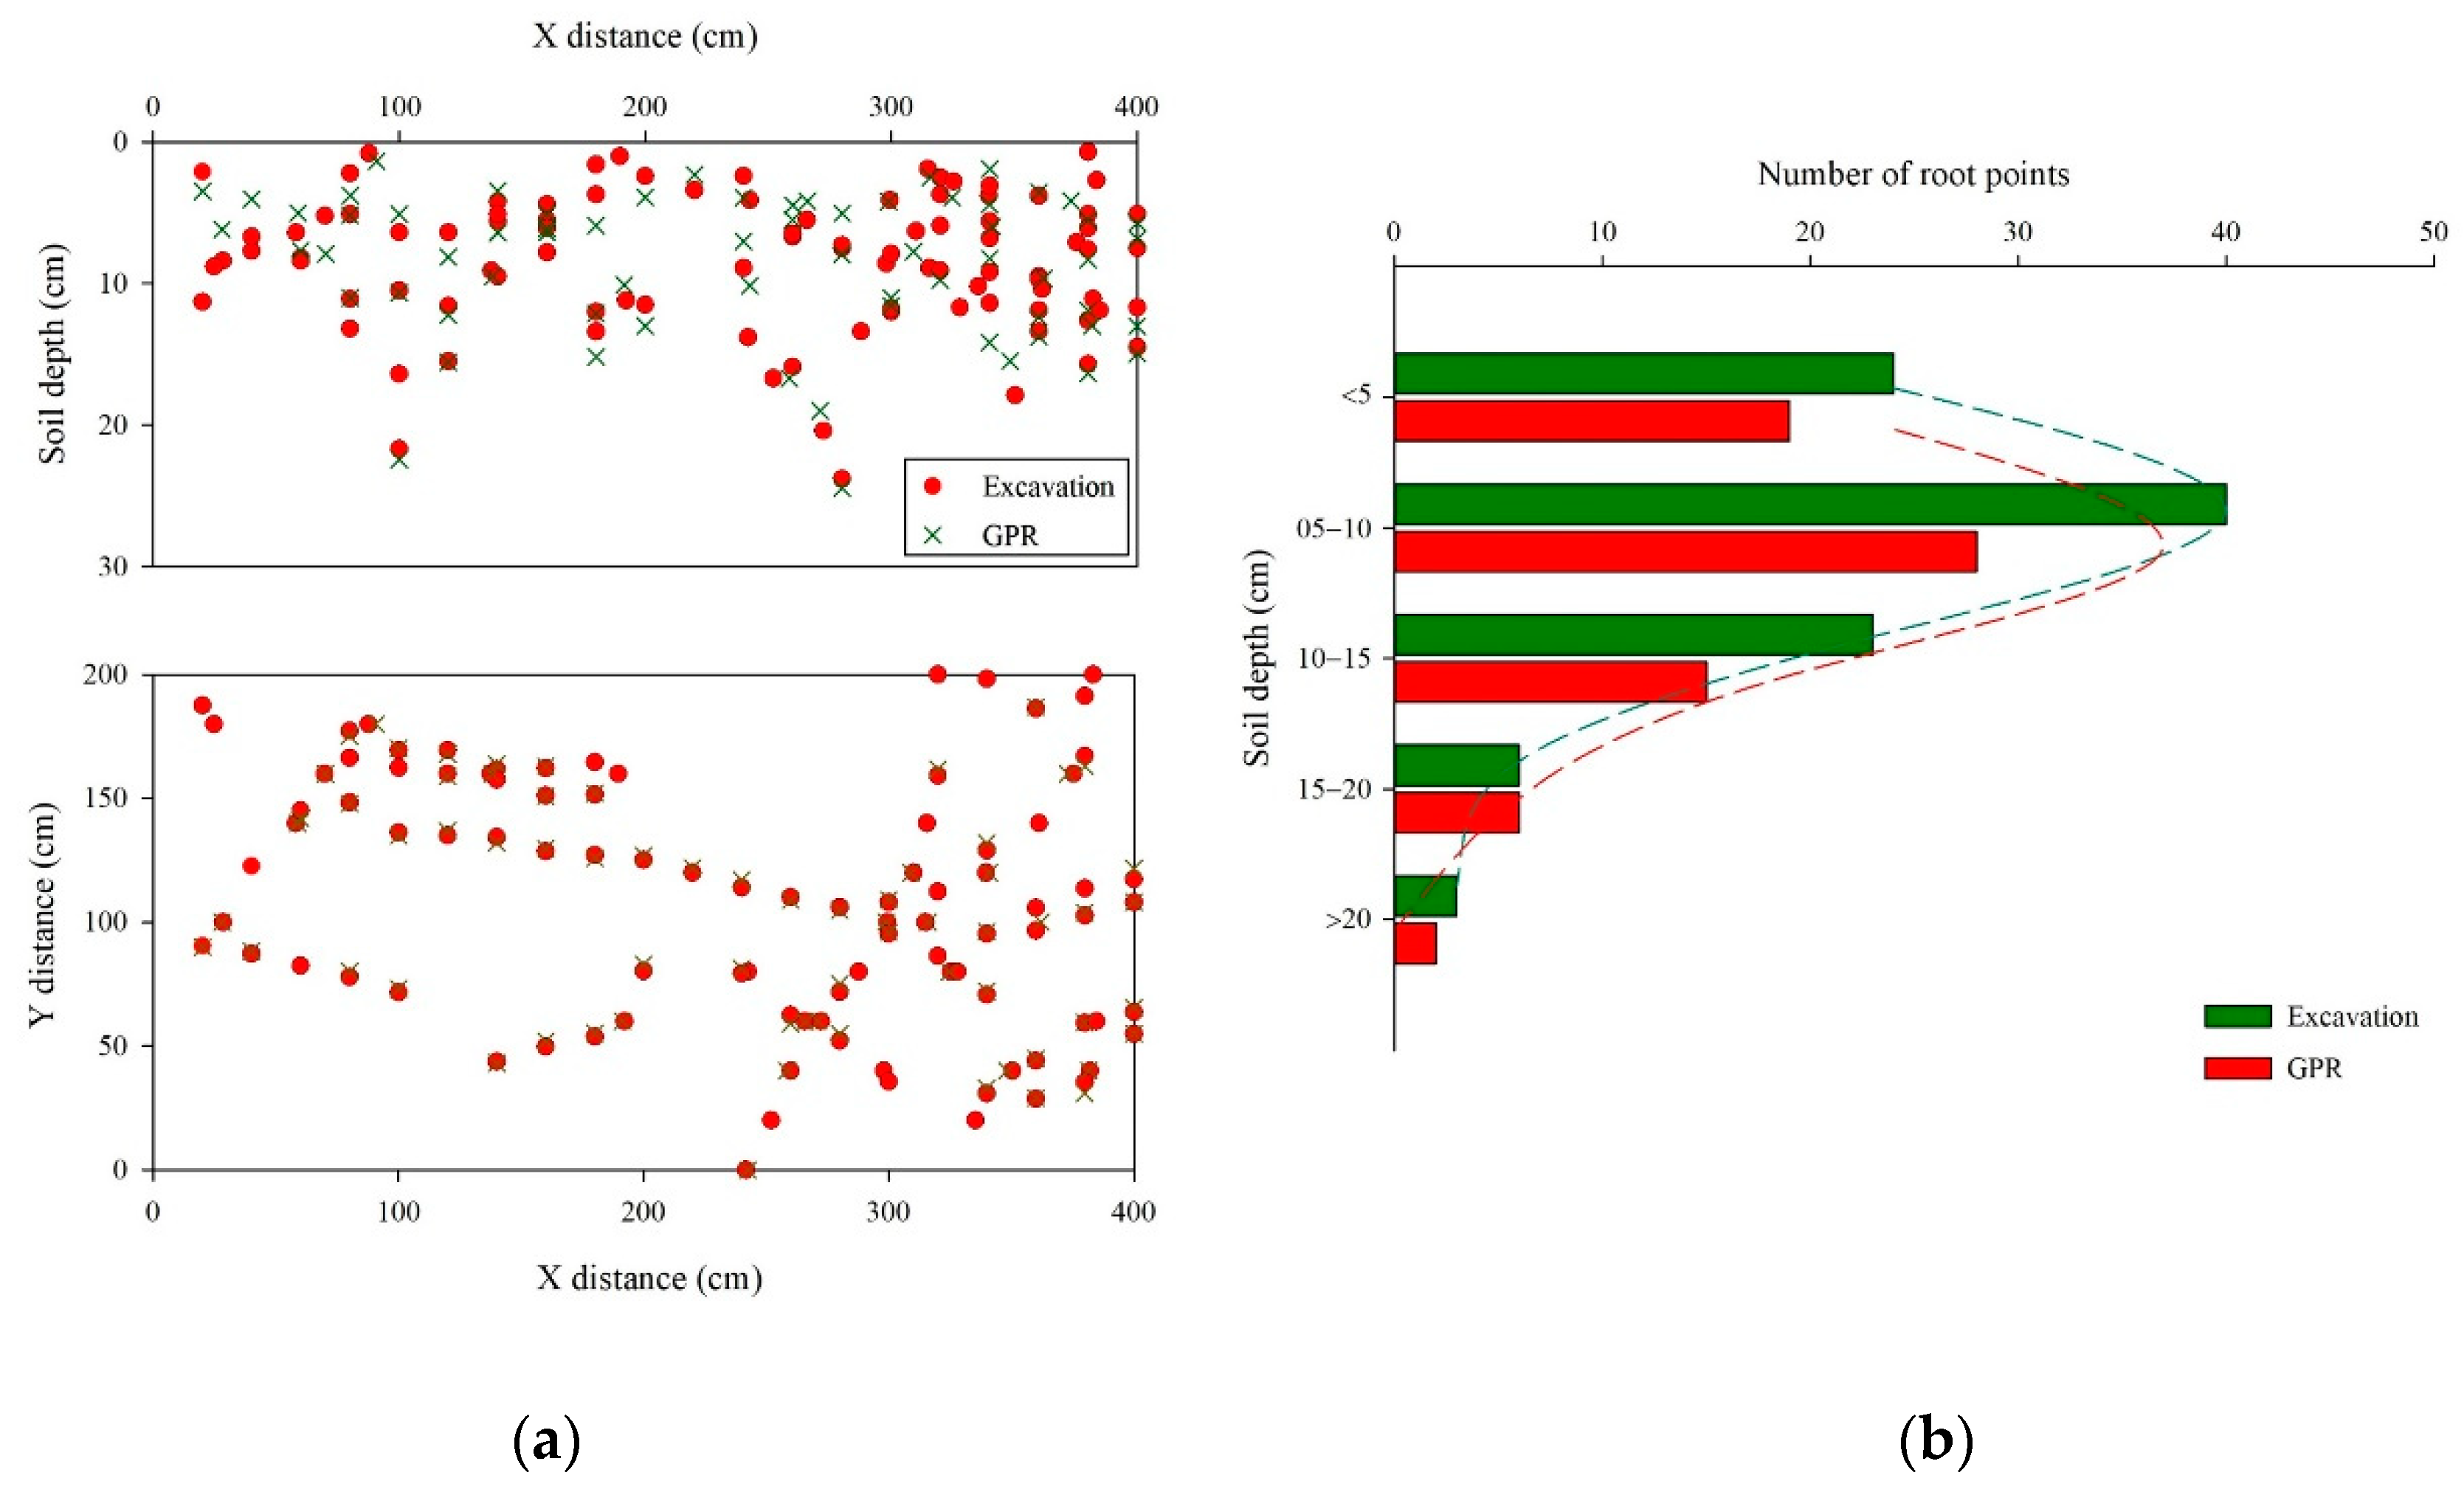
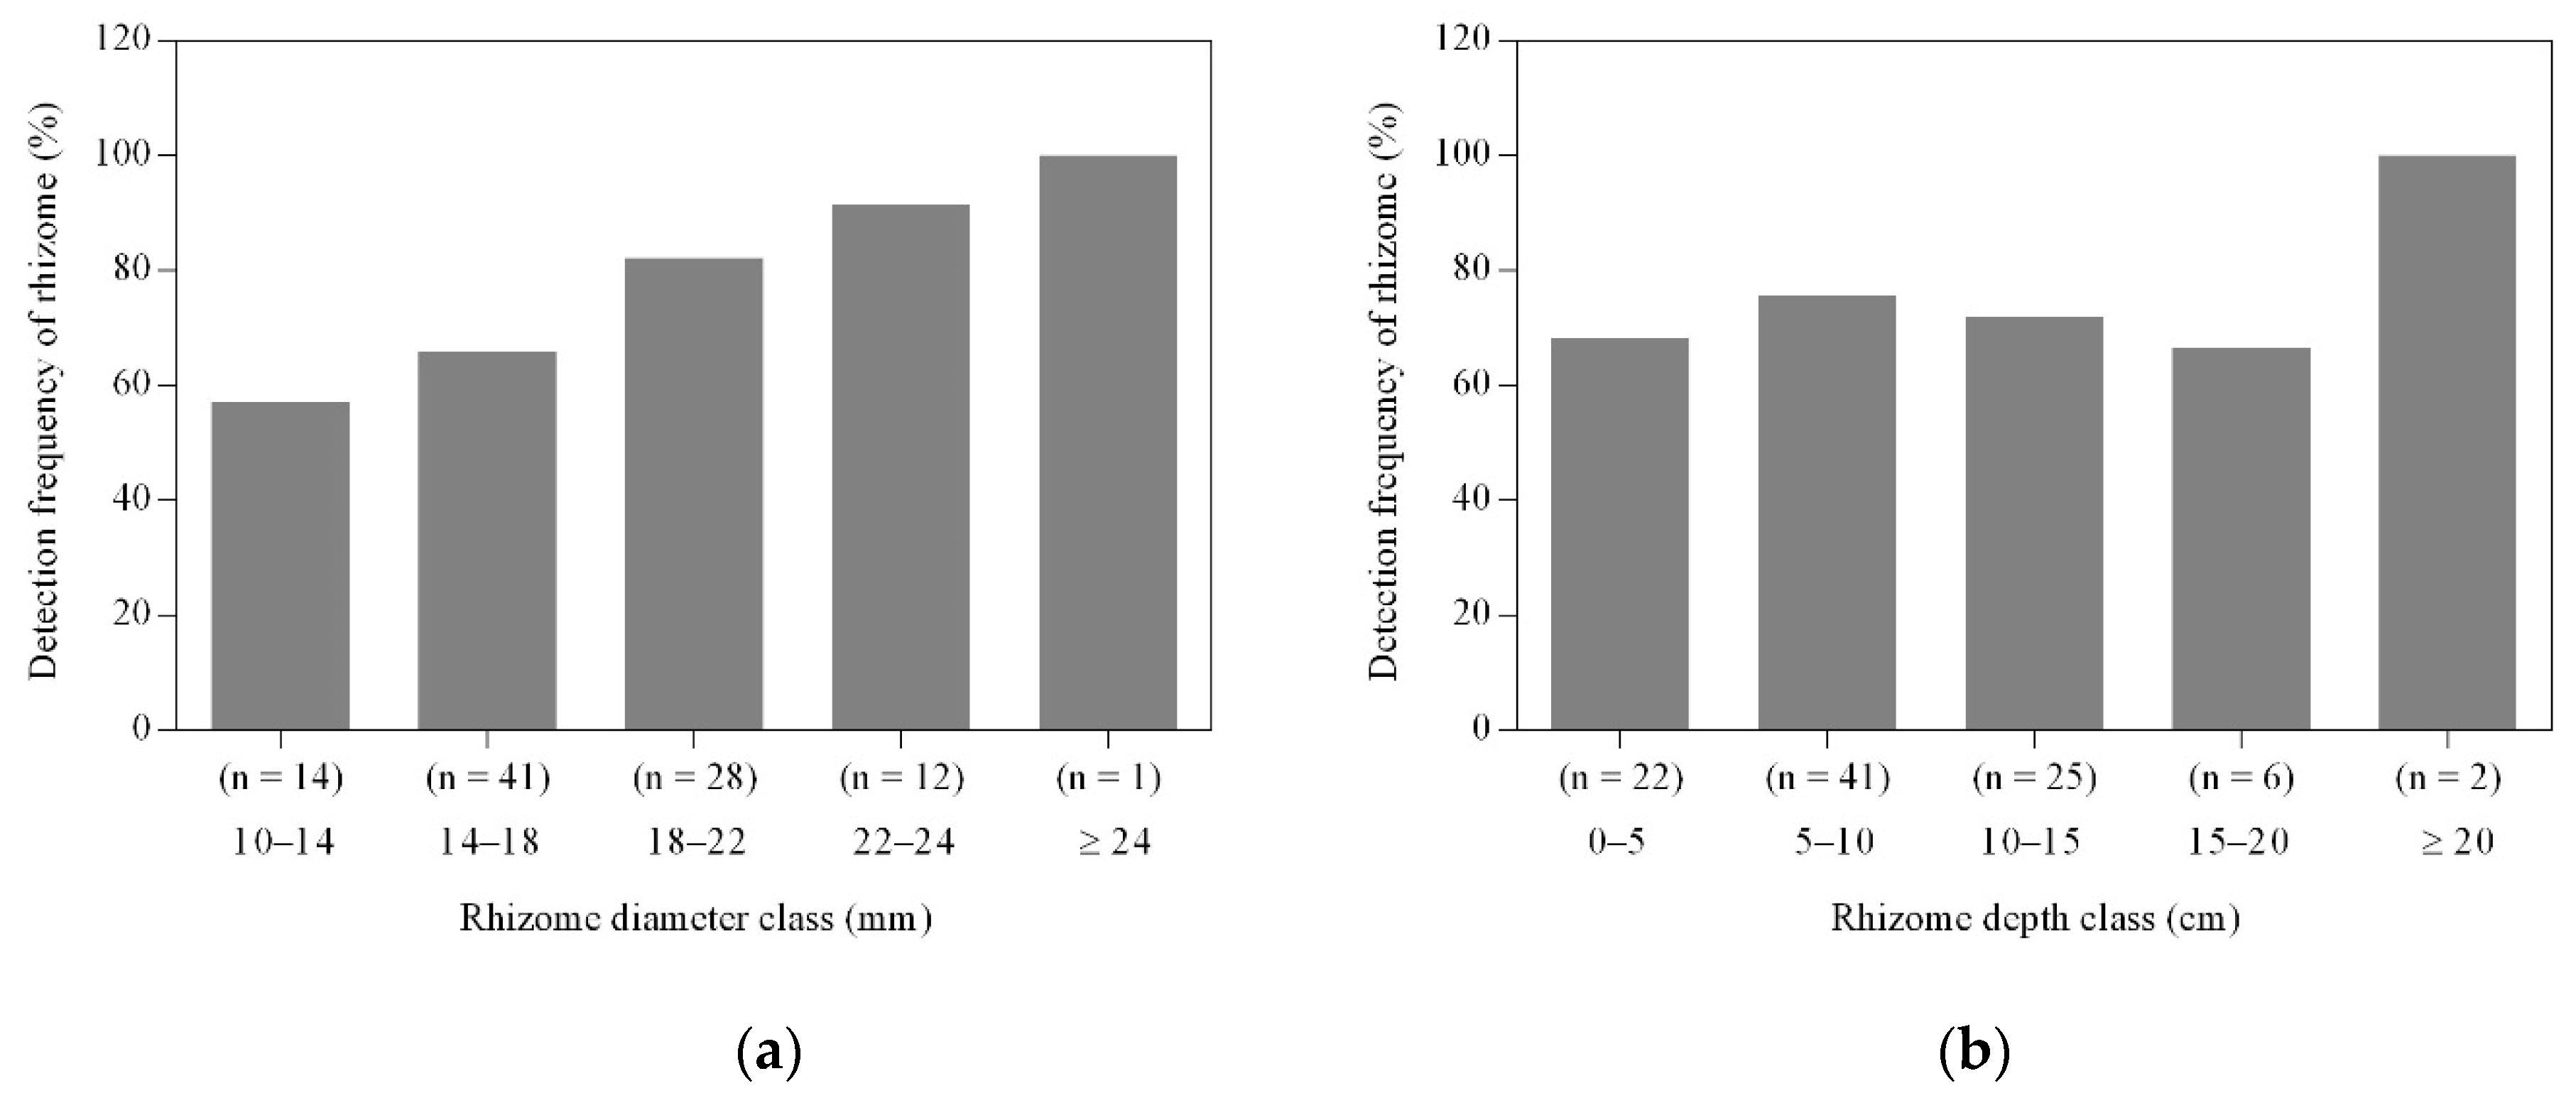
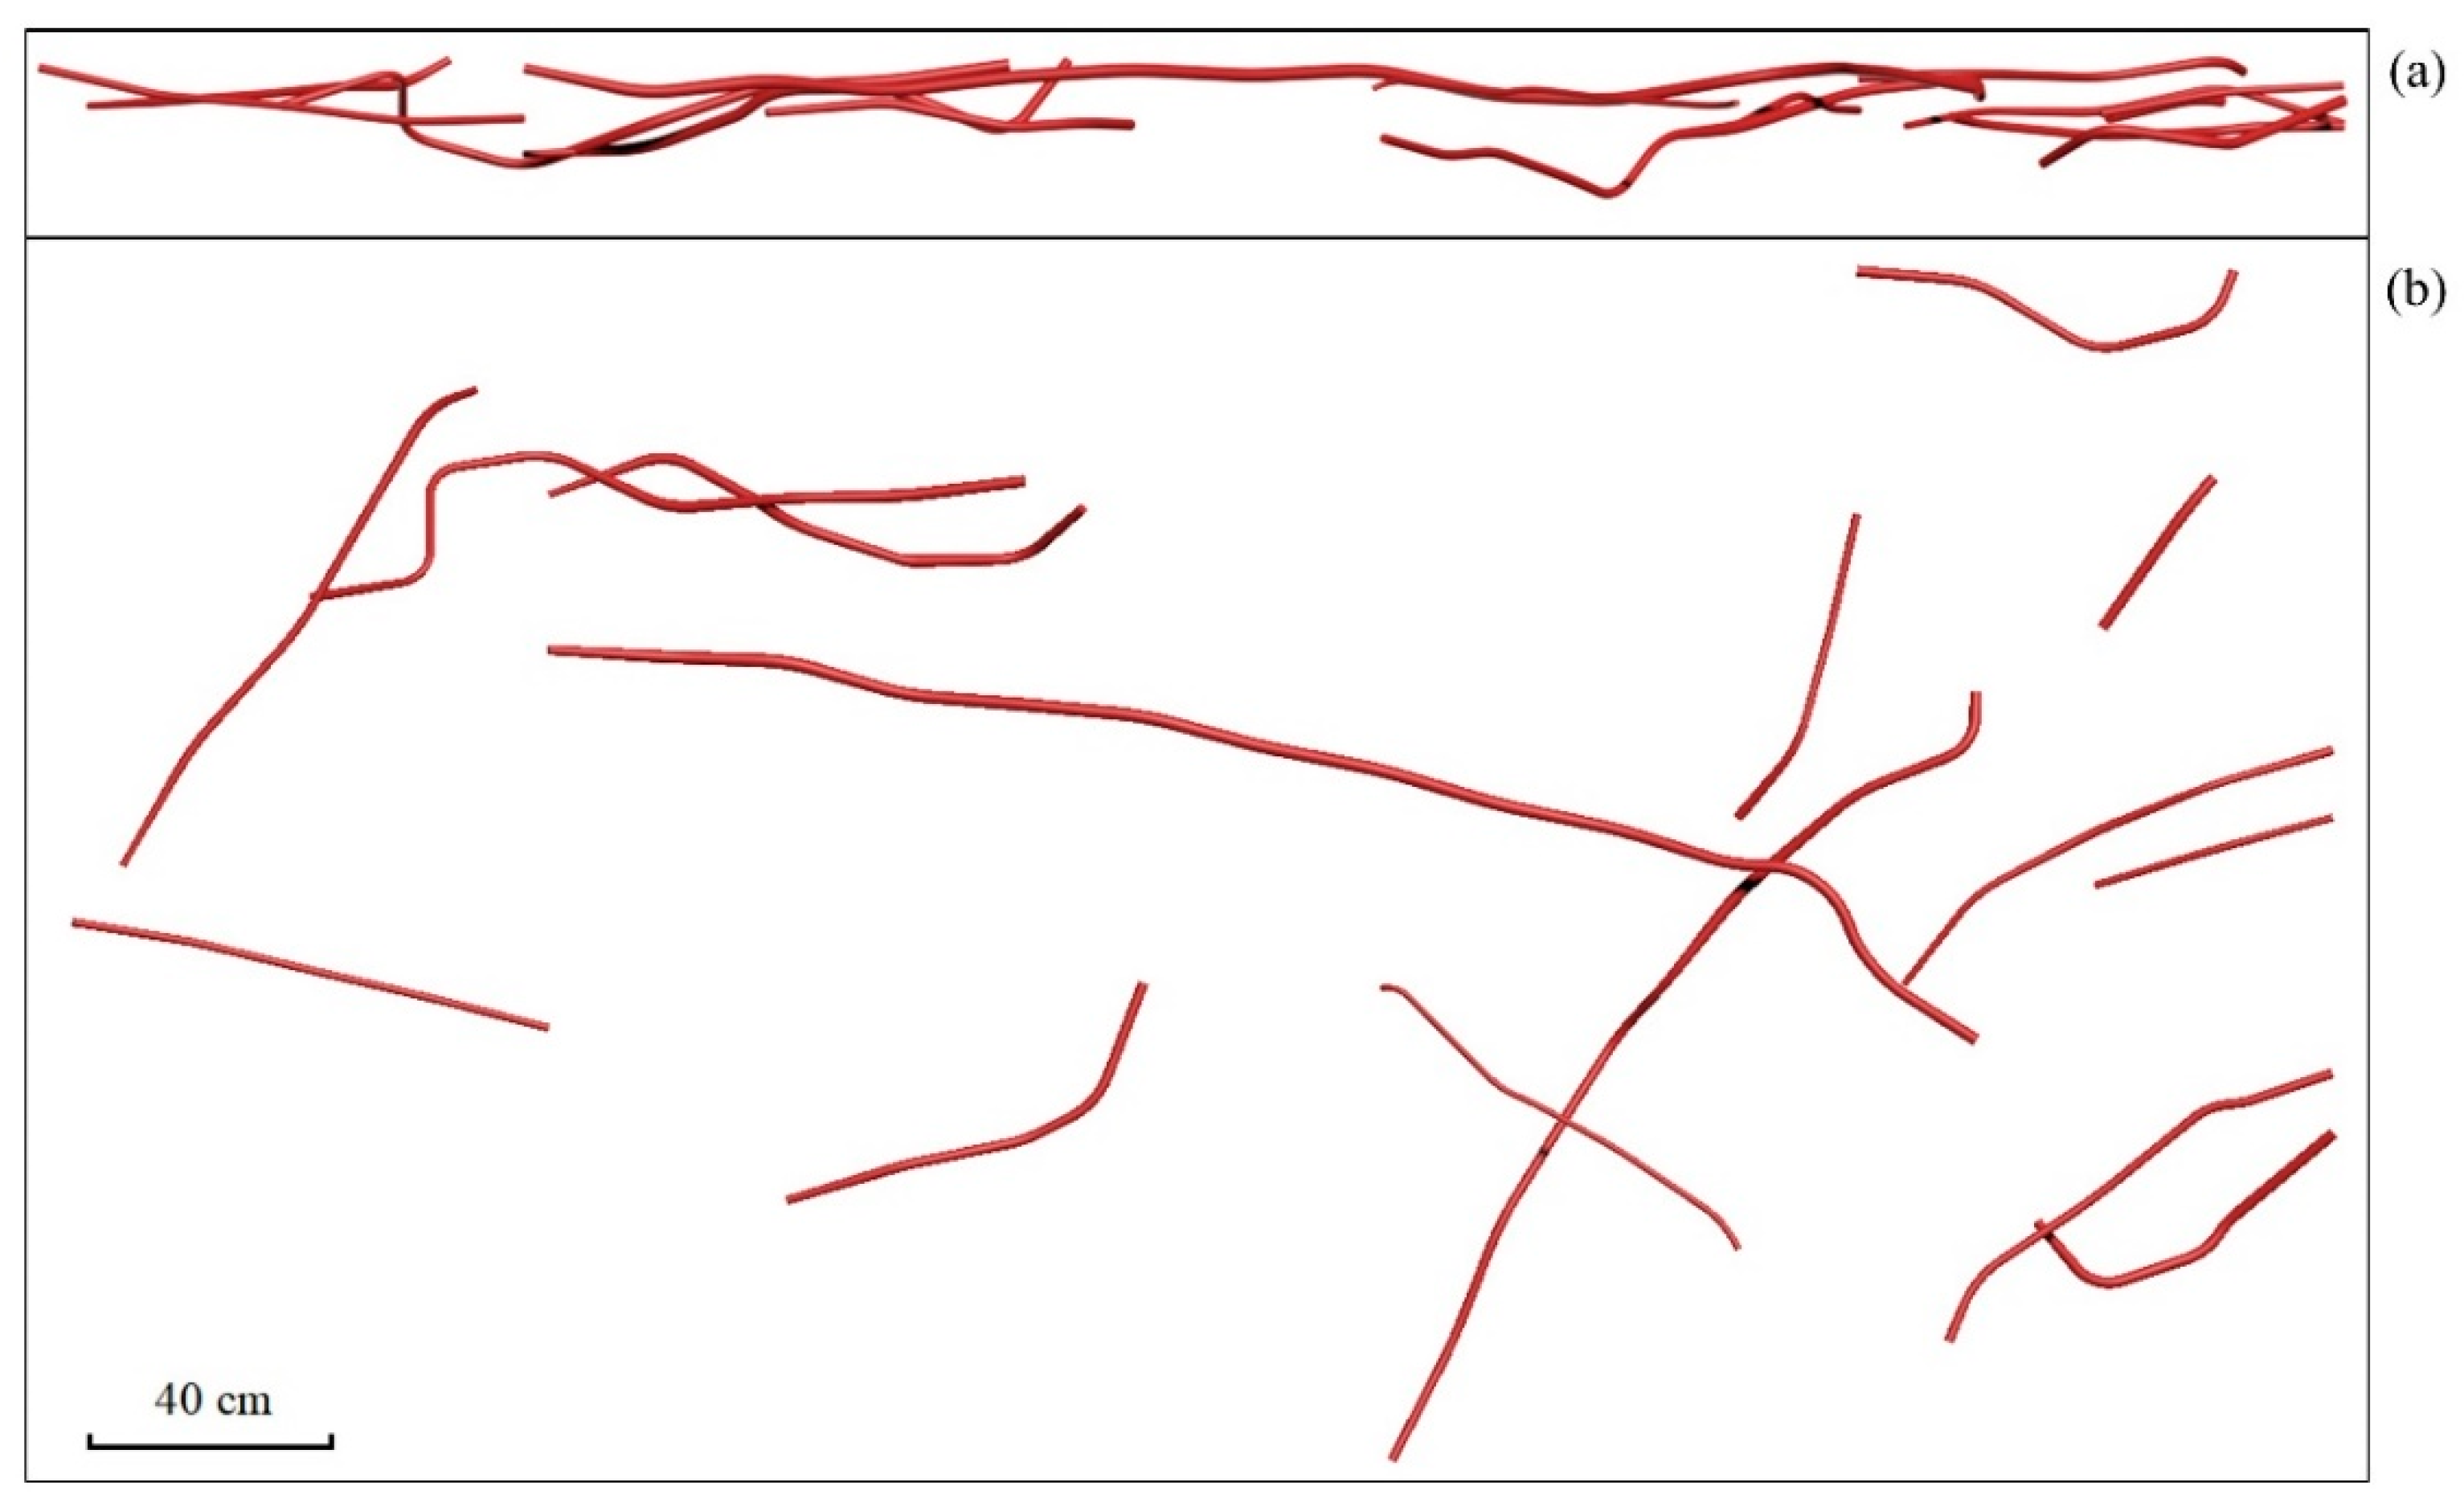
3.1. GPR Detection of Rhizomes

At 0–50 cm soil depth, the mean water content of the soil was 10.14% ± 2.94% (± standard deviation, n = 84) (Table 2), while the mean water content of the rhizomes was 55.74% ± 3.43% (± standard deviation, n = 16). The substantial difference between rhizome and soil water content allowed the ground-penetrating radar (GPR) system to detect rhizomes accurately. In addition, at 0–50 cm soil depth, the mean stone content of the soil was 4.98% ± 2.17% (± standard deviation, n = 84) (Table 2). This makes it relatively unlikely that reflection hyperbolas formed by non-root objects such as stones would be encountered in a radar profile.
A total of 96 root points (including only those of rhizomes with a diameter greater than 5 mm) were collected via excavation, with an average rhizome diameter of 16.8 mm (minimum 10.0 mm, maximum 24.0 mm). Seventy root points were detected using GPR, accounting for 72.9% of the excavated root points. The root points detected by GPR exhibited favourable localisation accuracy, with a root mean square error (RMSE) of 3.32 cm. The small RMSE value demonstrates that GPR is able to accurately localise rhizomes. A comparison of the spatial distributions of root points acquired by excavation and GPR analysis is shown in Figure 8a, while the relationship between rhizome distribution density and soil depth, compared between these two methods, is plotted in Figure 8b. The distribution of root points was generally consistent between the two methods, with both methods indicating that the majority of root points were located at 0–15 cm soil depth, while neither method found root points located at 30–50 cm soil depth (Figure 8).
Furthermore, our results indicated that the greater the diameter of the rhizome, the more detectable it was by the GPR system (Figure 9a). However, the GPR detection rate of rhizomes did not differ between the different soil depth classes (Figure 9b), which may be due to the fact that the rhizomes were concentrated in the 0–15 cm soil layer. Rhizomes also did not differ significantly in diameter between soil depths (Table 3), which could be attributed to inadequate sample sizes of rhizomes.

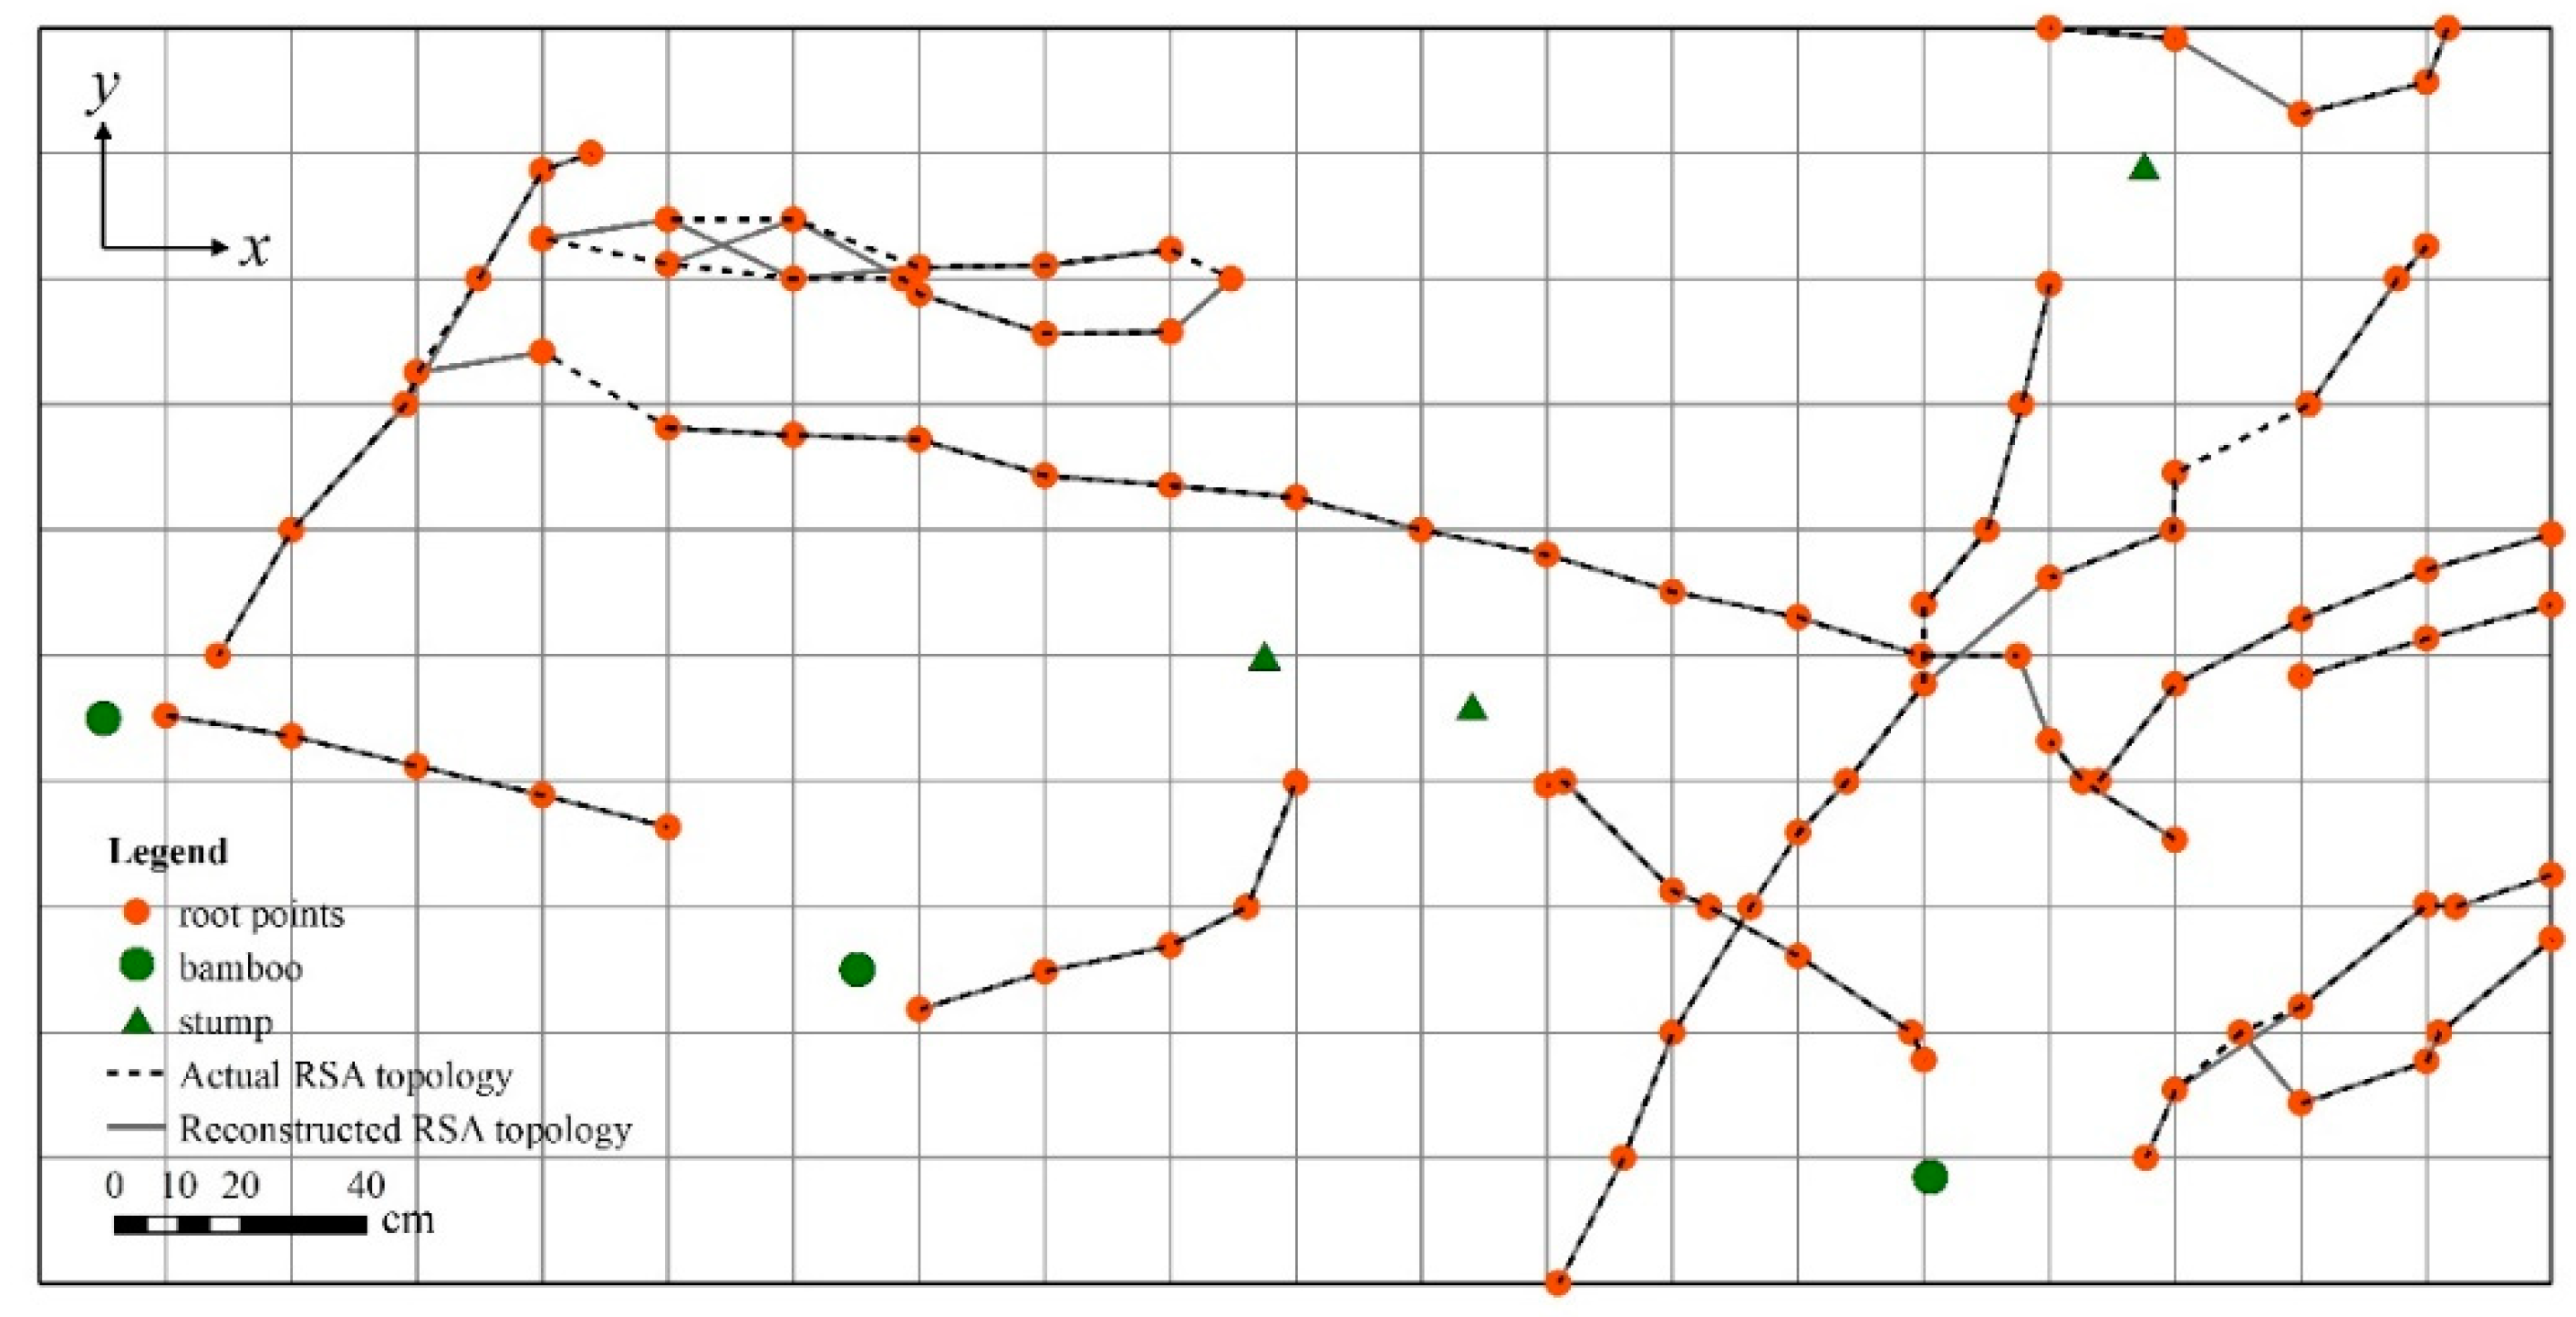
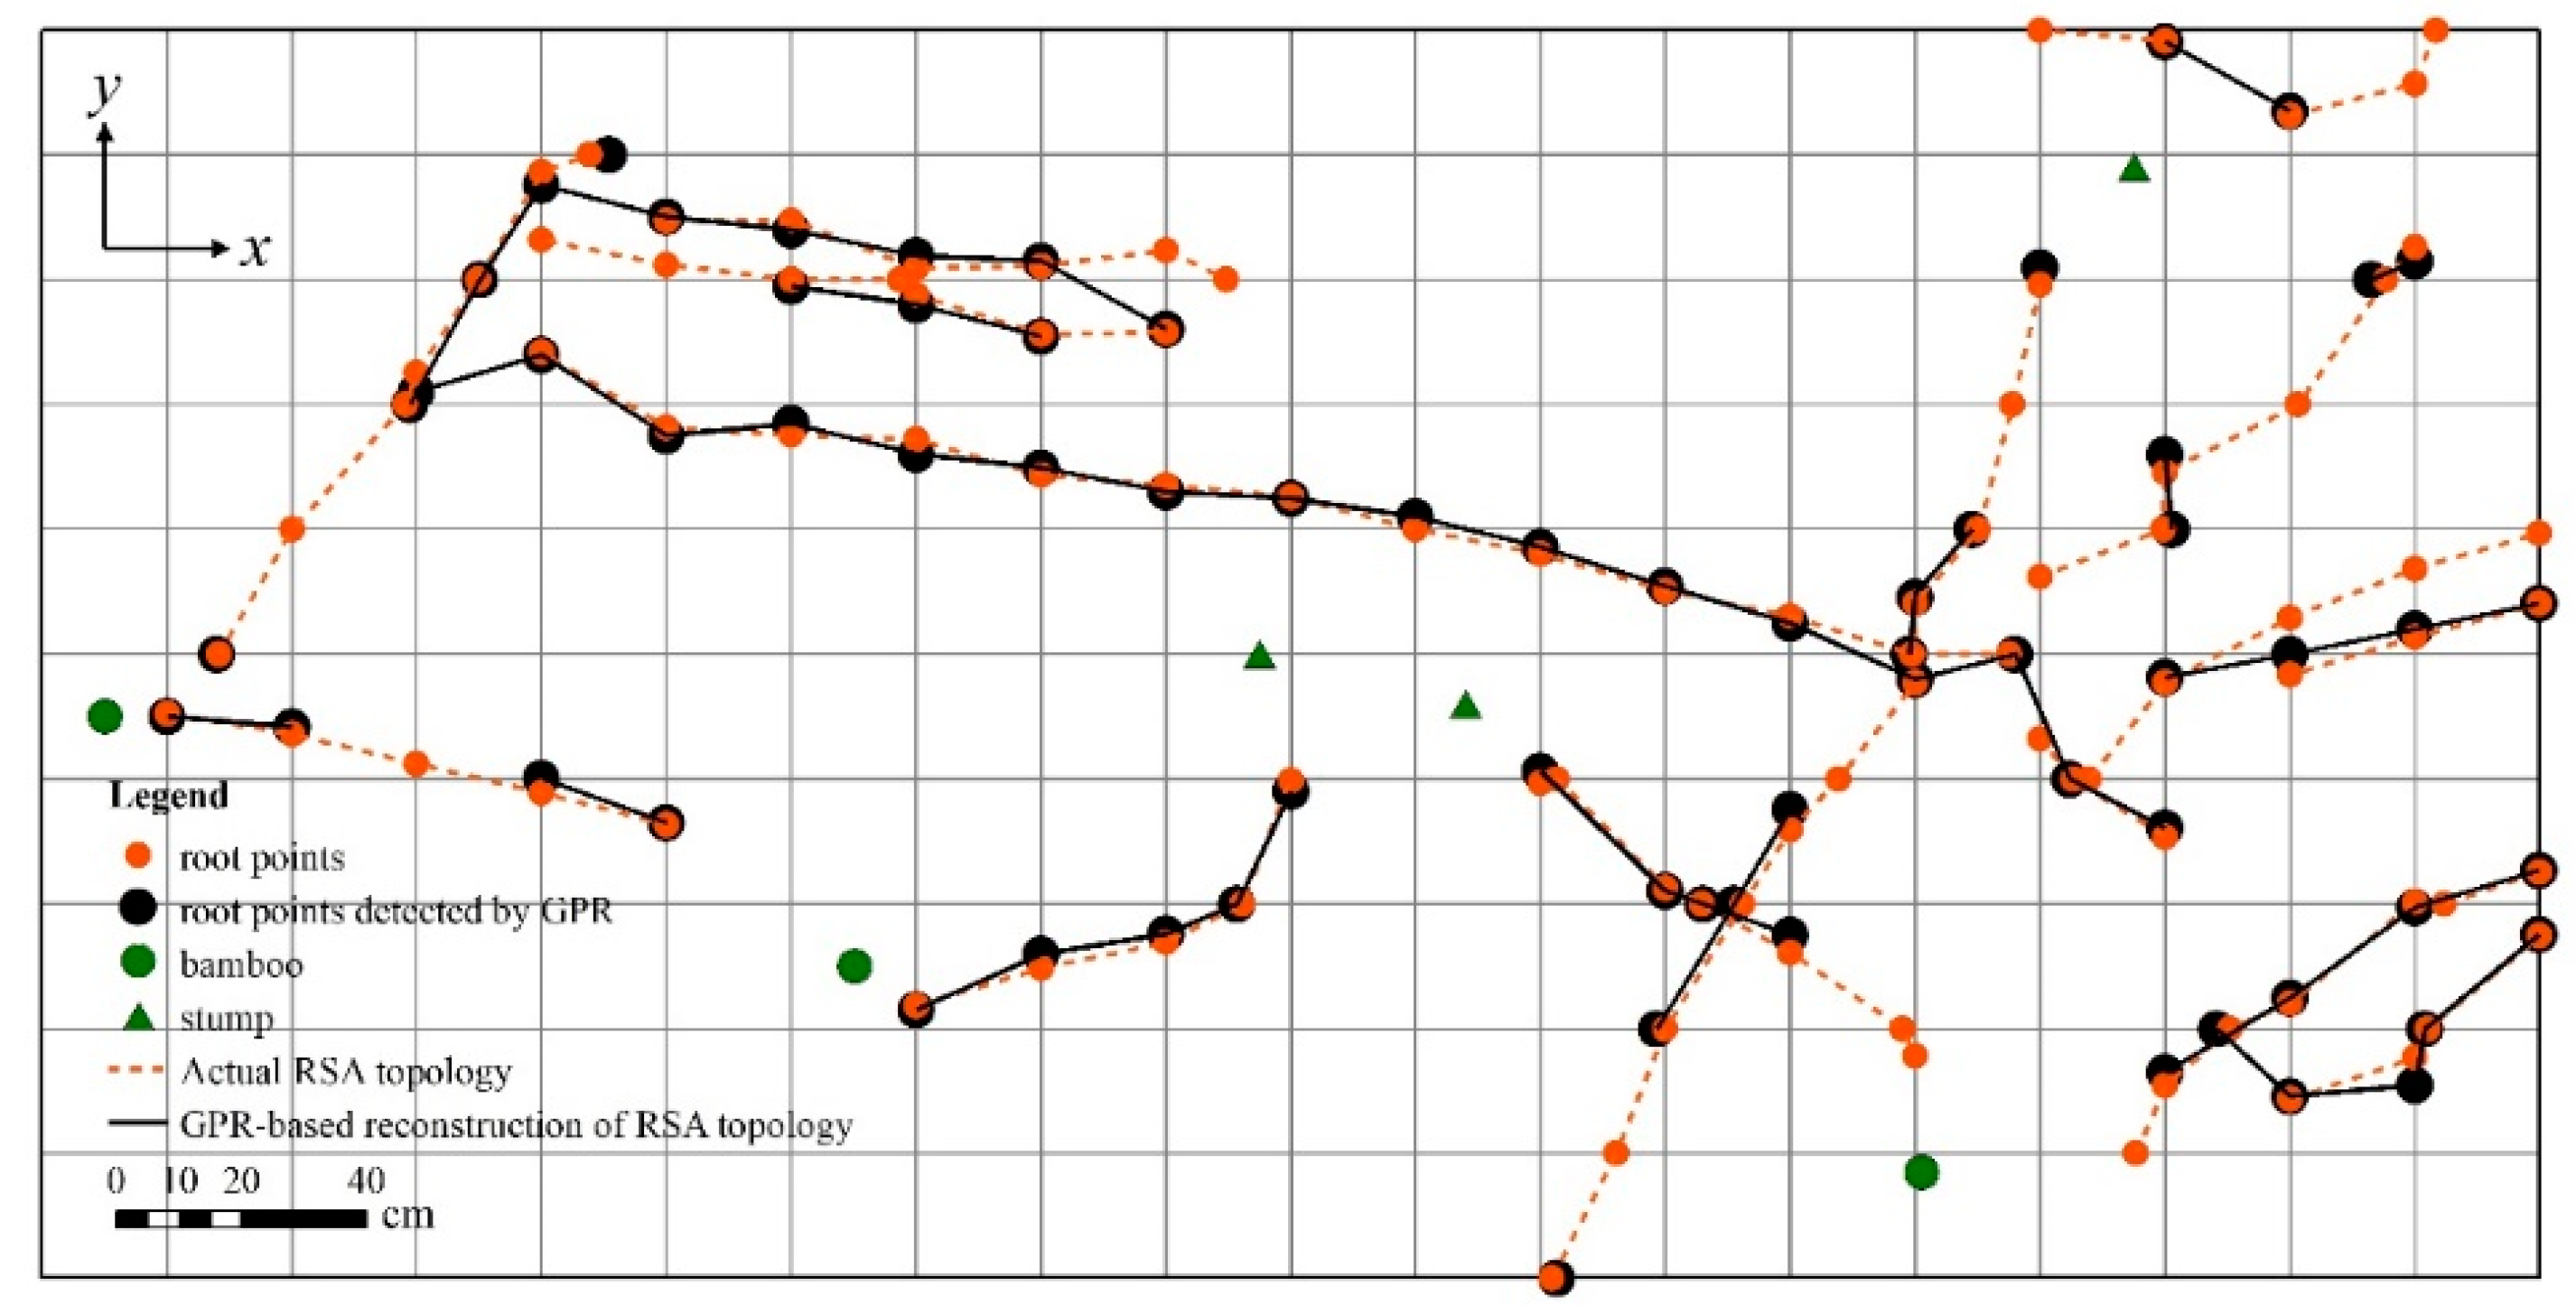
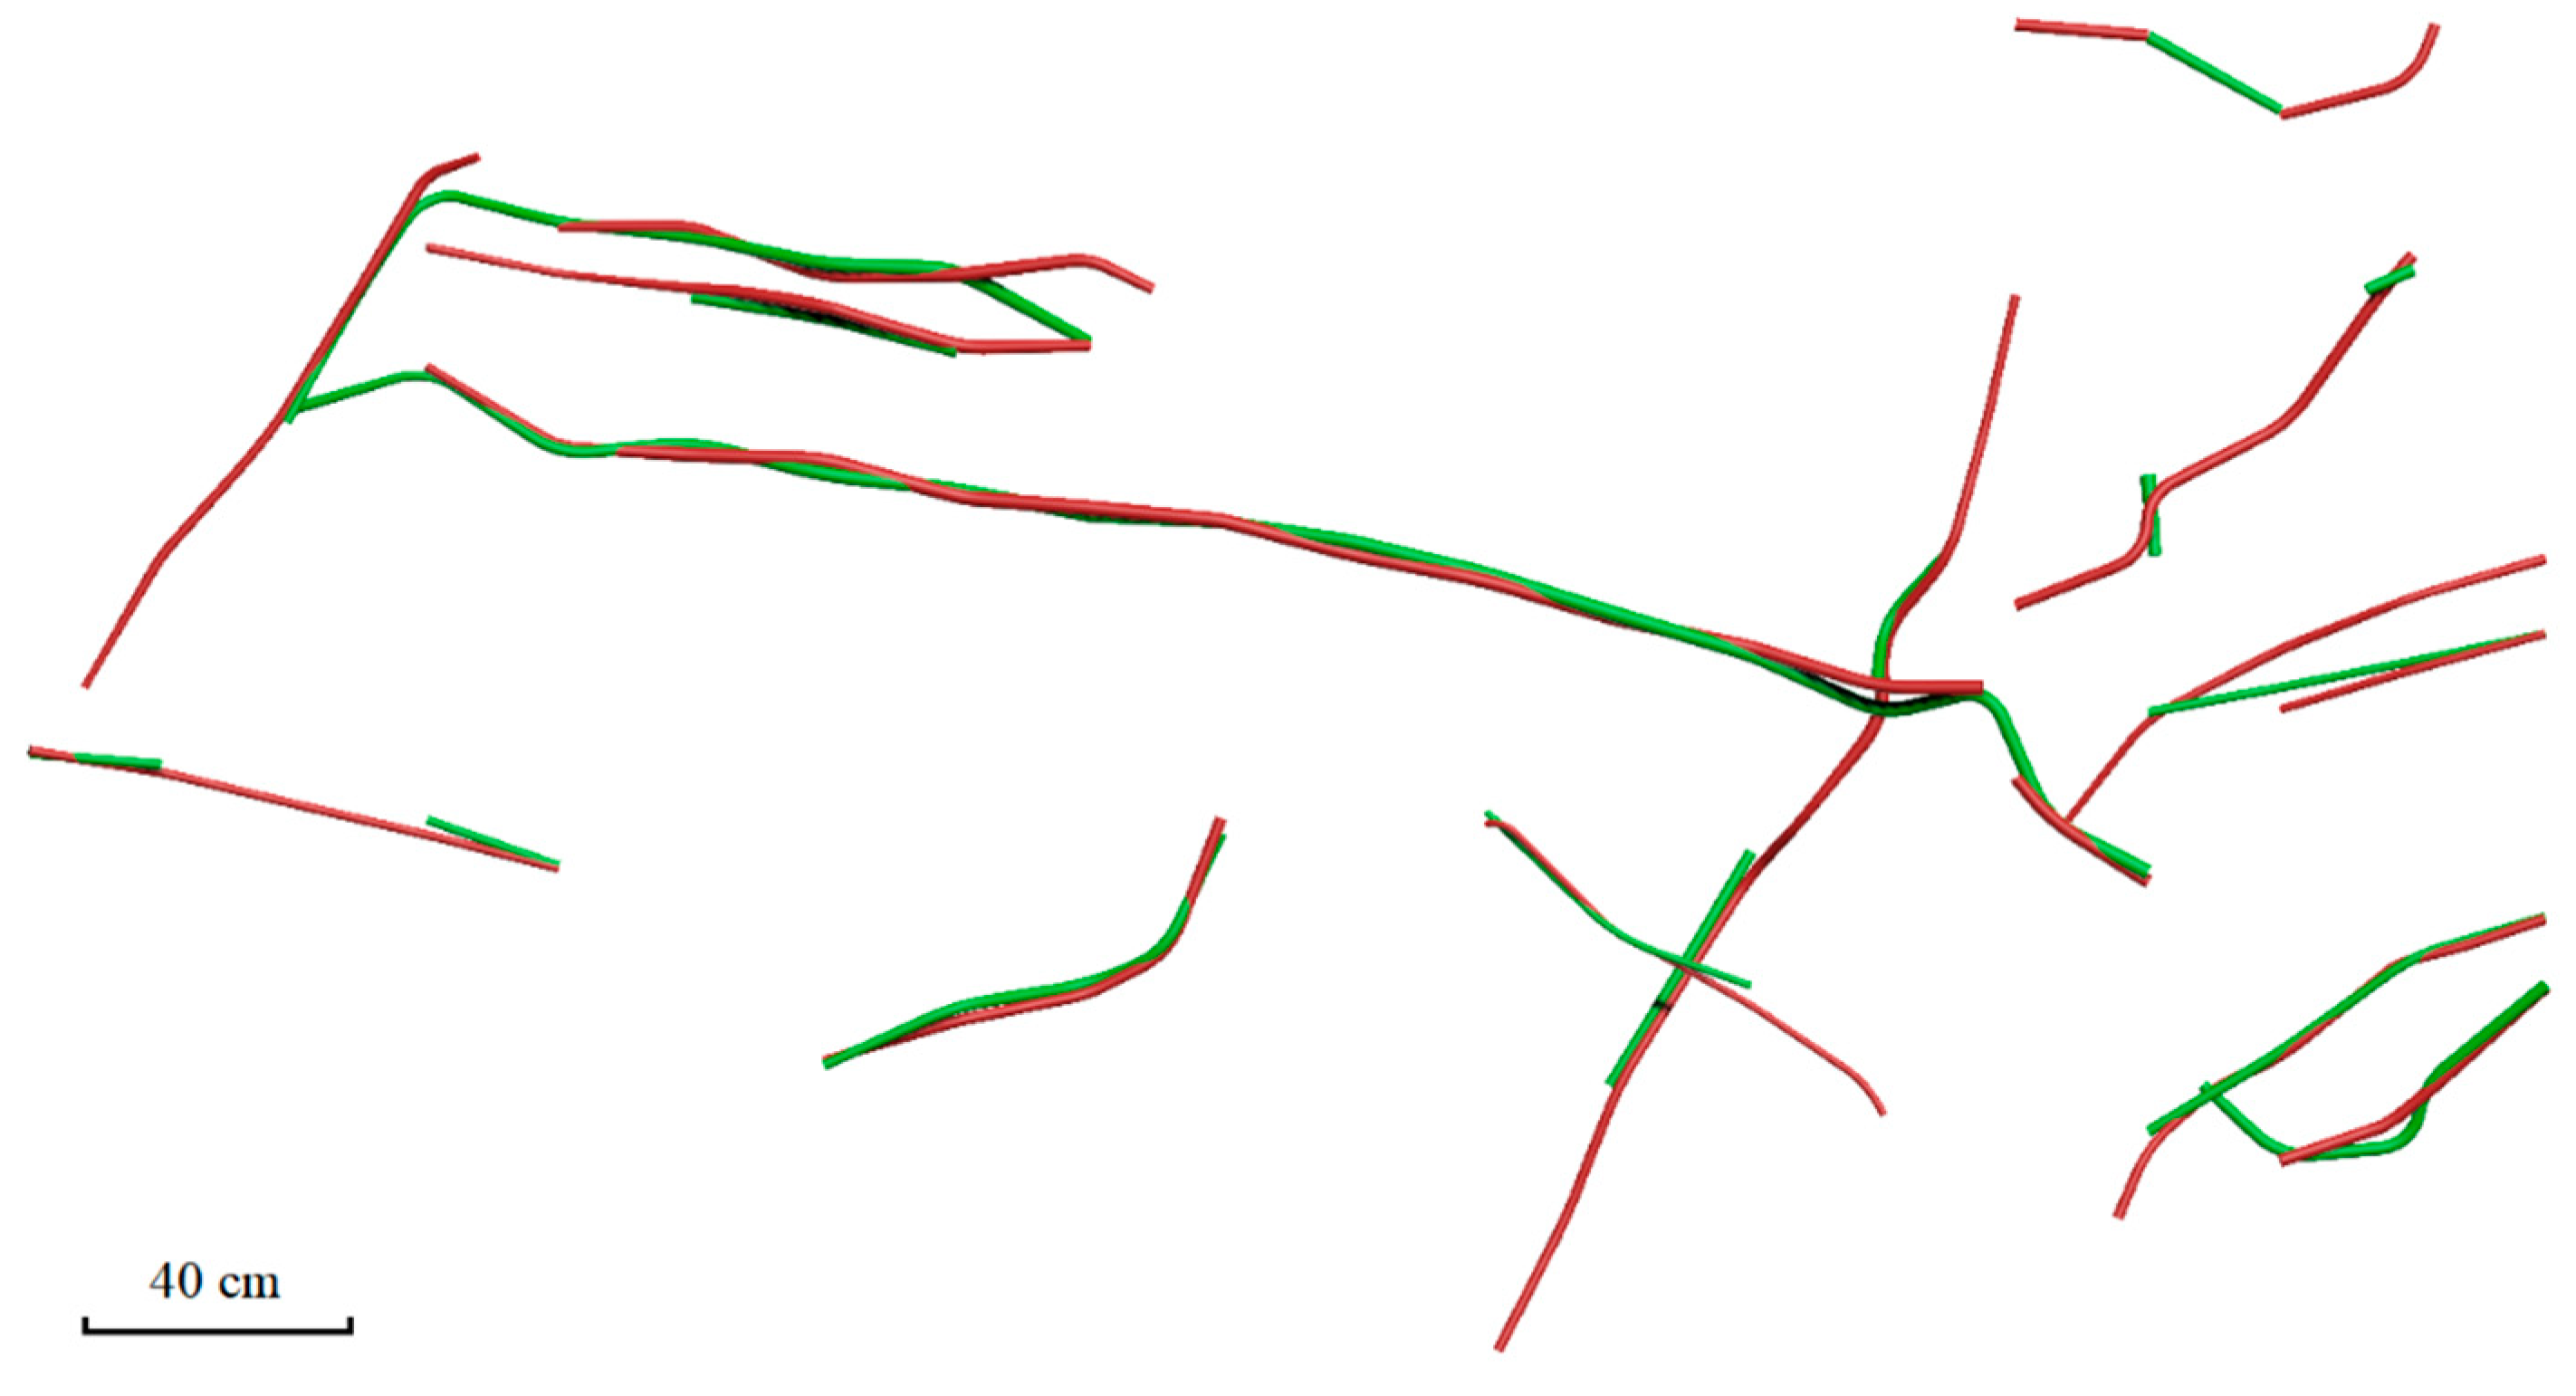
3.2. RSA Reconstructed

Figure 10 compares the actual measured topology of moso bamboo RSA (dashed lines) with the corresponding reconstructed topology (solid lines). The topology was reconstructed using the best score function described above, which was continuously adjusted to achieve the highest accuracy (Table 1). Seventy-five (78.13%) of the ninety-six root points (red) were correctly connected in the reconstructed topology (Figure 10, Table 1), which indicated substantial similarity between the reconstructed and measured topologies. Figure 11 shows the front and ground plan views of the reconstructed 3D RSA based on this recovered topology; this reconstructed RSA is essentially identical to the actual measured RSA, even in some fine details (such as the variation in diameter of some of the rhizomes). The reconstructed RSA estimated the total length, volume and biomass of the rhizome system with an accuracy of 91.98%, 95.21%, and 94.73%, respectively (Table 4), confirming that our model was sufficient to accurately approximate RSA in moso bamboo. Furthermore, the reconstructed 3D RSA included additional information not obtained from the excavation data, such as rhizome depth, length, and distribution in the soil media.
Figure 12 shows a comparison of the actual measured RSA topology (red dashed line) with the GPR-based reconstructed topology (black solid line), constructed using the best scoring function. The reconstructed topology is mostly consistent with the measured topology, although subtle spatial shifts are present. It should also be noted that some root points are not present in the reconstructed topology. Figure 13 shows a comparison of the actual measured 3D RSA (red) with that (green) reconstructed based on GPR analysis. The reconstructed RSA provided a rough approximation of the measured RSA, with the reconstruction exhibiting some deviation from the actual measured RSA due to missing root points and rhizome displacement. The GPR-based reconstructed RSA estimated the total length, volume, and biomass of the root system at an accuracy of 64.45%, 73.21%, and 72.84%, respectively (Table 4).

4. Discussion

4.1. Application of GPR to Rhizome Systems

Compared to optimal experimental conditions, such as those of coarse roots buried in dry, sandy soil, the spatial distribution and growth environment of roots in the field are much more complicated [45]. The application of ground-penetrating radar (GPR) to root detection is influenced by factors such as root diameter and soil depth. Previous studies have demonstrated that roots less than 10 mm in diameter have a very low probability of being detected by GPR, while thicker roots are more likely to be detected [30,31,46]. Previous studies also showed that GPR detection of roots gradually decreases with increasing soil depth due to the attenuation of radar energy [27,31]. In accordance with these findings, our study found that the probability of detection by GPR increased with the diameter of the rhizomes, with rhizomes with a diameter greater than or equal to 14 mm detected at a probability greater than 60% (Figure 9a). In contrast, root points located at different soil depths did not differ in their GPR detection rate (Figure 9b), due mainly to the concentration of rhizomes in the shallow soil layer (0–30 cm). Furthermore, the accuracy of the estimated total length, volume, and biomass of the GPR-based reconstructed RSA were all greater than 60% (Table 4), which indicates that GPR can detect and quantify (e.g., diameter prediction and biomass calculation) rhizome systems in the field. In addition, Tanikawa et al. [47] found that rhizomes of Phyllostachys pubescens (moso bamboo) buried at a depth of 30 cm, in an ideal sand experiment, could be clearly detected using GPR. Therefore, the results of this study further suggest that moso bamboo rhizomes may be a good potential target for the application of GPR to the study of clonal plant root systems in the field.
Root system architecture (RSA), which represents the spatial topology and geometric characteristics of the root system, characterises the growth and development of the root system [48]. Root system topology, which refers to the pattern in which roots are interconnected, offers the potential for a more detailed understanding of the 3D RSA [49]. Therefore, it is preferable to use both spatial position and topology of the root system to obtain the complete 3D RSA [39]. GPR has been shown to accurately extract the spatial location of coarse roots [27,31,35,45], which provides a basis for new non-invasive, technological method for RSA reconstruction. However, most field applications of GPR to RSA reconstruction have been on single trees and shrubs, with no record in the literature of GPR-based RSA reconstruction applied to clonal plants.
Based on our orthogonal survey grid excavation data, we developed a new method for estimating root point topology, which takes into account the unique biological characteristics of moso bamboo rhizomes. A root point connection score function ( F n ) based on the rhizome diameter ( D ), rhizome depth ( S D ), and rhizome extension angle ( θ ) was introduced to guide the search for the best-connected root points. The reconstructed root point topology showed that the majority of root points could be accurately connected (Figure 10, Table 1). The GPR-based root point topology was roughly reconstructed using this method (Figure 12). The results of this study indicate that our topological reconstruction model can be applied to the reconstruction of 3D RSA of moso bamboo based on GPR data (Figure 13, Table 1 and Table 4).
Our model provides a more accurate score function than does the model established by Ohashi et al. [39]. Their model only considered the distance between root points, the diameter of the root point, and the interior angle between root points. The additional physiological parameter of rhizome (root) depth was introduced in our model. Furthermore, due to differences between the study species used, we used the distance between survey lines instead of the distance between root points in our model. This proved to be more conducive to obtaining the correct root point in the case of moso bamboo. Our model thus represents an optimization of that established by Ohashi et al. [39]. In our model, the distance between survey lines is defined as the only constraint on the candidate root points, which means that our model exhibits high accuracy in determining root point connections. We also developed a simple algorithm for reconstructing RSA using only the root point XYZ coordinates and root diameter, with reconstruction accuracy depending on the values of the three weight parameters a, b, and c. Our model integrates the influences of rhizome extension angle ( θ ), rhizome diameter ( D ), and rhizome depth ( S D ) on RSA reconstruction, which improves the accuracy of the reconstructed RSA.

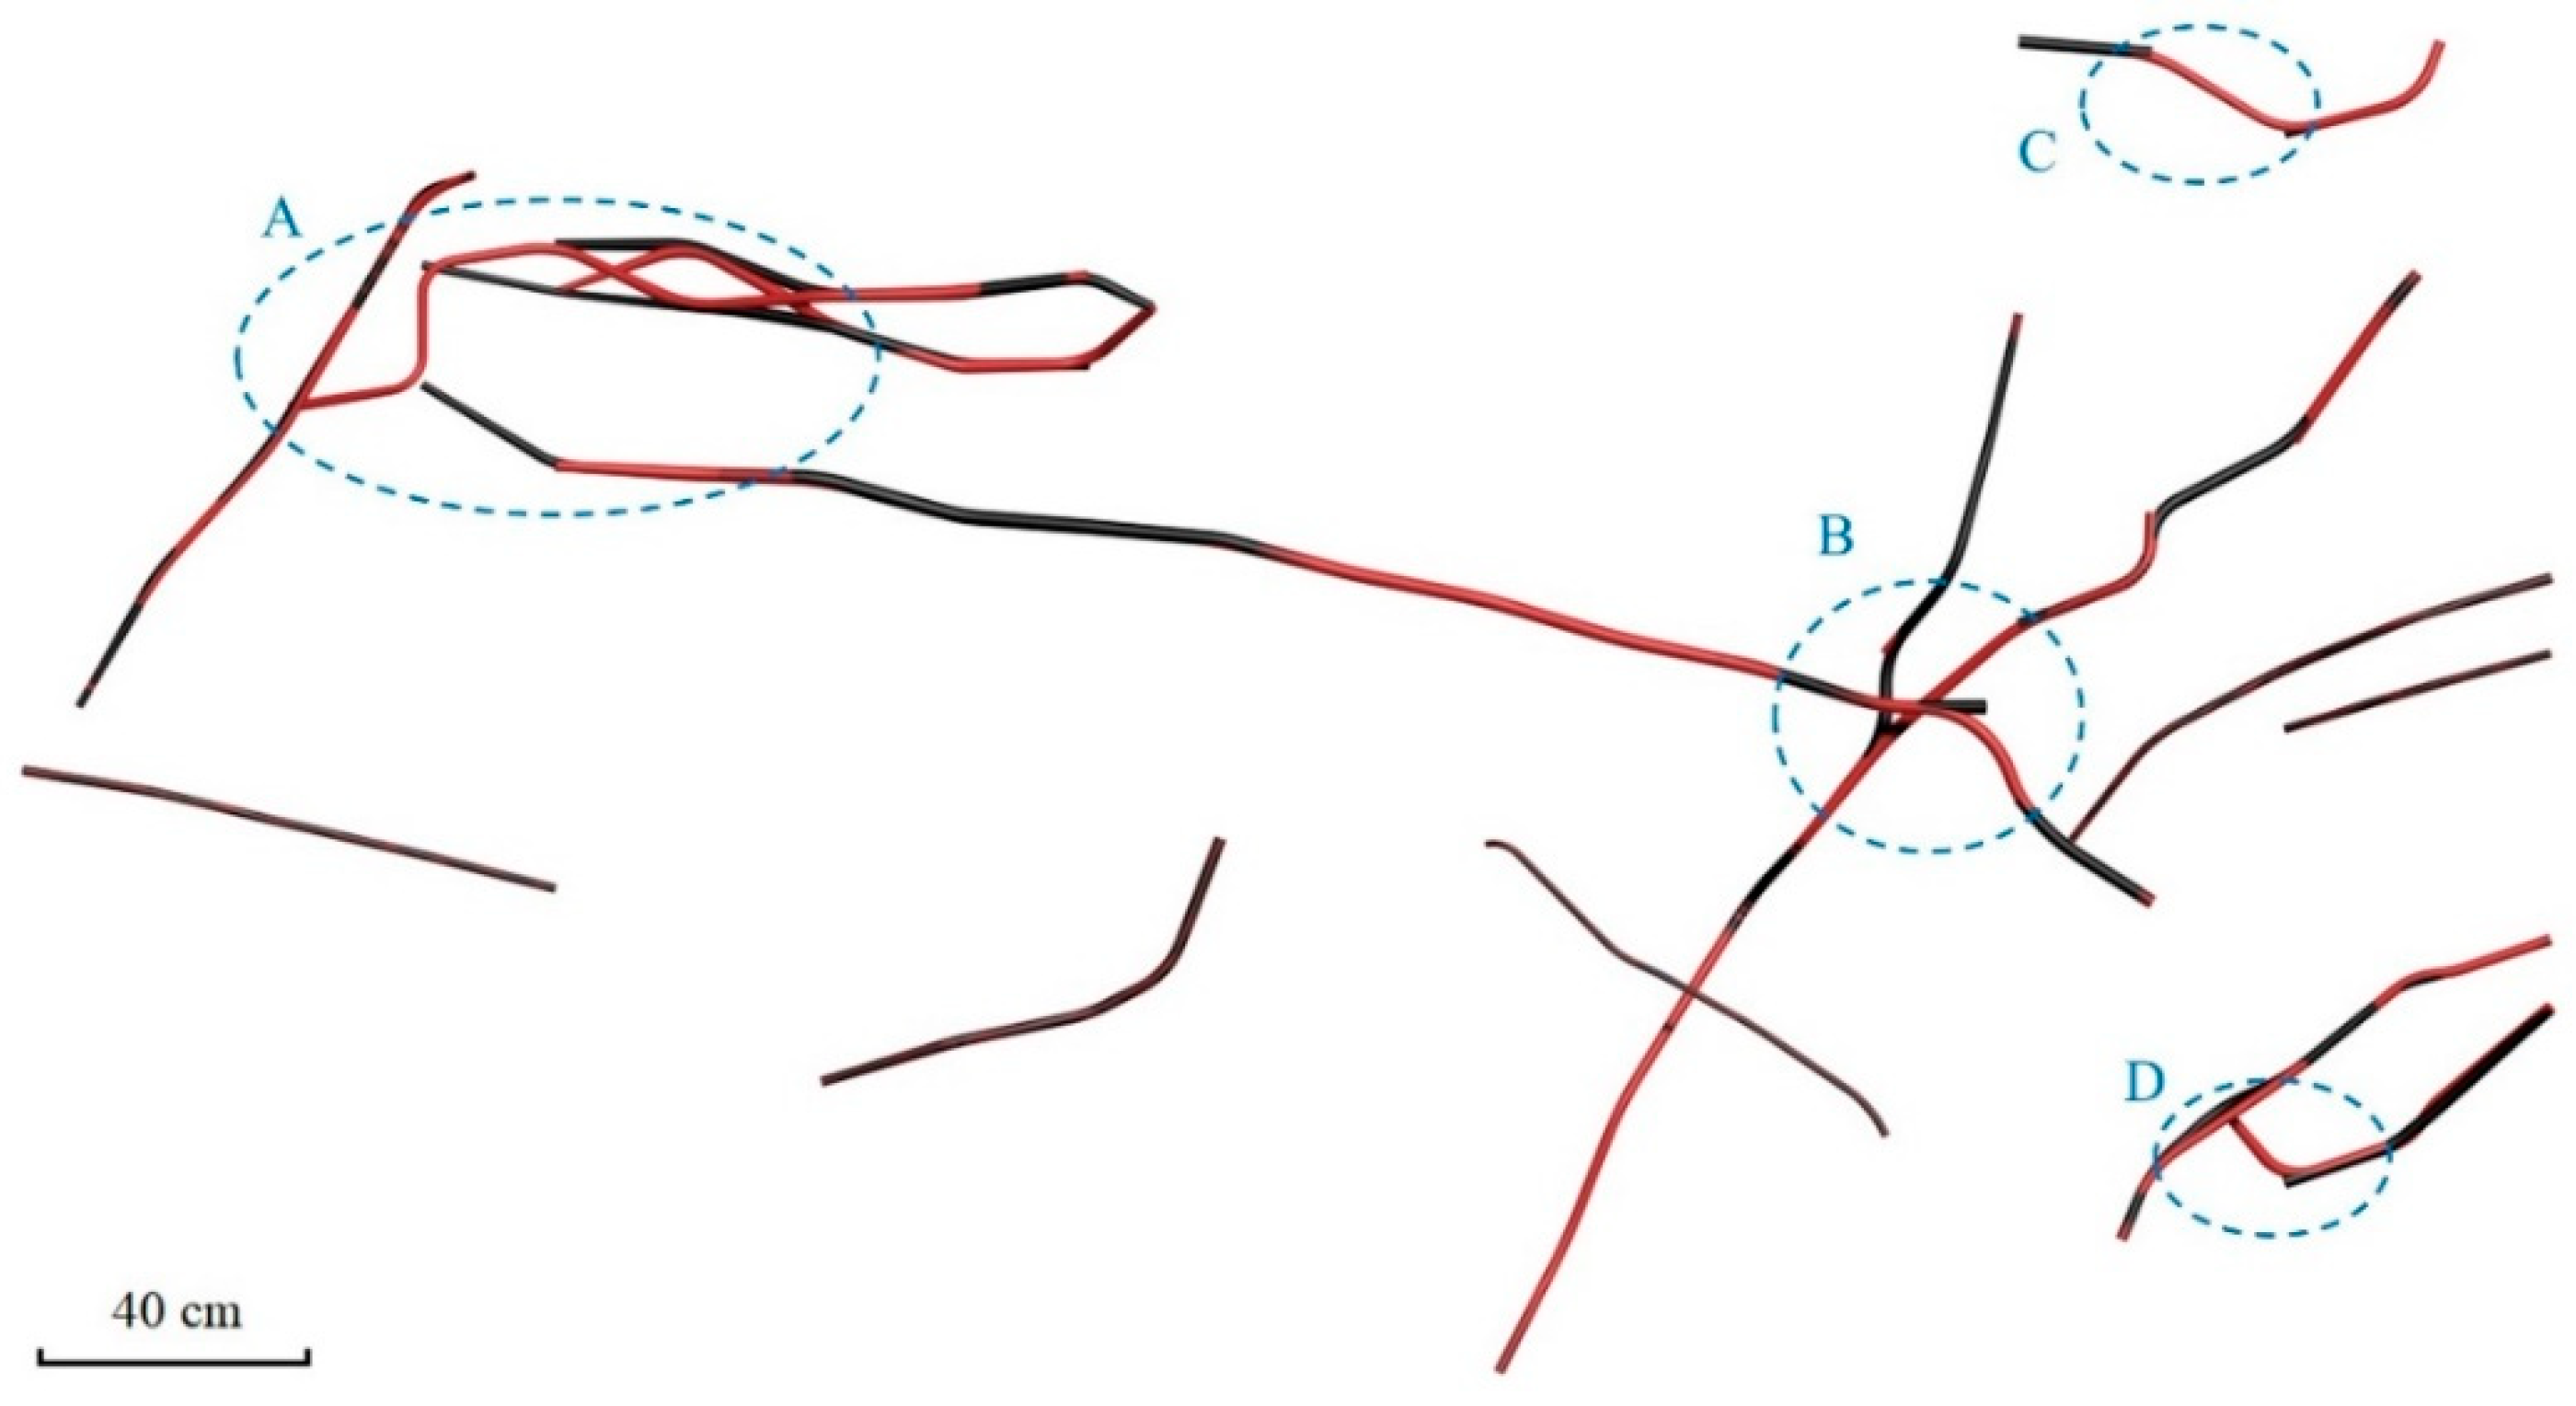
4.2. Limitations of RSA Reconstruction Based on GPR

In effect, when using GPR to detect root systems, the survey lines and the subsurface targets should remain as perpendicular to each other as possible [27,29,50]. The cross-angle formed by the survey line and the root orientation has a dramatic impact on GPR detection of the root system [34,51,52]. According to Tanikawa et al. [51], GPR can detect root systems with the cross-angle between 45° and 135°. It is well-known that the lateral roots of most individual trees and shrubs grow outward and downward around the stump, which makes it difficult to obtain suitable cross-angles using the orthogonal survey grid. Therefore, concentric scanning has proven to be the best scanning method for in-situ GPR root detection in these species [19,53]. However, unlike typical trees and shrubs, moso bamboo rhizomes have a unique growth and development pattern; they grow forward monopodally and are connected via associated branches [24,25] that render concentric scanning difficult, even in ideal environments. Therefore, an orthogonal survey grid was selected for this study, although its use may have hindered the ability of GPR to detect rhizomes.
In the present study, the root topology reconstruction model is based on an orthogonal survey grid that integrates variation in rhizome extension angle ( θ ), diameter ( D ), and depth ( S D ), with the influences of these three variables are balanced by three weighting parameters (a, b, and c). For example, if a larger value of a is chosen, the model places more emphasis on the variation in rhizome extension angle ( θ ). Therefore, the values of a, b, and c influence the accuracy of the estimated root point connection. Although we determined the effective values of a, b, and c (Table 1) in this study, it is still necessary to determine the optimal values of a, b, and c for moso bamboo rhizomes using a larger dataset.
However, although we have shown that our model can be successfully applied to 3D RSA reconstruction of moso bamboo rhizomes, it exhibits several limitations. Our model differs substantially from the algorithm proposed by Wu et al. [38], with one of the main differences being that the root points missing from the GPR data in our study were not recovered by the reconstructed topology. To further improve the accuracy of the model, we need to study how best to recover missing root points in the RSA. Additionally, our model did not perform well when root points were relatively close together (Figure 14), a failure which is also consistently exhibited by the algorithms proposed by Wu et al. [38] and Ohashi et al. [39] for RSA reconstruction. A feasible approach to rectifying this problem may be to shorten the spacing of the GPR scan to obtain a more refined spatial distribution of root points. The root detection is also affected by the antenna frequency of the radar [27,54,55]. In general, lower antenna frequencies are able to detect roots at deeper depths, with a reduced resolution, while higher antenna frequencies are able to detect roots at shallower depths, but with an increased resolution [56,57]. In the present study, we used an antenna with a frequency of only 1200 MHz, which reduced the detection ability of the GPR. Therefore, the selection of a more suitable antenna frequency for rhizome detection requires further investigation. We suggest that the detectability and quantification (e.g., diameter prediction and biomass calculation) of GPR for rhizome applications may be improved by using dual-frequency antenna. In this study, our model was able to approximately reconstruct the 3D RSA of moso bamboo (Figure 13), which may have been positively influenced by the sparse distribution of moso bamboo rhizomes within the study area. However, the accuracy and efficacy of the model may vary across different species and study locations, and thus, additional field studies are required to refine the model and expand its applicability to different root systems.

5. Conclusions

In the present study, GPR was used to detect moso bamboo rhizomes and enable 3D reconstruction of their root system architecture. Our study demonstrates that rhizomes may be favourable targets for GPR detection due to their unique biological characteristics, such as the fact that they are predominantly distributed in shallow soil layers. Based on these known biological characteristics and root points obtained from manual excavation, an automated method for reconstructing RSA and root system topology of moso bamboo was developed for an orthogonal survey grid, with this method used to reconstruct the 3D RSA of moso bamboo based on GPR data. This method involved determination of the best-connected root points by combining the rhizome extension angle, rhizome diameter, and rhizome depth, which in turn enabled reconstruction of topology of the rhizome system. Finally, based on the recovered topology, the 3D RSA of the rhizomes was modeled using a smoothing function. The reconstructed RSA was generally consistent with the measured RSA using the excavation data, with 78.13% of the root points correctly connected. The reconstructed RSA estimated the total length, volume, and biomass of the rhizome system with 91.98%, 95.21%, and 94.73% accuracy, respectively, which confirmed that our model could provide an accurate approximation the RSA of moso bamboo. However, the reconstructed RSA based on GPR data provided only a rough approximation of the measured RSA, with the model failing to accurately reconstruct some features of the RSA due to missing root points and rhizome displacement. Our method further enriches the application of GPR to the study of rhizome systems, making non-destructive and long-term monitoring and mapping of 3D RSA possible under field conditions.
To our knowledge, this study is the first to demonstrate the use of GPR to reconstruct 3D RSA in moso bamboo. This method allows for non-destructive reconstruction of the 3D RSA of rhizome systems, which provides a novel addition to the methodologies available for root system studies. However, the proposed methodology exhibits several limitations, which reduce its accuracy and applicability in field studies. Therefore, additional studies with larger sample sizes are needed to refine the proposed method.

Author Contributions

Funding acquisition, G.Z., H.D., and C.L.; Conceptualisation, G.Z. and Y.Z.; methodology, L.X., C.L., G.Z., and Y.Z.; supervision, C.L. and Y.Z.; project administration, Y.Z.; investigation, L.X., C.L., T.Z., and X.G.; data curation, L.X. and M.Z.; visualisation, L.X., Y.C., and C.L.; writing—original draft preparation, L.X.; writing—review and editing, Y.C., C.L., H.D., and Y.Z.; All authors have read and agreed to the published version of the manuscript.

Funding

This research was funded by the National Natural Science Foundation of China (Grant number: U1809208), the Key Research and Development Program of Zhejiang Province (Grant number: 2021C02005), and the Postdoctoral Foundation of Zhejiang Province (Grant number: zj2019141).

Institutional Review Board Statement

Not applicable.

Informed Consent Statement

Not applicable.

Data Availability Statement

Not applicable.

Acknowledgments

This study was supported by the National Natural Science Foundation of China (Grant number: U1809208), the Key Research and Development Program of Zhejiang Province (Grant number: 2021C02005), and the Postdoctoral Foundation of Zhejiang Province (Grant number: zj2019141). We would also like to thank the editor and anonymous reviewers for their contributions to the peer review of our work.

Conflicts of Interest

The authors declare no conflict of interest.

References

  1. De Smet, I.; White, P.J.; Bengough, A.G.; Dupuy, L.; Parizot, B.; Casimiro, I.; Heidstra, R.; Laskowski, M.; Lepetit, M.; Hochholdinger, F.; et al. Analyzing lateral root development: How tomove forward. Plant Cell 2012, 24, 15–20. [Google Scholar] [CrossRef] [Green Version]
  2. Nicoll, B.C.; Ray, D. Adaptive growth of tree root systems in response to wind action and site conditions. Tree Physiol. 1996, 16, 891–898. [Google Scholar] [CrossRef] [Green Version]
  3. Kell, D.B. Breeding crop plants with deep roots: Their role in sustainable carbon, nutrient and water sequestration. Ann. Bot. 2011, 108, 407–418. [Google Scholar] [CrossRef] [Green Version]
  4. Kell, D.B. Large-scale sequestration of atmospheric carbon via plant roots in natural and agricultural ecosystems: Why and how. Philos. Trans. R. Soc. B Biol. Sci. 2012, 367, 1589–1597. [Google Scholar] [CrossRef] [PubMed] [Green Version]
  5. Resh, S.C.; Battaglia, M.; Worledge, D.; Ladiges, S. Coarse root biomass for eucalypt plantations in Tasmania, Australia: Sources of variation and methods for assessment. Trees Struct. Funct. 2003, 17, 389–399. [Google Scholar] [CrossRef]
  6. Sorgonà, A.; Proto, A.R.; Abenavoli, L.M.; Di Iorio, A. Spatial distribution of coarse root biomass and carbon in a high-density olive orchard: Effects of mechanical harvesting methods. Trees Struct. Funct. 2018, 32, 919–931. [Google Scholar] [CrossRef]
  7. Takahashi, H.; Pradal, C. Root phenotyping: Important and minimum information required for root modeling in crop plants. Breed. Sci. 2021, 71, 109–116. [Google Scholar] [CrossRef]
  8. Piñeros, M.A.; Larson, B.G.; Shaff, J.E.; Schneider, D.J.; Falcão, A.X.; Yuan, L.; Clark, R.T.; Craft, E.J.; Davis, T.W.; Pradier, P.-L.; et al. Evolving technologies for growing, imaging and analyzing 3D root system architecture of crop plants. J. Integr. Plant Biol. 2016, 58, 230–241. [Google Scholar] [CrossRef] [PubMed]
  9. Tester, M.; Langridge, P. Breeding Technologies to Increase Crop Production in a Changing World. Science 2010, 327, 818–822. [Google Scholar] [CrossRef] [PubMed]
  10. Wang, X.R.; Shen, J.B.; Liao, H. Acquisition or utilization, which is more critical for enhancing phosphorus efficiency in modern crops? Plant Sci. 2010, 179, 302–306. [Google Scholar] [CrossRef]
  11. Wu, Q.; Wu, J.; Zheng, B.Y.; Guo, Y. Optimizing soil-coring strategies to quantify root-length-density distribution in field-grown maize: Virtual coring trials using 3D root architecture models. Ann. Bot. 2018, 121, 809–819. [Google Scholar] [CrossRef]
  12. Zhu, J.M.; Ingram, P.A.; Benfey, P.N.; Elich, T. From lab to field, new approaches to phenotyping root system architecture. Curr. Opin. Plant Biol. 2011, 14, 310–317. [Google Scholar] [CrossRef] [PubMed]
  13. Buczko, U.; Kuchenbuch, R.O.; Gerke, H.H. Evaluation of a core sampling scheme to characterize root length density of maize. Plant Soil 2008, 316, 205. [Google Scholar] [CrossRef]
  14. Cahill, J.F.; McNickle, G.G.; Haag, J.J.; Lamb, E.G.; Nyanumba, S.M.; Clair, C.C.S. Plants Integrate Information about Nutrients and Neighbors. Science 2010, 328, 1657. [Google Scholar] [CrossRef] [PubMed] [Green Version]
  15. Reubens, B.; Poesen, J.; Danjon, F.; Geudens, G.; Muys, B. The role of fine and coarse roots in shallow slope stability and soil erosion control with a focus on root system architecture: A review. Trees Struct. Funct. 2007, 21, 385–402. [Google Scholar] [CrossRef]
  16. Danjon, F.; Fourcaud, T.; Bert, D. Root architecture and wind-firmness of mature Pinus pinaster. New Phytol. 2005, 168, 387–400. [Google Scholar] [CrossRef] [PubMed]
  17. Godin, C.; Costes, E.; Sinoquet, H. A Method for Describing Plant Architecture Which Integrates Topology and Geometry. Ann. Bot. 1999, 84, 343–357. [Google Scholar] [CrossRef]
  18. Gärtner, H.; Wagner, B.; Heinrich, I.; Denier, C. 3D-laser scanning: A new method to analyze coarse tree root systems. For. Snow Landsc. Res. 2009, 82, 95–106. [Google Scholar]
  19. Zenone, T.; Morelli, G.; Teobaldelli, M.; Fischanger, F.; Matteucci, M.; Sordini, M.; Armani, A.; Ferrè, C.; Chiti, T.; Seufert, G. Preliminary use of ground-penetrating radar and electrical resistivity tomography to study tree roots in pine forests and poplar plantations. Funct. Plant Biol. 2008, 35, 1047–1058. [Google Scholar] [CrossRef]
  20. Song, X.Z.; Zhou, G.M.; Jiang, H.; Yu, S.Q.; Fu, J.H.; Li, W.Z.; Wang, W.F.; Ma, Z.H.; Peng, C.H. Carbon sequestration by Chinese bamboo forests and their ecological benefits: Assessment of potential, problems, and future challenges. Environ. Rev. 2011, 19, 418–428. [Google Scholar] [CrossRef] [Green Version]
  21. Li, C.; Cai, Y.; Xiao, L.D.; Gao, X.Y.; Shi, Y.J.; Du, H.Q.; Zhou, Y.F.; Zhou, G.M. Effects of different planting approaches and site conditions on aboveground carbon storage along a 10-year chronosequence after moso bamboo reforestation. For. Ecol. Manag. 2021, 482, 118867. [Google Scholar] [CrossRef]
  22. Xu, L.; Fang, H.Y.; Deng, X.; Ying, J.Y.; Lv, W.J.; Shi, Y.J.; Zhou, G.M.; Zhou, Y.F. Biochar application increased ecosystem carbon sequestration capacity in a Moso bamboo forest. For. Ecol. Manag. 2020, 475, 118447. [Google Scholar] [CrossRef]
  23. Yen, T.M.; Lee, J.S. Comparing aboveground carbon sequestration between moso bamboo (Phyllostachys heterocycla) and China fir (Cunninghamia lanceolata) forests based on the allometric model. For. Ecol. Manag. 2011, 261, 995–1002. [Google Scholar] [CrossRef]
  24. Isagi, Y.; Oda, T.; Fukushima, K.; Lian, C.; Yokogawa, M.; Kaneko, S. Predominance of a single clone of the most widely distributed bamboo species Phyllostachys edulis in East Asia. J. Plant Res. 2016, 129, 21–27. [Google Scholar] [CrossRef] [PubMed]
  25. Shi, J.M.; Mao, S.Y.; Wang, L.F.; Ye, X.H.; Wu, J.; Wang, G.R.; Chen, F.S.; Yang, Q.P. Clonal integration driven by source-sink relationships is constrained by rhizome branching architecture in a running bamboo species (Phyllostachys glauca): A 15N assessment in the field. For. Ecol. Manag. 2021, 481, 118754. [Google Scholar] [CrossRef]
  26. Li, Y.; Chen, J.; Xue, G.; Peng, Y.; Song, H. Effect of clonal integration on nitrogen cycling in rhizosphere of rhizomatous clonal plant, Phyllostachys bissetii, under heterogeneous light. Sci. Total Environ. 2018, 628–629, 594–602. [Google Scholar] [CrossRef] [PubMed]
  27. Guo, L.; Chen, J.; Cui, X.H.; Fan, B.H.; Lin, H. Application of ground penetrating radar for coarse root detection and quantification: A review. Plant Soil 2013, 362. [Google Scholar] [CrossRef] [Green Version]
  28. Lontoc-Roy, M.; Dutilleul, P.; Prasher, S.O.; Han, L.; Smith, D.L. Computed tomography scanning for three-dimensional imaging and complexity analysis of developing root systems. Can. J. Bot. 2005, 83, 1434–1442. [Google Scholar] [CrossRef]
  29. Barton, C.V.M.; Montagu, K.D. Detection of tree roots and determination of root diameters by ground penetrating radar under optimal conditions. Tree Physiol. 2004, 24, 1323–1331. [Google Scholar] [CrossRef] [PubMed] [Green Version]
  30. Butnor, J.R.; Doolittle, J.A.; Johnsen, K.H.; Samuelson, L.; Stokes, T.; Kress, L. Utility of ground-penetrating radar as a root biomass survey tool in forest systems. Soil Sci. Soc. Am. J. 2003, 67, 1607–1615. [Google Scholar] [CrossRef] [Green Version]
  31. Butnor, J.R.; Doolittle, J.A.; Kress, L.; Cohen, S.; Johnsen, K.H. Use of ground-penetrating radar to study tree roots in the Southeastern United States. Tree Physiol. 2001, 21, 1269–1278. [Google Scholar] [CrossRef] [Green Version]
  32. Cui, X.H.; Chen, J.; Shen, J.S.; Cao, X.; Chen, X.H.; Zhu, X.L. Modeling tree root diameter and biomass by ground-penetrating radar. Sci. China Earth Sci. 2011, 54, 711–719. (In Chinese) [Google Scholar] [CrossRef]
  33. Cui, X.H.; Zhang, Z.; Guo, L.; Liu, X.B.; Quan, Z.X.; Cao, X.; Chen, X.H. The Root-Soil Water Relationship Is Spatially Anisotropic in Shrub-Encroached Grassland in North China: Evidence from GPR Investigation. Remote Sens. 2021, 13, 1137. [Google Scholar] [CrossRef]
  34. Guo, L.; Wu, Y.; Chen, J.; Hirano, Y.; Tanikawa, T.; Li, W.T.; Cui, X.H. Calibrating the impact of root orientation on root quantification using ground-penetrating radar. Plant Soil 2015, 395, 289–305. [Google Scholar] [CrossRef]
  35. Hruska, J.; Čermák, J.; Šustek, S. Mapping tree root systems with ground-penetrating radar. Tree Physiol. 1999, 19, 125–130. [Google Scholar] [CrossRef] [Green Version]
  36. Isaac, M.E.; Anglaaere, L.C.N. An in situ approach to detect tree root ecology: Linking ground-penetrating radar imaging to isotope-derived water acquisition zones. Ecol. Evol. 2013, 3, 1330–1339. [Google Scholar] [CrossRef]
  37. Stokes, A.; Fourcaud, T.; Hruska, J.; Cermak, J.; Nadyezdhina, N.; Praus, L. An evaluation of different methods to investigate root system architecture of urban trees in situ: I. ground-penetrating radar. J. Arboric. 2002, 28, 2–10. [Google Scholar]
  38. Wu, Y.; Guo, L.; Cui, X.; Chen, J.; Cao, X.; Lin, H. Ground-penetrating radar-based automatic reconstruction of three-dimensional coarse root system architecture. Plant Soil 2014, 383, 155–172. [Google Scholar] [CrossRef]
  39. Ohashi, M.; Ikeno, H.; Sekihara, K.; Tanikawa, T.; Dannoura, M.; Yamase, K.; Todo, C.; Tomita, T.; Hirano, Y. Reconstruction of root systems in Cryptomeria japonica using root point coordinates and diameters. Planta 2019, 249, 445–455. [Google Scholar] [CrossRef] [PubMed]
  40. Hirano, Y.; Dannoura, M.; Aono, K.; Igarashi, T.; Ishii, M.; Yamase, K.; Makita, N.; Kanazawa, Y. Limiting factors in the detection of tree roots using ground-penetrating radar. Plant Soil 2009, 319, 15–24. [Google Scholar] [CrossRef]
  41. Liu, X.B.; Cui, X.H.; Guo, L.; Chen, J.; Li, W.T.; Yang, D.; Di Cao, X.; Chen, X.H.; Liu, Q.X.; Lin, H. Non-invasive estimation of root zone soil moisture from coarse root reflections in ground-penetrating radar images. Plant Soil 2019, 436, 623–639. [Google Scholar] [CrossRef]
  42. Ristic, A.V.; Petrovacki, D.; Govedarica, M. A new method to simultaneously estimate the radius of a cylindrical object and the wave propagation velocity from GPR data. Comput. Geosci. 2009, 35, 1620–1630. [Google Scholar] [CrossRef]
  43. Fan, H.H. Study on Rhizome Growth Regularity of New-planted Phyllostachys edulis. J. Fujian Coll. For. 1999, 19, 30–32. (In Chinese) [Google Scholar]
  44. Jiang, G.H.; Yu, L.H.; Li, Z.D.; Niu, H.W.; Shi, L. Hierarchical system and its quantitative attribute of moso bamboo rhizome. Chin. J. Ecol. 2017, 36, 3479–3484. (In Chinese) [Google Scholar] [CrossRef]
  45. Zhu, S.P.; Huang, C.L.; Su, Y.; Sato, M. 3D Ground Penetrating Radar to Detect Tree Roots and Estimate Root Biomass in the Field. Remote Sens. 2014, 6, 5754–5773. [Google Scholar] [CrossRef] [Green Version]
  46. Hirano, Y.; Yamamoto, R.; Dannoura, M.; Aono, K.; Igarashi, T.; Ishii, M.; Yamase, K.; Makita, N.; Kanazawa, Y. Detection frequency of Pinus thunbergii roots by ground-penetrating radar is related to root biomass. Plant Soil 2012, 360, 363–373. [Google Scholar] [CrossRef]
  47. Tanikawa, T.; Ikeno, H.; Dannoura, M.; Yamase, K.; Aono, K.; Hirano, Y. Leaf litter thickness, but not plant species, can affect root detection by ground penetrating radar. Plant Soil 2016, 408, 271–283. [Google Scholar] [CrossRef]
  48. Chen, X.X.; He, R.Y.; Ding, Q.S.; Sun, Q. A Digitization and Visualization Procedure for 3D Wheat Root System Architecture in Rice-Wheat Rotation. J. Inst. Eng. Ser. A 2019, 100, 1–8. [Google Scholar] [CrossRef]
  49. Danjon, F.; Reubens, B. Assessing and analyzing 3D architecture of woody root systems, a review of methods and applications in tree and soil stability, resource acquisition and allocation. Plant Soil 2008, 303, 1–34. [Google Scholar] [CrossRef]
  50. Liu, Q.X.; Cui, X.H.; Liu, X.B.; Chen, J.; Chen, X.H.; Cao, X. Detection of Root Orientation Using Ground-Penetrating Radar. IEEE Trans. Geosci. Remote Sens. 2018, 56, 93–104. [Google Scholar] [CrossRef]
  51. Tanikawa, T.; Hirano, Y.; Dannoura, M.; Yamase, K.; Aono, K.; Ishii, M.; Igarashi, T.; Ikeno, H.; Kanazawa, Y. Root orientation can affect detection accuracy of ground-penetrating radar. Plant Soil 2013, 373, 317–327. [Google Scholar] [CrossRef]
  52. Bain, J.; Day, F.; Butnor, J. Experimental Evaluation of Several Key Factors Affecting Root Biomass Estimation by 1500 MHz Ground-Penetrating Radar. Remote Sens. 2017, 9, 1337. [Google Scholar] [CrossRef] [Green Version]
  53. Guo, L.; Lin, H.; Fan, B.H.; Cui, X.H.; Chen, J. Impact of root water content on root biomass estimation using ground penetrating radar: Evidence from forward simulations and field controlled experiments. Plant Soil 2013, 371, 503–520. [Google Scholar] [CrossRef]
  54. Dannoura, M.; Hirano, Y.; Igarashi, T.; Ishii, M.; Aono, K.; Yamase, K.; Kanazawa, Y. Detection of Cryptomeria japonica roots with ground penetrating radar. Plant Biosyst. 2008, 142, 375–380. [Google Scholar] [CrossRef]
  55. Yamase, K.; Tanikawa, T.; Dannoura, M.; Ohashi, M.; Todo, C.; Ikeno, H.; Aono, K.; Hirano, Y. Ground-penetrating radar estimates of tree root diameter and distribution under field conditions. Trees 2018, 32, 1657–1668. [Google Scholar] [CrossRef]
  56. De Coster, A.; Lambot, S. Fusion of Multifrequency GPR Data Freed from Antenna Effects. IEEE J. Sel. Top. Appl. Earth Obs. Remote Sens. 2018, 11, 664–674. [Google Scholar] [CrossRef]
  57. Cui, X.; Liu, X.; Cao, X.; Fan, B.; Zhang, Z.; Chen, J.; Chen, X.; Lin, H.; Guo, L. Pairing dual-frequency GPR in summer and winter enhances the detection and mapping of coarse roots in the semi-arid shrubland in China. Eur. J. Soil Sci. 2020, 71, 236–251. [Google Scholar] [CrossRef]
Figure 1. Diagram illustrating the generalised spatial distribution of moso bamboo rhizomes. The rhizome system is composed of interconnected branches emanating from the same parent bamboo plant.
Remotesensing 13 02816 g001
Figure 2. 3D distribution map of rhizome systems of moso bamboo excavated in the field. (a) Distribution map of moso bamboo rhizome system in subplot A; (b) Distribution map of moso bamboo rhizome system in subplot B.
Remotesensing 13 02816 g002
Figure 3. (a) Survey site for ground-penetrating radar (GPR) analysis of moso bamboo rhizomes, including ropes representing the orthogonal survey grid. (b) 3D schematic of the sample plot, including the layout and orientation of scan survey lines.
Remotesensing 13 02816 g003
Figure 4. Detection and localisation of rhizomes using identification of by identifying hyperbolic reflections in a processed radar image. The yellow circles indicate the locations of the rhizomes as the vertices of the hyperbolic reflections.
Remotesensing 13 02816 g004
Figure 5. Schematic illustration of the principle of estimating rhizome diameter using the hyperbolic model.
Remotesensing 13 02816 g005
Figure 6. (a) Schematic illustration of the principle of connecting root points. Only four interconnected 20 × 20 cm rectangles are shown here. Red points represent the best-connected root points, while green points represent interfering root points; (b) flow chart of the root point connection algorithm for the proposed automatic root system architecture (RSA) reconstruction methodology.
Remotesensing 13 02816 g006
Figure 7. Variation in rhizome diameter and extension angle as a function of the root point. The x-axis represents the n t h root point of the rhizome. The angle between the line formed by the candidate root point, starting root point, and x-direction is defined as the extension angle.
Remotesensing 13 02816 g007
Figure 8. (a) Front (top panel) and ground plan (bottom panel) views of the distribution of root points obtained by excavation and ground-penetrating radar (GPR) methods. Green crosses represent root points identified by direct excavation, while red circles represent root points identified by GPR analysis; (b) Vertical distribution of rhizomes in the soil media, compared between data obtained by excavation (green) and GPR (red).
Remotesensing 13 02816 g008
Figure 9. Ground-penetrating radar (GPR) detection frequency of rhizomes in (a) each rhizome diameter class and (b) each rhizome depth class, where n represents the number of rhizomes in each class identified via excavation.
Remotesensing 13 02816 g009
Figure 10. Comparison of the actual measured and the reconstructed topology of the rhizome system. Dashed lines represent the measured root system architecture (RSA) topology, which was obtained by directly connecting the measured root points (red circles). Solid line represents the RSA topology reconstructed using the algorithm.
Remotesensing 13 02816 g010
Figure 11. Front (a) and ground plan (b) views of the reconstructed 3D root system architecture (RSA) of moso bamboo. This 3D RSA was developed using the topology structure presented in Figure 10.
Remotesensing 13 02816 g011
Figure 12. Comparison of actual measured (red dotted lines) and reconstructed (black solid lines) topology of the rhizome system. The measured root system architecture (RSA) topology was obtained by directly connecting the measured root points (red circles), while the ground-penetrating radar (GPR)-based RSA topology was constructed by connecting the root points detected by GPR (black circles).
Remotesensing 13 02816 g012
Figure 13. Comparison between actual measured (red) and ground-penetrating radar (GPR)-based reconstructed (green) 3D root system architecture (RSA), presented in a ground plan view.
Remotesensing 13 02816 g013
Figure 14. Comparison between the actual measured (black) and reconstructed (red) 3D root system architecture (RSA) as seen from the ground plan view. Blue dashed circles A–D represent four major differences between the measured and reconstructed RSA.
Remotesensing 13 02816 g014
Table 1. Values of the weighting parameters a, b, and c, and associated accuracy of the root system architecture (RSA) reconstruction. Numbers in bold indicate the highest accuracy achieved for the root point connection.
abcAccuracy (%)
0.00.50.542.88
0.20.40.448.96
0.40.30.367.71
0.60.20.278.13
0.80.10.170.83
1.00.00.059.38
Table 2. Soil stone content and soil water content at different soil depths.
Soil Depth (cm)Soil Stone Content (%)Soil Water Content (%)
0–105.14 ± 2.2910.84 ± 1.33
10–305.03 ± 1.8910.29 ± 1.15
30–504.77 ± 2.349.30 ± 0.46
Note: Data are expressed as mean ± standard deviation, and the number of samples per soil depth was 28.
Table 3. Mean rhizome diameter at different soil depths, based on both direct measurement and ground-penetrating radar (GPR) estimation methods.
Soil Depth (cm)Measured Diameter (mm)GPR-Based Estimated Diameter (mm)
0–517.8 ± 3.6 a18.8 ± 4.3 a
5–1015.8 ± 3.4 a16.8 ± 3.7 a
10–1517.9 ± 2.3 a18.0 ± 2.2 a
15–2017.8 ± 4.3 a19.7 ± 2.6 a
≥2016.7 ± 0.6 a16.7 ± 2.1 a
Note: Data are expressed as the mean ± standard deviation. Different lowercase letters in the same column indicate significant differences between different soil depths at p < 0.05 based on Tukey’s test.
Table 4. Accuracy of reconstructed root system architecture (RSA) in terms of total length, volume, and biomass assessed by comparison with measured RSA.
Measured RSAReconstructed RSAAccuracy (%)GPR-Based ReconstructedAccuracy (%)
Total length (cm)1530.61457.991.98986.564.45
Total volume ( cm 3 )3659.33483.995.212678.973.21
Total biomass (g)2866.82715.794.732088.272.84
Publisher’s Note: MDPI stays neutral with regard to jurisdictional claims in published maps and institutional affiliations.

