
Cotton Stand Counting from Unmanned Aerial System Imagery Using MobileNet and CenterNet Deep Learning Models


1
Department of Plant and Soil Science, Texas Tech University, Lubbock, TX 79409, USA
2
Department of Soil and Crop Sciences, Texas A&M AgriLife Research, Lubbock, TX 79403, USA
*
Author to whom correspondence should be addressed.
Remote Sens. 2021, 13(14), 2822; https://0-doi-org.brum.beds.ac.uk/10.3390/rs13142822
Submission received: 1 June 2021
/
Revised: 8 July 2021
/
Accepted: 15 July 2021
/
Published: 18 July 2021
/
Corrected: 11 May 2022
(This article belongs to the Special Issue Deep Learning Methods for Crop Monitoring and Crop Yield Prediction)
Abstract
:An accurate stand count is a prerequisite to determining the emergence rate, assessing seedling vigor, and facilitating site-specific management for optimal crop production. Traditional manual counting methods in stand assessment are labor intensive and time consuming for large-scale breeding programs or production field operations. This study aimed to apply two deep learning models, the MobileNet and CenterNet, to detect and count cotton plants at the seedling stage with unmanned aerial system (UAS) images. These models were trained with two datasets containing 400 and 900 images with variations in plant size and soil background brightness. The performance of these models was assessed with two testing datasets of different dimensions, testing dataset 1 with 300 by 400 pixels and testing dataset 2 with 250 by 1200 pixels. The model validation results showed that the mean average precision (mAP) and average recall (AR) were 79% and 73% for the CenterNet model, and 86% and 72% for the MobileNet model with 900 training images. The accuracy of cotton plant detection and counting was higher with testing dataset 1 for both CenterNet and MobileNet models. The results showed that the CenterNet model had a better overall performance for cotton plant detection and counting with 900 training images. The results also indicated that more training images are required when applying object detection models on images with different dimensions from training datasets. The mean absolute percentage error (MAPE), coefficient of determination (R2), and the root mean squared error (RMSE) values of the cotton plant counting were 0.07%, 0.98 and 0.37, respectively, with testing dataset 1 for the CenterNet model with 900 training images. Both MobileNet and CenterNet models have the potential to accurately and timely detect and count cotton plants based on high-resolution UAS images at the seedling stage. This study provides valuable information for selecting the right deep learning tools and the appropriate number of training images for object detection projects in agricultural applications.
1. Introduction
An accurate plant stand count is a prerequisite to evaluating emergence rate, assessing seedling vigor and facilitating site-specific management. Stand count is required to measure crop density and uniformity of seedlings for breeding programs [1,2,3]. Stand count is critical for growers to make decisions for replanting and other site-specific management to avoid yield loss [4,5]. For example, cotton (Gossypium hirsutum L.) yield rapidly decreases if plant density is below five plants per linear meter of a row in the Texas High Plains [6]. The traditional method for determining plant stand count is typically by manually counting the number of plants within a unit area, which is time consuming and labor intensive with sampling bias. Efficient and accurate stand counting methods are needed to expedite breeding pipelines or improve decision support in precision crop management. Technological innovations in unmanned aerial systems (UAS) and advances in image processing provide opportunities to enhance high-throughput plant phenotyping, including stand count. UAS platforms facilitate more flexibility in image acquisition in flight height, flight area and weather conditions compared to satellites and ground vehicles. As a result, the UAS with various sensors has become an increasingly important tool to acquire high-resolution imagery for plant phenotyping and evaluating within-field variations in precision agriculture [7,8,9]. For example, RGB images have been applied to estimate plant or fruit counts [10,11,12,13,14]. Feng et al. applied the normalized difference vegetation index (NDVI) derived from a hyperspectral sensor to segment and count the number of cotton plants [15]. However, it required the removal of false matches using the k-nearest neighbors algorithm for feature detection and matching. Deep learning algorithms can combine feature detection and matching in a more efficient way.
Deep learning with advanced image analysis has offered opportunities for high-throughput plant phenotyping in recent years. Deep learning algorithms learn high-level features in an incremental way, which eliminates the need for feature identification and extraction [16]. In addition, multilayer deep learning models perform well for complicated nonlinear tasks [17]. A number of popular pre-trained deep learning models have been tested and validated with high accuracy and efficiency, which can be transferred to different tasks as transform learning models [18,19]. Deep networks have been applied to generate complex models to assess crop phenotypic attributes [20,21]. For example, Gao et al. [22] used the faster R-CNN model to perform multiclass fruit-on-plant apple detection. Wu et al. [23] combined image segmentation with the VGG-16 CNN model for counting rice seedlings from UAS images. Lin and Guo [24] proposed the integration of image segmentation and the U-Net CNN model using UAV images for sorghum panicle detection and counting. Compared with studies on other plants and crops, cotton stand detection and counting requires delineation of individual cotton plant with multiple leaves.
Cotton stand count has been assessed using machine learning and deep learning algorithms with RGB and multispectral images in recent years. For example, Oh et al. [25] developed a deep learning cotton stand count algorithm using the You Only Look Once model (Version 3, YOLOv3), with excellent performance (R2 = 0.96). However, additional photogrammetry procedures were required to separate, locate and count cotton plants for more accurate results after YOLOv3 algorithm detection. Fend et al. [26] developed a nearly real-time image processing method using UAV imagery and a convolutional neural network (CNN) model for cotton stand counting (R2 = 0.95). Many challenges remain on cotton stand count tasks using deep learning algorithms. For example, a large ground truth and reference data are required for image preprocessing purposes [15,26]. High-resolution imagery is also required for such tasks using deep learning algorithms, which typically requires UAS images captured at altitudes of 10 m or lower. For object detection models, most of the advanced models are based on the region proposal convolutional neural networks (R-CNN) model, which is not very efficient [27]. Various improved and customized models have been developed and tested to improve object detection precision and accuracy. The MobileNet and CenterNet are such models applied in object detection and classification tasks. The MobileNet model [28] is a low-latency convolution neural network that can be applied on mobile phones with its embedded vision applications. Compared with previous models, the CenterNet model is an anchor-free one-stage object detection architecture that explores the visual patterns in each of the cropped regions with minimal costs [29]. The CenterNet model detects objects based on key points instead of anchor bounding boxes, which increases accuracy and speed by reducing the appearance of detected wrong bounding boxes [30,31]. Limited studies have evaluated the performance of these two models in agricultural applications. For example, the MobileNet model has been applied to detect plant disease on rice [32] and apple [33]. The CenterNet model has been applied to extract weeds from vegetable plants [34] and detect fruits from digital images [35]. The assessment of these two models in plant phenotyping, such as cotton stand counting, can provide valuable information about selecting the appropriate deep learning tools for the right tasks. These two models can separate and count individual cotton plants at the seedling stage. Therefore, the objective of this study was to assess the application of MobileNet and CenterNet models in cotton stand counting at the seedling stage. These models were evaluated for their performance in terms of the number of training images and dimensions of training and testing images.
2. Materials and Methods
2.1. Experimental Sites
This study was conducted in a research field (33°35′50.53″ N, 101°54′27.30″ W) in Lubbock County, Texas, in 2020. The climate in this region is semiarid, with an average annual rainfall of 487 mm, mostly falling between May and September, frequently as a result of convective thunderstorms [36]. The dominant soil type at the study site is Pullman clay loam (fine, mixed, superactive, thermic Torrertic Paleustolls), which has fine and mixed textures, good drainage and moderately high saturated hydraulic conductivity [37]. Three cotton varieties, including FM 1911GLT, FM 1830GLT, and ST 4946GLB2 (BASF, Ludwigshafen, Germany), were planted on May 28, 2020. In total, there were 208 plots, each 8 m long and eight rows wide in a north-south direction. A 1.5-m alley was arranged between plots. A subsurface drip system was used to irrigate the crop during the growing season.
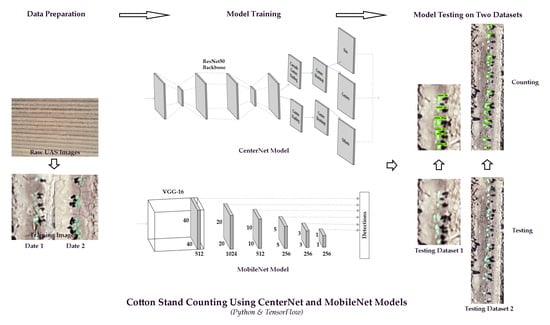
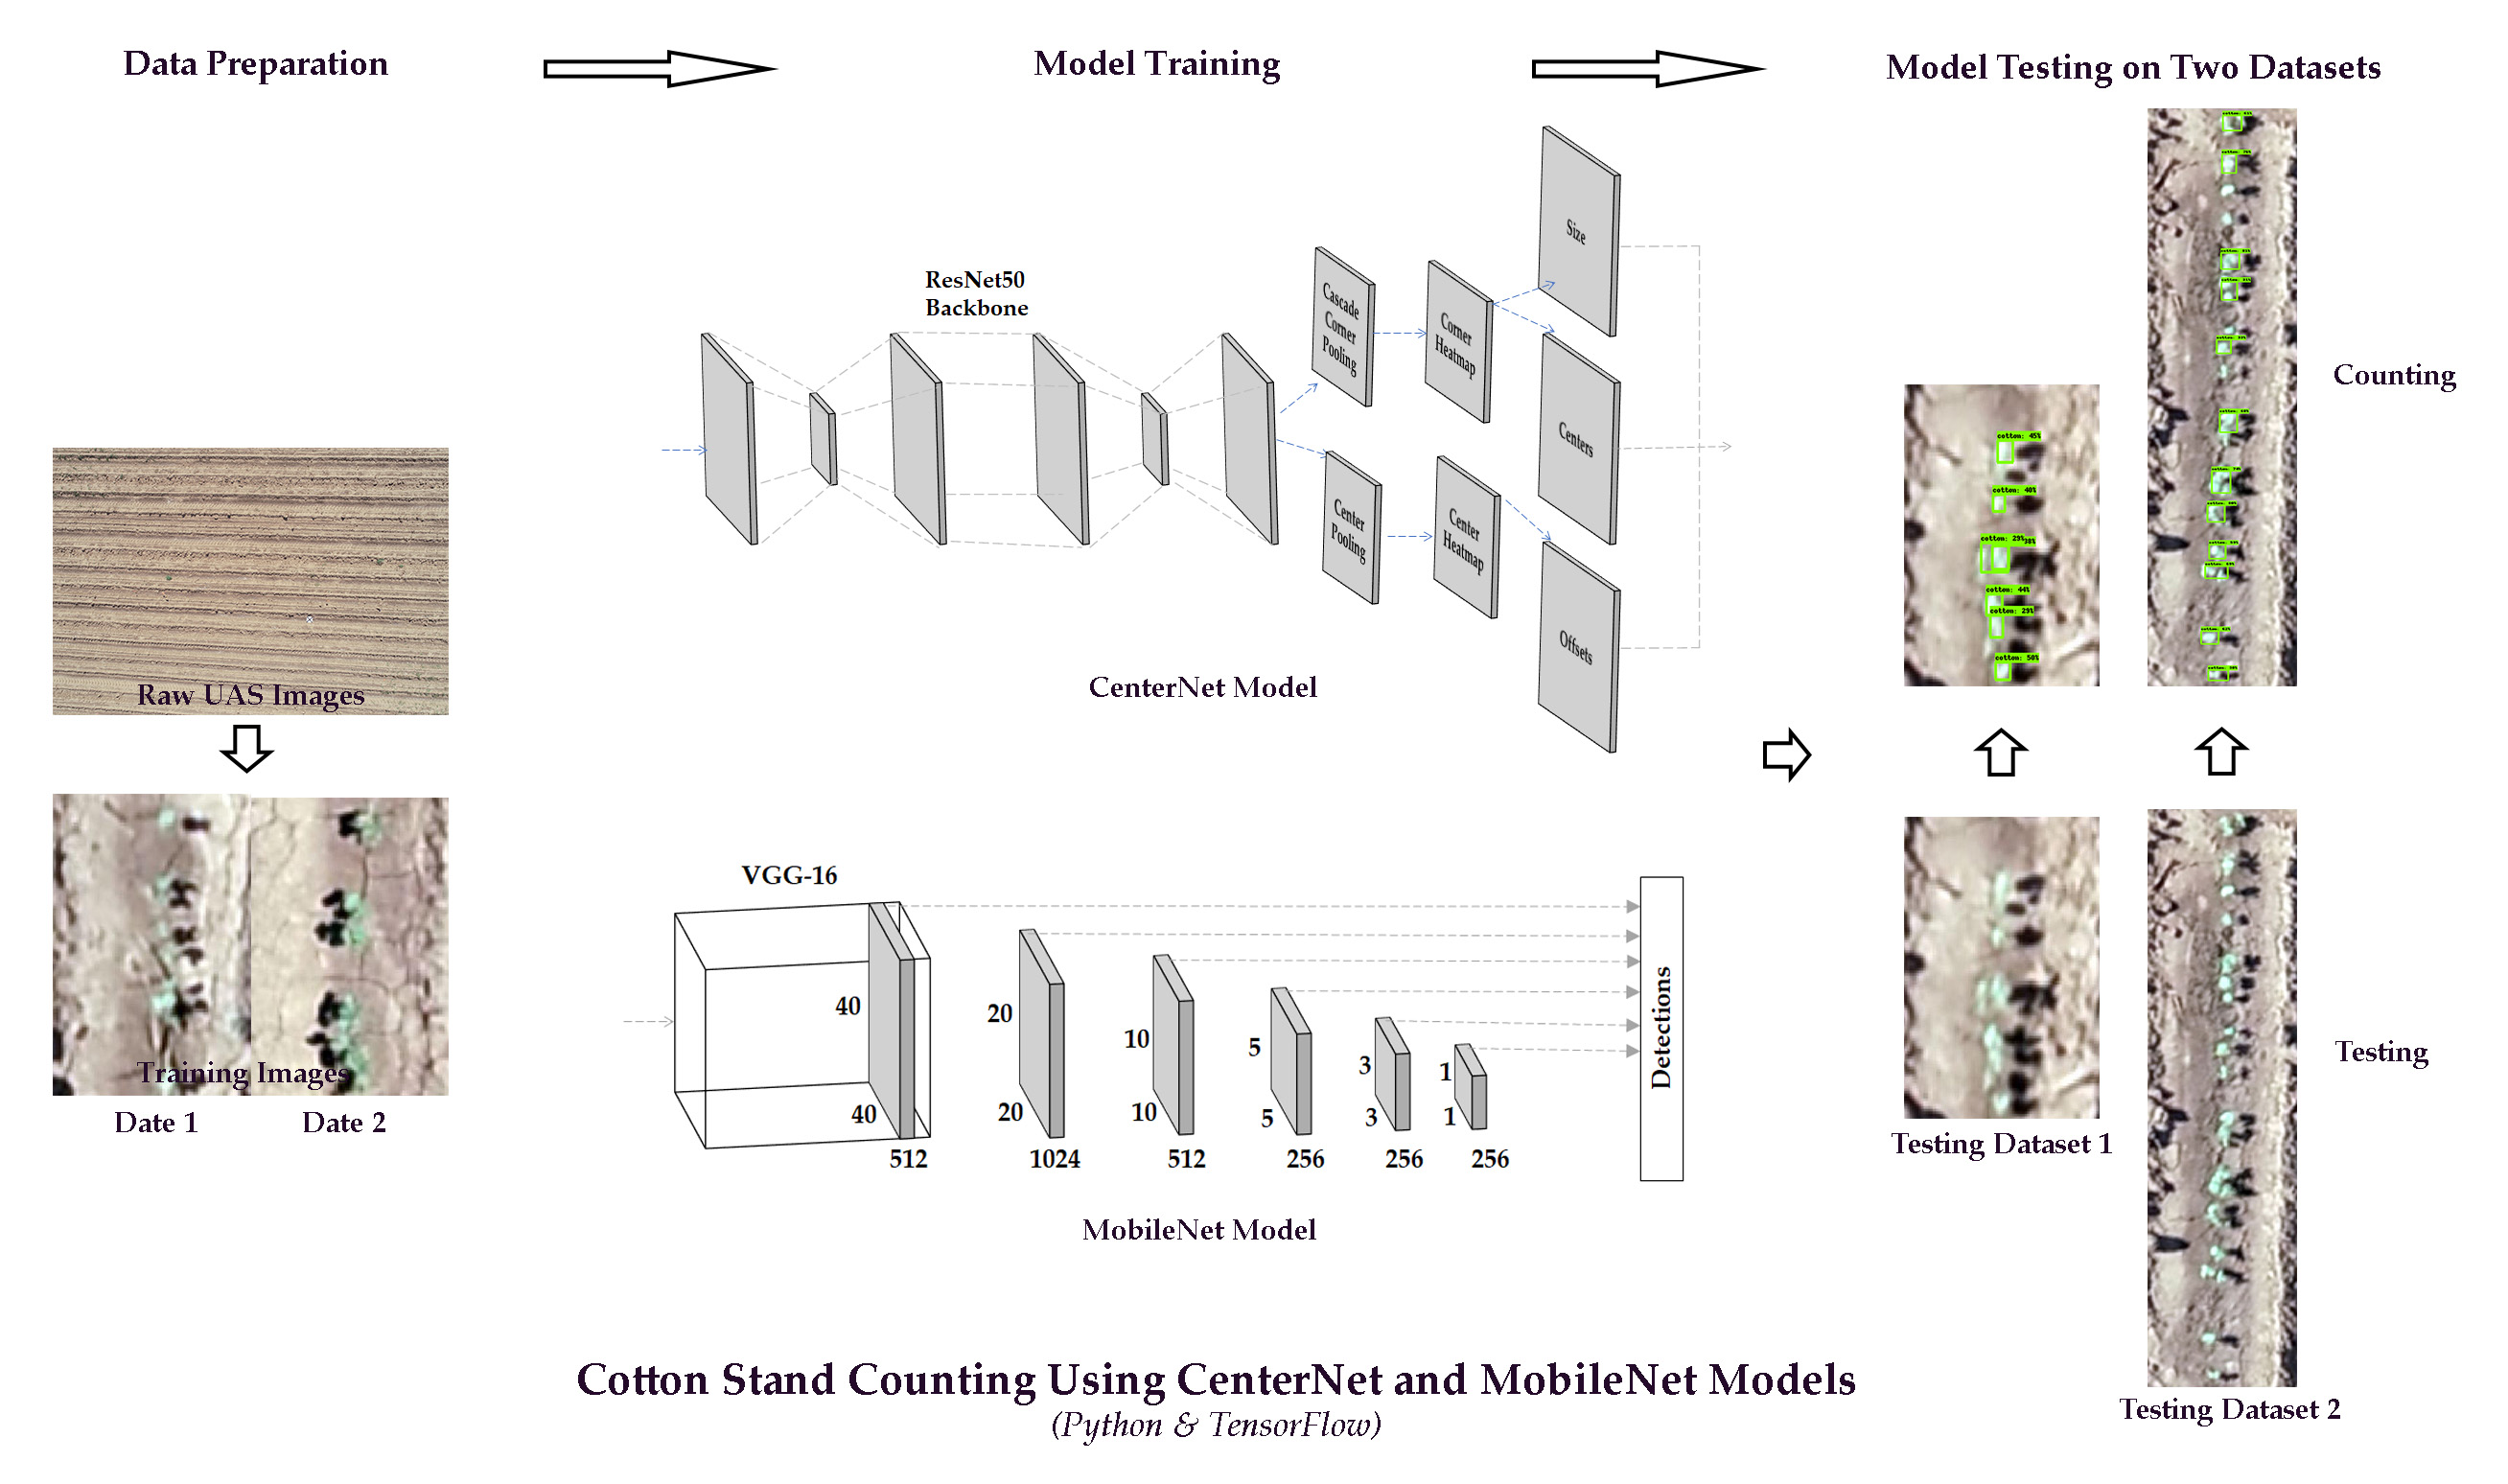
Figure 1 shows the general procedure of image acquisition, data processing and the algorithms of cotton stand counting using CenterNet and MobileNet models. After capturing UAS images, training images were randomly chosen from two flight dates. Two training datasets containing 400 and 900 images were prepared and trained by the CenterNet and MobileNet models separately. Trained models per training images were saved separately after CenterNet and MobileNet training. Testing images in two datasets went through each trained model to detect and count cotton plants. The final output included bounding boxes of detected cotton plants, detection class and the corresponding F1-score.
The algorithms of these two models were implemented using the TensorFlow [38] high-level application programming interface (API). TensorFlow is an end-to-end open-source platform developed by Google (Google Inc., Mountain View, CA, USA) for machine learning and deep learning applications. A Python (Version 3.7, Python Software Foundation) script was developed to facilitate the algorithms on the Google Colaboratory [39] platform, a web integrated development environment (IDE) in the Jupyter notebook platform that runs in the cloud environment. The training process was performed using a computer with 12 GB of GPU.
2.2. UAS Image Acquisition
A DJI Phantom 4 Pro (DJI, Shenzhen, China) with a 4K RGB camera was used for image acquisition. The UAS has a two-axis gimbal that can maintain the orientation of the camera independently from the movement. The UAS is controlled with a 2.4 GHz frequency bidirectional transmission that receives data of the battery voltage, Global Positioning System (GPS) reception, the distance, and the height differences from the home point. The maximum flight duration of the UAS is about 30 min. The flight plan was created using the DJI GSPro software (Version 2.0.15, DJI, Shenzhen, China). The flight plan included 80% front overlap and 80% side overlap. The angle of the camera was set at 90 degrees to the land surface during flight. The UAS flew at an altitude of 20 m at a speed of 2.4 m s−1, resulting in an image resolution of 3.3 mm. Images were acquired on 8 June and 14 June, 2020. All image acquisitions were conducted on clear days with light to moderate wind conditions around the local solar noon. For each dataset, the raw images were stitched into an orthomosaic image using the Pix4DMapper software (Version 4.6.4, Pix4D S.A., Prilly, Switzerland).
2.3. Training and Testing Images
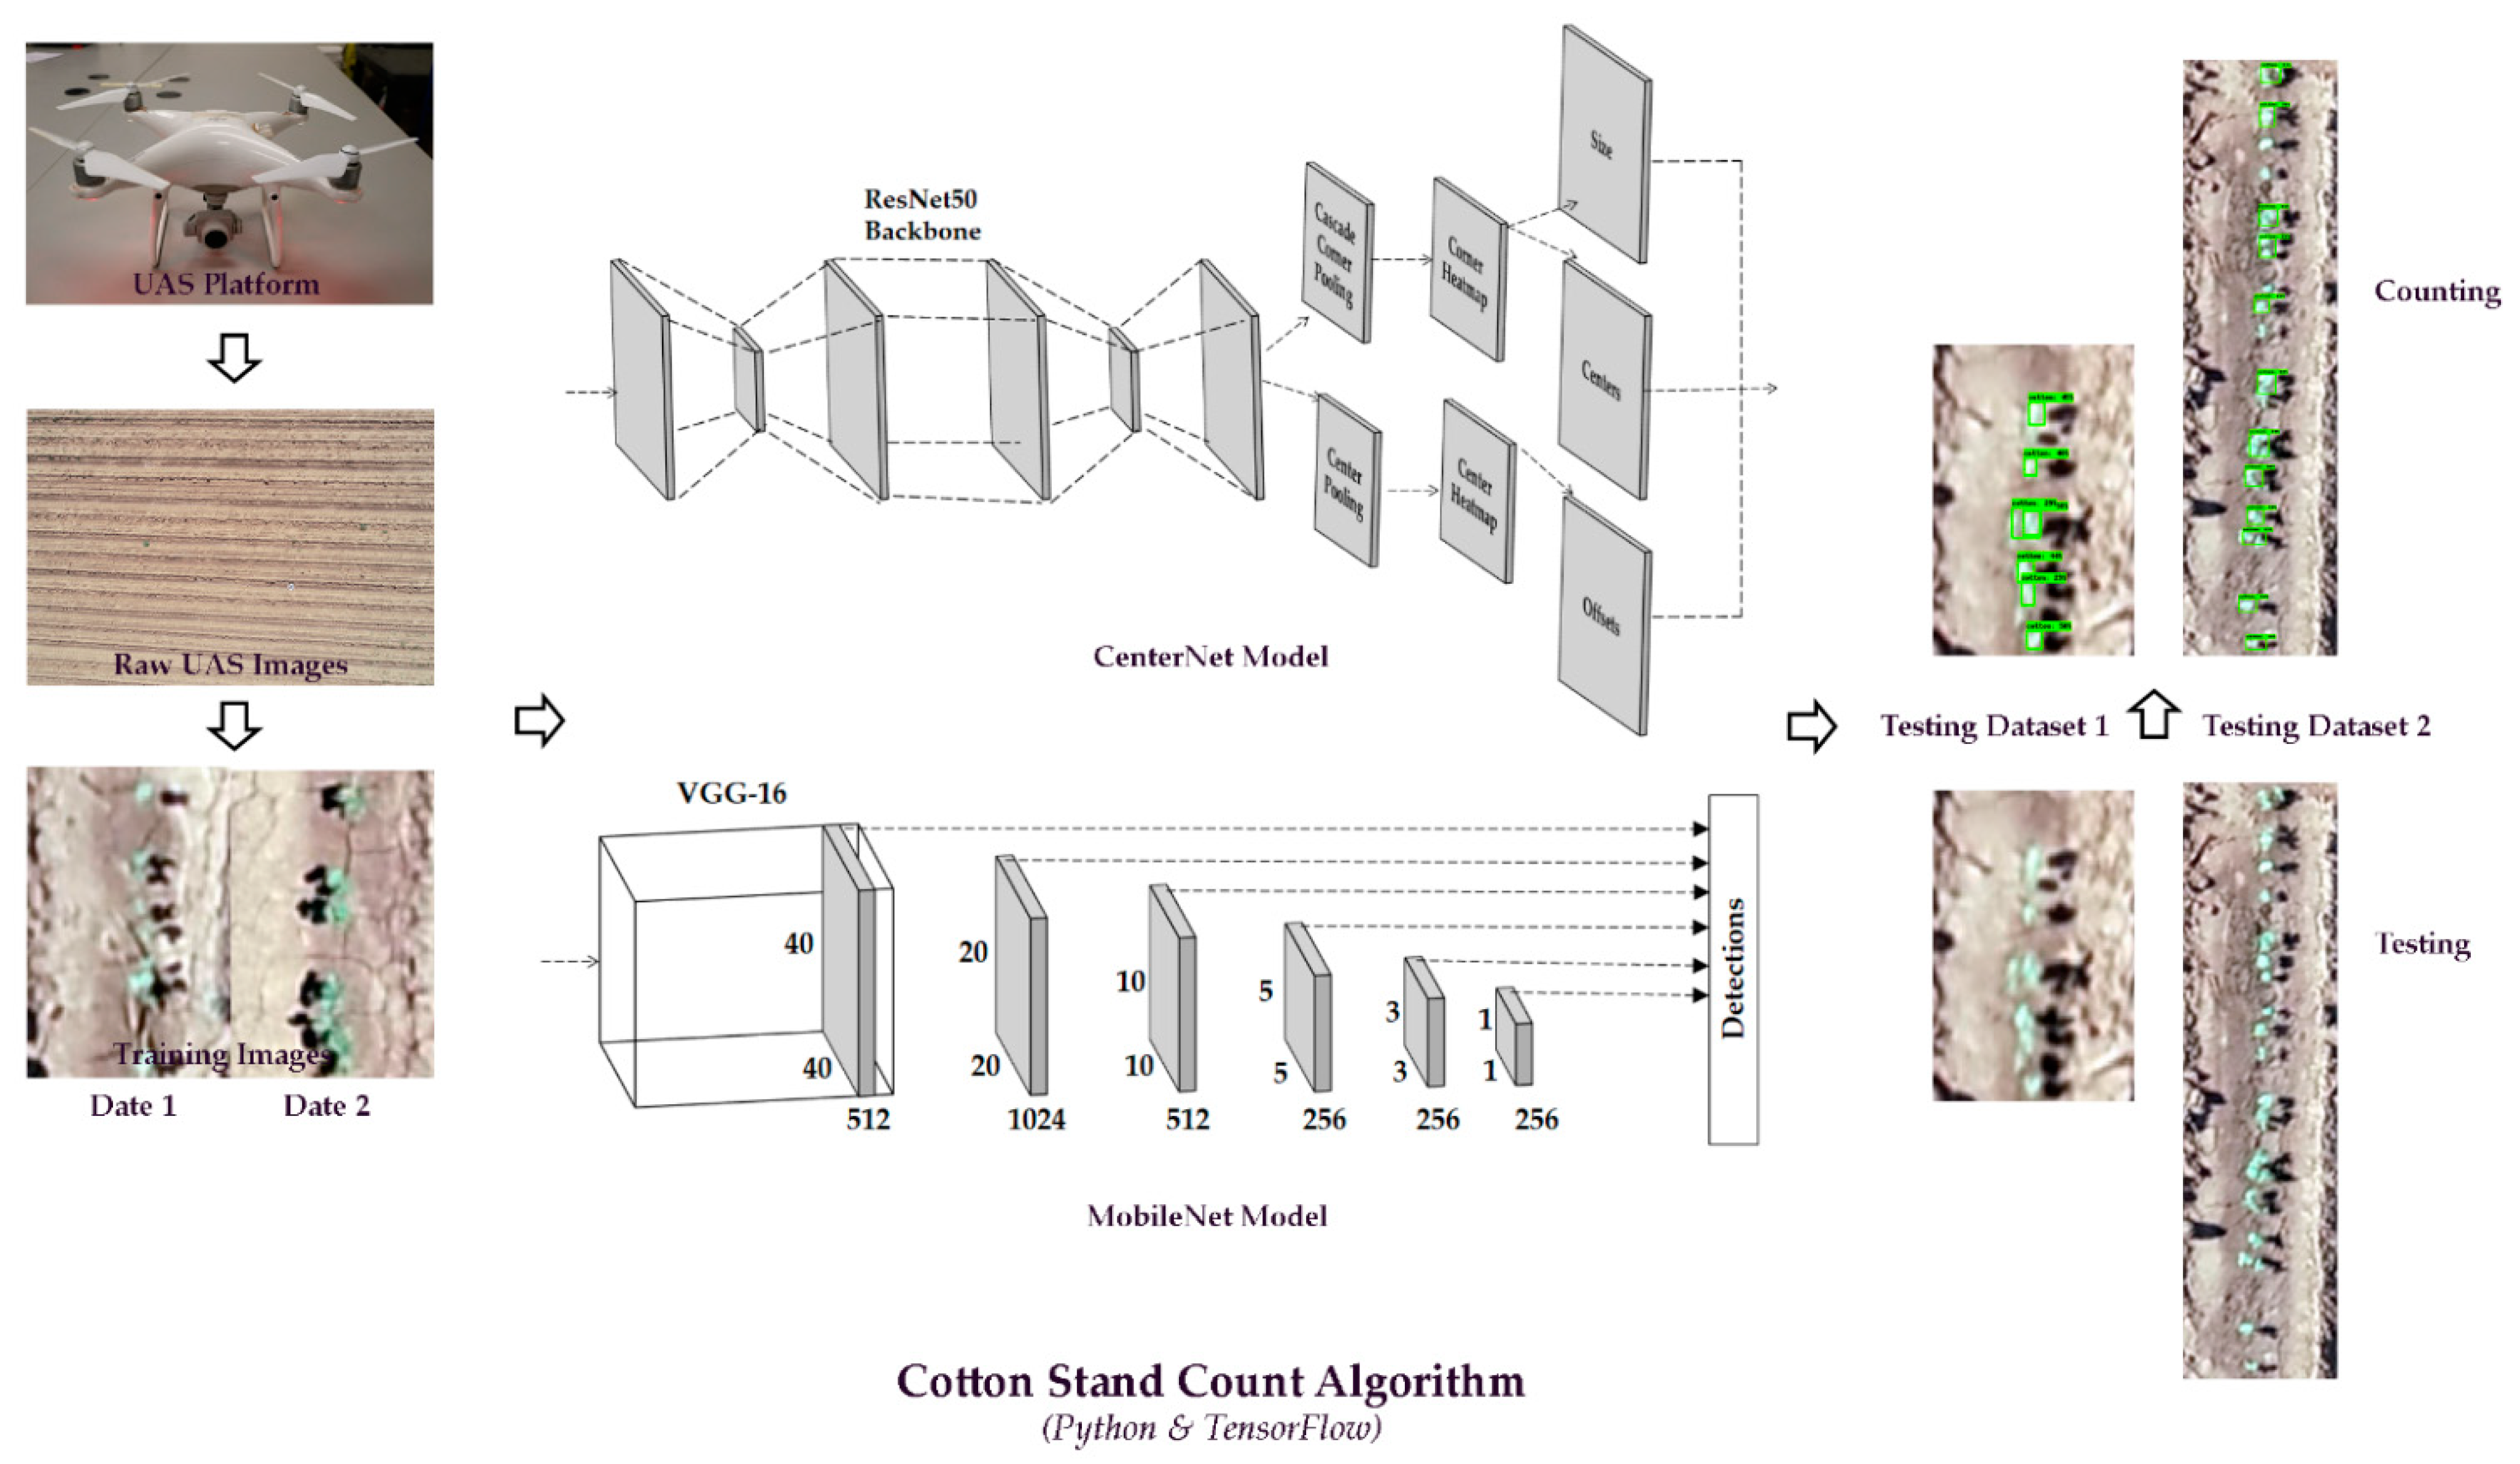
The training images were prepared using randomly cropped raw UAS images (Figure 2). The dimension of the training images was 300 by 400 pixels. For each training image, the LabelImg tool [40], a free and open-source image labeling tool, was applied to label individual cotton plants with two to four leaves with rectangular bounding boxes. Each output training image had a corresponding xml file, containing the image filename, path, coordinates of the bounding box of the top left and bottom right corners for each labeled cotton plant, and the height and width of the image. Both training images and their corresponding xml files were used in the model training process. Two training datasets were prepared. The first training dataset including 400 images randomly selected from the dataset acquired on 8 June and 14 June. The second training dataset including 900 images. Lin and Guo [24] found that the CNN model’s performance was not stable with less than 500 training images, but its accuracy was high and similar with 900 and 1000 training images. Oh et al. [25] used 200, 400, 600, and 800 manually labeled training images for cotton stand count with YOLOv3 deep learning models. Therefore, we chose 400 and 900 training images to test the optimal requirement of training images for deep learning cotton stand count. The number of cotton plants in the training images were manually counted.
To test the effect of testing image dimension on cotton stand counting accuracy, we created two testing datasets, each containing 100 randomly selected images. The first dataset, referred to as TD1, contained testing images with the same dimension as the training images (300 × 400 pixels). The second dataset, referred to as TD2, contained testing images with a dimension of 250 by 1200 pixels. Each testing image covered one row of cotton plants, 1.2 m for TD1 and 3.6 m for TD2, in the field. Cotton plants in each testing image were manually counted, and the number of cotton plants in TD1 and TD2 varied from one to eight and eight to 23, respectively.
2.4. MobileNet
The MobileNet is based on a streamlined architecture that uses depth-wise separable convolutions followed by a pointwise convolution to build lightweight deep neural networks. The SSD-MobileNet V2 model was applied in this study. The single-shot detector (SSD) architecture aims to predict bounding box locations and classify these boxes in a single network. The SSD uses a modified VGG-16 [41] model pre-trained on the ImageNet [42] as its backbone, with additional convolutional feature layers with progressively decreasing sizes. VGG-16 is a commonly used base feature extractor with 16 layers weights. ImageNet is a large visual database for visual object recognition software research. The MobileNetV2 uses only a single convolution network applied to all the channels of the input image and slides the weighted sum to the next pixel. It involves two new features, including linear bottlenecks between layers and short connections between bottlenecks, compared with MobileNetV1 [43]. The MobileNetV2 has two types of blocks, one with a stride of two for downsizing, and the other residual block with a stride of one.
The input image resolution was 320 × 320. The hyperparameters used for training the MobileNet model were random normal initializer, momentum optimizer value = 0.9, cosine decay learning rate base = 0.1, training batch size = 16 and total training steps = 30,000.
2.5. CenterNet
Another pre-trained model is the CenterNet Resnet50 from the Tensorflow Object Detection API. The CenterNet is a state-of-the-art object model based on deep convolution neural networks to detect each object as a triplet, rather than a pair, of keypoints [29]. It focuses on the center region information of each target rather than the overlap with the object, making this approach cost-efficient. Compared with the SSD MobileNet model, CenterNet models an object as a single point at the center point of its bounding box. It uses keypoints to find center points and regresses to all other object properties. The backbone of this model is the ResNet50, a 50-layer Residual Network. Center pooling, which helps to better detect center keypoints in both horizontal and vertical directions and aims to capture richer and more recognizable visual patterns [29]. Cascade corner pooling focuses on determining the corners of the bounding box by finding the maximum values on the boundary. Both cascade corner pooling and center pooling can be computed by combining corner pooling at different directions based on various situations [44].
The input image resolution was 320 × 320. The hyperparameters used for training the MobileNet model were random normal initializer, adam optimizer, cosine decay learning rate base = 0.001, training batch size = 8 and total training steps = 30,000.
2.6. Counting and Evaluations
The testing images were run through the models to detect and determine the number of cotton plants. A bounding box was applied around each detected cotton plant. Therefore, the number of bounding boxes represented the number of detected cotton plants in each testing image.
A set of metrics, including the precision, recall, and F1-score, were applied to assess the performance of cotton plant detection and counting. Precision and recall are the most commonly used indicators to evaluate object detection methods. Precision indicates how precise and accurate the trained model is out of the predicted positives and recall states how many of the true positives the trained model captured [45]. The F1-score aims to balance the two indicators [8]. Intersection over Union (IoU) measures how much of the predicted cotton plants overlap with the ground truth manually labeled cotton plants. The average recall (AR) is the recall averaged over all IoU ∈ [0.5, 1.0]. The interpolated average precision (AP) summarizes the shape of the precision/recall curve and is defined as the mean precision at a set of eleven equally spaced recall levels [0, 0.1, ..., 1] [46]. The precision, recall, and F1-score are computed as follows:
where true positive (TP) denotes the number of pixels predicted as cotton plants when these pixels are actually cotton plants; false positive (FP) denotes the number of pixels predicted as cotton plants when these pixels are actually soil or other features; false negative (FN) denotes the number of pixels predicted as other features when these pixels are cotton plants; is the interpolated precision at the maximum precision and is the measured precision at recall .
The mean absolute error (MAE), mean absolute percentage error (MAPE), coefficient of determination (R2), and the root mean squared error (RMSE) were used as evaluation metrics to assess the performance of the models in cotton plant counting.
where mi, , and ci represent the manually counted cotton plants for the ith image, the mean manual counts, and the predicted count for the ith image, respectively. n is the number of testing images.
3. Results
3.1. Model Validation
Table 1 shows the mAP and AR with IoU greater than 50% for the two models. The mAP, AR, and mean F1-score were 71, 48 and 75% for the CenterNet model, and 67, 39 and 63% for the MobileNet model with 400 training images. These results are similar to a study that reported an mAP of 86% using YOLOv3 with 200 labeled training images in predicting cotton stand count using UAS images [25]. The values of mAP, AR and mean F1-score increased by 8% and 19%, 25% and 33%, 12% and 18%, respectively, for the CenterNet and MobileNet models with 900 training images. These results demonstrate that a greater number of training images results in a more accurate model. The CenterNet model had higher mAP, AR and F1 score values than the MobileNet model for both training datasets, except for the mAP value with 900 training images. Therefore, the CenterNet model had a relatively better performance in training than the MobileNet model. With training images increasing from 400 to 900 images, the improvement of mAP, AR and F1-score values was less obvious for the CenterNet model than the MobileNet model. The less improvement of mAP, AR and F1-score for CenterNet model shows that the model had already had a relatively stable and accurate performance with 400 training images. This indicated that the MobileNet model requires a higher number of training images to achieve acceptable mAP, AR and F1-score compared with the CenterNet model.
The average per-step training time was 1.03 s for the MobileNet model, and 0.84 s for the CenterNet model with 400 training images. For the dataset with 900 training images, the mean per-step training time was 1.07 s for the MobileNet model, and 7.62 s for the CenterNet model. The trained model size was ~30 MB for the MobileNet model and ~220 MB for the CenterNet model. Therefore, the MobileNet model was more efficient on training time and disk space requirements.
3.2. Model Evaluation in Stand Counting
Table 2 shows the evaluation metrics for the performance of the MobileNet and CenterNet models in detecting and counting cotton plants. For TD1, the R2 value of the cotton plant count was 0.98 for the CenterNet model and 0.96 for the MobileNet model with 900 training images. The values of RMSE were 0.58 and 0.37 for the CenterNet model and were 0.89 and 0.64 for MobileNet models with 400 and 900 training images, respectively. For TD2, the value of R2 increased from 0.60 to 0.86 for the CenterNet model, and 0.48 to 0.87 for the MobileNet model, with the number of images increasing from 400 to 900. The RMSE values dropped from 6.08 to 3.94 for CenterNet Model and 7.81 to 3.66 for the MobileNet model with the number of training images increasing from 400 to 900.
The overall performance of cotton plant counting for the CenterNet model was better than the MobileNet model. The values of MAE and MAPE for the CenterNet model were lower than those for the MobileNet model in all the testing datasets, except for the case with TD2 and 400 training images (MAE = 8.03). For TD1, that both MobileNet and CenterNet models performed adequately with 400 and 900 training images. The MAE values were 0.25 and 0.27, and the MAPE values were 0.10% and 0.07% for the CenterNet model with 400 and 900 training images, respectively. For the MobileNet model, the MAE values were 0.54 and 0.33, and the MAPE values were 0.26% and 0.11% with 400 and 900 training images, respectively. For TD2, both models performed adequately, although the accuracies were substantially lower than those for the corresponding models for TD1. The MAE value decreased from 9.03 to 5.39 for the CenterNet model, and from 7.48 to 6.22 for the MobileNet model, with the number of training images increasing from 400 and 900. The MAPE value dropped from 6.57% to 4.73% for the CenterNet model, and from 7.83% to 5.61% for the MobileNet model, with the number of training images increasing from 400 to 900. These results were similar to previous studies that reported MAPE ranging from 9.8% to 4.3% [8,9,12,26,33,47]. Therefore, The MAPE results indicate that these two models had better performance in accuracy on cotton plant detection and counting for testing images with the same dimension as the training images. For TD2, the MAPE results suggest that both models had similar accuracy compared with previous similar studies.
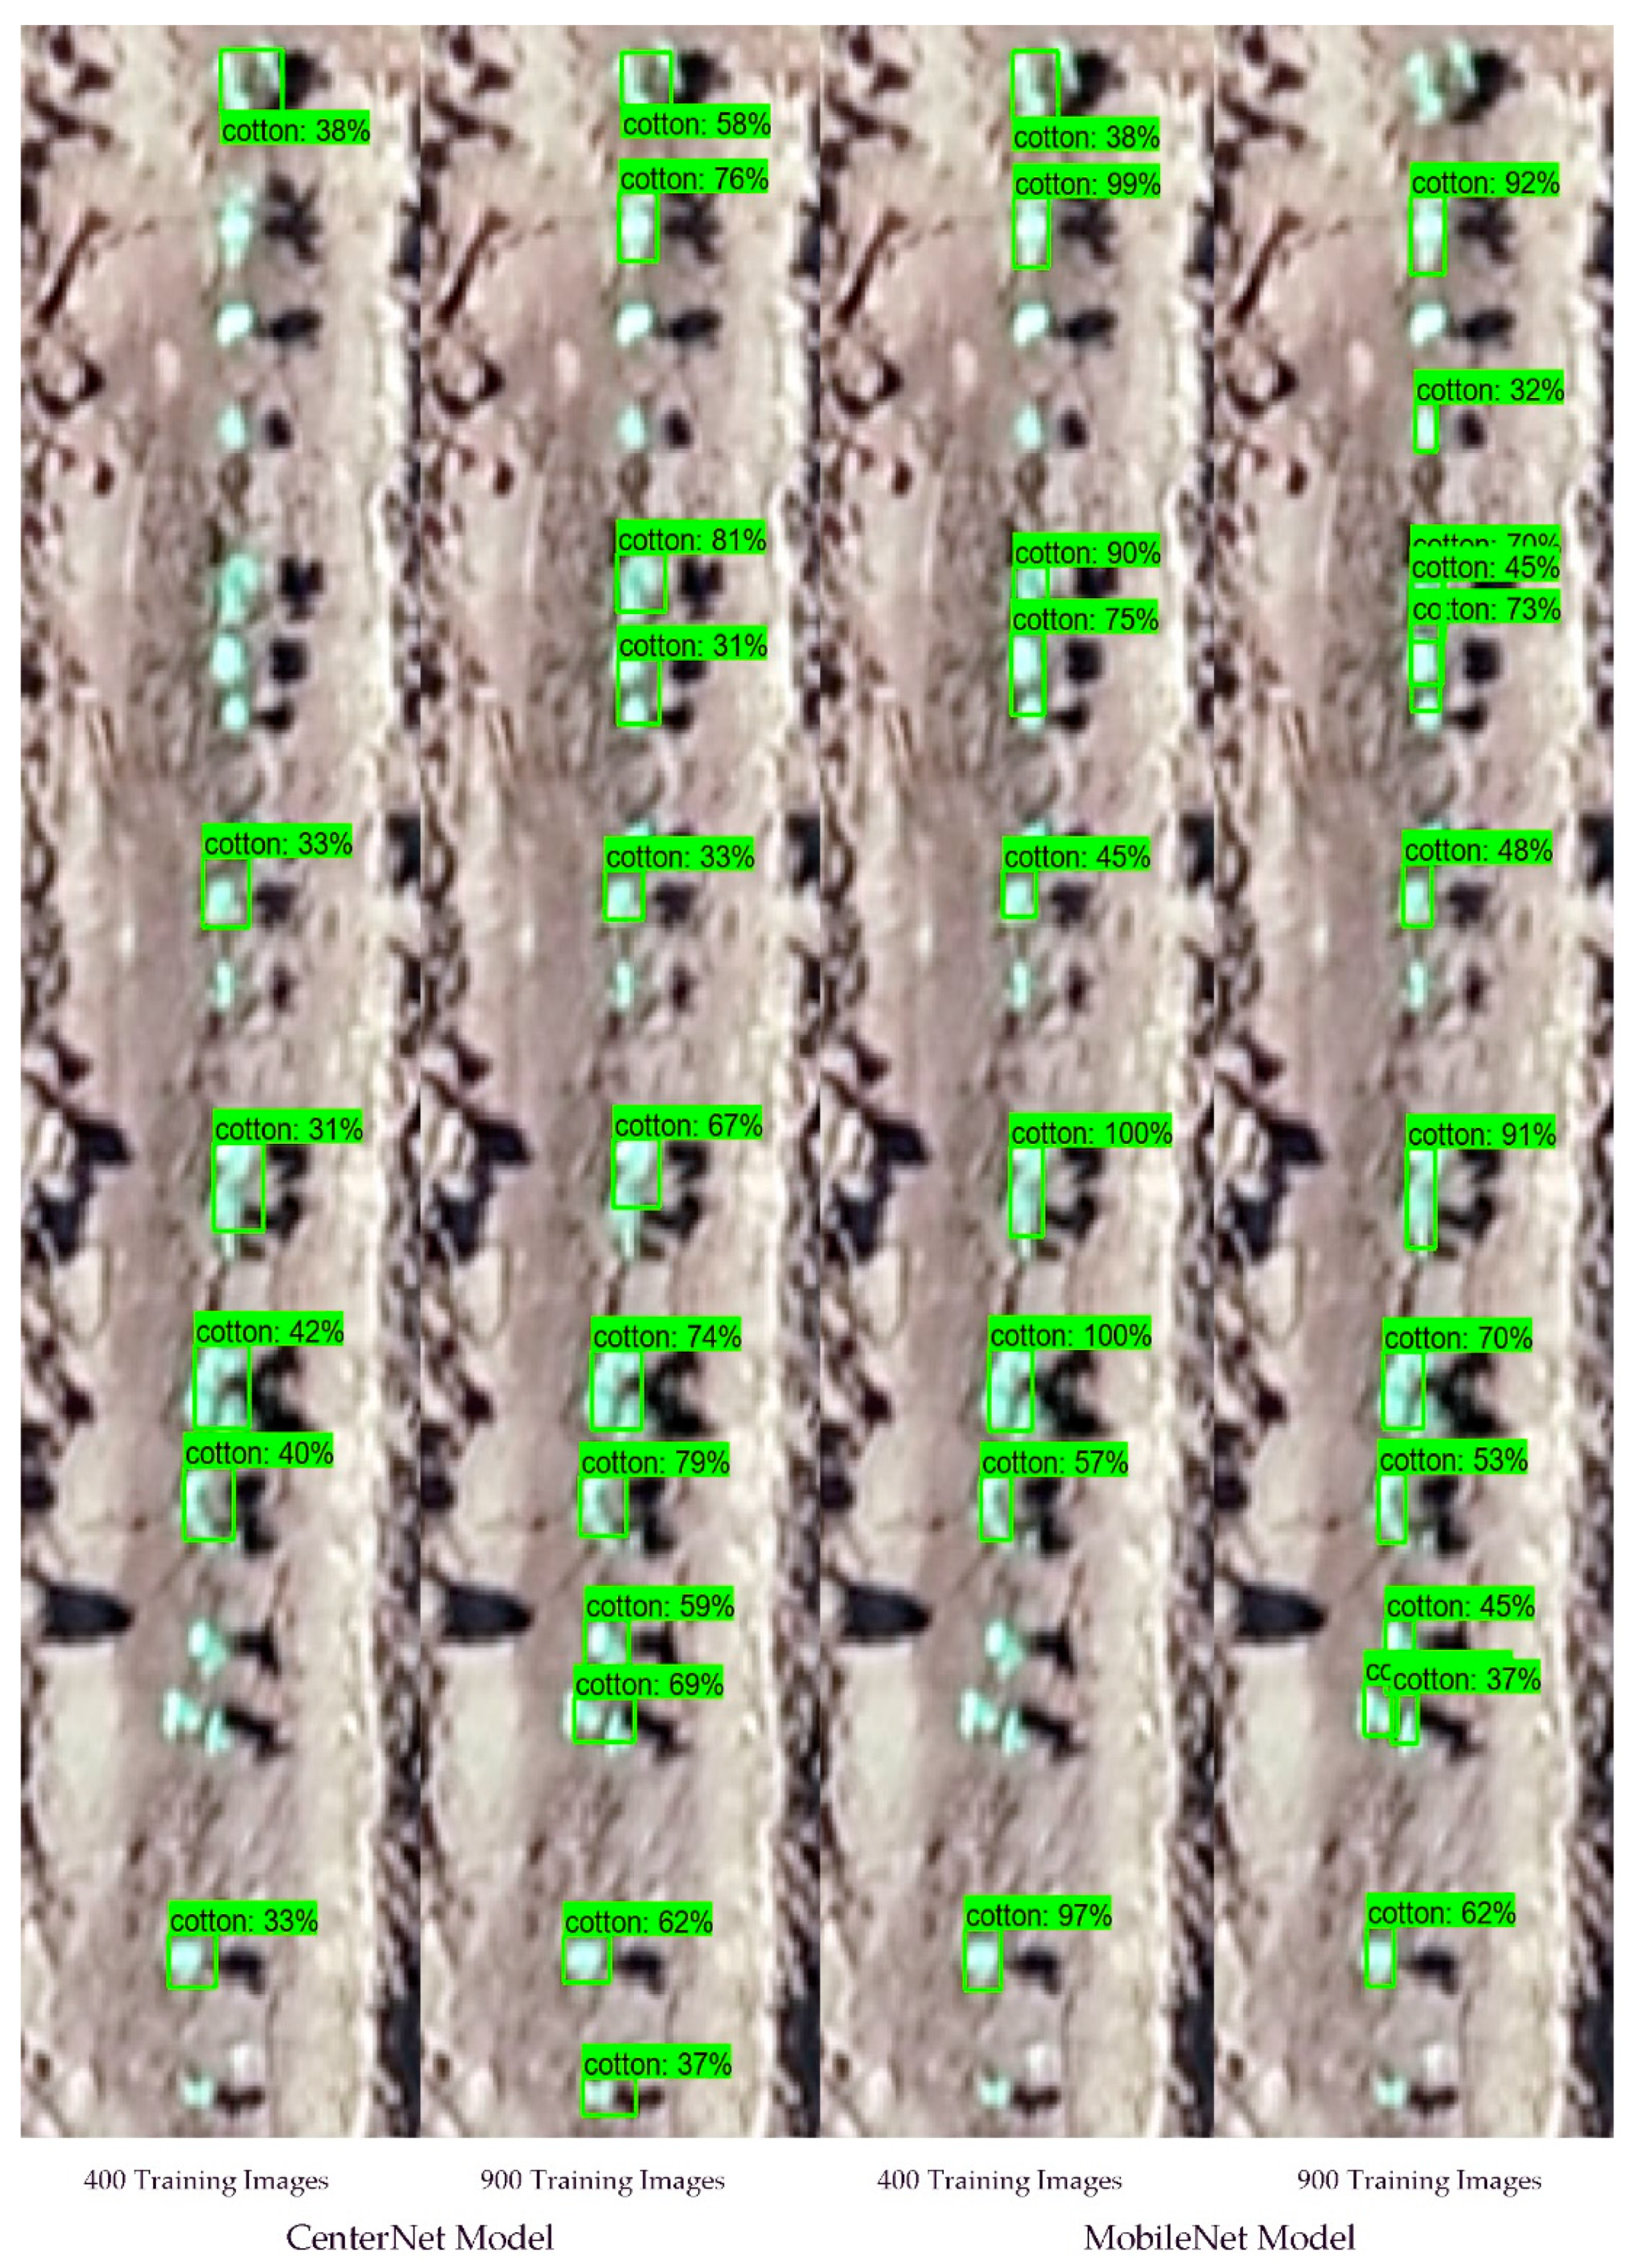
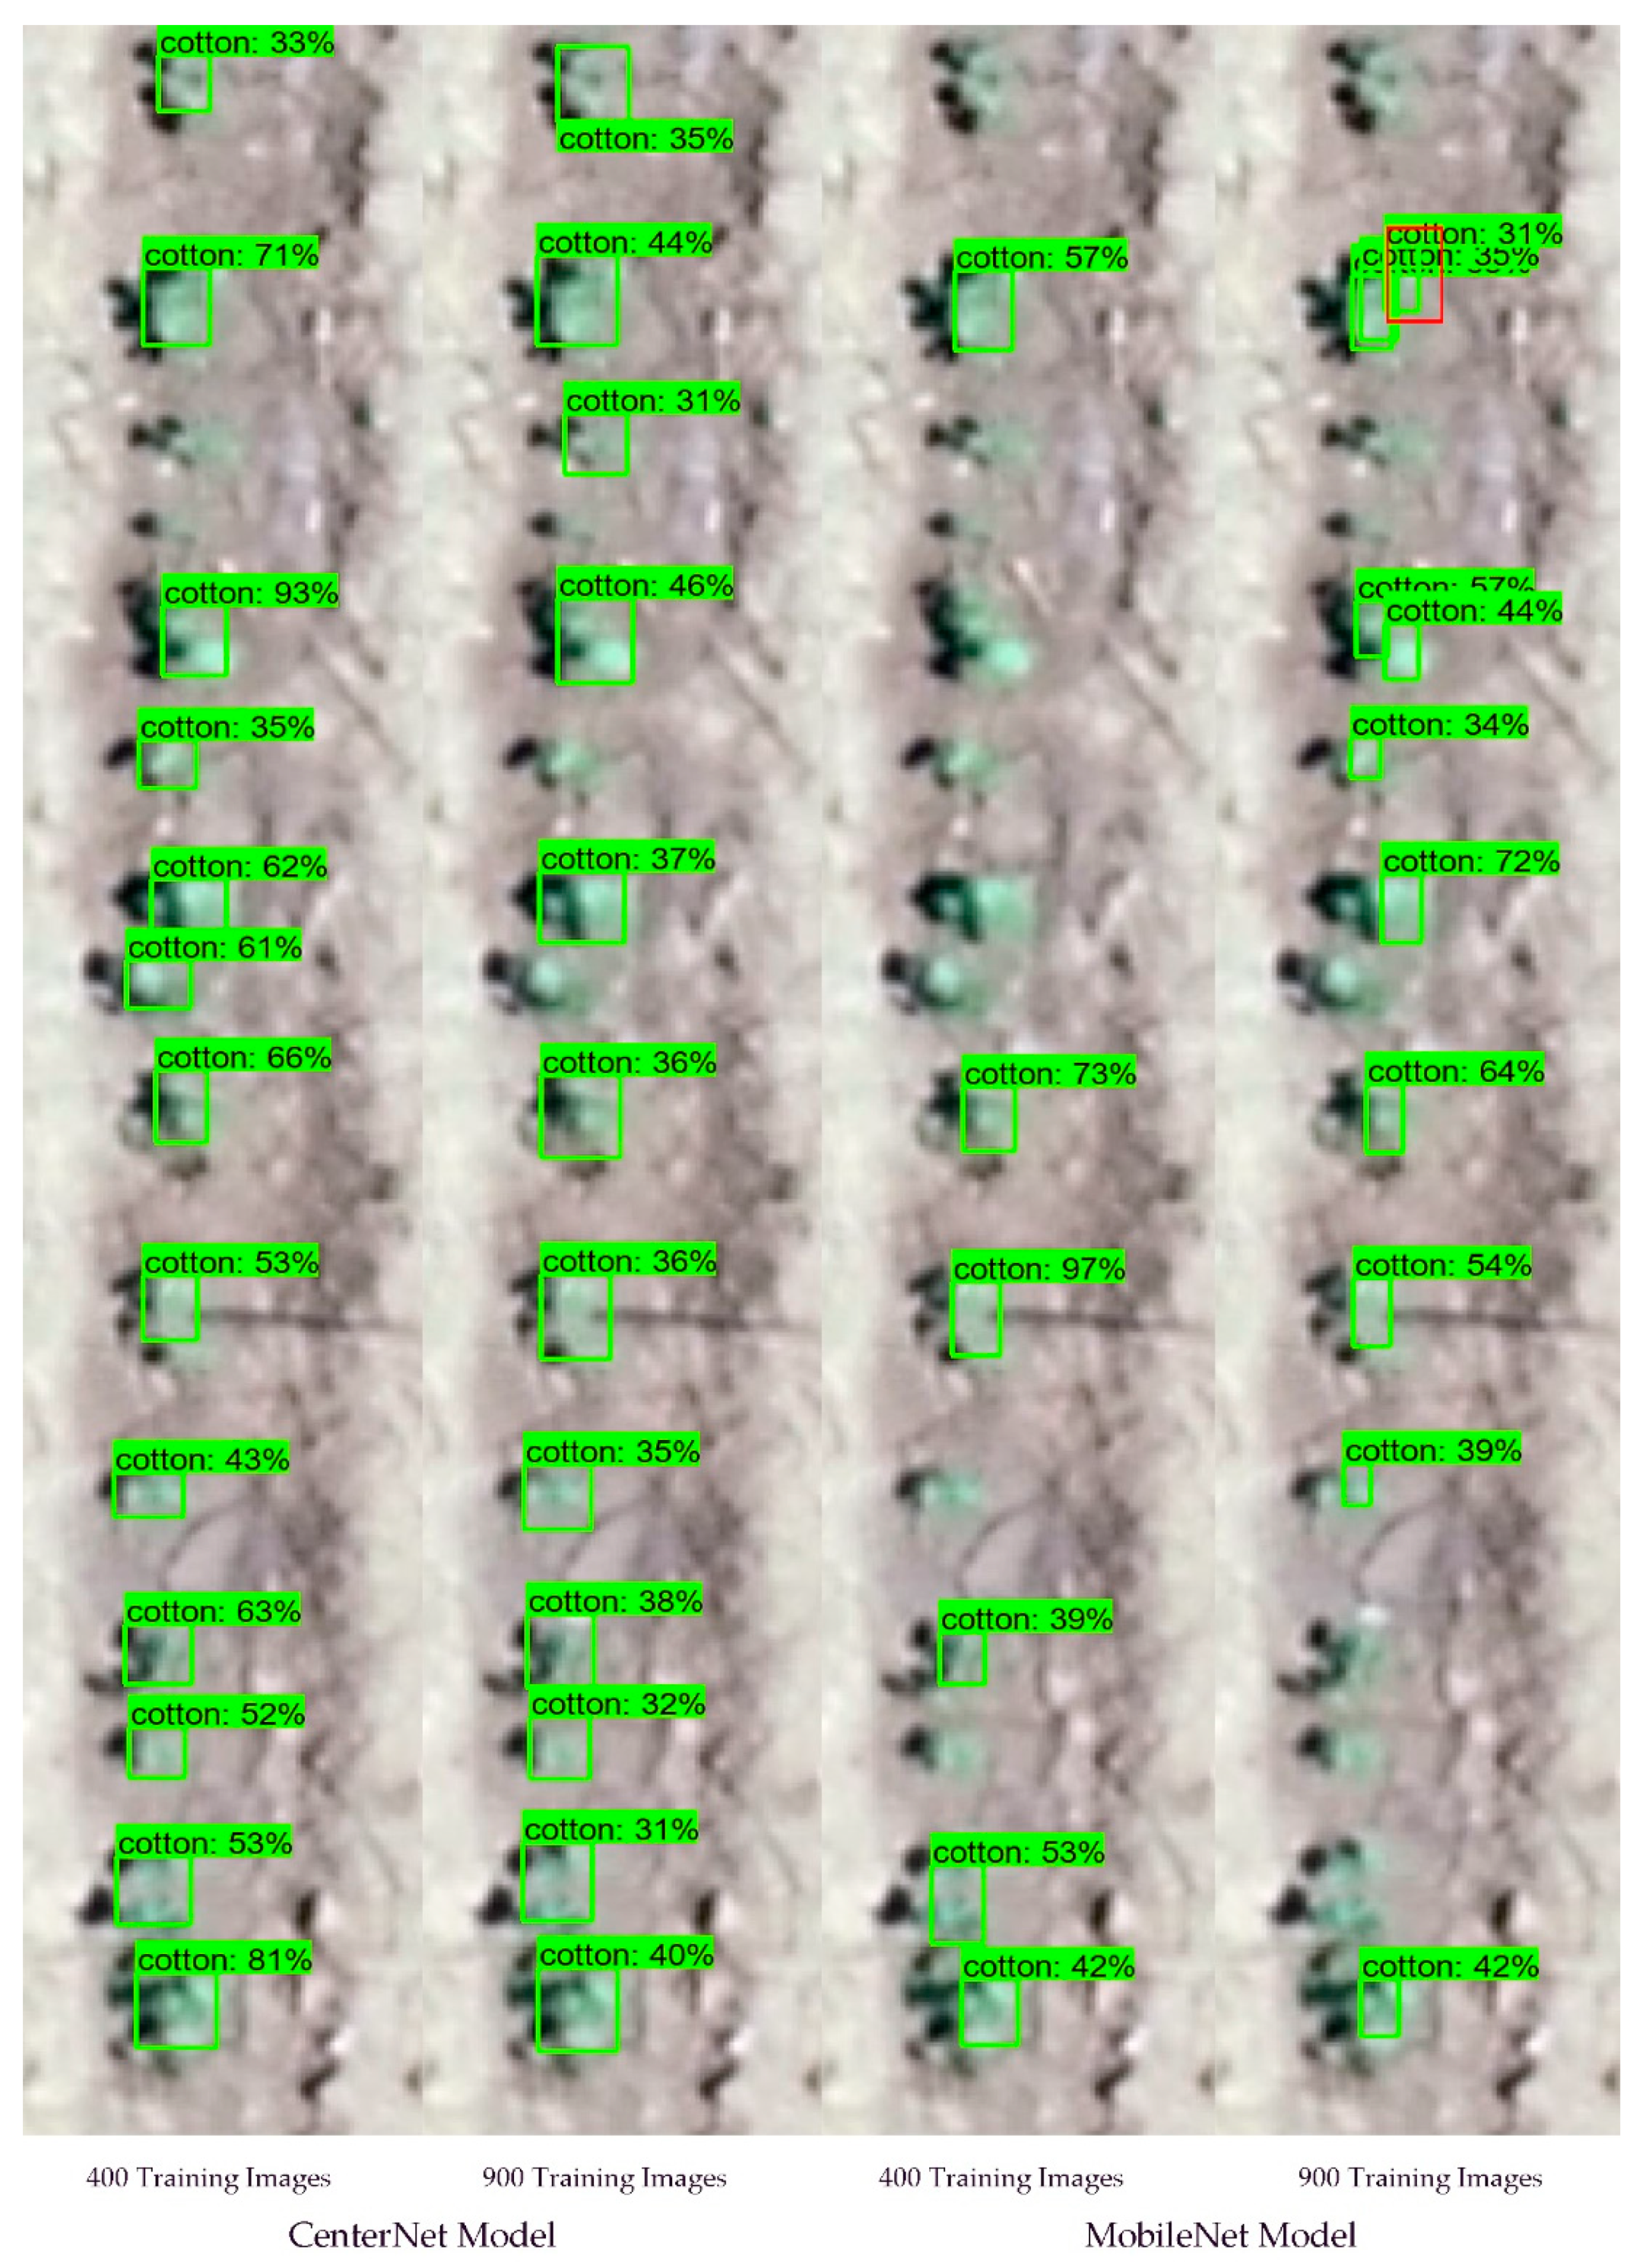
Figure 3 shows an example of cotton plant detection and counting based on an image acquired on 8 June using these two models for TD2 with a testing image with a larger dimension. Both CenterNet and MobileNet models underestimated the number of cotton plants in the scene with 400 training images. The CenterNet model provided more accurate plant detection results for small cotton plants. With 900 training images, the CenterNet model detected 11 cotton plants as compared to eight detected by the MobileNet model. The MobileNet model also had two false-positive counts, predicting two cotton plants that did not exist in the scene. Figure 4 shows an example of cotton plant detection and counting using the image data acquired on 14 June. Both CenterNet and MobileNet models underestimated cotton plants in TD2 as well. But the underestimation of cotton plants for the CenterNet model was less significant compared with the MobileNet model. With 400 training images, the CenterNet model detected 13 cotton plants as compared to eight detected by the MobileNet model. With 900 training images, the CenterNet model also detected 13 cotton plants, but the MobileNet model only detected 11 cotton plants. The red box shown in Figure 4 demonstrates a false-positive detection and overestimated errors. The bright soil near the cotton plants was detected as a single cotton plant.
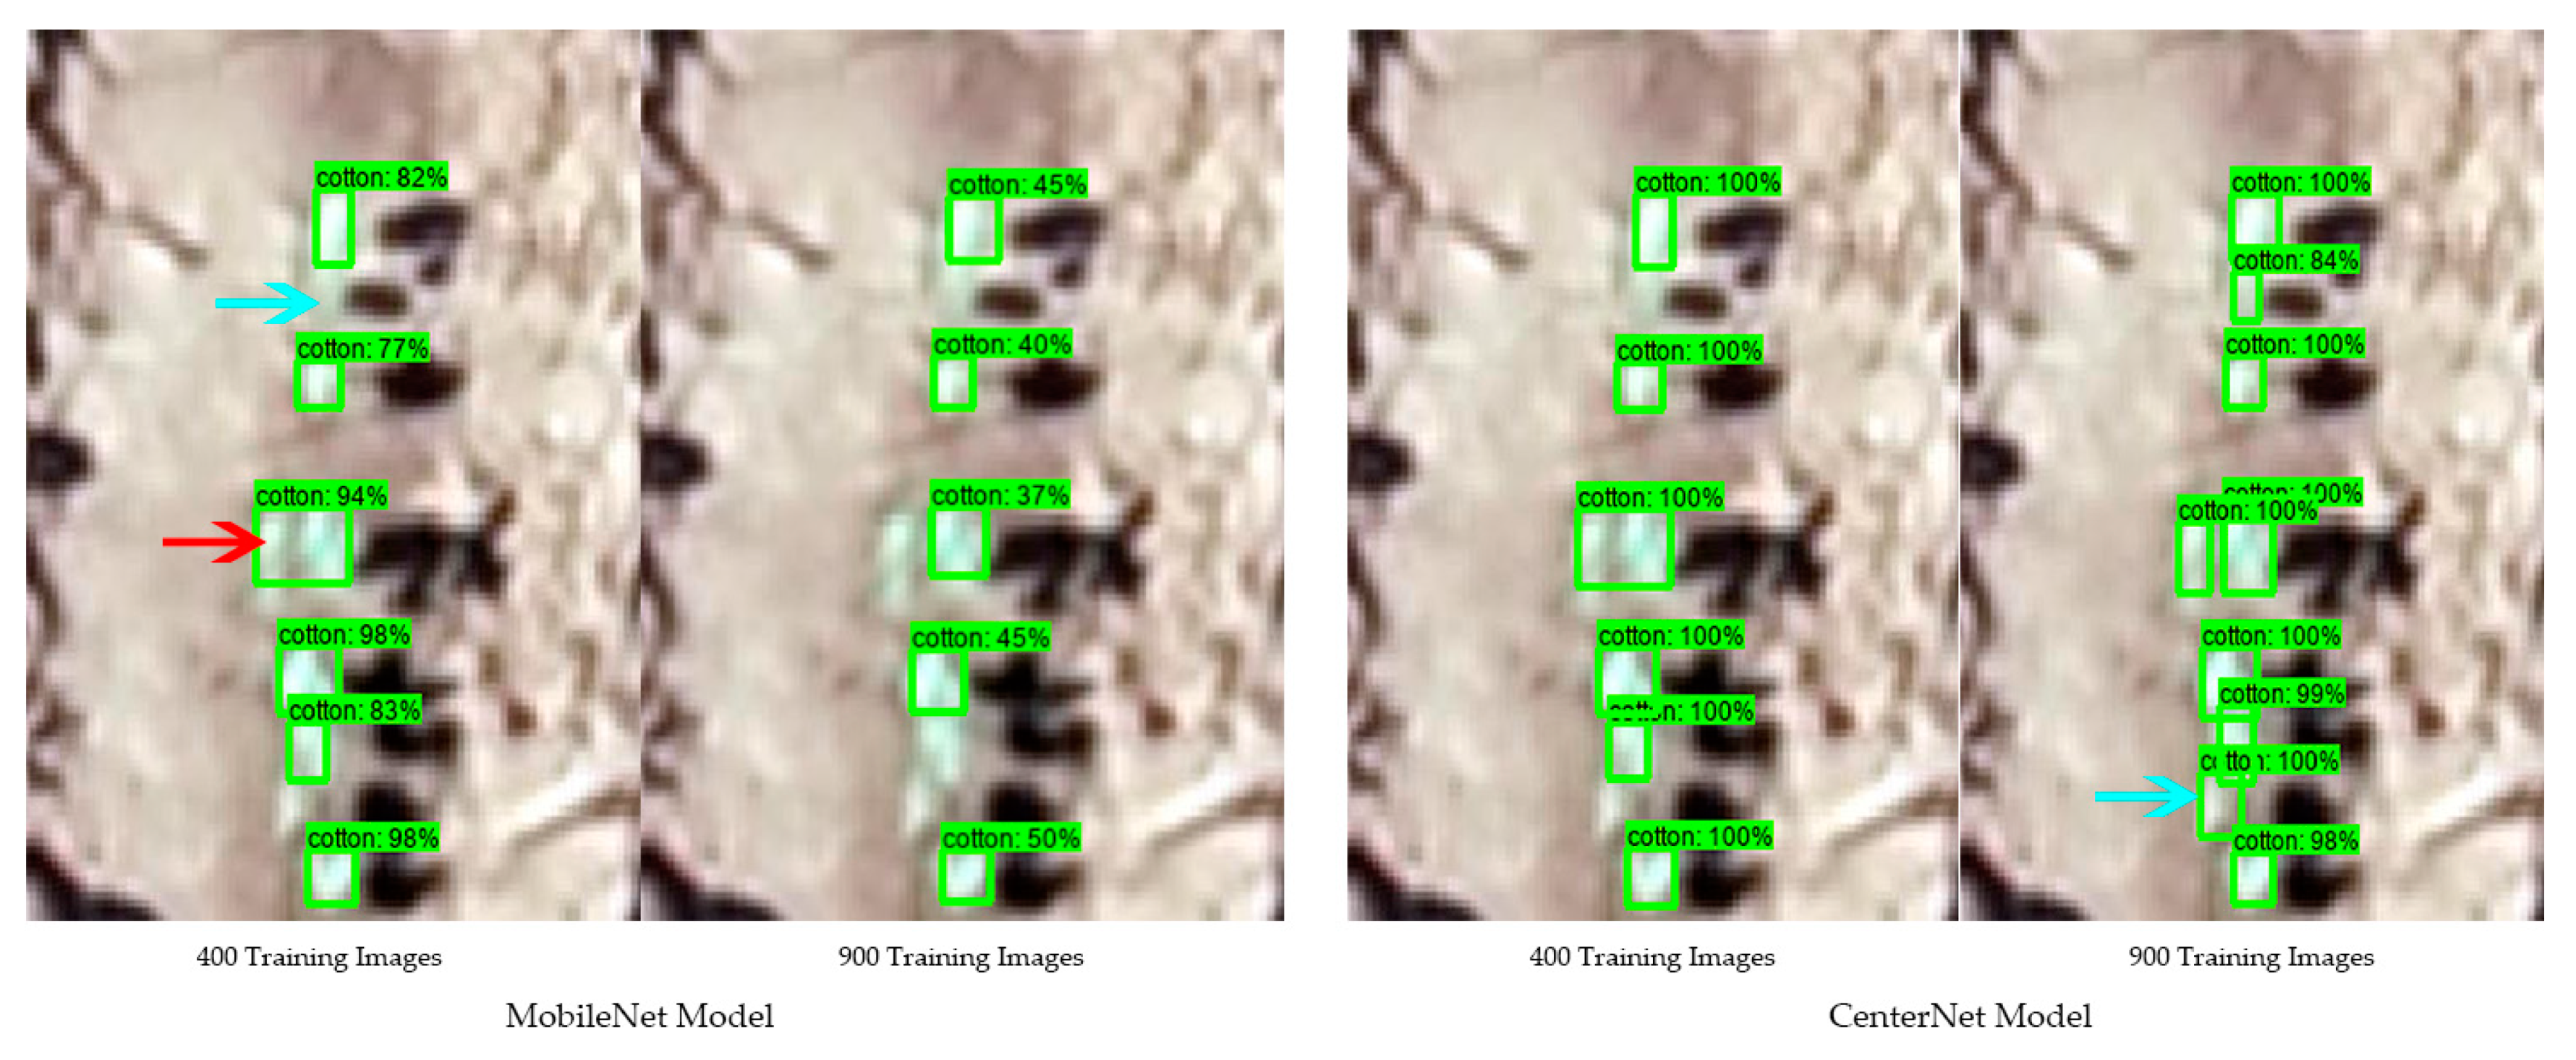
Figure 5 shows an example of using the two models with images on 8 June 2020, to detect cotton plants, the dimensions of the testing images being the same as the training images. The CenterNet model accurately detected eight cotton plants with 900 training images and six cotton plants with 400 training images. The MobileNet model underestimated cotton plants by three and two with 400 and 900 training images, respectively. Both models had higher accuracy for the testing images acquired on 14 June compared to those on 8 June (data not shown), because the cotton plants were relatively larger and easier to detect. However, the CenterNet model had a better performance with smaller cotton plants. As shown in Figure 5, the blue arrows show that the CenterNet model could detect and separate smaller cotton plants while the MobileNet model failed to detect them. The red arrow represents that both models could not completely detect overlapping cotton plants in high-density situations with 400 training images, but both models successfully separated and detected the overlapping pieces of cotton with 900 training images.
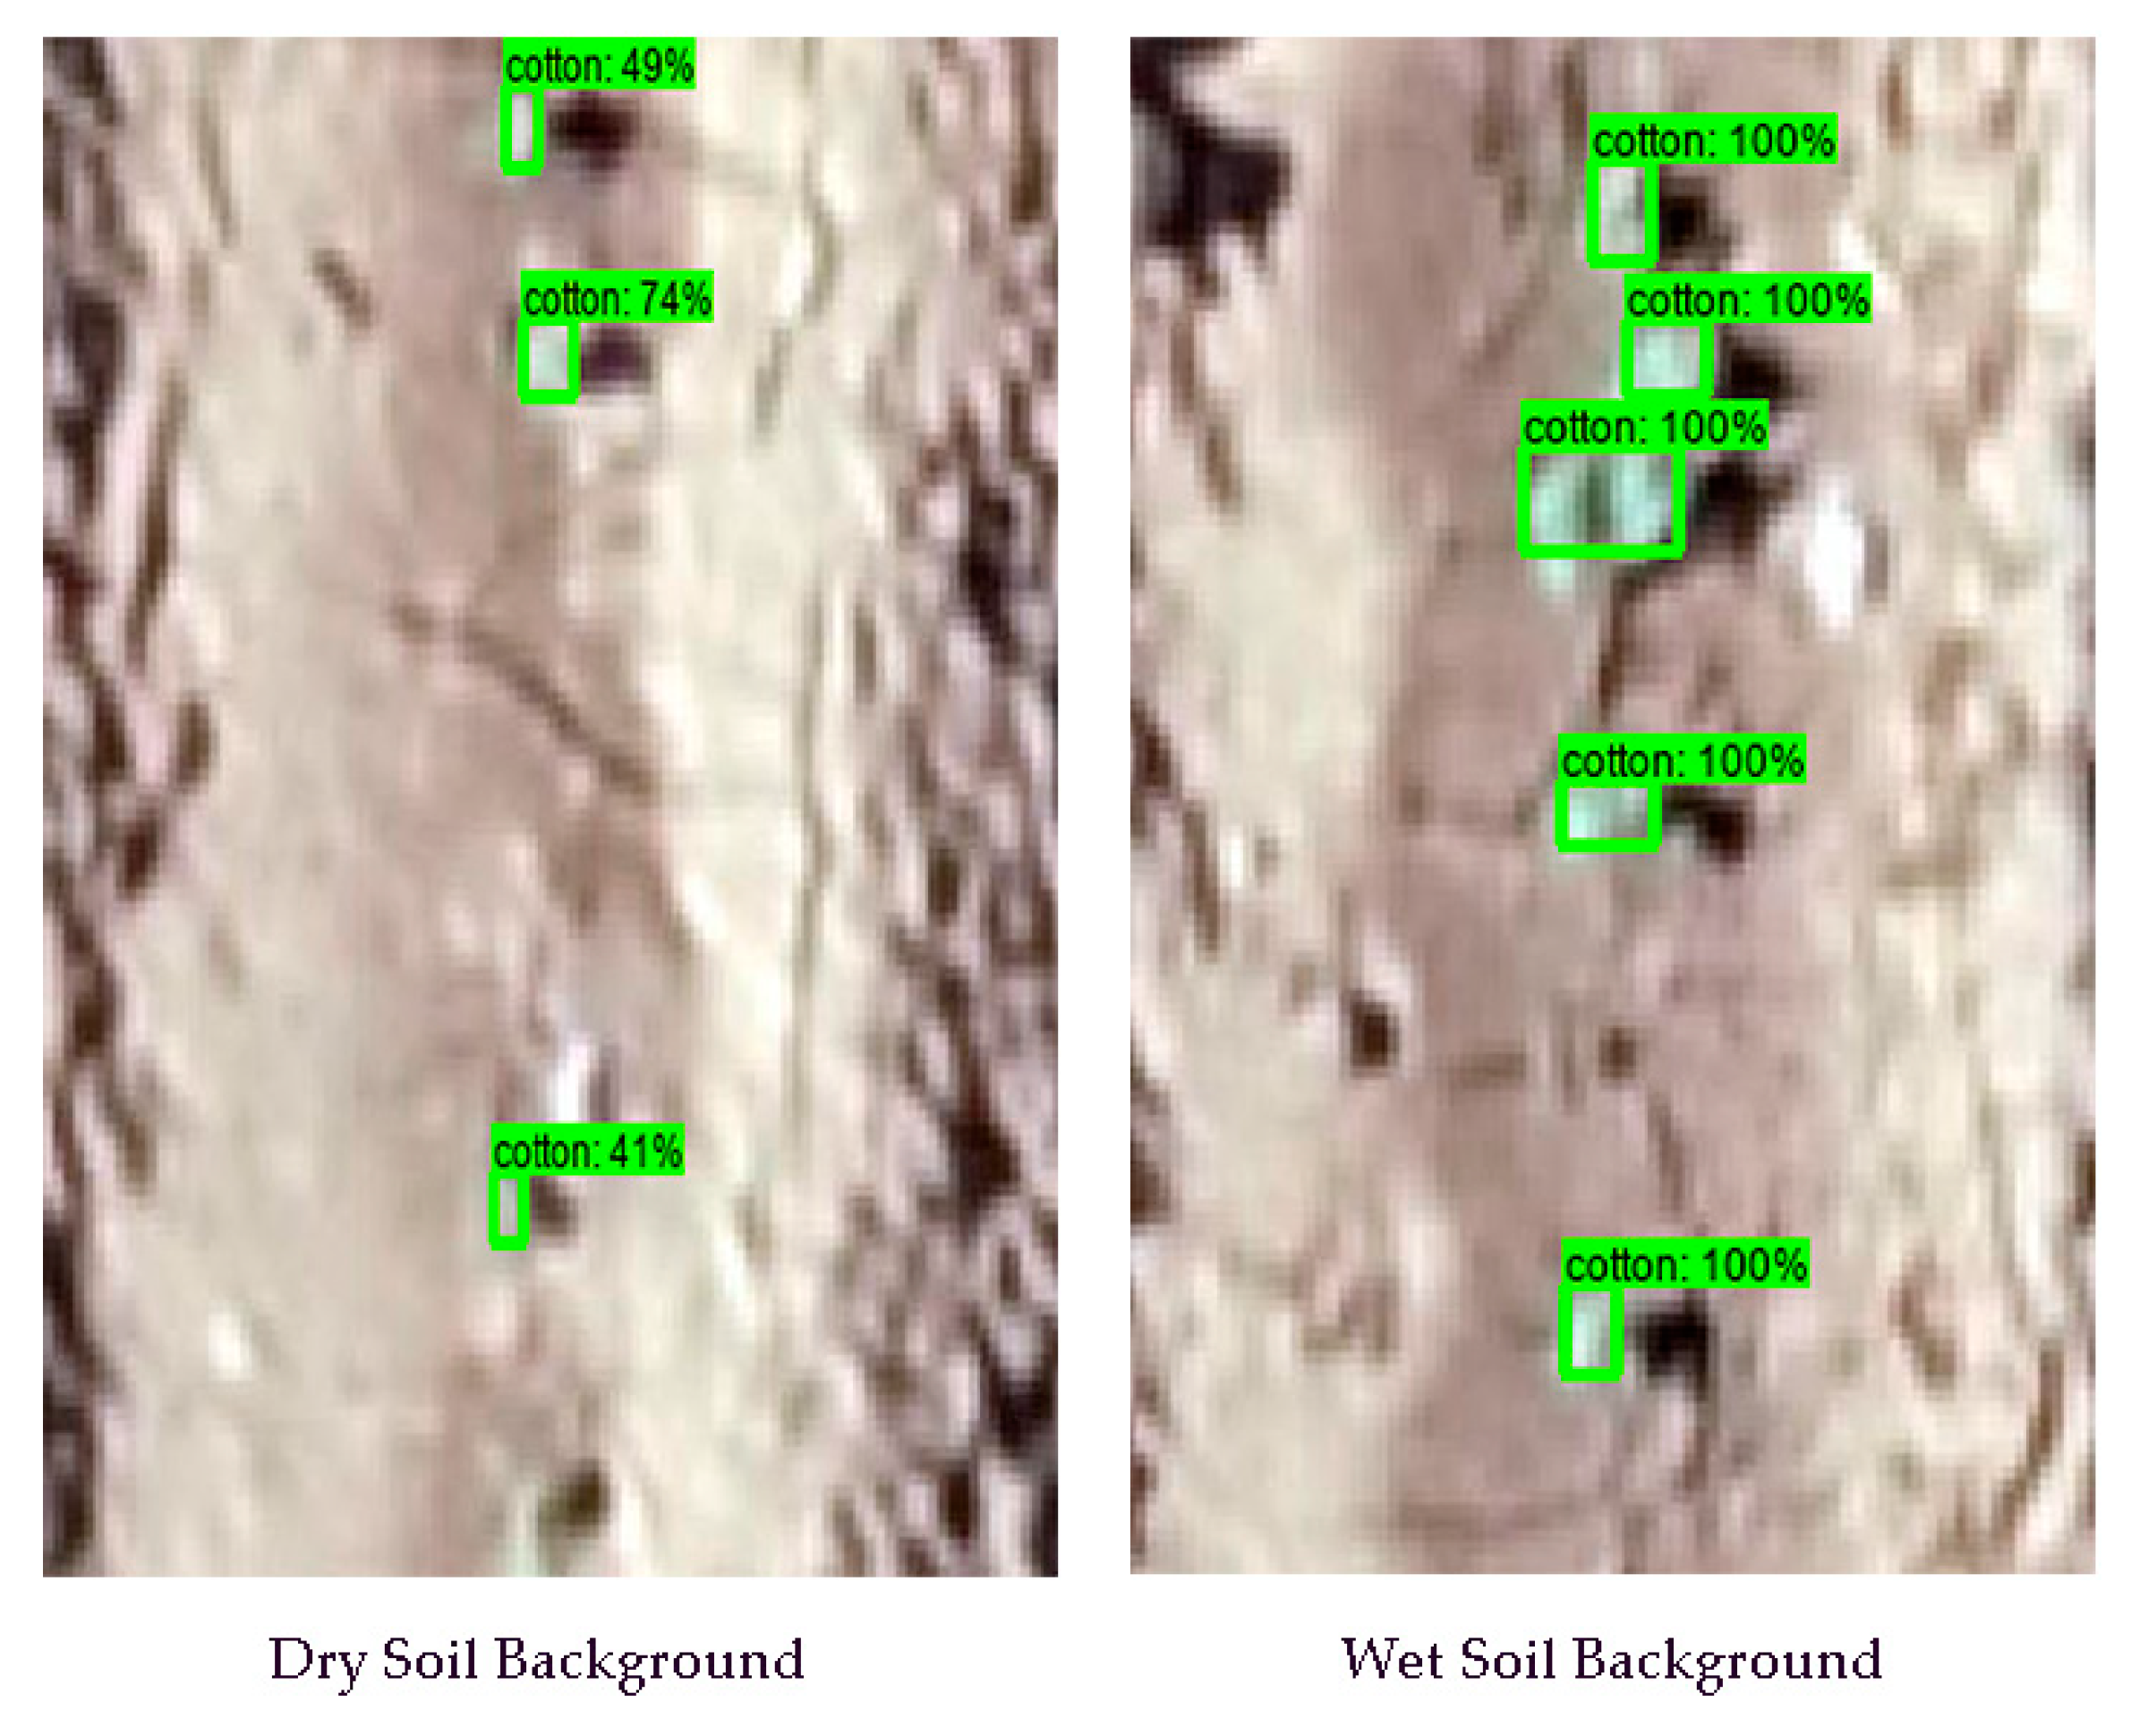
The results also demonstrated that the accuracy for cotton plant detection and counting was higher when the soil was relatively dark. Figure 6 showed an example of testing images acquired on 8 June 2020, trained with 900 same dimension training images. The algorithm successfully detected and counted cotton plants with darker and wetter soil background. The mean F1-score for this scene was 100%. For cotton plants with a dry and brighter soil background, the algorithm underestimated two cotton plants. The mean F1-score value was 54.5% for this scene. Previous studies had similar findings; images with darker soil color and less soil crusting had higher accuracy on cotton plant detection and counting [25,26]. The dataset in this study was limited to facilitate a systematic evaluation to determine the effects of soil background on cotton plant detection. Further studies on cotton stand counting need to incorporate soil moisture, soil color, soil texture and soil roughness conditions that directly affect soil reflectance.
4. Discussion
The results on training validation and testing showed that the CenterNet model had an overall superior performance. The size of the cotton plants in our study were small, with an average plant diameter of 2.4 cm and 3.5 for cotton plants on 8 June and 14 June. All object detection models have similar challenges when the target object is too small [8,21,22]. The CenterNet model is more sensitive to small objects [48,49]. The CenterNet model uses keypoints estimation to locate the center of each bounding box and other object properties such as orientation, location, and size, are regressed from image features at the center location [29,44]. This explains the superior performance of the CenterNet models on cotton stand counting in this study. On the other hand, the backbone of the MobileNet was VGG-16, which had much fewer convolutional layers causing lower detection accuracy [50,51]. However, the MobileNet model is simpler, faster and more accurate than the two-stage detector models [48,49,52]. Some real-time object detection tasks have been tested using MobileNet models with smartphone applications [53,54]. Since the model is small and has low latency, the cost of data transfer among UAS sensors, cloud databases, and deep learning inference could be minimized. In this study, the trained model size was only about 30 MB and an average of 0.2 s predicting time per image, which is promising to achieve on-site real-time cotton phenotyping with the MobileNet model using images acquired using UAS platforms or smartphones in the future.
Few studies have assessed the performance of deep learning object detection models with limited training images in agricultural studies. The mAP values in this study appeared relatively low (67–86% for the MobileNet model and 71–79% for the CenterNet model), but they are higher than the mAP values of many previous studies on object detection. For example, CoupleNet, Faster R-CNN, mask R-CNN, RetinaNet, and CornerNet algorithms reported mAP values ranging from 28% to 62% [29,43,55,56]. It should be noted that mAP and AR are applied to evaluate the object detection performance in the training process, but not a measure of object detection accuracy. Deep learning tasks require abundant training images [16,57], especially for complex object detection tasks such as cotton plant detection and counting. Lin and Guo [24] provided useful information regarding the required number of training images for sorghum panicle detection. They found a deep learning algorithm had poor performance with low and inconsistent accuracies with fewer than 500 training images, but had accurate results with 1000 training images. The results on TD1 and TD2 showed a similar trend for both CenterNet and MobileNet models, in that the overall accuracy increased with the number of training images. In addition, the dimension of testing images and consistency with training images played a role in this study. Previous studies proved that agricultural-related object detection tasks could be achieved successfully and accurately with limited training images when the dimensions of testing and training images were the same [9,25]. However, robust and practical models are needed to detect objects with different image dimensions for training and testing datasets.
Based on the small plant size, most plant phenotyping tasks required high-resolution UAS images acquired at a low altitude [25,58,59]. This study applied a 4k RGB sensor to acquire images at a relatively low altitude to detect and count cotton plants at the seedling stage. Because plant seedlings are relatively small, a fine ground sample distance (GSD) is required to detect cotton plants from UAS images. This, in turn, requires image acquisition at low altitudes, possibly below 10 m. UAS platforms typically do not fly automatically at such a low altitude. Therefore, researchers have to manually fly the UAS, which may cause many errors during image collections. To overcome this challenge, various sensors and post-processing procedures were evaluated in recent studies. For example, Feng et al. [15] applied multispectral sensors to capture additional image datasets for cotton plant detection and counting. Another study improved the overall quality of RGB images acquired at a relatively high altitude (50 m) by combining high-resolution RGB images, relatively low-resolution multispectral images, different vegetation indices and a digital surface model (DSM) [52]. It is practical and reasonable to use only the 4K RGB sensor flying at an optimal altitude to capture high-quality images for agricultural object detection tasks in commercial fields. More studies and observations are required to examine the optimal image resolutions and corresponding flight altitudes for cotton stand count in future work.
Various environmental factors, such as wind, cloud and light conditions, have effects on UAS image quality, which can influence the execution and performance of deep learning algorithms. In this study, the UAS images were acquired around local solar noon on clear days. As a result, the cotton plants and soil surface were relatively bright and had low contrast in strong sunlight. Both models performed better on cotton plant detection and counting with images having darker soil background. Similar results were found in other studies in crop monitoring and analyses [8,47]. The effects of field conditions, such as soil color, and brightness on the accuracy of cotton plant detection and counting, were similar to previous studies [25,26,60,61]. In future studies, one may consider acquiring UAS images under relatively soft light conditions, such as late afternoon or early morning, to facilitate better contrast between cotton plants and soil background for accurate plant stand counting results. In addition, the images were captured on two dates during the seedling stage in this study. The differences in cotton plant size and canopy cover might have resulted in different results for the two models. Therefore, more studies are required to examine plant size on stand counting accuracy by acquiring images on different dates in the early growing season.
5. Conclusions
Two deep learning models, the MobileNet and CenterNet, were applied to detect and count cotton plants at the seedling stage from UAS images. These models were trained with two datasets containing 400 and 900 images. The performance of these models was assessed with two testing datasets of different dimensions, 300 by 400 pixels and 250 by 1200 pixels. The CenterNet model had a better overall performance on cotton plant detection and counting, indicated by greater values of mAP and recall, R2, and lower RMSE, MAE and MAPE values. The MobileNet model was more efficient on training time and had less requirement for disk space. When the training and testing image dimensions were the same, the accuracy of cotton stand counting was acceptable (R2 = 0.86 and MAPE = 0.26% for the CenterNet model; R2 = 0.89 and MAPE = 0.10% for the MobileNet model) with 400 training images. With 900 training images, the cotton plant counting had better performance for both models (R2 = 0.96 and MAPE = 0.11% for the CenterNet model; R2 = 0.98 and MAPE = 0.07% the MobileNet model). Cotton stand counting for testing images with larger dimensions required more training images to achieve high accuracy. Therefore, this study helps to determine the right deep learning tools and an appropriate number of training images under certain conditions for object detection in agricultural applications.
Both the CenterNet and MobileNet models have the potential to accurately detect and count cotton plants at the seedling stage. However, there are challenges in detecting small cotton plants under high brightness and low contrast conditions. Therefore, further studies need to investigate cotton plant detection accuracy as influenced by environmental factors, including image resolution, soil background and illumination levels. Further studies are also needed to evaluate the optimal image resolutions and corresponding flight altitudes for accurate cotton stand counting.
Author Contributions
Conceptualization, W.G. and Z.L.; methodology, Z.L. and W.G.; software, Z.L.; validation, W.G. and Z.L.; formal analysis, Z.L.; investigation, Z.L. and W.G.; resources, W.G.; data curation, Z.L.; writing—original draft preparation, Z.L.; writing—review and editing, W.G.; visualization, Z.L.; supervision, W.G.; project administration, W.G.; funding acquisition, W.G. All authors have read and agreed to the published version of the manuscript.
Funding
This study was supported by Texas Tech University and Texas A&M AgriLife Research.
Data Availability Statement
The data generated from this study are available from the corresponding author on request.
Acknowledgments
The authors acknowledge Glen Ritchie’s research team at Texas Tech University for their support in implementing the field experiment.
Conflicts of Interest
The authors declare no conflict of interest.
References
- Reddy, K.R.; Brand, D.; Wijewardana, C.; Gao, W. Temperature effects on cotton seedling emergence, growth, and development. Agron. J. 2017, 109, 1379–1387. [Google Scholar] [CrossRef]
- Zheng, S.L.; Wang, L.J.; Wan, N.X.; Zhong, L.; Zhou, S.M.; He, W.; Yuan, J.C. Response of potato tuber number and spatial distribution to plant density in different growing seasons in Southwest China. Front. Plant Sci. 2016, 7, 365. [Google Scholar] [CrossRef] [Green Version]
- Liu, T.; Wu, W.; Chen, W.; Sun, C.; Zhu, X.; Guo, W. Automated image-processing for counting seedlings in a wheat field. Precis. Agric. 2016, 17, 392–406. [Google Scholar] [CrossRef]
- Godfrey, L.D.; Goodell, P.B.; Natwick, E.T.; Haviland, D.R.; Barlow, V.M. UC IPM pest management guidelines: Cotton. Available online: http://ipm.ucanr.edu/PMG/r3300311.html (accessed on 16 November 2020).
- Benson, G.O. Making corn replant decisions. In Proceedings of the Beltwide Cotton Conference Proceedings, San Antonio, TX, USA, 3–5 January 2018; pp. 1–7. [Google Scholar]
- Hopper, N.W.; Supak, J. Fungicide treatment effects on cotton (Gossypium hirsutum) emergence, establishment and yield. Texas J. Agric. Nat. Resour. 1993, 6, 69–80. [Google Scholar]
- Sun, S.; Li, C.; Paterson, A.H.; Chee, P.W.; Robertson, J.S. Image processing algorithms for infield single cotton boll counting and yield prediction. Comput. Electron. Agric. 2019, 166, 104976. [Google Scholar] [CrossRef]
- Zhao, B.; Zhang, J.; Yang, C.; Zhou, G.; Ding, Y.; Shi, Y.; Zhang, D.; Xie, J.; Liao, Q. Rapeseed seedling stand counting and seeding performance evaluation at two early growth stages based on unmanned aerial vehicle imagery. Front. Plant Sci. 2018, 9, 1362. [Google Scholar] [CrossRef]
- Chen, R.; Chu, T.; Landivar, J.A.; Yang, C.; Maeda, M.M. Monitoring cotton (Gossypium hirsutum L.) germination using ultrahigh-resolution UAS images. Precis. Agric. 2018, 19, 161–177. [Google Scholar] [CrossRef]
- Guo, W.; Zheng, B.; Potgieter, A.B.; Diot, J.; Watanabe, K.; Noshita, K.; Jordan, D.R.; Wang, X.; Watson, J.; Ninomiya, S.; et al. Aerial imagery analysis—quantifying appearance and number of sorghum heads for applications in breeding and agronomy. Front. Plant Sci. 2018, 9, 1544. [Google Scholar] [CrossRef] [Green Version]
- Chen, S.W.; Shivakumar, S.S.; Dcunha, S.; Das, J.; Okon, E.; Qu, C.; Taylor, C.J.; Kumar, V. Counting apples and oranges with deep learning: A data-driven approach. IEEE Robot. Autom. Lett. 2017, 2, 781–788. [Google Scholar] [CrossRef]
- Gnädinger, F.; Schmidhalter, U. Digital counts of maize plants by unmanned aerial vehicles (UAVs). Remote Sens. 2017, 9, 544. [Google Scholar] [CrossRef] [Green Version]
- Oh, M.; Olsen, P.; Ramamurthy, K.N. Counting and segmenting sorghum heads. arXiv 2019, arXiv:1905.13291. [Google Scholar]
- Olsen, P.A.; Natesan Ramamurthy, K.; Ribera, J.; Chen, Y.; Thompson, A.M.; Luss, R.; Tuinstra, M.; Abe, N. Detecting and counting panicles in sorghum images. In Proceedings of the 2018 IEEE 5th International Conference on Data Science and Advanced Analytics (DSAA 2018), Turin, Italy, 1–3 October 2018; pp. 400–409. [Google Scholar]
- Feng, A.; Zhou, J.; Vories, E.; Sudduth, K.A. Evaluation of cotton emergence using UAV-based narrow-band spectral imagery with customized image alignment and stitching algorithms. Remote Sens. 2020, 12, 1764. [Google Scholar] [CrossRef]
- LeCun, Y.; Bengio, Y.; Hinton, G. Deep learning. Nature 2015, 521, 436–444. [Google Scholar] [CrossRef]
- Nielsen, M.A. Neural Networks and Deep Learning; Determination Press: San Francisco, CA, USA, 2015; Available online: http://neuralnetworksanddeeplearning.com/index.html (accessed on 28 April 2021).
- Pan, S.J.; Yang, Q. A survey on transfer learning. IEEE Trans. Knowl. Data Eng. 2009, 22, 1345–1359. [Google Scholar] [CrossRef]
- Kamilaris, A.; Prenafeta-Boldú, F.X. Deep learning in agriculture: A survey. Comput. Electron. Agric. 2018, 147, 70–90. [Google Scholar] [CrossRef] [Green Version]
- Liu, Z.; Feng, Y.; Li, R.; Zhang, S.; Zhang, L.; Cui, G.; Al-Mallahi, A.; Fu, L.; Cui, Y. Improved kiwifruit detection using VGG16 with RGB and NIR information fusion. In Proceedings of the 2019 ASABE Annual International Meeting, Boston, MA, USA, 7–10 July 2019. [Google Scholar]
- Fu, L.; Majeed, Y.; Zhang, X.; Karkee, M.; Zhang, Q. Faster R–CNN–based apple detection in dense-foliage fruiting-wall trees using RGB and depth features for robotic harvesting. Biosyst. Eng. 2020, 197, 245–256. [Google Scholar] [CrossRef]
- Gao, F.; Fu, L.; Zhang, X.; Majeed, Y.; Li, R.; Karkee, M.; Zhang, Q. Multi-class fruit-on-plant detection for apple in SNAP system using Faster R-CNN. Comput. Electron. Agric. 2020, 176, 105634. [Google Scholar] [CrossRef]
- Wu, J.; Yang, G.; Yang, X.; Xu, B.; Han, L.; Zhu, Y. Automatic counting of in situ rice seedlings from UAV images based on a deep fully convolutional neural network. Remote Sens. 2019, 11, 691. [Google Scholar] [CrossRef] [Green Version]
- Lin, Z.; Guo, W. Sorghum panicle detection and counting using unmanned aerial system images and deep learning. Front. Plant Sci. 2020, 11, 1346. [Google Scholar] [CrossRef] [PubMed]
- Oh, S.; Chang, A.; Ashapure, A.; Jung, J.; Dube, N.; Maeda, M.; Gonzalez, D.; Landivar, J. Plant counting of cotton from UAS imagery using deep learning-based object detection framework. Remote Sens. 2020, 12, 2981. [Google Scholar] [CrossRef]
- Feng, A.; Zhou, J.; Vories, E.; Sudduth, K.A. Evaluation of cotton emergence using UAV-based imagery and deep learning. Comput. Electron. Agric. 2020, 177, 105711. [Google Scholar] [CrossRef]
- Girshick, R.; Donahue, J.; Darrell, T.; Malik, J. Rich feature hierarchies for accurate object detection and semantic segmentation. In Proceedings of the IEEE Computer Society Conference on Computer Vision and Pattern Recognition, Columbus, OH, USA, 23–28 June 2014; pp. 580–587. [Google Scholar]
- Howard, A.G.; Zhu, M.; Chen, B.; Kalenichenko, D.; Wang, W.; Weyand, T.; Andreetto, M.; Adam, H. MobileNets: Efficient convolutional neural networks for mobile vision applications. arXiv 2017, arXiv:1704.04861. [Google Scholar]
- Duan, K.; Bai, S.; Xie, L.; Qi, H.; Huang, Q.; Tian, Q. CenterNet: Keypoint triplets for object detection. In Proceedings of the IEEE International Conference on Computer Vision, Seoul, Korea, 27 October–3 November 2019; pp. 6568–6577. [Google Scholar]
- Sun, Y.; Zhang, Y.; Wang, H. Select the model who knows the image best: A multi-model method. Optoelectron. Imaging Multimed. Technol. VII 2020, 11550. [Google Scholar] [CrossRef]
- Dai, J.; Lei, S.; Dong, L.; Lin, X.; Zhang, H.; Sun, D.; Yuan, K. More reliable AI solution: Breast ultrasound diagnosis using multi-AI combination. arXiv 2021, arXiv:2101.02639. [Google Scholar]
- Chen, J.; Zhang, D.; Suzauddola, M.; Nanehkaran, Y.A.; Sun, Y. Identification of plant disease images via a squeeze-and-excitation MobileNet model and twice transfer learning. IET Image Process. 2021, 15, 1115–1127. [Google Scholar] [CrossRef]
- Bi, C.; Wang, J.; Duan, Y.; Fu, B.; Kang, J.R.; Shi, Y. MobileNet based apple leaf diseases identification. Mob. Netw. Appl. 2020, 1–9. [Google Scholar] [CrossRef]
- Jin, X.; Che, J.; Chen, Y. Weed identification using deep learning and image processing in vegetable plantation. IEEE Access 2021, 9, 10940–10950. [Google Scholar] [CrossRef]
- Zhao, K.; Yan, W.Q. Fruit detection from digital images using CenterNet. In Proceedings of the Geometry and Visionfirst International Symposium, ISGV 2021, Auckland, New Zealand, 28–29 January 2021; Revised Selected Papers. 2021. Volume 1386, pp. 313–326. [Google Scholar]
- Texas Climate Data-Lubbock. Available online: https://www.usclimatedata.com/climate/lubbock/texas/united-states/ustx2745 (accessed on 25 February 2021).
- Dhakal, M.; West, C.P.; Deb, S.K.; Kharel, G.; Ritchie, G.L. Field calibration of PR2 capacitance probe in pullman clay—loam soil of Southern High Plains. Agrosyst. Geosci. Environ. 2019, 2, 1–7. [Google Scholar] [CrossRef] [Green Version]
- Abadi, M.; Agarwal, A.; Barham, P.; Brevdo, E.; Chen, Z.; Citro, C.; Corrado, G.S.; Davis, A.; Dean, J.; Devin, M.; et al. TensorFlow: Large-scale machine learning on heterogeneous distributed systems. arXiv 2016, arXiv:1603.04467. [Google Scholar]
- Google Colaboratory—Google. Available online: https://research.google.com/colaboratory/faq.html (accessed on 31 May 2021).
- Tzutalin, D. LabelImg. Git Code. Available online: https://github.com/tzutalin/labelImg (accessed on 16 February 2021).
- Simonyan, K.; Zisserman, A. Very deep convolutional networks for large-scale image recognition. In Proceedings of the 3rd International Conference on Learning Representations (ICLR 2015—Conference Track Proceedings), San Diego, CA, USA, 7–9 May 2015. [Google Scholar]
- Deng, J.; Dong, W.; Socher, R.; Li, L.-J.; Li, K.; Fei-Fei, L. ImageNet: A large-scale hierarchical image database. In Proceedings of the 2009 IEEE Conference on Computer Vision and Pattern Recognition, Miami, FL, USA, 20–25 June 2009; pp. 248–255. [Google Scholar]
- Sandler, M.; Howard, A.; Zhu, M.; Zhmoginov, A.; Chen, L.C. MobileNetV2: Inverted residuals and linear bottlenecks. In Proceedings of the IEEE Computer Society Conference on Computer Vision and Pattern Recognition, Salt Lake City, UT, USA, 18–23 June 2018; pp. 4510–4520. [Google Scholar]
- Law, H.; Deng, J. CornerNet: Detecting objects as paired keypoints. Int. J. Comput. Vis. 2018, 128, 642–656. [Google Scholar] [CrossRef] [Green Version]
- Goutte, C.; Gaussier, E. A probabilistic interpretation of precision, recall and F-score, with implication for evaluation. In Advances in Information Retrieval, Proceedings of the 27th European Conference on IR Research (ECIR 2005), Santiago de Compostela, Spain, 21–23 March 2005; Springer: Berlin/Heidelberg, Germany, 2005; Volume 3408, pp. 345–359. [Google Scholar]
- Everingham, M.; Van Gool, L.; Williams, C.K.I.; Winn, J.; Zisserman, A. The pascal visual object classes (VOC) challenge. Int. J. Comput. Vis. 2010, 88, 303–338. [Google Scholar] [CrossRef] [Green Version]
- Supak, J.; Boman, R. Making replant decisions. In Proceedings of the 1990 Beltwide Cotton Production Conference, Las Vegas, NV, USA, 10–13 January 1990. [Google Scholar]
- Pailla, D.R.; Kollerathu, V.; Chennamsetty, S.S. Object detection on aerial imagery using CenterNet. arXiv 2019, arXiv:1908.08244. [Google Scholar]
- Cui, Z.; Wang, X.; Liu, N.; Cao, Z.; Yang, J. Ship detection in large-scale SAR images via spatial shuffle-group enhance attention. IEEE Trans. Geosci. Remote Sens. 2021, 59, 379–391. [Google Scholar] [CrossRef]
- Brendel, W.; Bethge, M. Approximating CNNs with bag-of-local-features models works surprisingly well on Imagenet. In Proceedings of the 7th International Conference on Learning Representations (ICLR 2019), New Orleans, LA, USA, 6–9 May 2019. [Google Scholar]
- Huang, Z.; Wang, N. Data-driven sparse structure selection for deep neural networks. In Proceedings of the European Conference on Computer Vision (ECCV), Munich, Germany, 8–14 September 2018; pp. 304–320. [Google Scholar]
- D’Odorico, P.; Besik, A.; Wong, C.Y.S.; Isabel, N.; Ensminger, I. High-throughput drone-based remote sensing reliably tracks phenology in thousands of conifer seedlings. New Phytol. 2020, 226, 1667–1681. [Google Scholar] [CrossRef]
- Wang, R.J.; Li, X.; Ling, C.X. Pelee: A real-time object detection system on mobile devices. arXiv 2018, arXiv:1804.06882. [Google Scholar]
- Velasco, J.; Pascion, C.; Alberio, J.W.; Apuang, J.; Cruz, J.S.; Gomez, M.A.; Molina, B.; Tuala, L.; Thio-Ac, A.; Jorda, R. A smartphone-based skin disease classification using Mobilenet CNN. Int. J. Adv. Trends Comput. Sci. Eng. 2019, 8, 2632–2637. [Google Scholar] [CrossRef]
- Liu, W.; Anguelov, D.; Erhan, D.; Szegedy, C.; Reed, S.; Fu, C.Y.; Berg, A.C. SSD: Single shot multibox detector. In Proceedings of the European Conference on Computer Vision Computer Vision, Amsterdam, The Netherlands, 8–16 October 2016; pp. 21–37. [Google Scholar]
- Girshick, R. Fast R-CNN. In Proceedings of the IEEE International Conference on Computer Vision, Santiago, Chile, 7–13 December 2015; Volume 2015, pp. 1440–1448. [Google Scholar]
- Deng, L.; Yu, D. Deep learning: Methods and applications. Found. Trends Signal Process. 2014, 7, 197–387. [Google Scholar] [CrossRef] [Green Version]
- Maimaitijiang, M.; Ghulam, A.; Sidike, P.; Hartling, S.; Maimaitiyiming, M.; Peterson, K.; Shavers, E.; Fishman, J.; Peterson, J.; Kadam, S.; et al. Unmanned aerial system (UAS)—Based phenotyping of soybean using multi-sensor data fusion and extreme learning machine. ISPRS J. Photogramm. Remote Sens. 2017, 134, 43–58. [Google Scholar] [CrossRef]
- Li, B.; Xu, X.; Han, J.; Zhang, L.; Bian, C.; Jin, L.; Liu, J. The estimation of crop emergence in potatoes by UAV RGB imagery. Plant Methods 2019, 15, 1–13. [Google Scholar] [CrossRef] [PubMed] [Green Version]
- Rasmussen, J.; Nielsen, J.; Streibig, J.C.; Jensen, J.E.; Pedersen, K.S.; Olsen, S.I. Pre-harvest weed mapping of Cirsium arvense in wheat and barley with off-the-shelf UAVs. Precis. Agric. 2019, 20, 983–999. [Google Scholar] [CrossRef]
- Lee, U.; Chang, S.; Putra, G.A.; Kim, H.; Kim, D.H. An automated, high-throughput plant phenotyping system using machine learning-based plant segmentation and image analysis. PLoS ONE 2018, 13, e0196615. [Google Scholar] [CrossRef] [PubMed] [Green Version]
Figure 1.
Cotton stand count using CenterNet and MobileNet machine learning algorithms based on unmanned aerial system images.
Figure 1.
Cotton stand count using CenterNet and MobileNet machine learning algorithms based on unmanned aerial system images.

Figure 2.
Sample training images showing cotton plants labeled as bounding boxes on unmanned aerial systems images for stand counting using deep learning algorithms.
Figure 2.
Sample training images showing cotton plants labeled as bounding boxes on unmanned aerial systems images for stand counting using deep learning algorithms.

Figure 3.
Examples of cotton plant detection and counting results using an unmanned aerial system image acquired on 8 June 2020. Percentage labels around bounding boxes represent F1-scores for detected cotton plants.
Figure 3.
Examples of cotton plant detection and counting results using an unmanned aerial system image acquired on 8 June 2020. Percentage labels around bounding boxes represent F1-scores for detected cotton plants.

Figure 4.
Examples of cotton plant detection and counting results using an unmanned aerial system image acquired on 14 June 2020. Percentage labels around bounding boxes represent F1-scores for detected cotton plants.
Figure 4.
Examples of cotton plant detection and counting results using an unmanned aerial system image acquired on 14 June 2020. Percentage labels around bounding boxes represent F1-scores for detected cotton plants.

Figure 5.
Examples of cotton plant detection and counting results using unmanned aerial system images having the same dimension as training images acquiring on 8 June 2020. Percentage labels around bounding boxes represent F1-scores for detected cotton plants.
Figure 5.
Examples of cotton plant detection and counting results using unmanned aerial system images having the same dimension as training images acquiring on 8 June 2020. Percentage labels around bounding boxes represent F1-scores for detected cotton plants.

Figure 6.
Examples of cotton plant detection and counting results using unmanned aerial system images at dry and wet soil conditions. Percentage labels around bounding boxes represent F1-scores for detected cotton plants.
Figure 6.
Examples of cotton plant detection and counting results using unmanned aerial system images at dry and wet soil conditions. Percentage labels around bounding boxes represent F1-scores for detected cotton plants.


Table 1.
Mean average precision (mAP), average recall (AR) and mean F1-score results for the MobileNet and CenterNet models in cotton stand counting using UAS images.
Table 1.
Mean average precision (mAP), average recall (AR) and mean F1-score results for the MobileNet and CenterNet models in cotton stand counting using UAS images.
| Model | Number of Training Images | mAP (%) | AR (%) | F1-Score (%) |
|---|---|---|---|---|
| MobileNet | 400 | 67 | 39 | 63 |
| - | 900 | 86 | 72 | 81 |
| CenterNet | 400 | 71 | 48 | 75 |
| - | 900 | 79 | 73 | 87 |
Table 2.
Coefficient of determination (R2), root mean square error (RMSE), mean absolute error (MAE), and mean absolute percentage error (MAPE) for cotton stand counting with the MobileNet and CenterNet models using unmanned aerial system images.
Table 2.
Coefficient of determination (R2), root mean square error (RMSE), mean absolute error (MAE), and mean absolute percentage error (MAPE) for cotton stand counting with the MobileNet and CenterNet models using unmanned aerial system images.
| Model | Testing Dataset | Number of Training Images | R2 | RMSE | MAE | MAPE (%) |
|---|---|---|---|---|---|---|
| MobileNet | 1 | 400 | 0.86 | 0.89 | 0.54 | 0.26 |
| - | - | 900 | 0.96 | 0.64 | 0.33 | 0.11 |
| - | 2 | 400 | 0.48 | 7.81 | 7.48 | 7.83 |
| - | - | 900 | 0.87 | 3.66 | 6.22 | 5.61 |
| CenterNet | 1 | 400 | 0.89 | 0.58 | 0.25 | 0.10 |
| - | - | 900 | 0.98 | 0.37 | 0.27 | 0.07 |
| - | 2 | 400 | 0.60 | 6.08 | 8.03 | 6.57 |
| - | - | 900 | 0.86 | 3.94 | 5.39 | 4.73 |
Publisher’s Note: MDPI stays neutral with regard to jurisdictional claims in published maps and institutional affiliations. |
© 2021 by the authors. Licensee MDPI, Basel, Switzerland. This article is an open access article distributed under the terms and conditions of the Creative Commons Attribution (CC BY) license (https://creativecommons.org/licenses/by/4.0/).
Share and Cite
MDPI and ACS Style
Lin, Z.; Guo, W. Cotton Stand Counting from Unmanned Aerial System Imagery Using MobileNet and CenterNet Deep Learning Models. Remote Sens. 2021, 13, 2822. https://0-doi-org.brum.beds.ac.uk/10.3390/rs13142822
AMA Style
Lin Z, Guo W. Cotton Stand Counting from Unmanned Aerial System Imagery Using MobileNet and CenterNet Deep Learning Models. Remote Sensing. 2021; 13(14):2822. https://0-doi-org.brum.beds.ac.uk/10.3390/rs13142822
Chicago/Turabian StyleLin, Zhe, and Wenxuan Guo. 2021. "Cotton Stand Counting from Unmanned Aerial System Imagery Using MobileNet and CenterNet Deep Learning Models" Remote Sensing 13, no. 14: 2822. https://0-doi-org.brum.beds.ac.uk/10.3390/rs13142822
Note that from the first issue of 2016, this journal uses article numbers instead of page numbers. See further details here.