
Statistical Characteristics of Raindrop Size Distribution in Monsoon Season over South China Sea

1
School of Atmospheric Sciences, Key Laboratory of Tropical Atmosphere-Ocean System, Sun Yat-sen University, Ministry of Education, Zhuhai 519000, China
2
Southern Laboratory of Ocean Science and Engineering, Zhuhai 519000, China
3
Guangdong Meteorological Observatory, Guangzhou 510641, China
*
Author to whom correspondence should be addressed.
Remote Sens. 2021, 13(15), 2878; https://0-doi-org.brum.beds.ac.uk/10.3390/rs13152878
Submission received: 18 May 2021
/
Revised: 17 July 2021
/
Accepted: 19 July 2021
/
Published: 22 July 2021
(This article belongs to the Special Issue Radar-Based Studies of Precipitation Systems and Their Microphysics)
Abstract
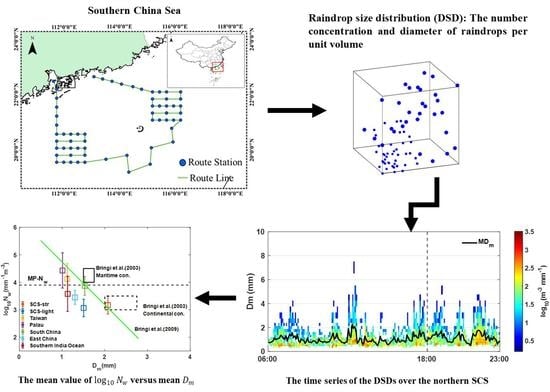
:The South China Sea (SCS) is the largest and southernmost sea in China. Water vapor from the SCS is the primary source of precipitation over coastal areas during the summer monsoon season and may cause the uneven distribution of rainfall in southern China. Deep insight into the spatial variability of raindrop size distribution (DSD) is essential for understanding precipitation microphysics, since DSD contains abundant information about rainfall microphysics processes. However, compared to the studies of DSDs over mainland China, very little is known about DSDs over Chinese ocean areas, especially over the South China Sea (SCS). This study investigated the statistical characteristics of the DSD in summer monsoon seasons using the second-generation Particle Size and Velocity (Parsivel2) installed on the scientific research vessel that measured the size and velocity of raindrops over the SCS. In this study, the characteristics of precipitation over the SCS for daytime and nighttime rains were analyzed for different precipitation systems and upon different rain rates. It was found that: (1) rain events were more frequent during the late evening to early morning; (2) more than 78.2% of the raindrops’ diameters were less than 2 mm, and the average value of mass-weighted mean diameter (1.46 mm) of the SCS is similar to that over land in the southern China; (3) the stratiform precipitation features a relatively high concentration of medium to large-sized rain drops compared to other regions; (4) the DSD in the SCS agreed with a three-parameter gamma distribution for the small raindrop diameter. Furthermore, a possible factor for significant DSD variability in the ocean compared with the coast and large islands is also discussed.
1. Introduction
Precipitation plays a critical role in the hydrological cycle and the Earth’s climate system. Raindrop size distribution (DSD) is helpful in understanding the characteristics of microphysical processes, such as coalescence and breakup processes [1]. The accurate detection of the DSD is important for many fields [2]. The DSD describes precipitation microphysics characteristics at raindrop scale and provides detailed information that is relevant to large-scale precipitation processes [3]. It is also useful for optimizing the short term weather forecasting through developing microphysical parameterization schemes in numerical weather prediction models and can also be used to improve quantitative precipitation estimation (QPE) [4].
Recently, the DSDs in various regions have received an increasing amount of attention. Many studies on DSD characteristics suggest that the DSDs is highly variable [5,6,7]. The characteristics of precipitation are affected by different climate systems and terrain [8,9], resulting in unique DSD characteristics in different regions [10,11].
Previous observation campaigns to investigate DSD characteristics have been conducted over a variety of regions in China. Tang et al. [10] analyzed the DSD characteristics during the warm season from 2008 to 2010 in northern China and from July to August 2010 in southern China. Their study indicated the significant regional DSD variation in different climatic regions and precipitation types which was responsible for the differences in DSD characteristics. For example, Yangjiang found the highest total number concentration of raindrops in convective precipitation, and Zhangbei showed a greater medium volume diameter () of raindrops than Yangjiang in convective precipitation [10]. Zhang et al. [11] also revealed that the number density of small-sized drops in southern China was higher than that in eastern China and northern China. Moreover, Chen et al. [12] carried out raindrop size distribution measurements in Meiyu seasons over eastern China and determined that the DSD characteristics in eastern China are distinct from other regions. However, compared to the studies of DSDs over mainland China, very little is known about DSDs in the SCS, which is located in the southeast of the Asian land.
Studies on the different climatic (near-equator to temperate) and terrain (high-plains to oceanic regions) DSD features of different rainfall type over the globe were also investigated. Chen et al. [13] illustrated the significant diurnal DSD variation for convective precipitation on the Tibetan Plateau (Naqu, China, at 4500 m). Zwiebel et al. [14] suggested that the different topographics of the region has an influence on the rainfall structure and DSD parameters. Tenório et al. [15] also found that maritime rainfall is significantly higher than continental rainfall for a one-minute mean rain rate. The concentrations of small drops (2 mm) were reduced in maritime rain compared to continental rain. Apart from the continental and maritime precipitation, previous studies also show that rainfall events have two clearly distinguishable types. Bringi et al. [16] classify convective and stratiform rainfall based on the rain rate and standard deviation of the rain rate. Their study suggested that the characteristics of raindrop concentration and diameter are different for different rain types and climatic regimes. A study by Sharma et al. [17] indicates that the larger sized drops existed in stratiform rainfall for a rain rate below 10 mm/h. On the contrary, convective rainfall shows a higher concentration of larger sized drops when the rain rate is greater than 10 mm/h. In addition to the convective and stratiform precipitation, rainfall was further divided into transition. Deo et al. [18] found that the tropical cyclone and non-tropical cyclone significantly differ with rainfall type. The stratiform and transition have broader gamma parameter distribution than the convective.
From the above literatures, it can be seen that the spatial-temporal variation was found not only in different locations but also in different precipitation regimes. Moreover, improving the accuracy of weather radar quantitative precipitation estimation (QPE) is a significant application of DSD. The radar reflectivity factor-rain rate (Z-R) power law relationship has a strong connection with the DSD variability is closely related to DSD characteristics [12,19]. Thus, it is necessary to improve the accuracy of radar QPE by investigating different properties of the DSDs and calculating the accurate coefficients and exponents of the power-law relationship in various rainfall types and climate regimes.
There are three well-known surface disdrometers widely used in the continuous measurement of the particle diameter and fall velocity. The first instrument is Particle Size Velocity (hereafter Parsivel), which is a laser-optical disdrometer. Loffler-Mang and Joss [20] introduced the specifications and measurement principles of the Prasivel in 2000. Parsivel produces a horizontal sheet of light (30 mm wide, 1 mm high, and 160 mm long) to detect the diameter and fall velocity of single raindrop through the sensor. The second is the Joss-Waldvogel disdrometer (JWD) [21,22] based on the impact techniques. This instrument has an obvious disadvantage as much effort is needed to evaluate the measurements, so it is commonly used as a reference instrument for rain investigations. The last disdrometer is the Two-Dimensional Video Disdrometer (2DVD) based on two high-speed line scan cameras to measure the size and velocity of raindrops. It can measure a single raindrop with the vertical and horizontal resolutions for a particle higher than 0.19 mm [23]. After intercomparisons of different disdrometers, several studies propose that the Parsivel disdrometer is susceptible to underestimating the concentration of small drops (diameter of less than 1 mm) compared to the 2DVD [24,25,26].
The SCS is one of the most intense sea areas on Earth in terms of ocean atmosphere land interactions. It is the key region of summer monsoon activities as well as the key passage for water vapor to East Asia. The summer monsoon over the SCS has an impact on the weather climate changes in China or even the world. Furthermore, the SCS summer monsoon onset is considered as a precursor to East Asian summer monsoons [27], which has a significant impact on the evolution of Asian monsoon variability [28]. The SCS and the surrounding areas are significantly influenced by monsoon. In recent years, attempts have been made to obtain precipitation data over remote oceans [29] for validating the satellite products and DSD parameters of a dual-frequency precipitation radar (DPR) on board the Global Precipitation Measurement (GPM) Core Observatory [30]. However, there is little knowledge about DSD in the SCS. Zeng et al. [31] analyzed oceanic rain events in the SCS with the onboard Particle Size Velocity (Parsivel) disdrometer and concluded that the pre-monsoon rainfall was influenced by the warm-rain process, whereas the monsoon rainfall was influenced by the cold-rain process. However, their study did not investigate the - relationship which could facilitate the retrieval of rain parameters from remote measurements [1,32]. Previous studies have proposed that three gamma parameters (Λ, μ and ) are dependent on the precipitation microphysical process. μ represents a distribution shape parameter, which reflects the shape of the fitted curve, while the Λ (mm−1) is a slope parameter [33,34]. The smaller value of represents the more stable raindrop spectrum and the high drop concentration of large particles [35]. Through the observations from the video disdrometer, Zhang et al. [32] proposed that is strongly dependent on . Ulbrich et al. [9] used raindrop size spectra measured by a disdrometer on the surface of tropical continental storms to determine the associated parameters of the best-fit gamma distributions. They found that each rain type has a reasonably distinctive set of median volume drop sizes () that defines different shape and slope relationships. Correspondingly, in this study, besides the statistical characteristic of the SCS precipitation, the Λ-μ relationship was also calculated to reduce the bias and standard errors in the retrieved rain parameters [36]. Knowledge about DSD characteristics over the SCS will improve the accuracy of satellite remote sensing precipitation products [37,38].
The objective of this study was to analyze the characteristics of the DSD over the SCS with a dataset collected in the SCS in July 2019, aiming to further understand critical physical processes for the occurrence, maintenance, and variability of monsoons over southern China in summer monsoon precipitation. This study is presented as follows: Section 2 describes the study area, dataset, and analysis methods. Section 3 presents the analysis of the DSD characteristics over the SCS. A summary and discussion are provided in Section 4.
2. Materials and Methods
2.1. Parsivel2 Disdrometer and Dataset
The rain DSD data analyzed in this study were continuously collected through a second-generation OTT (OTT-2) Particle Size Velocity (Parsivel2 [39]) disdrometer over the SCS in June 2019. The Parsivel2 disdrometer was deployed on the scientific research vessel named Shenkuo, which conducted crucial scientific research in the SCS, including obtaining the observation dataset of atmospheric circulation and ocean structure change, and developing the shipboard meteorology. In the study, the study area is the monsoon season area from the west to east of the Dongsha islands (shown in the upper right corner of Figure 1), and Shenkuo started at Huizhou dock and passed through 63 observation stations. Each station is a mooring point, and the Shenkuo arrives at a fixed mooring point to carry out observation tasks. After completing all observation tasks, Shenkuo returned from Guangzhou dock. The task of this voyage was to carry out the ‘Integrated Atmosphere Ocean Observation Experiment in northern South China Sea’, which is a comprehensive observation experiment, including the weather and climate, atmospheric environment, ocean dynamic, ocean chemistry, marine ecology, marine geology and other multidisciplinary organic intersections. The vessel route is shown as the green line in Figure 1, which was around 1800 nautical miles in total, and the blue solid points represent the route stations throughout the experiment.
The OTT-2 installed onboard was a laser optical disdrometer constructed by OTT Hydromel, Germany. The OTT-2 disdrometer simultaneously measures and observes the fall velocity and size of rain drops per unit of time (1 min) through an optical sensor. All raw output data of sizes and fall speeds are expressed as a 32 × 32 matrix, and every particle is given a class on the basis of the assigned value that corresponds to the center of the size and velocity classes. The size and fall velocity ranges are from 0.2 to 25 mm and from 0.2 to 20 mm/s, respectively. It is noted that the first two classes (0.62 and 0.187 mm) were not considered due to their low signal-to-noise ratios (SNR) [39]. More detailed information about drop size and falling velocity are given in Yuter et al. [40].
The optical disdrometers are capable of providing reliable observations in a moving vessel even with high wind speeds, frequently varying wind directions, etc., but they are also prone to biases and uncertainties [41]. To minimize these measurement errors, the observed DSD data were strictly quality-controlled (QC). Effective DSD samples were selected based on the criteria proposed by Tokay and Bashor et al. [42]. The QC steps were as follows: (1) the data are acceptable when the rain rate is more than 0.1 mm/h or the total raindrop number is greater than 10; (2) if the raindrop diameter is greater than 8 mm, it is regarded as an invalid datum, as the natural raindrops are typically sized between 0.1 and 6 mm in equivalent-volume sphere diameter (equivolume). After the QC methods above, there were 6 rainy days that consisted of a total 183 min of DSD samples from 7 to 27 June 2019.
It is worth noting that the valid data of this study are limited in number as the disdrometer experienced unexpected system shutdowns due to the unstable power on the vessel. Additionally, the disdrometer sometimes failed to store and output the observation data due to disconnections between the distrometer and the data acquisition system.
The data records from Shenkuo only cover 21 days, but the long-term oceanic precipitation data acquisition must be collected onboard since long-term disdrometer-based oceanic precipitation data campaign deployments is necessary for the surface validation of satellite, re-analysis and model data [36].
2.2. Analysis Methods
The method of calculating the DSD parameters from an OTT Parsivel2 disdrometer is defined by Zhang et al. [32]. It tends to place emphasis on medium-sized rain drops and thus avoid any difficulties associated with the undercounting of small and large drops. The second, fourth and six moments of the distribution were used to analyze the DSD data. To obtain the number concentration of raindrops per unit volume per unit size interval, the following equation was used:
Here indicates the number concentration of raindrops in the range diameter from to per unit volume per unit size interval; is the number of raindrops within the size bin and velocity ; A () and are the disdrometer sampling area and time, respectively. In this study, A is 0.054 and is 60 s. is the raindrop diameter for the size bin ; is the corresponding diameter interval (mm); is the fall speed for the velocity bin j. In this study, we dismissed the fall speed collected by the OTT Parsivel2 disdrometer due to the measurement error [39,43]. Instead, the falling speed was defined as follows [44]:
Once the is calculated, the rain rate (R), radar reflectivity factor (Z) and liquid water content (W) can be computed with the following equations [11,16]:
The raindrop diameter is commonly expressed by the mass-weighted mean diameter ((mm)). It is equal to the ratio of the 3rd to the 4th moment of the DSD, and can be computed with Equation (6) as follows:
where expresses the nth order moment of the DSD. The can be calculated as follows:
is the normalized intercept parameter (defined by Bing et al. [16], which is the same as the gamma parameter of an equivalent exponential DSD.
Both and gamma parameter mean the raindrop concentration, however, is calculated with Equation (8), and parameter has no influence on . Therefore, the scales , make it possible to compare DSDs with a widely varying rain rate. can be derived from and :
where (1.0 g cm−1) represents the density of liquid water.
According to the well-established results demonstrated of Ulbrich et al. [33], the DSD spectrum can be well described by a three-parameter gamma function, which is expressed by the Equation (9). Here, three parameters (, and ) were calculated by the second, fourth and sixth moments, respectively, of using disdrometer data via the moment method (MM) in Equation (7), which was recommended for practical use [45]. Specifically, (m−3 mm−1−μ) represents the intercept parameter, while expresses the shape parameter (dimensionless), and Λ denotes the slope parameter in a unit of mm−1 [33].
3. Results
3.1. Diurnal Featuresof Rain DSD
To discern the features of DSD and rainfall variability between daytime and nighttime rains, we calculated the maximum rainfall rate and max of each rainfall period (as shown in Table 1). Over the one-month observation period in the Shenkuo, DSD data in a total number of six rainy days over the SCS were collected by the disdrometer. After applying the aforementioned quality control, 183 minutes of raindrop spectra were obtained. Then, the data were divided into two periods, which belonged to either the daytime type (BJT 06:00 to 18:00) or nighttime type (BJT 18:00 to 06:00) according to the definitions of daytime and nighttime by Yang et al. [46] based on the local mean sunrise and sunset time in summer. It was found that the number of 1 min DSD spectra is 74 and 109, respectively, during the nighttime and daytime.
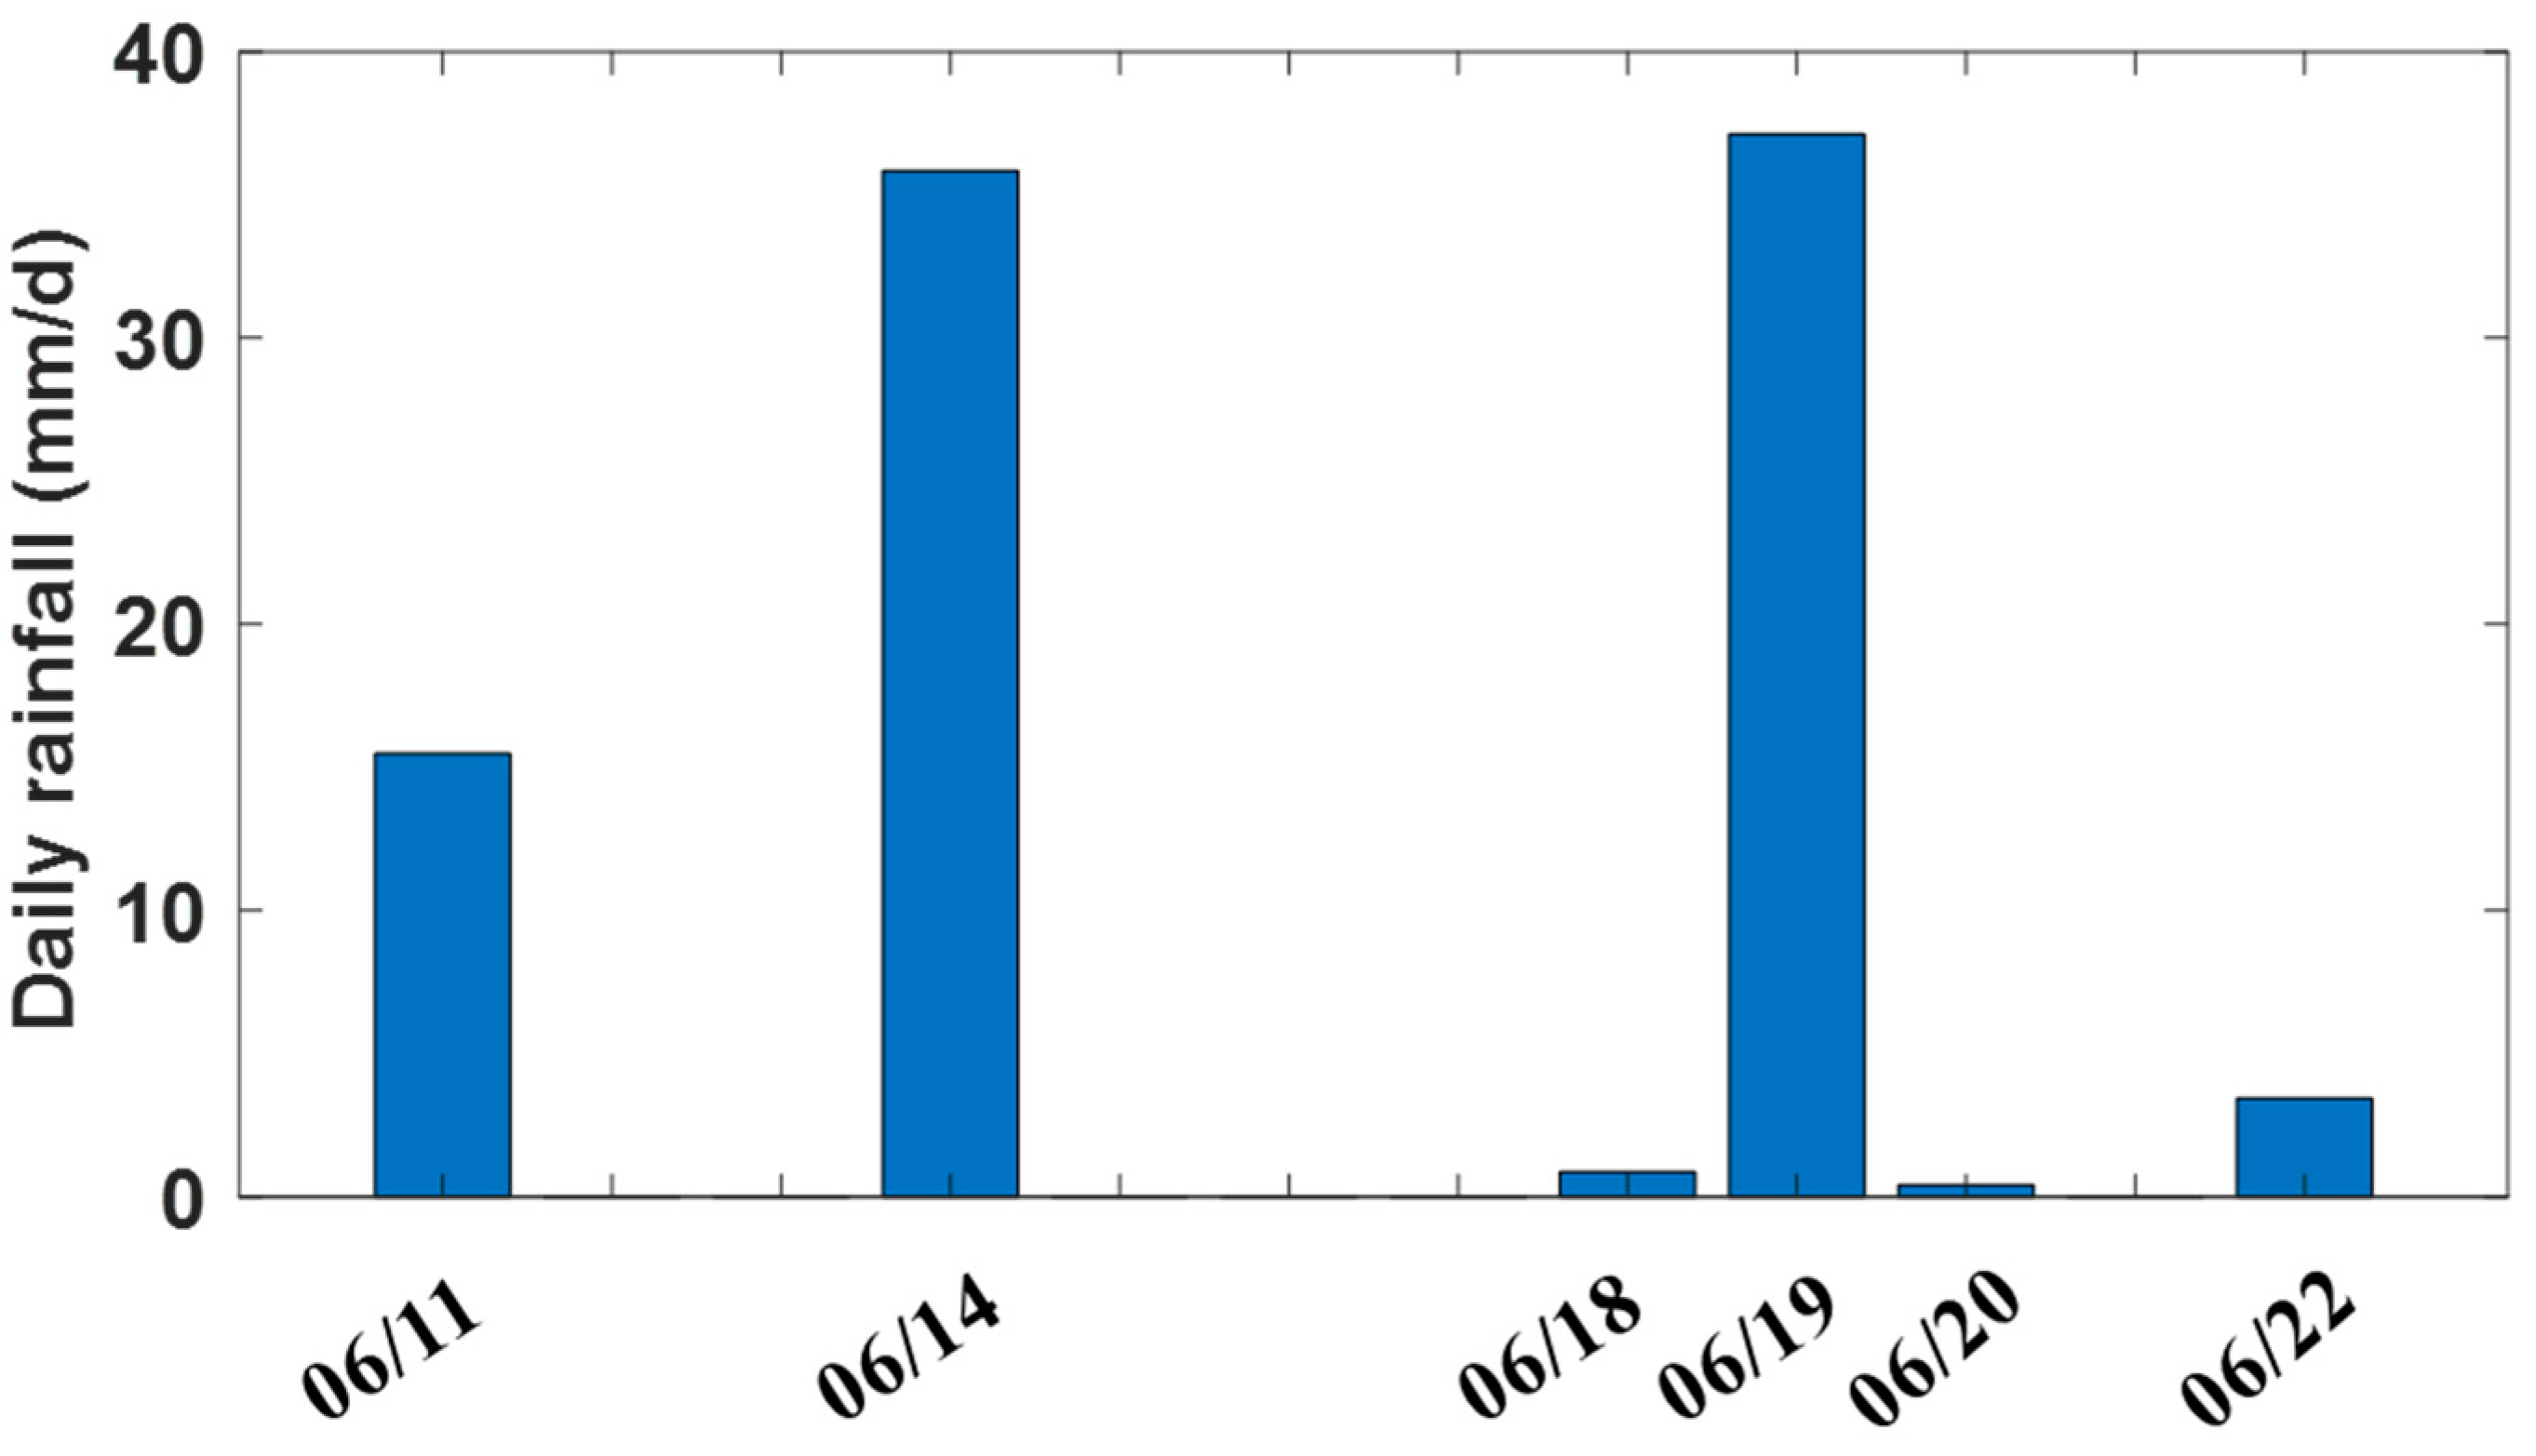
Figure 2 shows the daily rainfall. The rainy time, total number of samples, max rain rate and max are listed in Table 1. After analyzing the navigation information of the Shenkuo, we found that the precipitation mainly occurred on the open ocean far away from the coastline or large island. Therefore, the precipitation can be deemed ocean precipitation. As shown in Figure 2 and Table 1, the maximum rain rate and largest amount of daily rainfall were observed on 14 June (36 mm/day) and 19 June (37 mm/day). Rainfall events were measured at intervals of three or four days, and the amount of rainfall was below 40 mm/day. This suggests the relatively high frequency of occurrence of rainy days. A similar result has been reported in the southern Indian Ocean from September to October [35].
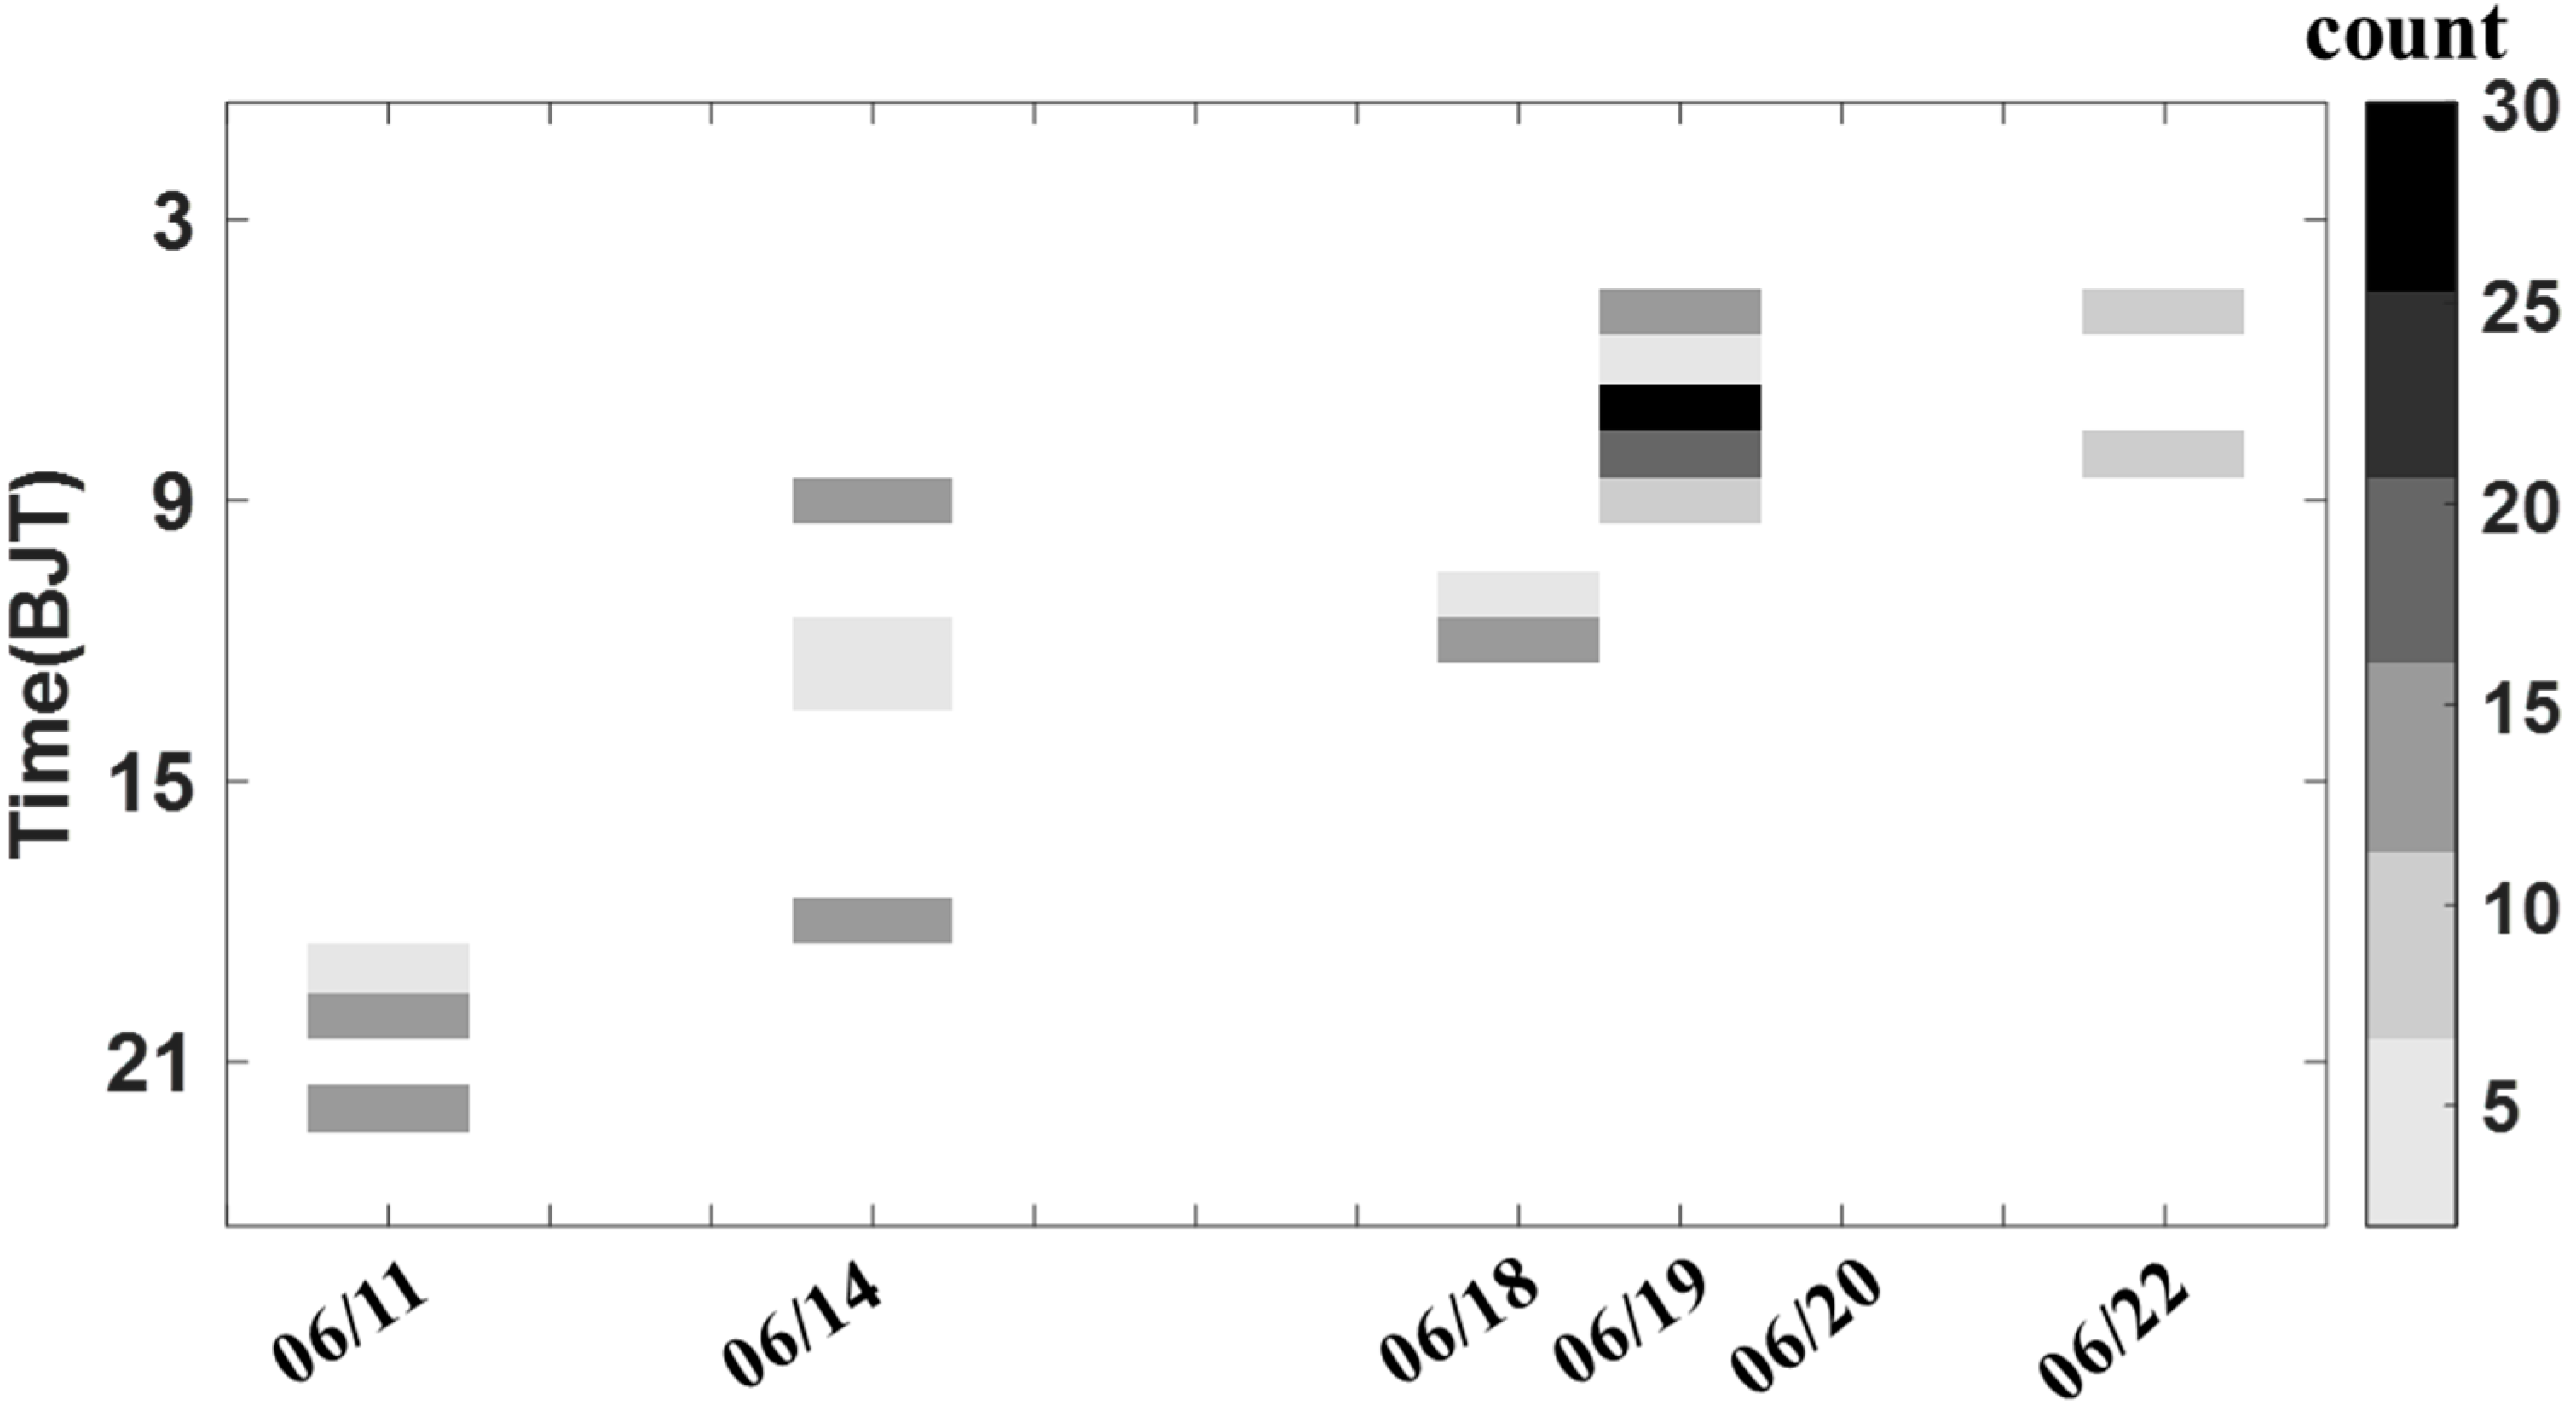
As shown in Figure 3, most rain events occur in the early morning and late evening, while there is rare rainfall in the mid to late afternoon. Similar results can be found in the studies by Yang et al. [47] and Gray et al. [48]. Yang et al. [47] investigated the diurnal variability of global rainfall with TRMM precipitation products and found a rainfall maximum from late evening to early morning over the ocean. Gray et al. [48] also found that the convective and maximum rainfall usually occurs in the morning, whereas the minimum rain rate occurs in the afternoon to evening. A previous study by Gray et al. [48] also assumed that the diurnal variability of rainfall over the ocean may be affected by the difference of radiation heating between the convective rain region and the surrounding cloudless region, and the dynamic results of convection are adjusted. The minimum rain rate occurred in the afternoon due to absorbing shortwave radiation on convective clouds, weakening the vertical movement of vapor.
In order to better reveal the evolution of the diurnal of raindrop size distribution, the time record of the mass-weighted mean diameter () and normalized intercept parameter () obtained from the data is illustrated in Figure 4 (totally 183 samples). In Figure 4, the vertical gray dotted line divides the nighttime and daytime periods. During the summer monsoon season, more than 78.2% of the raindrops’ diameters were less than 2 mm, resulting in a high concentration of small rain drops. As shown in Figure 4a, the of each 1 min DSD sample varied from 0.31 to 7.5 mm, and the average mass-weight diameter (black line) exceeded those of Taiwan (0.88 to 2.12 mm) and Palau (0.79 to 2.06 mm) located in the western Pacific Ocean in the range of approximately 0.5 to 2.5 mm [49]. As shown in Figure 4b, the rainfall rate was below 8 mm/h, the maximum 1 min rainfall rate (blue line) was up to 7.5 mm/h (only lasted 1 min), and the highest value of the number concentration of the raindrop was approximately 3.8 m−3 mm−1 during the observed period. Overall, the DSD resembles the tropical oceanic DSDs, that is, with a high concentration of small drops. This result indicates that the high number concentration of small drops with very few large drops is the basic characteristic of DSD over the northern SCS.
The in the daytime was 1.43 mm and at nighttime was 1.42 mm. Moreover, the rainfall in the SCS was composed of small raindrops generally smaller than 2 mm. Specifically, the mean in the daytime varied from 0.9 to 2 mm and the mean at nighttime was in the range of 0.8–1.8 mm. In general, the variation between the daytime and nighttime of was not obvious. A similar result was also found by Marzuki et al. [35], that the diurnal variation of convective activities is not significant over the oceans and is pronounced over the continents, large islands, and their adjacent seas. The diurnal variation of DSD is less obvious in the northern SCS. Similar results also appear in the southern Indian Ocean, as reported by Marzuki et al. [35]. This was potentially affected by the variation of convective activities, as they found that the diurnal variation of convective activities has no significance over the oceans and is pronounced over the continents, large islands, and their adjacent seas [50].
3.2. DSDs in Stratiform and Light Precipitation
To investigate the DSD characteristic of different rainfall types, precipitation was divided into three rainfall types: convective, stratiform and light precipitation. The classification scheme based on the variability of rain rate R and standard deviation with time was used to classify the stratiform and convective rain proposed by Bringi et al. [16]. A sample’s rain rate at the instant time () is defined as which is used to identify the precipitation type. If the values of R() in a time series from to vary between 0.5 and 5 mm/h, and their standard deviation is smaller than 1.5 mm/h, it is regarded as stratiform precipitation. Due to the limited rainfall observations, long time series were not considered in this study, and was set as 1, which indicates a one-min DSD sample. In addition, Wang et al. [51] found that the largest contributor to the total surface precipitation was light precipitation (0.066–0.5 mm/h), which accounted for 29.7% of the occurrences over the Southern Ocean. A similar rain rate classification threshold was also adopted in the Western Pacific in which the first rain rate class started at 0.1 mm/h [49]. Therefore, the sample of rain rate in the range of 0.1 to 0.5 mm/h is deemed light precipitation. This indicates that convective rain is rarely measured during the observation period. Therefore, we did not further investigate the convective rainfall characteristics of DSD in this study.
Figure 5 presents the relative frequency distribution histograms of and with three commonly used indexes (mean, standard deviation (SD) and skewness (SK)) retrieved from the whole data, stratiform and light precipitation, respectively. For the whole dataset (Figure 5a), the mean value of and was 1.46 mm and 3.08, respectively. The value of is similar to that in coastal in southern China, whereas the mean value of is lower than that in coastal southern China (3.88) and eastern China (3.55) [11,12]. It may be affected by the rare convective rainfall. For stratiform precipitation, the averaged value of (3.17) was smaller than that in southern China (3.86), indicating a lower concentration of small raindrops over the northern SCS. For light precipitation, the (1.5 mm) and (3.08) also showed close values in the whole data. Furthermore, the standard deviations of and histograms were 0.67 mm and 0.37 for the whole data, which are larger than those over eastern China and southern China, indicating that there is a high variability in and for the dataset. The histogram presented a negative skewedness (−0.81), and on the contrary, the value of exhibited a positive skewedness (1.68 mm). A similar result also can be found in the stratiform and light precipitation. In order to understand the difference in DSDs characteristics over the open oceanic and large island precipitation, these three indexes were also used for comparison in the southern Indian Ocean [35], Palau and Taiwan [49]. The mean values of in stratiform (2.07 mm) and light precipitation (1.5 mm) were significantly higher than those in the southern Indian Ocean (1.13 mm), Palau (1.01 mm) and Taiwan (1.12 mm).
Figure 6 describes the distribution of intercept parameter versus the derived from the SCS and various climatic regimes. It is noteworthy that the values of and in Figure 6 are from stratiform rainfall, since most of them belong to stratiform and light precipitation. Overall, all SCS samples are located within the range of 0.57–5.14 mm and 1.84–3.81. The stratiform of the SCS is apparent, and the samples of the SCS are close to the continental convective precipitation (gray dotted rectangle) proposed by Bringi et al. [16], which is characterized by = 2–2.75 mm and = 3–3.5. For the drop concentration, the SCS has a lower average value than other regions, which is also significantly lower than the Marshall–Palmer model (). The average values of and over the SCS are significantly smaller than but larger than in comparison with those measured in Palau (western north Pacific) [49] and the southern Indian Ocean (3.58) [35].
3.3. Composite Raindrop Spectra
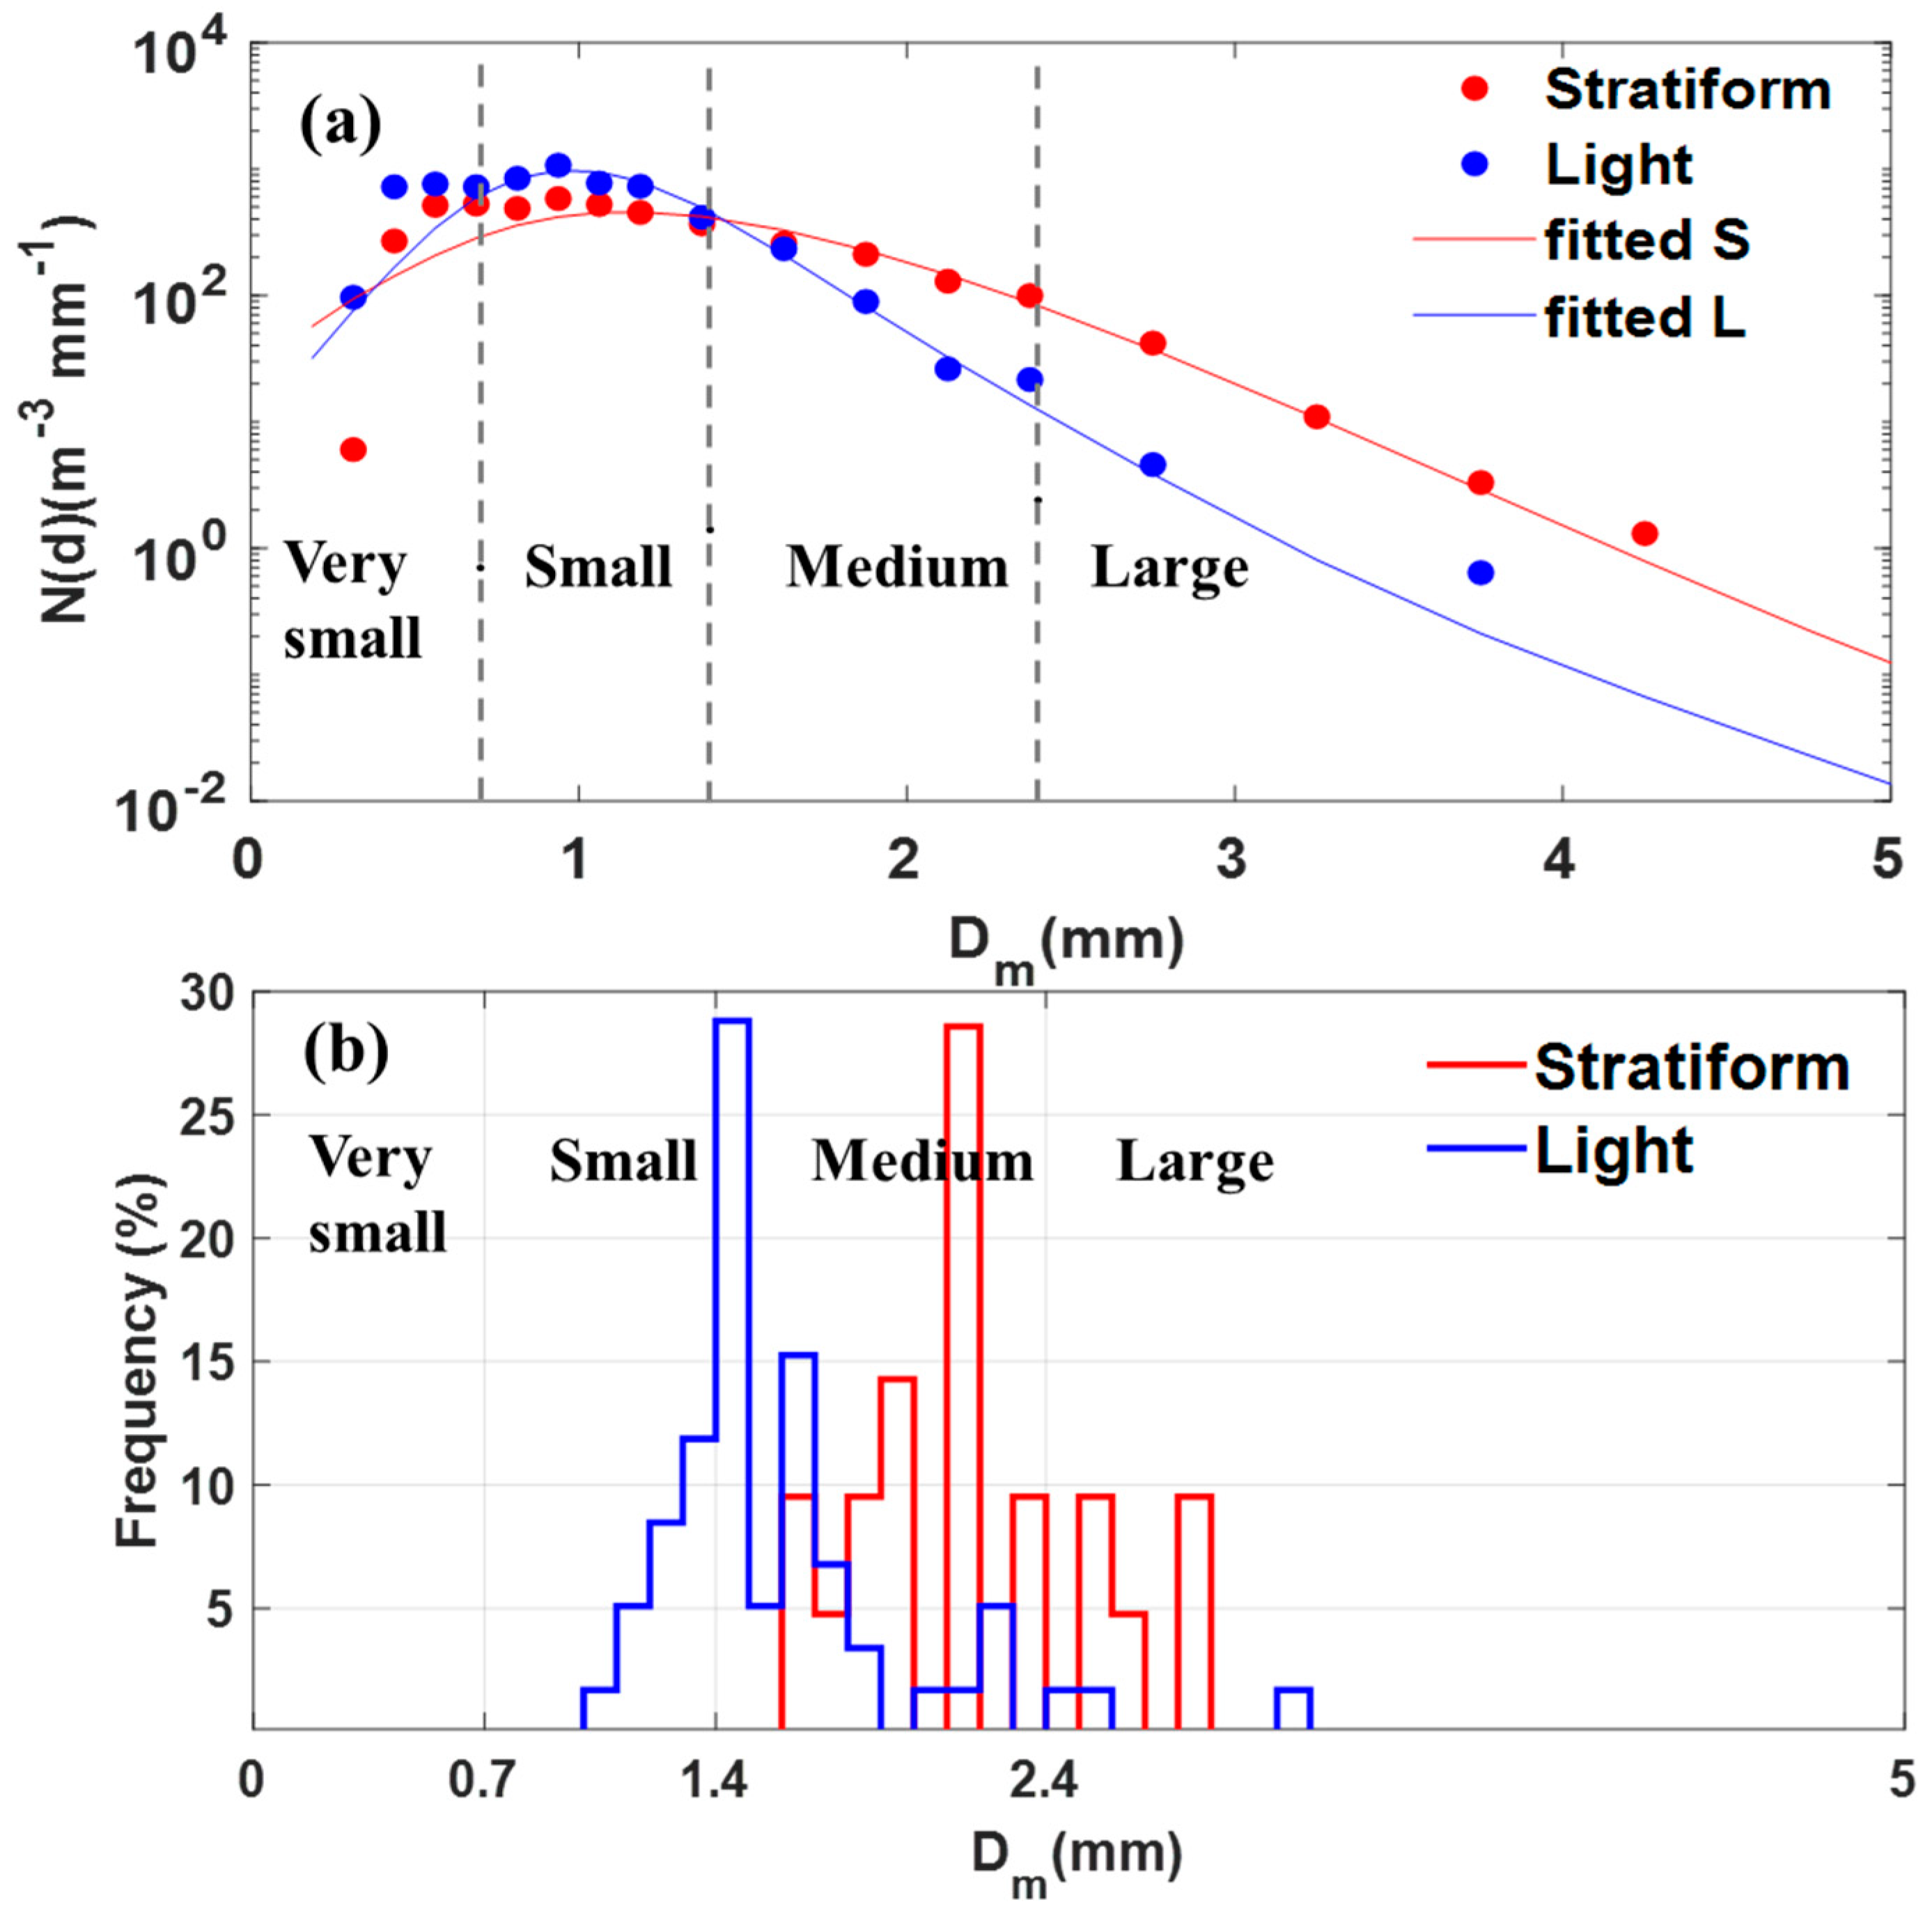
As mentioned earlier, the rainfall DSD has a lower large-sized raindrop concentration for stratiform. Figure 7a presents the mean raindrop spectra of the two different precipitation types; the composite raindrop spectra were derived from the second, fourth and sixth moments of the observed distribution using the method of moment (MM) that was recommended for practical DSD analysis [45]. Figure 7b shows the frequency distribution of diameters based on the stratiform and light rain. Additionally, the diameter range is very small (<0.7 mm), small (0.7–1.4 mm), medium (1.4–2.4 mm) and large (>2.4 mm), which is indicated by vertical solid lines. These raindrop diameter thresholds were adopted by Hopper et al. [52]. In Figure 7a, the gap between the stratiform and light precipitation gradually becomes wider until the raindrop diameter is close to 2.4 mm. This indicates that rare large particles exist in the stratiform and light rainfall. At the small to medium drop diameter, the average drop concentration of light precipitation is higher than stratiform, and the concentration of medium to large-sized raindrops (>1.4 mm) is pronouncedly lower than stratiform. As can be found in Figure 7b, = 1.4 (2.1 mm) has the highest number concentration of light (stratiform) precipitation. This result suggests that the medium-sized drops are prevalent in the stratiform precipitation during the monsoon season. This is potentially affected by the dominant cold rain process during the summer monsoon period [31]. The warm and cold rain process changes in terms of updraft, evaporation, particle formation and growth, thereby influencing the variations of DSD [52,53].
3.4. Shape–Slope (μ-Λ) Relationship
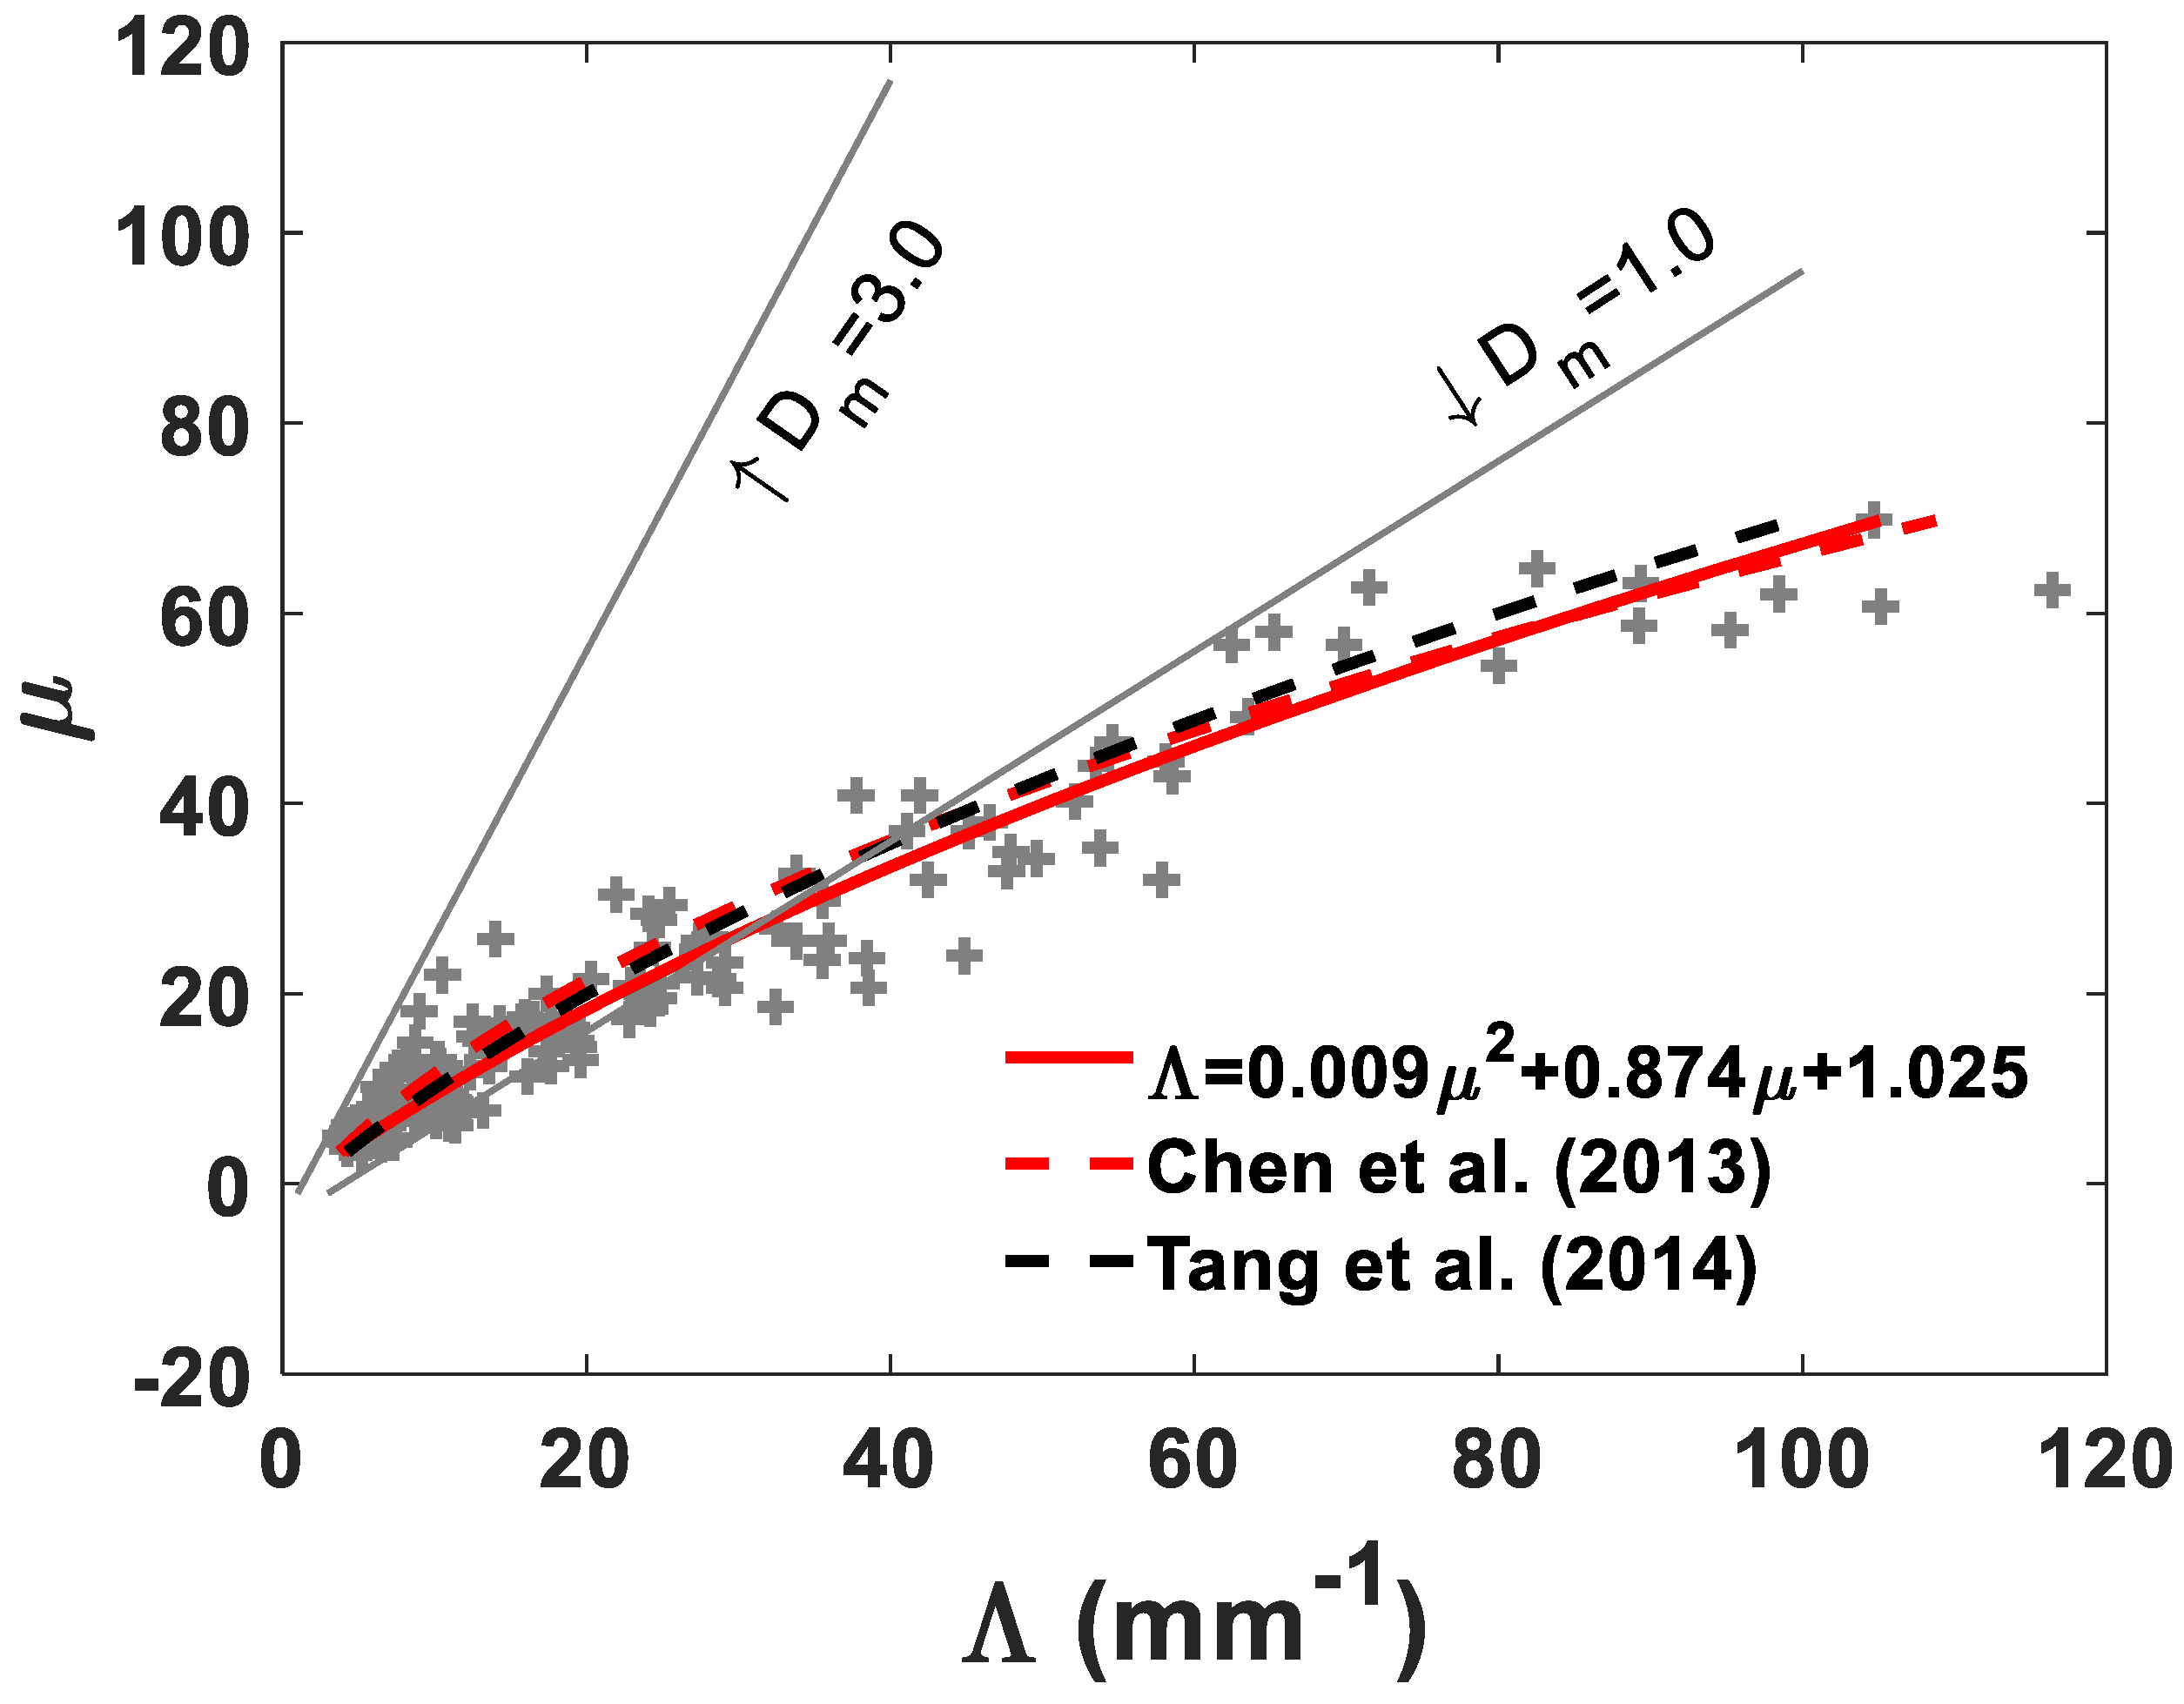
Apart from the statistical characteristic of rainfall results, an empirical -Λ relationship of three-parameter gamma DSD was also computed. The -Λ relationship can be widely used in retrieving and reducing the bias in rain parameters from estimated radar quality and remote measurements. Previous studies have also shown that the - relations vary according to the geographic location, climate, and rain type [32]. An empirical polynomial () of summer DSD samples observed in Florida was proposed by Zhang et al. [32]. Considering the variability of the -Λ relationship across different locations and regimes, we also compared the empirical polynomial in northern China [10] () and eastern China [12] (). Both relationships were based on the disdrometer observations of DSD data with total numbers larger than 1000 and a rain rate higher than 5 mm/h. In order to minimize the error in this study, the -Λ relationships were only calculated when the number of raindrops was over 1000. According to Ulbrich et al. [33] the - relationship can also be represented by the relationship of = 4 + . In Figure 8, the gray line denotes the relationship of = 4 + given the values of = 1.0 and = 3.0. In this study, the truncated moment method was used to fit the -Λ relationship. As shown in Figure 8, the fitting points in the SCS mostly fall within the range of = 1–3 mm, which suggests that the DSDs of stratiform and light rainfall in the SCS have lower . This statement also indicates that the - relationship varies with different locations.
4. Discussion
Previous studies have revealed that the variations in raindrop size characteristics are not stable; rather they are dependent on environmental factors, such as climatic region and terrain. As mentioned, the detail statistical characteristics of DSD measured in the SCS were analyzed using observations from the OTT Parsivel2. The DSD in the SCS showed a lower raindrop concentration and a much greater drop size compared with the southern Indian Ocean and western Pacific Ocean.
However, the number concentration of small drops is important for the numerical modeling of collision and coalescence processes in rainfall microphysics, since it has been shown that collision energy that leads to raindrop oscillation is greatest when larger drops collide with much smaller drops. Small-sized drop concentration is also important for the determination of the shape parameter in the popular gamma model of the DSD. Besides sample size issues discussed in the previous section, the primary sources of error in the DSD measurements result from the under sampling of small drops and calibration errors. Previous studies have suggested that disdrometers, such as Parsivel, 2DVD and JWD, do not capture small drops, which tend not to accurately measure the complete DSD. Instrumental errors in measurements of small drops are common and affect rainfall properties. Accurate and complete measurements of the DSD are important for many studies. An increasing number of efforts are focusing on investigating the DSD characteristics of stratiform or light rain, aiming to accurately measure the complete DSD. Abel et al. [54] compared the variety of cloud types and rainfall rate, and their study found that the exponential distribution with variable intercept and slope parameters better described the precipitation DSD on the range of scales from light drizzle to heavy rainfall. Raupach et al. [2] used the double-moment DSD normalization method to better measure DSD spectra and reduce the bias on low-order moments. Testud et al. [55] found that the normalized shapes of the DSD have significant stability on oceanic and warm clouds.
5. Summary and Conclusions
In this study, the statistical characteristics of DSD during summer monsoon season over the SCS were discussed using one-month (June) observations collected by the OTT-2 Parsivel2 disdrometer aboard the scientific research vessel Shenkuo. A total of 183 min of DSD data were selected for this study. Three indexes, i.e., mean, standard deviation (SD) and skewness (SK), were used to analyze the characteristics of the mass-weighted mean diameter () and normalized intercept parameter () for the rainfall. The major conclusions of this study can be summarized as follows:
- (1)
- The SCS sees a high-frequency occurrence of rainy day, while light daily rainfall is more prevalent during the summer monsoon period.
- (2)
- The diurnal variation of DSD is less pronounced in the SCS, likely due to few convective activities over the open ocean.
- (3)
- The histograms of all datasets show a positive skewedness, whereas the histograms are negatively skewed. Meanwhile, there is a high variability in and for the raindrop observations.
- (4)
- Classification of SCS rainfall into stratiform and light precipitation found a lower drop concentration than other regions. The SCS’s stratiform precipitation is similar to the continental convective of Bringi et al. [16].
- (5)
- Medium and large-sized drops existed in the stratiform precipitation, which is potentially affected by the dominant cold rain process during the monsoon season over the SCS.
- (6)
- The - relationship derived from a truncated moment method over the SCS is similar to that in northern and eastern China, and raindrops over the SCS have smaller values than those in Florida. The rainfall over the SCS primarily composed of stratiform and light precipitation, with a relatively higher concentration of large raindrops in stratiform precipitation compared with other regions. This study attempts to investigate the microphysical characteristics of DSD in the SCS. Given the short observation time, the results of this study are still-limited to the precipitation samples and do not cover the entire SCS. The characteristics of DSD in the SCS could serve as a reference for measuring the small-sized drops and improving the algorithm of precipitation in NASA GPM in the open ocean. Further research will focus on the deep investigation of convective rain type over the SCS. More work is underway to prepare for a new field campaign in the coming scientific expedition over the SCS in the summer of 2021, and a further understanding of the DSD characteristics over China is expected in the near future.
Author Contributions
All authors collaborated to conduct this work; S.C. conceived and designed the content of this paper; S.C. designed the deployment of the disdrometer; A.Z. and C.H. set up the disdrometer and processed the data; S.C. and A.Z. contributed to the development of the DSD analysis programs; S.C. and Y.P. reviewed and revised the manuscript; C.H. performed the DSD analysis and wrote the manuscript. All authors have read and agreed to the published version of the manuscript.
Funding
This research was funded by the National Natural Science Foundation of China (no. 41875182), Guangzhou Science and Technology plan projects (no. 201904010162), Sun Yat-sen University “100 Top Talents Program” (no. 74110-18841203), International Program for Ph.D. Candidates at Sun Yat-sen University and GRMC2020Z03.
Acknowledgments
Thanks are given to Rong Fang from the School of Atmospheric Sciences, Sun Yat-sen University, and Zhenqing Liang from the Nanning Normal University for their helps to setting up the OTT-2 distrometer on the vessel Shenkuo. I also appreciate the help from my parents and friends who give me so much encouragement in my life.
Conflicts of Interest
The authors declare no conflict of interest.
References
- Zhang, G.; Sun, J.; Brandes, E.A. Improving Parameterization of Rain Microphysics with Disdrometer and Radar Observations. J. Atmos. Sci. 2006, 63, 1273–1290. [Google Scholar] [CrossRef] [Green Version]
- Raupach, T.H.; Thurai, M.; Bringi, V.N.; Berne, A. Reconstructing the Drizzle Mode of the Raindrop Size Distribution Using Double-Moment Normalization. J. Appl. Meteorol. Clim. 2019, 58, 145–164. [Google Scholar] [CrossRef]
- Uijlenhoet, R.; Torres, D.S. Measurement and parameterization of rainfall microstructure. J. Hydrol. 2006, 328, 1–7. [Google Scholar] [CrossRef]
- Sun, J. Initialization and Numerical Forecasting of a Supercell Storm Observed during STEPS. Mon. Weather Rev. 2005, 133, 793–813. [Google Scholar] [CrossRef]
- Marzano, F.S.; Cimini, D.; Montopoli, M. Investigating precipitation microphysics using ground-based microwave remote sensors and disdrometer data. Atmos. Res. 2010, 97, 583–600. [Google Scholar] [CrossRef]
- You, C.-H.; Kang, M.-Y.; Lee, D.-I.; Uyeda, H. Rainfall estimation by S-band polarimetric radar in Korea. Part I: Preprocessing and preliminary results. Meteorol. Appl. 2014, 21, 975–983. [Google Scholar] [CrossRef]
- Wen, G.; Xiao, H.; Yang, H.; Bi, Y.; Xu, W. Characteristics of summer and winter precipitation over northern China. Atmos. Res. 2017, 197, 390–406. [Google Scholar] [CrossRef]
- Bruintjes, R.T. A review of cloud seeding experiments to enhance precipitation and some new prospects. Bull. Am. Meteorol. Soc. 1999, 80, 805–820. [Google Scholar] [CrossRef] [Green Version]
- Ulbrich, C.W.; Atlas, D. Microphysics of Raindrop Size Spectra: Tropical Continental and Maritime Storms. J. Appl. Meteorol. Clim. 2007, 46, 1777–1791. [Google Scholar] [CrossRef]
- Tang, Q.; Xiao, H.; Guo, C.; Feng, L. Characteristics of the raindrop size distributions and their retrieved polarimetric radar parameters in northern and southern China. Atmos. Res. 2014, 135–136, 59–75. [Google Scholar] [CrossRef]
- Zhang, A.; Hu, J.; Chen, S.; Hu, D.; Liang, Z.; Huang, C.; Xiao, L.; Min, C.; Li, H. Statistical Characteristics of Raindrop Size Distribution in the Monsoon Season Observed in Southern China. Remote Sens. 2019, 11, 432. [Google Scholar] [CrossRef] [Green Version]
- Chen, B.; Yang, J.; Pu, J. Statistical Characteristics of Raindrop Size Distribution in the Meiyu Season Observed in Eastern China. J. Meteorol. Soc. Jpn. 2013, 91, 215–227. [Google Scholar] [CrossRef] [Green Version]
- Chen, B.; Hu, Z.; Liu, L.; Zhang, G. Raindrop Size Distribution Measurements at 4500 m on the Tibetan Plateau during TIPEX-III. J. Geophys. Res. Atmos. 2017, 122, 11092–11106. [Google Scholar] [CrossRef]
- Zwiebel, J.; Van Baelen, J.; Anquetin, S.; Pointin, Y.; Boudevillain, B. Impacts of orography and rain intensity on rainfall structure. The case of the HyMeX IOP7a event. Q. J. R. Meteorol. Soc. 2015, 142, 310–319. [Google Scholar] [CrossRef]
- Tenório, R.S.; Moraes, M.C.D.S.; Sauvageot, H. Raindrop Size Distribution and Radar Parameters in Coastal Tropical Rain Systems of Northeastern Brazil. J. Appl. Meteorol. Clim. 2012, 51, 1960–1970. [Google Scholar] [CrossRef]
- Bringi, V.N.; Chandrasekar, V.; Hubbert, J.; Gorgucci, E.; Randeu, W.L.; Schoenhuber, M. Raindrop Size Distribution in Different Climatic Regimes from Disdrometer and Dual-Polarized Radar Analysis. J. Atmos. Sci. 2003, 60, 354–365. [Google Scholar] [CrossRef]
- Sharma, S.; Konwar, M.; Sarma, D.K.; Kalapureddy, M.C.R.; Jain, A.R. Characteristics of Rain Integral Parameters during Tropical Convective, Transition, and Stratiform Rain at Gadanki and Its Application in Rain Retrieval. J. Appl. Meteorol. Clim. 2009, 48, 1245–1266. [Google Scholar] [CrossRef] [Green Version]
- Deo, A.; Walsh, K.J. Contrasting tropical cyclone and non-tropical cyclone related rainfall drop size distribution at Darwin, Australia. Atmos. Res. 2016, 181, 81–94. [Google Scholar] [CrossRef]
- Chandrasekar, V.; Meneghini, R.; Zawadzki, I. Global and Local Precipitation Measurements by Radar. Meteorol. Monogr. 2003, 30, 215. [Google Scholar] [CrossRef]
- Löffler-Mang, M.; Joss, J. An Optical Disdrometer for Measuring Size and Velocity of Hydrometeors. J. Atmos. Ocean. Technol. 2000, 17, 130–139. [Google Scholar] [CrossRef]
- Joss, J.; Waldvogel, A. Ein spektrograph für niederschlagstropfen mit automatischer auswertung. Pure Appl. Geophys. 1967, 68, 240–246. [Google Scholar] [CrossRef]
- Waldvogel, A. TheN0Jump of Raindrop Spectra. J. Atmos. Sci. 1974, 31, 1067–1078. [Google Scholar] [CrossRef] [Green Version]
- Schönhuber, M.; Lammer, G.; Randeu, W.L. One decade of imaging precipitation measurement by 2D-video-distrometer. Adv. Geosci. 2007, 10, 85–90. [Google Scholar] [CrossRef] [Green Version]
- Tokay, A.; Kruger, A.; Krajewski, W.F. Comparison of Drop Size Distribution Measurements by Impact and Optical Disdrometers. J. Appl. Meteorol. 2001, 40, 2083–2097. [Google Scholar] [CrossRef]
- Miriovsky, B.J.; Bradley, A.; Eichinger, W.E.; Krajewski, W.F.; Kruger, A.; Nelson, B.R.; Creutin, J.-D.; Lapetite, J.-M.; Lee, G.; Zawadzki, I.; et al. An Experimental Study of Small-Scale Variability of Radar Reflectivity Using Disdrometer Observations. J. Appl. Meteorol. 2004, 43, 106–118. [Google Scholar] [CrossRef]
- Thurai, M.; Petersen, W.A.; Tokay, A.; Schultz, C.; Gatlin, P. Drop size distribution comparisons between Parsivel and 2-D video disdrometers. Adv. Geosci. 2011, 30, 3–9. [Google Scholar] [CrossRef] [Green Version]
- Tao, S.Y.; Chen, L.X. A Review of Recent Research on the East Asian Summer Monsoon in China. In Monsoon Meteorology; Oxford University Press: Oxford, UK, 1987. [Google Scholar]
- Lau, K.M.; Ding, Y.; Wang, J.T.; Johnson, R.; Keenan, T.; Cifelli, R.; Gerlach, J.; Thieleandamp, O.; Rickenbach, T.; Tsay, S.-C. A Report of the Field Operations and Early Results of the South China Sea Monsoon Experiment (SCSMEX). Bull. Am. Meteorol. Soc. 2000, 81, 1261–1270. [Google Scholar] [CrossRef] [Green Version]
- Duncan, D.I.; Eriksson, P.; Pfreundschuh, S.; Klepp, C.; Jones, D.C. On the distinctiveness of observed oceanic raindrop distributions. Atmos. Chem. Phys. Discuss. 2019, 19, 6969–6984. [Google Scholar] [CrossRef] [Green Version]
- Tokay, A.; D’Adderio, L.P.; Wolff, D.B.; Petersen, W.A. Development and Evaluation of the Raindrop Size Distribution Parameters for the NASA Global Precipitation Measurement Mission Ground Validation Program. J. Atmos. Ocean. Technol. 2020, 37, 115–128. [Google Scholar] [CrossRef]
- Zeng, Q.; Zhang, Y.; Lei, H.; Xie, Y.; Gao, T.; Zhang, L.; Wang, C.; Huang, Y. Microphysical Characteristics of Precipitation during Pre-monsoon, Monsoon, and Post-monsoon Periods over the South China Sea. Adv. Atmos. Sci. 2019, 36, 1103–1120. [Google Scholar] [CrossRef]
- Zhang, G.; Vivekanandan, J.; Brandes, E.A.; Meneghini, R.; Kozu, T. The Shape–Slope Relation in Observed Gamma Raindrop Size Distributions: Statistical Error or Useful Information? J. Atmos. Ocean. Technol. 2003, 20, 1106–1119. [Google Scholar] [CrossRef] [Green Version]
- Ulbrich, C.W. Natural variations in the analytical form of the raindrop size distribution. J. Clim. Appl. Meteorol. 1983, 22, 1764–1775. [Google Scholar] [CrossRef] [Green Version]
- Huo, Z.; Ruan, Z.; Wei, M.; Ge, R.; Li, F.; Ruan, Y. Statistical characteristics of raindrop size distribution in south China summer based on the vertical structure derived from VPR-CFMCW. Atmos. Res. 2019, 222, 47–61. [Google Scholar] [CrossRef]
- Hashiguchi, H.; Vonnisa, M.; Katsumata, M. Determination of Intraseasonal Variation of Precipitation Microphysics in the Southern Indian Ocean from Joss–Waldvogel Disdrometer Observation during the CINDY Field Campaign. Adv. Atmos. Sci. 2018, 35, 1415–1427. [Google Scholar] [CrossRef]
- Klepp, C. measurement network for surface validation—OceanRAIN. Atmos. Res. 2015, 163, 74–90. [Google Scholar] [CrossRef]
- Liao, L.; Meneghini, R.; Tokay, A. Uncertainties of GPM DPR Rain Estimates Caused by DSD Parameterizations. J. Appl. Meteorol. Clim. 2014, 53, 2524–2537. [Google Scholar] [CrossRef] [Green Version]
- Chandrasekar, V.; Le, M. Evaluation of profile classification module of GPM-DPR algorithm after launch. In Proceedings of the 2015 IEEE International Geoscience and Remote Sensing Symposium (IGARSS), Milan, Italy, 26–31 July 2015; pp. 5174–5177. [Google Scholar]
- Tokay, A.; Wolff, D.B.; Petersen, W.A. Evaluation of the New Version of the Laser-Optical Disdrometer, OTT Parsivel. J. Atmos. Ocean. Technol. 2014, 31, 1276–1288. [Google Scholar] [CrossRef]
- Yuter, S.E.; Kingsmill, D.; Nance, L.B.; Löffler-Mang, M. Observations of Precipitation Size and Fall Speed Characteristics within Coexisting Rain and Wet Snow. J. Appl. Meteorol. Clim. 2006, 45, 1450–1464. [Google Scholar] [CrossRef] [Green Version]
- Bumke, K.; Seltmann, J. Analysis of Measured Drop Size Spectra over Land and Sea. ISRN Meteorol. 2012, 2012, 1–10. [Google Scholar] [CrossRef] [Green Version]
- Tokay, A.; Bashor, P.G. An experimental study of small-scale variability of raindrop size distribution. J. Appl. Meteorol. Clim. 2010, 49, 2348–2365. [Google Scholar] [CrossRef]
- Chen, H.; Chandrasekar, V.; Bechini, R. An Improved Dual-Polarization Radar Rainfall Algorithm (DROPS2.0): Application in NASA IFloodS Field Campaign. J. Hydrometeorol. 2017, 18, 917–937. [Google Scholar] [CrossRef]
- Atlas, D.; Srivastava, R.C.; Sekhon, R.S. Doppler radar characteristics of precipitation at vertical incidence. Rev. Geophys. 1973, 11, 1–35. [Google Scholar] [CrossRef]
- Cao, Q.; Zhang, G. Errors in Estimating Raindrop Size Distribution Parameters Employing Disdrometer and Simulated Raindrop Spectra. J. Appl. Meteorol. Clim. 2009, 48, 406–425. [Google Scholar] [CrossRef]
- Yang, S.; Smith, E.A. Convective–Stratiform Precipitation Variability at Seasonal Scale from 8 Yr of TRMM Observations: Implications for Multiple Modes of Diurnal Variability. J. Clim. 2008, 21, 4087–4114. [Google Scholar] [CrossRef]
- Yang, S.; Smith, E.A. Mechanisms for Diurnal Variability of Global Tropical Rainfall Observed from TRMM. J. Clim. 2006, 19, 5190–5226. [Google Scholar] [CrossRef] [Green Version]
- Gray, W.M.; Jacobson, R.W. Diurnal Variation of Deep Cumulus Convection. Mon. Weather Rev. 1977, 105, 1171–1188. [Google Scholar] [CrossRef]
- Seela, B.K.; Janapati, J.; Lin, P.-L.; Reddy, K.K.; Shirooka, R.; Wang, P.K. A Comparison Study of Summer Season Raindrop Size Distribution between Palau and Taiwan, Two Islands in Western Pacific. J. Geophys. Res. Atmos. 2017, 122, 11–787. [Google Scholar] [CrossRef]
- Nitta, T.; Sekine, S. Diurnal Variation of Convective Activity over the Tropical Western Pacific. J. Meteorol. Soc. Jpn. 1994, 72, 627–641. [Google Scholar] [CrossRef] [Green Version]
- Wang, Z.; Siems, S.; Belušić, D.; Manton, M.J.; Huang, Y. A Climatology of the Precipitation over the Southern Ocean as Observed at Macquarie Island. J. Appl. Meteorol. Clim. 2015, 54, 2321–2337. [Google Scholar] [CrossRef]
- Hopper, J.L.J.; Schumacher, C.; Humes, K.; Funk, A. Drop-Size Distribution Variations Associated with Different Storm Types in Southeast Texas. Atmosphere 2019, 11, 8. [Google Scholar] [CrossRef] [Green Version]
- Rosenfeld, D.; Ulbrich, C.W. Cloud Microphysical Properties, Processes, and Rainfall Estimation Opportunities. In Radar and Atmospheric Science: A Collection of Essays in Honor of David Atlas; American Meteorological Society: Boston, MA, USA, 2003; pp. 237–258. [Google Scholar]
- Abel, S.; Boutle, I. An improved representation of the raindrop size distribution for single-moment microphysics schemes. Q. J. R. Meteorol. Soc. 2012, 138, 2151–2162. [Google Scholar] [CrossRef]
- Testud, J.; Oury, S.; Black, R.; Amayenc, P.; Dou, X. The Concept of “Normalized” Distribution to Describe Raindrop Spectra: A Tool for Cloud Physics and Cloud Remote Sensing. J. Appl. Meteorol. 2001, 40, 1118–1140. [Google Scholar] [CrossRef]
Figure 1.
(a) The vessel route of Shenkuo over SCS. (b) The scientific expedition vessel of Shenkuo.
Figure 1.
(a) The vessel route of Shenkuo over SCS. (b) The scientific expedition vessel of Shenkuo.

Figure 2.
Daily rainfall amount over SCS.

Figure 3.
Time series of the frequency of occurrence of hourly rainfall events. x label is the time series of the precipitation occurrence; y label means the length of the axis is 24 h. The color bar indicates the number of rainfall events, the unit is min.
Figure 3.
Time series of the frequency of occurrence of hourly rainfall events. x label is the time series of the precipitation occurrence; y label means the length of the axis is 24 h. The color bar indicates the number of rainfall events, the unit is min.

Figure 4.
The time series of the DSDs over the northern SCS. (a) The logarithmic number of the drops concentration and the mass-weighted mean diameter . (b) The rainfall rate (R).
Figure 4.
The time series of the DSDs over the northern SCS. (a) The logarithmic number of the drops concentration and the mass-weighted mean diameter . (b) The rainfall rate (R).

Figure 5.
Histogram of (gray region) and (black region) for the (a) whole dataset, (b) stratiform precipitation, and (c) light precipitation, respectively.
Figure 5.
Histogram of (gray region) and (black region) for the (a) whole dataset, (b) stratiform precipitation, and (c) light precipitation, respectively.

Figure 6.
The mean value of versus mean for stratiform rain with their respective stand deviations () of . The points below the dotted line represent stratiform rain, while the points above the line represent convective rain. The outlined rectangles correspond to the maritime and continental convective clusters. The green solid line is the least squares fit based on the stratiform rain. Abbreviations are explained in the text.

Figure 7.
(a) Composite raindrop spectra for the stratiform and light precipitation; (b) frequency distribution of .
Figure 7.
(a) Composite raindrop spectra for the stratiform and light precipitation; (b) frequency distribution of .

Figure 8.
Scatter plot of - values for all samples. The gray lines correspond to the relationship = 4 + given the values of = 1.0 and = 3.0.
Figure 8.
Scatter plot of - values for all samples. The gray lines correspond to the relationship = 4 + given the values of = 1.0 and = 3.0.


Table 1.
Time periods used in this study, the and mean of each time period.
| Time (BJT) | No. of Samples | ||
|---|---|---|---|
| 20190611 | 30 | 2.20 | 3.31 |
| 20190614 | 45 | 7.49 | 5.14 |
| 20190618 | 30 | 3.37 | 1.57 |
| 20190619 | 74 | 4.75 | 2.73 |
| 20190620 | 15 | 0.50 | 1.30 |
| 20190622 | 9 | 4.49 | 2.33 |
Publisher’s Note: MDPI stays neutral with regard to jurisdictional claims in published maps and institutional affiliations. |
© 2021 by the authors. Licensee MDPI, Basel, Switzerland. This article is an open access article distributed under the terms and conditions of the Creative Commons Attribution (CC BY) license (https://creativecommons.org/licenses/by/4.0/).
Share and Cite
MDPI and ACS Style
Huang, C.; Chen, S.; Zhang, A.; Pang, Y. Statistical Characteristics of Raindrop Size Distribution in Monsoon Season over South China Sea. Remote Sens. 2021, 13, 2878. https://0-doi-org.brum.beds.ac.uk/10.3390/rs13152878
AMA Style
Huang C, Chen S, Zhang A, Pang Y. Statistical Characteristics of Raindrop Size Distribution in Monsoon Season over South China Sea. Remote Sensing. 2021; 13(15):2878. https://0-doi-org.brum.beds.ac.uk/10.3390/rs13152878
Chicago/Turabian StyleHuang, Chaoying, Sheng Chen, Asi Zhang, and Ying Pang. 2021. "Statistical Characteristics of Raindrop Size Distribution in Monsoon Season over South China Sea" Remote Sensing 13, no. 15: 2878. https://0-doi-org.brum.beds.ac.uk/10.3390/rs13152878
Note that from the first issue of 2016, this journal uses article numbers instead of page numbers. See further details here.