
Impact of Urban Expansion on Rain Island Effect in Jinan City, North China

1
Key Laboratory of Water Cycle and Related Land Surface Processes, Institute of Geographic Sciences and Natural Resources Research, Chinese Academy of Sciences, Beijing 100101, China
2
University of Chinese Academy of Sciences, Beijing 100049, China
3
Beijing Key Laboratory of Urban Hydrological Cycle and Sponge City Technology, College of Water Sciences, Beijing Normal University, Beijing 100875, China
4
State Key Laboratory of Water Resources and Hydropower Engineering Science, Wuhan University, Wuhan 430072, China
5
Key Laboratory of Ecosystem Network Observation and Modeling, Institute of Geographic Sciences and Natural Resources Research, Chinese Academy of Sciences, Beijing 100101, China
*
Author to whom correspondence should be addressed.
Remote Sens. 2021, 13(15), 2989; https://0-doi-org.brum.beds.ac.uk/10.3390/rs13152989
Submission received: 10 June 2021
/
Revised: 24 July 2021
/
Accepted: 26 July 2021
/
Published: 29 July 2021
(This article belongs to the Special Issue Advances to GIS for Sensing of Earth and Human Interaction)
Abstract
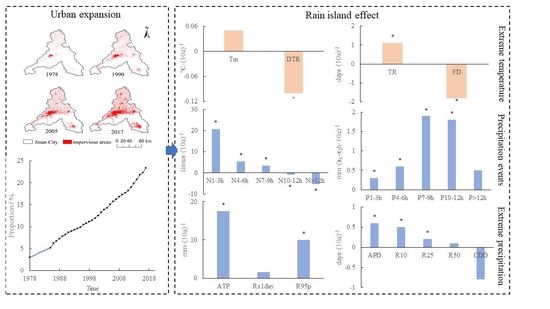
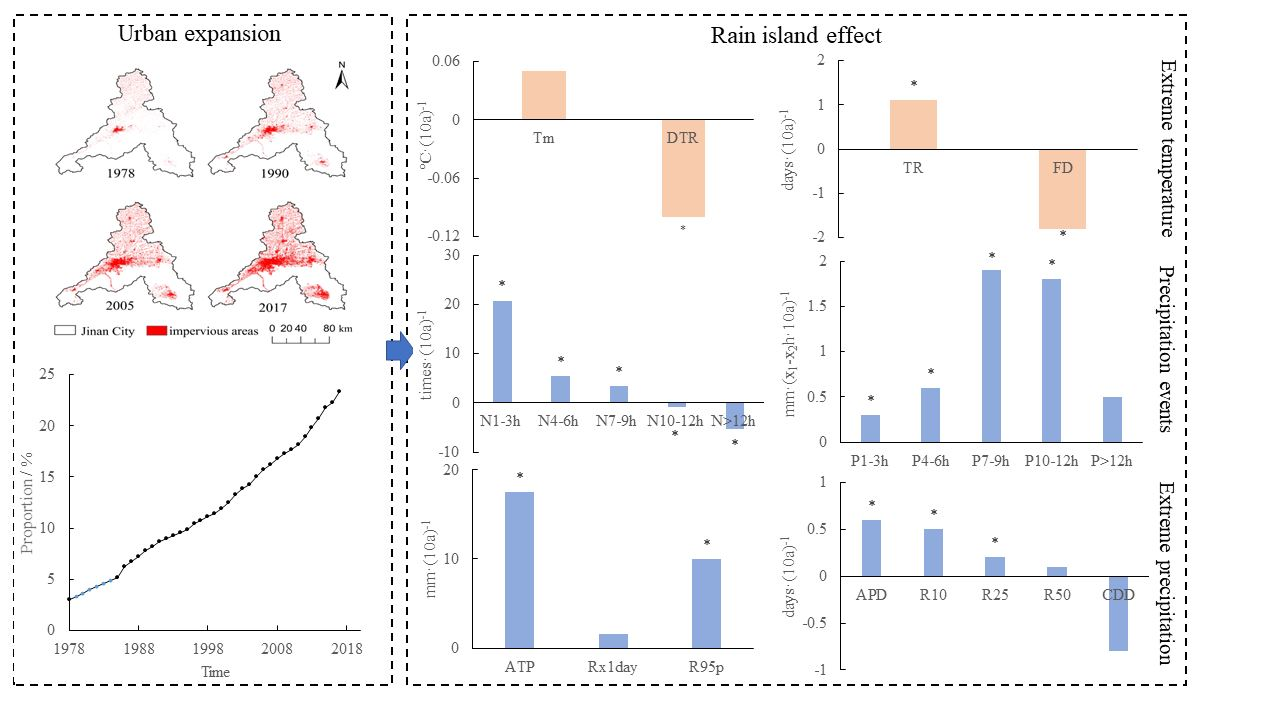
:Rapid urbanization leads to changes in urban micro meteorology, such as the urban heat island effect and rain island effect, which eventually brings about urban waterlogging and other problems. In this study, the data of precipitation, temperatures and impervious surfaces with long series and high resolution are used to study the rain island effect in Jinan City, China. MK-Sen’s slope estimator, Pettitt test and Pearson correlation analysis are used to quantitatively analyze the impact of urban expansion on extreme climate indices. The results show that Jinan City has experienced rapid urbanization since the 1978 economic reform, and the impervious surface areas have increased from 311.68 km2 (3.04%) in 1978 to 2389.50 km2 (23.33%) in 2017. Urban expansion has a significant impact on temperature, with large variations in extreme temperature indices over the intensive construction area relative to the sparse construction area. The extreme temperature indices have a significant correlation with impervious surfaces. Jinan City shows a certain degree of rain island effect, which seems to be spatially correlated with the urban heat island effect. The frequency of short-duration precipitation events significantly increases and the intensity of precipitation events generally increases. The magnitude and frequency of extreme precipitation indices in the intensive construction area significantly increase when compared to that in the sparse construction area, and they have a significant correlation with impervious surfaces. There is a tendency that Jinan City’s rainfall center moves towards to the intensive construction area.
1. Introduction
Urbanization is commonly pursued by all countries to achieve social and economic modernization. In 2018, 55% of the world’s population was recorded to live in urban areas, a proportion that is expected to increase to 68% by 2050, and it is expected that the growth of the world’s urban population will be highly concentrated in a few countries, such as China, India and Nigeria [1]. By 2030, more than 70% of China’s population is expected to live in metropolitan areas [2]. Urbanization inevitably leads to variations in near-surface material and energy balance and affects local atmospheric circulations [3]. The analysis of regional climate change caused by urban expansion has been the subject of numerous studies in the past decade [4,5].
The impact of urbanization on regional climate is due to variations in atmospheric thermal, dynamic and chemical components [6,7]. The formation of urban rainfall is dominated by urban heat island, changes in surface roughness and aerosol emissions coupled with regional topography and climate features [8,9,10,11,12,13]. Shepherd and Burian pointed out that the urban heat island effect has an important influence on precipitation anomalies [14]. Ganeshan found that the amount and frequency of precipitation in urban centers and downwind areas were often greater than those of surrounding areas [15]. Miao used the WRF model to analyze the influence of urbanization on summer precipitation and concluded that the change in precipitation depended on the degree of urbanization [16]. Yang et al. indicated that inland wind enhances the formation of a convergence zone, leading to an increase in heavy rainfall in the Milwaukee–Lake Michigan region [17]. Li and Ma observed that the city effect was obvious for local heavy precipitation and large-scale weak precipitation events, but not for large-scale heavy precipitation events [18].
Rapid urbanization has led to serious urban problems, such as urban waterlogging, landslide hazard and environmental degradation, which threaten social stability, economic development and human health [19]. Land urbanization changes the regional hydrological conditions and reduces the stability of slopes, increasing the severity and frequency of natural disasters [20,21]. From 2003 to 2014, there were 288,946 places with geological disasters (including landslides, ground cracks and land subsidence) that caused economic losses of about USD 870 million and 9560 casualties in China [22]. The change in urban micrometeorology has become a growing concern, and extreme precipitation and extreme temperature represent the key factors that influence it [23,24]. The mechanisms of how urbanization induces extreme precipitation are still poorly understood, most of which are deduced from differences in precipitation between urban and rural areas using data from numerical models, ground stations or satellites [25,26]. At present, most studies focus on the indicators connected with precipitation intensity, but there are still shortcomings in analyzing the regional patterns of extreme precipitation [27].
Jinan City, the capital of Shandong Province, is an important intersection between the Bohai Rim Economic Zone and the Beijing–Shanghai Economic Axis [28]. Its water security is of great significance to the ecological protection and high-quality development of the Yellow River basin. With the rapid urbanization development in Jinan City, the urban climate conditions have changed, and urban flash flooding has become an increasingly serious issue. The data of precipitation, temperature and impervious surfaces with long series and high resolution are used to study the spatio-temporal evolution of temperature and precipitation and their correlation with urbanization in Jinan City. The quantitative impact of the urbanization on air temperature and precipitation is analyzed, and the “urban rain island effect” in Jinan City is analyzed in depth. The knowledge on the contribution of urbanization to rainfall is of great practical significance to the water security strategy in Jinan City.
2. Materials and Methods Description
2.1. Study Area Description
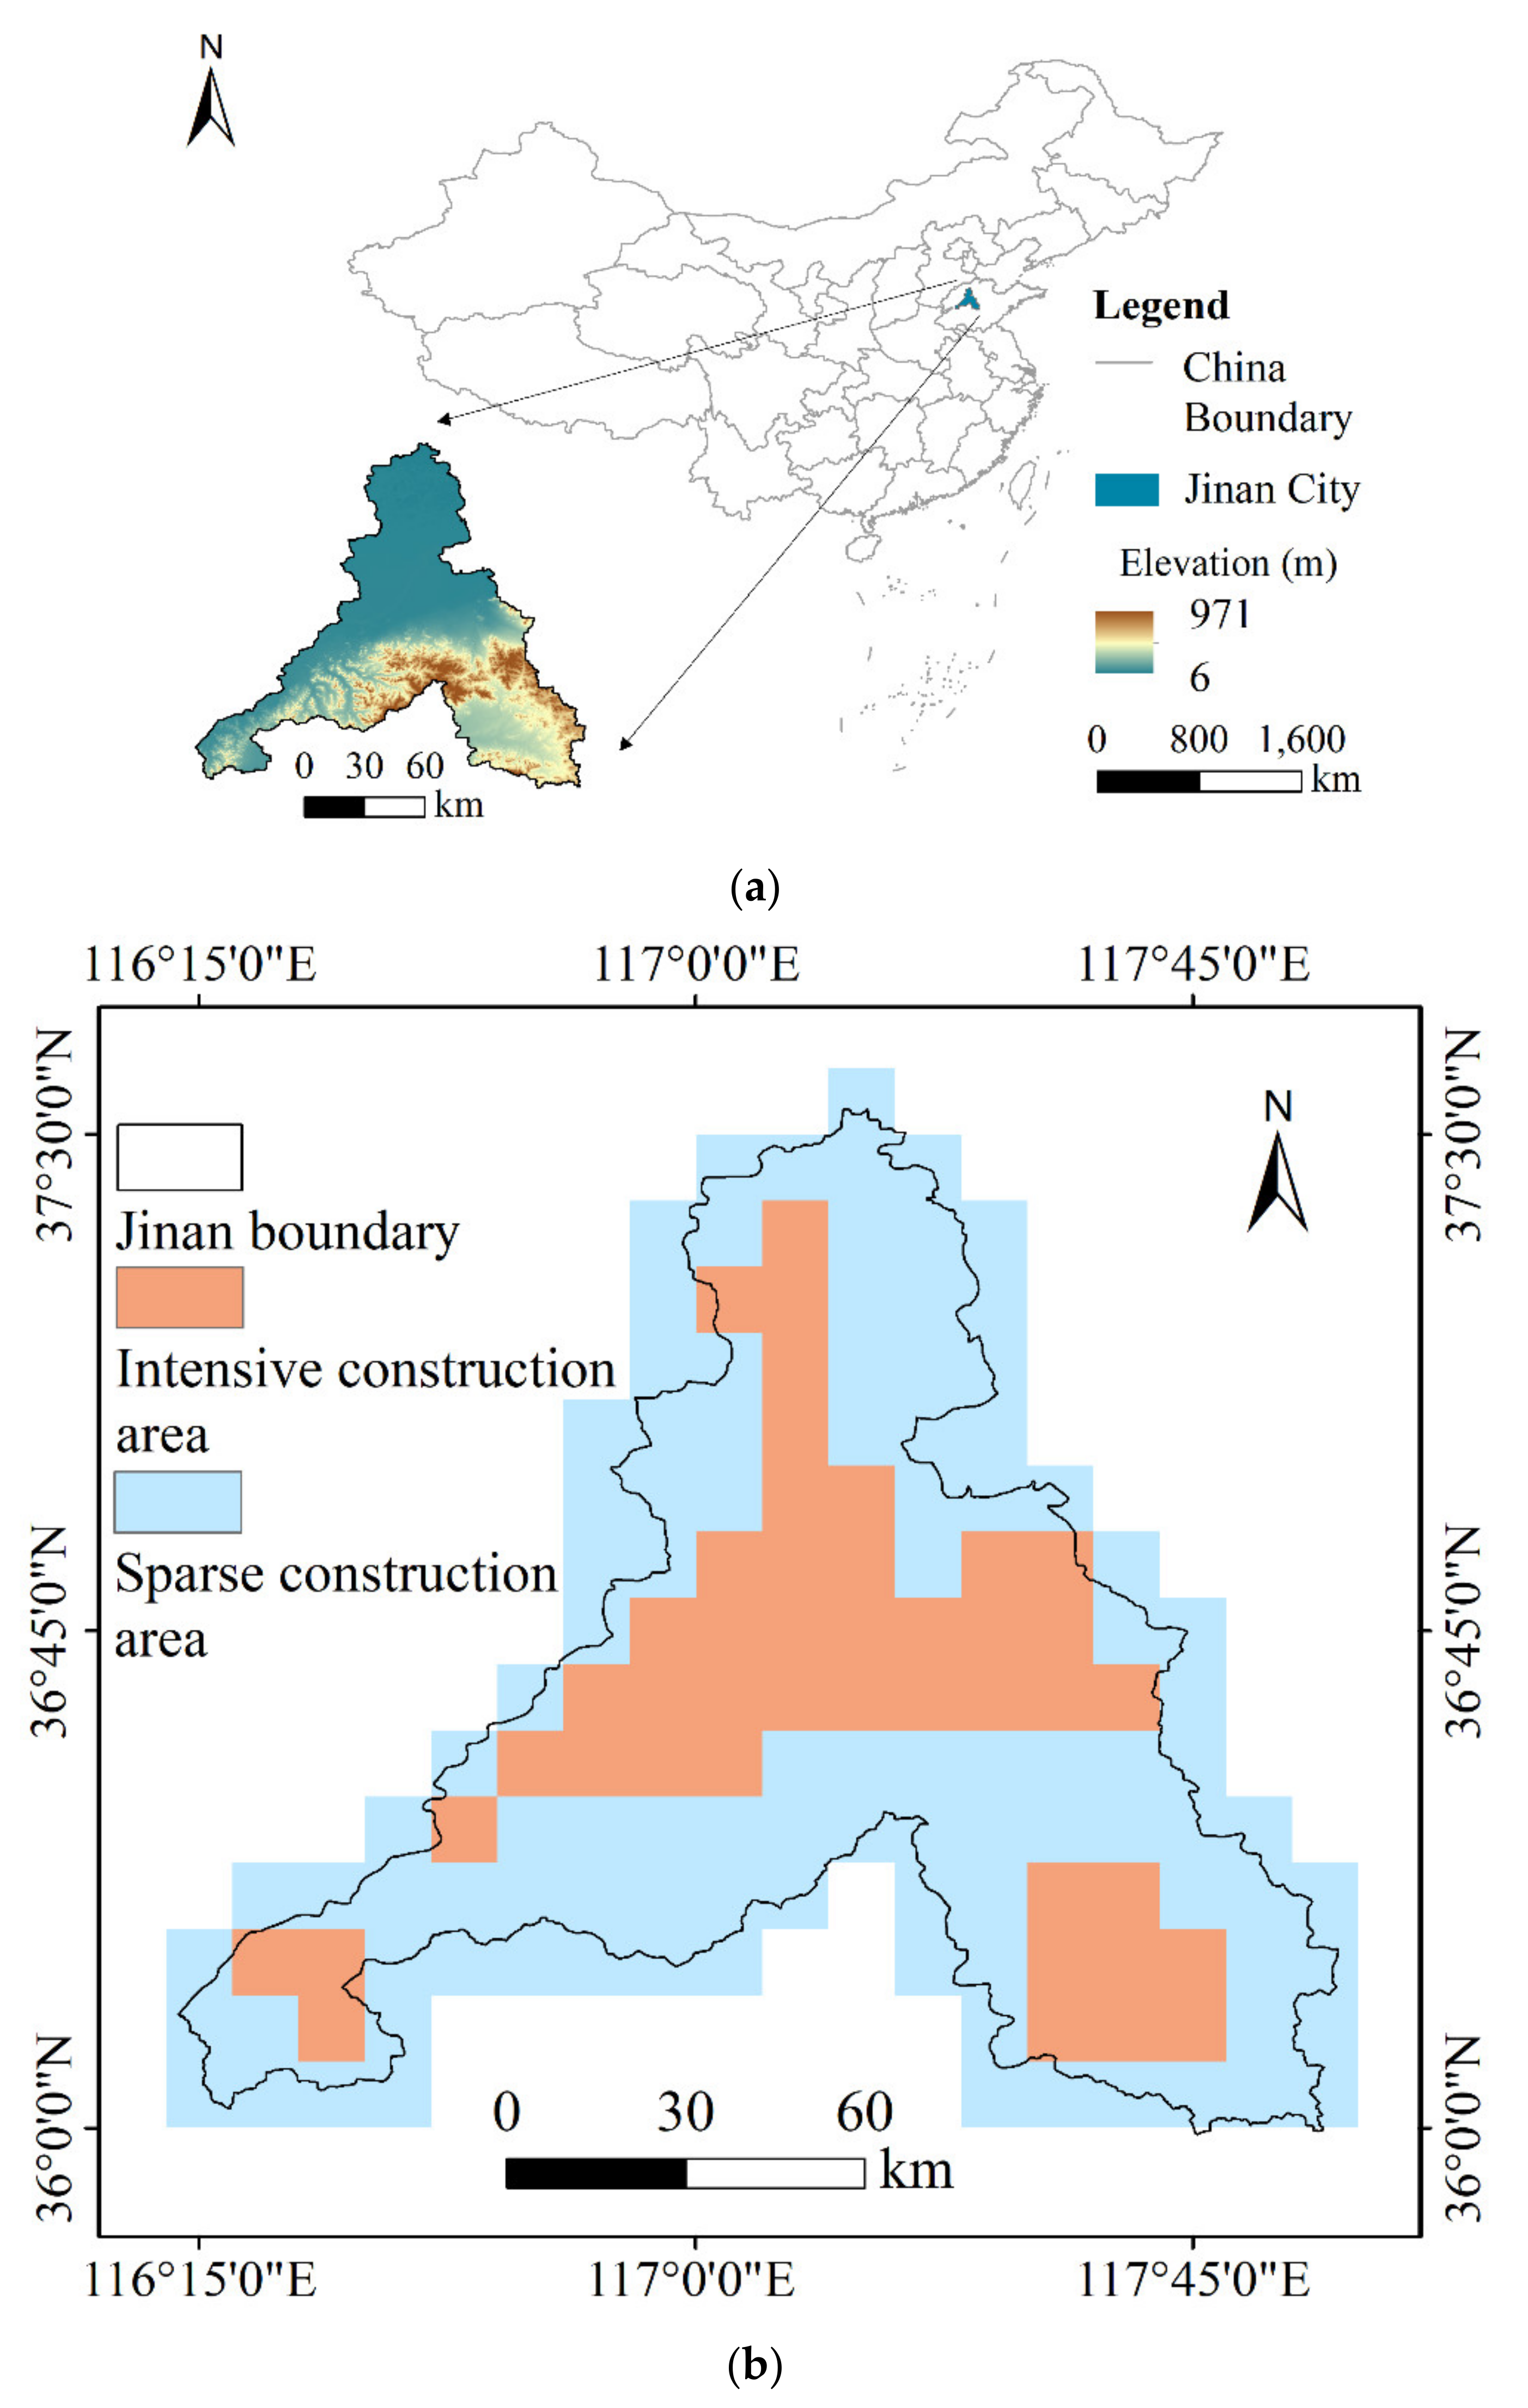
Located in east China (36°40′N, 117°00′E), Jinan is the capital city of Shandong Province. It is a national logistics hub, one of the top 50 Asian cities, and a global second-tier city. As of the end of 2019, Jinan City has a permanent population of 8.91 million and a population urbanization rate of 71.21%. Jinan City is located at the junction of the low mountains and hills in central southern Shandong Province and the alluvial plains in northwestern Shandong Province. The elevation is high in the south and low in the north, which is conducive to the accumulation of surface water and groundwater in the urban area. Jinan City has a monsoon climate of medium latitudes, with an average annual temperature of 13.8 °C and an average annual precipitation of 685 mm. Affected by marine air mass in summer, warm and humid air currents from the ocean prevail, and there is a considerable amount of rainfall. The unique topography causes the water vapor and hot air backflow to gather, which leads to more summer precipitation in this region than in other northern cities.
Jinan City is dominated by piedmont plain. According to the spatial distribution of impervious surfaces, it can be divided into the intensive construction area (towns and their nearby areas) and the sparse construction area (rural areas and undeveloped areas), so as to reveal its “urban rain island effect” (Figure 1).
2.2. Data Source Description
The data of precipitation and temperature during the period of 1979–2017 were obtained from the China Meteorological Forced Dataset (CMFD), with a spatial resolution of 0.1° and a temporal resolution of three hours [29] (http://poles.tpdc.ac.cn/, accessed on 21 January 2020) (Table 1). The meteorological dataset took TRMM (Tropical Rainfall Measuring Mission) satellite precipitation analysis data (3B42), Princeton forcing data and GLDAS data, and GEWEX–SRB (Global Energy and Water Cycle Experiment–Surface Radiation Budget) downward shortwave radiation data as the climatological background field, and the observed CMA (China Meteorological Administration) station data were interpolated to grid points. The dataset was made through fusion of remote sensing products, reanalysis datasets and in-situ station data. The accuracy is intermediate between the meteorological observation data and the satellite remote sensing data. Due to its continuous temporal coverage and consistent quality, the CMFD is one of the most widely used climate datasets for China [30].
The impervious surface data of Jinan City during the period of 1978–2017 were obtained from the database of Department of Earth System Science, Tsinghua University, with a spatial resolution of 60 m in 1978 and 30 m in 1985–2017 [31] (Table 1). We selected the Urban and Rural data. They developed an automatic impervious surface mapping framework on Google Earth Engine (GEE), using different algorithms for the processing of the 60 m resolution MSS and 30 m resolution Landsat Thematic Mapper (TM), Enhanced Thematic Mapper Plus (ETM+) and Operational Land Imager (OLI) data. Landsat imagery is the main source, with an ancillary dataset of nighttime light (NTL) data. The NTL data were derived from the day/night band (DNB) detectors of the Suomi-NPP Visible Infrared Imaging Radiometer Suite (VIIRS). The overall accuracy of the impervious surface data is more than 90%.
2.3. Methodology Description
2.3.1. Extreme Climate Indices
The World Meteorological Organization (WMO) recommended 27 core extreme climate indices that have been widely used in climate research around the world [32,33,34,35]. We selected 13 indices to study the changes in the microclimate of Jinan City and made corresponding modifications according to local conditions, as shown in Table 2.
In order to deeply analyze the duration and intensity of precipitation events, another 10 precipitation indices were selected. N1–3h, N4–6h, N7–9, N10–12h and N>12h represent the number of precipitation events of 1–3 h, 4–6 h, 7–9 h, 10–12 h and more than 12 h, respectively, and the unit is time. P1–3, P4–6h, P7–9h, P10–12h and P>12h represent the intensity of the corresponding precipitation events. The unit is mm·(1–3 h)−1, mm·(4–6 h)−1, mm·(7–9 h)−1, mm·(10–12 h)−1 and mm·(>12 h)−1, respectively.
2.3.2. M-K and Sen’s Slope Estimator
The M-K test does not require data to obey a specific distribution, and it is widely used to estimate the changing trends of meteorological and hydrological elements over time [36]. A positive Z value indicates an increasing trend, and there is a significant trend in the time series when . In this study, the specific significance level α = 0.05 is adopted, and a significant trend exists if .
Sen’s slope estimator is used in conjunction with the M-K test to estimate the rate of change of hydrometeorological elements [37,38]:
In Equation (1), xj and xk represent the data values at times j and k (j > k), respectively. The N values of Qi are ranked from smallest to largest, where N = (n(n − 1)/2), and Sen’s slope estimator is computed as:
The value of Qmed reflects the change rate of the data, and a positive value indicates an increasing trend.
2.3.3. Pettitt Test
The Pettitt test is a nonparametric test method for identifying abrupt change points in hydrological series [39]. A statistical index Ut,N is expressed as follows:
where, similarly,
The most possible change point is found where its value is:
The significance probability is evaluated as:
If , the point t is considered as a significant change point in this study.
2.3.4. Pearson Correlation Analysis
Pearson correlation coefficient can quantitatively measure the linear relationship between random variables [40] and it is expressed as follows:
In Equation (7), n is the number of sequences; and are the mean value and mean square deviation of sequences X, respectively; and and are the mean value and mean square deviation of sequences Y, respectively. Positive r indicates a positive correlation between the two variables, and negative r indicates a negative correlation. The larger the absolute value of r, the stronger the correlation between the two sequences. Similarly, the specific significance level is 0.05 in this study, and the correlation is significant when .
3. Results Analysis
3.1. Urbanization Process in Jinan City
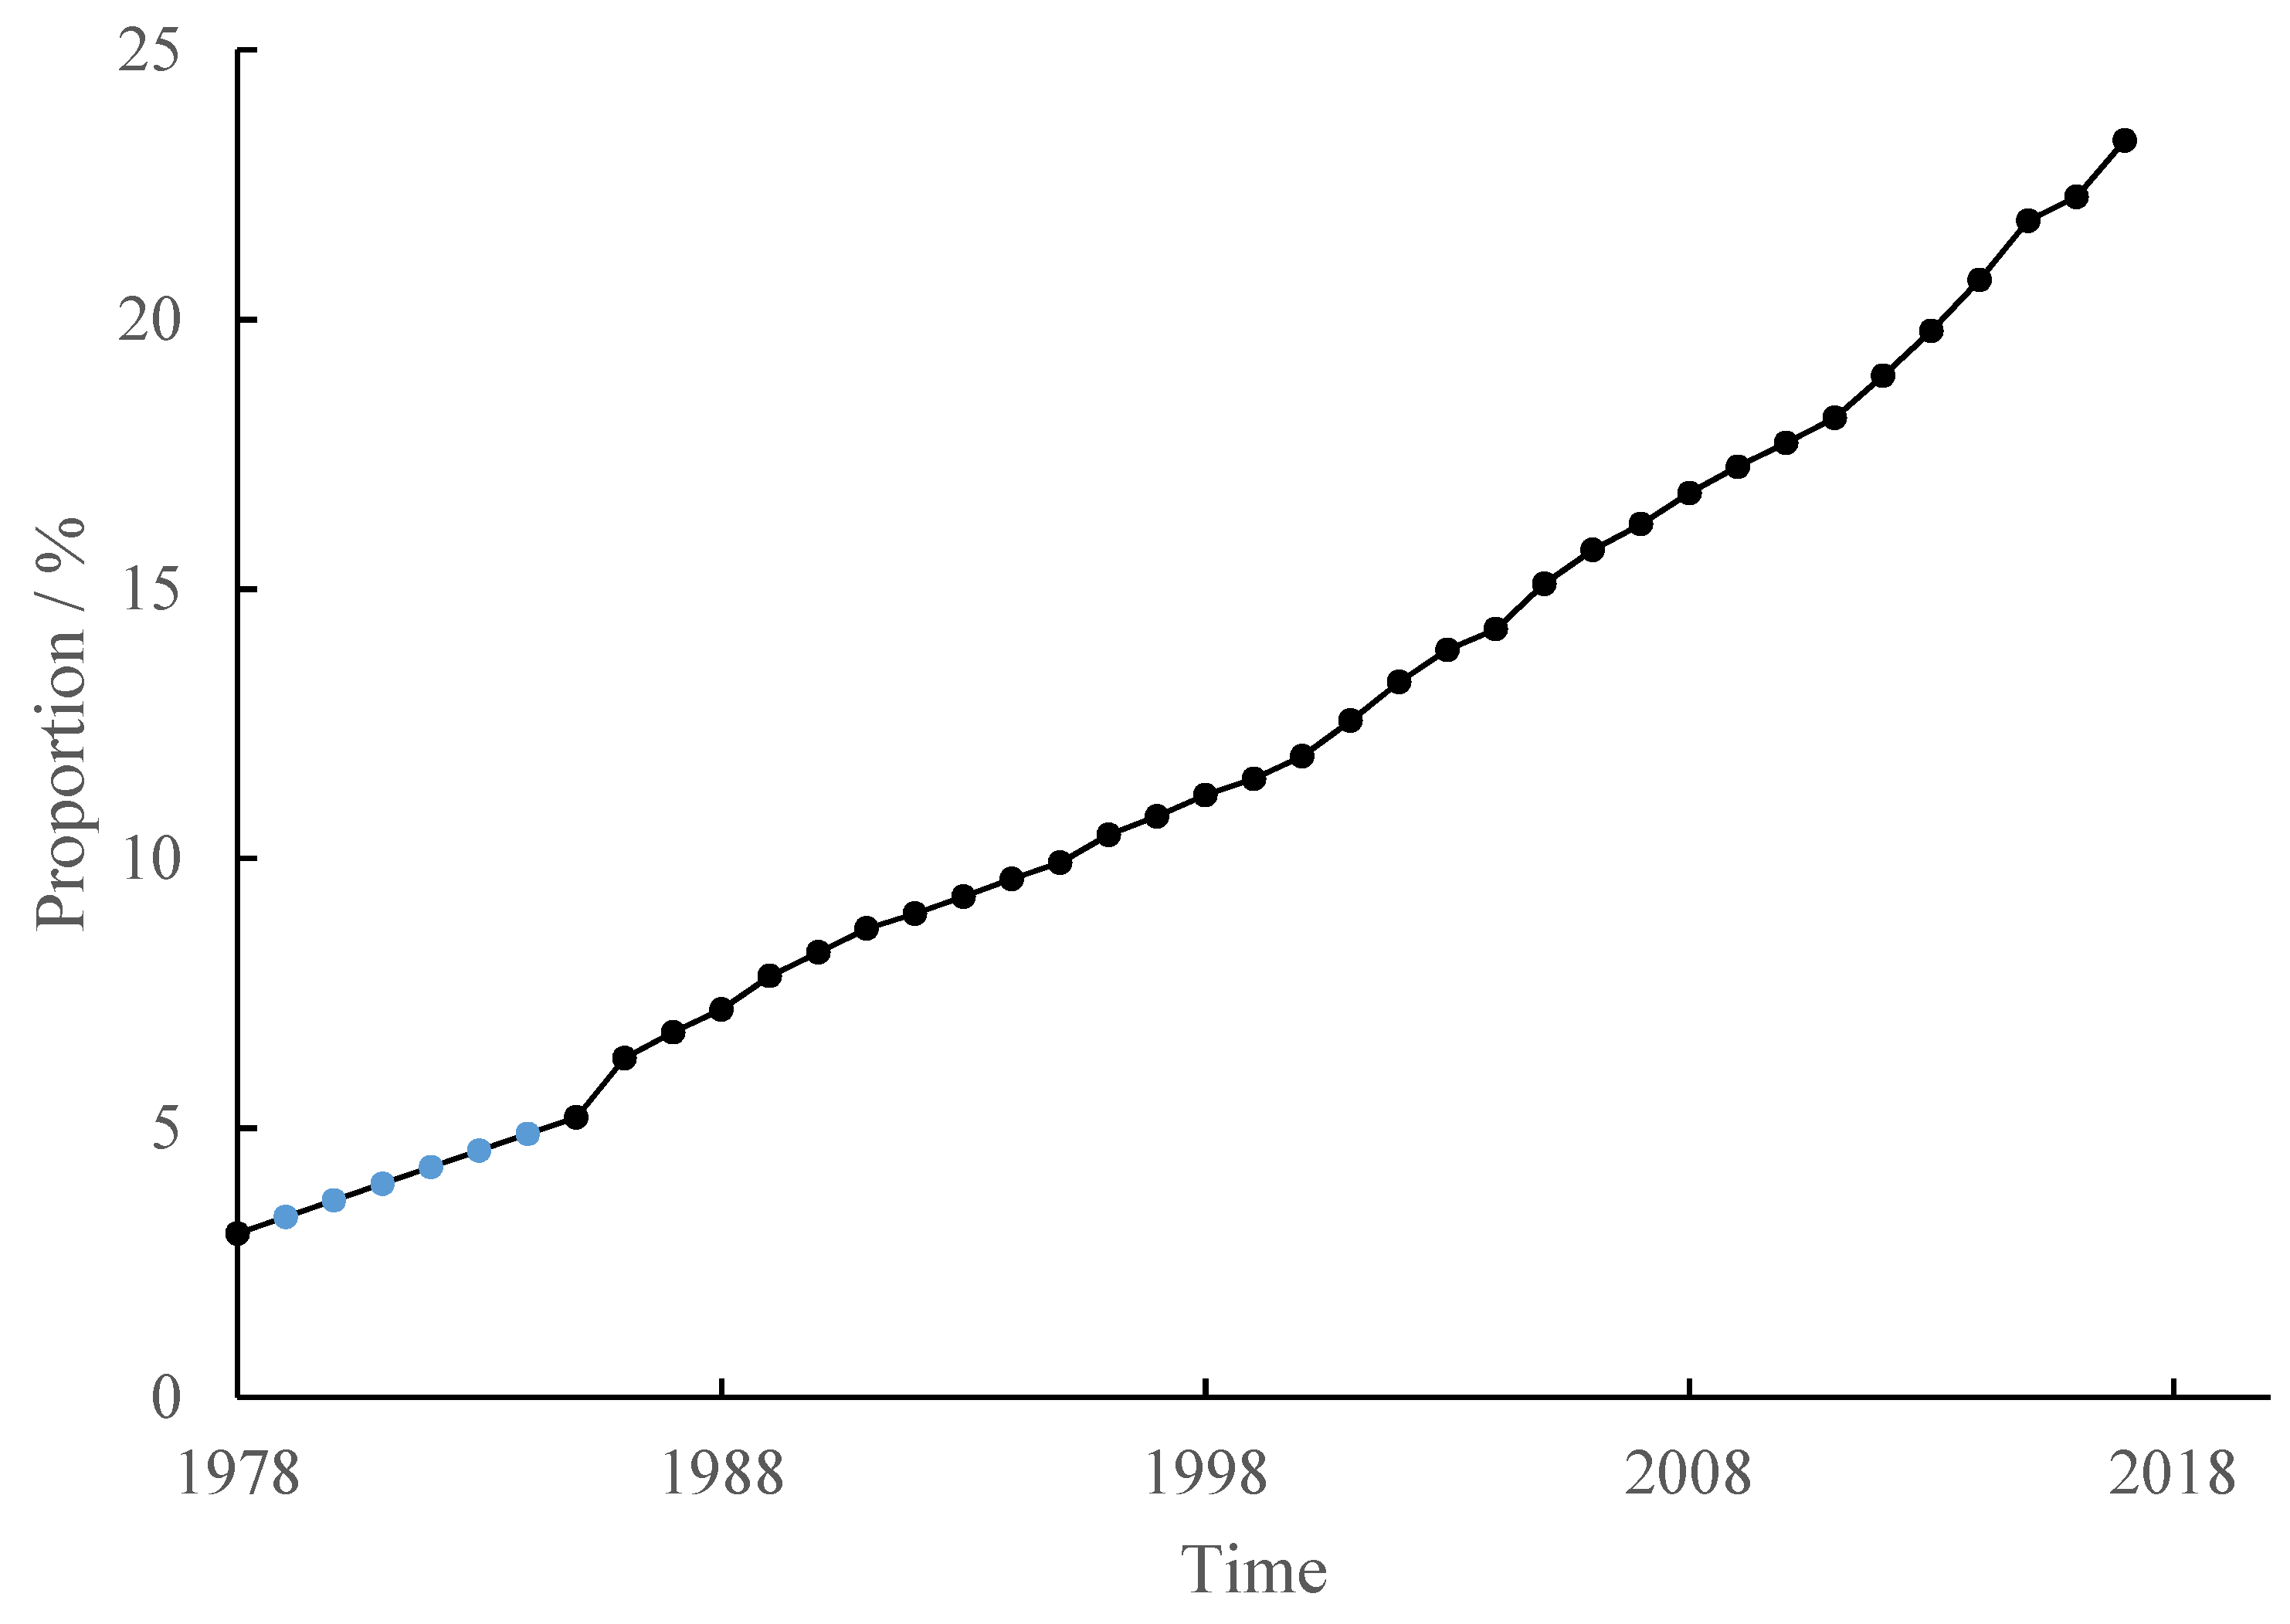
Based on the impervious surface data of Jinan City in 1978 and 1985–2017, the spatial and temporal variations of impervious surfaces in Jinan City during the period of 1978–2017 were analyzed. The proportion of impervious area from 1979 to 1984 was obtained by the linear interpolation method. As can be seen from Figure 2, the proportion of impervious surface areas in Jinan City increased rapidly from 1978 to 2017, and the growth rate showed an increasing trend. In 1978, 1995, 2005 and 2017, the impervious surface areas were 311.68 km2 (3.04%), 1016.23 km2 (9.92%), 1546.56 km2 (15.10%) and 2389.50 km2 (23.33%), respectively.
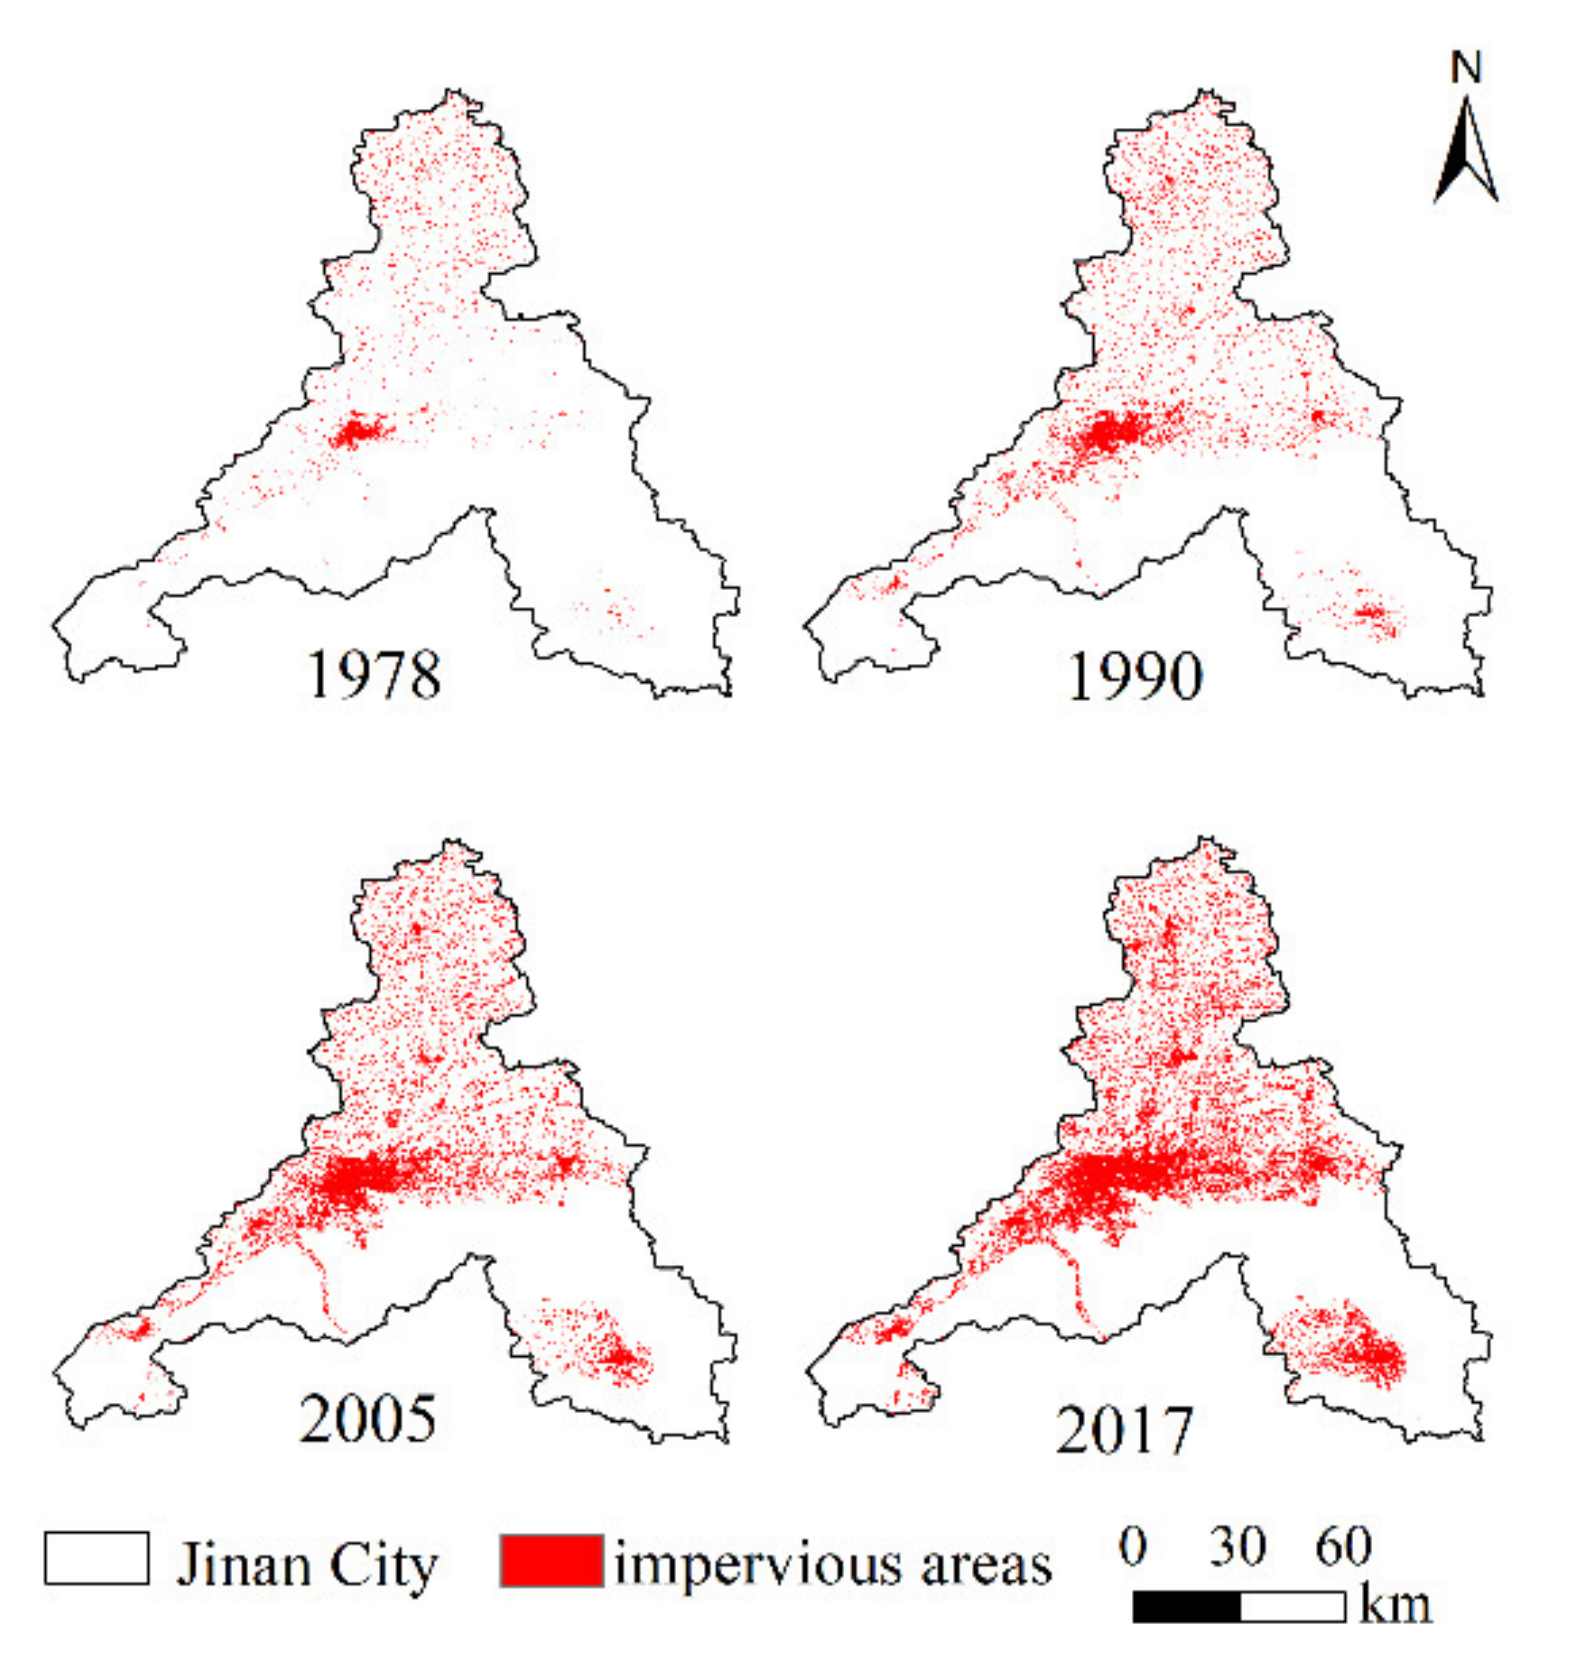
As can be seen from Figure 3, the impervious surfaces in Jinan City continued to expand in space during the period of 1978–2017. In 1978, the impervious surfaces were mainly concentrated in the central old urban area of Jinan City. With the development of urbanization, the impervious surfaces gradually expanded to the east, southwest, southeast and north of Jinan City. Urbanization is mainly reflected by the expansion of urban space from the center to the periphery.
3.2. Characteristics of Temperature in Jinan City
3.2.1. Spatial and Temporal Variations of Temperature Indices
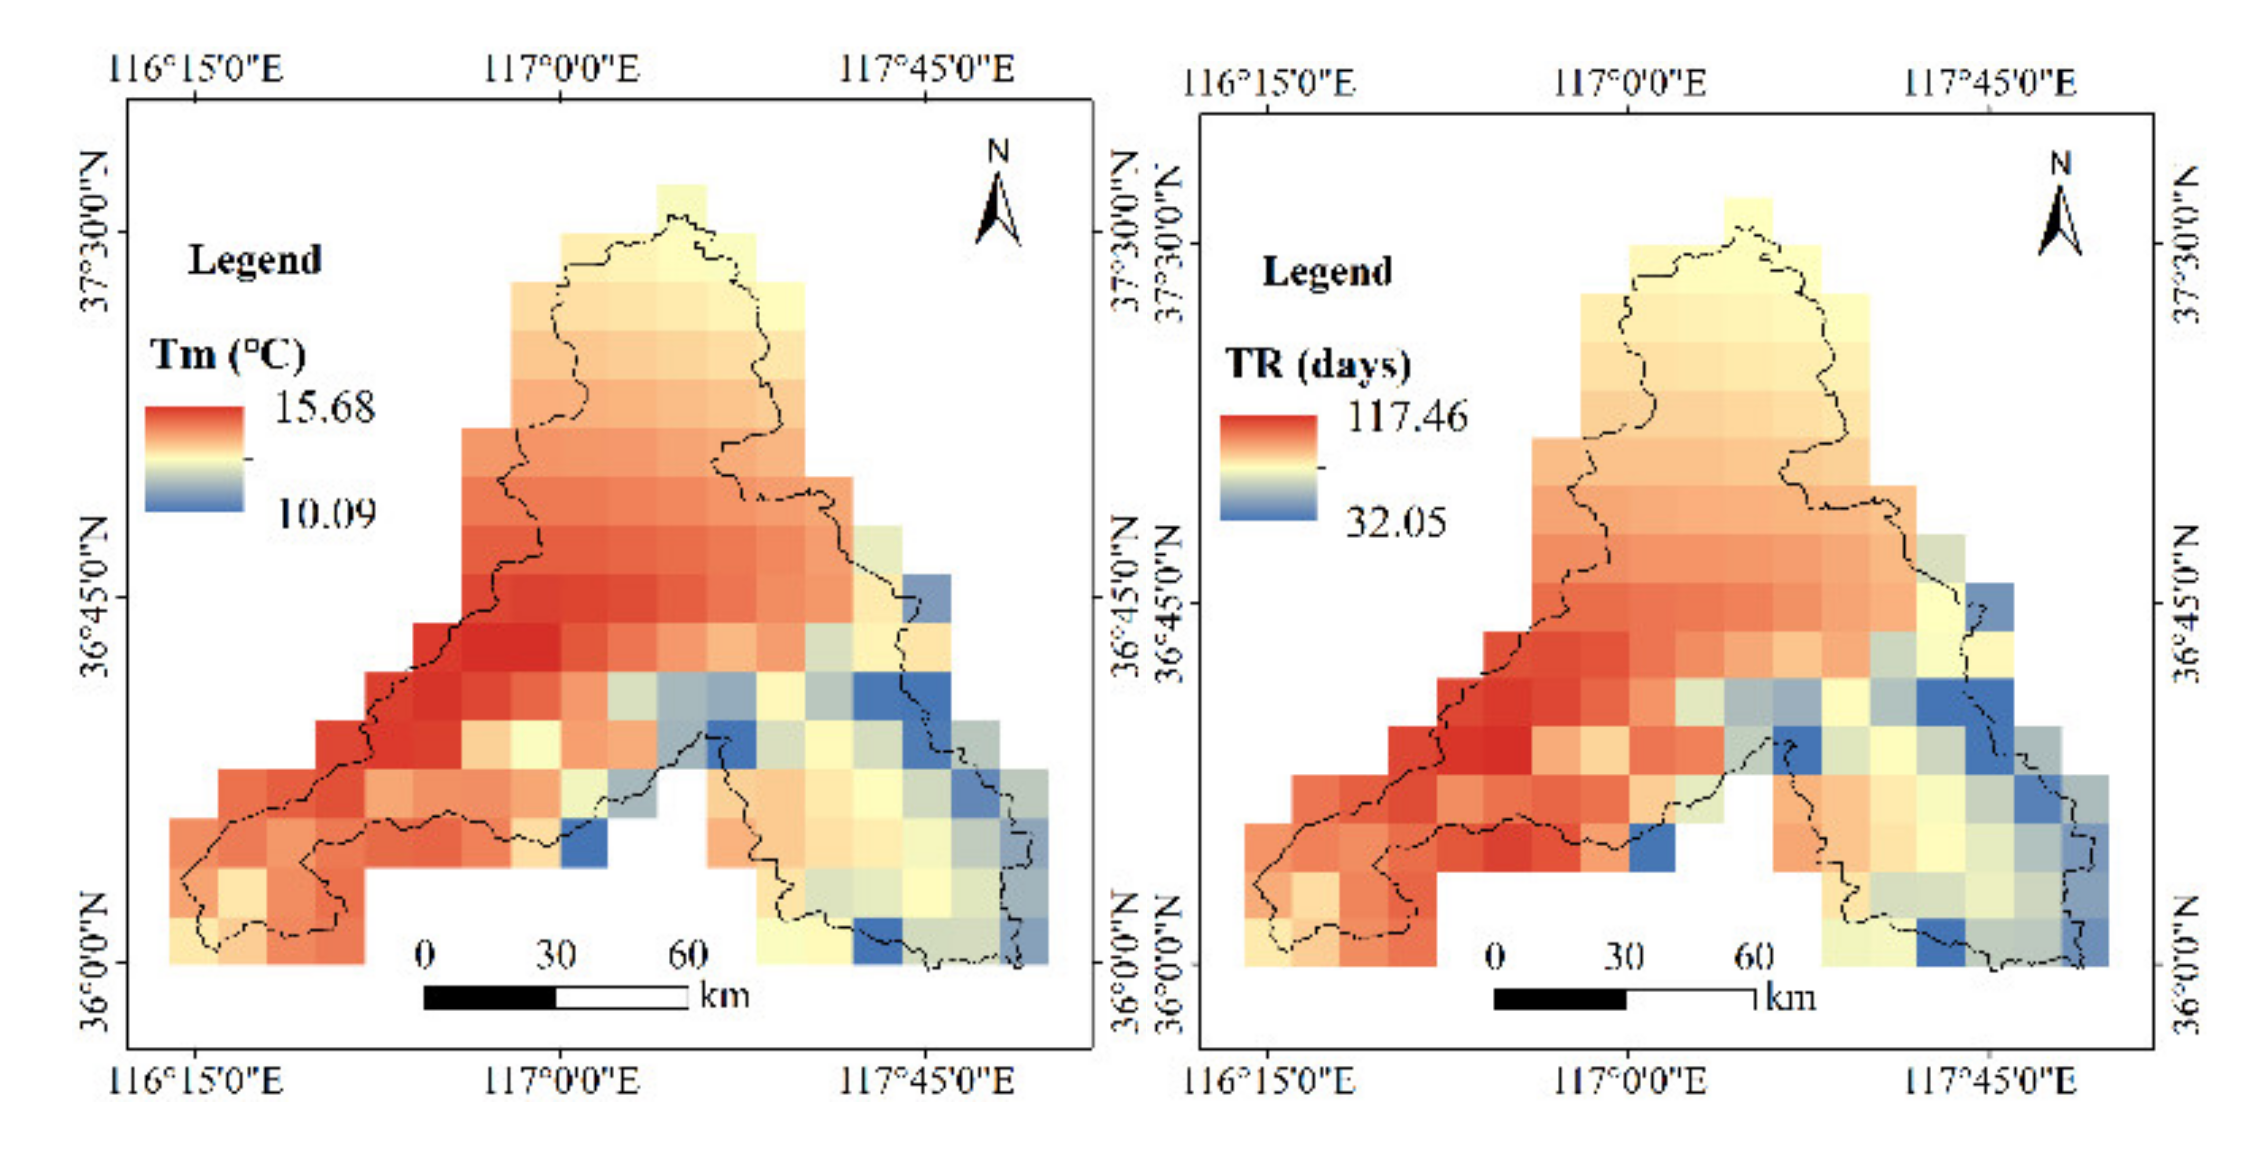
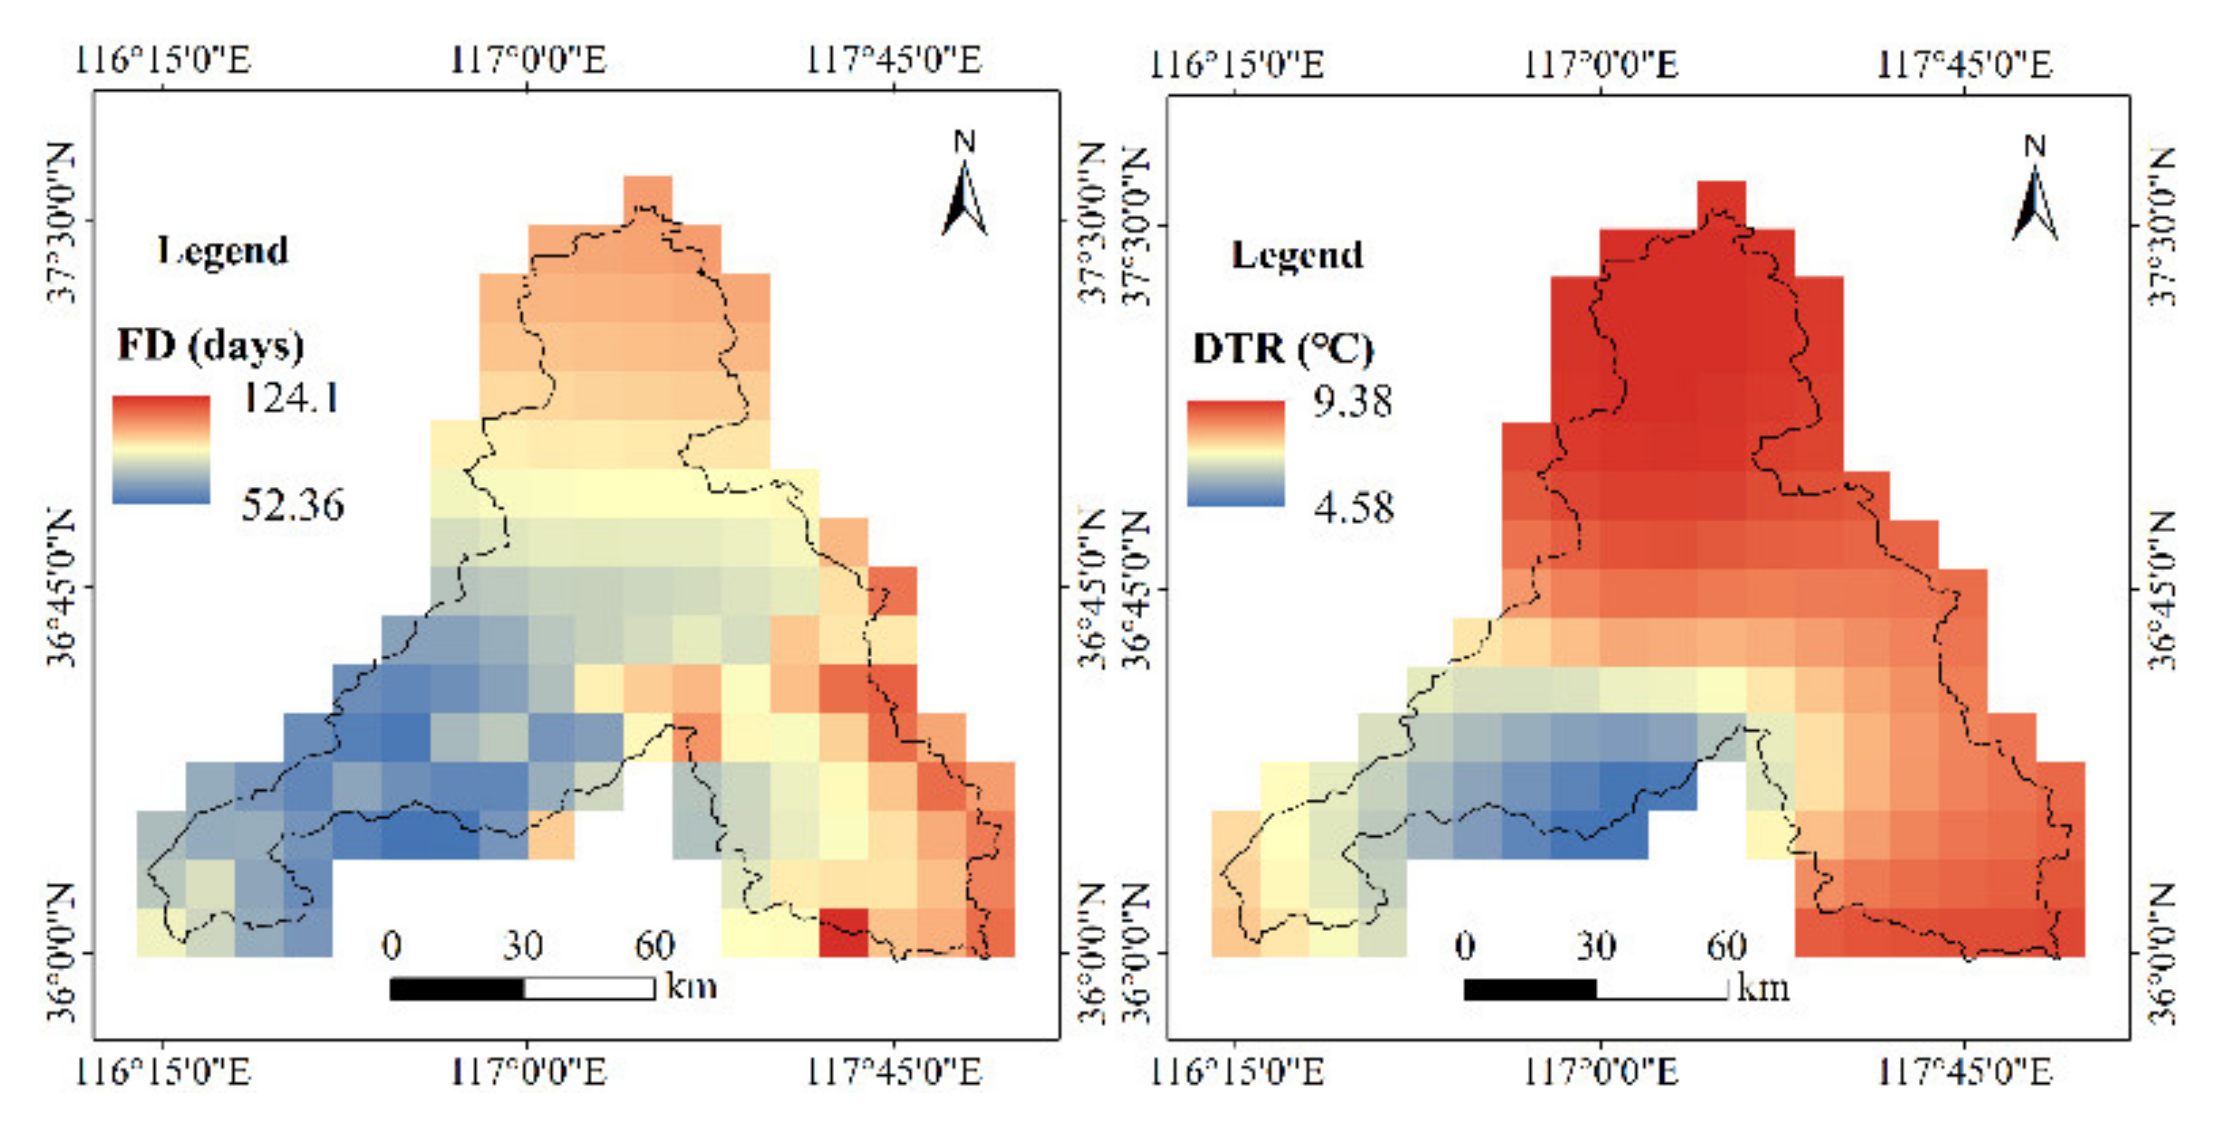
Based on temperature data, four temperature indices including the annual mean temperature (Tm), tropical nights (TR), frost days (FD) and diurnal temperature range (DTR) were selected to analyze the spatial distribution of temperature in Jinan City during 1979–2017.
The spatial distribution of air temperature is basically consistent with that of impervious surfaces, and the temperature in the impervious surface areas is generally higher than that in the permeable surface areas (Figure 4). The high-value areas of Tm and TR and the low-value areas of FD and DTR are mostly concentrated in the intensive construction area. The results indicate that the impervious surfaces have a certain degree of impact on the spatial distribution of temperature.
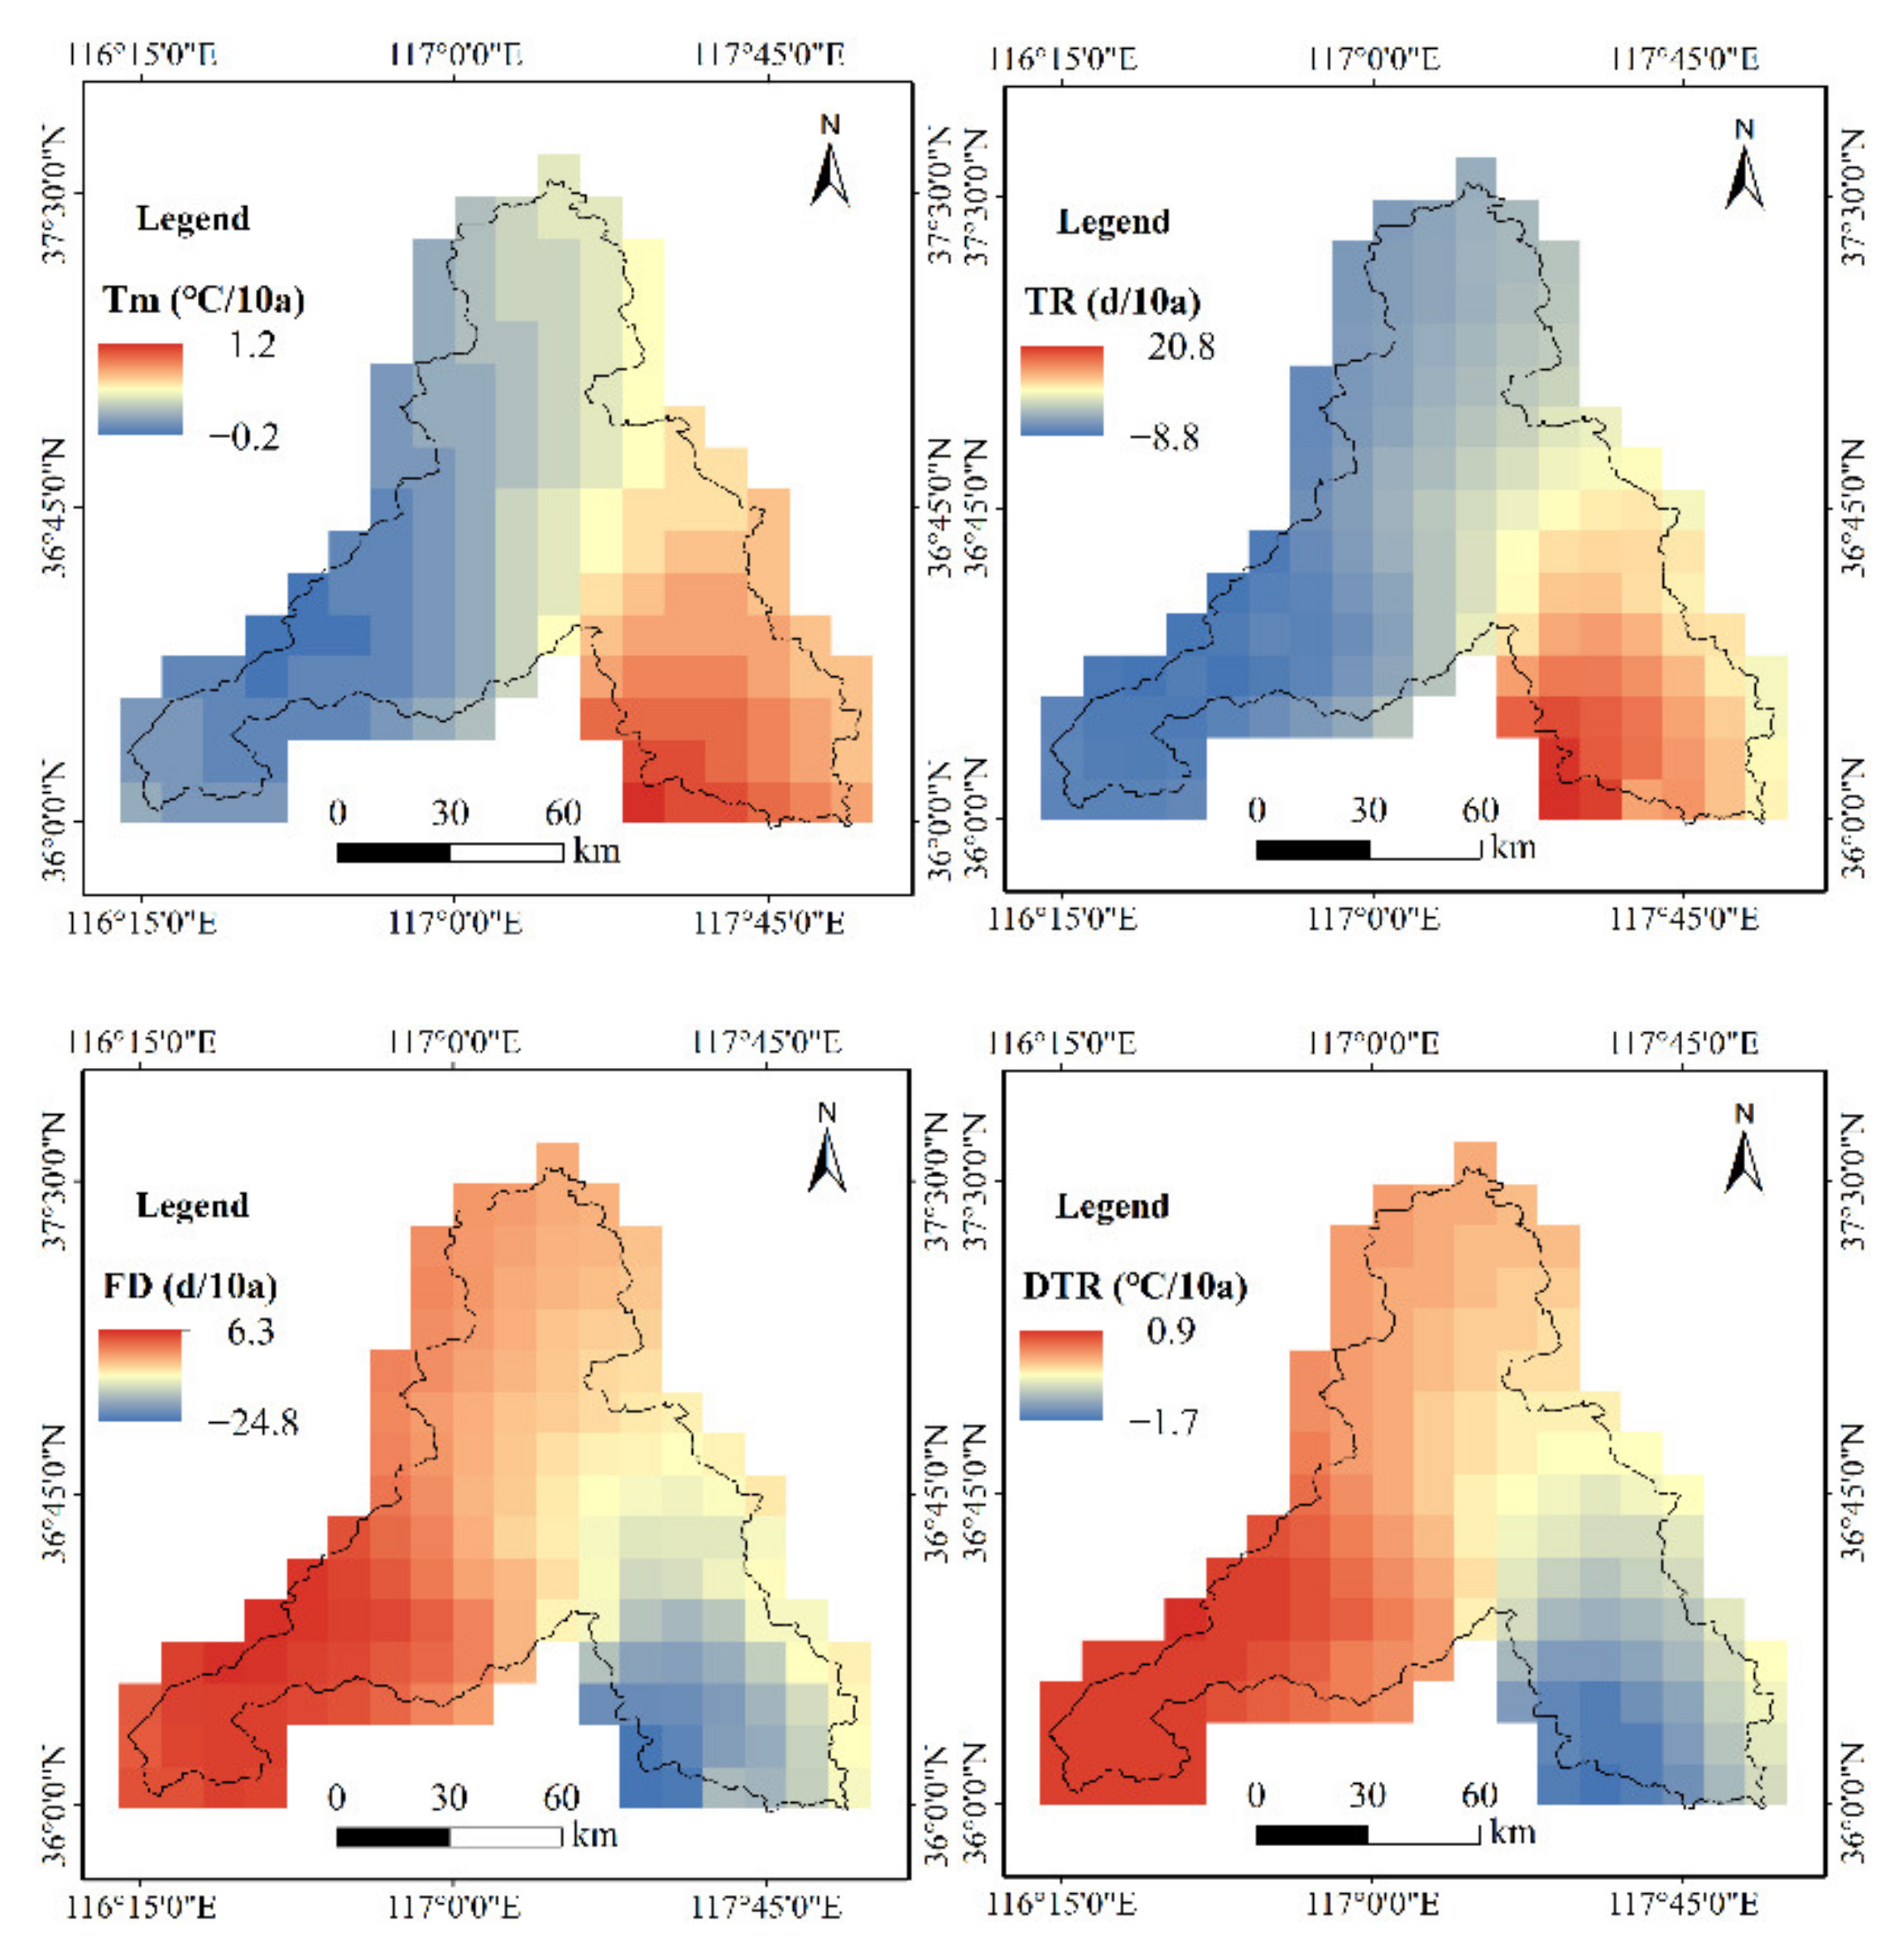
During the period of 1979–2017, the temperature in Jinan City showed an increasing trend, and the extreme values of the temperature indices were mainly concentrated in the southeastern areas and the southwest mountainous areas (Figure 5). The variation trend of temperature indices in the intensive construction area is significant, and the fluctuation range is small. It can be seen that the variations of temperature have a certain degree of correlation with the expansion of impervious surfaces.
3.2.2. Effects of Urban Expansion on Temperature
In order to quantitatively analyze the impact of urban expansion on temperature, the values of temperature indices in the sparse construction area are subtracted from that in the intensive construction area of every year so as to eliminate the impact of climate change on temperature (Table 3). Based on their Sen’s slope estimator, Tm and TR show an increasing trend, with an average rate of 0.05 °C·(10a)−1 and 1.1 °C·(10 a)−1, respectively. FD and DTR display a decreasing trend, with an average of 1.8 day·(10 a)−1 and 0.1 °C·(10 a)−1, respectively. TR, FD and DTR experience statistically significant trends at the 0.05 significance level. According to the result of the Pettitt test, the mutation year of the four temperature indices is 1991, which may be related to the urbanization development of Jinan City. According to the results of the Pearson correlation analysis, TM and TR are positively correlated with the impervious surfaces proportion, while FD and DTR are negatively correlated with the impervious surfaces proportion. TR, FD and DTR show statistically significant trends at the 0.05 significance level, and the correlation is significant. It can be seen that there is a certain correlation between impervious surfaces and temperature in Jinan City, and urbanization can lead to the change in relevant temperature indices. The increase in impervious surfaces leads to an increase in Tm and TR and a decrease in FD and DTR. Jinan City shows a relatively significant heat island effect.
3.3. Precipitation Patterns in Jinan City
3.3.1. Characteristics of Precipitation
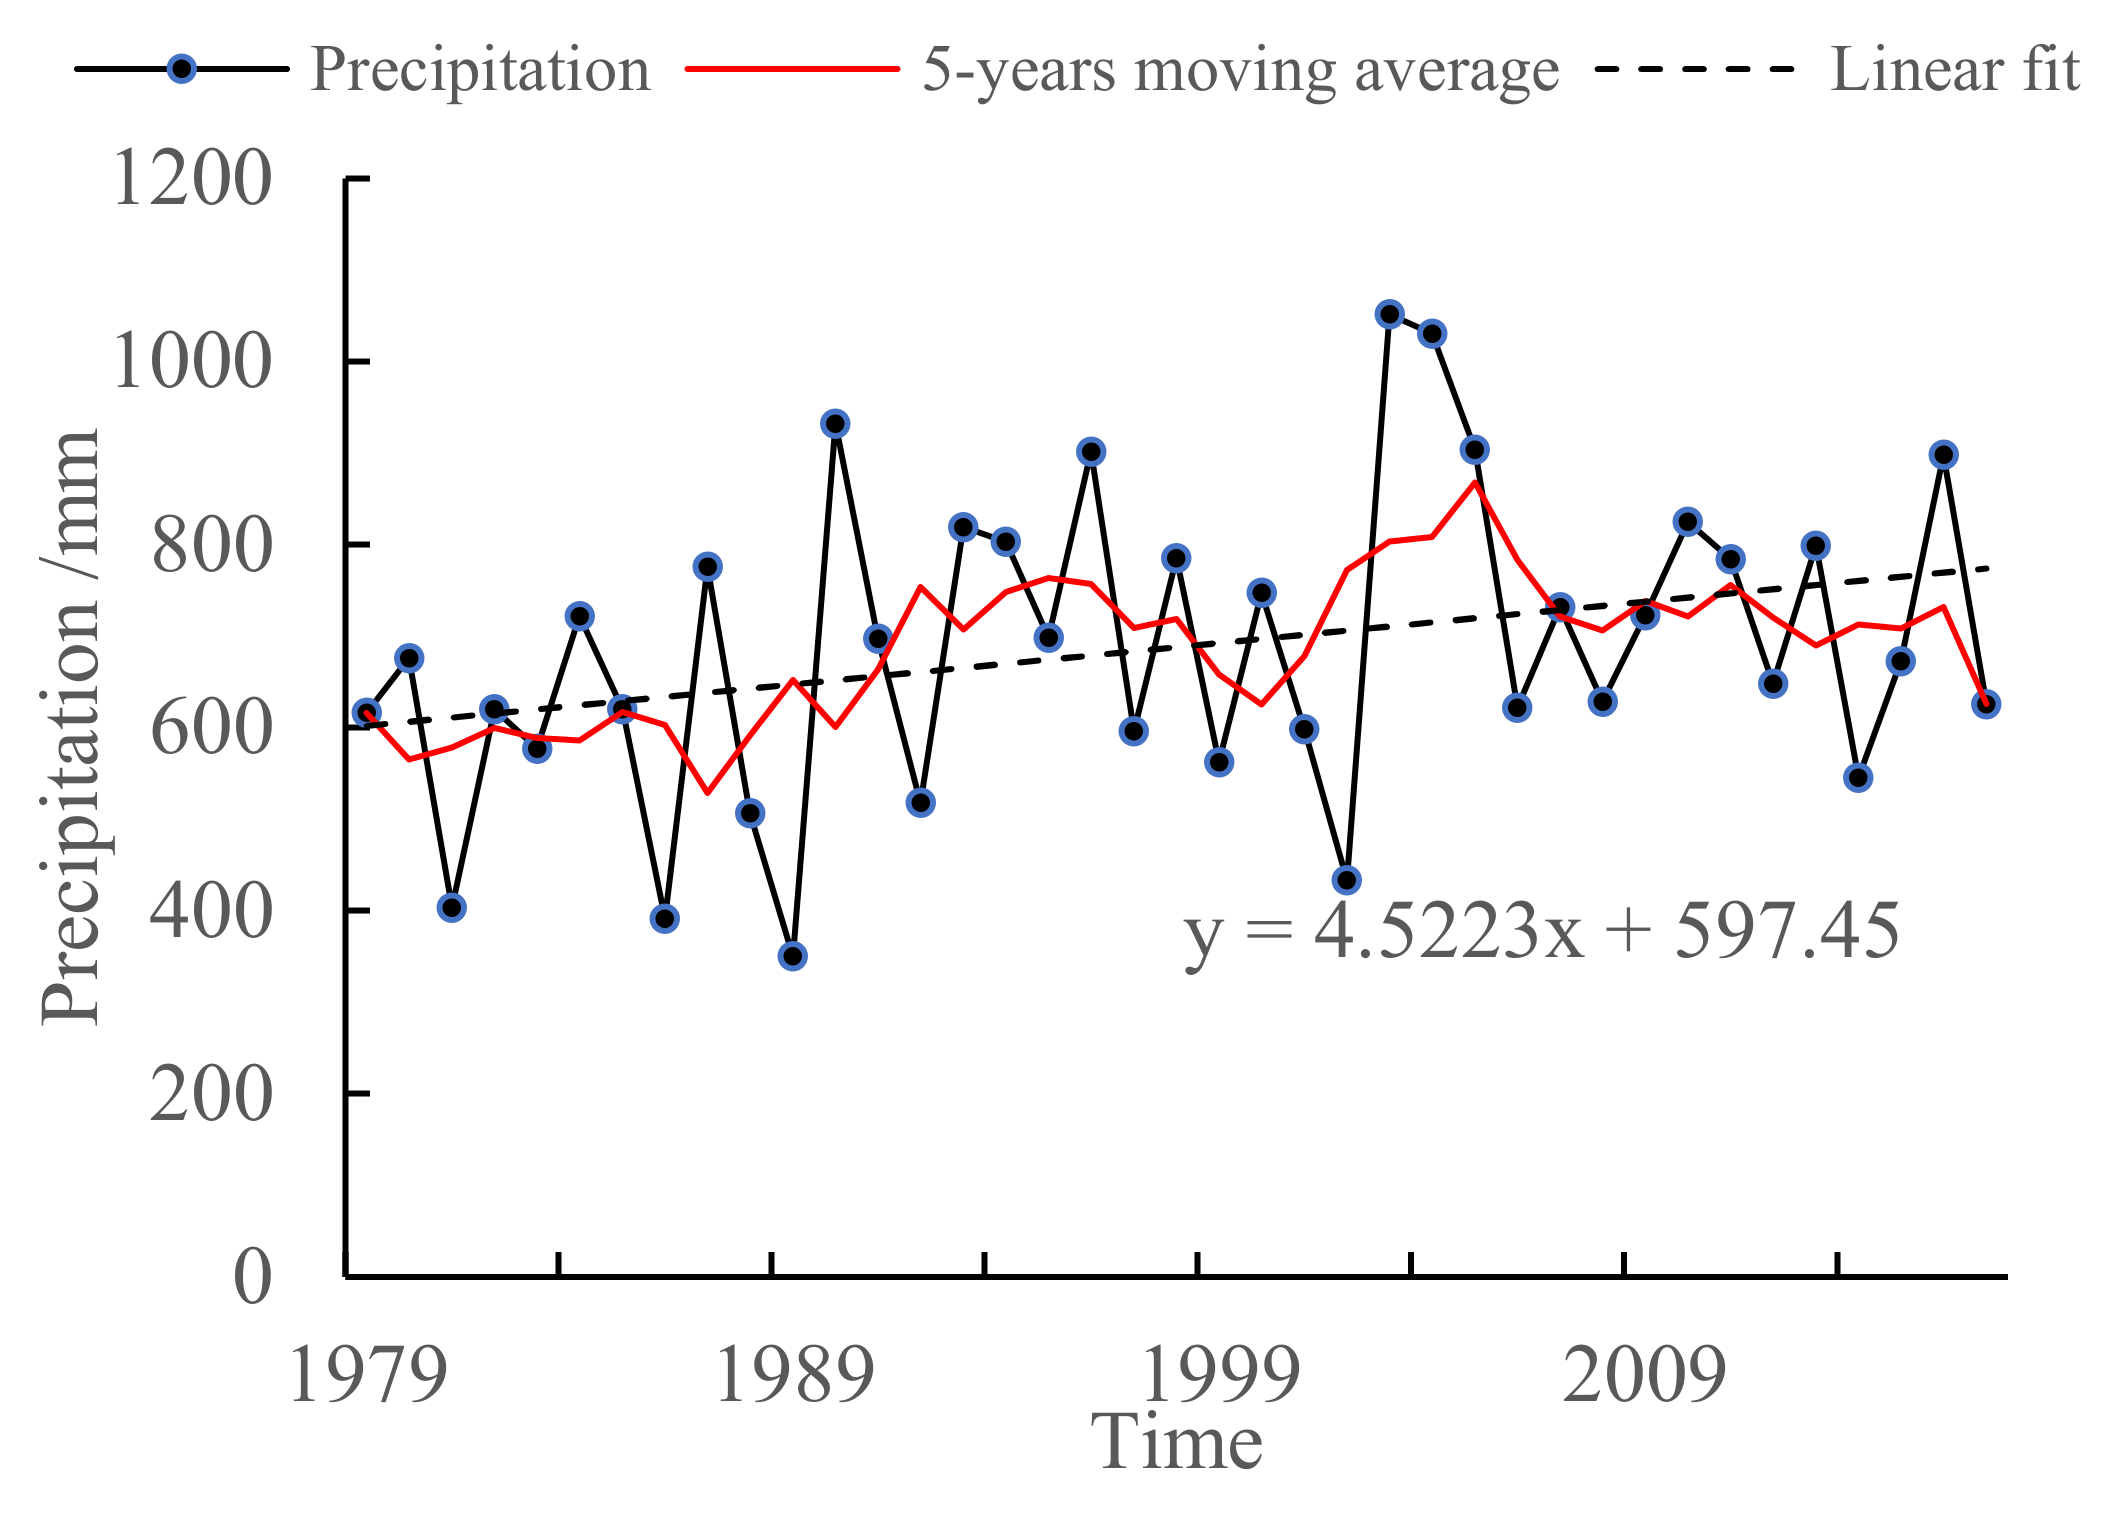
The annual mean precipitation during the period of 1979–2017 in Jinan shows a slowly increasing trend (Figure 6). According to the result of the M-K test, it does not experience statistically significant trend. Table 4 shows the statistical characteristic of precipitation in the intensive construction area and sparse construction area of Jinan City during the period of 1979–2017. The wet season represents April to October, and the dry season represents November to March. By comparison, it can be seen that the increased value in the wet season in the intensive construction area is the largest, and it experienced statistically significant trend.
The duration and intensity of precipitation events in Jinan City from 1979 to 2017 were statistically analyzed (Table 5). It can be seen that the number of events with rainfall time of less than 9 h increased, and the number of events with rainfall time of more than 10 h decreased, and all experienced statistically significant trends at the 0.05 significance level. The rainfall intensity of events shows an increasing trend, and most of the events show statistically significant trends. The abrupt change in events occurred from 1995 to 2002, which may be related to the urbanization development of Jinan City.
3.3.2. Spatial and Temporal Variations of Precipitation Indices
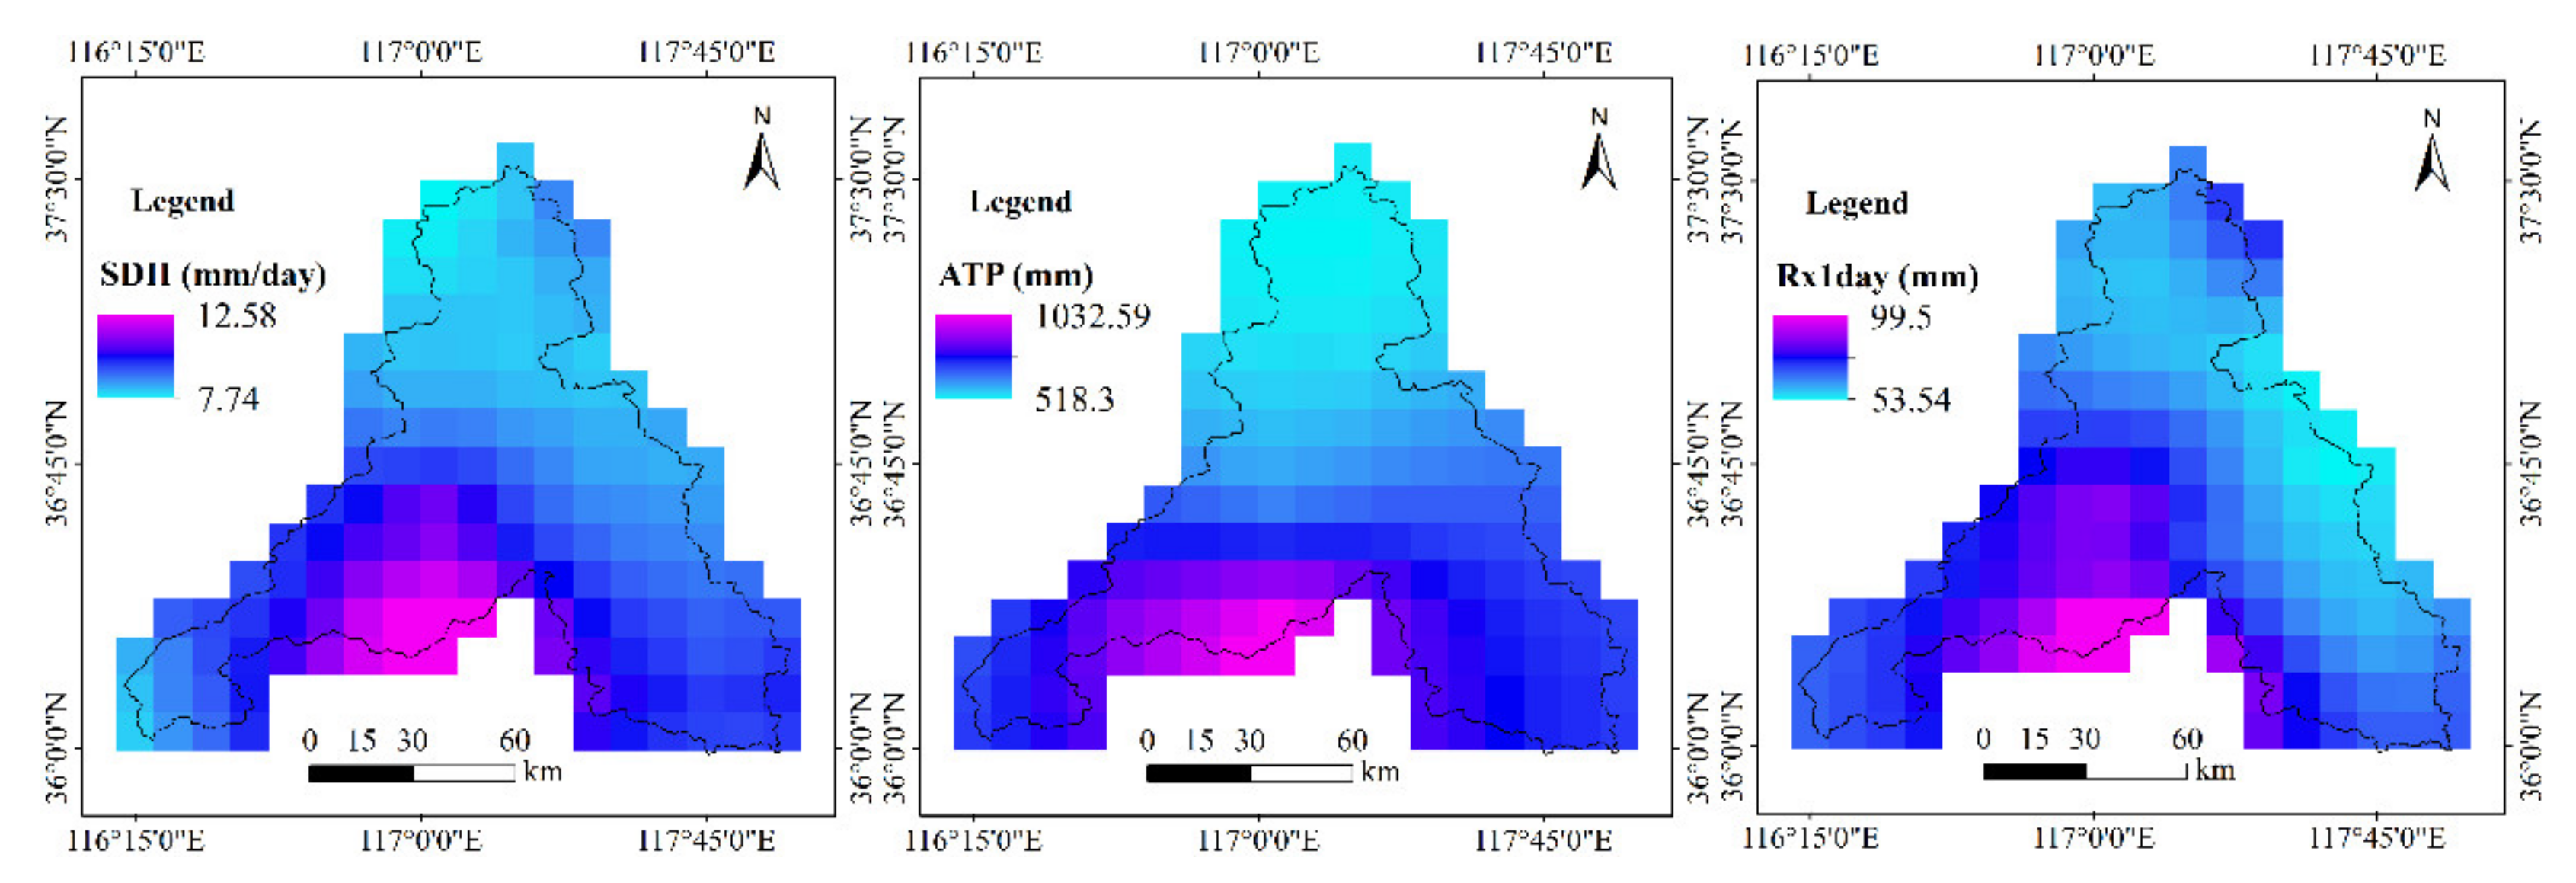
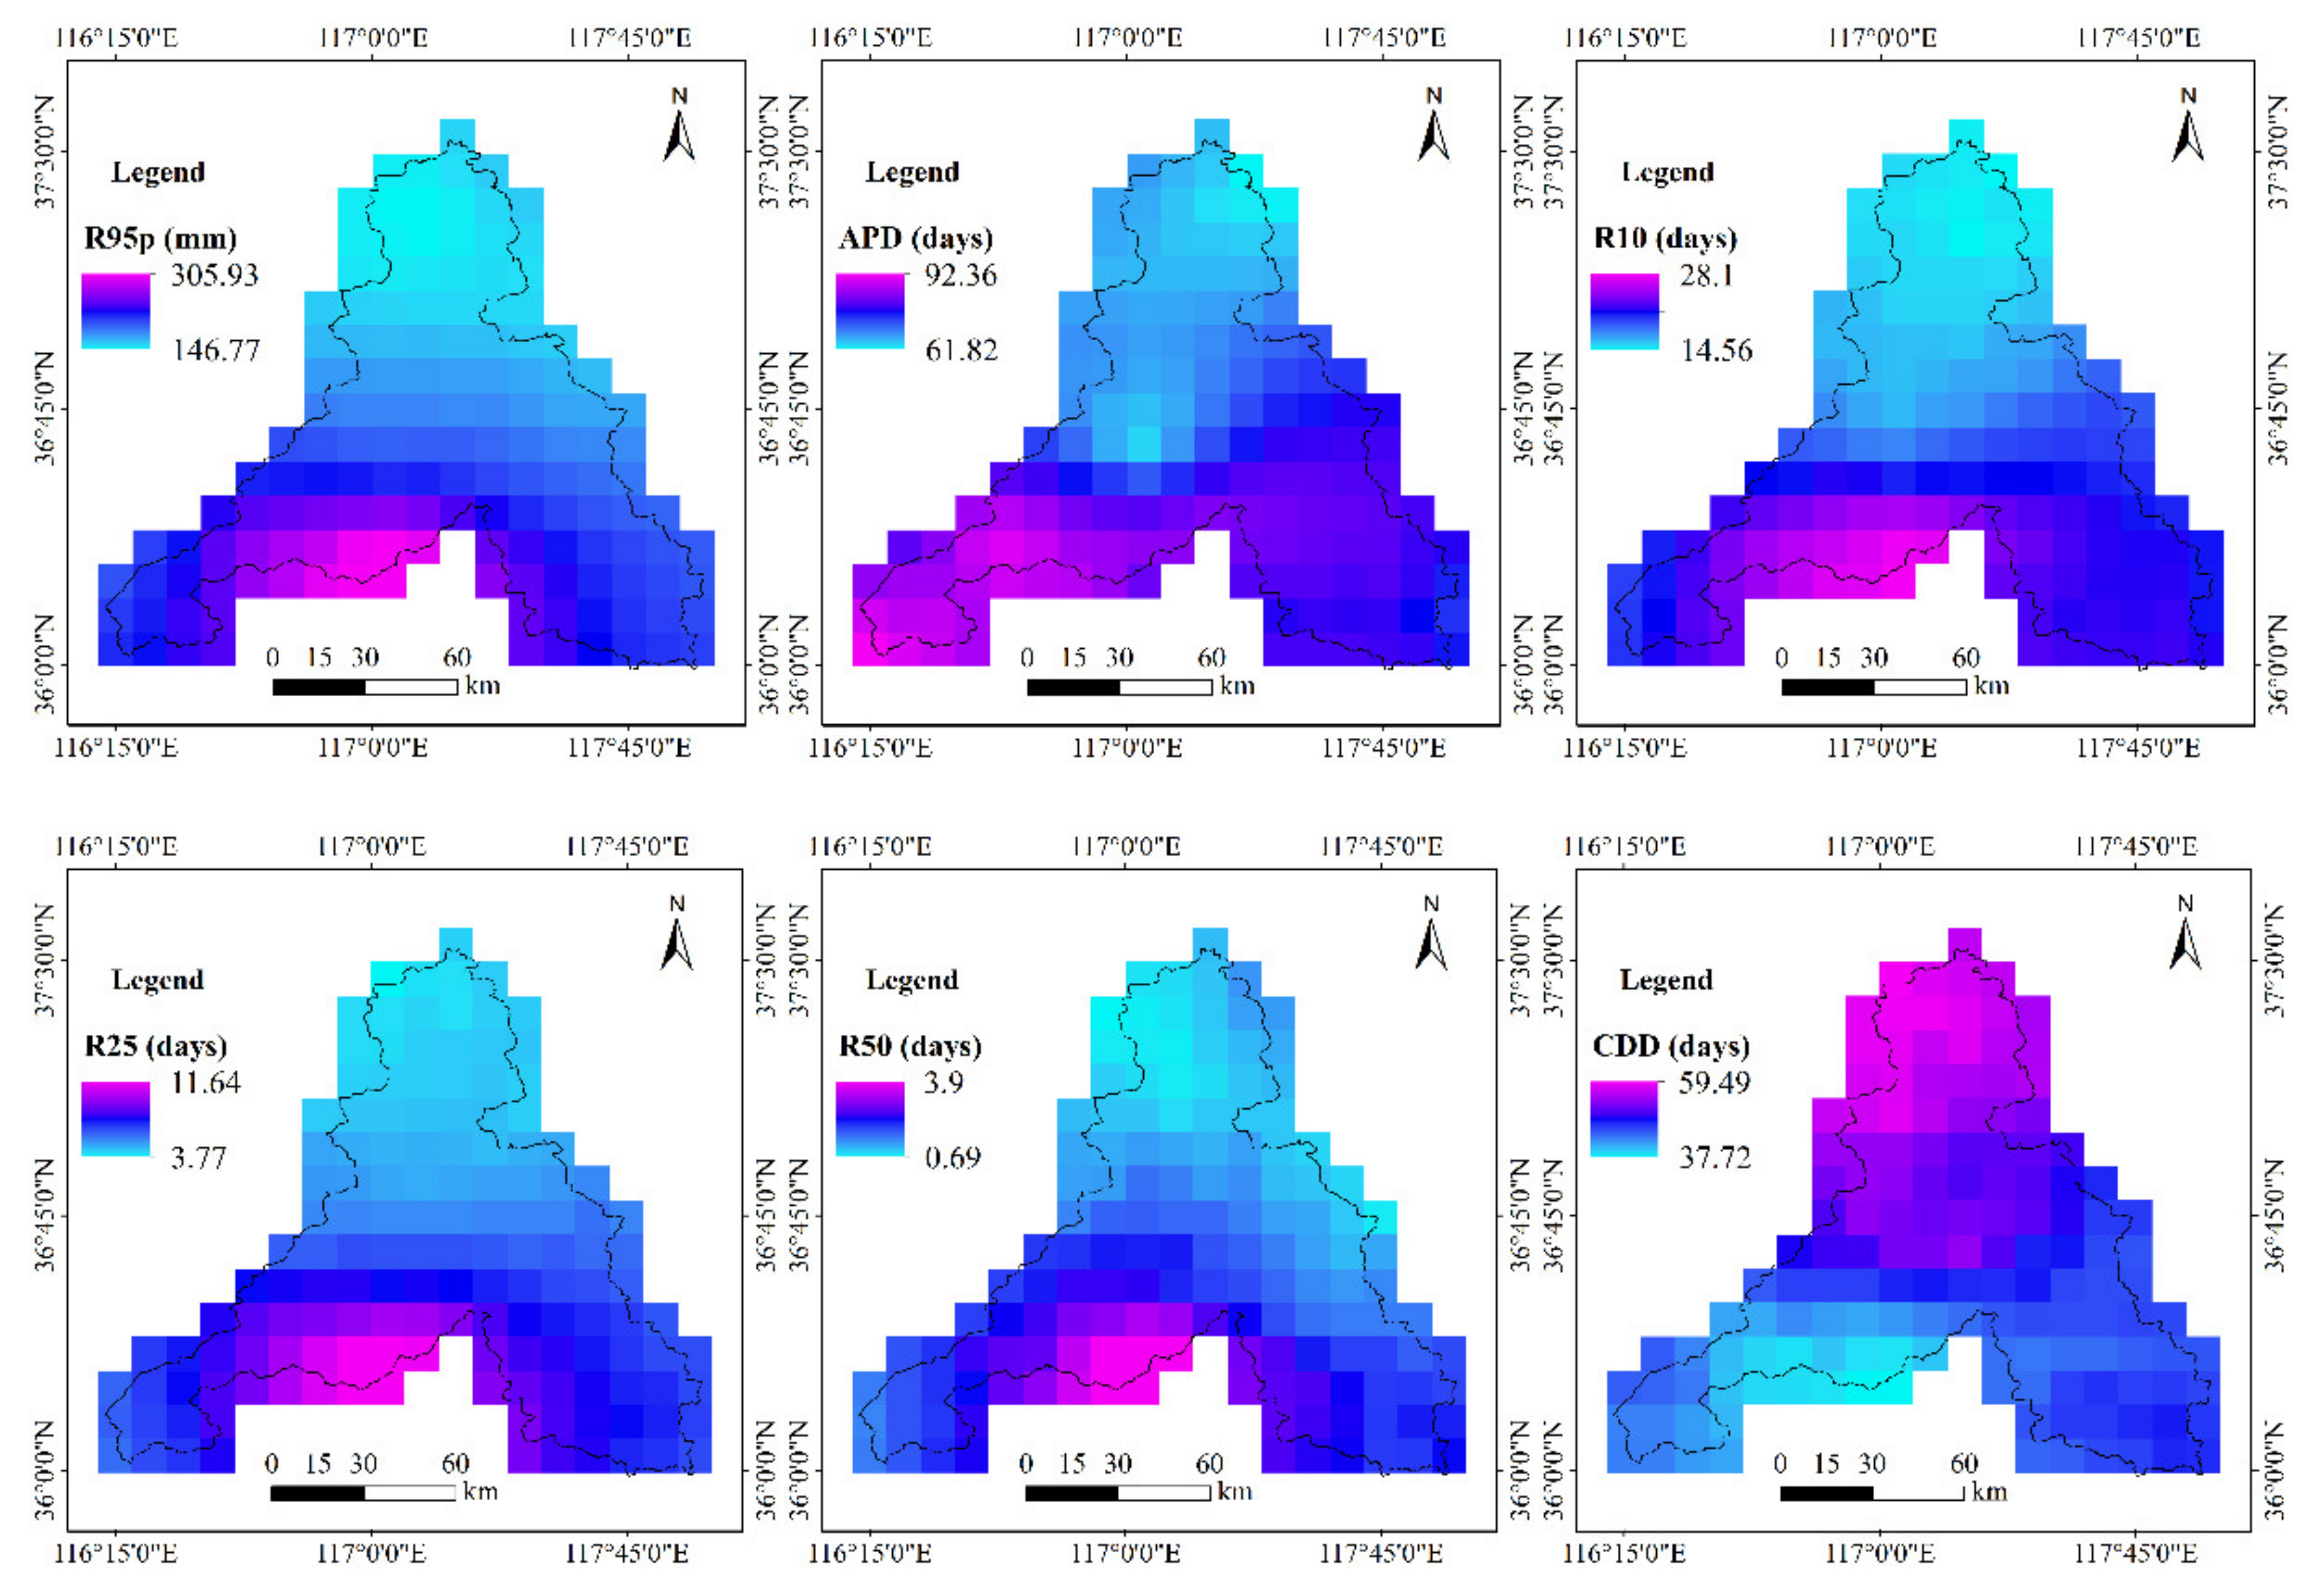
Based on precipitation data, nine precipitation indices, namely, simple daily intensity index (SDII), total wet-day precipitation (ATP), maximum 1-day precipitation (Rx1day), very-wet-day precipitation (R95p), count of precipitation days (APD), moderate rain days (R10), heavy rain days (R25), rainstorm days (R50) and consecutive dry days (CDD) were selected to analyze the spatial distribution of precipitation in Jinan City during the period of 1979–2017 (Figure 7). Most of the maximum values of precipitation indices are concentrated in the southern mountainous area of Jinan City, indicating that topography has a great influence on precipitation. The values of SDII, Rx1day, R50 and APD in the central and southeastern intensive construction areas are large. The values of ATP, R95p, R10 and R25 in the southeastern intensive construction areas are large. CDD shows an increasing trend from south to north, but it is notably small in the central intensive construction areas. The results show that the distribution of extreme precipitation is related to the urbanization process in Jinan City.
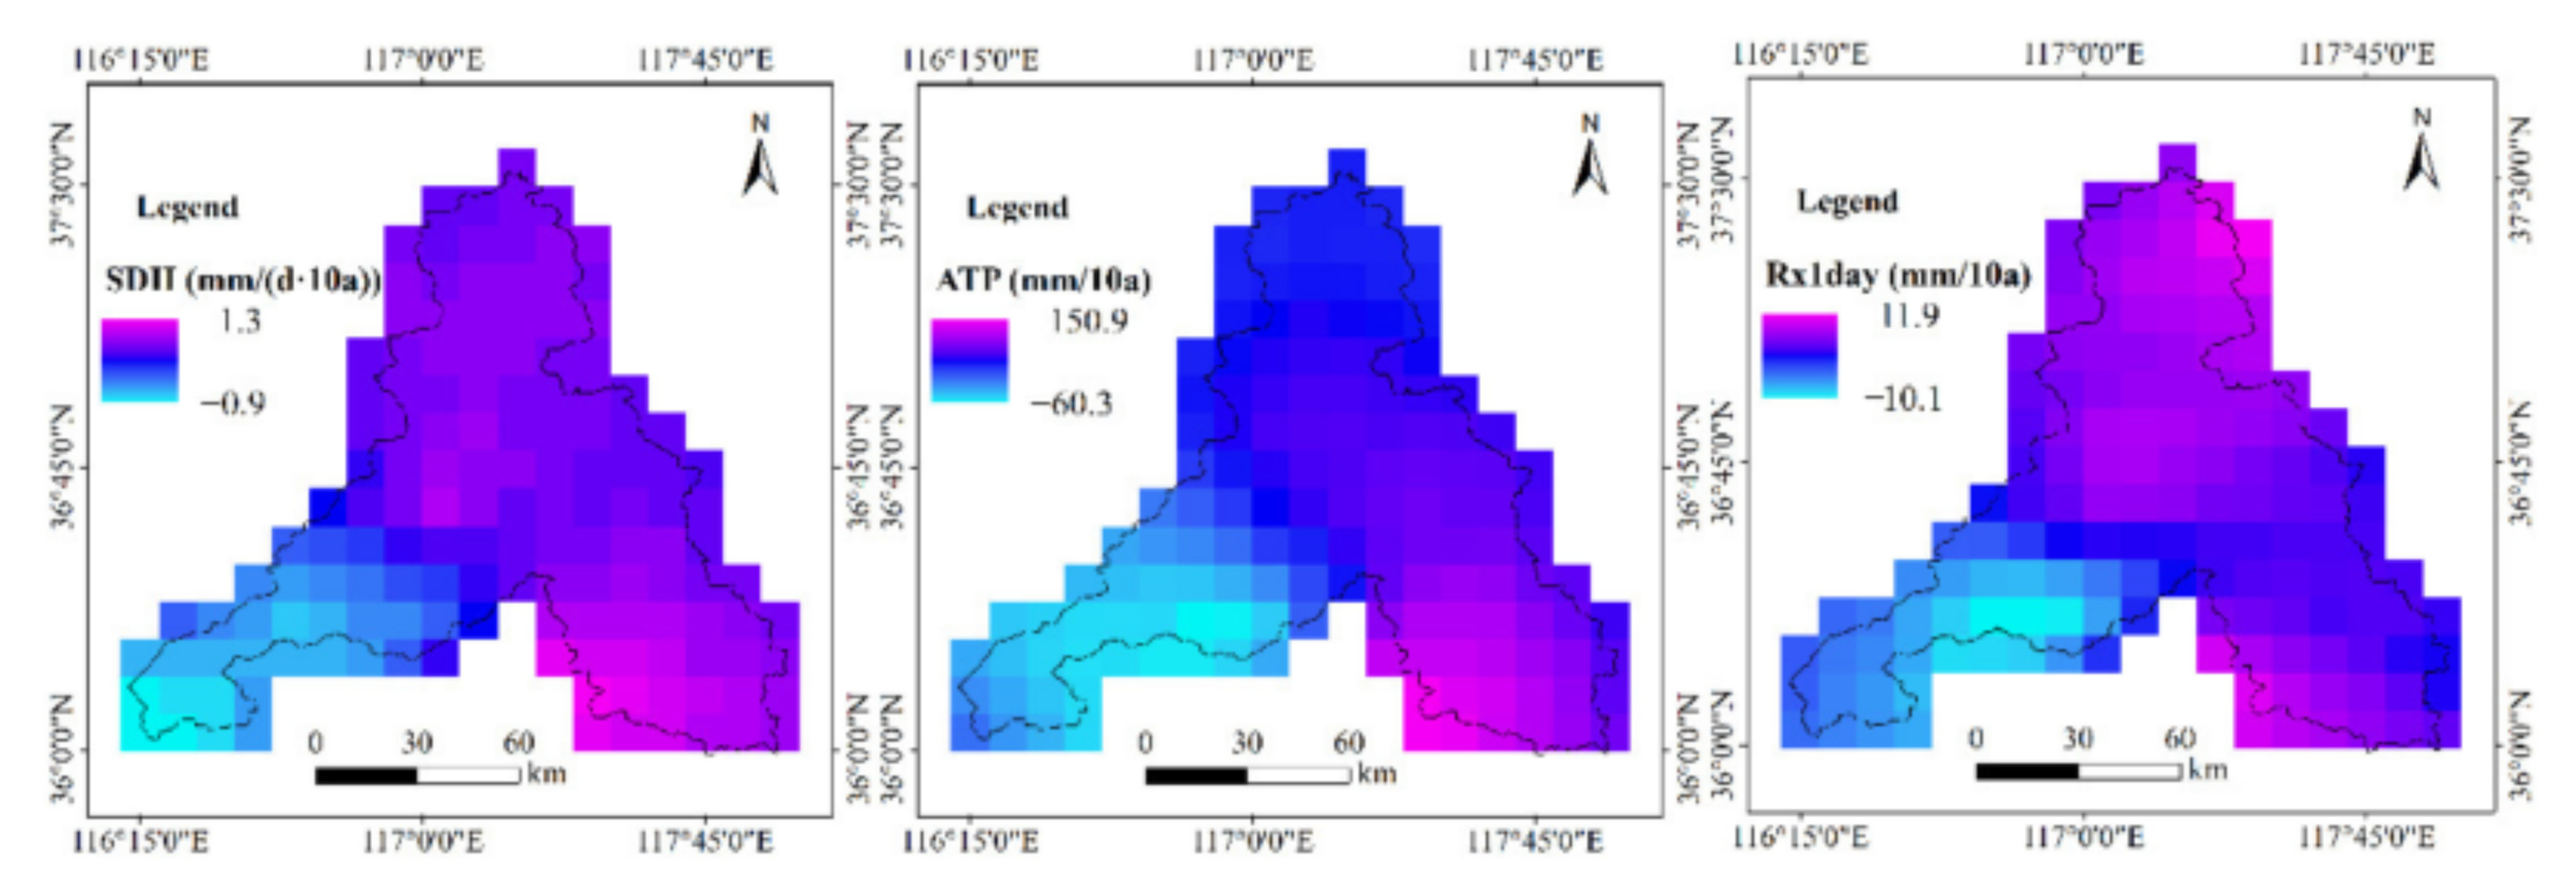
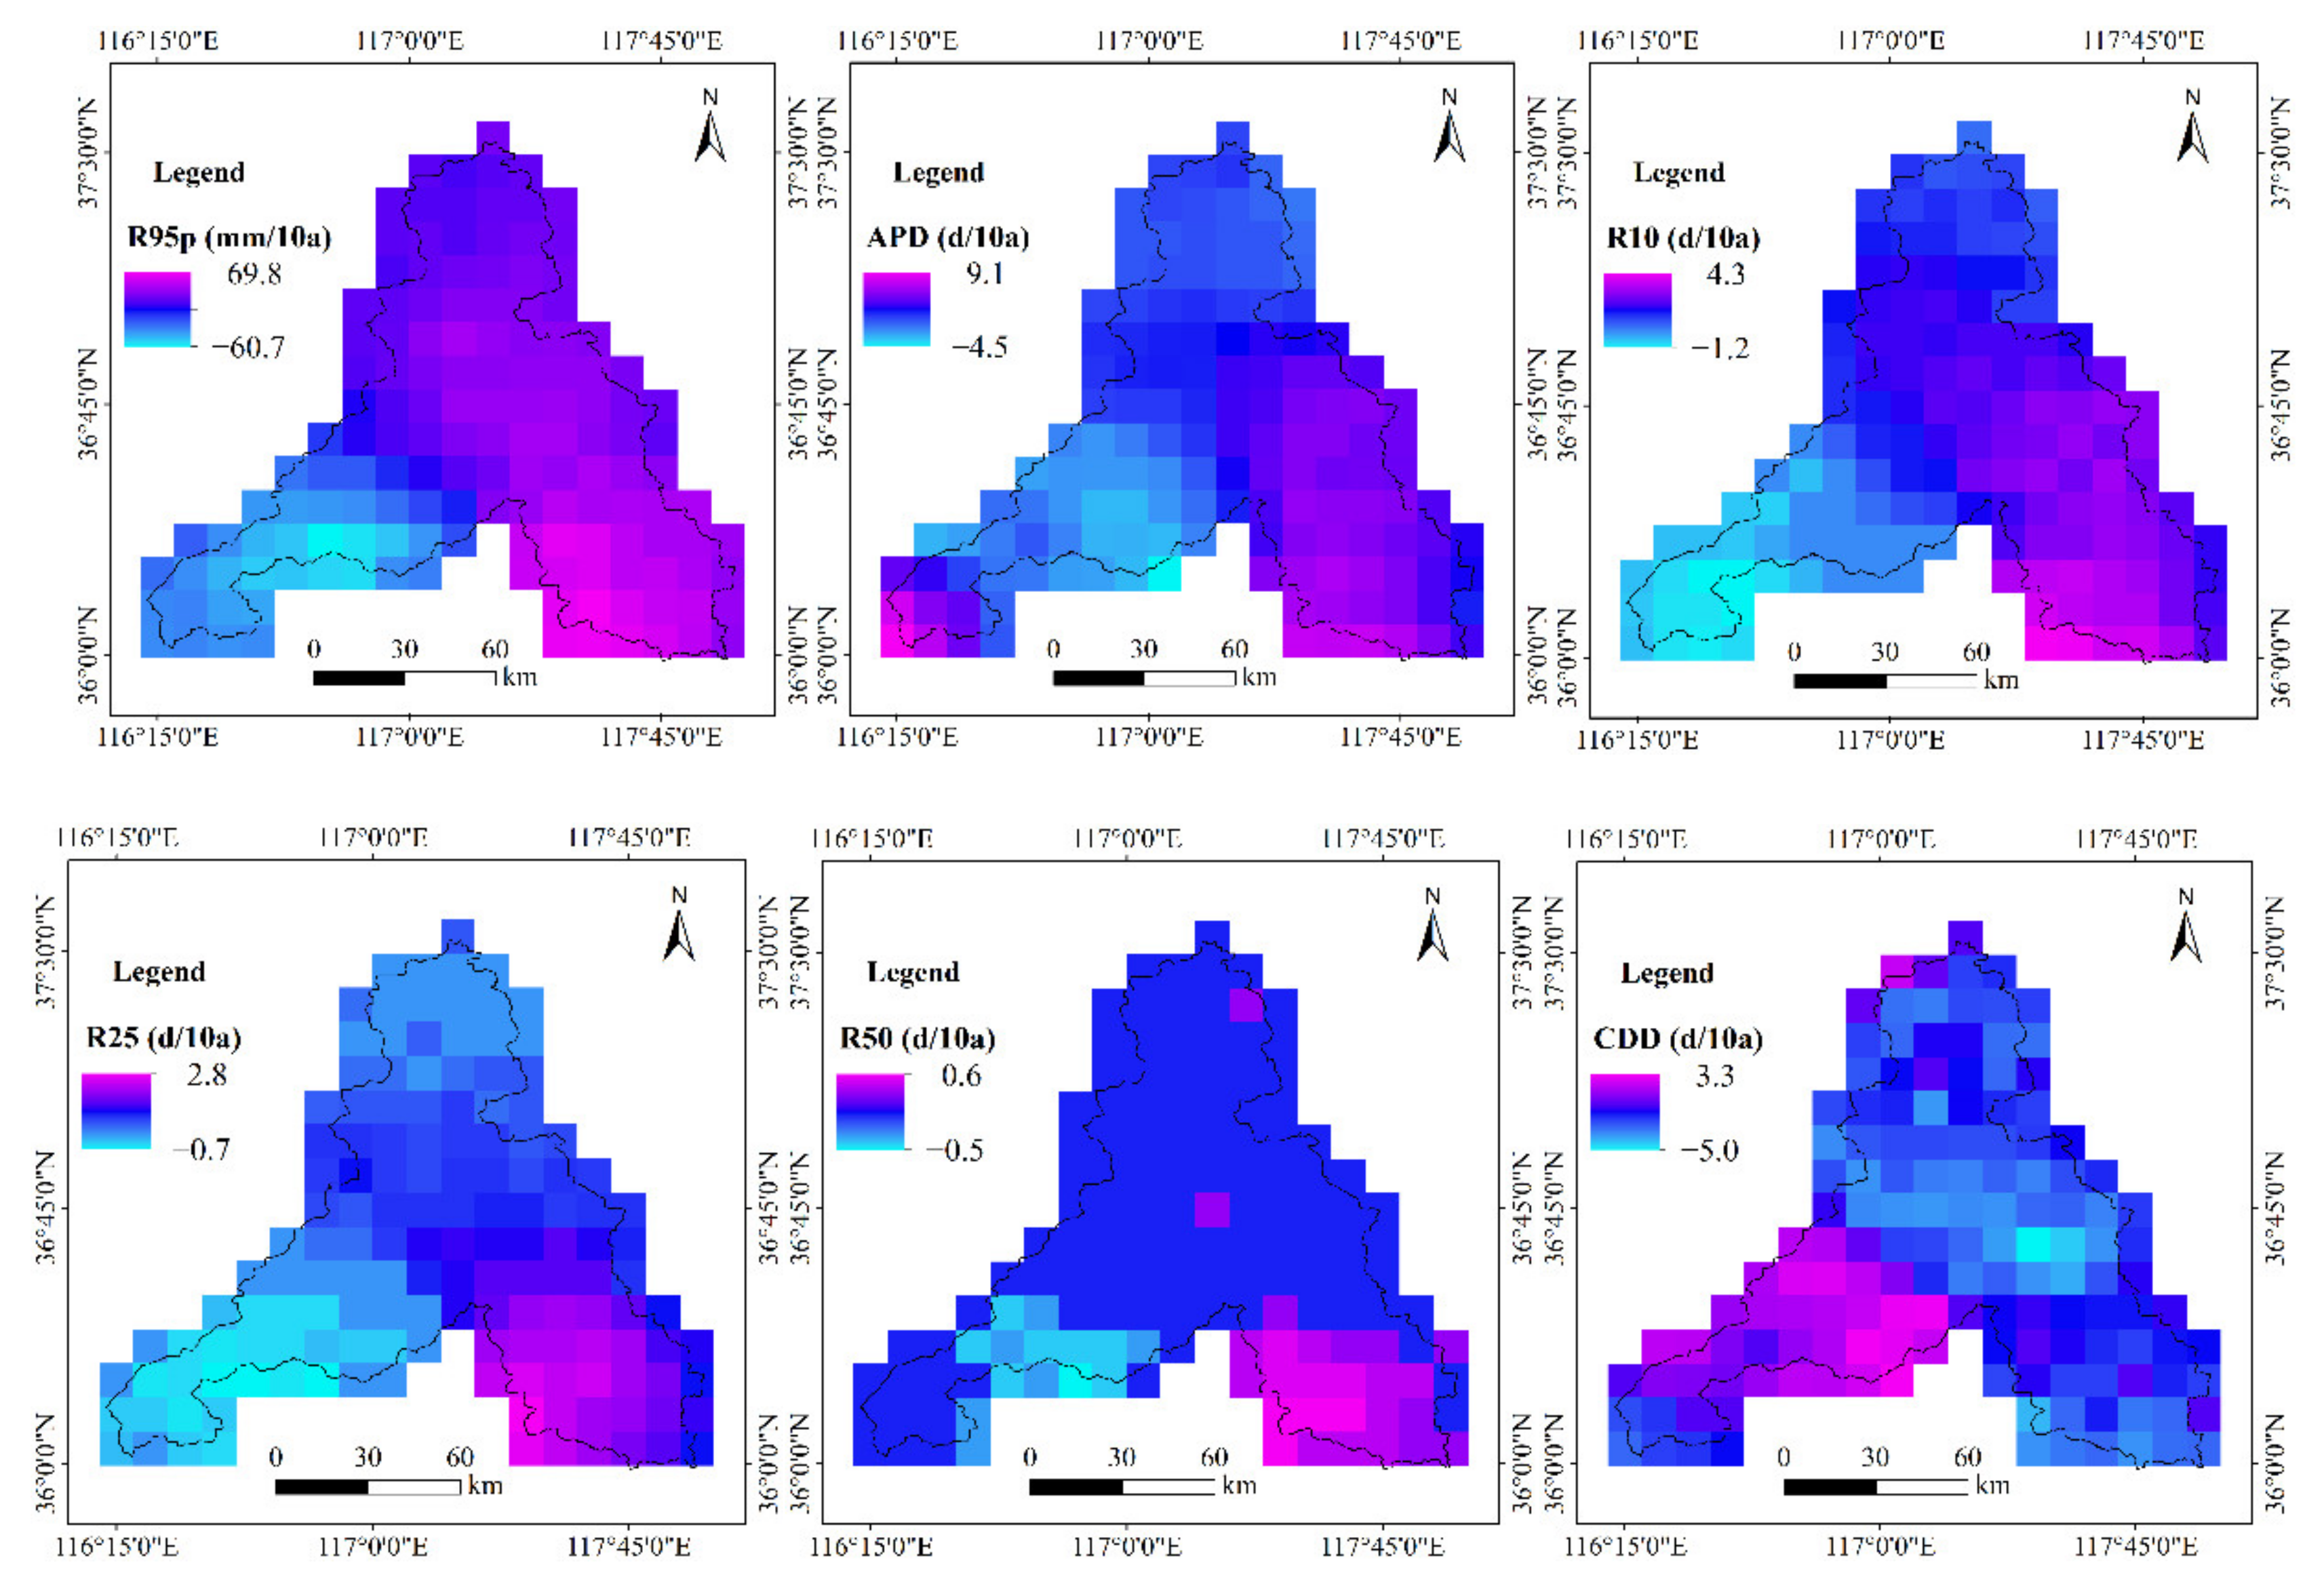
The above nine extreme precipitation indices were also selected to analyze the spatial variation of precipitation in Jinan City during the period of 1979–2017 (Figure 8). SDII, Rx1day and R95p in the central, southeastern and northern intensive construction areas show an increasing trend. ATP, APD and R10 in the central, southeastern intensive construction areas show an increasing trend. R25 and R50 in the southeastern intensive construction areas show an increasing trend. It is worth noting that the above indices show a decreasing trend in most of the sparse construction areas, especially in the southwest mountainous areas. On the contrary, CDD increases in the southwest sparse construction areas and decreases in intensive construction areas. The results prove that the increasing trend of extreme precipitation in the intensive construction areas is significant, and the rainfall center has a tendency to move towards to the intensive construction area.
3.3.3. Effects of Urban Expansion on Precipitation
In order to quantitatively analyze the impact of urban expansion on precipitation, the values of precipitation indices in sparse construction areas are subtracted from that in intensive construction areas every year so as to eliminate the impact of climate change on precipitation (Table 6).
SDII, ATP, R95p, JSTS, R10 and R25 show statistically significant trends. According to the results of the Pettitt test, the year of mutation of the nine precipitation indices occurred from 1986 to 1993, which may be related to the urbanization development of Jinan City. According to the results of the Pearson correlation analysis, most of the precipitation indices are positively correlated with the impervious surfaces proportion, while CDD is negatively correlated with the impervious surfaces proportion. SDII, ATP, R95p, JSTS, R10 and R25 show statistically significant trends, and the correlation is significant.
It can be observed that the magnitude (SDII, ATP, Rx1day and R95p) and frequency (APD, R10, R25 and R50) of extreme precipitation show an increasing trend, and there is a certain correlation between impervious surfaces and precipitation in Jinan City. Urbanization can lead to change in relevant precipitation indices. Jinan City shows a certain degree of the rain island effect.
4. Discussion
The impact of urban expansion on localized rainfall events in Jinan City is explored in this study. The results indicate that most of the differences in extreme climate indices in the intensive construction area and sparse construction area remarkably increase and have a strong correlation with impervious surfaces. It can be observed that urban expansion has a degree of impact on the local climate pattern in Jinan City. The results are generally consistent with the findings of previous studies. The study of Meng Dan et al. on the rainstorm on 21 July in Beijing showed that the distribution between the rain island and heat island was consistent [41]. The research of Cao Kun et al. showed that the trends of temperature and precipitation in Shanghai were basically the same, and the rain island effect was mainly concentrated in the flood season [42]. He Ping et al. studied the rain island effect in Chuxiong City, Yunnan Province, and the results showed that the urban area had a great influence on the intensity of rain island effect [43]. In addition, Kaufmann et al. found that urbanization may lead to urban precipitation deficit in the dry season by changing the underlying surface properties and local evaporation [44]. Their results indicate that the changes in extreme precipitation in urban areas are related to urban expansion.
The underlying mechanism of the rain island effect is as follows: urbanization can alter the patterns of circulation by changing the local thermodynamic conditions, which provides conditions favorable for the production of more extreme rainfall and rainstorm events [45]. The underlying surface has undergone drastic changes in urban areas. In horizontal landscapes, the permeable surfaces (such as cropland, forestland and grassland) have converted to impervious surfaces (such as residential area, commercial area and industrial area), and residential land witnessed the greatest growth [46,47]. In vertical landscapes, bungalows have converted to multi-layer and high-rise buildings, with high-rise buildings concentrated in the central urban areas and low-rise buildings concentrated in the city edge [48,49]. Urbanization causes changes in the surface energy balance, resulting in more sensible heat flux (SHF) and less maximum convective available potential energy (MCAPE) [50]. The increased SHF leads to an increase in the surface temperature and an elevated planetary boundary layer height (PBLH), leading to more water vapor mixing in the atmosphere over urban areas [51]. The decrease in MCAPE and increased surface roughness change the evolving convective activity, which leads to stronger low-level convergence and convection [52,53]. In addition, exhaust emissions of vehicles and buildings give off aerosols with condensation nuclei, which are conducive to the nucleation of cloud droplets [54]. It can be observed that the urban rain island effect is often accompanied by the urban heat island effect [55]. Some scholars have interpreted the mechanism of urbanization on local extreme climates through surface observations and climate models, as well as land–atmosphere coupling simulations under different urbanization scenarios [56,57]. It is worth pointing out that the above research is consistent with our study.
Extreme rainfall is frequently associated with climate change over this region. It is weakened to the greatest extent by calculating the difference between the indices of the intensive construction area and sparse construction area. We also analyze the characteristics of climate indices in the intensive construction area and sparse construction area separately. The results show that the variation trend of climate indices in the intensive construction area is significant. To some extent, the changes in climate indices are spatially consistent with the changes in urban expansion. In addition, the underlying surface factors of urbanization in this paper only consider impervious surfaces, and the impact of various land use changes on the regional climate pattern also needs to be further analyzed. In future research, a finer-resolution numerical model needs to be developed to explore the physical mechanism of urban expansion on extreme rainfall.
5. Conclusions
In this study, multiple climate indices are selected based on long-term series and high-resolution precipitation, temperature and impervious surface data. The role of urban expansion in the change of rainfall and temperature is comprehensively analyzed, and the mechanism of the rain island effect is discussed. The main conclusions are as follows:
- (1)
- Jinan City has experienced rapid urbanization since the 1978 economic reform. The impervious surface areas increased from 311.68 km2 (3.04%) in 1978 to 2389.50 km2 (23.33%) in 2017, and the impervious surfaces expanded year by year. The development of urbanization is mainly concentrated in the middle and southeast of Jinan City (intensive construction area), while the development of urbanization is relatively slow in the southern mountainous area, southwest and north of Jinan City (sparse construction area).
- (2)
- Urban expansion in Jinan City has a significant effect on temperature. On the one hand, the spatial distribution of temperature indices in Jinan City during the period of 1979–2017 is basically consistent with that of impervious surfaces, and the temperature in the intensive construction area is generally higher than that in the sparse construction area. On the other hand, urban expansion significantly decreases FD and DTR by 1.8 days and 0.1 °C, respectively, every 10 years, while TR increases by 1.1 days every 10 years. Moreover, there is a significant correlation between temperature indices and impervious surfaces in Jinan City.
- (3)
- Jinan City shows a certain degree of the rain island effect, which seems to be spatially correlated with the urban heat island effect. The frequency of events of short-duration precipitation increases, and the rainfall intensity of events generally increases. The precipitation in the wet season significantly increases in the intensive construction area. Urban expansion results in an increase of SDII, ATP, Rx1day, Rx95p, APD, R10, R25 and R50, while a decrease in CDD can be observed. There is a tendency that Jinan City’s rainfall center moves towards to the intensive construction area. In addition, the development of urbanization results in an increase in precipitation intensity and a decrease in the surface infiltration capacity in the intensive construction area of Jinan City, which is also one of the main reasons for frequent rainstorm and flood disasters in the central area of the city in recent years.
Author Contributions
Conceptualization, Y.Z. and Z.X.; methodology, Y.Z. and Z.X.; software, Y.Z.; validation, Y.Z. and P.L.; formal analysis, Y.Z.; investigation, Y.Z.; resources, J.X. and Z.X.; data curation, Y.Z. and Y.Q.; writing—original draft preparation, Y.Z.; writing—review and editing, Y.Z. and L.Z.; visualization, Y.Z.; supervision, J.X.; project administration, J.X. and L.Z.; funding acquisition, J.X. All authors have read and agreed to the published version of the manuscript.
Funding
This research was funded by the Strategic Priority Research Program of the Chinese Academy of Sciences, (Grant No. XDA23040304) and the National Key R&D Program of China (2017YFC1502701) and the Geology and Mineral Resources Survey Project: Ecological Configuration and Global Strategy of China Water Resources (DD20190652).
Acknowledgments
We thank the A Big Earth Data Platform for Three Poles for providing the climate data and the Finer Resolution Observation and Monitoring–Global Land Cover for providing the impervious surface data.
Conflicts of Interest
The authors declare no conflict of interest.
References
- United Nations; Population Division of the Department of Economic and Social Affairs. World Urbanization Prospects: The 2018 Revision, (ST/ESA/SER.A/366); United Nations: New York, NY, USA, 2019. [Google Scholar]
- Zhang, Y.; Pang, X.; Xia, J.; Shao, Q.; Yu, E.; Zhao, T.; She, D.; Sun, J.; Yu, J.; Pan, X.; et al. Regional Patterns of Extreme Precipitation and Urban Signatures in Metropolitan Areas. J. Geophys. Res. Atmos. 2019, 124, 641–663. [Google Scholar] [CrossRef]
- Demuzere, M.; Oleson, K.; Coutts, A.M.; Pigeon, G.; Van Lipzig, N.P.M. Simulating the surface energy balance over two contrasting urban environments using the Community Land Model Urban. Int. J. Clim. 2013, 33, 3182–3205. [Google Scholar] [CrossRef] [Green Version]
- Xia, J.; Zhang, Y.; Xiong, L.; He, S.; Wang, L.; Yu, Z. Opportunities and challenges of the Sponge City construction related to urban water issues in China. Sci. China Earth Sci. 2017, 60, 652–658. [Google Scholar] [CrossRef]
- Cao, Q.; Yu, D.Y.; Georgescu, M.; Wu, J.G. Impacts of urbanization on summer climate in China: An assessment with coupled land-atmospheric modeling. J. Geophys. Res. Atmos. 2016, 121, 10505–10521. [Google Scholar] [CrossRef]
- Li, H.; Liu, L.; Xu, Z. Greening Implication Inferred from Vegetation Dynamics Interacted with Climate Change and Human Activities over the Southeast Qinghai–Tibet Plateau. Remote. Sens. 2019, 11, 2421. [Google Scholar] [CrossRef] [Green Version]
- Liu, F.-H.; Xu, C.-Y.; Yang, X.-X.; Ye, X.-C. Controls of Climate and Land-Use Change on Terrestrial Net Primary Productivity Variation in a Subtropical Humid Basin. Remote. Sens. 2020, 12, 3525. [Google Scholar] [CrossRef]
- Zhao, L.; Lee, X.; Smith, R.B.; Oleson, K. Strong contributions of local background climate to urban heat islands. Nat. Cell Biol. 2014, 511, 216–219. [Google Scholar] [CrossRef] [PubMed]
- Rizwan, A.M.; Dennis, L.Y.; Liu, C. A review on the generation, determination and mitigation of Urban Heat Island. J. Environ. Sci. 2008, 20, 120–128. [Google Scholar] [CrossRef]
- Ward, K.; Lauf, S.; Kleinschmit, B.; Endlicher, W. Heat waves and urban heat islands in Europe: A review of relevant drivers. Sci. Total. Environ. 2016, 569–570, 527–539. [Google Scholar] [CrossRef] [PubMed]
- Rozoff, C.M.; Cotton, W.R.; Adegoke, J.O. Simulation of St. Louis, Missouri, Land Use Impacts on Thunderstorms. J. Appl. Meteorol. 2003, 42, 716–738. [Google Scholar] [CrossRef]
- Zhang, Y.; Wen, X.-Y.; Jang, C. Simulating chemistry–aerosol–cloud–radiation–climate feedbacks over the continental U.S. Using the online-coupled Weather Research Forecasting Model with chemistry (WRF/Chem). Atmos. Environ. 2010, 44, 3568–3582. [Google Scholar] [CrossRef]
- Dou, J.J.; Wang, Y.C.; Bornstein, R.; Miao, S.L. Observed Spatial Characteristics of Beijing Urban Climate Impacts on Summer Thunder storms. J. Appl. Meteorol. Climatol. 2015, 54, 94–105. [Google Scholar] [CrossRef]
- Shepherd, J.M.; Burian, S.J. Detection of Urban-Induced Rainfall Anomalies in a Major Coastal City. Earth Interact. 2003, 7, 1–17. [Google Scholar] [CrossRef] [Green Version]
- Ganeshan, M.; Murtugudde, R.; Imhoff, M.L. A multi-city analysis of the UHI-influence on warm season rainfall. Urban Clim. 2013, 6, 1–23. [Google Scholar] [CrossRef]
- Miao, S.; Chen, F.; Li, Q.; Fan, S. Impacts of Urban Processes and Urbanization on Summer Precipitation: A Case Study of Heavy Rainfall in Beijing on 1 August 2006. J. Appl. Meteorol. Clim. 2011, 50, 806–825. [Google Scholar] [CrossRef]
- Yang, L.; Tian, F.; Smith, J.A.; Hu, H. Urban signatures in the spatial clustering of summer heavy rainfall events over the Beijing metropolitan region. J. Geophys. Res. Atmos. 2014, 119, 1203–1217. [Google Scholar] [CrossRef]
- Li, S.; Ma, J. Impact of urbanization on precipitation in Beijing area. J. Meteorol. Sci. 2011, 31, 414–421. [Google Scholar]
- Liu, J.; Xia, J.; She, D.; Li, L.; Wang, Q.; Zou, L. Evaluation of Six Satellite-Based Precipitation Products and Their Ability for Capturing Characteristics of Extreme Precipitation Events over a Climate Transition Area in China. Remote. Sens. 2019, 11, 1477. [Google Scholar] [CrossRef] [Green Version]
- Segoni, S.; Caleca, F. Definition of Environmental Indicators for a Fast Estimation of Landslide Risk at National Scale. Land 2021, 10, 621. [Google Scholar] [CrossRef]
- Zope, P.; Eldho, T.; Jothiprakash, V. Impacts of land use–land cover change and urbanization on flooding: A case study of Oshiwara River Basin in Mumbai, India. Catena 2016, 145, 142–154. [Google Scholar] [CrossRef]
- Li, G.R.; Lei, Y.L.; Yao, H.J.; Wu, S.M.; Ge, J.P. The influence of land urbanization on landslides: An empirical estima tion based on Chinese provincial panel data. Sci. Total Environ. 2017, 595, 681–690. [Google Scholar] [CrossRef] [PubMed]
- Shepherd, J.M. A Review of Current Investigations of Urban-Induced Rainfall and Recommendations for the Future. Earth Interact. 2005, 9, 1–27. [Google Scholar] [CrossRef] [Green Version]
- Yang, L.; Smith, J.A.; Baeck, M.L.; Bou-Zeid, E.; Jessup, S.M.; Tian, F.Q.; Hu, H.P. Impact of Urbanization on Heavy Convective Precipitation under Strong Large-Scale Forcing: A Case Study over the Milwaukee-Lake Michigan Region. J. Hydrometeorol. 2014, 15, 261–278. [Google Scholar] [CrossRef]
- Ramamurthy, P.; Bou-Zeid, E. Contribution of impervious surfaces to urban evaporation. Water Resour. Res. 2014, 50, 2889–2902. [Google Scholar] [CrossRef]
- Kalnay, E.; Cai, M. Impact of urbanization and land-use change on climate. Nature 2003, 423, 528–531. [Google Scholar] [CrossRef]
- Yang, Y.-J.; Wu, B.-W.; Shi, C.-E.; Zhang, J.-H.; Li, Y.-B.; Tang, W.-A.; Wen, H.-Y.; Zhang, H.-Q.; Shi, T. Impacts of Urbanization and Station-relocation on Surface Air Temperature Series in Anhui Province, China. Pure Appl. Geophys. 2012, 170, 1969–1983. [Google Scholar] [CrossRef]
- Li, P.; Xu, Z.; Ye, C.; Ren, M.; Chen, H.; Wang, J.; Song, S. Assessment on IMERG V06 Precipitation Products Using Rain Gauge Data in Jinan City, Shandong Province, China. Remote. Sens. 2021, 13, 1241. [Google Scholar] [CrossRef]
- Yang, K.; He, J. China meteorological forcing dataset (1979–2018). A Big Earth Data Platform for Three Poles. Natl. Tibet. Plateau Data Cent. 2019, 10. [Google Scholar] [CrossRef]
- He, J.; Yang, K.; Tang, W.; Lu, H.; Qin, J.; Chen, Y.; Li, X. The first high-resolution meteorological forcing dataset for land process studies over China. Sci. Data 2020, 7, 1–11. [Google Scholar] [CrossRef] [PubMed] [Green Version]
- Gong, P.; Li, X.; Zhang, W. 40-Year (1978–2017) human settlement changes in China reflected by impervious surfaces from satellite remote sensing. Sci. Bull. 2019, 64, 756–763. [Google Scholar] [CrossRef] [Green Version]
- Chang, X.; Xu, Z.; Zhao, G.; Cheng, T.; Song, S. Spatial and temporal variations of precipitation during 1979–2015 in Jinan City, China. J. Water Clim. Chang. 2017, 9, 540–554. [Google Scholar] [CrossRef]
- Wei, W.; Shi, Z.; Yang, X.; Wei, Z.; Liu, Y.; Zhang, Z.; Ge, G.; Zhang, X.; Guo, H.; Zhang, K.; et al. Recent Trends of Extreme Precipitation and Their Teleconnection with Atmospheric Circulation in the Beijing-Tianjin Sand Source Region, China, 1960–2014. Atmosphere 2017, 8, 83. [Google Scholar] [CrossRef] [Green Version]
- Feng, R.; Yu, R.; Zheng, H.; Gan, M. Spatial and temporal variations in extreme temperature in Central Asia. Int. J. Clim. 2017, 38, e388–e400. [Google Scholar] [CrossRef]
- Zhang, J.; Shen, X.; Wang, B. Changes in precipitation extremes in Southeastern Tibet, China. Quat. Int. 2015, 380–381, 49–59. [Google Scholar] [CrossRef]
- Deng, S.L.; Chen, T.; Yang, N.; Qu, L.A.; Li, M.C.; Chen, D. Spatial and temporal distribution of rainfall and drought characteristics across the Pearl River basin. Sci. Total. Environ. 2018, 619, 28–41. [Google Scholar] [CrossRef] [PubMed]
- Wang, R.H.; Li, C. Spatiotemporal analysis of precipitation trends during 1961–2010 in Hubei province, central China. Theor. Appl. Climatol. 2016, 124, 385–399. [Google Scholar] [CrossRef]
- Sen, P.K. Estimates of the regression coefficient based on Kendall’s tau. J. Am. Stat. Assoc. 1968, 63, 1379. [Google Scholar] [CrossRef]
- Mallakpour, I.; Villarini, G. A simulation study to examine the sensitivity of the Pettitt test to detect abrupt changes in mean. Hydrol. Sci. J. 2015, 61, 245–254. [Google Scholar] [CrossRef] [Green Version]
- Holgado-Tello, F.P.; Chacon-Moscoso, S.; Barbero-Garcia, I.; Vila-Abad, E. Polychoric versus Pearson correlations in exploratory and confirmatory factor analysis of ordinal variables. Qual. Quant. 2010, 44, 153–166. [Google Scholar] [CrossRef]
- Meng, D.; Gong, H.L.; Li, X.J.; Yang, S.Y. Spatiotemporal distribution of the rainstorm and the relationship between urban heat island and urban rain island in Beijing on July 21, 2012. Remote. Sens. Land Resour. 2017, 29, 178–185. [Google Scholar]
- Cao, K.; Ge, Z.X.; Xue, M.; Song, Y.Y. Analysis of Urban Rain Island Effect in Shanghai and Its Changing Trend. Water Resour. Power 2009, 27, 31–33. [Google Scholar]
- He, P.; Jiang, Y.P.; Li, J.X.; Zhang, Q.Y. Influence of urbanization on urban rain island effect of Chuxiong City on Yunnan Plateau in recent years. Arid. Land Geogr. 2017, 40, 933–941. [Google Scholar]
- Kaufmann, R.K.; Seto, K.C.; Schneider, A.; Liu, Z.T.; Zhou, L.M.; Wang, W.L. Climate response to rapid urban growth: Evidence of a human-induced precipitation deficit. J. Clim. 2007, 20, 2299–2306. [Google Scholar] [CrossRef]
- Zhang, H.; Wu, C.; Chen, W.; Huang, G. Effect of urban expansion on summer rainfall in the Pearl River Delta, South China. J. Hydrol. 2019, 568, 747–757. [Google Scholar] [CrossRef]
- Qi, S.Z.; Guo, J.M.; Jia, R.; Sheng, W.F. Land use change induced ecological risk in the urbanized karst region of North China: A case study of Jinan city. Environ. Earth Sci. 2020, 79, 1–8. [Google Scholar] [CrossRef]
- Li, P.J.; Zuo, D.P.; Xu, Z.X.; Gao, X.X.; Peng, D.Z.; Kan, G.Y.; Sun, W.C.; Pang, B.; Yang, H. Impact of urbanization on variability of annual and flood season precipitation in a typical city of North China. Hydrol. Res. 2020, 51, 1150–1169. [Google Scholar] [CrossRef]
- Xue, C.; Zheng, X.Q.; Zhang, B.; Yuan, Z.Y. Evolution of a multidimensional architectural landscape under urban regeneration: A case study of Jinan, China. Ecol. Indic. 2015, 55, 12–22. [Google Scholar] [CrossRef]
- Kong, F.; Nakagoshi, N. Spatial-temporal gradient analysis of urban green spaces in Jinan, China. Landsc. Urban Plan. 2006, 78, 147–164. [Google Scholar] [CrossRef]
- Zhang, Y.; Smith, J.A.; Luo, L.; Wang, Z.; Baeck, M.L. Urbanization and Rainfall Variability in the Beijing Metropolitan Region. J. Hydrometeorol. 2014, 15, 2219–2235. [Google Scholar] [CrossRef]
- Yu, M.; Miao, S.; Li, Q. Synoptic analysis and urban signatures of a heavy rainfall on 7 August 2015 in Beijing. J. Geophys. Res. Atmos. 2017, 122, 65–78. [Google Scholar] [CrossRef]
- Changnon, S.A.; Westcott, N.E. Heavy rainstorms in Chicago: Increasing frequency, altered impacts, and future implications. J. Am. Water Resour. Assoc. 2002, 38, 1467–1475. [Google Scholar] [CrossRef]
- Bornstein, R.; Lin, Q. Urban heat islands and summertime convective thunderstorms in Atlanta: Three case studies. Atmospheric Environ. 2000, 34, 507–516. [Google Scholar] [CrossRef]
- Sailor, D.J. A review of methods for estimating anthropogenic heat and moisture emissions in the urban environment. Int. J. Clim. 2011, 31, 189–199. [Google Scholar] [CrossRef]
- Ramanathan, V.; Crutzen, P.J.; Kiehl, J.T.; Rosenfeld, D. Atmosphere—Aerosols, climate, and the hydrological cycle. Science 2001, 294, 2119–2124. [Google Scholar] [CrossRef] [PubMed] [Green Version]
- Song, X.M.; Zhang, J.Y.; AghaKouchak, A.; Sen Roy, S.; Xuan, Y.Q.; Wang, G.Q.; He, R.M.; Wang, X.J.; Liu, G.S. Rapid urbanization and changes in spatiotemporal charac teristics of precipitation in Beijing metropolitan area. J. Geophys. Res. Atmos. 2014, 119, 11250–11271. [Google Scholar] [CrossRef] [Green Version]
- Bounoua, L.; Zhang, P.; Mostovoy, G.; Thome, K.J.; Masek, J.G.; Imhoff, M.L.; Shepherd, M.; Quattrochi, D.; Santanello, J.A.; Silva, J.; et al. Impact of urbanization on US surface climate. Environ. Res. Lett. 2015, 10, 084010. [Google Scholar] [CrossRef] [Green Version]
Figure 1.
(a) Geographic location and elevation of Jinan City; (b) impervious surfaces zoning of Jinan City.
Figure 1.
(a) Geographic location and elevation of Jinan City; (b) impervious surfaces zoning of Jinan City.

Figure 2.
Proportions of impervious surfaces in Jinan City (the blue dots represent interpolation data during the period of 1979–1984).
Figure 2.
Proportions of impervious surfaces in Jinan City (the blue dots represent interpolation data during the period of 1979–1984).

Figure 3.
Spatial distribution of impervious surface areas in Jinan City during the period of 1978–2017.
Figure 3.
Spatial distribution of impervious surface areas in Jinan City during the period of 1978–2017.

Figure 4.
Spatial distribution of temperature indices in Jinan City during the period of 1979–2017.


Figure 5.
Spatial variation trend of the temperature indices in Jinan City during the period of 1979–2017.
Figure 5.
Spatial variation trend of the temperature indices in Jinan City during the period of 1979–2017.

Figure 6.
The trend of precipitation in Jinan City during the period of 1979–2017.

Figure 7.
Spatial distribution of precipitation indices in Jinan City during the period of 1979–2017.
Figure 7.
Spatial distribution of precipitation indices in Jinan City during the period of 1979–2017.


Figure 8.
Spatial variation trend of precipitation indices in Jinan City during the period of 1979–2017.
Figure 8.
Spatial variation trend of precipitation indices in Jinan City during the period of 1979–2017.


Table 1.
Description of data source.
| Data | Resolution | Unit | Metadata | Data Sources |
|---|---|---|---|---|
| Precipitation | 3 h and 0.1° | mm hr−1 | CMA station data GLDAS NOAH10SUBP 3H GLDAS NOAH025 3H TRMM 3B42 | CMFD (A Big Earth Data Platform for Three Poles) |
| Temperature | 3 h and 0.1° | K | CMA station data GLDAS NOAH10SUBP 3H | CMFD (A Big Earth Data Platform for Three Poles) |
| Impervious surfaces | 1 y and 30 m (60 m in 1978) | Landsat MSS 1–5, TM 4–5, ETM+, LC8; NTL data | Database of Tsinghua University (Finer Resolution Observation and Monitoring–Global Land Cover) |
Table 2.
Definitions of the precipitation and temperature indices.
| Index | Description | Units |
|---|---|---|
| Tm | Annual mean temperature | °C |
| TR | Annual count of days when daily minimum temperature>20°C | days |
| FD | Annual count of days when daily minimum temperature<0°C | days |
| DTR | Average of daily temperature difference | °C |
| SDII | Annual total precipitation divided by wet days in the year | mm/day |
| ATP | Annual total precipitation in wet days | mm |
| Rx1day | Annual maximum 1-day precipitation | mm |
| R95p | Annual precipitation when DP > 95th percentile | mm |
| APD | Number of wet days in the year | days |
| R10 | Annual count of days when DP ≥ 10 mm | days |
| R25 | Annual count of days when DP ≥ 25 mm | days |
| R50 | Annual count of days when DP ≥ 50 mm | days |
| CDD | Maximum number of consecutive days when DP < 1 mm | days |
DP means daily precipitation; a wet day is defined by DP ≥ 1 mm.
Table 3.
The impact of urban expansion on temperature in Jinan City during the period of 1979–2017.
| M-K Test | Pettitt Test | Pearson Correlation Analysis | |||||||
|---|---|---|---|---|---|---|---|---|---|
| Z Value | Trends | Sen’s Slope | Change Point (Year) | p Value | Trends | R Value | p Value | Correlation | |
| Tm | 1.44 | Positive | 0.05 °C·(10 a)−1 | 1991 | <0.01 | * | 0.16 | 0.34 | Positive |
| TR | 2.73 | Positive * | 1.1 days·(10 a)−1 | 1991 | <0.01 | * | 0.48 | <0.01 | Positive * |
| FD | −3.6 | Negative * | −1.8 days·(10 a)−1 | 1991 | <0.01 | * | −0.6 | <0.01 | Negative * |
| DTR | −3 | Negative * | −0.1 °C·(10 a)−1 | 1991 | <0.01 | * | −0.6 | <0.01 | Negative * |
* Significant at the 0.05 level.
Table 4.
Characteristic of precipitation in wet season and dry season in Jinan City during the period of 1979–2017.
Table 4.
Characteristic of precipitation in wet season and dry season in Jinan City during the period of 1979–2017.
| Area | Period | Mean (mm) | Range (mm) | Z Value | Trends | Sen’s Slope (mm/10 a) |
|---|---|---|---|---|---|---|
| Intensive construction area | wet season | 603.24 | 258.87 to 947.19 | 2.23 | Positive * | 46.7 |
| dry season | 56.16 | 15.24 to 249.64 | 1.74 | Positive | 8.4 | |
| Sparse construction area | wet season | 638.84 | 298.26 to 949.48 | 1.55 | Positive | 30.4 |
| dry season | 61.36 | 21.72 to 272.02 | 1.09 | Positive | 4.5 |
* Significant at the 0.05 level.
Table 5.
Duration and intensity of precipitation events.
| M-K Test | Pettitt Test | |||||
|---|---|---|---|---|---|---|
| Z Value | Trends | Sen’s Slope | Change Point (Year) | p Value | Trends | |
| N1–3h | 5.09 | Positive * | 20.8 times·(10 a)−1 | 1997 | <0.01 | * |
| P1–3h | 4.39 | Positive * | 0.3 mm·(1–3 h·10 a)−1 | 1995 | <0.01 | * |
| N4–6h | 3.41 | Positive * | 5.4 times·(10 a)−1 | 2000 | <0.01 | * |
| P4–6h | 4.72 | Positive * | 0.6 mm·(4–6 h·10 a)−1 | 1997 | <0.01 | * |
| N7–9h | 5.2 | Positive * | 3.4 times·(10 a)−1 | 1997 | <0.01 | * |
| P7–9h | 3.73 | Positive * | 1.9 mm·(7–9 h·10 a)−1 | 1996 | <0.01 | * |
| N10–12h | −2.98 | Negative * | −0.9 times·(10 a)−1 | 1995 | <0.01 | * |
| P10–12h | 3.48 | Positive * | 1.8 mm·(10–12 h·10 a)−1 | 1995 | <0.01 | * |
| N>12h | −4.89 | Negative * | −5.2 times·(10 a)−1 | 1998 | <0.01 | * |
| P>12h | 0.73 | Positive | 0.5 mm·(>12 h·10 a)−1 | 2002 | 0.18 | |
* Significant at the 0.05 level.
Table 6.
The impact of urban expansion on precipitation in Jinan City during 1979–2017.
| M-K Test | Pettitt Test | Pearson Correlation Analysis | |||||||
|---|---|---|---|---|---|---|---|---|---|
| Z Value | Trends | Sen’s Slope | Change Point (Year) | p Value | Trends | R Value | p Value | Correlation | |
| SDII | 2.15 | Positive * | 0.2 mm·(d·10 a) −1 | 1990 | 0.02 | * | 0.34 | <0.01 | Positive * |
| ATP | 3.19 | Positive * | 17.5 mm·(10 a)−1 | 1990 | <0.01 | * | 0.53 | <0.01 | Positive * |
| Rx1day | 1.38 | Positive | 1.6 mm·(10 a)−1 | 1986 | 0.11 | 0.23 | 0.15 | Positive | |
| R95p | 2.15 | Positive * | 10 mm·(10 a)−1 | 1990 | 0.02 | * | 0.37 | <0.01 | Positive * |
| APD | 2.08 | Positive * | 0.6 days·(10 a)−1 | 1993 | <0.01 | * | 0.32 | <0.01 | Positive * |
| R10 | 2.44 | Positive * | 0.5 days·(10 a)−1 | 1990 | 0.01 | * | 0.41 | <0.01 | Positive * |
| R25 | 2.01 | Positive * | 0.2 days·(10 a)−1 | 1990 | 0.04 | * | 0.36 | <0.01 | Positive * |
| R50 | 1.9 | Positive | 0.1 days·(10 a)−1 | 1991 | 0.02 | * | 0.28 | 0.08 | Positive |
| CDD | −1.23 | Negative | −0.8 days·(10 a)−1 | 1987 | 0.21 | −0.23 | 0.17 | Negative | |
* Significant at the 0.05 level.
Publisher’s Note: MDPI stays neutral with regard to jurisdictional claims in published maps and institutional affiliations. |
© 2021 by the authors. Licensee MDPI, Basel, Switzerland. This article is an open access article distributed under the terms and conditions of the Creative Commons Attribution (CC BY) license (https://creativecommons.org/licenses/by/4.0/).
Share and Cite
MDPI and ACS Style
Zhao, Y.; Xia, J.; Xu, Z.; Zou, L.; Qiao, Y.; Li, P. Impact of Urban Expansion on Rain Island Effect in Jinan City, North China. Remote Sens. 2021, 13, 2989. https://0-doi-org.brum.beds.ac.uk/10.3390/rs13152989
AMA Style
Zhao Y, Xia J, Xu Z, Zou L, Qiao Y, Li P. Impact of Urban Expansion on Rain Island Effect in Jinan City, North China. Remote Sensing. 2021; 13(15):2989. https://0-doi-org.brum.beds.ac.uk/10.3390/rs13152989
Chicago/Turabian StyleZhao, Yanjun, Jun Xia, Zongxue Xu, Lei Zou, Yunfeng Qiao, and Peng Li. 2021. "Impact of Urban Expansion on Rain Island Effect in Jinan City, North China" Remote Sensing 13, no. 15: 2989. https://0-doi-org.brum.beds.ac.uk/10.3390/rs13152989
Note that from the first issue of 2016, this journal uses article numbers instead of page numbers. See further details here.