
Automatic Generation of Seamless Mosaics Using Invariant Features


1
National Space Science and Technology Center, United Arab Emirates University, Al Ain 15551, United Arab Emirates
2
Space Program, Group 42, Abu Dhabi 111999, United Arab Emirates
*
Author to whom correspondence should be addressed.
†
These authors contributed equally to this work.
Remote Sens. 2021, 13(16), 3094; https://0-doi-org.brum.beds.ac.uk/10.3390/rs13163094
Submission received: 15 July 2021
/
Revised: 2 August 2021
/
Accepted: 4 August 2021
/
Published: 5 August 2021
(This article belongs to the Special Issue Satellite Image Processing and Applications)
Abstract
:The acquisition of satellite images over a wide area is often carried out across seasons because of satellite orbits and atmospheric conditions (e.g., cloud cover, dust, etc.). This results in spectral mismatch between adjacent scenes as the sun angle and the atmospheric conditions will be different for different acquisitions. In this work, we developed an approach to generate seamless mosaics using Scale-Invariant Features Transformation (SIFT). In this process, we make use of the overlapping areas between two adjacent scenes and then map spectral values of one imagery scene to another based on the filtered points detected by SIFT features to create a seamless mosaic. We make use of the Random Sample Consensus (RANSAC) method successively to filter out obtained SIFT points across adjacent tiles and to remove spectral outliers across each band of an image. Several high resolution satellite images acquired with WorldView-2 and Dubaisat-2 satellites, and medium resolution Sentinel-2 satellite imagery are used for experimentation. The experimental results show that the proposed approach can generate good seamless mosaics. Furthermore, Sentinel-2’s level 2A (L2A) product surface reflectance data is used to adjust the spectral values for color consistency.
1. Introduction
Satellite imagery is used in several earth observation applications such as land monitoring, classification, object detection, damage assessment, etc. Such applications often span across a wider area and at times country-scale or even larger. This area of interest cannot always be captured in one image due to the limitation in the field of view of satellite sensors and the satellite orbits. Due to the limitations of the imaging swath or acquisition mechanism, it is common that the region of interest (ROI) cannot be contained in only one remote sensing image scene. Therefore, it is necessary to generate a large-scale composite image with a sequence of overlapped satellite scenes or tiles, which is usually referred to by a technique called image mosaicking [1]. Image mosaicking consists of five aspects which include image registration, extraction of overlapping areas, radiometric normalization, seam-line detection, and finally, image blending [2].
When the area of interest spans a wider area, the mosaicking process often has color balancing issues due to different acquisition conditions of underlying scenes. Generally, there are two desirable properties required in generating visually pleasant color-balanced mosaic [3]. First, the output mosaic should be as similar as possible to the input images in terms of intensity and geometry. Furthermore, secondly, the stitching line should not appear in the mosaic output. Hence, to create a good seamless mosaic, one would need constituent satellite tiles that are geo-rectified and acquired within a few days or at most within the same season.
With an assumption that the tiles with partially overlapped regions have already been rectified by using image registration methods [4,5,6], image mosaicking methods can be reviewed and classified into two categories: blending based method and optimal seam based method [7,8]. The blending-based method that is commonly known as alpha blending or feathering approach [9,10,11,12,13,14], acts by obtaining smooth transition in the overlapped region. The mosaic output is generated considering a weighted combination of two overlapped images, where the weight coefficient is determined according to the distance from the stitching borders or the centers. Some advanced weighted blending techniques are constructed by using variational approach [15] or Poisson-based gradient-domain compositing approach [16]. However, the blending-based mosaic methods have the drawback that ghosting and blurring artifacts could be introduced if overlapped images are misaligned [3,17,18]. On the other hand, the optimal seam-based methods look to fit a curve in the overlapping region, so that the minimum difference is obtained between the two registered images [18]. With the overlapping region being divided into two parts by the searched curve, each part can then be filled with the pixels in the corresponding image. In the literature, many optimal seam searching methods are used that make use of Dijkstra’s algorithm [19,20,21], dynamic programming [18,22,23,24], and graph-cuts [25,26]. However, the optimal seam-based methods are found to have problems in generating visually pleasant mosaic output with apparent intensity differences [27]. Hence, histogram matching-based pre-processing has been extensively used [28,29,30] to avoid problems related to the visual inconsistency caused by unbalanced intensity. The histogram matching technique uses a statistics-based intensity balancing method and is found to be effective in adjusting the global intensity distribution of the target image to fit the reference image through a non-linear transformation.
Considering the pros and cons of the blending-based methods and the optimal seam-based methods, both types of methods were also incorporated into one framework to improve the performance of a mosaic [31]. Usually, a low-pass filter is applied to decompose each overlapped image into two components of high-frequency and low frequency. Furthermore, mosaic schemes are designed for stitching each component. The weighted approach of blending rule-based mosaic scheme is used to achieve smooth intensity transition for low-frequency components consisting of uneven illumination information. With very little information available in the low-frequency components, the weighted blending rule can help to avoid ghosting or blurring effect [9]. However, for high-frequency components that consist of detailed information (for example edges, structures, and texture), an optimal seam searching method is modified to determine the seam line and perform the stitching process within the overlapping area [22,23,24]. Thus, modified optimal seam-based mosaic methods work well in preserving structure and texture consistency in the high-frequency components with proper intensity information. Then the final mosaic is obtained by jointly considering the linear composition of the high-frequency and the low-frequency components.
In this work, we make use of the idea of an optical seam-based approach to find the appropriate points in the curve, and then, a blending process is used to create a mosaic. We use a two-step filtration approach: first, using Random Sample Consensus (RANSAC) [32,33,34] method, collinear points are obtained using Scale-Invariant Feature Transformation (SIFT). In the second step, we again use RANSAC as a robust approach to remove spectral outliers across each band to determine the linear function for mapping adjoining tile onto the base tile [34]. This method helps to properly deal with color balancing issues by mapping spectrally-consistent control points between the images. Furthermore, we also correct the spectral values of the resulting mosaic to map to standard surface reflectance values. This allows us to relate spectral values of unknown objects from satellite mosaics to the available standard spectral library for more accurate change detection, classification, and object detection [35]. The remapping of the values can be performed either by collecting the stable ground spectra or by using validated standard reflectance products. In our approach, the standard reflectance product of Sentinel’s L2A is considered for re-mapping. Since the sensors of WV-2 and Sentinel-2 do not perfectly match, slight inconsistencies are expected for actual reflectance values, but the color consistency is guaranteed across scenes. The rest of the manuscript is organized as follows. ’Proposed Methodology’ is provided in Section 2, which is followed by ’Results and Discussion’ in Section 3, while Section 4 is ‘Conclusions and Future Work’.
2. Proposed Methodology
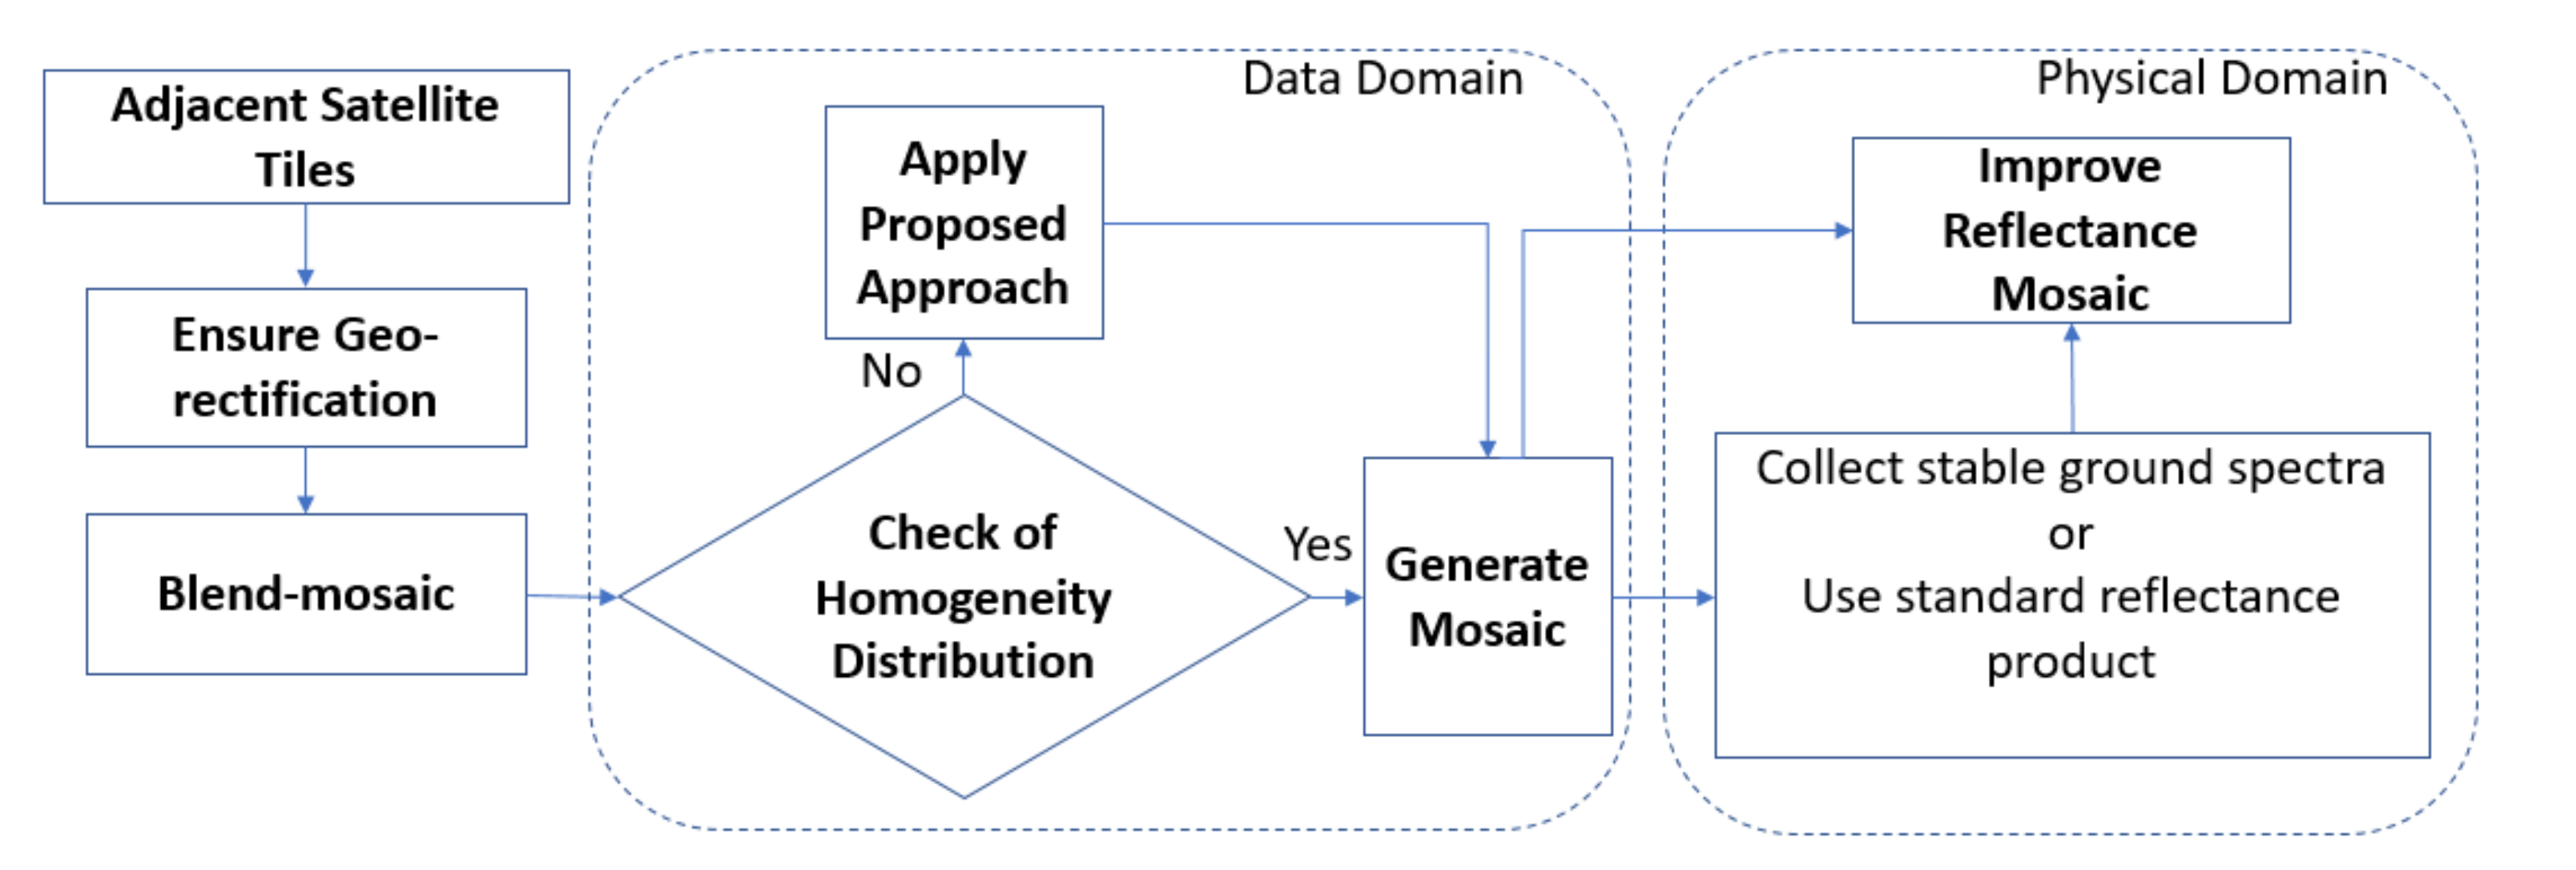
In our approach, we use a two-step approach for extracting the feature points to be used for blending purposes. For this, we first find scale-invariant features in the overlapped region of the adjacent tiles. The Random Sample Consensus (RANSAC) approach is used to find the collinear points in the scale-invariant features across two adjacent tiles based on distance [36]. The RANSAC approach is used again as a robust approach for further removing the spectral outliers across each band. A linear function is determined to map the spectrally-consistent pixels for each band of a tile to map it onto the base image tile to create the homogeneous mosaic. The overview of the proposed process can be found in Figure 1, and its details are explained in Algorithm 1.
| Algorithm 1 Proposed Workflow |
for each tile in two adjacent image tiles do Consider one tile as base and other tile as adjoining tile Ensure the two tiles are geo-rectified Use blending approach to determine the homogeneity of consisted points in the blended image in each band of the image if The points are homogeneous then Generate a mosaic using a blending process Repeat the process for the remaining adjacent image tiles else Find scale invariant (SIFT) features within the overlapped region of two tiles Apply a RANSAC approach to retrieve set of collinear points among the SIFT features for each band in two adjacent image tiles do Use RANSAC approach as robust approach and develop linear models for every band to map adjoining image onto the base image by removing spectral outliers across each band Apply the fitting function from each band of the adjoining image onto base tile to obtain homogeneously distributed data points across each band end for Generate a mosaic using a blending process Apply the proposed approach Repeat the process for the remaining adjacent image tiles end if end for |
2.1. Extraction of Robust Key Match Points in Overlapping Regions
We employ Scale-Invariant Feature Transform (SIFT) on the base image and adjoining image to detect the key match points across the adjacent tiles. To select the robust key match points, we employ the RANSAC algorithm with the homography model [37], to avoid misleading points. The RANSAC method computes a homography and provides a prediction of outliers. Using SIFT, we generate keypoints and the feature vector for each keypoint. Furthermore, if k is a keypoint in image x and is a keypoint in image , the feature vectors provide a way to identify whether k, are good matches or not. Then, for each k, we look for a good match: a from that is significantly closer to k than any other keypoint in . The set formed with a good matches forms a potential candidate set for image registration.
Algorithm 2 shows steps of the RANSAC algorithm. We initially pick four non-collinear feature pairs randomly to compute a homography from these four pairs, and then test the goodness of this homography, by checking whether the number of good matches is consistent with this homography or not. If k, are a good match, we assume that in most cases the homography will map k to something near . The one with good matches that are consistent with the homography would be treated as inliers, and those that are inconsistent are considered as outliers (for this homography) for the chosen threshold. By using a trial and error method, a good choice for threshold value was found to be 65 for dealing with the case of our experiment of finding collinear points across adjacent satellite scenes. Eventually we repeat this process 100 times and pick a set of four good matches each time. In each iteration, a homography is derived and the number of associated outliers is counted. At the end, we obtain the homography with the smallest number of inliers that constitute our feature points for image mapping. This step provides a set of refined points from a pool of SIFT feature points obtained from the base and adjoining images. With the first application of RANSAC, it allows filtering SIFT feature points across the overlapping region to find eligible points based on distance.
| Algorithm 2 RANSAC algorithm |
for each four non-colinear feature pairs selected randomly do Compute homography H for these features Compute inliers where Sum of Squared Distances Keep largest set of inliers Re-compute least-squares H estimate on all of the inliers end for |
2.2. Mapping of Points from Adjoining Image to Base Image
Once the SIFT points are filtered out using RANSAC algorithm, the obtained points are further refined based on spectral values in individual bands using RANSAC as a robust approach to identify spectral outliers across each band. A linear fitting function is calculated for each band, to map the adjoining image tile onto the base image tile. Furthermore, finally, a blending method is used to create the final homogeneous mosaic.
2.3. Blending Method
Overlapping regions of two images may have different brightness or intensities. A simple way to perform blending is to use a weighted sum of the image intensities along each band using weight functions [38].
We can assign a weight function to each image w(x, y) = w(x)w(y) where w(x) varies linearly from 1 at the center of the image to 0 at the edge. If there exists a small registration error, this process may lead to blurring of high-frequency detail. Hence, a multi-band blending strategy developed by Burt and Adelson [39] is applied. The rationale behind using multi-band blending is to blend low frequencies over a large spatial range and high frequencies over a short-range.
2.4. Mapping of Mosaic to Standard Surface Reflectance
A color balanced mosaic obtained after a successful color blending approach leads to a change in the spectral values in the considered tiles/scenes. To guarantee spectral consistency, an approach to map mosaic values to standard surface reflectance is required. The remapping of the values can be performed either by collecting the ground reflectance values for stable surfaces or by using known standard reflectance products such as Sentinel-2 L2A data. We apply the procedure similar to the approach explained in Section 2.1 and Section 2.2 for remapping. A linear robust regression method is applied in each band of the obtained mosaic to map the features to the surface reflectance.
2.5. Evaluation of Proposed Approach
Correlation Coefficient: The correlation coefficient helps to reflect the similarity between the base image and the final mosaic. The higher the correlation value, the higher will be the fidelity of the image spectrum and the better is the fusion quality. It can be calculated as shown in Equation (1).
Here, is the image pixel value of the base image, is the mapped color pixel value after mosaicking. and represent the pixel values of the two images to be mosaicked, respectively. The larger the value of C.C. in Equation (1), the greater will be the correlation between the base image tile and the final mosaic.
2.6. Satellite Images
Three different satellite datasets are used to demonstrate the effectiveness of our proposed approach. The datasets were acquired over the region of UAE during 2015/2016 using WorldView-2, Sentinel-2, and DubaiSat-2 satellites.
The WorldView-2 dataset consists of high resolution satellite imagery with eight multi-spectral bands at a spatial resolution of 2 m. The panchromatic band having 0.5 m spatial resolution is used to improve the spatial resolution of the images. Only 4 bands (R-5, G-3, B-2, and IR-8) of WorldView-2 data are considered in this work for the images acquired over the Northern Emirates of UAE in summer (June/July) months of 2014/2015. Sentinel-2 provides medium spatial resolution satellite imagery which is freely available. In this work, we use imagery acquired over UAE during the summer months of 2016. Only four bands available at 10 m spatial resolution are used. The third dataset consists of high resolution satellite imagery having 4 bands at 4m spatial resolution acquired over Dubai emirate during summer months of 2016 with DubaiSat-2 satellite. The image tiles in all the three datasets have significant color variation making it difficult to produce high quality mosaics using traditional methods.
3. Results and Discussion
3.1. Experiments, Observation and Analysis
The experimental setup is explained in Section 2. The process has been applied to all the three mentioned datasets and an illustration of the process is provided with the WorldView-2 and DubaiSat-2 dataset.
3.1.1. WorldView-2 Data
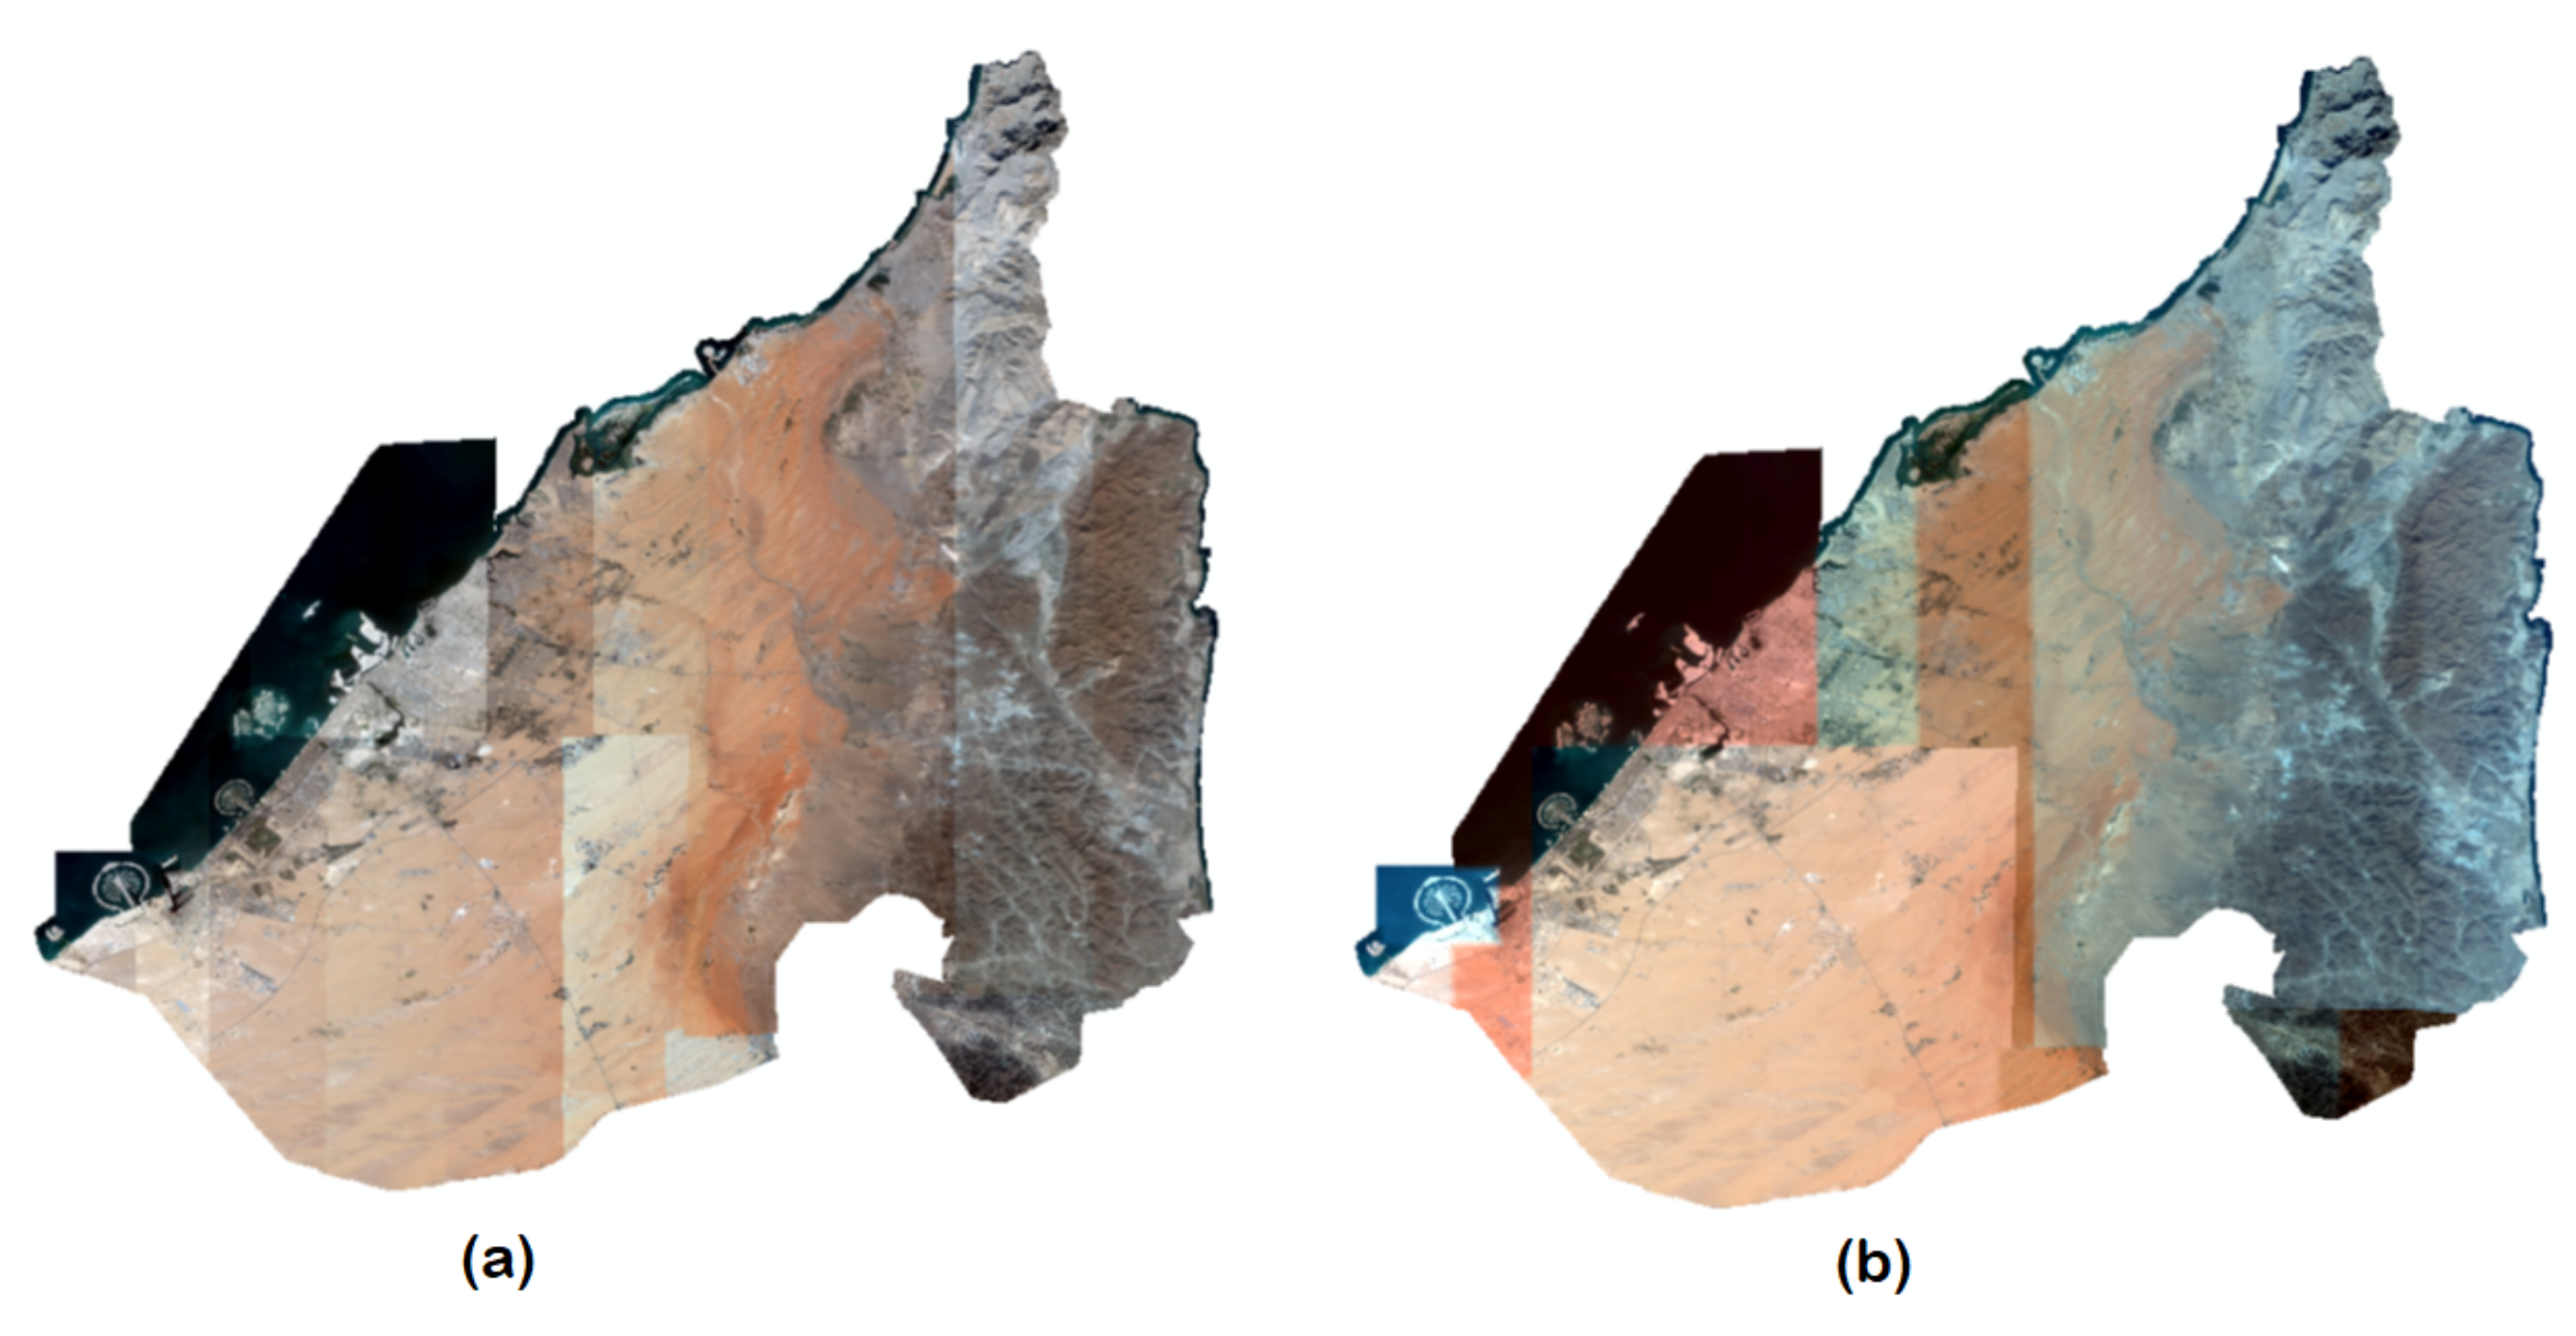
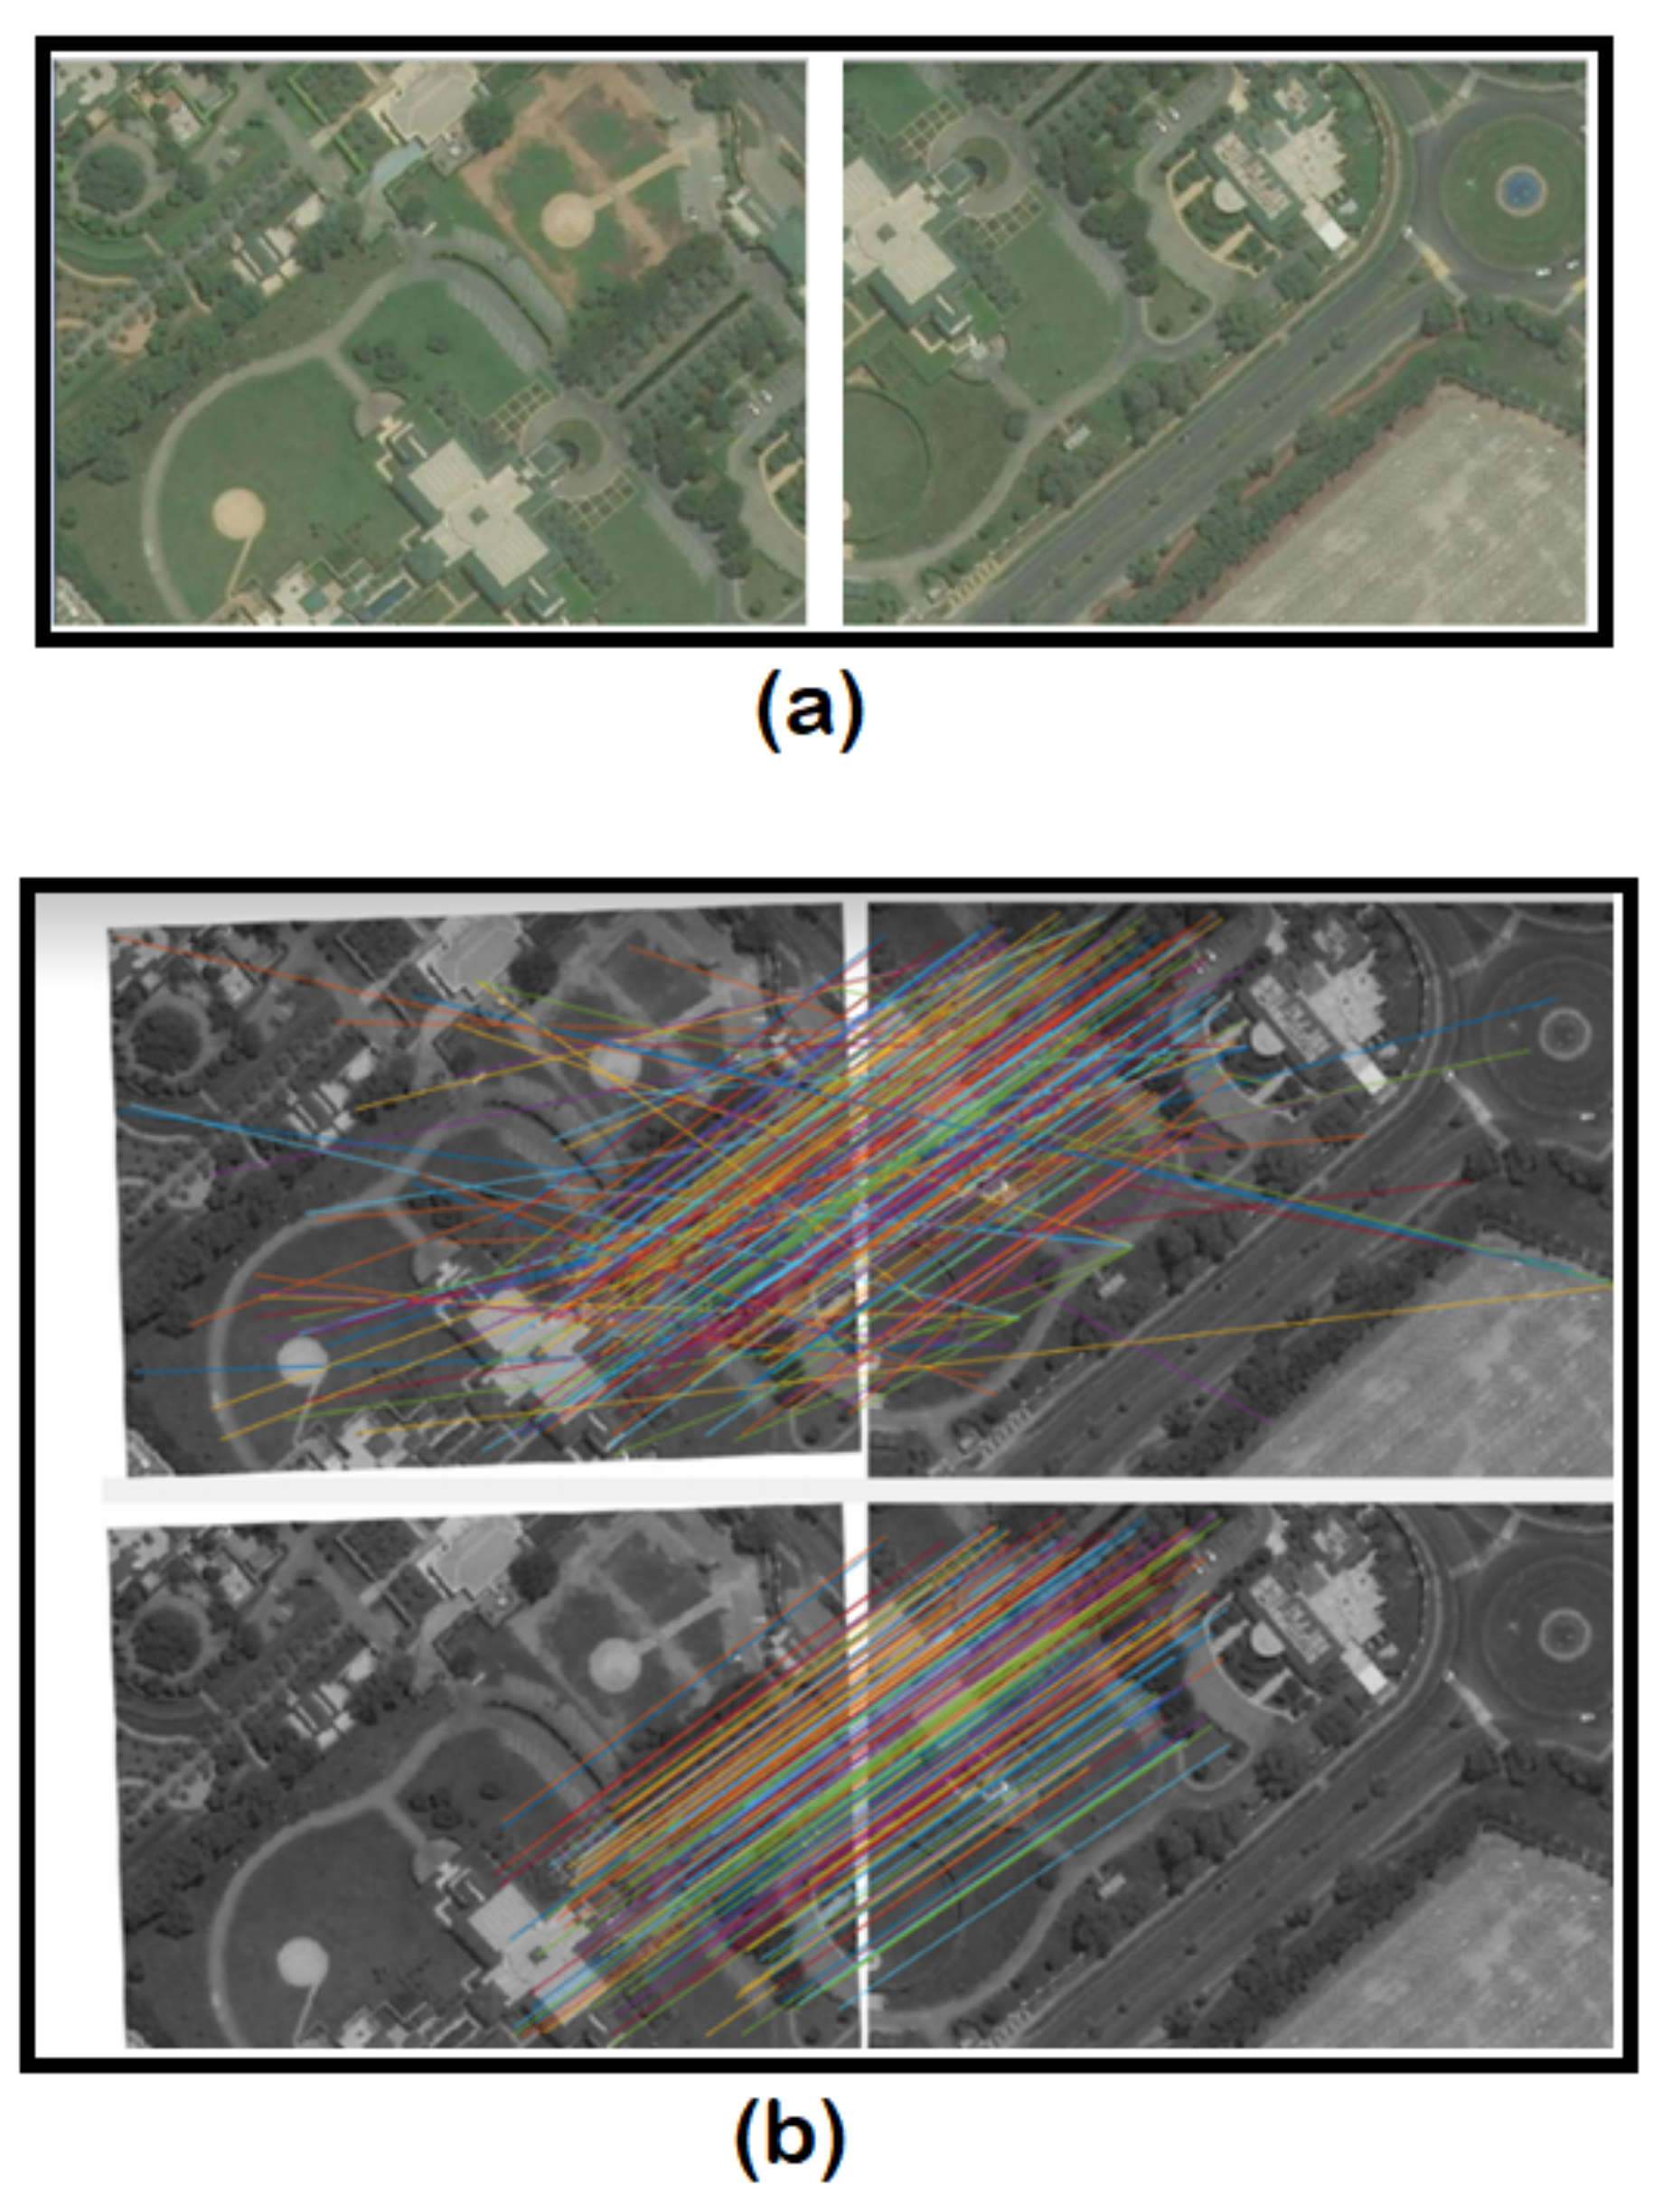
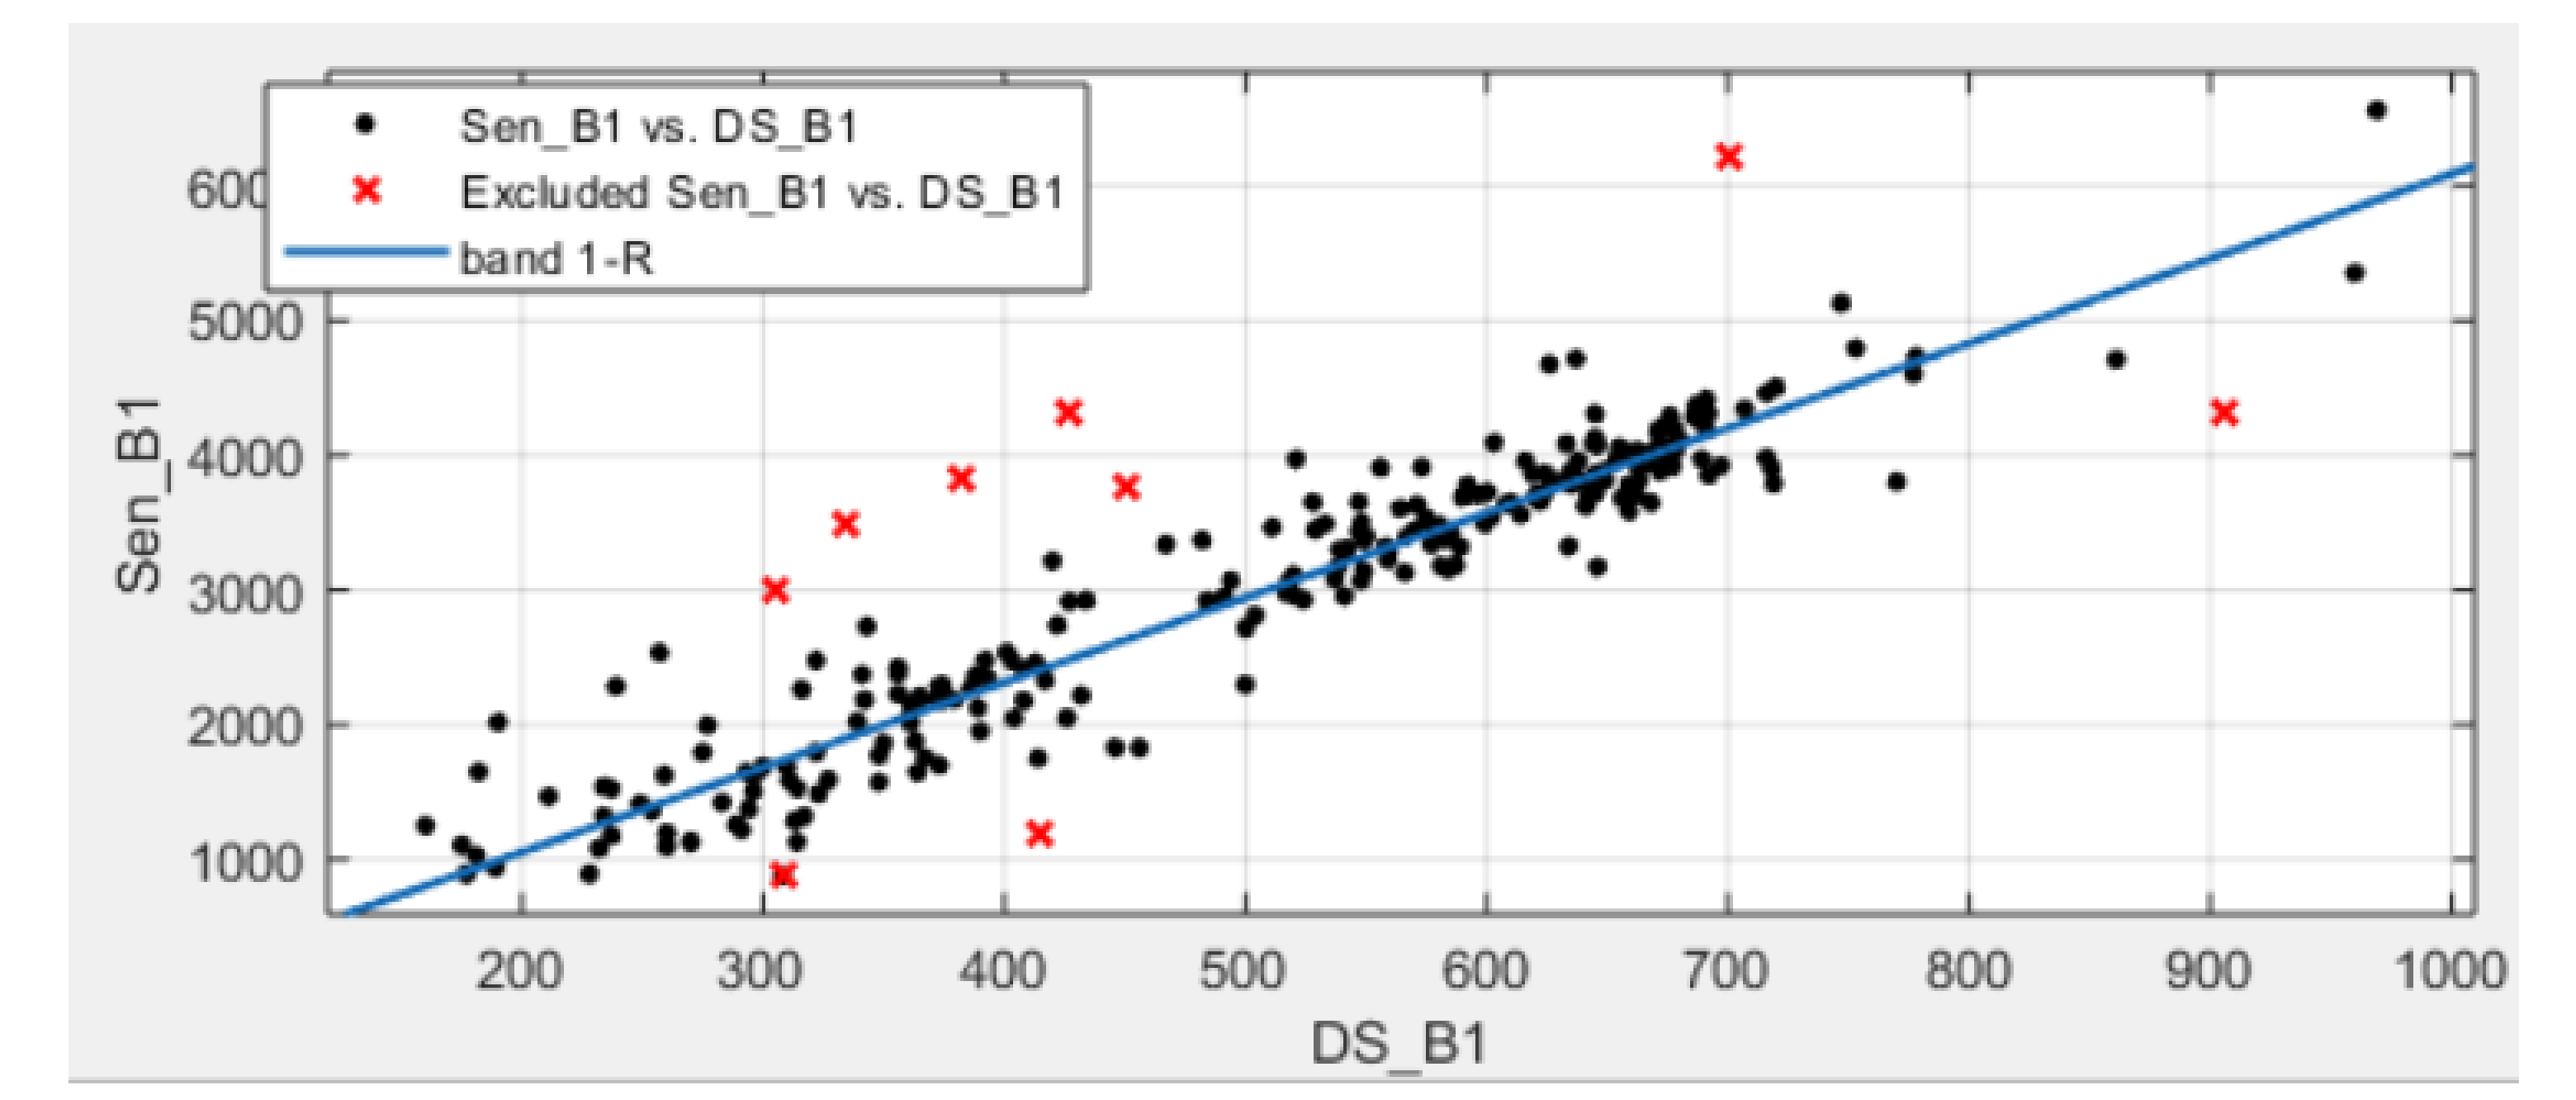
Figure 2a shows the adjacent tiles of the WorldView-2 dataset for the Northern Emirates region in the UAE. The acquisition of tiles is mostly during the summer time in 2014, with some of the tiles acquired in 2015 that led to mosaicking issues. These issues can be clearly observed in Figure 2b, where significant differences in spectral values across some tiles led to color balancing issues during a simple blending procedure. Figure 3a shows the overlapping region in the sample adjacent tiles. The SIFT features are extracted followed by a RANSAC procedure that would allow obtaining selected points by removing distance outliers from the adjacent tiles as shown in Figure 3b. This process is followed by another application of the RANSAC method in each band to remove spectral outliers, after which a linear function for each band is developed to map the adjoining tile onto the base tile. An example of such mapping for one band is demonstrated in Figure 4. Then a blending process is followed to obtain the mosaic as seen in Figure 5a. Finally, the obtained mosaic is mapped to standard surface reflectance using a robust linear regression approach to obtain an improved surface reflectance product as seen in Figure 5b. Thus, the obtained mapped surface reflectance product is observed to have a reflectance value within the 3% limit of the considered standard surface reflectance values of stable objects such as sand, roads, alluvial plains, and roofs.
3.1.2. DubaiSat-2 Data
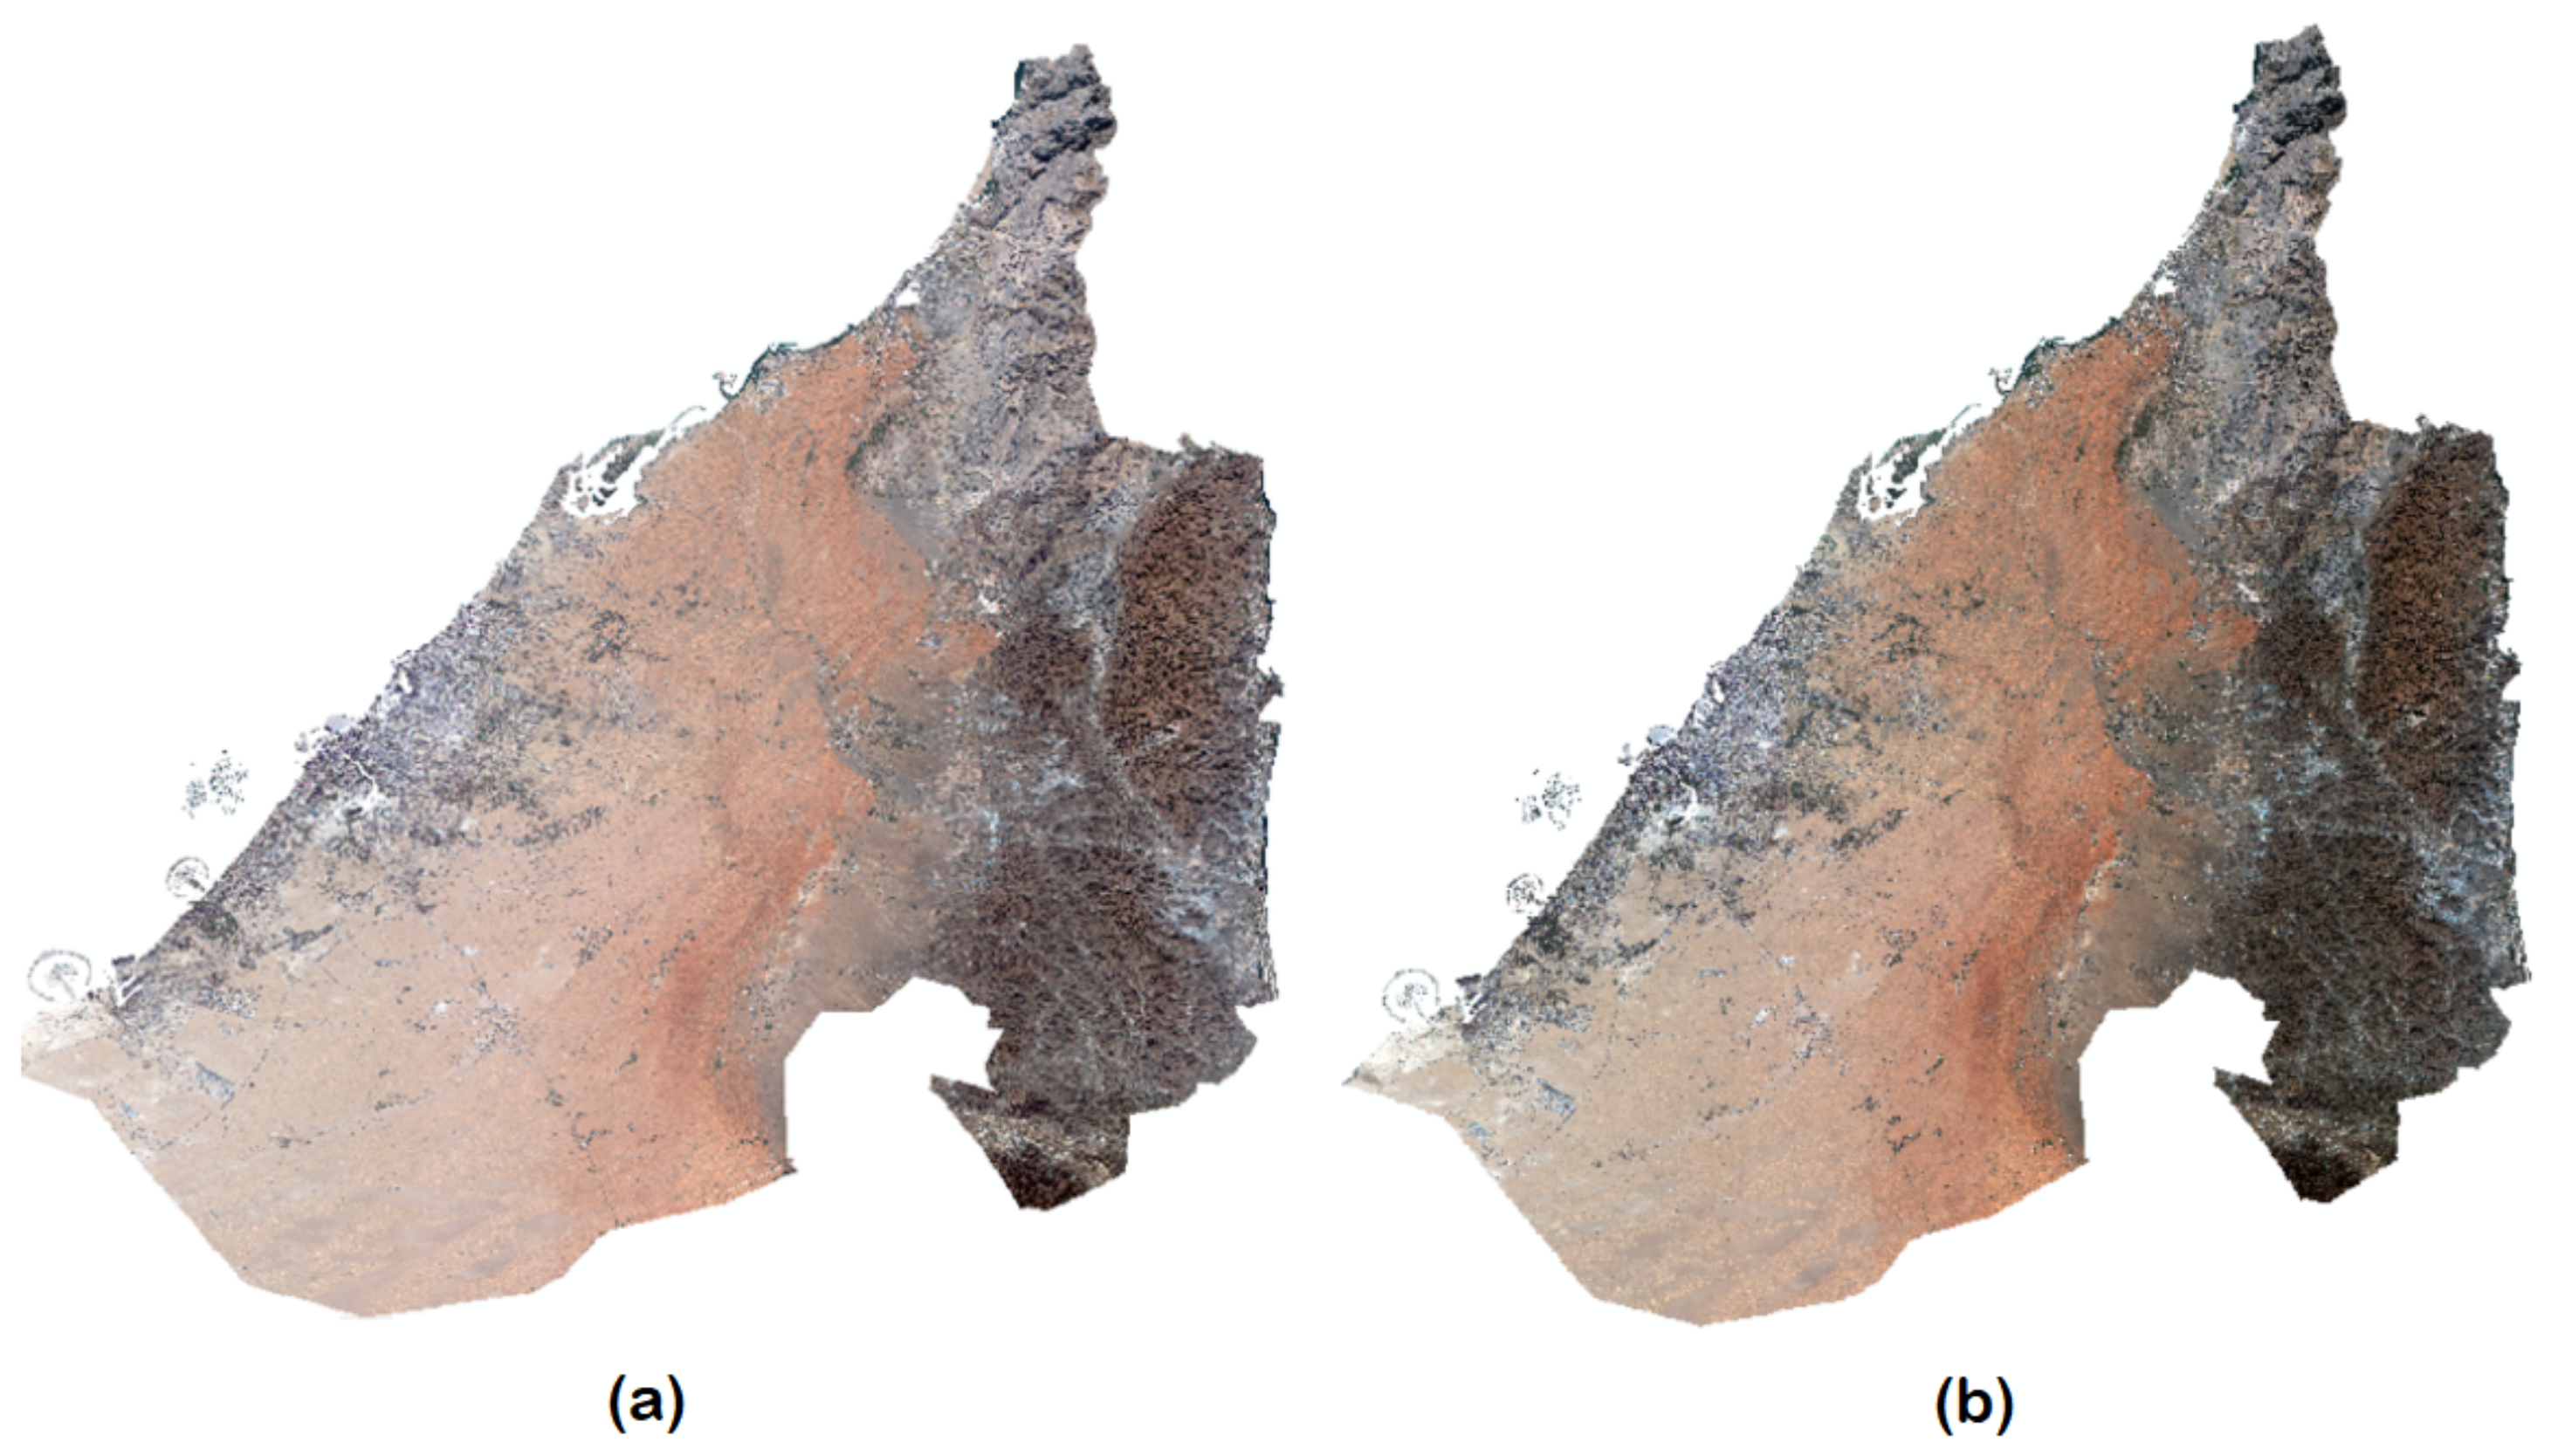
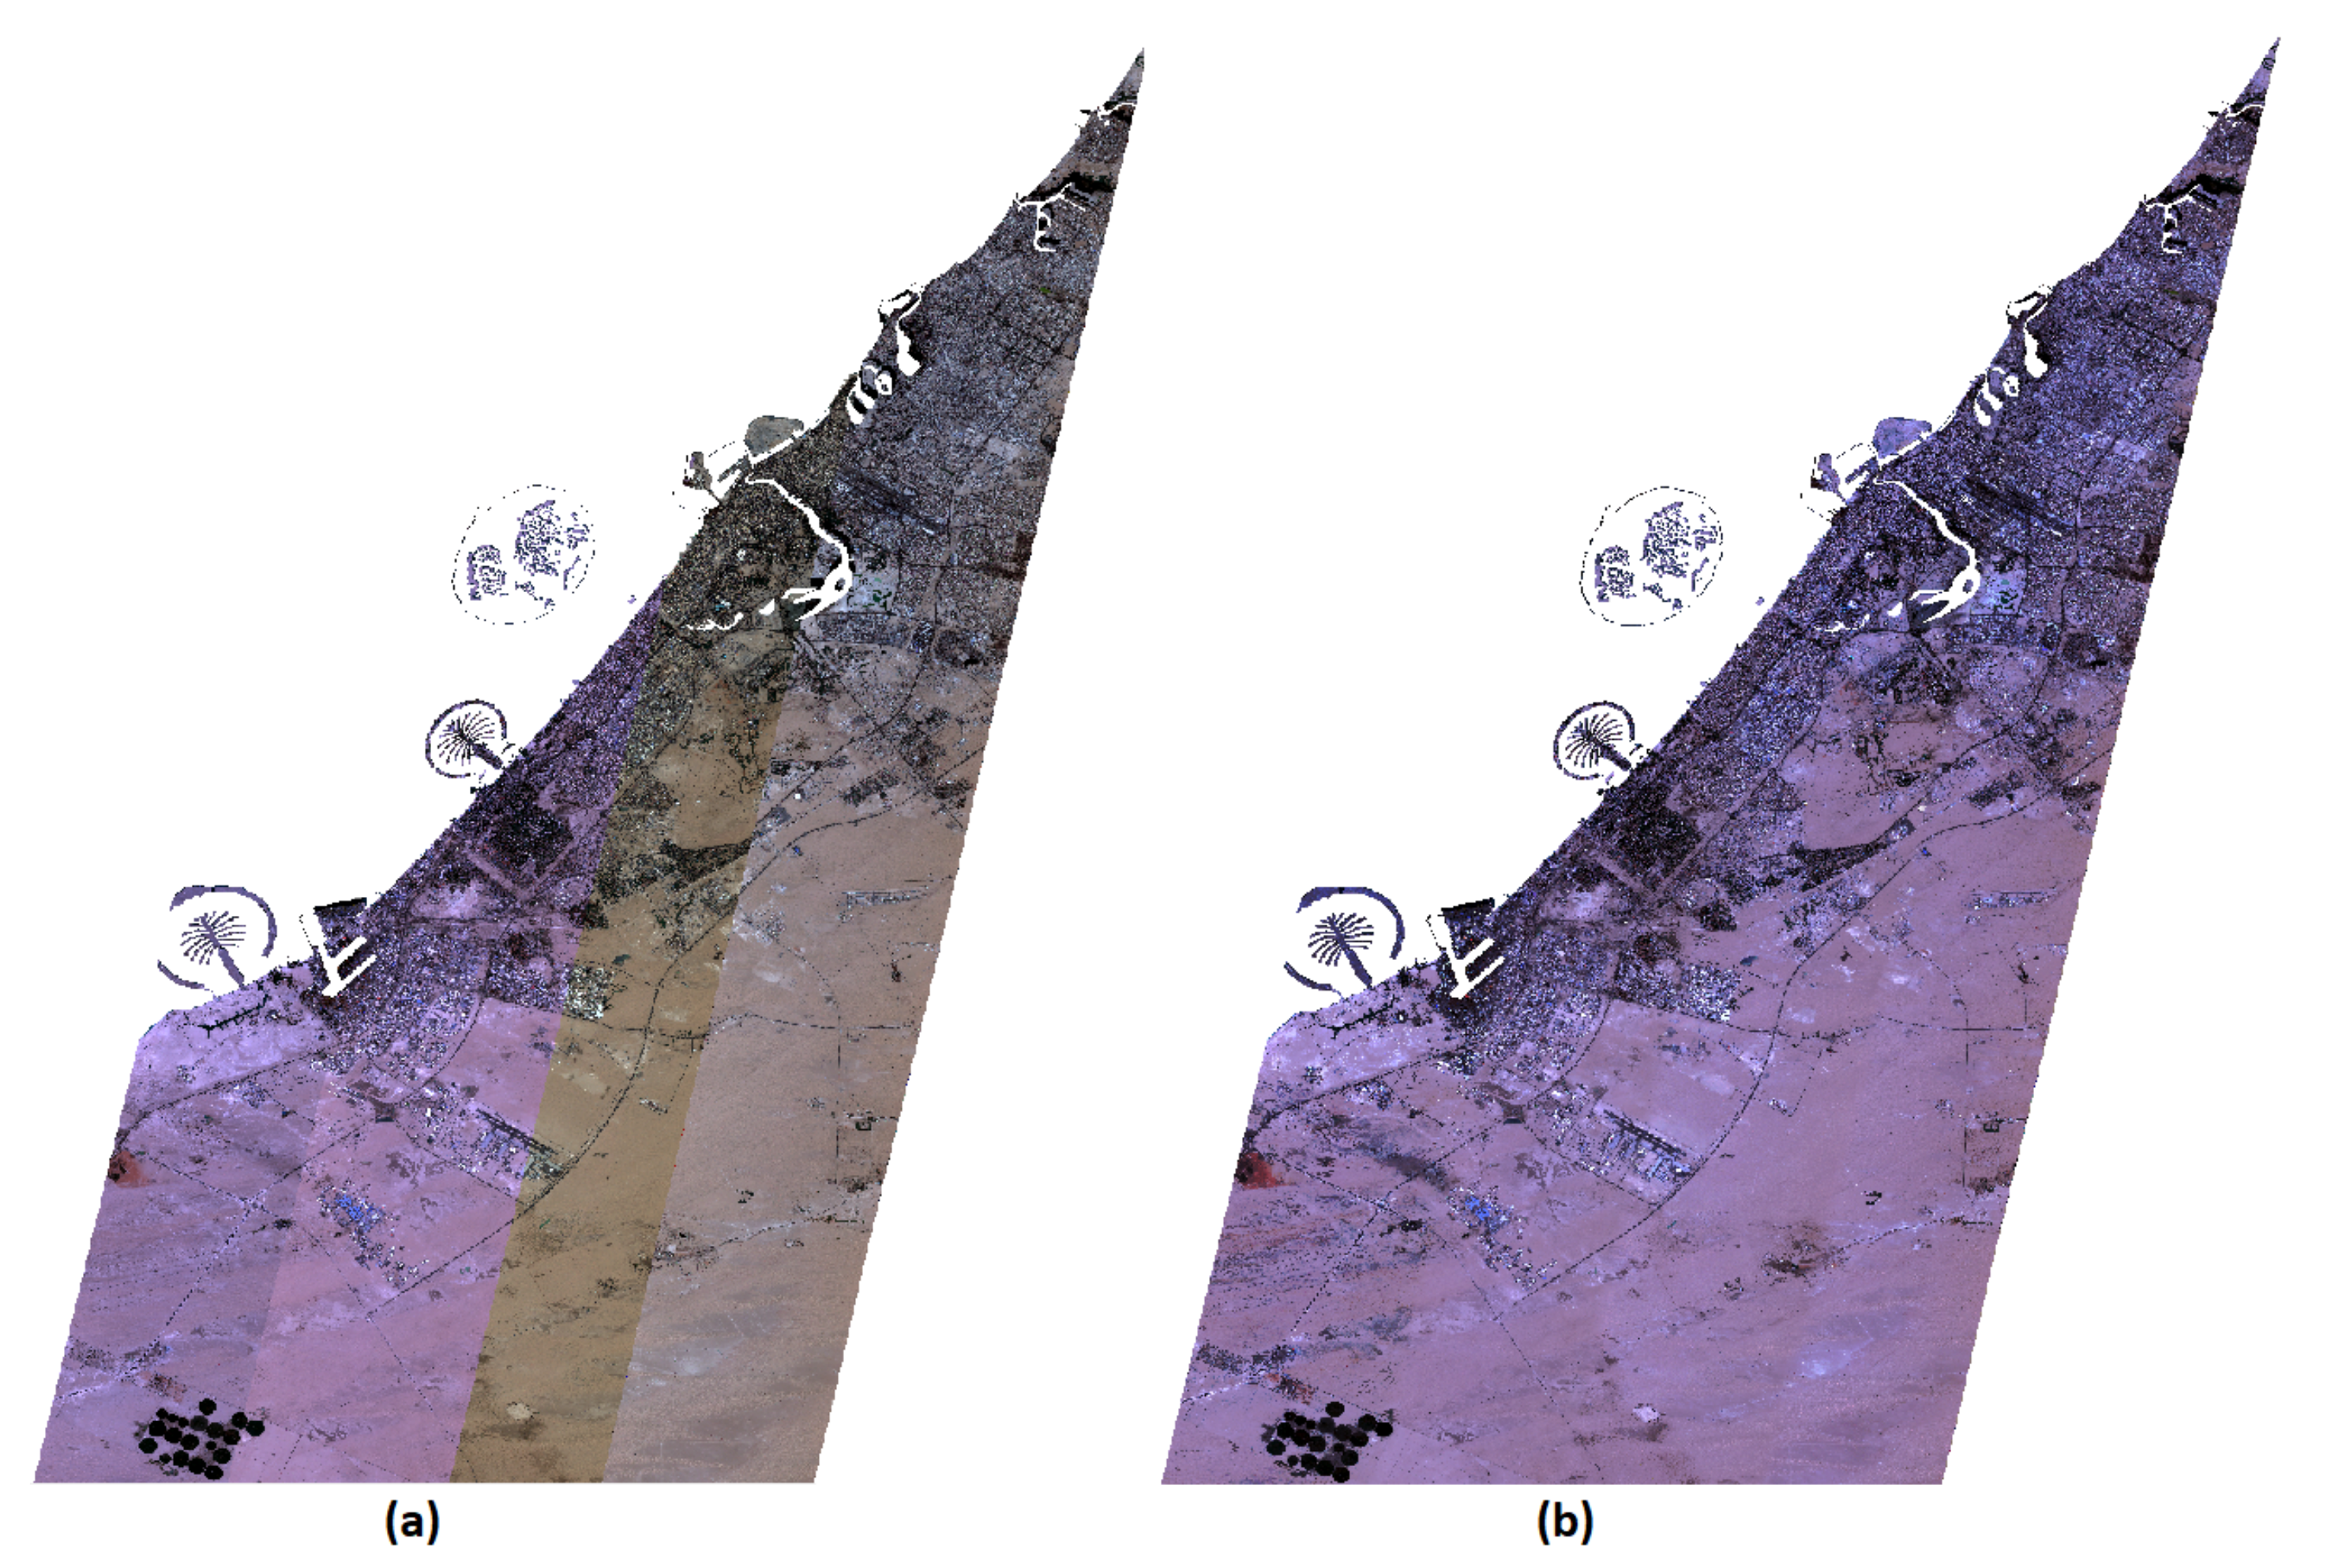
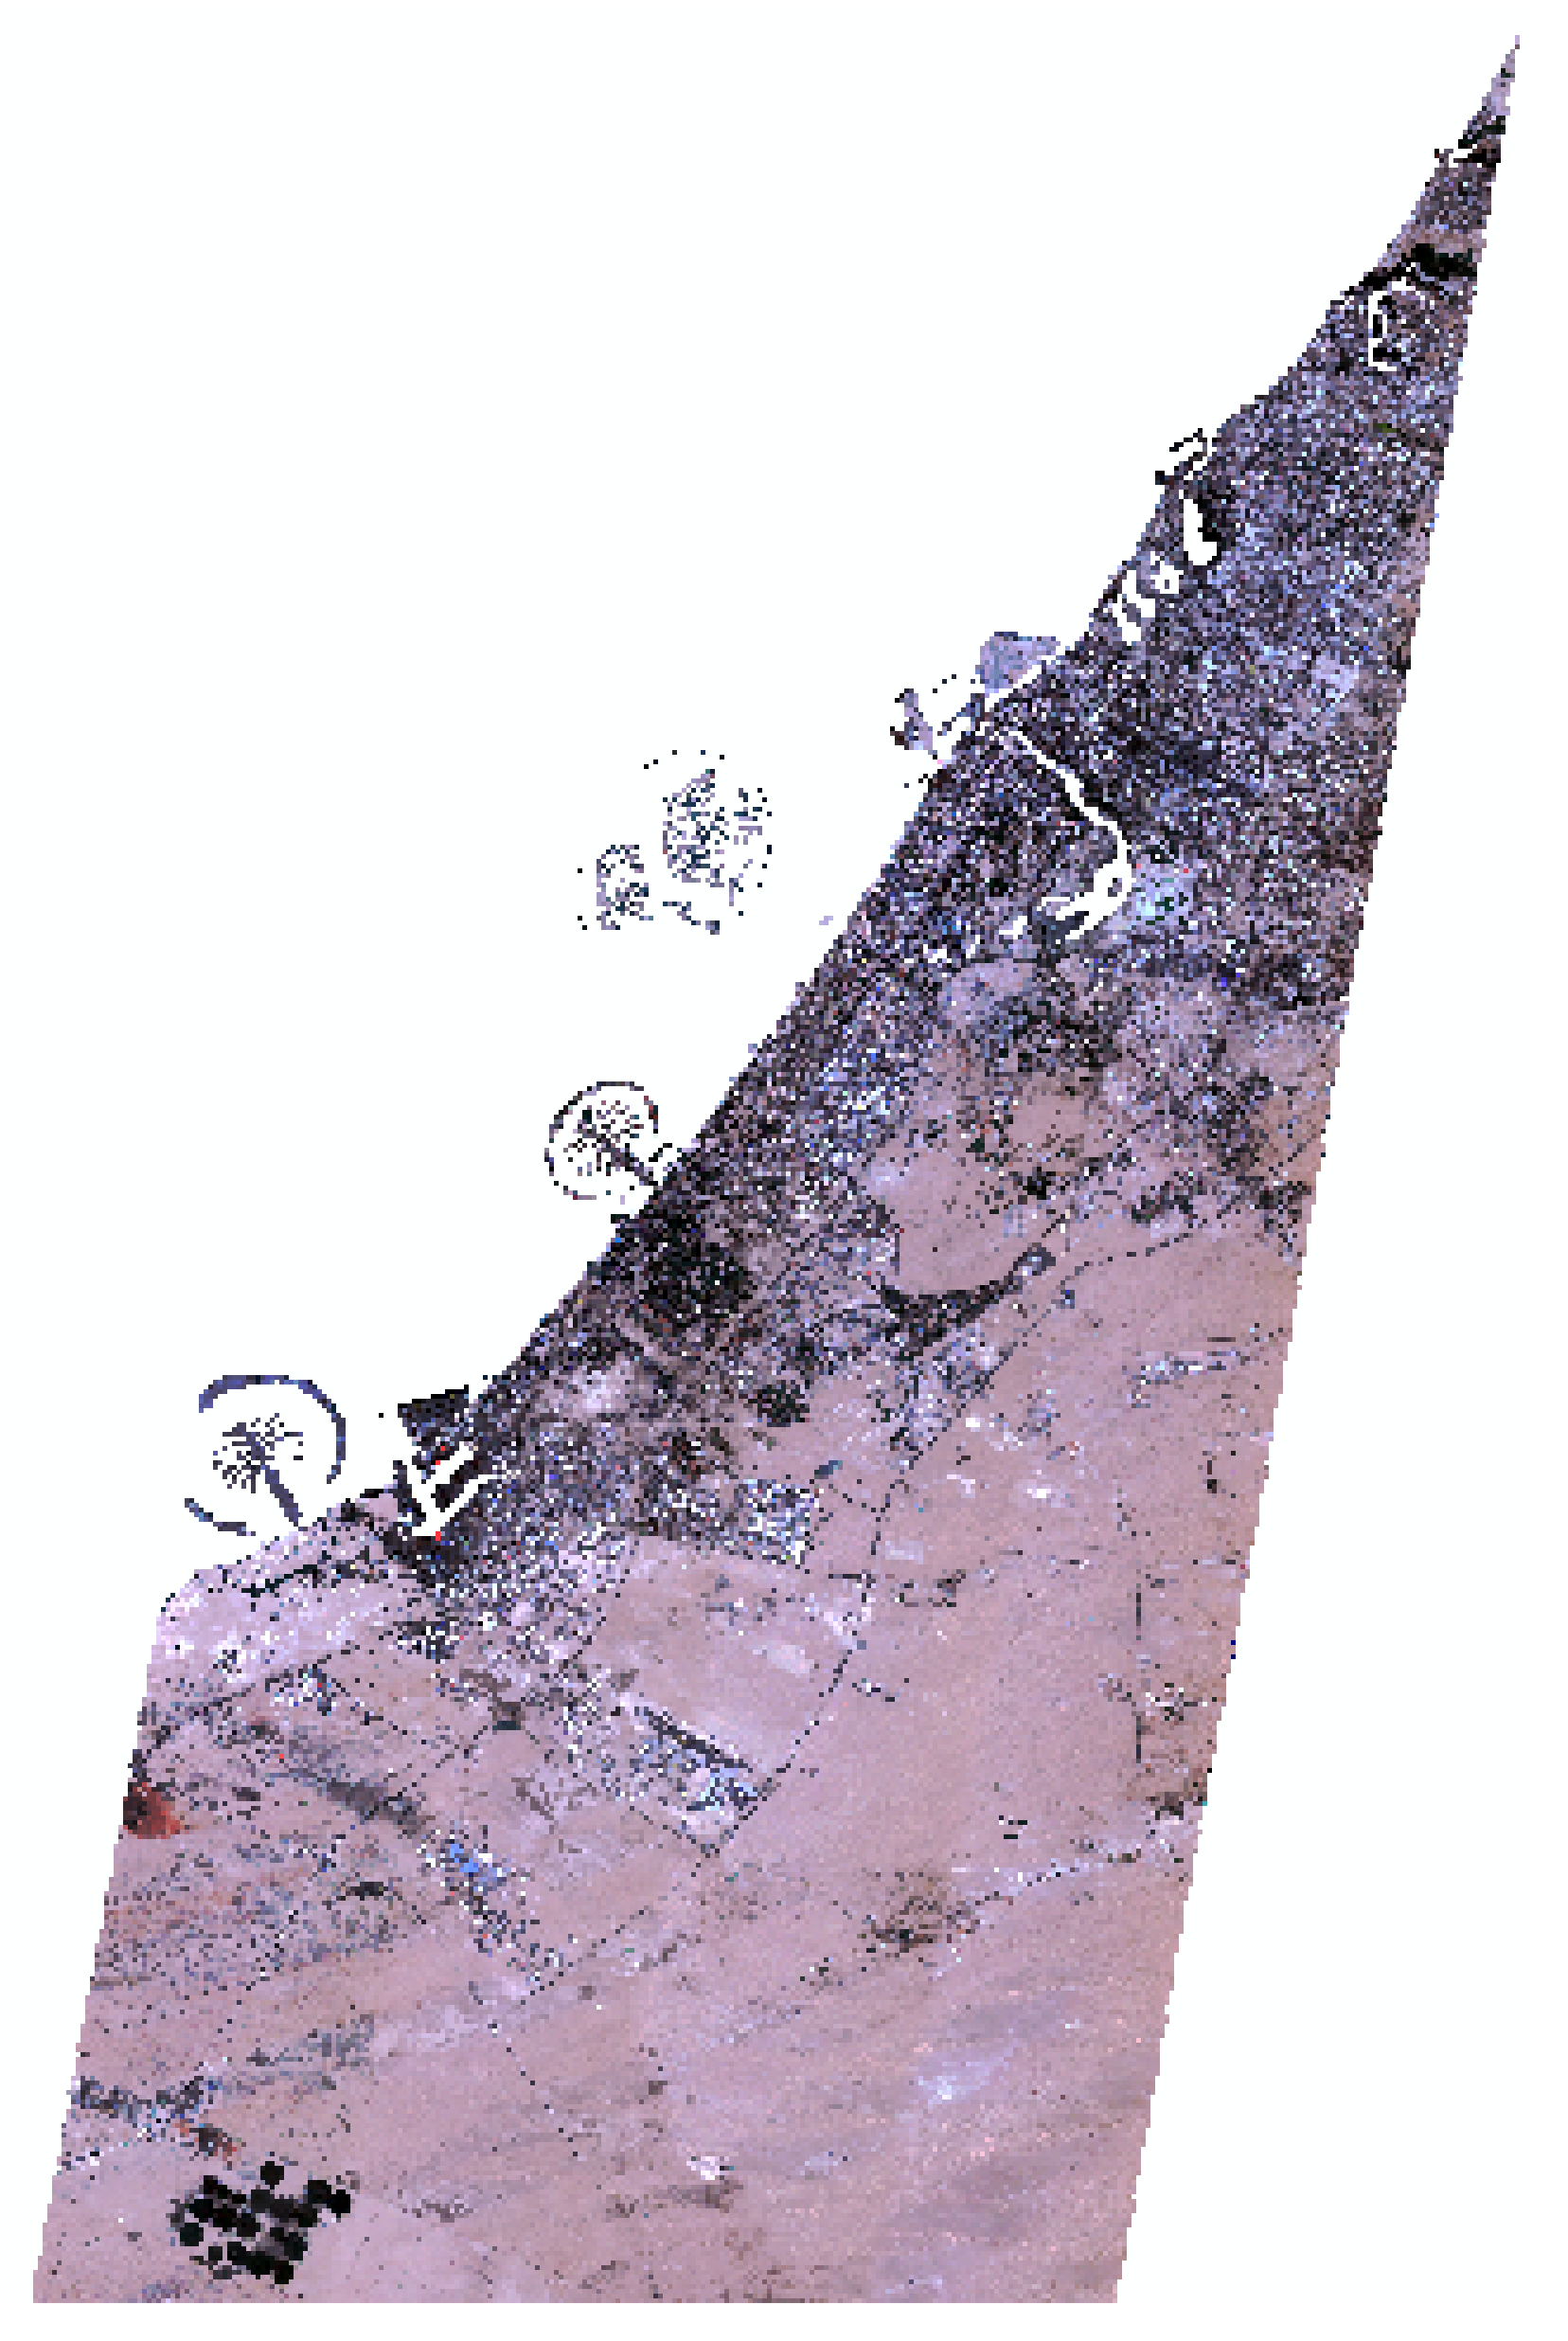
Figure 6a shows the DubaiSat-2 adjacent tiles where the considered leftmost base tile seem to consist of spectral values that are very different from standard surface reflectance. As a result, the obtained color-balanced mosaic is also observed to have spectral values in line with this considered base tile as shown in Figure 6b. Afterward, the mosaic is remapped to surface reflectance (shown in Figure 7) which is observed to have a reflectance value within the 2% limit of the considered standard surface reflectance values of above mentioned stable objects.
3.2. Analysis
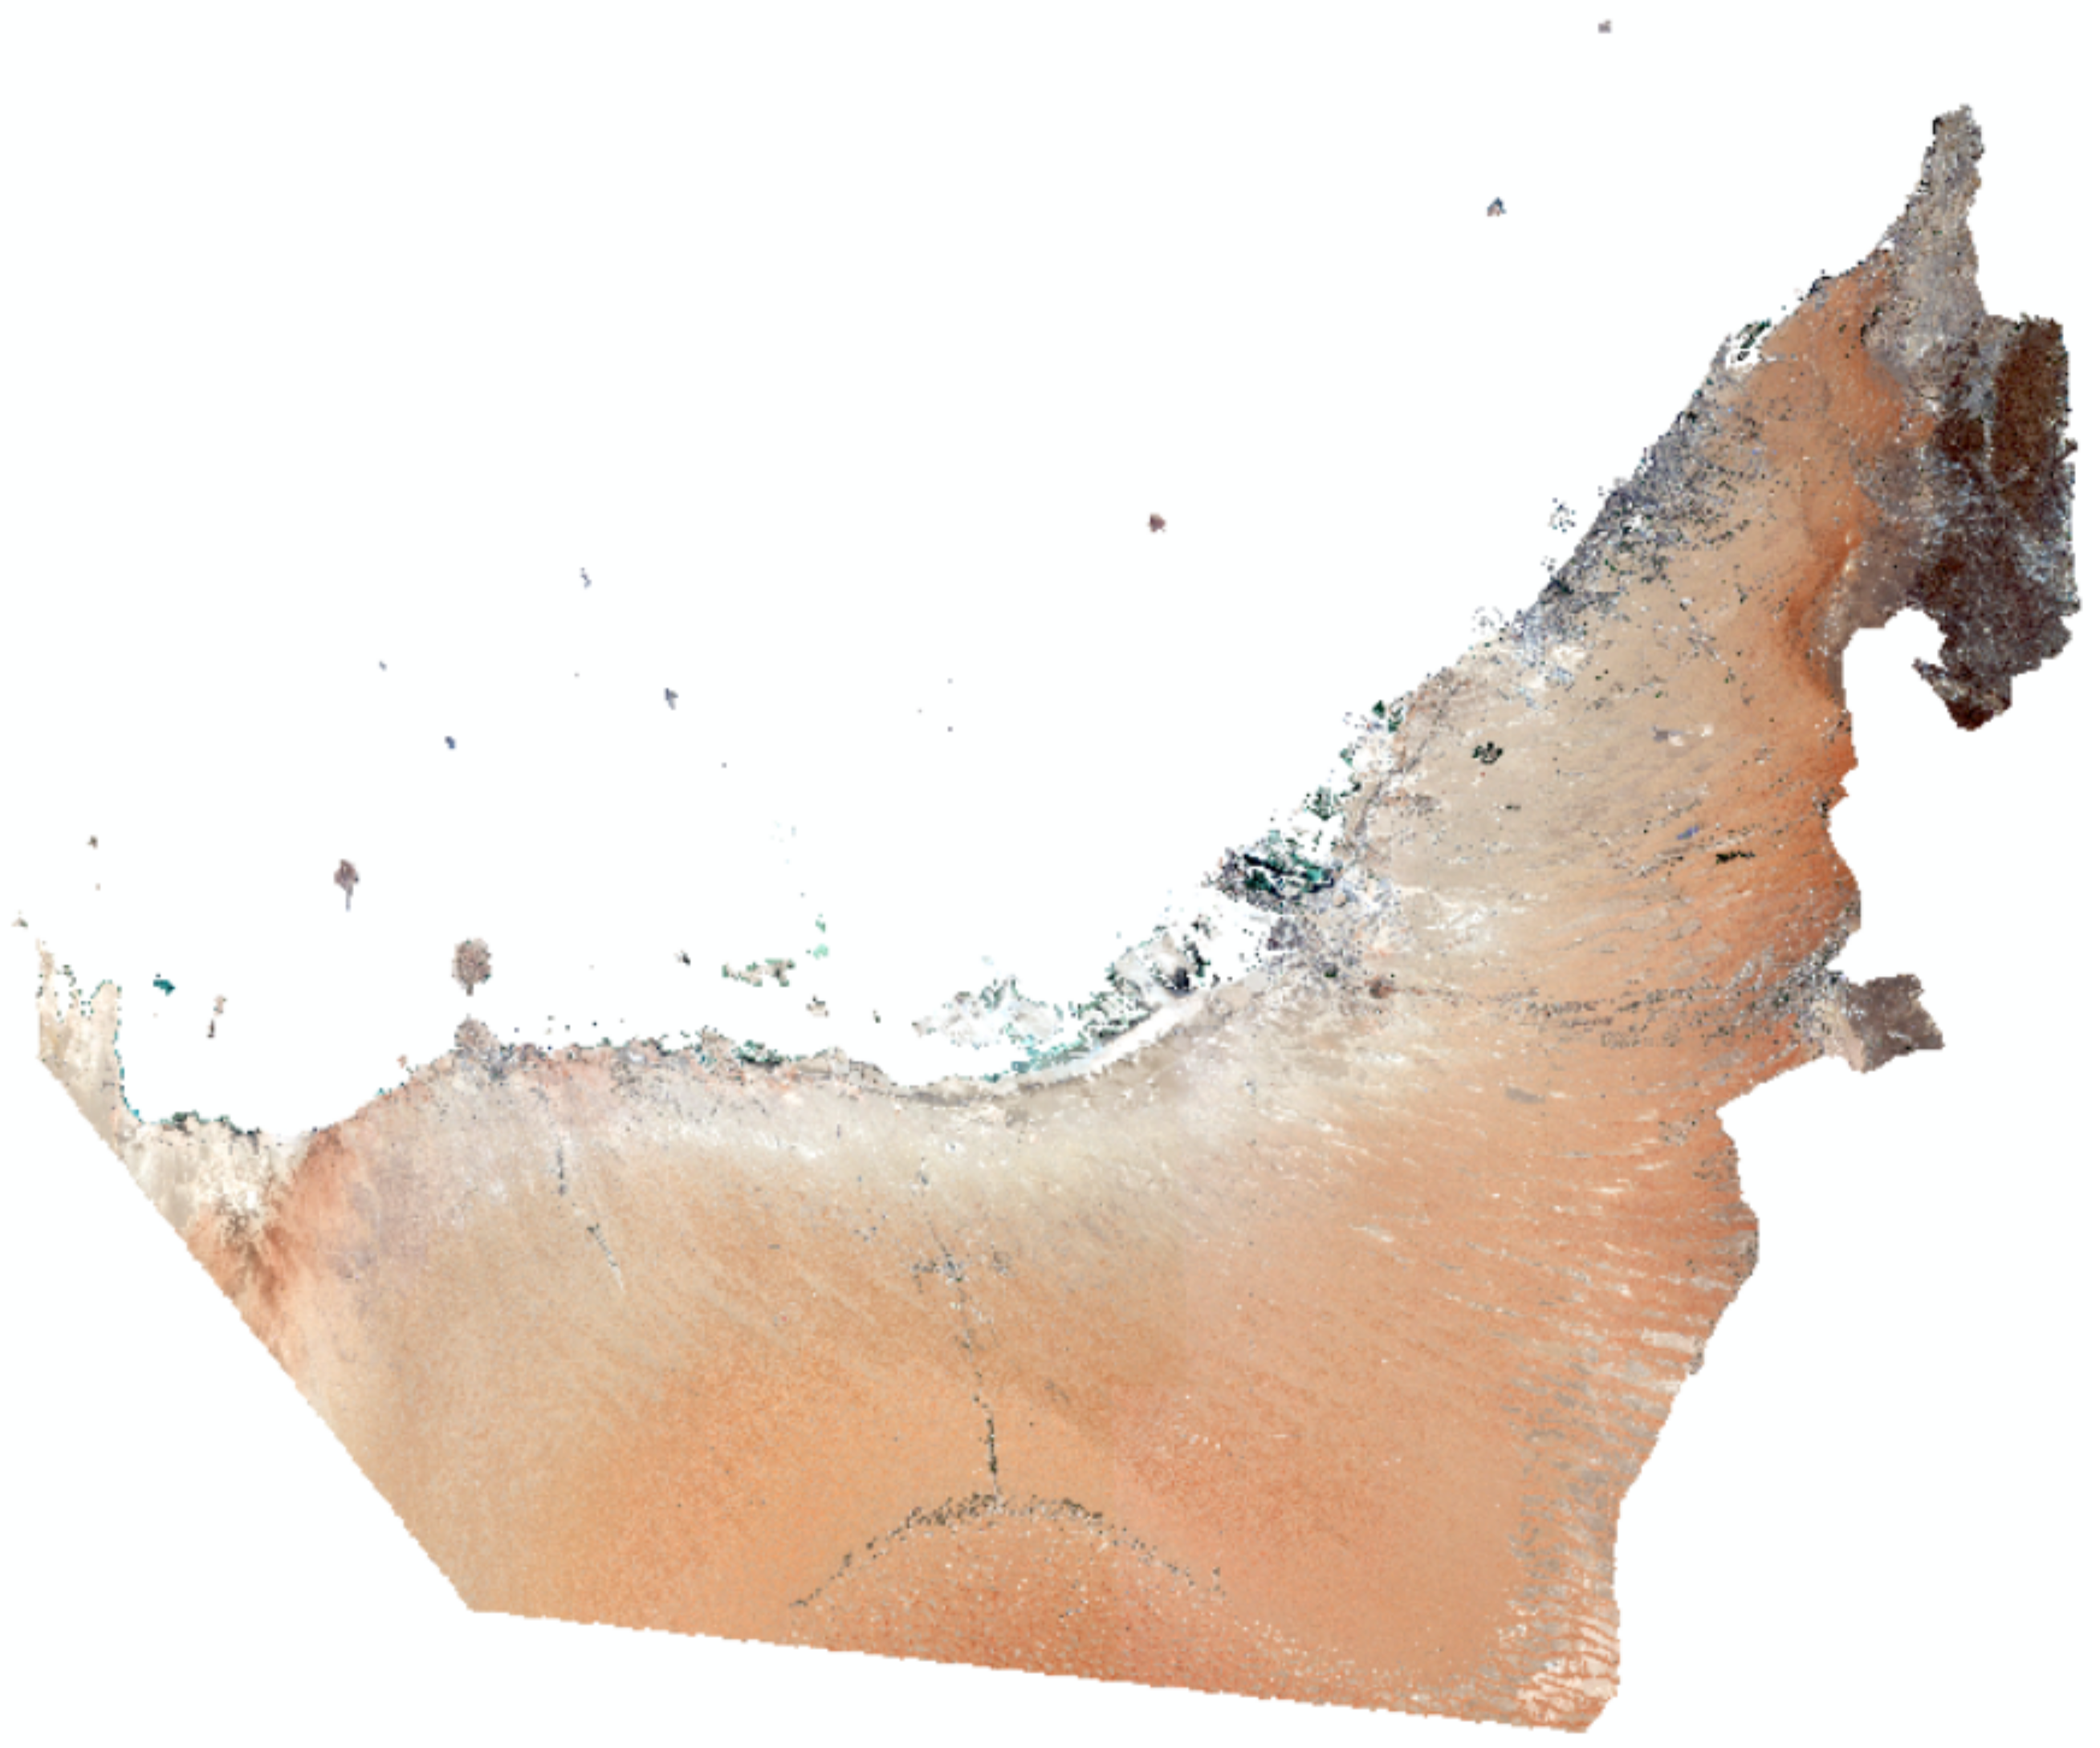
Table 1 shows how a base tile relates to a color-balanced mosaic tile using a proposed approach, and we can clearly see that the correlation coefficient concerning all four datasets is very high. A correlation coefficient is calculated based on the pixel value of the base tile (before mosaicking) and the same corresponding pixel value of the final mosaic. There are no significant differences one can observe visually between mosaics of Sentinel-2’s level 2A and 1C product data as shown in Figure 8 and Figure 9 but statistically, the correlation coefficient seems to decay more in the case of Sentinel-2’s level 1C data.
Image mosaicking has been traditionally used to develop basemaps primarily for visualization. However, such data may not be ideal for applications like change detection, classification, object detection, etc. In addition to this, since the sun angle tends to vary significantly from one month to another, the acquisition of images must be within the same period (within a few days to a maximum time of a season), otherwise, the spectral values will differ leading to significant color-balancing issues in the image mosaic. As an example, significant color balancing issue can be clearly noticed while trying to create a mosaic from Copernicus’s Sentinel-2 images that have a revisit time of 10 days and whose data products are freely available at Level 1C and Level 2A processing levels. The mosaicking process has relatively fewer issues while using Level 2A data which is a reflectance product at surface level (also known as Top of Canopy (TOC)) in comparison to using level 1C which is a reflectance product at top of the atmosphere (TOA) due to the extra processing to map to surface characteristics. However, irrespective of the data product used, the proposed approach will map all the data products whether it is a radiance product or, reflectance product at TOA or TOC to obtain the acceptable surface reflectance mosaic.
The computational cost of the proposed method depends on the size and resolution of the dataset used. A standard multi-spectral scene or tile of WorldView-2 satellite consists of 4096 rows and 4096 columns contributing towards the file size of about 256 MB for 8 bands that covers about 8 km in length as well as in breadth. In our experimentation, the execution time for mosaicking two scenes of the WorldView-2 high-resolution dataset is about 2 min. It usually takes less than 30 s for extracting the filtered feature points within the overlapping region and up to 1 min for mapping the adjacent scene based on the baseline scene and performing a blending procedure. Similarly, depending upon the standard tile size of the WorldView-2 data, remapping the reflectance values back to the physical domain in a mosaic of two tiles takes less than 1 min of execution time.
3.3. Comparison with other Methods
The proposed approach has been developed to resolve the color balancing issues encountered with the parametric mosaicking methods available with commercial software such as ArcGIS and ENVI. The advantage of using our approach over other approaches and other available methods in proprietary software is that we simulate the reflectance values to achieve consistency in mosaicking during the process of color balancing or blending operations. This is especially proven to be extremely useful when performing the classification of habitats and sub-habitats consisting of more than 30 classes where a slight change in spectral values could alter and induce errors in classification outputs. Otherwise, automatic object mapping or classification in mosaic images may not provide accurate results. In our proposed approach, the RANSAC method was used successively to filter out the obtained SIFT points across adjacent tiles and to remove spectral outliers across each band of an image so that proper mapping of the spectral reflectance values can be performed. In addition to this, our approach has demonstrated a good seamless mosaic output in various three demonstrated datasets.
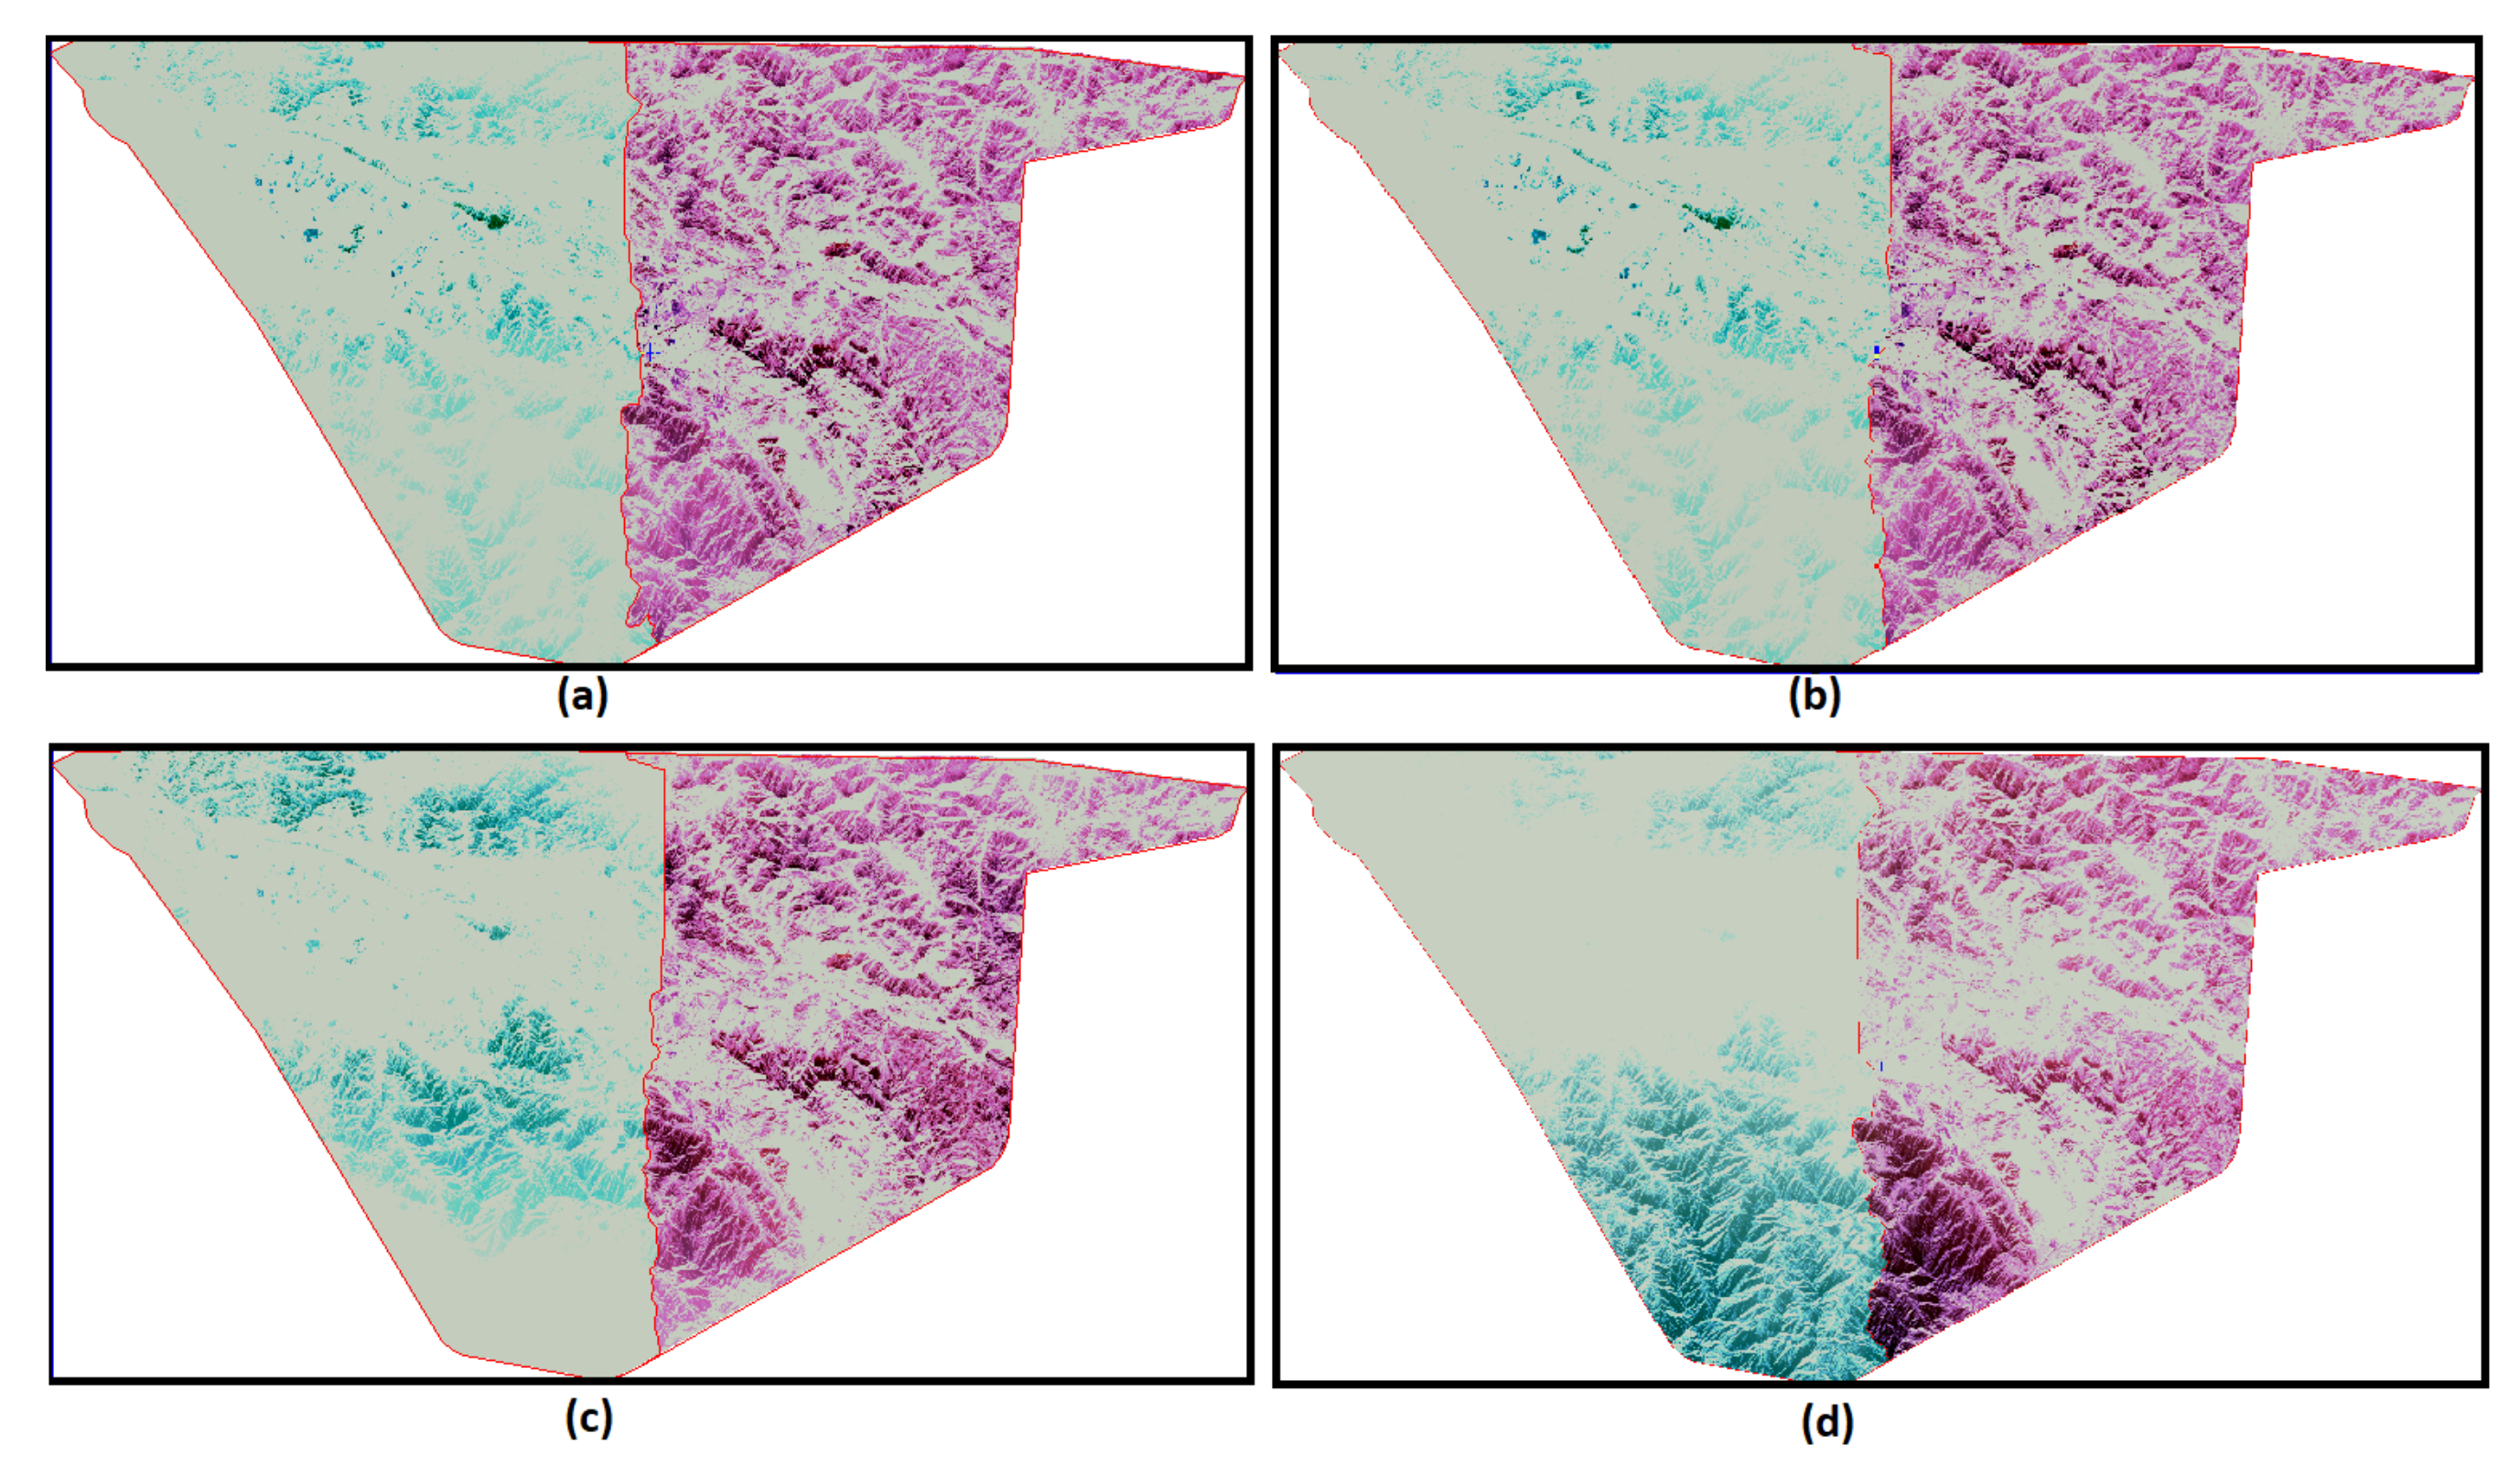
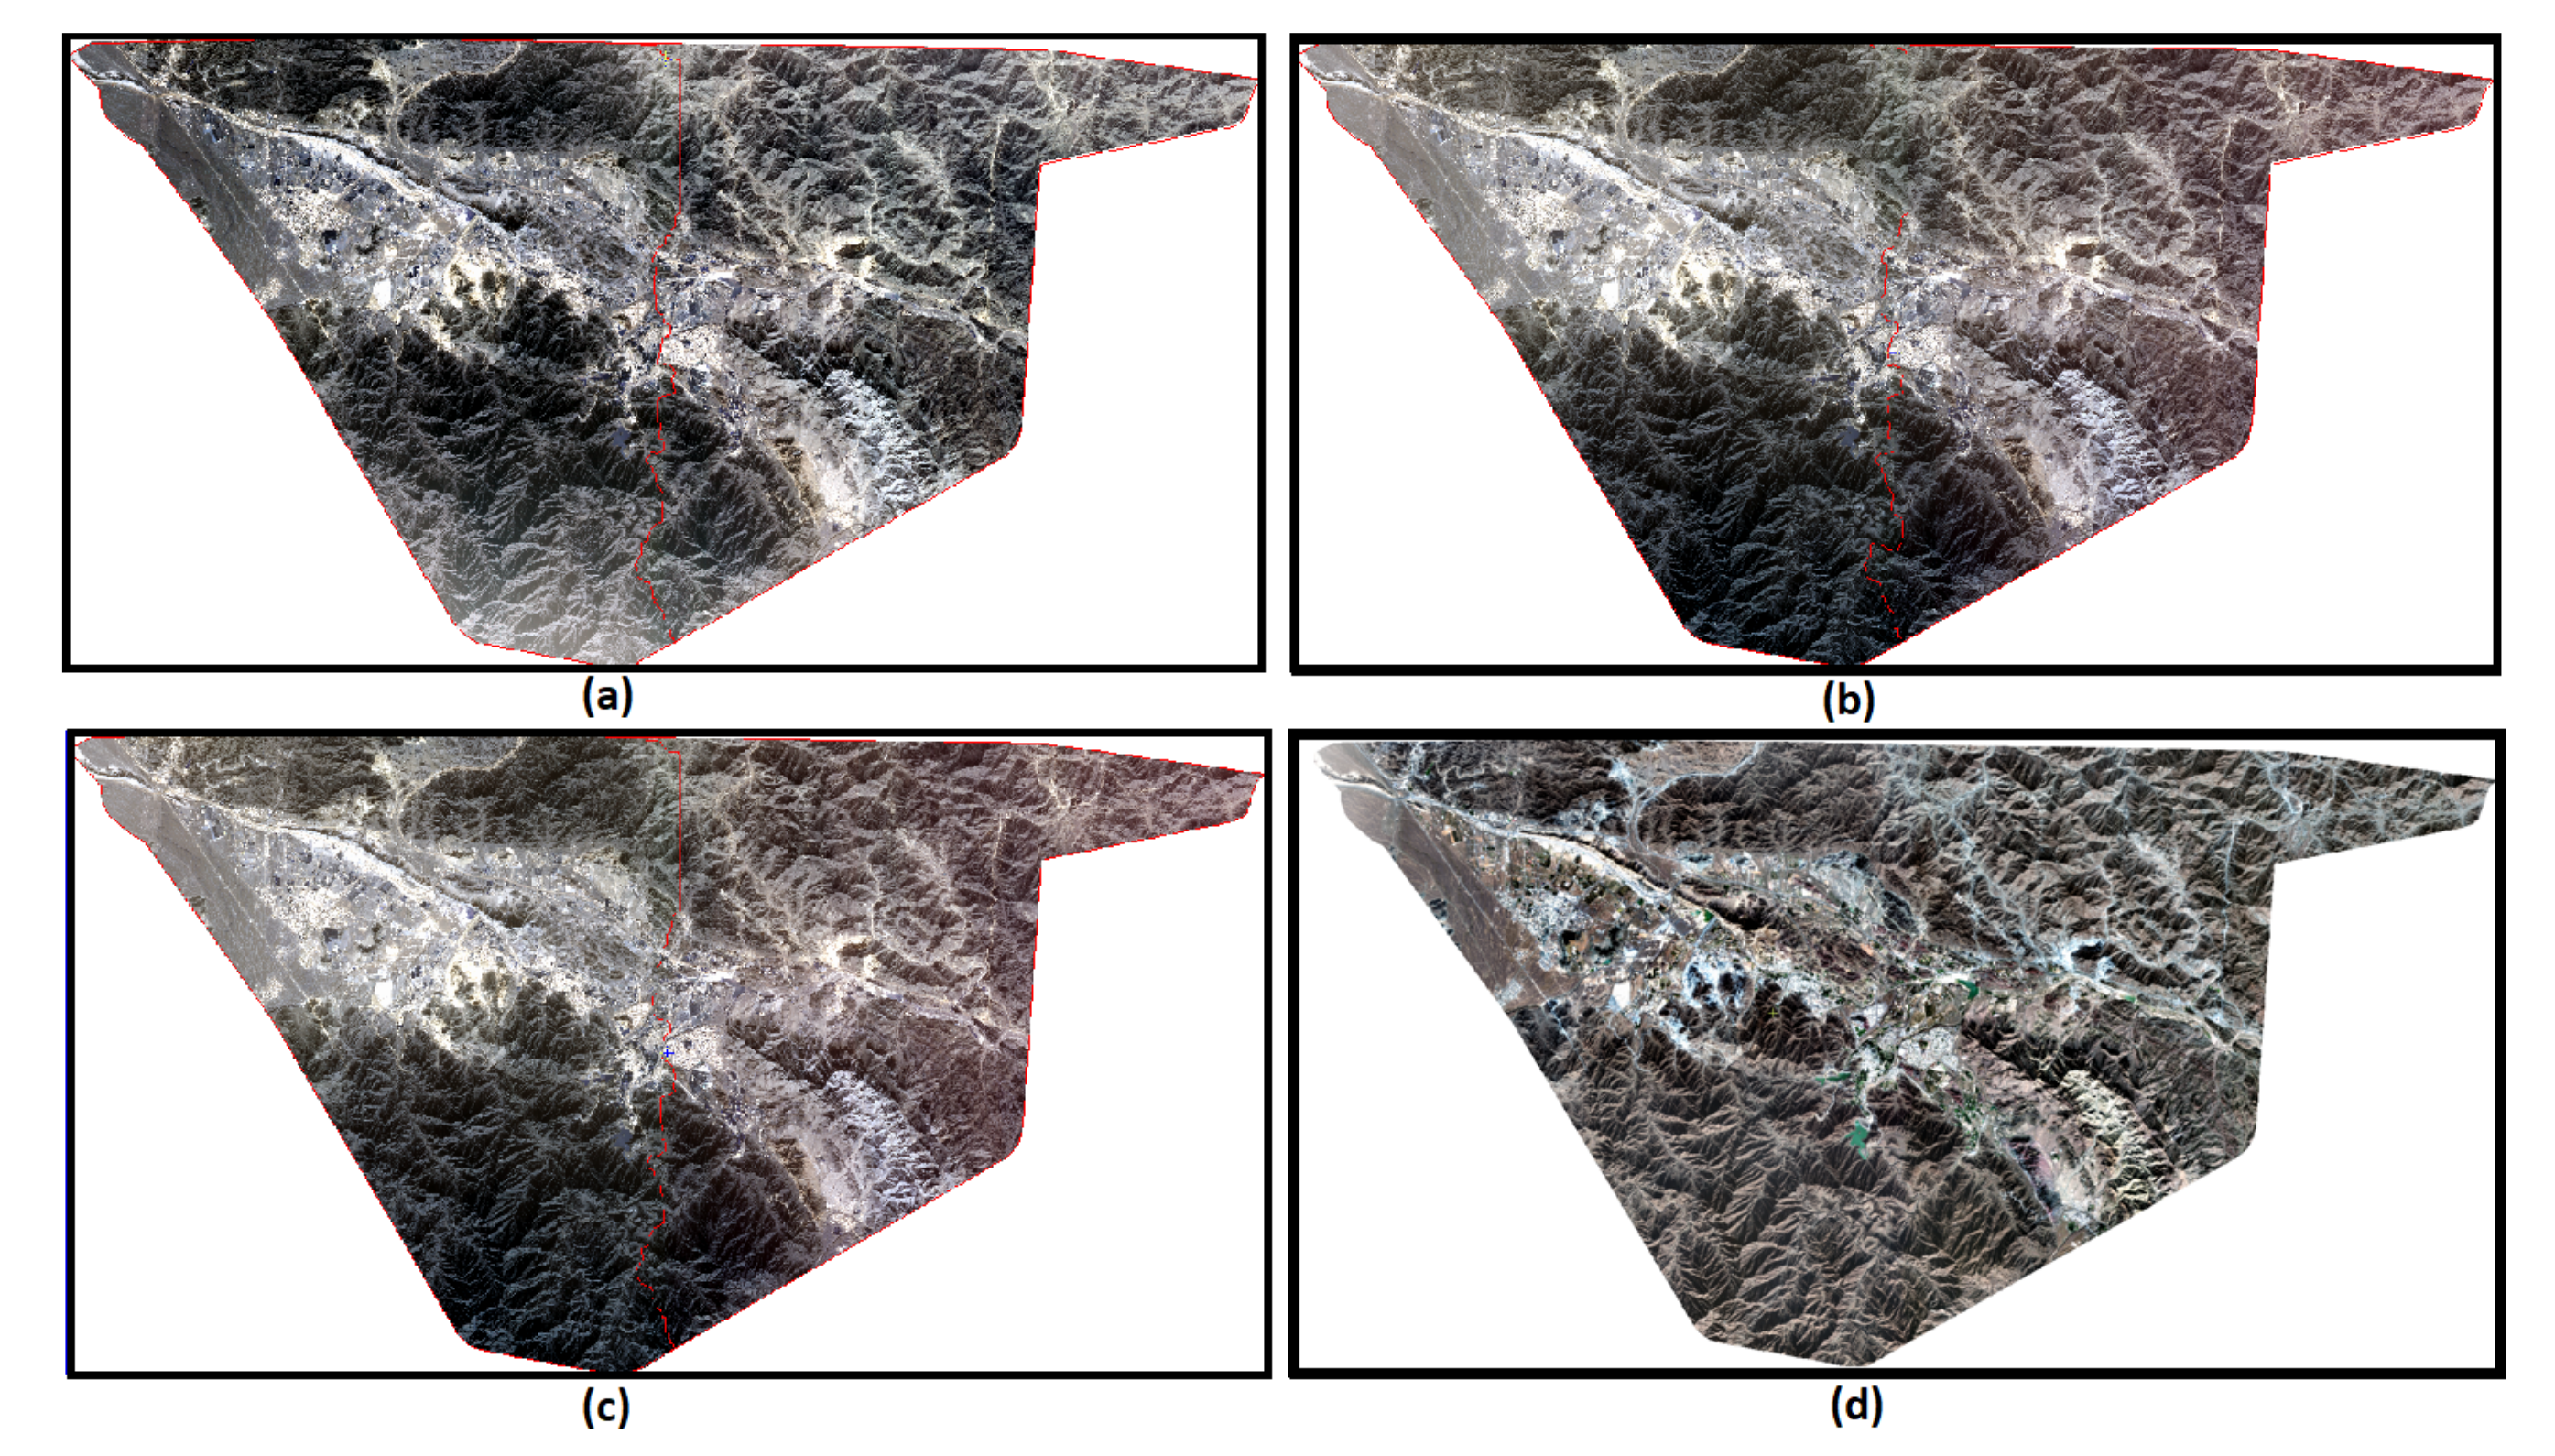
Figure 10 and Figure 11 show the output of various histogram and overlapping based color balancing approaches performed in the WorldView-2 images consisting of the parts of the Northern Emirates, UAE. In Figure 10, we can clearly observe that when information across bands over adjacent tiles are not linearly represented, it causes distinct color balancing issues. Even though histogram-based methods are found to be effective in many cases, the non-uniform distribution of information across the bands leads to mosaicking issues in such approaches. In Figure 10a–c, we can observe slight greenish and pinkish tint in the obtained mosaic while in Figure 10d, we can clearly observe how our proposed approach can handle color balancing issues and provide better mosaic as compared to other overlapping methods with different mentioned parameters for the earlier mentioned case.
3.4. Shortcomings of the Proposed Approach
The proposed approach has the following shortcomings. To establish proper mapping function from adjoining tile onto the base tile, sufficient points or SIFT features across the overlapping region of these two tiles need to exist, for which there has to be significant overlapping between the two adjacent tiles to properly represent the different population (object classes) of the constituent images. In the case of some tiles, whose overlapping is not sufficient, another set of tiles that has overlapping are required so that sufficient points are available to develop mapping functions. Furthermore, the overlapping region needs to contain features from various classes of objects. The presence of only a few specific classes of objects in the overlapping region makes the mapping function biased towards those few object classes only and the proposed approach may not work well with unseen classes of objects outside the overlapped region. Therefore, it is required to have significant overlapping between the tiles with the presence of various diverse classes of objects.
In the case of mapping spectral values of obtained mosaic to standard surface reflectance, it would have been better to use stable ground spectra as sensor bands of WorldView-2 and DubaiSat-2 do not perfectly match with Sentinel-2. Hence, while mapping obtained mosaic to surface reflectance using Sentinel-2 L2A product, some inconsistencies were observed as a result of which surface reflectance values for WorldView-2 and DubaiSat-2 differ by 3% and 2% respectively.
4. Conclusions and Future Work
We have developed an approach to generate seamless mosaics based on SIFT features by filtering outliers based on a robust approach. The RANSAC method was used successively to filter the SIFT points across adjacent tiles and to also remove spectral outliers across each band of the images. Our approach has demonstrated a good seamless mosaic output in various datasets. In our approach, we also demonstrated remapping the color-balanced mosaic image to the standard surface reflectance values. This is necessary for mapping and relating spectral values of unknown objects with the available standard spectral library especially when the task is to perform habitat and sub-habitat classification consisting of several classes. In the future, we would like to use stable ground surface reflectance measurements collected over a systematically sampled region of a mosaic to map its color-balanced mosaic to standard surface reflectance.
Author Contributions
Conceptualization, P.M. (Prajowal Manandhar) and P.M. (Prashanth Marpu); methodology, P.M. (Prashanth Marpu); software, P.M. (Prajowal Manandhar); validation, P.M. (Prajowal Manandhar) and A.J.; formal analysis, P.M. (Prajowal Manandhar); investigation, P.M. (Prajowal Manandhar) and A.J.; resources, K.A.; data curation, P.M. (Prajowal Manandhar); writing—original draft preparation, P.M. (Prajowal Manandhar); writing—review and editing, P.M. (Prashanth Marpu); visualization, A.J.; supervision, P.M. (Prashanth Marpu); project administration, K.A.; funding acquisition, K.A. All authors have read and agreed to the published version of the manuscript.
Funding
This research is funded by UAE Space Agency grant number SA12-2018-013.
Institutional Review Board Statement
Not applicable.
Informed Consent Statement
Not applicable.
Data Availability Statement
Sentinel-2 data is available on request.
Acknowledgments
We would like to acknowledge the support of various agencies for the data used in this work. WorldView-2 data was acquired through Abu Dhabi Digital Authority (ADDA) and DubaiSat-2 data from Mohammed Bin Rashid Space Centre (MBRSC). Sentinel-2 data was acquired from the United States Geological Survey explorer. We would also like to acknowledge Fatima Al Aydaroos and UAE Space Agency for their support.
Conflicts of Interest
The authors declare no conflict of interest.
References
- Pandey, A.; Pati, U.C. Image mosaicing: A deeper insight. Image Vis. Comput. 2019, 89, 236–257. [Google Scholar] [CrossRef]
- Li, X.; Feng, R.; Guan, X.; Shen, H.; Zhang, L. Remote sensing image mosaicking: Achievements and challenges. IEEE Geosci. Remote Sens. Mag. 2019, 7, 8–22. [Google Scholar] [CrossRef]
- Zomet, A.; Levin, A.; Peleg, S.; Weiss, Y. Seamless image stitching by minimizing false edges. IEEE Trans. Image Process. 2006, 15, 969–977. [Google Scholar] [CrossRef] [PubMed] [Green Version]
- Sibiryakov, A.; Bober, M. Image registration using RST-clustering and its application in remote sensing. In Proceedings of the International Society for Optics and Photonics, Image and Signal Processing for Remote Sensing XII, Stockholm, Sweden, 29 September 2006; Volume 6365, p. 63650G. [Google Scholar]
- Peng, Y.; Ying, S.; Qin, J.; Zeng, T. Trimmed strategy for affine registration of point sets. J. Appl. Remote Sens. 2013, 7, 073468. [Google Scholar] [CrossRef]
- Zaragoza, J.; Chin, T.J.; Brown, M.S.; Suter, D. As-projective-as-possible image stitching with moving DLT. In Proceedings of the IEEE Conference on Computer Vision and Pattern Recognition, Portland, OR, USA, 23–28 June 2013; pp. 2339–2346. [Google Scholar]
- Szeliski, R. Image alignment and stitching. In Handbook of Mathematical Models in Computer Vision; Springer: Berlin, Germany, 2006; pp. 273–292. [Google Scholar]
- Liu, J.; Li, H.T.; Gu, H.Y. Study of Color Balance for Remote Sensing Imagery Mosaic. In Proceedings of the 2011 International Symposium on Image and Data Fusion, Yunnan, China, 9–11 August 2011; pp. 1–4. [Google Scholar] [CrossRef]
- Uyttendaele, M.; Eden, A.; Skeliski, R. Eliminating ghosting and exposure artifacts in image mosaics. In Proceedings of the 2001 IEEE Computer Society Conference on Computer Vision and Pattern Recognition, CVPR 2001, Kauai, HI, USA, 8–14 December 2001; Volume 2, p. II. [Google Scholar]
- Shum, H.Y.; Szeliski, R. Construction of panoramic image mosaics with global and local alignment. In Panoramic Vision; Springer: Berlin, Germany, 2001; pp. 227–268. [Google Scholar]
- Schechner, Y.Y.; Nayar, S.K. Generalized mosaicing: High dynamic range in a wide field of view. Int. J. Comput. Vis. 2003, 53, 245–267. [Google Scholar] [CrossRef]
- Wang, W.; Ng, M.K. A variational method for multiple-image blending. IEEE Trans. Image Process. 2011, 21, 1809–1822. [Google Scholar] [CrossRef] [PubMed]
- Fang, J.; Wang, X.; Zhu, T.; Liu, X.; Zhang, X.; Zhao, D. A Novel Mosaic Method for UAV-Based Hyperspectral Images. In Proceedings of the IGARSS 2019—2019 IEEE International Geoscience and Remote Sensing Symposium, Yokohama, Japan, 28 July–2 August 2019; pp. 9220–9223. [Google Scholar] [CrossRef]
- Miller, S.D.; Lindsey, D.T.; Seaman, C.J.; Solbrig, J.E. GeoColor: A Blending Technique for Satellite Imagery. J. Atmos. Ocean. Technol. 2020, 37, 429–448. [Google Scholar] [CrossRef]
- Wang, W.; Ng, M.K. A variational approach for image stitching I. SIAM J. Imaging Sci. 2013, 6, 1318–1344. [Google Scholar] [CrossRef]
- Tao, M.W.; Johnson, M.K.; Paris, S. Error-tolerant image compositing. In Proceedings of the European Conference on Computer Vision, Crete, Greece, 5–11 September 2010; pp. 31–44. [Google Scholar]
- Levin, A.; Zomet, A.; Peleg, S.; Weiss, Y. Seamless image stitching in the gradient domain. In Proceedings of the European Conference on Computer Vision, Prague, Czech Republic, 11–14 May 2004; pp. 377–389. [Google Scholar]
- Ai, Y.; Kan, J. Image Mosaicing Based on Improved Optimal Seam-Cutting. IEEE Access 2020, 8, 181526–181533. [Google Scholar] [CrossRef]
- Dijkstra, E.W.; others. A note on two problems in connexion with graphs. Numer. Math. 1959, 1, 269–271. [Google Scholar] [CrossRef] [Green Version]
- Davis, J. Mosaics of scenes with moving objects. In Proceedings of the 1998 IEEE Computer Society Conference on Computer Vision and Pattern Recognition (Cat. No. 98CB36231), Santa Barbara, CA, USA, 25 June 1998; pp. 354–360. [Google Scholar]
- Chon, J.; Kim, H.; Lin, C.S. Seam-line determination for image mosaicking: A technique minimizing the maximum local mismatch and the global cost. ISPRS J. Photogramm. Remote Sens. 2010, 65, 86–92. [Google Scholar] [CrossRef]
- Avidan, S.; Shamir, A. Seam carving for content-aware image resizing. In ACM SIGGRAPH 2007 Papers; Association for Computing Machinery: New York, NY, USA, 2007; pp. 10–19. [Google Scholar]
- Pan, J.; Wang, M.; Li, D.; Li, J. Automatic generation of seamline network using area Voronoi diagrams with overlap. IEEE Trans. Geosci. Remote Sens. 2009, 47, 1737–1744. [Google Scholar] [CrossRef]
- Wan, Y.; Wang, D.; Xiao, J.; Wang, X.; Yu, Y.; Xu, J. Tracking of vector roads for the determination of seams in aerial image mosaics. IEEE Geosci. Remote Sens. Lett. 2011, 9, 328–332. [Google Scholar] [CrossRef]
- Jia, J.; Tang, C.K. Eliminating structure and intensity misalignment in image stitching. In Proceedings of the Tenth IEEE International Conference on Computer Vision (ICCV’05) Volume 1, Beijing, China, 17–21 October 2005; pp. 1651–1658. [Google Scholar]
- Gracias, N.; Mahoor, M.; Negahdaripour, S.; Gleason, A. Fast image blending using watersheds and graph cuts. Image Vis. Comput. 2009, 27, 597–607. [Google Scholar] [CrossRef] [Green Version]
- Lu, T.; Li, S.; Fu, W. Fusion based seamless mosaic for remote sensing images. Sens. Imaging 2014, 15, 1–14. [Google Scholar] [CrossRef]
- Mehtre, B.M.; Kankanhalli, M.S.; Narasimhalu, A.D.; Man, G.C. Color matching for image retrieval. Pattern Recognit. Lett. 1995, 16, 325–331. [Google Scholar] [CrossRef]
- Kalpoma, K.A.; Kudoh, J.i. Image fusion processing for IKONOS 1-m color imagery. IEEE Trans. Geosci. Remote Sens. 2007, 45, 3075–3086. [Google Scholar] [CrossRef]
- Holtkamp, D.J.; Goshtasby, A.A. Precision registration and mosaicking of multicamera images. IEEE Trans. Geosci. Remote Sens. 2009, 47, 3446–3455. [Google Scholar] [CrossRef]
- Li, X.; Hui, N.; Shen, H.; Fu, Y.; Zhang, L. A robust mosaicking procedure for high spatial resolution remote sensing images. ISPRS J. Photogramm. Remote Sens. 2015, 109, 108–125. [Google Scholar] [CrossRef]
- Choi, S.; Kim, T.; Yu, W. Performance evaluation of RANSAC family. J. Comput. Vis. 1997, 24, 271–300. [Google Scholar]
- Lati, A.; Belhocine, M.; Achour, N. Robust aerial image mosaicing algorithm based on fuzzy outliers rejection. Evol. Syst. 2020, 11, 717–729. [Google Scholar] [CrossRef]
- Manandhar, P.; Alkhaja, A.M.; Marpu, P.R.; Aung, Z. Towards Rectifying the Effect on Image Registration of Pointing Inaccuracies in Nanosatellites Using Deep Convolutional Neural Networks. J. Small Satell. 2020, 9, 897–910. [Google Scholar]
- Yu, L.; Zhang, Y.; Sun, M.; Zhu, X. Colour balancing of satellite imagery based on a colour reference library. Int. J. Remote Sens. 2016, 37, 5763–5785. [Google Scholar] [CrossRef]
- Manandhar, P.; Marpu, P.R.; Aung, Z.; Melgani, F. Towards automatic extraction and updating of VGI-based road networks using deep learning. Remote Sens. 2019, 11, 1012. [Google Scholar] [CrossRef] [Green Version]
- Naixin, Q.; Shengxiu, Z.; Lijia, C.; Xiaogang, Y.; Qiao, S. A robust to outliers method for estimating the homography. In Proceedings of the 2017 29th Chinese Control And Decision Conference (CCDC), Chongqing, China, 28–30 May 2017; pp. 1586–1590. [Google Scholar]
- Su, M.S.; Hwang, W.L.; Cheng, K.Y. Analysis on multiresolution mosaic images. IEEE Trans. Image Process. 2004, 13, 952–959. [Google Scholar] [CrossRef] [PubMed]
- Burt, P.J.; Adelson, E.H. A multiresolution spline with application to image mosaics. ACM Trans. Graph. (TOG) 1983, 2, 217–236. [Google Scholar] [CrossRef]
Figure 1.
Flowchart of the proposed approach.

Figure 2.
WorldView-2 tiles: (a) for Northern Emirates region, UAE and (b) a preview of color balancing issues observed using mosaicking algorithm available in Envi software.
Figure 2.
WorldView-2 tiles: (a) for Northern Emirates region, UAE and (b) a preview of color balancing issues observed using mosaicking algorithm available in Envi software.

Figure 3.
Demonstration of process in sample area: (a) true color RGB image of the adjacent tiles. (b) Illustration of identified collinear points from SIFT feature points in adjacent tiles using RANSAC algorithm.
Figure 3.
Demonstration of process in sample area: (a) true color RGB image of the adjacent tiles. (b) Illustration of identified collinear points from SIFT feature points in adjacent tiles using RANSAC algorithm.

Figure 4.
A plot showing outliers and linear function fitting on Band-1 data w.r.t base tile ’Sen-B1’ and adjoining tile ’DS-B1’. The linear function developed for mapping adjoining tile to base tile with a function y = 6.294x − 203.2.
Figure 4.
A plot showing outliers and linear function fitting on Band-1 data w.r.t base tile ’Sen-B1’ and adjoining tile ’DS-B1’. The linear function developed for mapping adjoining tile to base tile with a function y = 6.294x − 203.2.

Figure 5.
(a) Mosaicking output of WorldView-2 images; (b) final product after remapping of the mosaic to surface reflectance values.
Figure 5.
(a) Mosaicking output of WorldView-2 images; (b) final product after remapping of the mosaic to surface reflectance values.

Figure 6.
(a) Initial satellite tiles. (b) The color balanced mosaic output in DubaiSat-2 images using the proposed approach.
Figure 6.
(a) Initial satellite tiles. (b) The color balanced mosaic output in DubaiSat-2 images using the proposed approach.

Figure 7.
The remapping of DubaiSat-2 mosaic to Surface Reflectance.

Figure 8.
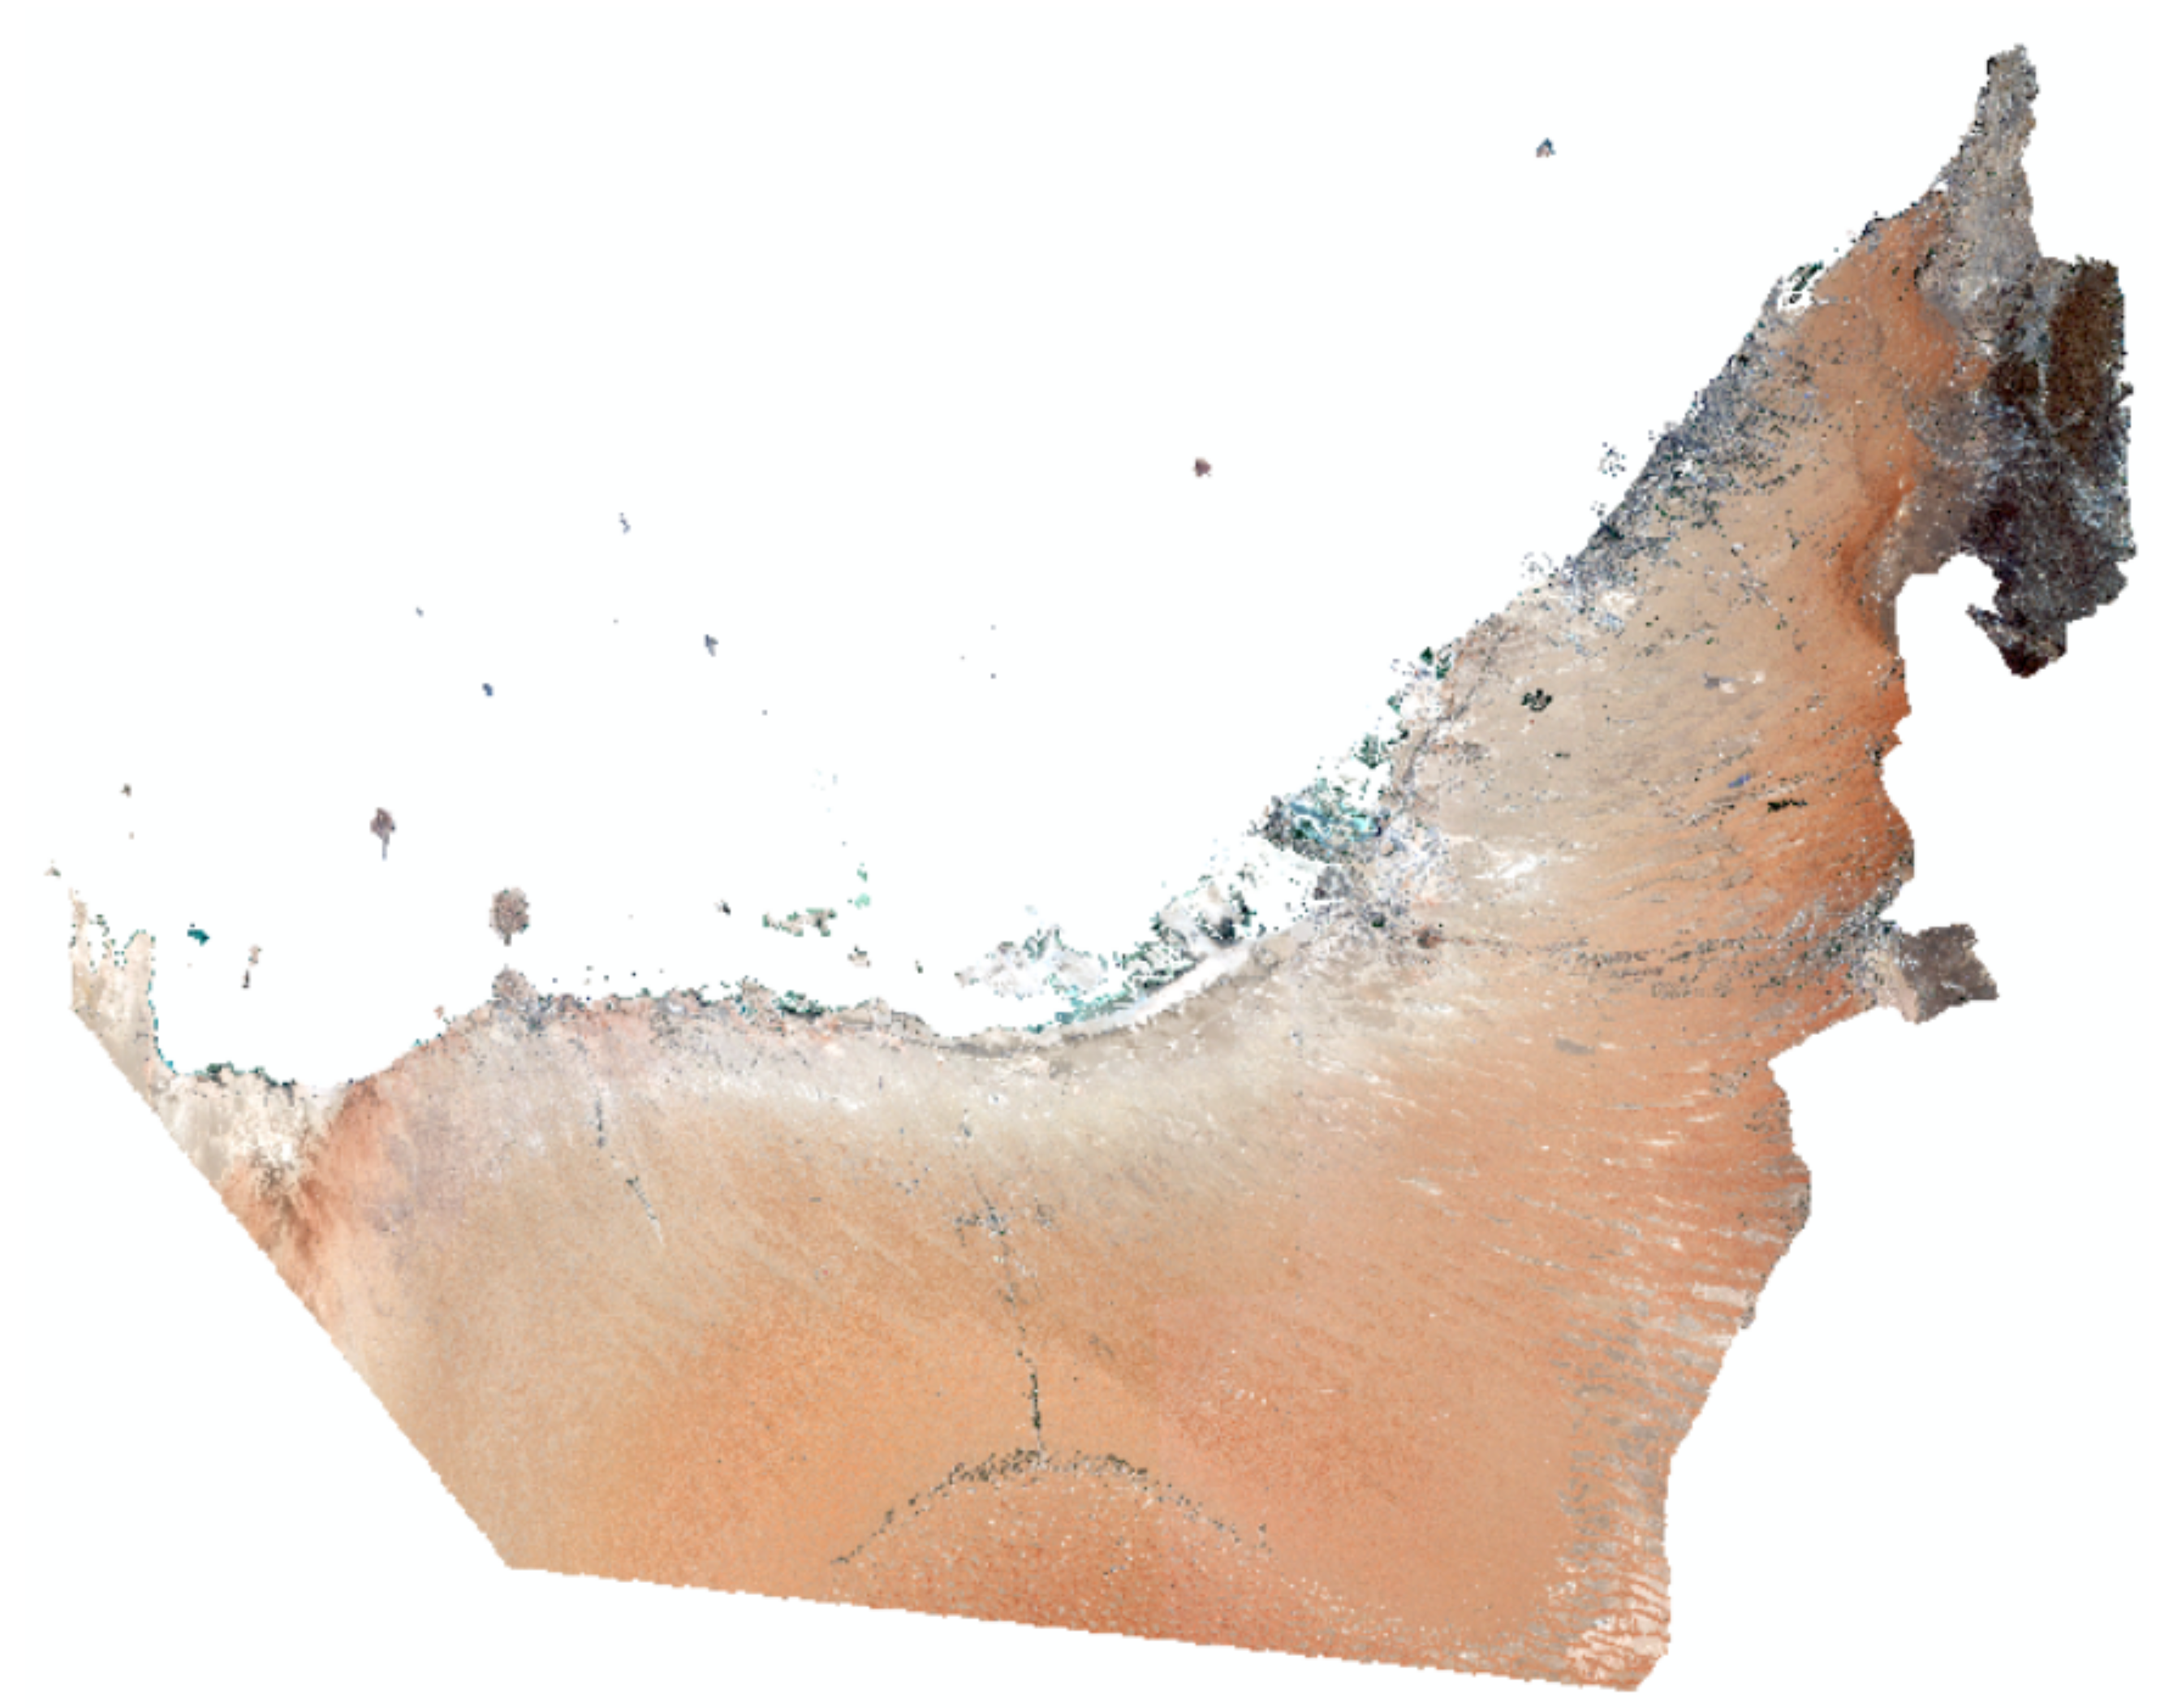
The mosaic of UAE developed using the proposed approach on Sentinel-2 Level 2A data.

Figure 9.
The mosaic of UAE developed using the proposed approach on Sentinel-2 Level 1C data.

Figure 10.
The color balancing outputs obtained in the South-Eastern part of the WorldView-2 tiles provided in Figure 2 using different Histogram based approaches: (a) minimum difference with adaptive filter, (b) minimum difference with hot spot, (c) minimum square distance with hot spot, (d) minimum difference with adaptive filter.

Figure 11.
The color balancing outputs obtained in the South-Eastern part of WorldView-2 tiles provided in Figure 2 using different overlapping based approaches: (a) minimum squared difference with hot spot, (b) minimum difference with hot spot, (c) minimum difference with adaptive filter. (d) Proposed approach.


Table 1.
Correlation coefficient (C.C.) between reference base image and the final mosaic image.
| Band | WV-2 | DS-2 | Sen-2 2A | Sen-2 1C |
|---|---|---|---|---|
| Red | 0.941 | 0.954 | 0.982 | 0.962 |
| Green | 0.952 | 0.963 | 0.971 | 0.956 |
| Blue | 0.955 | 0.949 | 0.973 | 0.964 |
| Infra-red | 0.938 | 0.924 | 0.962 | 0.951 |
Publisher’s Note: MDPI stays neutral with regard to jurisdictional claims in published maps and institutional affiliations. |
© 2021 by the authors. Licensee MDPI, Basel, Switzerland. This article is an open access article distributed under the terms and conditions of the Creative Commons Attribution (CC BY) license (https://creativecommons.org/licenses/by/4.0/).
Share and Cite
MDPI and ACS Style
Manandhar, P.; Jalil, A.; AlHashmi, K.; Marpu, P. Automatic Generation of Seamless Mosaics Using Invariant Features. Remote Sens. 2021, 13, 3094. https://0-doi-org.brum.beds.ac.uk/10.3390/rs13163094
AMA Style
Manandhar P, Jalil A, AlHashmi K, Marpu P. Automatic Generation of Seamless Mosaics Using Invariant Features. Remote Sensing. 2021; 13(16):3094. https://0-doi-org.brum.beds.ac.uk/10.3390/rs13163094
Chicago/Turabian StyleManandhar, Prajowal, Ahmad Jalil, Khaled AlHashmi, and Prashanth Marpu. 2021. "Automatic Generation of Seamless Mosaics Using Invariant Features" Remote Sensing 13, no. 16: 3094. https://0-doi-org.brum.beds.ac.uk/10.3390/rs13163094
Note that from the first issue of 2016, this journal uses article numbers instead of page numbers. See further details here.