Article

Land Use Scenario Simulation and Ecosystem Service Management for Different Regional Development Models of the Beibu Gulf Area, China

1
Research Center for Spatial Planning and Human-Environment System Simulation, School of Geography and Information Engineering, China University of Geosciences, Wuhan 430078, China
2
School of Arts and Communication, China University of Geosciences, Wuhan 430074, China
3
College of Horticulture and Forestry Sciences/Hubei Engineering Technology Research Center for Forestry Information, Huazhong Agricultural University, Wuhan 430070, China
*
Author to whom correspondence should be addressed.
Remote Sens. 2021, 13(16), 3161; https://0-doi-org.brum.beds.ac.uk/10.3390/rs13163161
Submission received: 1 July 2021 / Revised: 6 August 2021 / Accepted: 7 August 2021 / Published: 10 August 2021
(This article belongs to the Section Environmental Remote Sensing)

Abstract

:
Land use change is an important way for human activities to affect ecosystems. Based on the land use demands and policies, the simulation of future land use changes under different scenarios can test the rationality of socio-economic and policy-oriented land use changes. In this study, we set three scenarios of regular growth, ecological protection, and ecotourism development in 2030 for the Beibu Gulf area, China. We simulated the spatial distribution and evolution characteristics of the future landscape pattern using the Scenario Generator Rule Based Module of InVEST. Meanwhile, the ecosystem service value (ESV) was estimated by the improved unit area value equivalent method to reveal the trend of ESVs under different regional development models. The results indicated that the land use changes in the Beibu Gulf during 1999–2014 showed significant spatial heterogeneity. The farmland was mainly distributed in Beihai, the forestland was located in Fangchenggang, while the orchard was concentrated on Qinzhou. Due to economic construction and urban expansion, construction land and aquaculture land were gradually growing, while farmland and mud flat continued to decrease. Between 2014 and 2030, the total ESV decreased in the regular growth scenario and gradually increased in the ecological protection scenario and ecotourism development scenario. In addition, by comparing the three scenarios, the ecotourism development scenario is a more reasonable model for Guangxi Beibu Gulf area, which realized the trade-off between tourism development and resource conservation. Therefore, regional planners should not only consider maximizing ESVs when planning for ecosystem services, but also strive to maintain a reasonable structure of ecosystem services. Some suggestions were provided in this paper at the macro level and the local development model level respectively, which offered some references for the rational allocation of land resources, ecological environmental protection and ecotourism development in the coastal area of Beibu Gulf.

1. Introduction

Land use change is an important way in which human activities affect ecosystems, altering the provision of ecosystem goods and services by influencing ecosystem patterns and processes, thereby affecting the function and value of ecosystem services [1,2,3]. Ecosystem services are rapidly degraded under strong disturbance of human activities, and the assessment of ESVs has become a research hotspot [4,5,6,7]. Land use types can serve as proxies for ecosystem services by matching with equivalent biomes to facilitate large-scale ecosystem service valuation based on remote sensing data [8]. Some studies have already discussed the relationship between land use change and ecosystem services [5,9,10]. For example, Rimal et al. [5] analyzed and quantified the spatio-temporal variation of land use in the Koshi River Basin, Eastern Nepal during 1996–2016 to help maintain ecosystem services. Xie et al. [9] predicted the changes in the ecosystem service values of Zhujiajian Island in the next 20 years to provide recommendations on the ecological management of the island. With the continuous development of related research, the quantitative assessment methods of ecosystem services are becoming more mature, and the common methods include conditional value method, shadow engineering method, market opportunity method and asset value method [11]. In the existing studies on ecosystem service value (ESV) evaluation, Costanza et al. [12] first presented the equivalence factor method to quantify global ESV [1,13]. Since then, the ESV has been studied globally and has become a popular and cutting-edge issue for regional organizations and their scientific communities [3]. This method has more accurate calculation results, highlights the characteristics of the study area, and facilitates the spatial expression of ecosystem service function values. However, it has high requirements for data collection and processing, and the calculation is more complicated [14]. Therefore, Xie et al. [15] proposed an evaluation system of ecological service value per unit area of terrestrial ecosystems based on the land use in China on the theoretical basis of Costanza et al. [12], and improved it later in accordance with the actual situation in China [16]. The method is based on distinguishing different kinds of ecosystem service functions, constructing the value equivalents of various ecosystem service functions on the basis of quantifiable criteria, and then assessing them in combination with the distribution area of the ecosystem [15]. It has the advantages of simple utilization, low data requirements, high comparability of results, and comprehensive evaluation, which is widely used in the study of regional ESV evaluation in China [1].
With the rapid development of the regional economy, people have started to conduct simulations of future land use changes under different scenarios based on the land use demand in coastal areas and the policy changes associated with it [17]. By simulating the changes in regional land use scenarios and their potential impacts on ecosystem structure and function to understand the interaction mechanisms between land use systems and ecosystems, so as to test the rationality of socioeconomic and policy-oriented land use changes [18,19]. Currently, building simulation models is an effective way to study land use change [19]. As an important tool for conducting landscape regulation and optimization, land use change models can help us better understand the mechanisms of land use systems and provide a basis for land use policy formulation [20]. The current simulation model focuses on the evolution of specific land use types under the influence of human activities, such as the interconversion of cropland, forestland, and construction land [21]. In this way, the causes and consequences of alternative future landscape dynamics related to socio-economic and natural environmental drivers are analyzed. Commonly used models for land use change simulation at a certain spatial scale mainly includes quantitative simulation models that focus on quantifying the land demands such as the system dynamics (SD) model and Markov model, and spatial simulation models that focus on the spatial allocation of land at the micro level such as the cellular automata (CA) series models, Agent-based models and CLUE (Conversion of Land Use and its Effects) series models [22]. The former can analyze the driving mechanisms and the trends of land use change from the perspective of temporal changes, but it is difficult to simulate the spatial distribution characteristics of land use change [23]. Therefore, it needs to be combined with other models with spatial simulation capability, thus to simulate the spatio-temporal dynamics of land use. In contrast, the latter not only incorporates natural and human factors, but also couples global land quantity demand and local land use spatial changes. It strengthens the connection between various land use types from the perspective of dynamic competition, and provides solutions for the evolution of landscape patterns and integration of ecosystem services. InVEST was collaboratively developed by Stanford University, the University of Minnesota, the Nature Conservancy and the World Wildlife Fund in 2007 to provide a powerful tool to simultaneously quantify and assess the multiple ecosystem services generated by a landscape. The model is an open-source modeling environment, widely used for scenario-based modeling and assessment of ecosystem services given changes in land uses [24]. It can be used to quantify ecosystem services for different spatial scales with fewer data due to its simplicity, and rapid and powerful spatial representation [25]. Moreover, the InVEST model is easy to operate and requires fewer constraints than other spatial simulation models. Therefore, we chose the InVEST model to simulate the land use changes in the Beibu Gulf area, and attempted to provide relevant guidance for the rational use of land in the coastal zone as well as the sustainable development of the ecological environment.
The rise of the Beibu Gulf Economic Zone in recent years has promoted the development of local economy, accelerated urbanization, as well as provided financial and technical support for local ecological construction. The Guangxi Beibu Gulf Economic Zone is rich in ecological resources, but as a key pivot point for the Western Development Strategy and China-ASEAN Free Trade Agreement, the region is experiencing rapid urbanization expansion and infrastructure construction. This has intensified the encroachment of industrial land, commercial land, residential land, and transportation and other construction land on ecological land, reducing the ecosystem service function of the Beibu Gulf area. In recent years, the development of tourism in the Beibu Gulf area can also lead to a significant loss of ecosystem services. It alters ecosystems by converting land from forestland and farmland to built-up land, which has critical implications for local economies and ecosystem management [26]. The development and construction of various tourism infrastructures such as hotels, parking lots and visitor centers have also seriously affected the ecosystem structure and function and the sustainable use of ecotourism resources. Meanwhile, pollutants from rivers entering the sea have led to the deterioration of water quality, making the environmental pollution problem in the Beibu Gulf area more prominent [27]. Its nearshore marine ecosystem is also facing serious challenges from various human activities that are increasing during the development process [28]. For example, mud flat in the Beibu Gulf area is being destroyed at an alarming rate. This loss has led to some serious ecological problems such as sea level fluctuations and biodiversity degradation, which will have a huge impact on the coastal areas [29]. Therefore, understanding the changing pattern of ecosystem structure and function in the Beibu Gulf area and its driving factors, as well as assessing its ecotourism potential and possible impacts, have become one of the key scientific issues in this region’s development. However, current research on changes in ecosystem structure and function in the Beibu Gulf area is relatively scarce, and the relationship between rapid economic development and drastic structural changes in the regional ecosystem remains unclear [11]. Therefore, assessing the land use change and ESV evolution characteristics, and simulating the future land use regulation pattern and its ESV change trend in the region with the help of land use change model is very important to promote the ecological construction and sustainable development of the Beibu Gulf Economic Zone.
To understand the land use change and the pattern of ecosystem service changes in the Beibu Gulf coastal area from 1999 to 2014, we simulated the future spatial distribution and evolution characteristics of landscape pattern with the help of land use change model. In addition, the improved unit area value equivalent method was used to estimate the ESVs in the region at different periods and reveal the trends of ESVs under different landscape regulation modes. Thus provide a scientific basis for the rational allocation of land resources, ecological environmental protection and ecotourism development in the Beibu Gulf coastal area. The objectives of this paper as follows: (1) to reveal the characteristics of the landscape pattern evolution in the Beibu Gulf area under the influence of multiple human activities. (2) Setting up different scenario models for future land use control in Beibu Gulf and simulating the future landscape pattern with the help of land use models. (3) To compare the ESVs in Beibu Gulf under different scenario models, so as to provide a theoretical basis for landscape management and ecological regulation under different development requirements.

2. Materials and Methods

2.1. The Study Area

The Beibu Gulf of Guangxi Province is located in southern China, bordering Guangdong from the estuary of the Ximi River in the east and dividing Vietnam from the Beilun River in the west. It lies between 21.3°–22.3′N and 107.5°–109.8°E, including three coastal cities—i.e., Beihai, Qinzhou, and Fangchenggang—and these three cities are arranged from east to west along the Beibu Gulf (Figure 1). The study area includes four counties or districts in Beihai (the Hepu County, the Yinhai District, the Tieshangang District, and the Haicheng District), one district in Qinzhou (the Qinnan District), and three counties or districts in Fangchenggang (the Gangkou District, Fangcheng District, and the Dongxing District). The total area of these 8 counties and districts is about 8840 km2. Their all have the advantage of coastal locations, and also have a strategic position for economic development. It is the distinctive feature of Beibu Gulf area compared with other regions in China.
The Beibu Gulf area has a tropical monsoon climate with warm and humid climatic characteristics, with an average annual temperature of about 26 °C and an average annual sunshine duration of 1750–2650 h. Its topography is complex and the landform types are diverse, but mainly dominated by river alluvial plains, and marine plains and hills. These rivers in the study area flow from northwest to southeast. It is characterized as rain heat over the same period, and is dry in winter and rich rain in hot summer.
The Beibu Gulf is rich in eco-tourism resources, which have high real and potential development value. The region is also a post-development area for eco-tourism due to historical, locational, and resource constraints as well as the influence of unbalanced development strategies, which has greater growth potential in the future. According to the National Strategic Plan of China, the Beibu Gulf area will be made into a world-class tourism destination comparable to the Mediterranean Sea and the Caribbean Sea. As a border area in southwest China, it enjoys the Policy of Regional National Autonomy, the Western Development Strategy, the Coastal Opening-up Policy and the Border Opening-up Policy, etc. Moreover, it is also an important channel for China-ASEAN Free Trade Agreement. However, due to the rapid economic development and urbanization, population growth and resource over-consumption have led to a series of environmental pollutions, such as vegetation degradation and land sanding. These ecological problems are gradually emerging, posing a serious threat to ecosystem management in the Beibu Gulf Economic Zone. As one of the four most prolific marine ecosystems in the world, the mud flat has suffered significant damage from human activities and has disappeared dramatically in this region. Therefore, it is imperative to develop ecotourism to promote ecological construction and sustainable development in the Beibu Gulf Economic Zone.

2.2. Data Information

We downloaded Landsat remote sensing images of the study area from the Geospatial Data Cloud (http://www.gscloud.cn/, accessed on 2 September 2017) for the years of 1999 and 2014. High-quality images of the growing or non-growing season were both acquired to identify vegetation types (Table 1). The spatial resolution of remote sensing image was 30 m, and the study area was covered by two scenes of 124/045 and 125/045 images. Landsat 7 satellite images were used in 1999, while Landsat 8 satellite images were used in 2014. In this study, the fast atmospheric correction model of ENVI was used to process all the images. Since the central longitudes of the images of 124/045 and 125/045 were different, they were converted to WGS_1984_UTM_zone_49N to ensure that the subsequent study was carried out properly.

2.3. Land Use Change Analysis

Compared with other classification methods such as the mahalanobis distance method, the maximum likelihood estimate and the support vector machine, we found that the artificial neural network method has the highest decoding accuracy. Therefore, the land use maps in 1999 and 2014 were derived from Landsat TM/ETM+/OLI imageries using supervised classification and artificial neural network methods. The classification technique is a standard backpropagation for supervised learning, and we used a layered feed-forward neural network which provided a non-linear classification [30,31]. We interpreted eight land use types (Table 2), i.e., farmland, forestland, orchard, aquaculture land, mud flat, water, bare land, and construction land. The overall classification accuracy of each map was validated through official reports and field verifications, and the accuracies were >90%, which met the needs of this study.
In addition, we analyzed the temporal characteristics of land use change using four indicators, including the total net change area, annual change area, annual change rate, and dynamic degree. Kernel density analysis was also used to reflect the spatial distribution characteristics of land use change. The specific calculation methods for these four indicators and the kernel density analysis methods were described in detail in the attachment (Supplementary Materials).

2.4. Land Use Scenario Simulation

Land use scenario is the future land use planning considering the conditions of historical land use dynamic, the status of land resource distribution and the regional land use constraints and others. In this paper, we set three different land use scenarios for Beibu Gulf area in 2030 based on the geographical characteristics, the economic development trends, and the ecological vulnerabilities.

2.4.1. Regular Growth Scenario

In recent years, the construction of heavy industrial projects, the rapid development of trade and logistics, as well as the development and construction of tourism in the Beibu Gulf area have led to a continuous decrease in natural resources and an increase in construction land area. Meanwhile, the economic value of fruits and aquaculture has increased, leading to the growing of orchard and aquaculture areas. In this scenario, the growth of construction land, aquaculture land, and orchard areas during 2014–2030 should be consistent with the period from 1999 to 2014 to ensure the sustainable development of regional economy (Table 3). However, these ecological problems in the Beibu Gulf area have become very prominent. Extensive deforestation and encroachment on remnant mud flat should be prohibited. Therefore, the regular growth scenario primarily followed the historical land use evolution to develop the regional economy and no longer destroy the natural environment of the Beibu Gulf area.

2.4.2. Ecological Protection Scenario

Rapid economic development has posed a serious ecological threat to the Beibu Gulf area, including seawater backflow, vegetation degradation and land sanding. In this scenario, we tried to control the urban expansion, and avoided the transformation of forest resources into orchards and the transformation of natural wetland resources into aquaculture land. Meanwhile, this scenario tried to restore forestland and mud flat, so the increment of forestland area and mudflat area during 2014–2030 was set the same as that during 1999–2014 (Table 3). The scenario required not only the enhancement of regional ecosystem services and ecological security in the Beibu Gulf area, but also the development of agricultural economy and the improvement of the total production value in this region. Therefore, the change area of orchard from 2014 to 2030 was set to 50% of the increment during 1999–2014 to meet the economic growth demand.

2.4.3. Ecotourism Development Scenario

To weigh the sustainable regional economic development and ecological protection, ecotourism development scenario was proposed to balance economic growth and ecological protection. The natural resources and tourism resources such as coastal and national borders should be reasonably utilized to highlight the characteristics of the economic structure in the Beibu Gulf area. Tourism development is not only dependent on natural resources, human resources, and urban infrastructure, but also combined with the potential for tourism development in the Beibu Gulf area. Therefore, the change areas of construction land, aquaculture land and orchard during 2014–2030 was set to 50% of the increment at the period of 1999–2014 to ensure its economic development (Table 3). Meanwhile, the change area of forestland during 2014–2030 was set to 75% of the increment during 1999–2014, while the change area of mud flat was set to 50% of it to safeguard the regional ecological security.

2.5. Land Use Change Model

The InVEST model is a distributed algorithm based on 3S technology that provides a new technical tool for spatial representation, dynamic analysis and quantitative assessment of ecosystem service functions. The model is an open-source modeling environment that can quantify ecosystem services at different spatial scales with less data. It takes data such as regional natural and socio-economic under current or future scenarios as input, and the distribution characteristics and evolutionary trend of ecosystem service functions under the scenario as output. In this paper, the Scenario Generator Rule Based Module of InVEST was used to simulate the future land use change during 2014–2030 under each scenario. This scenario generation tool provides a relatively simple method of generating scenarios based on land suitability. It combines multi-criteria evaluation methods, overlay analysis, and expert knowledge to project alternative futures. Moreover, the InVEST model is easy to operate and requires fewer constraints than models such as CA, CLUE-S, and IMAGE. It determines the complexity of the simulation based on the information provided by decision makers and also incorporates the functional requirements of ecological services. We considered the land-use in 2014 as the reference map for the simulation, and used the parameters as inputs of the Scenario Generator Rule Based Module, including land use map (raster data), transition table (Table S1), calculate priorities, specify transitions, use factors (Table S2), and constraints layer (Table S3). The characteristics and roles of these parameters are described in the annex (Supplementary Materials).

2.6. Assessing Ecosystem Service Value

Based on the ecosystem service value assessment system and historical literature, each land-use type included 11 ecosystem service function types [12]. Referred to the equivalent coefficients of ecosystem service value and the “Ecosystem Service Value Equivalent Scale for China’s Terrestrial Ecosystem” of Costanza et al. [12] and Xie et al. [15], we revised the ecosystem service value equivalent of Beibu Gulf area. The per-unit standard value of ecosystem services is the economic value of the grain produced by an average hectare of farmland [15], quantifying the contribution of various ecosystems to ecosystem services. In this paper, the net profit of per-unit grain production of farmland ecosystem was regarded as per-unit standard ecosystem services value. Based on it and various ecosystem service value coefficients, we estimated the total value of ecosystem services. The calculation formula is
D = i = 1 n S i F i
where the D is the ecosystem services value per unit area of class i land use type ($/ha). The Si is the percentage of the crop area of i (%). The Fi is the average net profit per unit area for crop of i ($/ha); and the ranges of i is [1, n].
According to the national statistical data for crops in 2010 selected by Xie et al. [15], we calculated the D value, and the results was 484.64 $/ha. Meanwhile, we combined the per-unit standard ecosystem services equivalent value to determine the value of service units of different ecosystem types (Table 4).

3. Results

3.1. Land Use Change from 1999 to 2014

Farmland, forestland and orchard were the main land use types in the Beibu Gulf area (Table 5), and their areas accounted for 82.24% of the total area. Farmland was mainly represented by paddy fields, forestland was mainly evergreen broad-leaved forests, while orchards were mainly the dwarfed economic forests such as litchi, longan, and passion fruit. In 1999, farmland was the dominant land use type, accounting for 41.61% of the study area. The following was orchard, which accounted for 28.88%. However, orchard was the dominant land use type in 2014, accounting for 30.76% of the study area, followed by farmland with 29.82%. Forestland was consistently the third landscape during 1999–2014, accounting for about 20% of the study area. Between 1999 and 2014, farmland decreased significantly from 3677.51 km2 in 1999 to 2635.85 km2 in 2014. Mud flat and bare land were also decreasing with a reduction of 67.28 km2 and 59.16 km2, respectively. In contrast, other land use types were increasing in area. The largest growth was observed in construction land, which increased from 1.38% in 1999 to 6.74% in 2014. The second was forestland, which increased from 17.25% in 1999 to 21.66% in 2014.
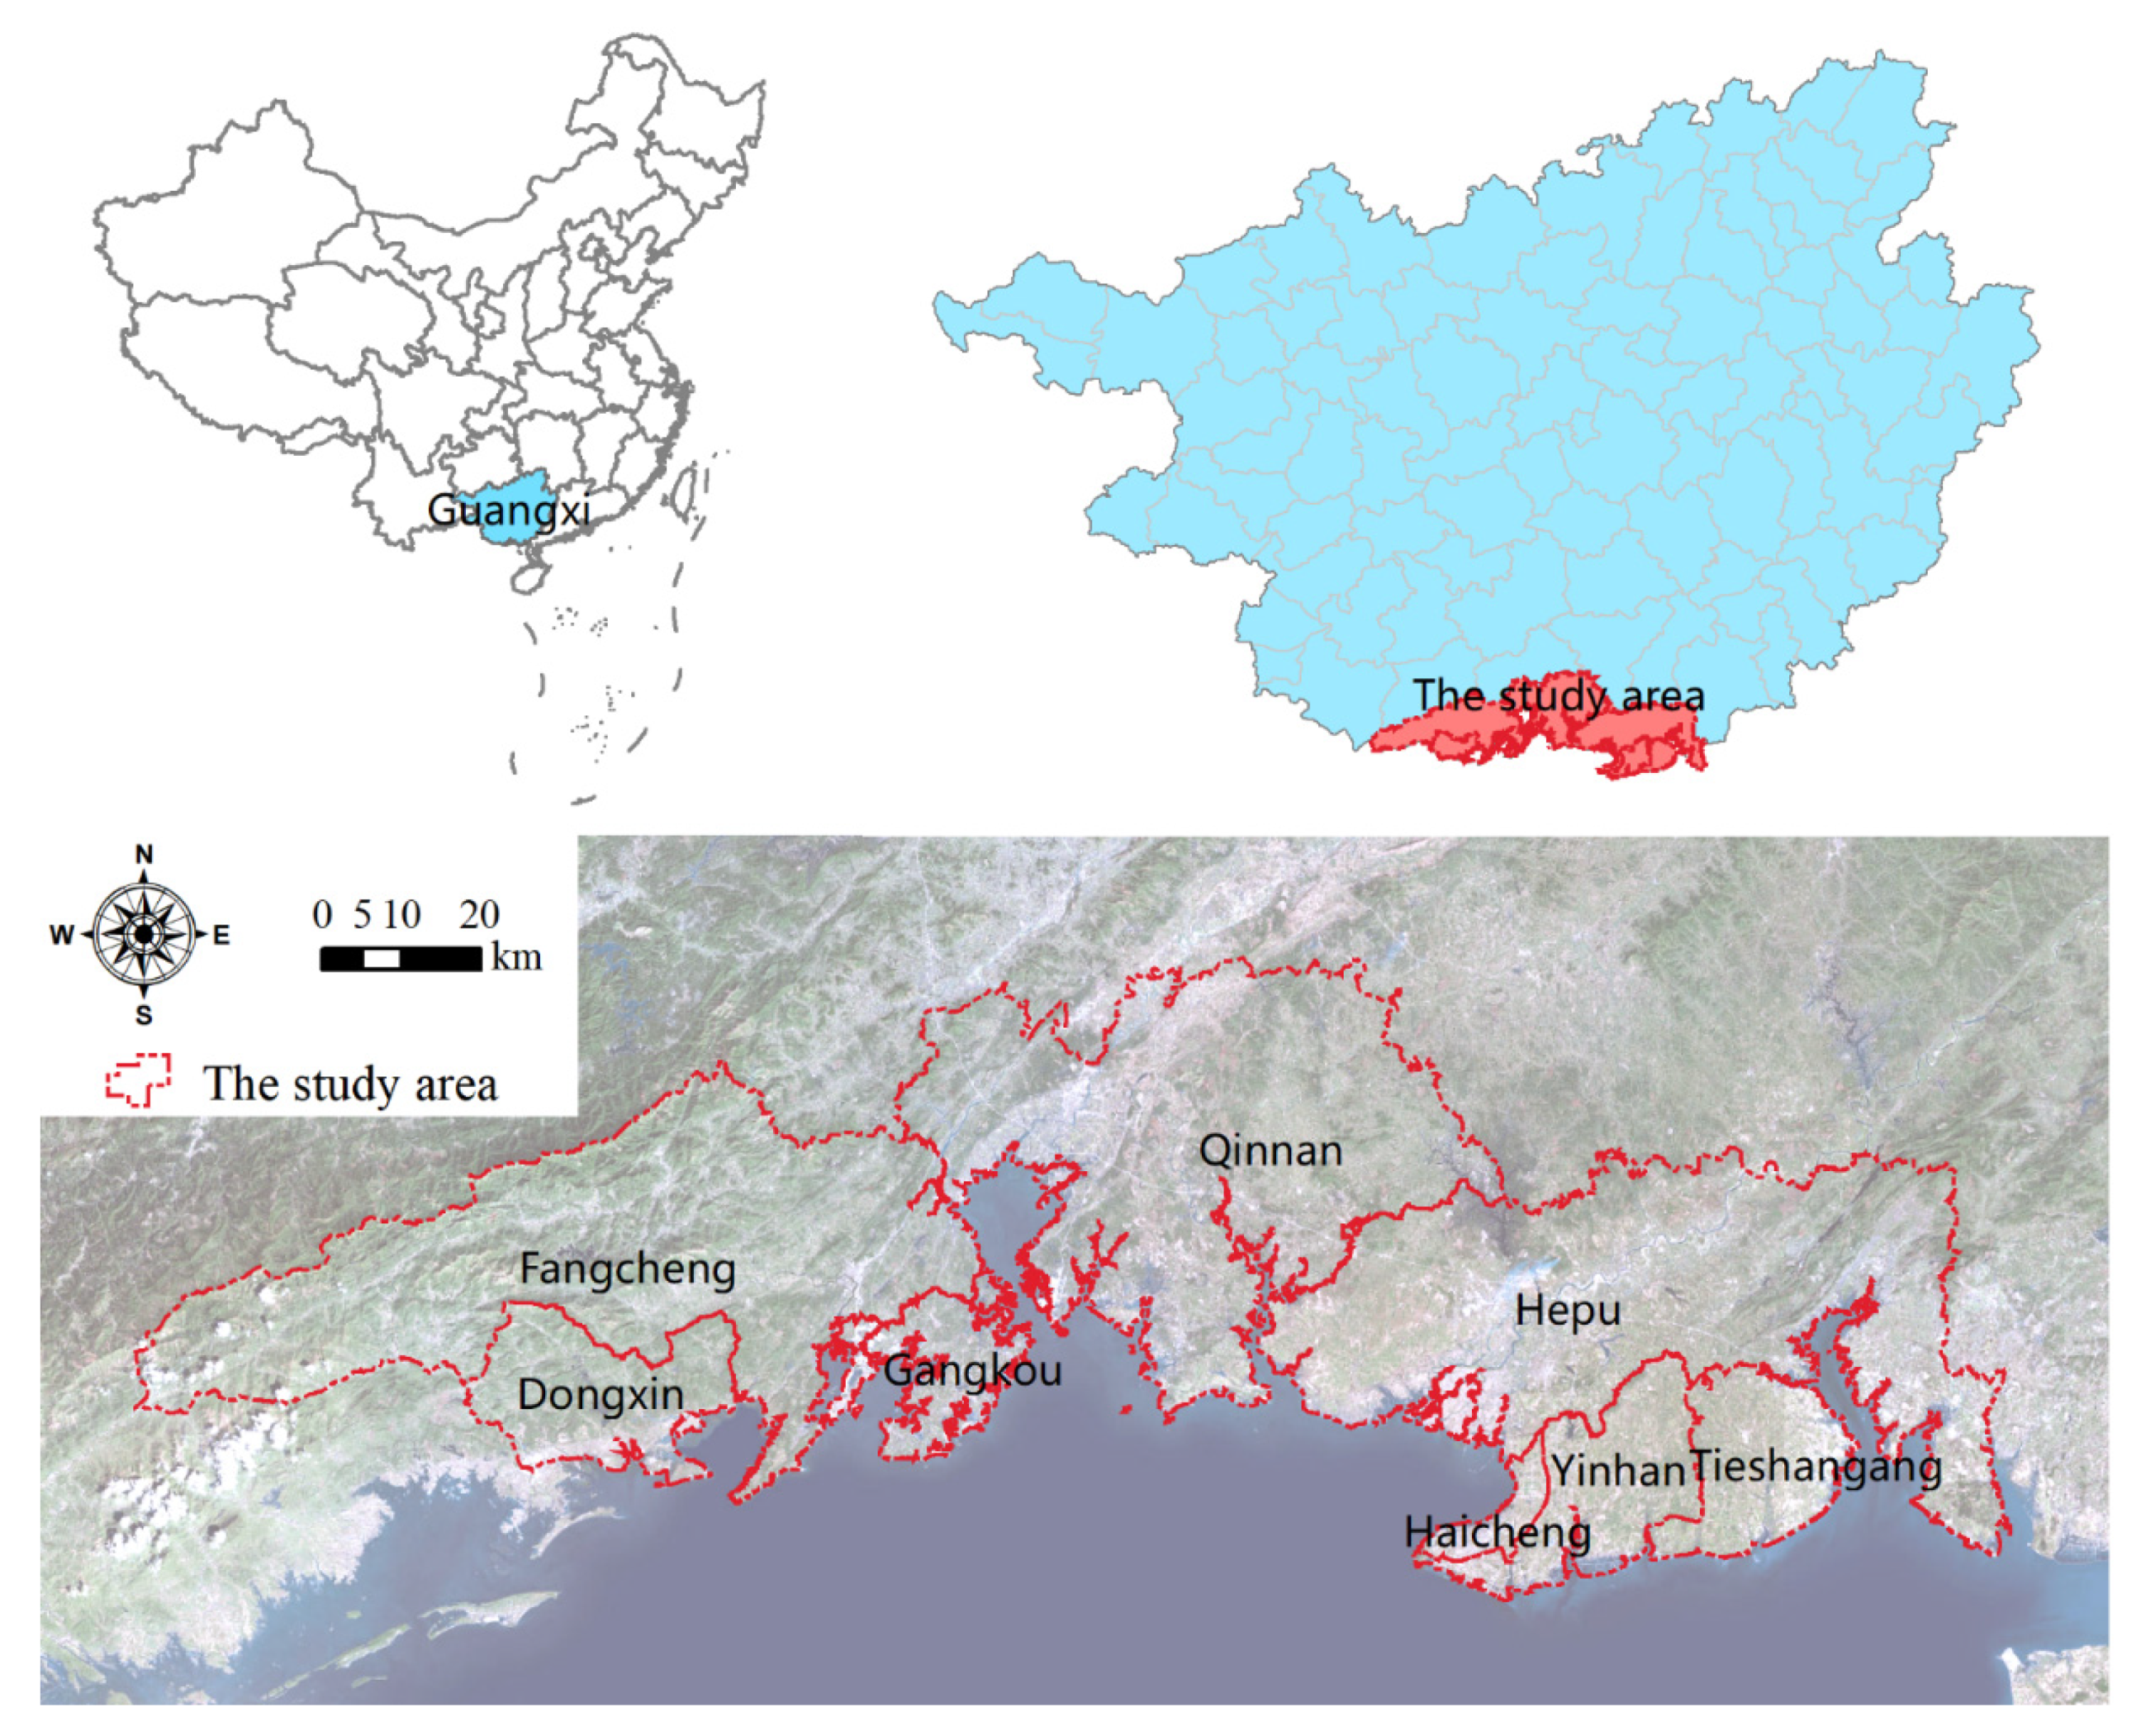
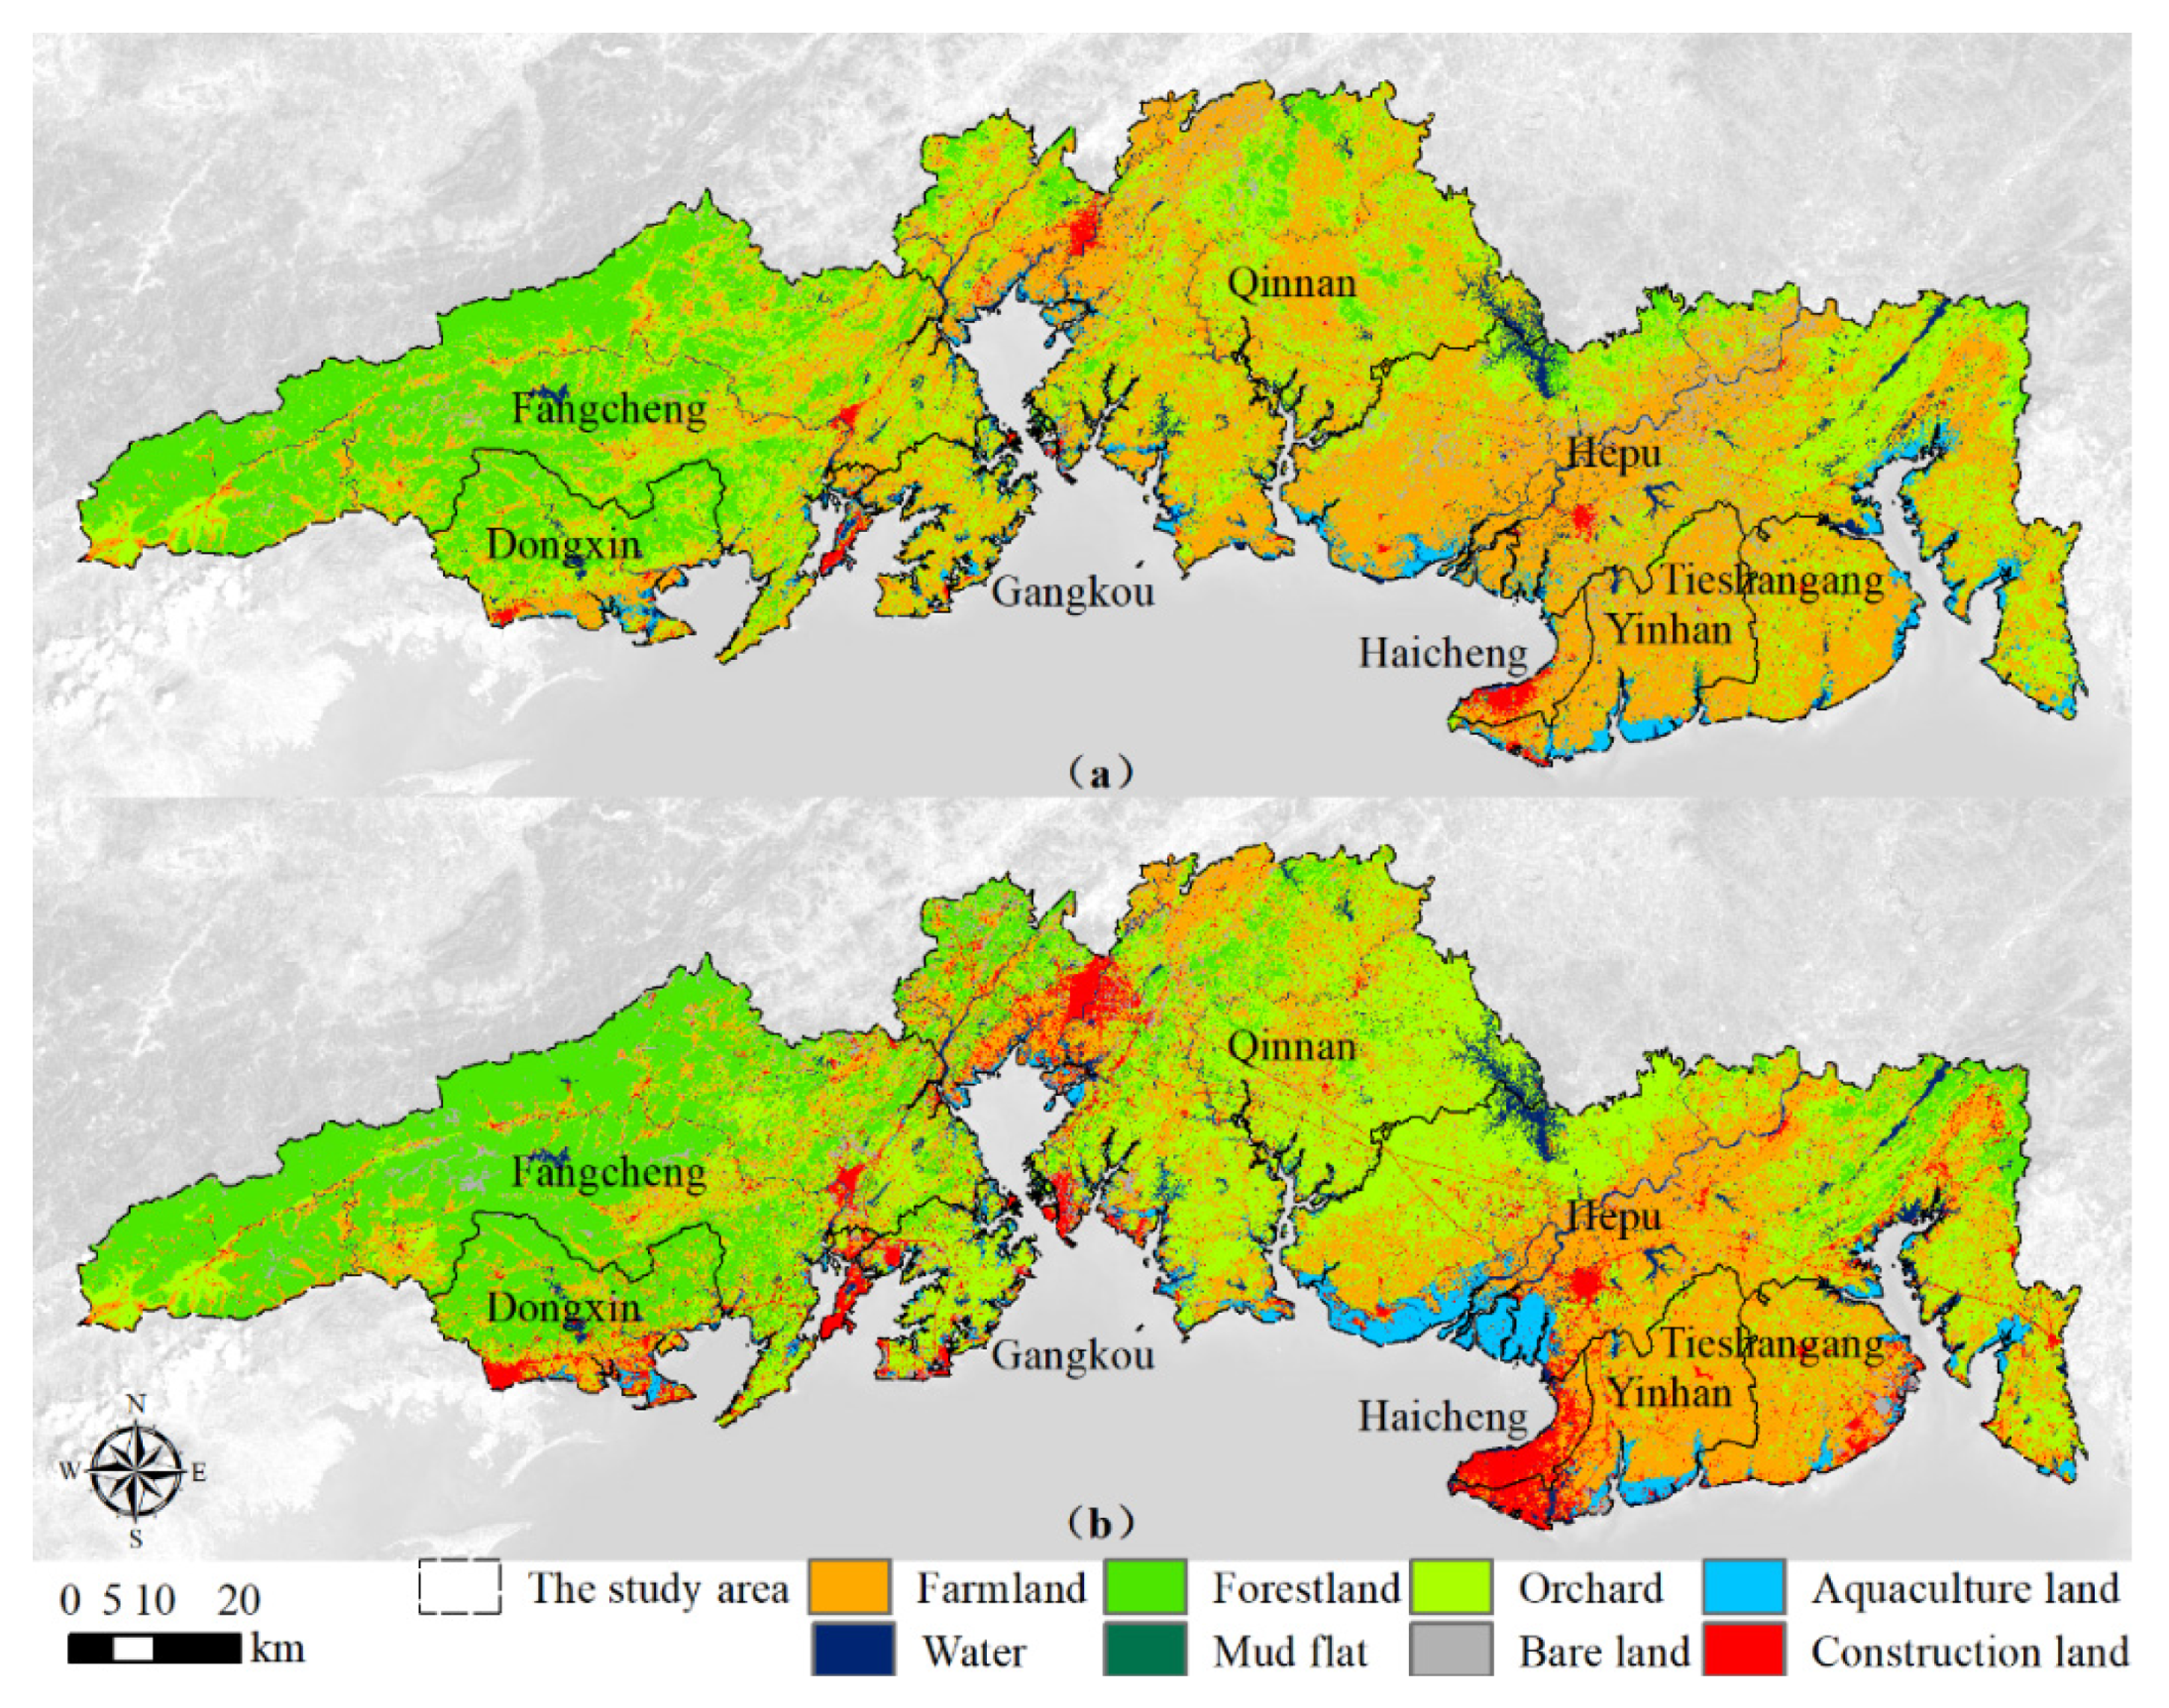
The land use change in the Beibu Gulf presented a significant spatial heterogeneity (Figure 2). In 1999, farmland was primarily distributed in the eastern of Beibu Gulf area, including Haicheng District, Yinhai District, Tieshangang District, Hepu County, and Qinnan District, and it accounted for about 90% of the total farmland area. The Fangcheng District and Dongxing District have about 90% of the total forestland area. Orchard was mostly clustered in Qinan District and the northern of Hepu County. The construction land was gathered within each district and county by region, mainly concentrated in Haicheng District, Qinnan District, and Hepu County. Moreover, water bodies were largely located in Hepu County and Qinan District, while aquaculture land was aggregated in coastal areas, such as Hepu County and Yinhai District. Although the area occupied by bare land and mud flat in the study area were small, but they were scattered in each district and county. However, the farmland in Qinnan District, Hepu County, and Gangkou District was largely reduced and converted to forestland, orchard and construction land during 1999–2014. Therefore, farmland was mainly distributed in Yinhai District, Hepu County, and Tieshangang District in 2014, while forestland was mainly located in Fangcheng District, Dongxing District, Qinnan District, and the eastern of Hepu County. Meanwhile, the orchard area had grown significantly in the Gangkou District. In addition to Haicheng District, Qinnan District, and Hepu County, construction land was also sporadically distributed in other districts. Other land use types such as mud flat and aquaculture land only had increased or decreased in area, their distribution in Beibu Gulf area remained consistent during 1999–2014.
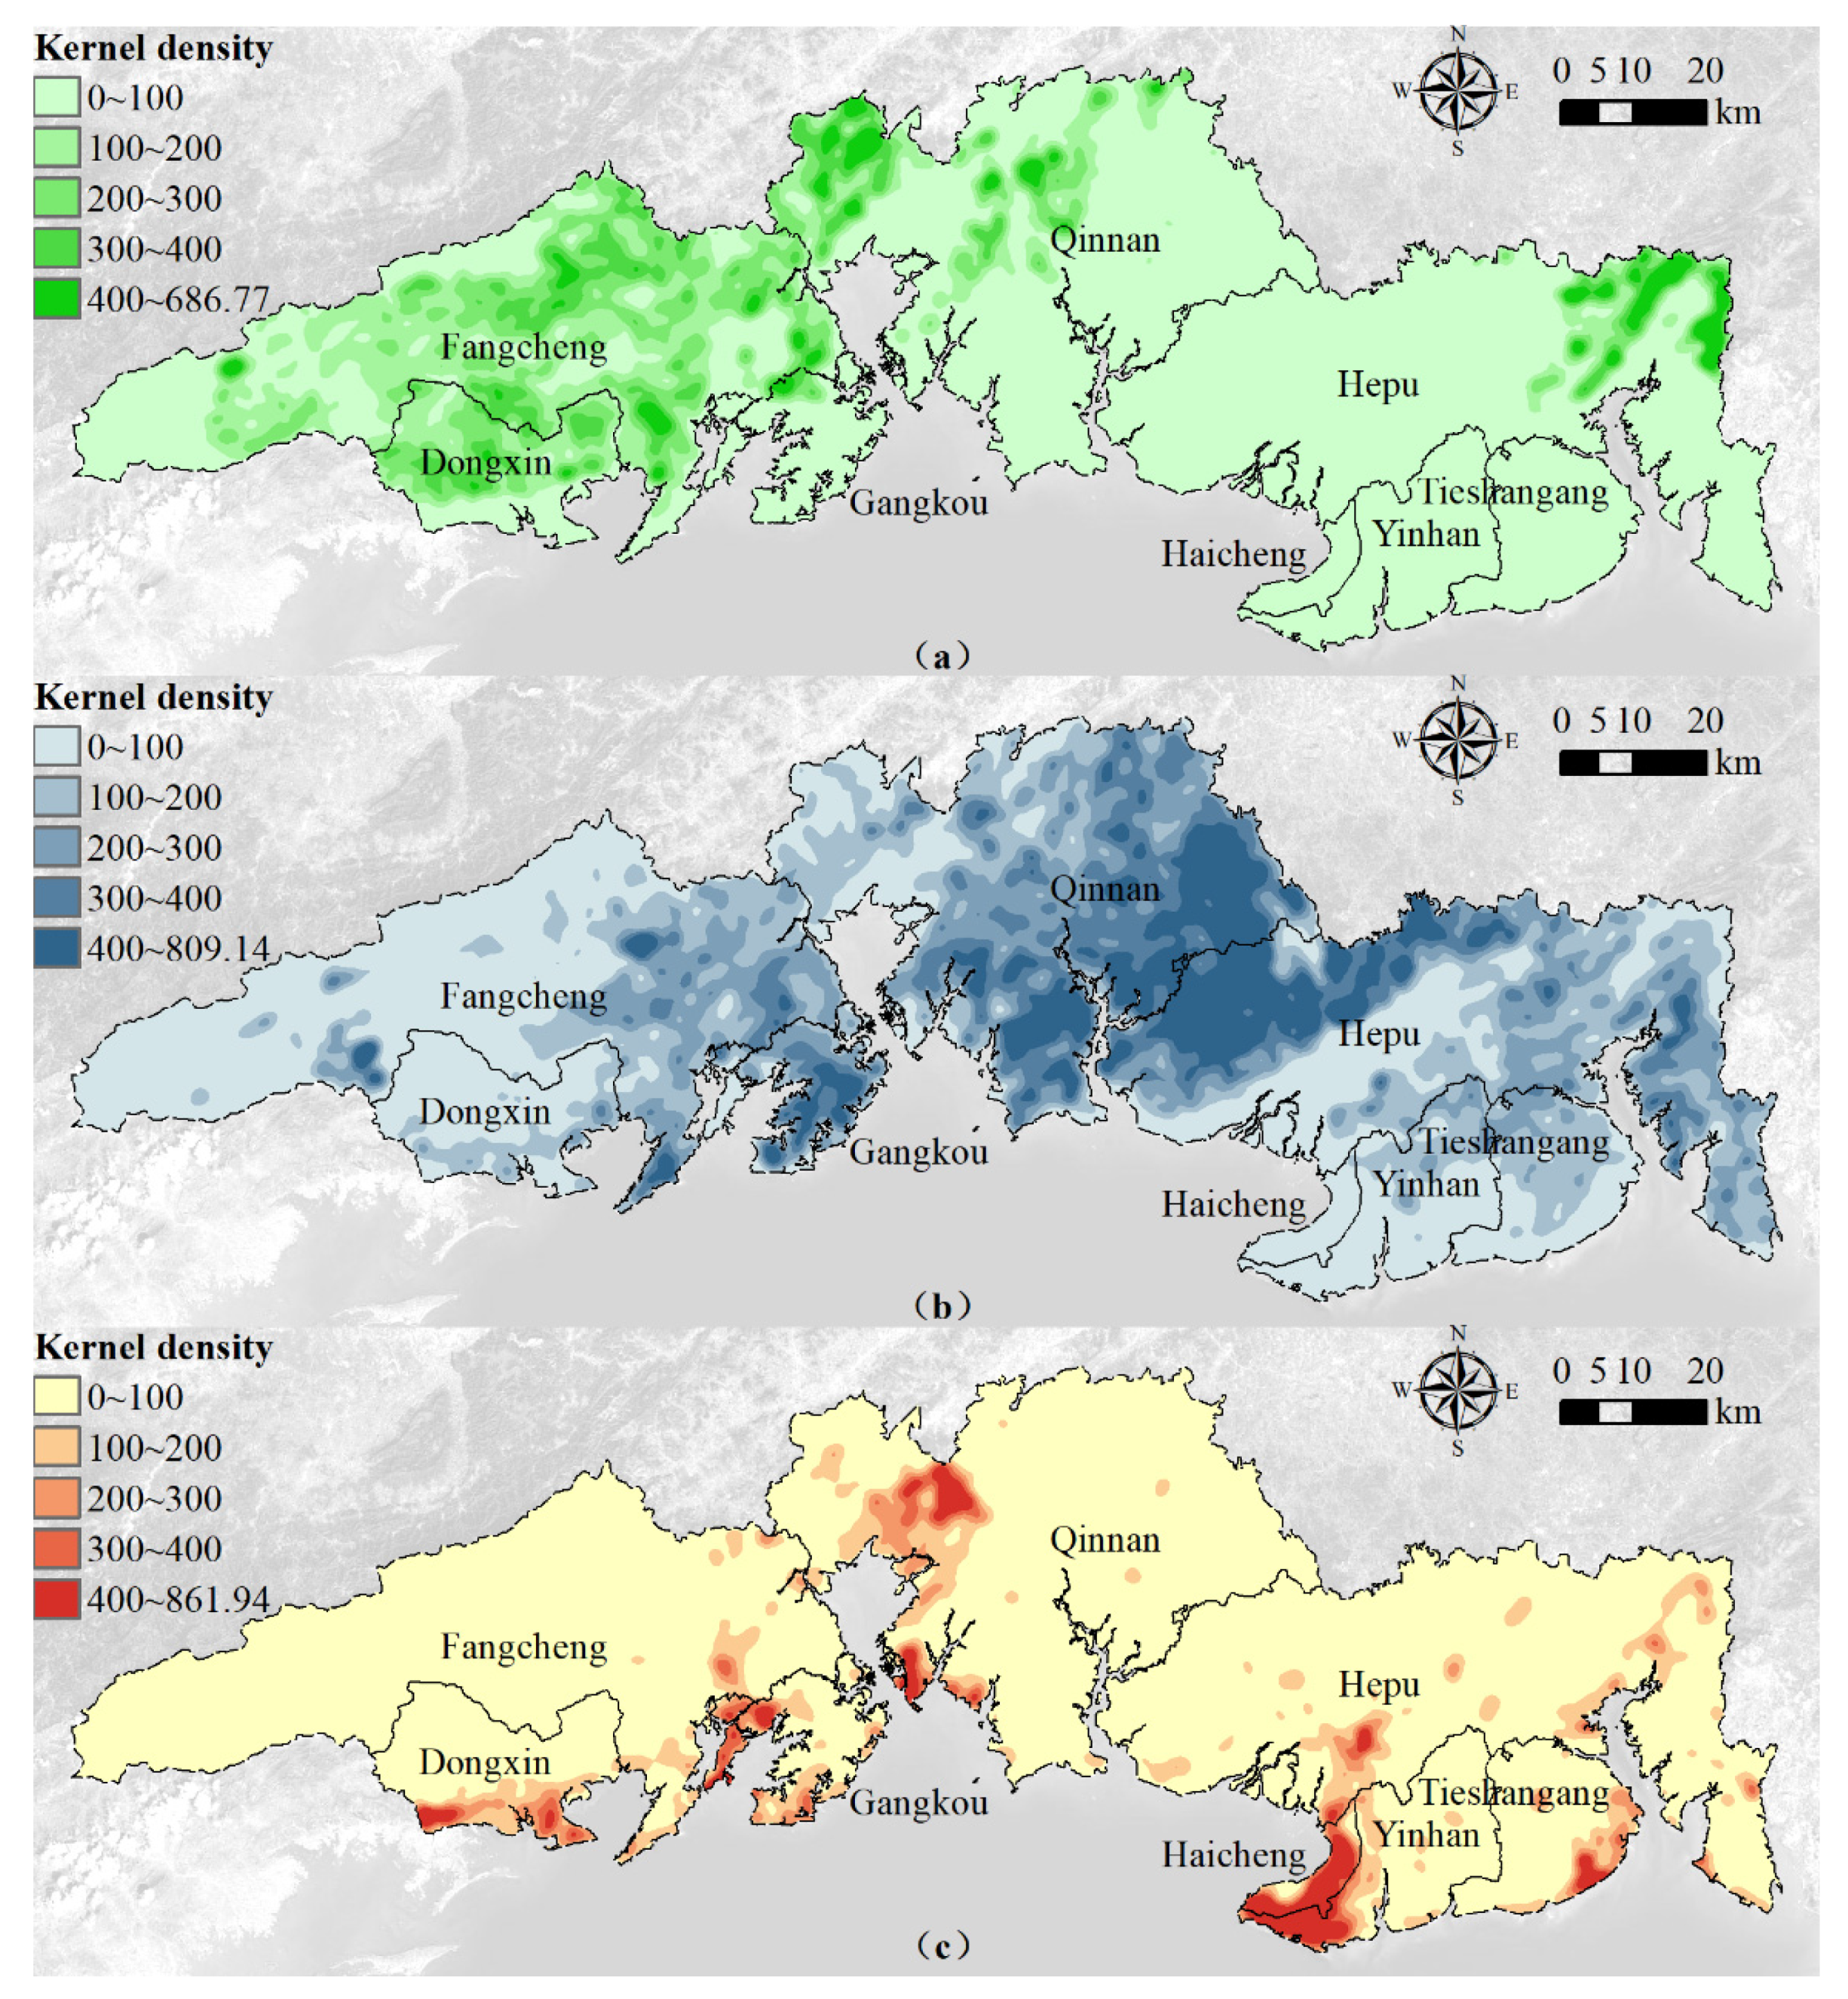
Based on the kernel density analysis from 1999 to 2014, the three increasing land use types have more obvious spatial clustering characteristics in Beibu Gulf area (Figure 3). According to the kernel density of each interval, they could be divided into high-density hotspot areas (the interval of >400), medium-density hotspot areas (the interval of 100–400), and low-density hotspot areas (the interval of 0–100). The high-density hotspot areas of increased forestland were mainly concentrated in the southwestern of Qinnan District and the northeastern of Hepu County. The medium-density hotspot areas of increased forestland were mainly distribution in Fangcheng District and Dongxing District. Increased orchard was the most highly clustered in the eastern and southern of Qinan District, the northwestern of Hepu County and the Gangkou District. The medium-density hotspot areas of it was concentrated in the eastern of Hepu County and Fangcheng District, the northern of Yinhai District and Tieshangang District, and Qinnan District. In addition, the high clusters of increased construction land were mainly concentrated in the Haicheng District, the western of Yinhai District and Qinnan District, the southeastern of Tieshangang District and the southern of Dongxing District. Meanwhile, the medium-density hotspot areas of increased construction land were mainly located in the southern of Fangcheng District and Gangkou District, as well as the southern and eastern of Hepu County.

3.2. Land Use Scenario Simulation in 2030

According to the land use area for three scenarios, farmland, forestland, and orchard were the main land use types during 2014–2030 (Table 6). In the three scenarios, farmland area was the largest in the ecotourism development scenario with 2539.31 km2 and the smallest in the regular growth scenario with 2479.59 km2. Forestland area was the largest with 2297.50 km2 in the ecological protection scenario, followed by the ecotourism development scenario with 1915.09 km2. The orchard area was the largest in the regular growth scenario with 2801.93 km2 and the smallest in the ecological protection scenario with 2687.46 km2. In addition, the areas of aquaculture land, bare land and construction land were the largest in the regular growth scenario with 312.51 km2, 282.18 km2, and 896.65 km2, respectively. The smallest area was observed in the ecological protection scenario with 212.41 km2, 53.75 km2, and 595.54 km2, respectively. In contrast, mud flat area was the largest with 202.14 km2 in the ecological protection scenario, followed by the ecotourism development scenario with 150.46 km2.
Compared to the land use area in 2014, only orchard area and construction land area increased in 2030 under the regular growth scenario. The construction land area increased the most at 301.11 km2, while the orchard area only increased by 82.64 km2. Meanwhile, forestland area and farmland area had the largest decrease with the decrement of 163.35 km2 and 156.26 km2, respectively. The bare land area remained constant from 2014 to 2030. In the ecological protection scenario, there was a significant increase in forestland area and mud flat area, with an increase of 382.88 km2 and 189.08 km2, respectively. The construction land area remained unchanged from 2014 to 2030. However, other land use areas showed a decline trend. Bare land, farmland and aquaculture land decreased the most, by 228.43 km2, 122.63 km2, and 101.68 km2, respectively. In the ecotourism development scenario, the mud flat area had the largest increment with 137.39 km2. The areas of construction land, orchard, and forestland also increased by 44.67 km2, 29.03 km2, and 0.47 km2, respectively. In contrast, other land use types were in decline from 2014 to 2030. Farmland area decreased the most with a reduction of 96.54 km2.
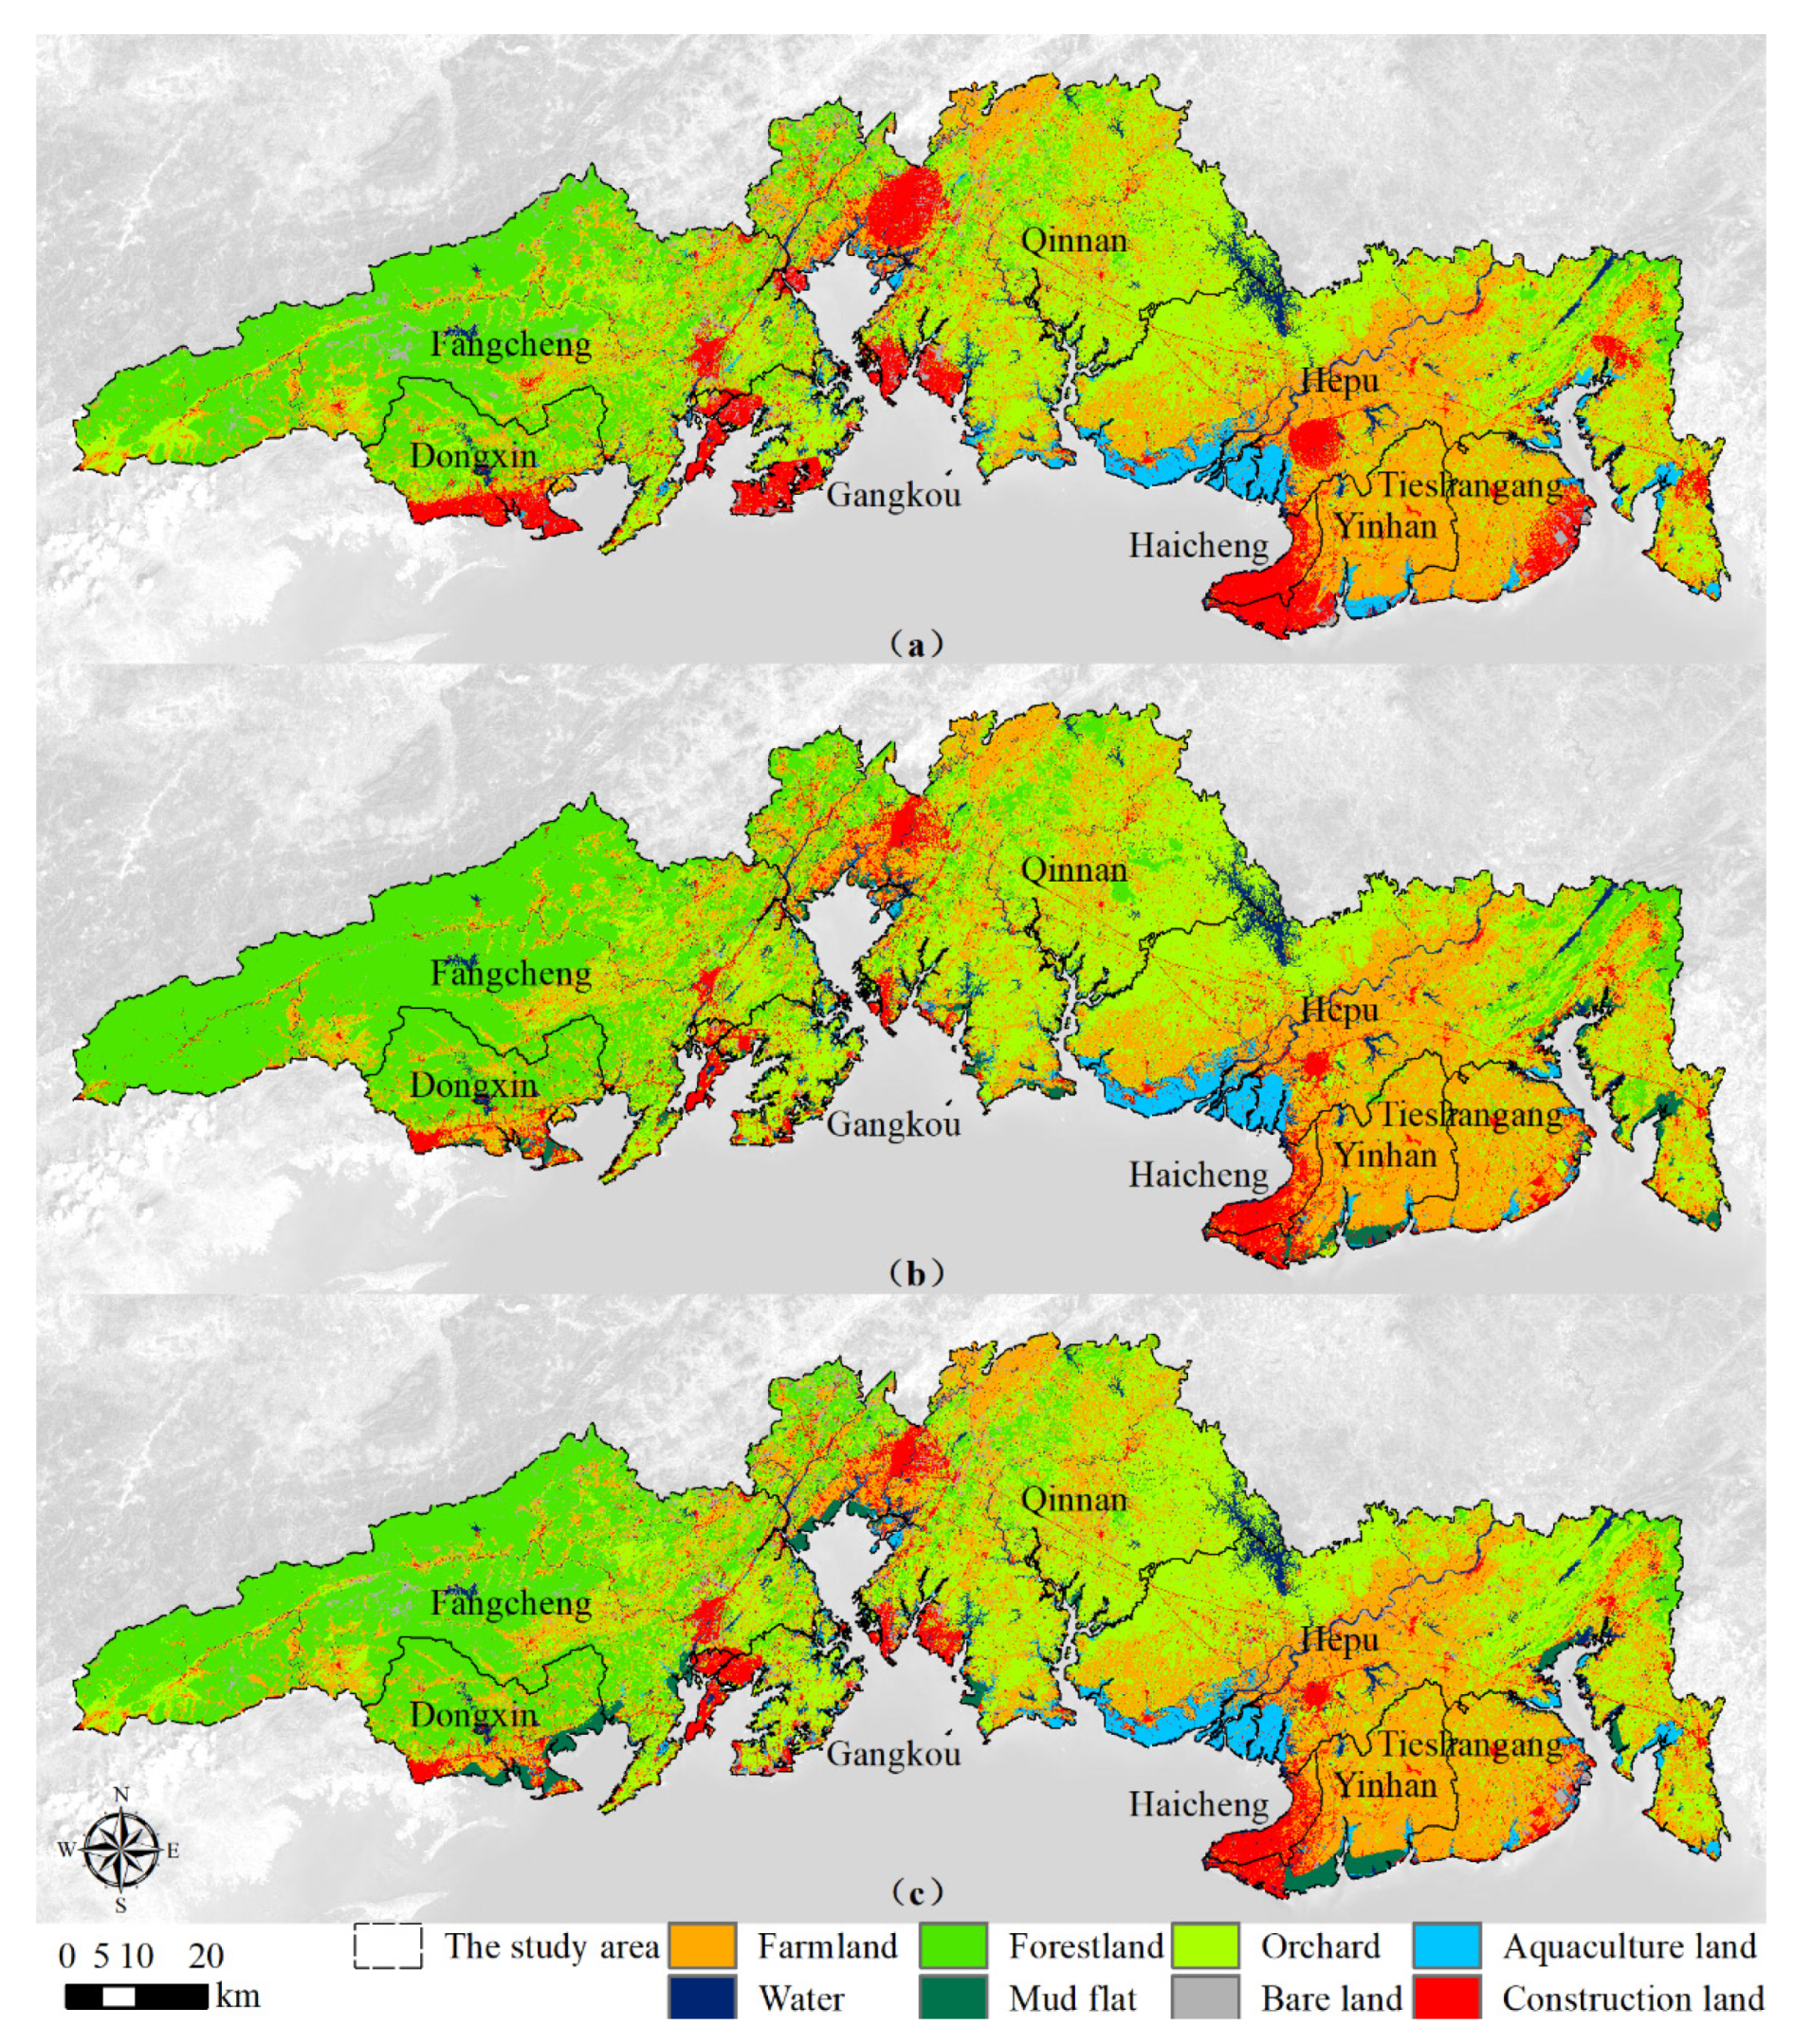
In the regular growth scenario, farmland was mainly distributed in Yinhai District, Tieshangang District and the southern of Hepu County (Figure 4a). Forestland was mainly located in the Fangcheng District, Dongxing District and the western of Qinnan District, while orchard was mainly distributed in the Qinnan District, Gangkou District and the northwestern and eastern of Hepu County. Construction land was distributed within the eight districts and counties in a zoned aggregation, and aquaculture land was mainly located in coastal areas such as Hepu Country and Yinhai District. The water bodies were mainly located in the southern of the Beibu Gulf area and had a small area. There were also two large lakes in Hepu County. The mud flat was mainly located on the seashore, while the bare land was sporadically distributed within each district and county.
Compared with the regular growth scenario, the other two scenarios only had a small number of land use types distributed in a different way, while other land use types remained basically the same. In the ecological protection scenario (Figure 4b), the construction land was mainly located in the Haicheng District, the western of Yinhai District, Gangkou District, and the Qinnan District, and the southern of Dongxin District. Other districts and counties also had a distribution of construction land, but the scale was much smaller than that of the regular growth scenario. Aquaculture land was mainly distributed in the southwest of Hepu County and the part of coastal areas in Yinhai District and Tieshangang District. The mud flat was mainly located in the southern of Yinhai District and the southeastern of Dongxing District. Besides, mud flat was also found in the coastal areas of Qinnan District and Hepu County. The distribution of other land use types was consistent with the regular growth scenario.
In the ecotourism development scenario (Figure 4c), construction land had a similar distribution to the ecological protection scenario, but its scale was larger than that of the ecological protection scenario. Mud flat was mainly located in the coastal area of each district and county, and its spatial extent was the largest among the three scenarios. The distribution of aquaculture land was consistent with the ecological protection scenario, while that of other land use types—including farmland, forestland, orchard, bare land, and water—were consistent with the regular growth scenario.
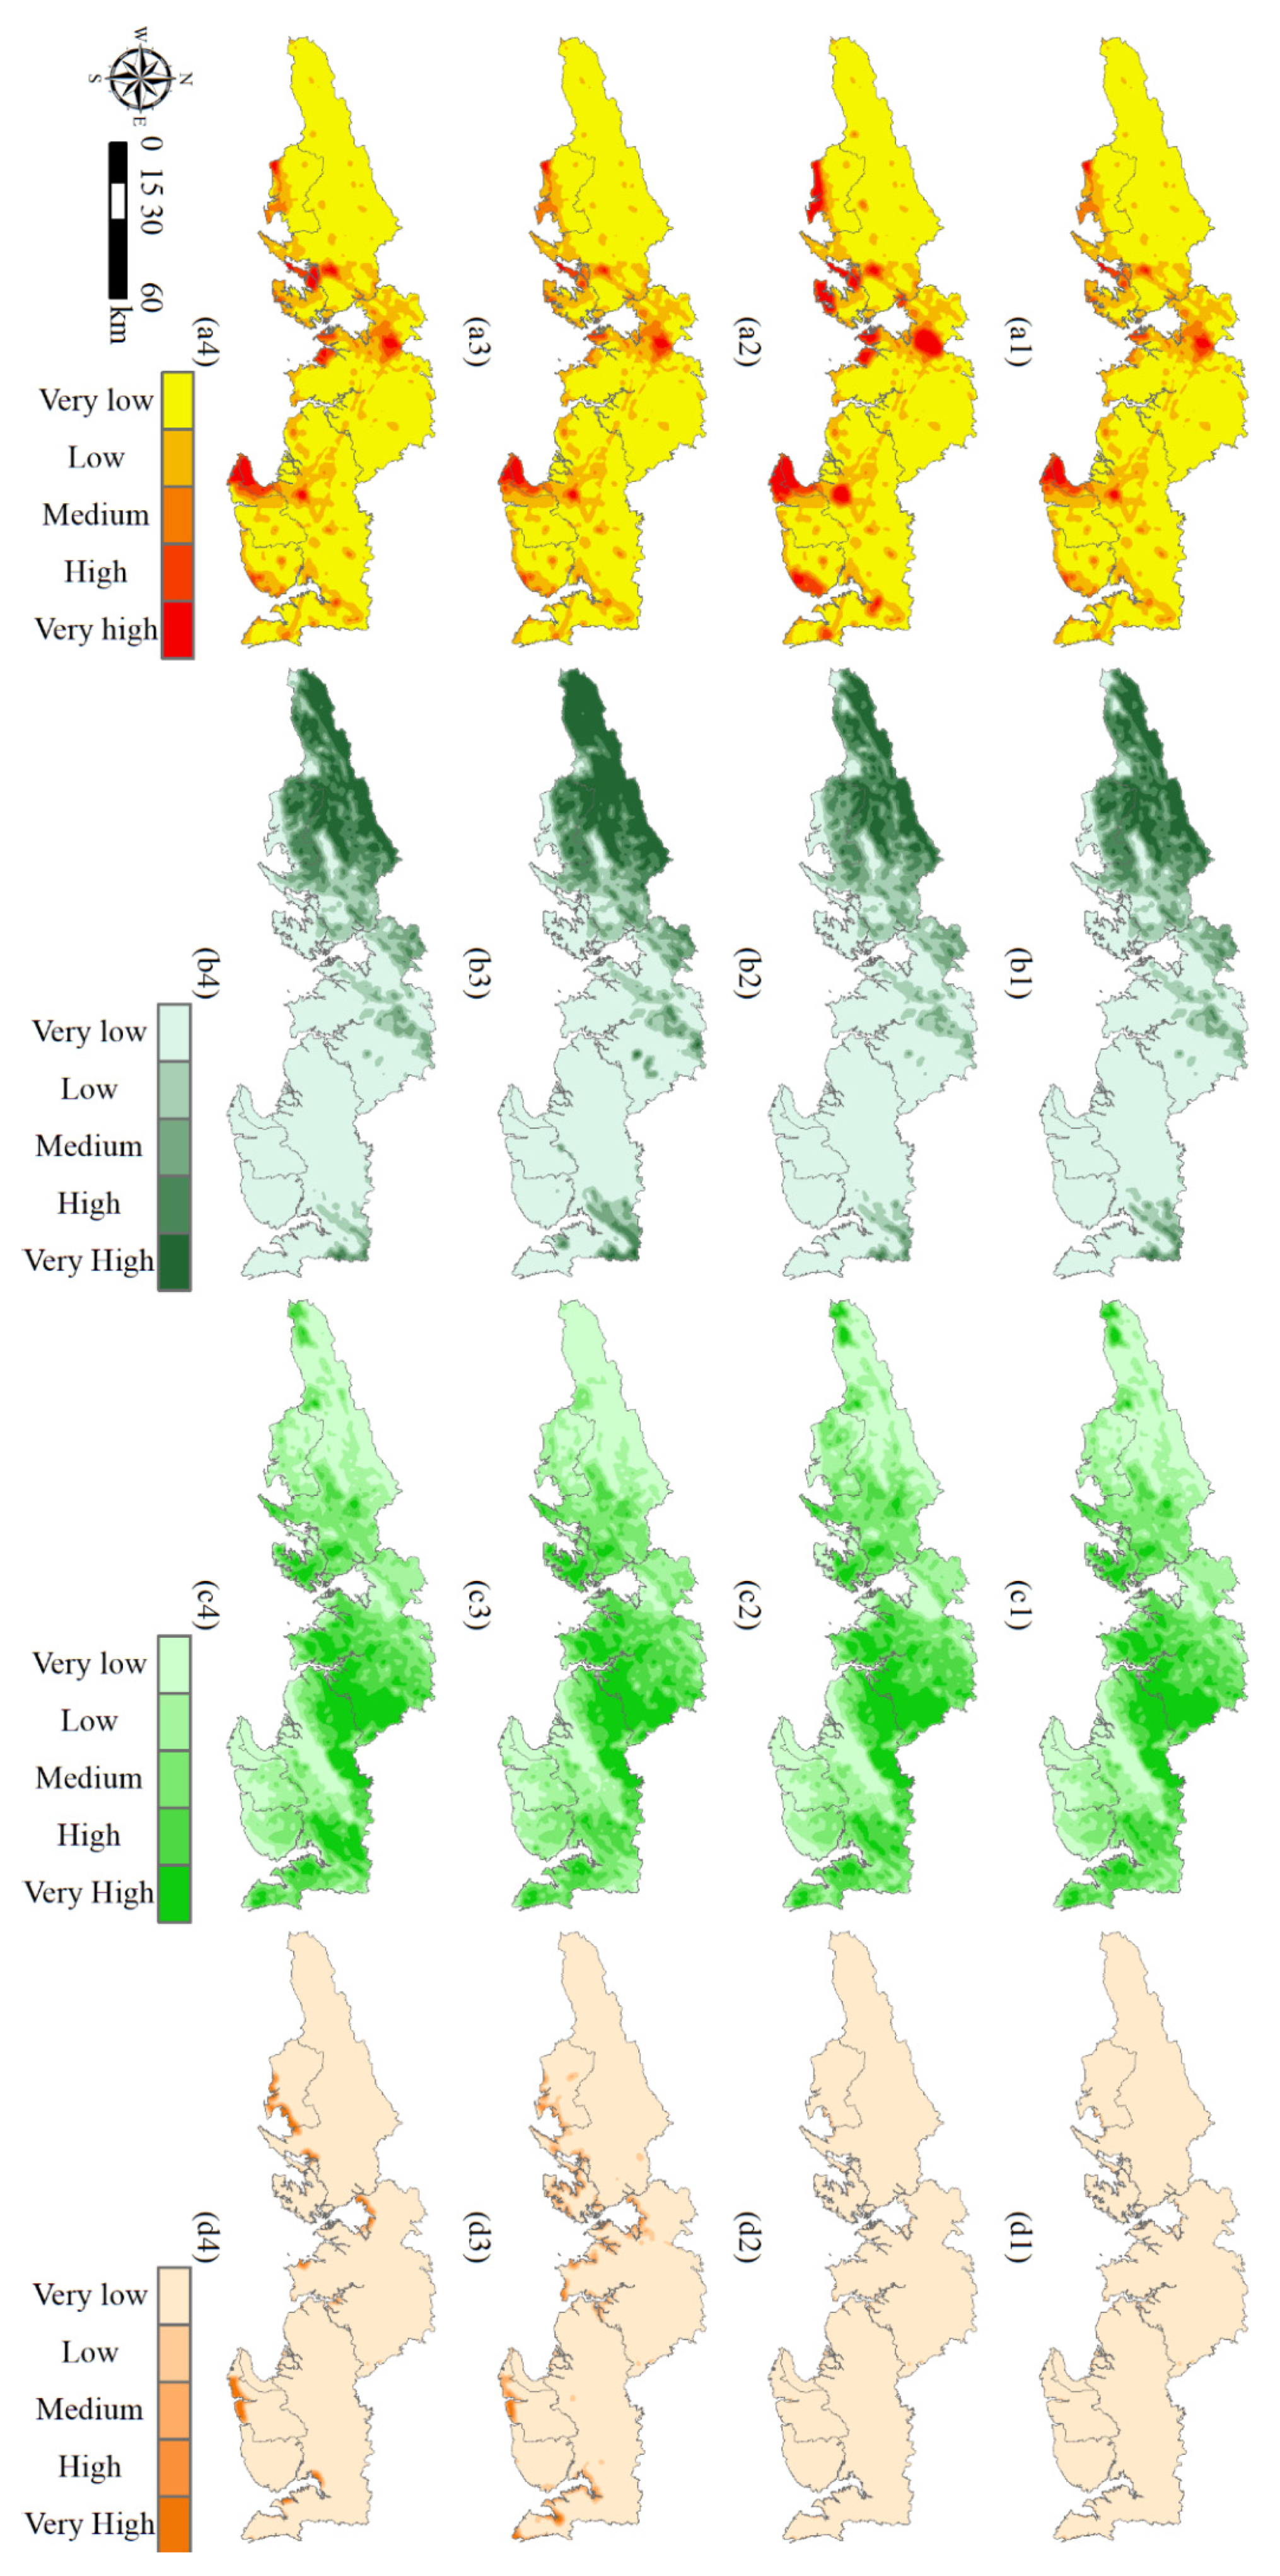
Based on the kernel density analysis (Figure 5a), construction land was mainly concentrated on the Haicheng District and the western of Yinhai District and Qinnan District. Compared to the distribution of construction land in 2014, construction land under the regular growth scenario increased significantly, aggregated within the eight districts and counties by subdivision. The distribution of construction land in the ecological protection scenario was consistent with that of 2014, which was almost unchanged. In the ecotourism development scenario, the clustering of construction land in the western of Gangkou District, the southeastern of Fangcheng District and the southwestern of Qinnan District had increased, while the clustering in other districts and counties remained the same as in 2014.
In 2014, forestland was mainly concentrated in Fangcheng District and Dongxing District (Figure 5b). In contrast, the distribution of forestland under the three scenarios was consistent with that of 2014, but some districts or counties have significant changes in the clustering of it. The clustering of forestland within Dongxing District and Hepu County in the regular growth scenario was significantly weakened, while that of forestland within each district and county in the ecological protection scenario was significantly enhanced. The clustering of forestland in the ecotourism development scenario was consistent with 2014.
Orchard was mainly concentrated in Gangkou District, Qinan District, and Hepu District in 2014 (Figure 5c). Overall, orchard was similarly distributed within the eight districts and counties in the three scenarios as in 2014, only varying in the clustering degree. In the regular growth scenario, the clustering of orchard in Dongxing District, the central of Qinnan District and the eastern of Hepu County was enhanced, while that of orchard in the southern of Gangkou District was weakened. However, the scale of orchard in this scenario was larger than that of 2014. In the ecological protection scenario, the clustering of orchard in the western of Fangcheng District was significantly weakened. In the ecotourism development scenario, the clustering of orchard in the eastern of Hepu County was significantly enhanced.
Mud flat was mainly located in the Dongxin District and Hepu Country, and its scale was extremely small in 2014 (Figure 5d). The distribution and scale of mud flat in the regular growth scenario was consistent with that of 2014. The distribution of mud flat in the ecological protection scenario was consistent with that in the ecotourism scenario, which was mainly distributed in the coastal areas in each district and county such as Yinhai District, Gangkou District, and Dongxin District. However, the clustering of mud flat in the ecotourism scenario was higher than that of mud flat in the ecological protection scenario.

3.3. Ecosystem Service Value Dynamic

According to the ecosystem service value (ESV) in 1999, regulating services had the highest ESV in the study area at $4.54 × 10⁹, followed by supporting services at $1.18 × 10⁹, and provisioning services had the lowest ESV at $1.20 × 10⁸ (Table 7). The ESV ranking among four categories for 2014 was consistent with that of 1999, but with a change in value. Overall, the ESV of four categories all increased during 1999–2014. The increase of supporting service value was $1.65 × 10⁸ and was the highest, while the increase of regulating service value was $4.33 × 10⁶ and was the lowest.
In the provisioning services, food production service had the highest ESV of $3.05 × 10⁸ in 1999, followed by raw material production service with only $1.33 × 10⁸. However, the ESV of water supply service was in deficit, with a loss of $3.18 × 10⁸ in 1999. Between 1999 and 2014, only the ESV of food production service was decreasing with a reduction of $6.11 × 10⁷, while the value of other ecosystem services had increased. The water supply service increased by $1.32 × 10⁸ during 1999–2014. In the regulating services, hydrological regulation service and climate regulation service had the highest ESV of $2.29 × 10⁹ and $1.21 × 10⁹ in 1999 respectively, while purify environment service had the lowest ESV of $4.51 × 10⁸. The ESV of hydrological regulation service decreased by $1.92 × 10⁸ from 1999 to 2014, while that of other regulating services were increasing. Climate regulation service had the largest increase in ESV with $1.45 × 10⁸, followed by purify environment service with $4.42 × 10⁷, and gas regulation service had the smallest increase with $6.57 × 10⁶. The ESV of biodiversity conservation service was the highest in the supporting services at $6.28 × 10⁸ in 1999, followed by that of soil retention service at $4.77 × 10⁸, while the ESV of nutrient cycling service was the lowest with $7.00 × 10⁷. Between 1999 and 2014, the ESV of biodiversity conservation service and soil retention service increased by $9.26 × 10⁷ and $7.62 × 10⁷, respectively, while that of nutrient cycling service decreased by $3.80 × 10⁶. Besides, the ESV of cultural services was higher in 2014 than that of 1999, and the value was $3.59 × 10⁸. Its ESV increased by $4.69 × 10⁷ during 1999–2014. In general, the total ESV of 11 ecosystem services in the Beibu Gulf area was growing from $6.15 × 10⁹ to $6.45 × 10⁹ between 1999 and 2014.
Compared to the ESV of ecosystem services in 2014, the ESVs of the provisioning services in 2030 for the ecological protection scenario and ecotourism development scenario were higher than those in 2014, while that of the provisioning services in the regular growth scenario was lower than those in 2014 (Table 8). The ESV of the former two scenarios increased by $8.24 × 10⁷ and $5.66 × 10⁷, respectively, but the latter decreased by $9.37 × 10⁶ from 2014 to 2030. In the three scenarios, ecological protection scenario had the highest ESV for provisioning services, including food production service, raw material production service, and water supply service, while regular growth scenario had the lowest ESV. In the regular growth scenario, the ESV of water supply service was increased by $9.87 × 10⁶, and that of food production service and raw material production service was decreased by $1.35 × 10⁷ and $5.75 × 10⁶. In the ecological protection scenario, only the ESV of food production service was decreased by $3.38 × 10⁵. Similarly, only the ESV of food production service in the ecotourism development scenario decreased by $2.53 × 10⁶, while that of raw material production service and water supply service increased by $1.01 × 10⁴ and $5.92 × 10⁷, respectively.
In the three scenarios, the ESV of hydrological regulation service was the highest, followed by the climate regulation service, and the ESV of purify environment service was the lowest. Overall, the ESV of regulating service was the highest in the ecological protection scenario with $5.50 × 10⁹ and the lowest in the regular growth scenario with $4.33 × 10⁹. Compared to the ESV in 2014, the ESVs of all regulating services in 2030 under the regular growth scenario was reduced. The ESV of hydrological regulation service decreased notably with a reduction of $1.24 × 10⁸, followed by climate regulation service with a reduction of $5.02 × 10⁷. In contrast, the ESVs in the ecological protection scenario were increased. The ESV of hydrological regulation service and climate regulation service increased by $7.84 × 10⁸ and $9.91 × 10⁷, respectively. In the ecotourism development scenario, only the ESV of climate regulation service decreased by $4.63 × 10⁶, while other regulation services had increased. In particular, the value of hydrological regulation service increased by $5.92 × 10⁸ during 2014–2030.
For supporting services, the ESV of biodiversity conservation service was the highest, while that of nutrient cycling service was the lowest. In general, the ecological protection scenario had the highest ESV of supporting services at $1.37 × 10⁹, followed by the ecotourism development scenario at $1.33 × 10⁹, and the lowest ESV in the regular growth scenario at $1.28 × 10⁹. In the regular growth scenario, the ESV of biodiversity conservation service was reduced by $3.88 × 10⁷ during 2014–2030. Meanwhile, the ESV of soil retention service was reduced by $2.14 × 10⁷, and that of nutrient cycling service was reduced by $3.07 × 10⁶. In the ecological protection scenario, only the ESV of biodiversity conservation service decreased by $7.95 × 10⁶, while that of soil retention service and nutrient cycling service increased by $3.37 × 10⁷ and $1.38 × 10⁶, respectively. In contrast, only the ESV of soil retention service increased by $6.38 × 10⁵ in the ecotourism scenario for the period 2014–2030.
For cultural services, the ESV of aesthetic landscape service decreased in all scenarios compared to 2014. The regular growth scenario had the largest decrease with a reduction of $2.10 × 10⁷. Among the three scenarios, the highest ESV of aesthetic landscape service presented in the ecotourism development scenario, while the lowest presented in the regular growth scenario with the value of $3.38 × 10⁸. Overall, the total ESVs of 11 ecosystem services of the Beibu Gulf area was highest in the ecological protection scenario with the value of $7.51 × 10⁹, followed by the ecotourism development scenario with the value of $7.11 × 10⁹, and lowest in the regular growth scenario with the value of $6.14 × 10⁹. In addition, the total ESV decreased by $3.16 × 10⁸ during 2014–2030 in the regular growth scenario, while the total ESVs under the ecological protection scenario and the ecotourism development scenario both increased by $1.06 × 10⁹ and $6.63 × 10⁸, respectively.
According to the ESVs of various ecosystems in the three scenarios, there were significant differences between districts and counties (Table 9). By comparing regular growth scenario and ecological protection scenario, we found that the ESV of farmland ecosystems in Fangcheng District under the regular growth scenario was higher than the ecological protection scenario, while the ESV of other districts and counties was lower than it. The ESVs of both forest ecosystems and wetland ecosystems within the eight districts and counties under this scenario were lower than the ecological protection scenario, of which the ESV of forest ecosystems had the largest gap of $2.60 × 10⁸ in Fangcheng District and the ESV of wetland ecosystems had the largest gap of $2.40 × 10⁸ in Qinnan District. However, the ESVs of desert ecosystems within each district and county were higher than the ecological protection scenario. Similarly, by comparing the regular growth scenario with the ecotourism development scenario, it can be demonstrated that only the ESV of farmland ecosystems in Fangcheng District and the ESVs of desert ecosystems within each district and county were higher than the ecotourism development scenario. The ESV of farmland ecosystems in Hepu County was consistent under the two scenarios. The ESV of forest ecosystems between these two scenarios had the largest difference of $6.00 × 10⁷ in Fangcheng District, followed by $2.50 × 10⁷ in Hepu County, while the ESV of wetland ecosystems had the largest difference of $2.31 × 10⁸ in Dongxing District, followed by $2.17 × 10⁸ in Yinhai District. By comparing ecological protection scenario and ecotourism development scenario, it could be found that the ESV of farmland ecosystems in Fangcheng District and Tieshangang District under the ecological protection scenario was lower than that of the ecotourism development scenario. The ESVs of forest ecosystems were higher than the ecotourism development scenario in all districts and counties, with the largest differences in Fangcheng District and Qinnan District of $2.00 × 10⁸ and $8.00 × 10⁷, respectively. In addition, the ESVs of wetland ecosystems in Dongxing District, Yinhai District, and Fangcheng District were lower than the ecotourism scenario, while other districts and counties were higher than the ecotourism scenario. The ESVs of desert ecosystems were higher in the ecotourism scenario, and their differences were highest in Fangcheng District and Qinnan District with $6.59 × 10⁵ and $6.51 × 10⁵, respectively.

4. Discussion

4.1. Land Use Change and Ecosystem Service Value Dynamic from 1999 to 2014

The Beibu Gulf area had experienced profound land use changes according to the land use areas in 1999 and 2014 (Table 5). The urbanization has been increasing in this region because of the Western Development Strategy, the Coastal Opening-up Policy and the Border Opening-up Policy, etc. In 2008, the Guangxi Beibu Gulf Economic Zone Development Plan was approved by the state, making the Beibu Gulf Economic Zone usher in new development opportunities, as well as further development of socio-economic construction [32]. Therefore, construction land related to industry, ports, and infrastructure was expanding, and these were mainly converted from farmland, mud flat and bare land. This explains why farmland, mud flat and bare land in the Beibu Gulf area have been decreasing while construction land has been increasing during 1999–2014. In addition, people have planted fast-growing eucalyptus and economic forests on a large scale in the study area due to the booming forestry-pulp-and-paper industry and the implementation of Returning Farmland to Forest project, which is the main reason for the increasing area of forestland. Meanwhile, with the accelerated urbanization and the expansion of reclamation, mangroves and other types of wetlands have been severely damaged, resulting in a large reduction of mud flat in the study area [33]. Orchard and aquaculture as the main economic sources in Guangxi, their areas had been increasing between 1999 and 2014.
Combining the land use maps (Figure 2) and kernel density analysis (Figure 3), the spatial distribution of some land uses in the Beibu Gulf area had changed significantly between 1999 and 2014. Due to the economic construction and urban expansion, the distribution area of farmland in the districts and counties decreased significantly, especially in Qinnan District, Gangkou District, Haicheng District, and Fangcheng District (Figure 2). In contrast, construction land had changed most dramatically, especially in the Beibu Gulf coastal areas where the size of cities continues to expand. This may be explained by the cities with the rich natural resources around the sea. Tourism industry and aquaculture are the main economic sources for them, it is also could partly explained the increasing of aquaculture area in each coastal area. The coastal area has a unique land use structure, pattern and process, which provides important ecosystem services and influences local tourism economy as well as be sensitive to coastal erosion [33,34]. However, irrational land use patterns have exacerbated the ecological and environmental pollution. For example, the coastal areas are rapidly decreasing due to natural phenomena such as global sea level rise, coastal erosion, as well as anthropogenic development such as tourism infrastructure [34]. Similar results were found in a study by Mendoza-González et al. [35] in the Gulf of Mexico, who showed that the growth of tourism activities in coastal areas could lead to further degradation and loss of natural ecosystems. These developments have exacerbated ecological and environmental problems such as sedimentation and a significant reduction in mangrove area. As one of the richest and most productive marine ecosystems in the world, mangroves have important economic significance and great ecological value [36]. Therefore, it is necessary to take measures such as ecological restoration to achieve the coordinated development of regional economy, society, and ecology.
ESV is the value of the goods and services that ecosystems provide for human well-being [37]. There are two approaches to evaluating ESV using monetary valuation methods. One method is based on raw data and is usually applied to small spatial scales or single ecosystems. The other is a unit value-based approach, which is typically used in regional and global studies to assess the spatial and temporal distribution of ESVs. In this paper, the latter method was used to assess ESV in the Beibu Gulf area. The results indicated that the ESVs of all ecosystem services increased significantly during 1999–2014, except for food production service, hydrological regulation service, and nutrient cycling service (Table 7). In terms of the provisioning services, the ESVs of food production service and raw material production service were positive, while the ESV of water supply service was negative. The main reason for this is the need for water consumption in agricultural production, and with the evolution of farmland ecosystems to forest ecosystems during the study period, the ESV of food production services decreased while the ESVs of raw material production service and water supply service increased [11]. Due to the extensive development and construction of port in Beibu Gulf area, the mud flat area has been greatly reduced [28]. This was the main reason for the continuous decline in the ESV of hydrological regulation service in the Beibu Gulf area. However, with the increasing of forestland area and orchard in the Beibu Gulf area, the ESVs of all other regulating services increased. In terms of the supporting services, only the ESV of nutrient cycling service continued to decrease during the study period, which might because the soil nutrient imbalance caused by ship exhaust emissions, sewage, oil spills, anti-fouling coatings, and garbage discharges during port operations [38]. In addition, forest ecosystems also can provide services such as biodiversity conservation, nature conservation, soil and water conservation, so the increase in their areas are the main reason for the increase in the ESVs of other supporting services [39,40]. Tolessa et al. [41] similarly found that forests provide higher levels of ecosystem services than other land use types, which was consistent with our observations. The ESV of cultural service had increased as the evolution of ecosystems in the Beibu Gulf area, which might be explained by the rich tourism resources in the Beibu Gulf area. These tourism resources should be developed to boost the economy, and the tourism infrastructure should be improved. However, tourism development is increasingly vulnerable to natural hazards in coastal areas, which will lead to a decline in coastal ecosystem services [34]. Therefore, it is essential to give priority to protection and saving of resources in the process of tourism development to achieve the sustainable development.

4.2. Comparison of Three Scenarios of the Beibu Gulf Area in 2030

An objective and reasonable simulation of the future land use change can not only grasp the development pattern, but also test the rationality of the land use changes which are oriented by socio-economic and policy [18]. Therefore, we used the Scenario Generator Rule Based Module of InVEST to simulate the changes of three land use scenarios during 2014–2030. There were significant differences in land use changes between the three scenarios (Table 6). In the regular growth scenario, the area of orchard, construction land, and aquaculture land were largest and showed a significant growth trend during 2014–2030, which was directly related to the rapid development of urbanization and economy in the Beibu Gulf area [39]. Because regional economic development and urbanization have led to the continuous expansion of construction land and the cultivation of orchard [1]. Moreover, the development of urbanization and aquaculture has accelerated the encroachment on non-urban areas, which is the main reason for the greatest decrease in farmland and forestland [1,18]. This development approach can easily cause adverse effects on the ecological environment. In contrast, the ecological protection scenario had the largest proportion of forestland area and mud flat area with a significant increasing trend, which was caused by a series of ecological protection measures in this scenario for protecting ecological land [18]. Therefore, the expansion rate of construction land under this scenario is effectively curbed. However, although the ecological protection scenario could effectively control the encroachment on ecological land, it could not effectively control the reduction of farmland area to support the sustainable development of urbanization [42]. This problem could be solved in the ecotourism development scenario. Based on the purpose of weighing the regional economic sustainability and ecological protection, the continuation of urbanization and the rational use of natural resources and tourism resources can lead to an increase in the area of construction land and orchard [43]. Meanwhile, the protection and restoration of coastal vegetation can help build an ecological city with good ecological environment and sustainable economic development [17].
According to the land use map (Figure 4) and kernel density analysis (Figure 5), the spatial distribution of land use types in the three land use scenarios had distinct differences. This might be due to the spatial pattern of urban expansion differs among the three scenarios, and the advancement of policies significantly changes future land use patterns and development trajectories [18]. In the regular growth scenario, the construction of coastal cities was expanding and spatially dispersed, which might be due to the demand for infrastructure development as a result of socioeconomic development and population growth [22]. In contrast, the expansion of construction land in the other two land use scenarios was relatively slow due to the purpose of ecological and environmental protection. However, because the ecotourism development scenario also focused on the socio-economic development, the scale of construction land under this scenario was higher than that of the ecological protection scenario. In the ecological protection scenario, the economic construction of the coastal city had been gradually moderated. Not only the natural forestland in Fangcheng District and Dongxing District had been protected, but also a large amount of farmland and orchard in Qinan District and Hepu County had been converted into forestland. Meanwhile, the mud flat area in the southern coastal area of Beibu Gulf also showed a significant increase, which indicated that the scenario had a significant effect on the protection of forestland and mud flat. However, the mud flat area in the ecotourism development scenario was the largest and was mainly gathered in the coastal areas. The main reason for this was that mangroves not only provide important natural resources for tourism, but also provided important ecosystem services for the marine environment and industries including fisheries, timber, and plant products, which was one of the priority land use types for conservation in this scenario [29].
Compared to 2014, the total ESVs under the ecological protection scenario and ecotourism development scenario in 2030 showed an increasing trend, while the total ESVs under the regular growth scenario showed a decreasing trend (Table 8). Landscape dynamics were the main cause of ESV changes [3]. In the regular growth scenario, the urban ecosystem increased rapidly as a result of pursuing economic benefits, and the ecological land had been lost extensively, thus leading to the loss of ESV in the Beibu Gulf area. The continuous loss of coastal wetland ecosystems has led to severe ecosystem degradation [38]. This also explained why its ESVs of the four ecosystem services was the smallest among these three scenarios. It was supported by the results of Mendoza-González et al. [35], who showed that the loss of natural ecosystems caused significant losses to ESVs. In the ecological protection scenario, the ecological and environment conservation tried to limit development activities and restore the destroyed forest ecosystems and wetland ecosystems, leading to a significant increase in ESV [3]. Therefore, the ESVs of provisioning, regulating, and supporting services were higher than those of the other two land use scenarios. However, the ecotourism development scenario tried to balance tourism development and ecological protection, and the ESV of cultural services was higher than the other two land use scenarios. In contrast, the ecotourism development scenario could provide a reference for future land resource management in the region [22]. In addition, the highest ESV in the regular growth scenario was mainly distributed in the forest ecosystems represented by Fangcheng District and Dongxing District, while the highest ESV in the ecological protection scenario and ecotourism development scenario was mainly distributed in the wetland ecosystems represented by Hepu County, Yinhai District, and Gangkou District (Table 9). This was mainly because wetland ecosystems have a high value of ecosystem services, but the proportion of area occupied by it in natural growth scenarios was extremely small. In summary, the ecotourism development scenario was a more reasonable land use development pattern for coastal cities in Guangxi. In the future, the rational development as well as comprehensive management of the coastal areas should be strengthened by combining the green development concept of synergistic socio-economic development and ecological environmental protection in Guangxi Beibu Gulf area [17].

4.3. Land Use Suggestions and Ecotourism Implications

Land use policy is a fundamental policy regulating the socio-economic development of China, which affects economic growth, social equity, regional development, and ecological environmental protection [44]. As a key pivot point for the Western Development Strategy and China-ASEAN Free Trade Agreement, the Guangxi Beibu Gulf Economic Zone is simultaneously influenced by various policies. On the one hand, it is necessary to implement the Central Government’s policies, including reforestation policy and the Coastal Opening-up Policy. On the other hand, the Beibu Gulf Tourism Development Plan states that the region will be made into a world-class coastal tourism destination, which further accelerates urban expansion and farmland occupation. To address the land use problems brought about by urbanization, the Chinese central government has introduced a series of policies to control the growth of construction land, including the increasing versus decreasing balance of urban–rural built land, the economic and intensive land use and the basic farmland protection regulation [45]. However, these policies have had a positive impact on local land use patterns, but their strict implementation does not necessarily guarantee better land use patterns [45]. Our results demonstrated that the regular growth scenario oriented by economic construction was prone to adverse ecological impacts. The ecological protection scenario had a positive effect on ecological land conservation and improves ecological vulnerability, but it constrained economic development. In contrast, the ecotourism development scenario was the most appropriate development pattern, which achieved a trade-off between tourism development and resource conservation. Therefore, promoting ecotourism development and achieving coordinated ecological and economic development will be the focus of future research in the Beibu Gulf coastal area [11]. In addition, because of the different land use characteristics within each district and county in the Beibu Gulf, it is necessary to propose targeted policies for economic development and ecological protection based on it.
In summary, we recommend promoting ecological protection policies and strictly controlling the urban expansion in Fangchenggang, a city dominated by forest ecosystems. Meanwhile, it can also make use of its resource characteristics to create an international coastal tourist resort and establish a national forest park, thus promoting economic development. We also suggested the grade classification of ecological land in Beihai, where was dominated by urban ecosystems and farmland ecosystems. It is essential to expand urban construction under restricted conditions to ensure a good living environment while ensuring urban development and economic growth [42]. In addition, the city can focus on the development of transnational tourism and coastal leisure tourism due to the comprehensive advantages of marine tourism resources. However, the booming development of the marine economy can also cause damage to coastal ecology, so effective coastal ecological protection policies remain necessary to restore and protect the coastal ecological environment [46]. According to the “Beibu Gulf Tourism Development Plan”, Qinzhou City can develop in the direction of eco-tourism on sea and land, making full use of the sensational effect of white dolphins to drive the development of it. The core of sustainable tourism development is based on economic benefits, social benefits, and ecological benefits, so as to satisfy people’s tourism needs as well as to protect tourism resources and the environment simultaneously. Therefore, it is also an important element of the future land management system to control the intensity of land development, strengthen ecological civilization, and implement land spatial planning while developing the tourism economy [47]. Overall, regional planners need to plan intelligently for ecosystem services to improve policies and regulation [48]. This should not only consider maximizing the ESV, but also strive to maintain a reasonable structure of ecosystem services to develop a sustainable ecosystem [49].

4.4. Landscape Planning for Local Development Models

To better weigh the balance between regional economic development and ecological protection, it is necessary not only to propose an overall landscape plan at the macro level, but also to target landscape transformation according to local characteristics. As ecotourism of the Beibu Gulf area is in its infancy and development stage, we suggest to make full use of waterscape resources such as mangroves to enhance ecotourism, contributing to the protection and sustainable use of coastal ecosystems [50]. Synergistic development of tourism and ecological protection is reflected in two aspects. On the one hand, ecological advantages should be used to boost economic development and actively promote tourism by creating ecotourism scenic spots. Meanwhile, tourism could not only improve the benefits and economic development of surrounding hotels, restaurants and other industries, but also help to build a complete mangrove industry chain from traditional coastal industries to modern high value-added extension, improving the efficiency of commercialization of ecological service values and the economic returns of farmers [45]. On the other hand, ecosystem service could be promoted by industrial optimization and land use structure adjusting. Therefore, we proposed three landscape planning for local development models (Figure 6) to promote local economic development and enhance ecological service functions.
The featured forest and fruit economic model (Figure 6a) is suitable for villages where have more plantation land in hilly areas with good planting foundations, stable labor resources, and good transportation conditions. It is necessary to strengthen the quality of special forest fruits and other products. This model could create geographical indication products with regional characteristics to enhance product awareness and product benefits. Meanwhile, the natural landscapes, forest resources and ethnic minority customs should be fully utilized. Various special tourism forms such as ecotourism, leisure, and vacation, and festival tourism should be developed as a priority. Besides, it is essential to encourage farmers to develop business activities such as ecological farms to improve residents’ participation in tourism and increase their economic income.
Second model promotes special agricultural products (Figure 6b), and is applicable to rural communities in the low hills. These villages are relatively flat and adjacent to urban areas or townships, where have good location and transportation conditions. They also have more farmland, which is conducive to growing agricultural products on a large scale. This model should vigorously develop the deep processing of agricultural products, and cultivate and strengthen leading processing enterprises and cooperative organizations to extend the processing industry chain and enhance the added value of agricultural products. Besides, it could enhance the design and quality level of modern agricultural cultural tourism products, and strengthen many tourism categories such as eco-agricultural tourism and experience-based tourism.
The featured under-forest economy model (Figure 6c) could be applied to forest protection areas where the economic development is lagging and the per capita income of farmers is low due to slow or non-optimal industrial transformation. This model should not only make full use of the advantages of forestry resources, but also develop special forest and fruit economy, under-forest economy. It also should actively develop the forest products processing and other industries. Moreover, this model should rely on forestry ecological resources to actively develop forest ecotourism and create a recreation and leisure ecological industry.

4.5. Limitations and Uncertainties

Our study could provide reliable predictive data for studies on regional land resource management and ecological sustainability by simulating future land use changes [22]. However, due to the inherent limitations of land use change model and the lack of complete datasets of the Beibu Gulf area, uncertainties still exist. First, as a common issue, using the InVEST model to set up different scenarios is predicated on certain assumptions, so the forecast results are subject to many uncertainties and cannot be completely close to the actual situation in 2030. Therefore, in the future, we need to further deepen the research on the driving mechanism of land change, thus to better facilitate the simulation of land use change models. Second, ecosystem services research is a relatively new field, and its quantification and assessment remain highly uncertain [51]. Despite rapid research progress, this uncertainty continues to limit our ability to generate rigorous value estimates to inform policy and land use decisions. Therefore, this study mainly adopted the remote sensing images of 1999 and 2014, and combined them with the current Land Use Plan of the Beibu Gulf area to conduct a qualitative analysis. The simulation results after the introduction of planning factors are more in line with the real urban development trajectory, which is conducive to achieving sustainable development and provides some useful information for urban planning [18]. Finally, the ESV is mainly calculated based on the area of different land use types. Therefore, its quality depends in part on the accuracy of the land use classification, and higher resolution land use data provide more accurate results [3]. However, accurate supervised classification of remotely sensed images requires appropriate ground reference data, which are usually derived from field training sites [52]. It leads to many uncertainties in the process of supervised classification, as there are no clear boundaries between land cover classes [53]. Therefore, we suggested choosing an appropriate classification scheme based on the ecological phenomenon being analyzed to reduce some known potential sources of spatial uncertainty.

5. Conclusions

As an important pivot point of the Western Development Strategy and the China-ASEAN Free Trade Agreement, the Guangxi Beibu Gulf is simultaneously affected by various policies and human activities such as urban and tourism development, thus seriously affecting the structure and function of ecosystems and the sustainable use of ecotourism resources. However, few studies have been conducted on changes in ecosystem structure and function in the Beibu Gulf area, and the relationship between rapid economic development and dramatic changes in regional ecosystem structure remains unclear. Therefore, this paper simulated land use changes for three scenarios (regular growth scenario, ecological conservation scenario, and ecotourism development scenario) using the Scenario Generator Rule Based Module of InVEST based on the land use distribution maps in 1999 and 2014. We also estimated the ESVs in the region at different periods based on the improved unit area value equivalent method, and revealed the trend of ESVs under different landscape patterns. The results indicated that farmland, forestland and orchard were the main land use types in the Beibu Gulf area. Due to the economic construction and urban expansion in Beibu Gulf, the area of construction land had proliferated and the areas of farmland and mudflat had continued to decrease, causing a serious negative impact on the ecological environment and reducing its ecosystem service value. Therefore, we recommend ecological restoration measures to achieve coordinated development of regional economy, society, and ecology. By comparing the land use change and the evolution trend of ESV in the three scenarios, we found that the regular growth scenario oriented to economic construction could easily have adverse effects on the ecological environment, while the ecological protection scenario constrained the economic development. In contrast, the ecotourism development scenario is the most appropriate development model, which achieves a trade-off between tourism development and resource conservation. Therefore, we suggested to formulate targeted economic development and ecological protection policies based on the land use characteristics of each district and county in the Beibu Gulf. To this end, we have designed a regional planning scheme at the macro level and the local development model level respectively, which provides a scientific basis for the rational allocation of land resources, ecological environmental protection, and ecotourism development in the coastal area of Beibu Gulf.

Supplementary Materials

The following are available online at https://0-www-mdpi-com.brum.beds.ac.uk/article/10.3390/rs13163161/s1. Table S1: Percent change and priority of each land use type for three scenarios. Table S2: Factors and weights for three land use scenarios. Table S3: ID and protection level in the constraints layer.

Author Contributions

Conceptualization, C.H. and D.Z.; Methodology, D.Z.; Software, M.X. and D.Z.; Validation, C.H., Y.L. and Z.Y.; Formal analysis, Y.L. and Z.Y.; Writing—original draft preparation, C.H. and D.Z.; Writing—review and editing, C.H.; Visualization, C.H., M.X. and Y.L.; Supervision, C.H.; Project administration, C.H.; Funding acquisition, C.H. All authors have read and agreed to the published version of the manuscript.

Funding

This work is sponsored by the Natural Science Foundation of China (grant no. 42001218).

Institutional Review Board Statement

Not applicable.

Informed Consent Statement

Not applicable.

Acknowledgments

The authors would like to thank the anonymous reviewers for their constructive comments on improving this paper.

Conflicts of Interest

The authors declare no conflict of interest.

References

  1. Yuan, K.; Li, F.; Yang, H.; Wang, Y. The Influence of Land Use Change on Ecosystem Service Value in Shangzhou District. Int. J. Environ. Res. Public Health 2019, 16, 1321. [Google Scholar] [CrossRef] [Green Version]
  2. Huang, C.; Huang, X.; Peng, C.; Zhou, Z.; Teng, M.; Wang, P. Land use/cover change in the Three Gorges Reservoir area, China: Reconciling the land use conflicts between development and protection. Catena 2019, 175, 388–399. [Google Scholar] [CrossRef]
  3. Liu, Y.; Hou, X.; Li, X.; Song, B.; Wang, C. Assessing and predicting changes in ecosystem service values based on land use/cover change in the Bohai Rim coastal zone. Ecol. Indic. 2020, 111, 106004. [Google Scholar] [CrossRef]
  4. Xie, G.; Zhang, C.; Zhen, L.; Zhang, L. Dynamic changes in the value of China’s ecosystem services. Ecosyst. Serv. 2017, 26, 146–154. [Google Scholar] [CrossRef]
  5. Rimal, B.; Sharma, R.; Kunwar, R.; Keshtkar, H.; Stork, N.E.; Rijal, S.; Rahman, S.A.; Baral, H. Effects of land use and land cover change on ecosystem services in the Koshi River Basin, Eastern Nepal. Ecosyst. Serv. 2019, 38, 100963. [Google Scholar] [CrossRef]
  6. Wu, C.; Chen, B.; Huang, X.; Wei, Y.H.D. Effect of land-use change and optimization on the ecosystem service values of Jiangsu province, China. Ecol. Indic. 2020, 117, 106507. [Google Scholar] [CrossRef]
  7. Liao, Q.; Wang, Z.; Huang, C. Green Infrastructure Offset the Negative Ecological Effects of Urbanization and Storing Water in the Three Gorges Reservoir Area, China. Int. J. Environ. Res. Public Health 2020, 17, 8077. [Google Scholar] [CrossRef] [PubMed]
  8. Cai, Y.; Zhang, H.; Pan, W.; Chen, Y.; Wang, X. Land use pattern, socio-economic development, and assessment of their impacts on ecosystem service value: Study on natural wetlands distribution area (NWDA) in Fuzhou city, southeastern China. Environ. Monit. Assess. 2013, 185, 5111–5123. [Google Scholar] [CrossRef]
  9. Xie, Z.; Li, X.; Chi, Y.; Jiang, D.; Zhang, Y.; Ma, Y.; Chen, S. Ecosystem service value decreases more rapidly under the dual pressures of land use change and ecological vulnerability: A case study in Zhujiajian Island. Ocean Coast. Manag. 2021, 201, 105493. [Google Scholar] [CrossRef]
  10. Dai, X.; Johnson, B.A.; Luo, P.; Yang, K.; Dong, L.; Wang, Q.; Liu, C.; Li, N.; Lu, H.; Ma, L.; et al. Estimation of Urban Ecosystem Services Value: A Case Study of Chengdu, Southwestern China. Remote Sens. 2021, 13, 207. [Google Scholar] [CrossRef]
  11. Luo, S.; Yan, W. Evolution and driving force analysis of ecosystem service values in Guangxi Beibu Gulf coastal areas, China. Acta Ecol. Sin. 2018, 38, 3248–3259. Available online: https://kns.cnki.net/kcms/detail/detail.aspx?FileName=STXB201809025&DbName=CJFQ2018 (accessed on 5 April 2021).
  12. Costanza, R.; d’Arge, R.; De Groot, R.; Farber, S.; Grasso, M.; Hannon, B.; Limburg, K.; Naeem, S.; O’neill, R.V.; Paruelo, J.; et al. The value of the world’s ecosystem services and natural capital. Nature 1997, 387, 253–260. [Google Scholar] [CrossRef]
  13. Luo, Q.; Zhou, J.; Li, Z.; Yu, B. Spatial differences of ecosystem services and their driving factors: A comparation analysis among three urban agglomerations in China’s Yangtze River Economic Belt. Sci. Total Environ. 2020, 725, 138452. [Google Scholar] [CrossRef]
  14. Xu, B.; Zhou, Y.; Xu, L.; Yu, L.; Wu, W. Spatial characteristics analysis of ecological system service value in QianJiang City of Hubei Province. Acta Ecol. Sin. 2011, 31, 7379–7387. Available online: https://kns.cnki.net/kcms/detail/detail.aspx?FileName=STXB201124007&DbName=CJFQ2011 (accessed on 5 April 2021).
  15. Xie, G.; Zhang, C.; Zhang, C.; Xiao, Y.; Lu, C.X. The value of ecosystem services in China. Resour. Sci. 2015, 37, 1740–1746. Available online: https://kns.cnki.net/kcms/detail/detail.aspx?FileName=ZRZY201509008&DbName=CJFQ2015 (accessed on 5 April 2021).
  16. Hu, Y.; Cheng, Y.; Zheng, Z.; Wu, Z.; Li, J.; Yang, Z. Spatial Heterogeneity Change of Guangzhou Ecosystem Services Value. Trop. Geogr. 2018, 38, 475–486. [Google Scholar] [CrossRef]
  17. Guo, R.; Lu, B.; Chen, K. Dynamic simulation of multi-scenario land use change based on CLUMondo model: A case study of coastal cities in Guangxi. Remote. Sens. Land Resour. 2020, 32, 176–183. Available online: https://kns.cnki.net/kcms/detail/detail.aspx?FileName=GTYG202001025&DbName=CJFQ2020 (accessed on 9 April 2021).
  18. Lao, J.; Wang, C.; Wang, J.; Pan, F.; Xi, X.; Liang, L. Land Use Simulation of Guangzhou Based on Nighttime Light Data and Planning Policies. Remote Sens. 2020, 12, 1675. [Google Scholar] [CrossRef]
  19. Li, Y.; He, C. Scenario simulation and forecast of land use/cover in northern China. Chin. Sci. Bull. 2008, 53, 1401. [Google Scholar] [CrossRef] [Green Version]
  20. Zhang, H.; Zhang, B. Review on Land Use and Land Cover Change Models. J. Nat. Resour. 2005, 422–431. Available online: https://kns.cnki.net/kcms/detail/detail.aspx?FileName=ZRZX200503016&DbName=CJFQ2005 (accessed on 9 April 2021).
  21. Liu, X.; Liang, X.; Li, X.; Xu, X.; Ou, J.; Chen, Y.; Li, S.; Wang, S.; Pei, F. A future land use simulation model (FLUS) for simulating multiple land use scenarios by coupling human and natural effects. Landsc. Urban Plan. 2017, 168, 94–116. [Google Scholar] [CrossRef]
  22. Zhang, X.; Li, A.; Nan, X.; Lei, G.; Wang, C. Multi-scenario Simulation of Land Use Change Along China-Pakistan Economic Corridor through Coupling FLUS Model with SD Model. J. Geo-Inf. Sci. 2020, 32, 176–183. Available online: https://kns.cnki.net/kcms/detail/detail.aspx?FileName=DQXX202012012&DbName=DKFX2020 (accessed on 16 April 2021).
  23. Yang, J.; Xie, P.; Xi, J.; Ge, Q.; Li, X.; Ma, Z. LUCC simulation based on the cellular automata simulation: A case study of Dalian Economic and Technological Development Zone. Acta Geogr. Sin. 2015, 70, 461–475. Available online: https://kns.cnki.net/kcms/detail/detail.aspx?FileName=DLXB201503009&DbName=CJFQ2015 (accessed on 16 April 2021).
  24. Singh, N.K.; Gourevitch, J.D.; Wemple, B.C.; Watson, K.B.; Rizzo, D.M.; Polasky, S.; Ricketts, T.H. Optimizing wetland restoration to improve water quality at a regional scale. Environ. Res. Lett. 2019, 14, 64006. [Google Scholar] [CrossRef] [Green Version]
  25. Yang, X.; Ji, G.; Wang, C.; Zuo, J.; Yang, H.; Xu, J.; Chen, R. Modeling nitrogen and phosphorus export with Invest model in Bosten Lake basin of Northwest China. PLoS ONE 2019, 14, e220299. [Google Scholar] [CrossRef]
  26. Li, J.; Bai, Y.; Alatalo, J.M. Impacts of rural tourism-driven land use change on ecosystems services provision in Erhai Lake Basin, China. Ecosyst. Serv. 2020, 42, 101081. [Google Scholar] [CrossRef]
  27. Wu, B.; Li, Y.; Zhao, Q.; Zhang, W.; Lu, R. The Service Value and Driving Mechanism of Coastal Wetland Ecosystem in Beibu Gulf of Guangxi. Ecol. Econ. 2020, 36, 151–157. Available online: https://kns.cnki.net/kcms/detail/detail.aspx?FileName=STJJ202009024&DbName=DKFX2020 (accessed on 21 April 2021).
  28. Chen, Z.; Cai, W.; Xu, S.; Huang, Z.; Qiu, Y. Risk assessment of coastal ecosystem in Beibu Gulf, Guangxi of South China. Chin. J. Appl. Ecol. 2011, 22, 2977–2986. [Google Scholar] [CrossRef]
  29. Geng, Q.; Wang, Z.; Tao, J.; Kimura, M.K.; Liu, H.; Hogetsu, T.; Lian, C. Ocean Currents Drove Genetic Structure of Seven Dominant Mangrove Species Along the Coastlines of Southern China. Front. Genet. 2021, 12, 615911. [Google Scholar] [CrossRef] [PubMed]
  30. Richards, J.A. Remote Sensing Digital Image Analysis; Springer: Berlin, Germany, 1999; p. 240. [Google Scholar] [CrossRef]
  31. Canty, M.J. Image Analysis, Classification and Change Detection in Remote Sensing: With Algorithms for ENVI/IDL and Python; CRC Press: Boca Raton, FL, USA, 2014. [Google Scholar]
  32. He, W.; Lu, Y.; He, P.; Gao, F.; Jin, J. Dynamic Simulation and Eco-environmental Benefits Evaluation of Land Use Pattern in Beibu Gulf Economic Zone—A Case Study of Qinzhou City in Guangxi Zhuang Autonomous Region. Bull. Soil Water Conserv. 2015, 35, 281–286. [Google Scholar] [CrossRef]
  33. Su, H.; Hou, X.; Di, X. Spatio-temporal characteristics and scenario analysis of land-use change in the Beibu Gulf Economic Rim coastal area, China. Mar. Sci. 2016, 40, 107–116. Available online: https://kns.cnki.net/kcms/detail/detail.aspx?FileName=HYKX201609015&DbName=CJFQ2016 (accessed on 21 April 2021).
  34. You, S.; Kim, M.; Lee, J.; Chon, J. Coastal landscape planning for improving the value of ecosystem services in coastal areas: Using system dynamics model. Environ. Pollut. 2018, 242, 2040–2050. [Google Scholar] [CrossRef] [PubMed]
  35. Mendoza-González, G.; Martínez, M.L.; Lithgow, D.; Pérez-Maqueo, O.; Simonin, P. Land use change and its effects on the value of ecosystem services along the coast of the Gulf of Mexico. Ecol. Econ. 2012, 82, 23–32. [Google Scholar] [CrossRef]
  36. Gong, B.; Cao, H.; Peng, C.; Perčulija, V.; Tong, G.; Fang, H.; Wei, X.; Ouyang, S. High-throughput sequencing and analysis of microbial communities in the mangrove swamps along the coast of Beibu Gulf in Guangxi, China. Sci. Rep. 2019, 9, 9377. [Google Scholar] [CrossRef]
  37. Liu, Z.; Wu, R.; Chen, Y.; Fang, C.; Wang, S. Factors of ecosystem service values in a fast-developing region in China: Insights from the joint impacts of human activities and natural conditions. J. Clean. Prod. 2021, 297, 126588. [Google Scholar] [CrossRef]
  38. Zhai, T.; Wang, J.; Fang, Y.; Qin, Y.; Huang, L.; Chen, Y. Assessing ecological risks caused by human activities in rapid urbanization coastal areas: Towards an integrated approach to determining key areas of terrestrial-oceanic ecosystems preservation and restoration. Sci. Total Environ. 2020, 708, 135153. [Google Scholar] [CrossRef]
  39. Tian, Y.; Huang, Y.; Zhang, Q.; Tao, J.; Zhang, Y.; Zhou, G.; Han, X.; Yang, Y.; Lin, J. Simulation of land cover and biodiversity in Nanliu river basin in Beibu Gulf. China Environ. Sci. 2020, 40, 1320–1334. [Google Scholar] [CrossRef]
  40. Huang, C.; Zhou, Z.; Teng, M.; Wu, C.; Wang, P. Effects of climate, land use and land cover changes on soil loss in the Three Gorges Reservoir area, China. Geogr. Sustain. 2020, 1, 200–208. [Google Scholar] [CrossRef]
  41. Tolessa, T.; Senbeta, F.; Kidane, M. The impact of land use/land cover change on ecosystem services in the central highlands of Ethiopia. Ecosyst. Serv. 2017, 23, 47–54. [Google Scholar] [CrossRef]
  42. Ma, S.; Lao, C.; Jiang, H. Ecological restoration zoning of territorial space based on the pattern simulation of eco-security scenario: A case study of Guangdong-Hong Kong-Macao Greater Bay Area. Acta Ecol. Sin. 2021, 41, 3441–3448. Available online: https://kns.cnki.net/kcms/detail/detail.aspx?FileName=STXB202109010&DbName=CJFQTEMP (accessed on 27 April 2021).
  43. Cao, Q.; Gu, C.; Guan, W. China’s urbanization SD modelling and simulation based on land use. J. Nat. Resour. 2021, 36, 1062–1084. Available online: https://kns.cnki.net/kcms/detail/detail.aspx?FileName=ZRZX202104019&DbName=DKFX2021 (accessed on 27 April 2021).
  44. Li, Y.; Li, Y.; Karácsonyi, D.; Liu, Z.; Wang, Y.; Wang, J. Spatio-temporal pattern and driving forces of construction land change in a poverty-stricken county of China and implications for poverty-alleviation-oriented land use policies. Land Use Policy 2020, 91, 104267. [Google Scholar] [CrossRef]
  45. Mao, X.; Meng, J.; Wang, Q. Modeling the effects of tourism and land regulation on land-use change in tourist regions: A case study of the Lijiang River Basin in Guilin, China. Land Use Policy 2014, 41, 368–377. [Google Scholar] [CrossRef]
  46. Cheng, P.; Wang, H.; Nie, X.; Zhu, S.; Chen, Z.; Wu, X.; Zhang, A.; Wang, J. What Are the Impacts of a Coastal Zone Protection Policy on Farmers’ Livelihood Capital? Empirical Analysis From the Perspective of Farmer Participation. Front. Mar. Sci. 2021, 8, 689182. [Google Scholar] [CrossRef]
  47. Huang, X.; Huang, X.; Liu, M.; Wang, B.; Zhao, Y. Spatial-temporal Dynamics and Driving Forces of Land Development Intensity in the Western China from 2000 to 2015. Chin. Geogr. Sci. 2020, 30, 16–29. [Google Scholar] [CrossRef] [Green Version]
  48. Song, F.; Su, F.; Mi, C.; Sun, D. Analysis of driving forces on wetland ecosystem services value change: A case in Northeast China. Sci. Total Environ. 2021, 751, 141778. [Google Scholar] [CrossRef]
  49. Hasan, S.; Shi, W.; Zhu, X. Impact of land use land cover changes on ecosystem service value—A case study of Guangdong, Hong Kong, and Macao in South China. PLoS ONE 2020, 15, e0231259. [Google Scholar] [CrossRef] [Green Version]
  50. Luchman, H.; Dian, S.; Nobukazu, N. Mangrove Conservation in East Java: The Ecotourism Development Perspectives. J. Trop. Life Sci. 2017, 7, 277–285. [Google Scholar] [CrossRef] [Green Version]
  51. Johnson, K.A.; Polasky, S.; Nelson, E.; Pennington, D. Uncertainty in ecosystem services valuation and implications for assessing land use tradeoffs: An agricultural case study in the Minnesota River Basin. Ecol. Econ. 2012, 79, 71–79. [Google Scholar] [CrossRef]
  52. Rocchini, D.; Foody, G.M.; Nagendra, H.; Ricotta, C.; Anand, M.; He, K.S.; Amici, V.; Kleinschmit, B.; Förster, M.; Schmidtlein, S.; et al. Uncertainty in ecosystem mapping by remote sensing. Comput. Geosci. 2013, 50, 128–135. [Google Scholar] [CrossRef]
  53. Lechner, A.M.; Langford, W.T.; Bekessy, S.A.; Jones, S.D. Are landscape ecologists addressing uncertainty in their remote sensing data? Landsc. Ecol. 2012, 27, 1249–1261. [Google Scholar] [CrossRef]
Figure 1. Location of Beibu Gulf area in China.
Remotesensing 13 03161 g001
Figure 2. Land use maps of the study area in 1999 (a) and 2014 (b).
Remotesensing 13 03161 g002
Figure 3. Kernel density analysis of increased forestland (a), increased orchard (b), and increased construction land (c) in the study area from 1999 to 2014.
Remotesensing 13 03161 g003
Figure 4. Land use map of the study area in 2030 for the regular growth scenario (a), the ecological protection scenario (b), and the ecotourism scenario (c).
Remotesensing 13 03161 g004
Figure 5. Kernel density analysis of construction land (a), forestland (b), orchard (c), and mud flat (d) for the year of 2014 (1), the regular growth scenario (2), the ecological protection scenario (3), and the ecotourism scenario (4).
Remotesensing 13 03161 g005
Figure 6. Landscape planning for different local economic development models of the study area. (a) featured forest and fruit economy, (b) special agricultural products, and (c) featured under-forest economy.
Remotesensing 13 03161 g006
Table 1. Scene ID of Landsat remote sensing images in study area.
Data Acquisition TimeScene ID of Landsat Remote Sensing Images
Vegetation Growing SeasonNon-Growing Season
1999LE71240451999253SGS00LE71240451999317SGS00
LE71250451999308EDC00LE71250451999356EDC00
2014LC81240452014286LGN00LC81240452014318LGN00
LC81250452014165LGN00LC81250452014021LGN00
Table 2. Classification and definition of ecosystem and land use types.
Ecosystem TypeLand Use TypeDescription
Farmland ecosystemFarmlandThe land is used for agricultural production
Forest ecosystemForestlandIt can provide a canopy and can be identified by remote sensing images. The crown density is >0.2.
OrchardIt is distributed regularly and has a clear texture of orchard. The crown density is at 0.2–0.7.
Wetland ecosystemAquaculture landAquaculture, including paddock aquaculture, aquaculture tanks, etc.
Mud flatIt includes mud flats, mangroves, etc.
WaterIt includes oceans, rivers, and lakes.
Desert ecosystemBare landIt includes abandoned land, bare rock, the water fluctuation zone, etc.
Urban ecosystemConstruction landIt includes the various scales of towns, roads, settlements, etc.
Table 3. Parameter setting for three scenarios.
Land Use TypeRegular Growth ScenarioEcological Protection ScenarioEcotourism Development Scenario
Farmland---
Forestland-+100% Δ Forestland+75% Δ Forestland
Orchard+100% Δ Orchard+50% Δ Orchard +50% Δ Orchard
Aquaculture land+100% Δ Aquaculture land-+50% Δ Aquaculture land
Water- --
Mud flat-+100% Δ Mud flat+50% Δ Mud flat
Bare land- --
Construction land+100% Δ Construction land- +50% Δ Construction land
Note: The “Δ” represents the amount of change in the land use type during 1999–2014. The “-” indicates that the change of land use type is not required in the land use scenario.
Table 4. Ecosystem service equivalent value per unit area ($/ha).
Ecosystem TypeFarmlandForestWetlandDesertUrban
Land Use TypeCultivated LandForestlandOrchardAquaculture LandMangrovesWaterBare LandBuilt-Up Land
Provisioning servicesFood production661.83141.1392.46248.19248.19389.310.000.00
Raw material production43.80321.18209.26243.32243.32111.930.000.00
Water supply−1279.87165.46107.061260.411260.414034.270.000.00
Regulating servicesGas regulation540.171056.02686.17924.62924.62374.729.730.00
Climate regulation277.393163.182058.501751.911751.911114.410.000.00
Purify environment82.73939.22622.901751.911751.912700.8748.660.00
Hydrological regulation1323.672306.691630.2511,791.3611,791.3649,754.3714.600.00
Supporting servicesSoil retention4.871289.60837.031124.151124.15452.589.730.00
Nutrient cycling92.4697.3363.2687.6087.6034.070.000.00
Biodiversity102.201172.81764.033829.883829.881240.949.730.00
Cultural servicesAesthetic landscape43.80515.84335.782301.822301.82919.764.870.00
Table 5. Land use area and land use change from 1999 to 2014.
Land Use Type199920141999–2014
Area (km2)Area (%)Area (km2)Area (%)Area Change (km2)Area Change (%)
Farmland3677.51 41.61 2635.85 29.82 −1041.66−11.79
Forestland1524.84 17.25 1914.62 21.66 389.784.41
Orchard2553.05 28.88 2719.28 30.76 166.231.88
Aquaculture land249.22 2.82 314.09 3.55 64.870.73
Water290.33 3.28 364.37 4.12 74.040.84
Mud flat80.35 0.91 13.07 0.15 −67.28−0.76
Bare land341.34 3.86 282.18 3.19 −59.16−0.67
Construction land122.36 1.38 595.54 6.74 473.185.36
Table 6. Land use area and land use change from 2014 to 2030 for three scenarios.
Land Use TypeArea (km2) Area Change between 2014 and 2030 (km2)
2014Regular Growth ScenarioEcological Protection ScenarioEcotourism ScenarioRegular Growth ScenarioEcological Protection ScenarioEcotourism Scenario
Farmland2635.852479.592513.222539.31−156.26−122.63−96.54
Forestland1914.621751.272297.501915.09−163.35382.880.47
Orchard2719.282801.932687.462748.3282.64−31.8229.03
Water364.37302.61276.98335.80−61.76−87.40−28.57
Aquaculture land314.09312.51212.41271.65−1.57−101.68−42.44
Mud flat13.0712.26202.14150.46−0.81189.08137.39
Bare land282.18282.1853.75238.140.00−228.43−44.03
Construction land595.54896.65595.54640.22301.110.0044.67
Table 7. Ecosystem service value ($) in 1999 and 2014, and the ecosystem service value change between 1999 and 2014.
Ecosystem ServiceESV ($)ESV Change ($)
199920141999–2014
Food production3.05 × 1082.44 × 108−6.11 × 10⁷
Raw material production1.33 × 1081.47 × 1081.41 × 107
Water supply−3.18 × 10⁸−1.86 × 1081.32 × 108
Supplying services1.20 × 1082.05 × 1088.49 × 107
Hydrological regulation2.29 × 1092.10 × 109−1.92 × 10⁸
Climate regulation1.21 × 1091.36 × 1091.45 × 108
Gas regulation5.88 × 1085.95 × 1086.57 × 106
Purify environment4.51 × 1084.95 × 1084.42 × 107
Regulating services4.54 × 1094.55 × 1094.33 × 106
Biodiversity conservation6.28 × 1087.21 × 1089.26 × 107
Soil retention4.77 × 1085.53 × 1087.62 × 107
Nutrient cycling7.00 × 1076.62 × 107−3.80 × 10⁶
Supporting services1.18 × 1091.34 × 1091.65 × 108
Aesthetic landscape (Cultural services)3.12 × 1083.59 × 1084.69 × 107
Total ESV6.15 × 1096.45 × 1093.01 × 108
Table 8. Ecosystem service value ($) in 2030 and the ecosystem service value change ($) from 2014 to 2030 for three scenarios.
Ecosystem ServiceESV ($)ESV Change ($)
2014Regular GrowthEcological ProtectionEcotourismRegular GrowthEcological ProtectionEcotourism
Food production2.44 × 1082.30 × 1082.44 × 1082.41 × 108−1.35 × 10⁷−3.38 × 10⁵−2.53 × 10⁶
Raw material production1.47 × 1081.41 × 1081.55 × 1081.47 × 108−5.75 × 1068.61 × 1061.01 × 104
Water supply−1.86 × 10⁸−1.76 × 10⁸−1.12 × 10⁸−1.27 × 1089.87 × 1067.41 × 1075.92 × 107
Supplying services2.05 × 1081.95 × 1082.87 × 1082.61 × 108−9.37 × 1068.24 × 1075.66 × 107
Hydrological regulation2.10 × 1091.98 × 1092.88 × 1092.69 × 109−1.24 × 1087.84 × 1085.92 × 108
Climate regulation1.36 × 1091.31 × 1091.46 × 1091.37 × 109−5.02 × 1079.91 × 1076.32 × 106
Gas regulation5.95 × 1085.69 × 1086.16 × 1085.90 × 108−2.59 × 1072.10 × 107−4.63 × 10⁶
Purify environment4.95 × 1084.72 × 1085.45 × 1085.20 × 108−2.28 × 1074.98 × 1072.55 × 107
Regulating services4.55 × 1094.33 × 1095.50 × 1095.17 × 109−2.22 × 1089.54 × 1086.19 × 108
Biodiversity conservation7.21 × 1086.82 × 1087.13 × 1087.12 × 108−3.88 × 10⁷−7.95 × 10⁶−8.90 × 10⁶
Soil retention5.53 × 1085.32 × 1085.87 × 1085.54 × 108−2.14 × 1073.37 × 1076.38 × 105
Nutrient cycling6.62 × 1076.31 × 1076.76 × 1076.53 × 107−3.07 × 1061.38 × 106−8.58 × 10⁵
Supporting services1.34 × 1091.28 × 1091.37 × 1091.33 × 109−6.32 × 1072.72 × 107−9.12 × 10⁶
Aesthetic landscape3.59 × 1083.38 × 1083.51 × 1083.56 × 108−2.10 × 10⁷−8.10 × 10⁶−3.15 × 10⁶
Total ESV6.45 × 1096.14 × 1097.51 × 1097.11 × 109−3.16 × 1081.06 × 1096.63 × 108
Table 9. Comparison of ecosystem service values ($) of different districts and counties for three scenarios.
ScenarioEcosystem TypeHaicheng DistrictHepu CountyTieshangang DistrictYinhai DistrictDongxing DistrictFangcheng DistrictGangkou DistrictQinnan District
Regular growth scenario and Ecological protection scenarioFarmland ecosystem−1.58 × 10⁶−2.00 × 10⁶−4.20 × 10⁶−3.00 × 10⁶−2.40 × 1061.44 × 107−2.48 × 10⁶−6.00 × 10⁶
Forestland ecosystem−4.25 × 10⁵−7.30 × 10⁷−1.17 × 10⁷−6.70 × 10⁶−4.50 × 10⁷−2.60 × 10⁸−3.12 × 10⁷−1.00 × 10⁸
Wetland ecosystem−1.03 × 10⁷−1.95 × 10⁸−2.20 × 10⁷−1.26 × 10⁸−9.33 × 10⁷−6.20 × 10⁷−9.35 × 10⁷−2.40 × 10⁸
Desert ecosystem4.60 × 1032.41 × 1051.03 × 1055.72 × 1048.21 × 1048.83 × 1051.29 × 1057.24 × 105
Urban ecosystem0.000.000.000.000.000.000.000.00
Regular growth scenario and Ecotourism development scenarioFarmland ecosystem−5.30 × 1050.00−4.30 × 10⁶−8.00 × 10⁵−2.20 × 1061.80 × 106−1.48 × 10⁶−4.00 × 10⁶
Forestland ecosystem−1.40 × 10⁴−2.50 × 10⁷−1.40 × 10⁶−1.00 × 10⁵−2.00 × 10⁷−6.00 × 10⁷−1.63 × 10⁷−2.00 × 10⁷
Wetland ecosystem−4.24 × 10⁶−7.50 × 10⁷−1.16 × 10⁷−2.17 × 10⁸−2.31 × 10⁸−8.40 × 10⁷−2.60 × 10⁷−1.77 × 10⁸
Desert ecosystem1.60 × 1032.40 × 1042.00 × 1033.29 × 1043.50 × 1042.24 × 1053.50 × 1047.30 × 104
Urban ecosystem0.000.000.000.000.000.000.000.00
Ecological protection scenario and Ecotourism development scenarioFarmland ecosystem1.05 × 1062.00 × 106−1.00 × 1052.20 × 1062.00 × 105−1.26 × 1071.00 × 1062.00 × 106
Forestland ecosystem4.11 × 1054.80 × 1071.03 × 1076.60 × 1062.50 × 1072.00 × 1081.49 × 1078.00 × 107
Wetland ecosystem6.10 × 1061.20 × 1081.04 × 107−9.10 × 10⁷−1.38 × 10⁸−2.20 × 1076.75 × 1076.30 × 107
Desert ecosystem−3.00 × 10³−2.17 × 10⁵−1.01 × 10⁵−2.43 × 10⁴−4.71 × 10⁴−6.59 × 10⁵−9.36 × 10⁴−6.51 × 10⁵
Urban ecosystem0.000.000.000.000.000.000.000.00
Publisher’s Note: MDPI stays neutral with regard to jurisdictional claims in published maps and institutional affiliations.

