Article

Impact of Aerosol and Cloud on the Solar Energy Potential over the Central Gangetic Himalayan Region

by
Umesh Chandra Dumka
1,
Panagiotis G. Kosmopoulos
2,*,
Shantikumar S. Ningombam
3 and
Akriti Masoom
4
1
Aryabhatta Research Institute of Observational SciencES (ARIES), Nainital 263001, India
2
Institute for Environmental Research and Sustainable Development, National Observatory of Athens (IERSD/NOA), 15236 Athens, Greece
3
Indian Institute of Astrophysics, Bangalore 560034, India
4
Indian Institute of Technology Roorkee, Roorkee 247667, India
*
Author to whom correspondence should be addressed.
Remote Sens. 2021, 13(16), 3248; https://0-doi-org.brum.beds.ac.uk/10.3390/rs13163248
Submission received: 24 June 2021 / Revised: 30 July 2021 / Accepted: 13 August 2021 / Published: 17 August 2021
(This article belongs to the Special Issue Remote Sensing for Smart Renewable Cities)

Abstract

:
We examine the impact of atmospheric aerosols and clouds on the surface solar radiation and solar energy at Nainital, a high-altitude remote location in the central Gangetic Himalayan region (CGHR). For this purpose, we exploited the synergy of remote-sensed data in terms of ground-based AERONET Sun Photometer and satellite observations from the MODerate Resolution Imaging Spectroradiometer (MODIS) and the Meteosat Second Generation (MSG), with radiative transfer model (RTM) simulations and 1 day forecasts from the Copernicus Atmosphere Monitoring Service (CAMS). Clouds and aerosols are one of the most common sources of solar irradiance attenuation and hence causing performance issues in the photovoltaic (PV) and concentrated solar power (CSP) plant installations. The outputs of RTM results presented with high accuracy under clear, cloudy sky and dust conditions for global horizontal (GHI) and beam horizontal irradiance (BHI). On an annual basis the total aerosol attenuation was found to be up to 105 kWh m−2 for the GHI and 266 kWh m−2 for BHI, respectively, while the cloud effect is much stronger with an attenuation of 245 and 271 kWh m−2 on GHI and BHI. The results of this study will support the Indian solar energy producers and electricity handling entities in order to quantify the energy and financial losses due to cloud and aerosol presence.

1. Introduction

Renewable energy has drawn increasing attention in scientific research and had significant evolution over the last two decades [1,2,3,4,5]. It has seen intense promotion by governments in many countries and produces an important share of the total energy production, focusing on the reduction both of the growing carbon dioxide emissions, and regional air pollution, particularly carbonaceous aerosols from fossil fuel burning and anthropogenic activities [1,6,7,8,9,10]. Solar energy, which is one of the most abundant renewable energies, can be very useful for many aspects such as generating electricity for commercial or industrial use. The study of solar energy measurement and its mapping at the surface level is very important not only for renewable energy but also on environmental pollution, agriculture, and hydrology as well as climate change [11]. Therefore, the wide range of solar energy uses and technology requires detailed study. Photovoltaic (PV) power generation is an important step in this direction and it demands research in this field; due to the large variability in the available solar resources, a detailed comprehensive study of its spatiotemporal behaviour is needed. The efficiency of PV power generation is also sensitive to various atmospheric parameters of the location where the installation of solar panels is made. In addition to dust, cloud presence is another key determining factor in determining the energy efficiency as clouds absorb and scatter solar radiation in the short-wave and re-emit it in the long-wave into space, therefore contributing to the greenhouse effect [12].
Further, it is well known that the effects of atmospheric aerosols, clouds, and dust on solar radiation that reaches the Earth’s surface has received great attention as changes in the amount of solar radiation have a profound implication on the surface radiation budget and the hydrological cycle [13]. The solar radiation that reaches the Earth’s surface is subjected to reflection, scattering, and absorption by air molecules, aerosols, clouds, and dust in the atmosphere. Clouds block most of the direct radiation, whereas aerosols also affect the amount as well as the lifetime of clouds. Therefore, accurate knowledge of all these processes is a very complex and challenging task. Over south Asia, the aerosol burden is high due to large sources of local dust, long-range transport from the deserts in Asia and Africa, smoke plumes from biomass burning (i.e., crop residue burning, agricultural waste burning, etc.), and lots of anthropogenic pollution [14,15,16,17,18,19,20]. The large aerosol burden results in haze and intense scattering and absorption of solar radiation, and effects on the Himalayan climate changes, cryosphere, and Indian summer monsoon circulation [21,22,23,24]. These aerosols and pollutants have a significant influence on the climate system directly by affecting the Earth’s radiation budget through scattering and absorption of solar radiation or indirectly by changing cloud microphysical properties [13,25,26]. The scattering and absorption of the incoming solar radiation by the aerosols, dust, and clouds have significantly reduced the surface solar radiation (SSR) reaching the Earth’s surface [8,27,28,29]. Such a reduction in SSR is expected for the attenuation of both the global horizontal irradiance (GHI) and the beam horizontal irradiance (BHI) recorded on the Earth’s surface. The reduction of GHI and BHI will reduce the efficiency of solar power plants located at large photovoltaic (PV) installations to generate electricity. The effects of aerosols, dust, and clouds on solar energy resources are not well understood and quantified in detail, particularly in India. Therefore, due to their significant importance in the amount of solar radiation reaching the Earth’s surface and their effects on climate change, the evaluation of their impact on solar energy resources for energy purposes is of special interest [30]. The efficiency of PV energy production largely depends on the higher solar irradiance, clear sky (cloud-free) with thin aerosols or dust concentrations. In the absence of clouds, aerosols are the main source attenuating the SSR. Such locations are generally located at high-altitude remote sites. In this case, the present site has many advantages due to its high altitude and location far away from any major anthropogenic sources of pollution.
The present study deals with the application of a remote sensing and RTM-based model over the central Himalayan region, which is one of the regional background sites and influenced significantly by the densely populated and heavily polluted Indo-Gangetic Plain region. Further, the site experiences extreme dust storms during the pre-monsoon/spring months and significant rainfall during the Indian Summer Monsoon seasons [17,31,32,33,34]. Therefore, this provides a unique opportunity to analyze and study the effects of aerosols and clouds on solar radiation and photovoltaic power production.
Due to the recent unprecedented industrialization/urbanization, a large and dense population, economic growth, and rapidly increasing demands of energy, particularly in countries such as India and China, there has been an increase in emissions of aerosols and pollutions [35,36,37]. Further, the population of India is increasing at a rapid rate and in 2030, India will be the world’s most populous country with 1.5 billion people compared to the current population of ~1.4 billion with a population density of 464 per km2 [2,38]. This demands a large amount of energy. Therefore, to meet this energy demand it is necessary to know the availability of solar energy resources over the region.
In the current work, the analysis was performed by calculating the 5-year aerosol optical depth (AOD) and cloud optical thickness (COT) climatology over the Indian subcontinent from MODIS, CAMS, and MSG and quantifying its impacts on GHI and BHI for the period 2008–2012. Finally, for the first time in India, we performed a brief financial analysis for a hypothetical scenario of a 1 MW system to quantify the impact of aerosols and clouds’ presence on the solar energy production from a PV and CSP system and on the daily, monthly, and annual revenues under climatological conditions. In Section 2, we present the experimental site’s details and data used. Section 3 describes the methodology and techniques used followed by results and discussion in Section 4, which describes the solar power and energy results including the financial analysis for the aforementioned scenarios, and lastly in Section 5 we present our conclusions.

2. Experimental Site and Data

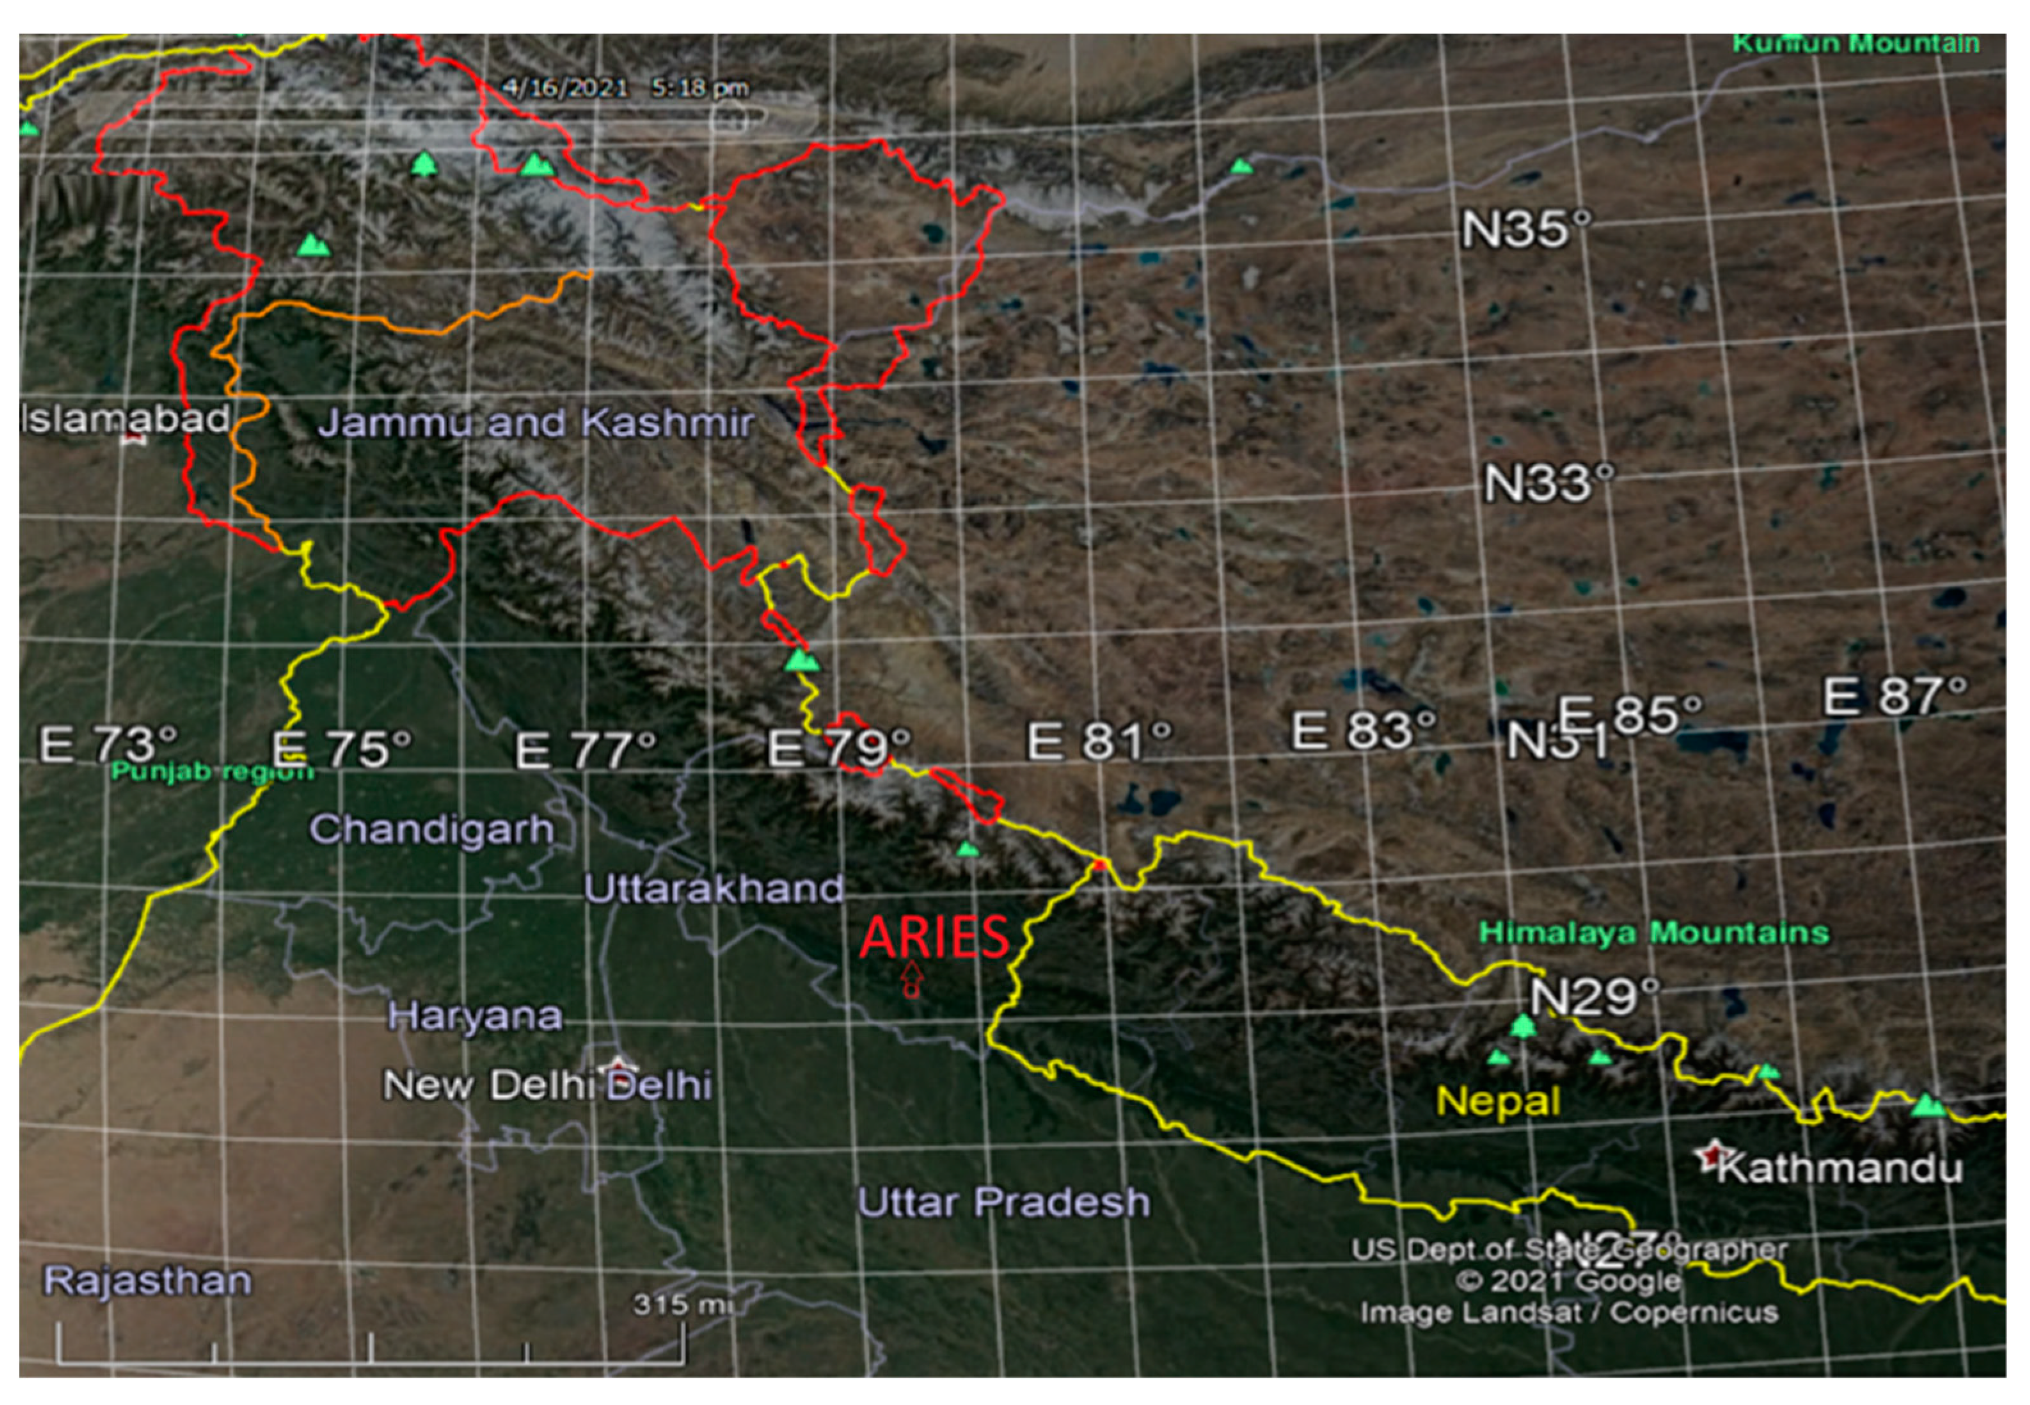
2.1. Experimental Site

The Uttarakhand state has huge natural renewable resources to generate electricity. Due to cold and sunny weather conditions, the region is quite suitable for installing solar energy, in spite of its huge hydropower potential of about 20,236 MW out of which only 3594.85 MW has been harnessed [39]. The average solar radiation received in the state is 1300 K Wh m−2 which is equivalent to the solar potential energy of about 4077 MW in the document of Uttarakhand Renewable Energy Development Agency [40].
The experimental site, the Aryabhatta Research Institute of Observational Sciences (ARIES; 29.4° N, 79.5° E), Manora Peak Nainital as shown in Figure 1, is a high-altitude (1958 m above mean sea level) remote location in the central Gangetic Himalayan region (CGHR). This site is far away from any urban cities or any major anthropogenic pollution source and hence considered as a better regional representative background site [16,41,42,43,44]. It is a unique site to study the regional environment, particularly the interactions between the natural and anthropogenic aerosols, cloud-aerosol interaction, air pollutants, and hence climate change. Nainital (well known as the Lake City of Uttarakhand state) is at about 2 km aerial distance from the observation location and does not host any major pollution source such as industry, urbanization, etc. About 35 km to the south of Nainital are located Haldwani and Rudrapur which host small-scale industry. Towards its northeast are the high-altitude mountains of the Himalayan region, and low-altitude mountains lie towards the North West. The densely populated and highly polluted Indo-Gangetic Plain (IGP) region towards the south serves as a major possible pollution source for this site, other than its local pollutant source which is mainly automobile exhaust [16,42,43,44]. In general, the present site can be considered as a pristine mountainous site and further details about the observational site are presented elsewhere [45,46,47], and hence are not repeated here.

2.2. Data Used

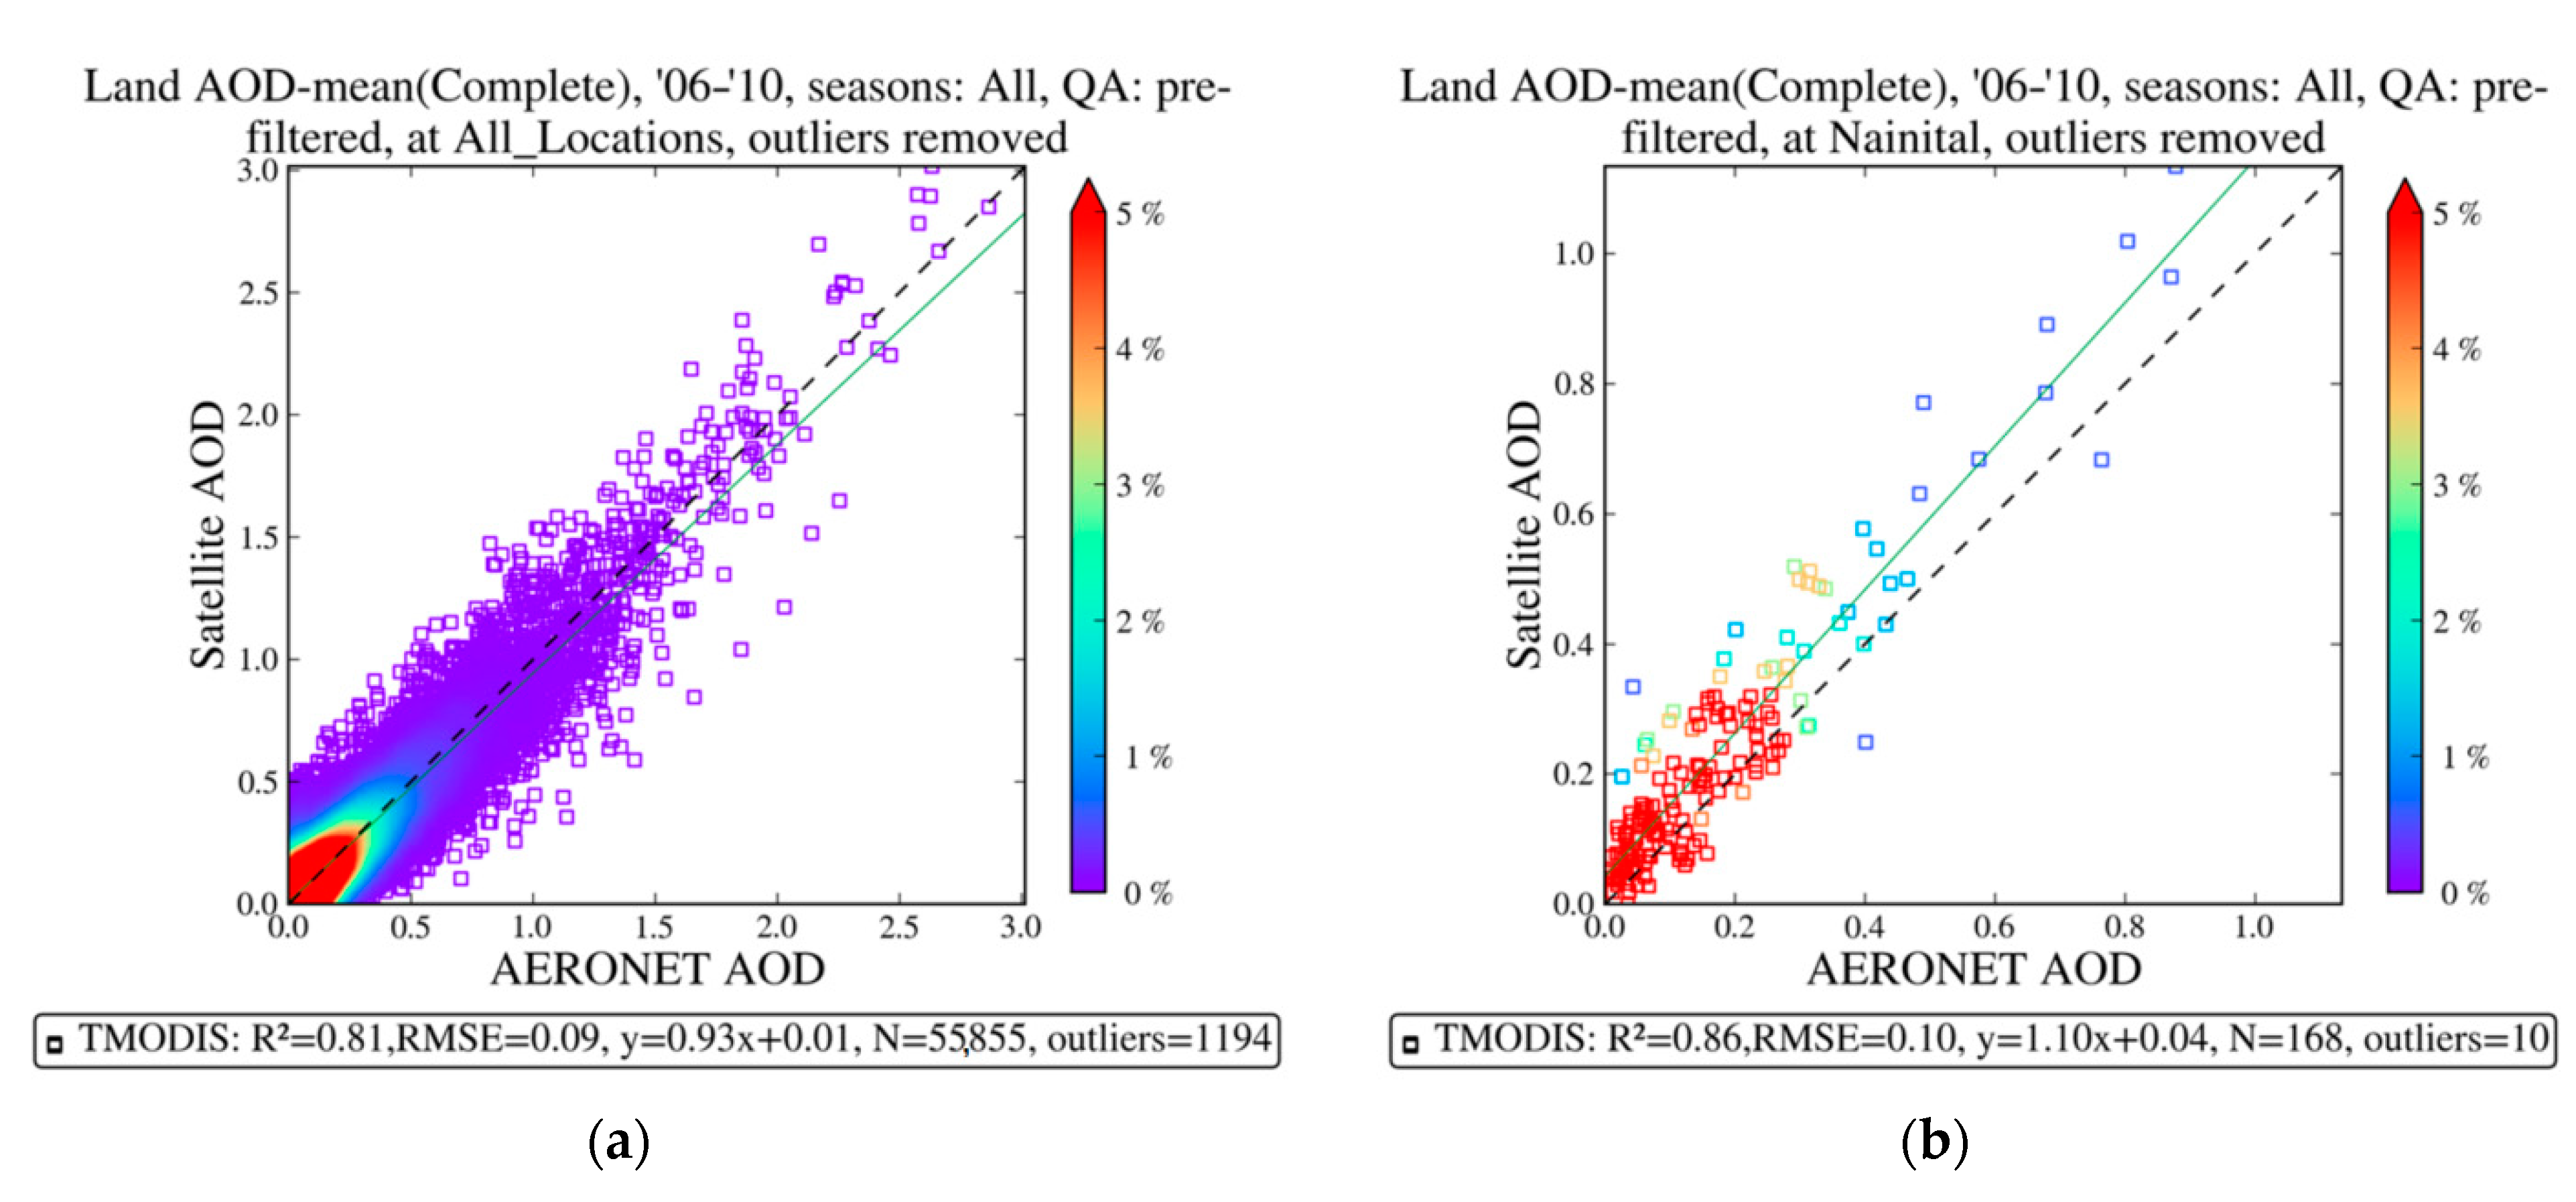
2.2.1. AERONET Sun Photometer

The AERONET measurements presented in the current work were carried out at ARIES, Manora Peak Nainital. The details of the instrumentation, data acquisitions, calibrations, etc are presented in several earlier papers [48,49,50,51,52,53] and hence are not repeated here. In general, the typical uncertainty in AOD retrieval under cloud-free conditions is ± 0.01 for λ > 400 nm and ± 0.02 for shorter wavelengths [54]. In the current work, the daily averaged data, which are cloud-screened and quality assured [50,55,56], were used.

2.2.2. Model Forecasts

The Copernicus Atmosphere Monitoring Service (CAMS) is one of the European commission services implemented by the European Center for Medium-Range Weather Forecasts (ECMWF) under the Copernicus program. The CAMS is based on Monitoring Atmospheric Composition and Climate (MACC) which is used to estimate the near-real-time daily global forecasts of aerosol optical depth at 550 nm for up to 5 days [57,58]. The basic parameters include dust, organic carbon, black carbon, sulfate AOD, and sea salt. The temporal and spatial resolution of AOD data retrieved from MACC is 1 h and 0.4°, respectively.

2.2.3. Satellite Observations

MODIS (MODerate Resolution Imaging Spectroradiometer) is a key instrument aboard the Terra and Aqua satellites, viewing the whole Earth’s surface every 1–2 days. The MODIS Terra and Aqua satellites acquire the data in 36 spectral bands. In the current work, the collection 6.1 Level 3 (1° × 1°) Terra and Aqua MODIS AOD550 values following the dark target [59] and the deep blue approach were used over the Indian subcontinent [59]. Further, several studies [52,60,61] have showed a satisfactory agreement between the MODIS and AERONET AODs. The MODIS AOD falls within the expected uncertainty of ± 0.05 ± 0.15 × AOD over land [59]. The error involved in the MODIS C6.1 AOD550 retrievals is in the range of ± (0.05 + 15%) over land and ± (0.04 + 10%) over the ocean [62].
MSG is a geostationary meteorological satellite equipped with a Spinning Enhanced Visible and Infrared Imager (Meteosat-8/SEVIRI) that covers the region from −60° N to 60° N and −18.5° E to 101.5° E. The data products are provided in a hierarchical data format with a hourly temporal resolution and spatial resolution of 3 km over the nadir. MSG provides cloud microphysical parameters such as cloud optical thickness (COT) and cloud effective radius [63].
The Surface Solar Radiation Data Set–Heliosat (SARAH) provided the solar surface irradiance (SIS) or global horizontal irradiance (GHI), surface direct normalized irradiance (BHI) from the visible channels of MVIRI (Meteosat Visible Infra-Red Imager) and SEVIRI instruments on-board the geostationary Meteosat Satellites.

3. Methodology

3.1. Radiative Transfer Model

In the present study, we used the Radiative Transfer Model (RTM) simulations produced by libRadtran [64,65] for estimating the gridded GHI and BHI under the aerosol and cloud conditions. A fast version of RTM was developed by [66] based on pre-calculated look-up tables. The major input parameters for the RTM simulations under clear sky conditions by libRadtran models are the AOD, solar zenith angle (SZA), Ångström exponent (AE), single scattering albedo (SSA), total ozone column (TOC), and columnar water vapor (WV). Under cloudy sky conditions, the main input parameters are SZA and TOC along with an optical thickness of water and ice clouds (WCOT and ICOT, respectively). The outputs of the RTM simulation are the GHI and BHI, which cover the wavelength range from 285 to 2700 nm used the SBDART radiative transfer solver [67] with pseudo-spherical approximation to generate the valid output for SZA from 0 to 90 ° . The model simulation was performed using the band parameterization method based on the correlated-K approximation [68], along with aerosol and cloud determination which was performed based on the default available aerosol models [69].
The energy generated from the solar panel is affected by the number of meteorological parameters and also by the GHI, which decomposed into BHI and diffuse horizontal irradiance (DHI) components under the following equation:
G H I = D H I + B H I × S i n ( S o l a r   e l e v a t i o n )
For the quantification of the aerosols, dust, and clouds’ effect on GHI and BHI, we additionally used the corresponding aerosol, dust, and cloud modification factors (i.e., AMF, DMF, and CMF, respectively) for more generalized results and for a better understanding of the individual and combined (aerosol and cloud) impact. The AMF, DMF, and CMF are described by the following equations:
A M F = S S R a e r o s o l / S S R n o _ a e r o s o l
D M F = S S R d u s t / S S R n o _ d u s t
C M F = S S R c l o u d / S S R n o _ c l o u d
The SSRaerosol, SSRdust, and SSRcloud correspond to the surface solar radiation (GHI and BHI) under aerosol, dust, and cloud effect, respectively, while the SSRno_aerosol, SSRno_dust, and SSRno_cloud correspond to the radiation under clean (from aerosol or dust) and clear (from clouds) sky conditions as simulated by the fast RTM [66]. We note that for the CMF the aerosol effect is activated in order to quantify the individual effect of clouds.

3.2. Financial Analysis

The financial analysis was performed by simulating a hypothetical scenario of a PV and a CSP system with nominal power of 1 MW assumed to be installed in CGHR following the methodology described in [70]. During the estimation of PV energy production, we assumed that the PV material (which is silicon polycrystalline) has an efficiency of 16% and a shadowing effect of 4% from the surroundings [71]. Therefore, the remaining efficiency of 80% has been converted to PV output energy based on the nominal power and electricity converter technology and AC/DC efficiency. To perform the financial analysis of PV and CSP energy production, there is a need for electricity generation price in INR per kWh (1 INR ≈ 0.013 USD). The PV as well as the CSP output energy is converted into the price of electricity as follows the earlier energy by [70,71]:
R e v e n u e   g e n e r a t e d   ( I N R ) = E n e r g y   p r o d u c e d   ( k W h ) × P r i c e   o f   e l e c t r i c i t y   ( I N R k W h )
The price of electricity used in the above equation (Equation (2)) taken as 2.9 INR/kWh for India [72] for projects up to 1 MW and hence the financial losses are calculated as:
F L = ( E P M a x E P a c t u a l ) × ( P r i c e   o f   e l e c t r i c i t y )
The FL is the financial loss in INR, E P M a x is the maximum energy produced in kWh by assuming the atmosphere to be clean/clear i.e., the AOD and COD must be zero and the E P a c t u a l is the actual energy produced by assuming the AOD for clear sky conditions and COD for cloudy conditions.

4. Results and Discussion

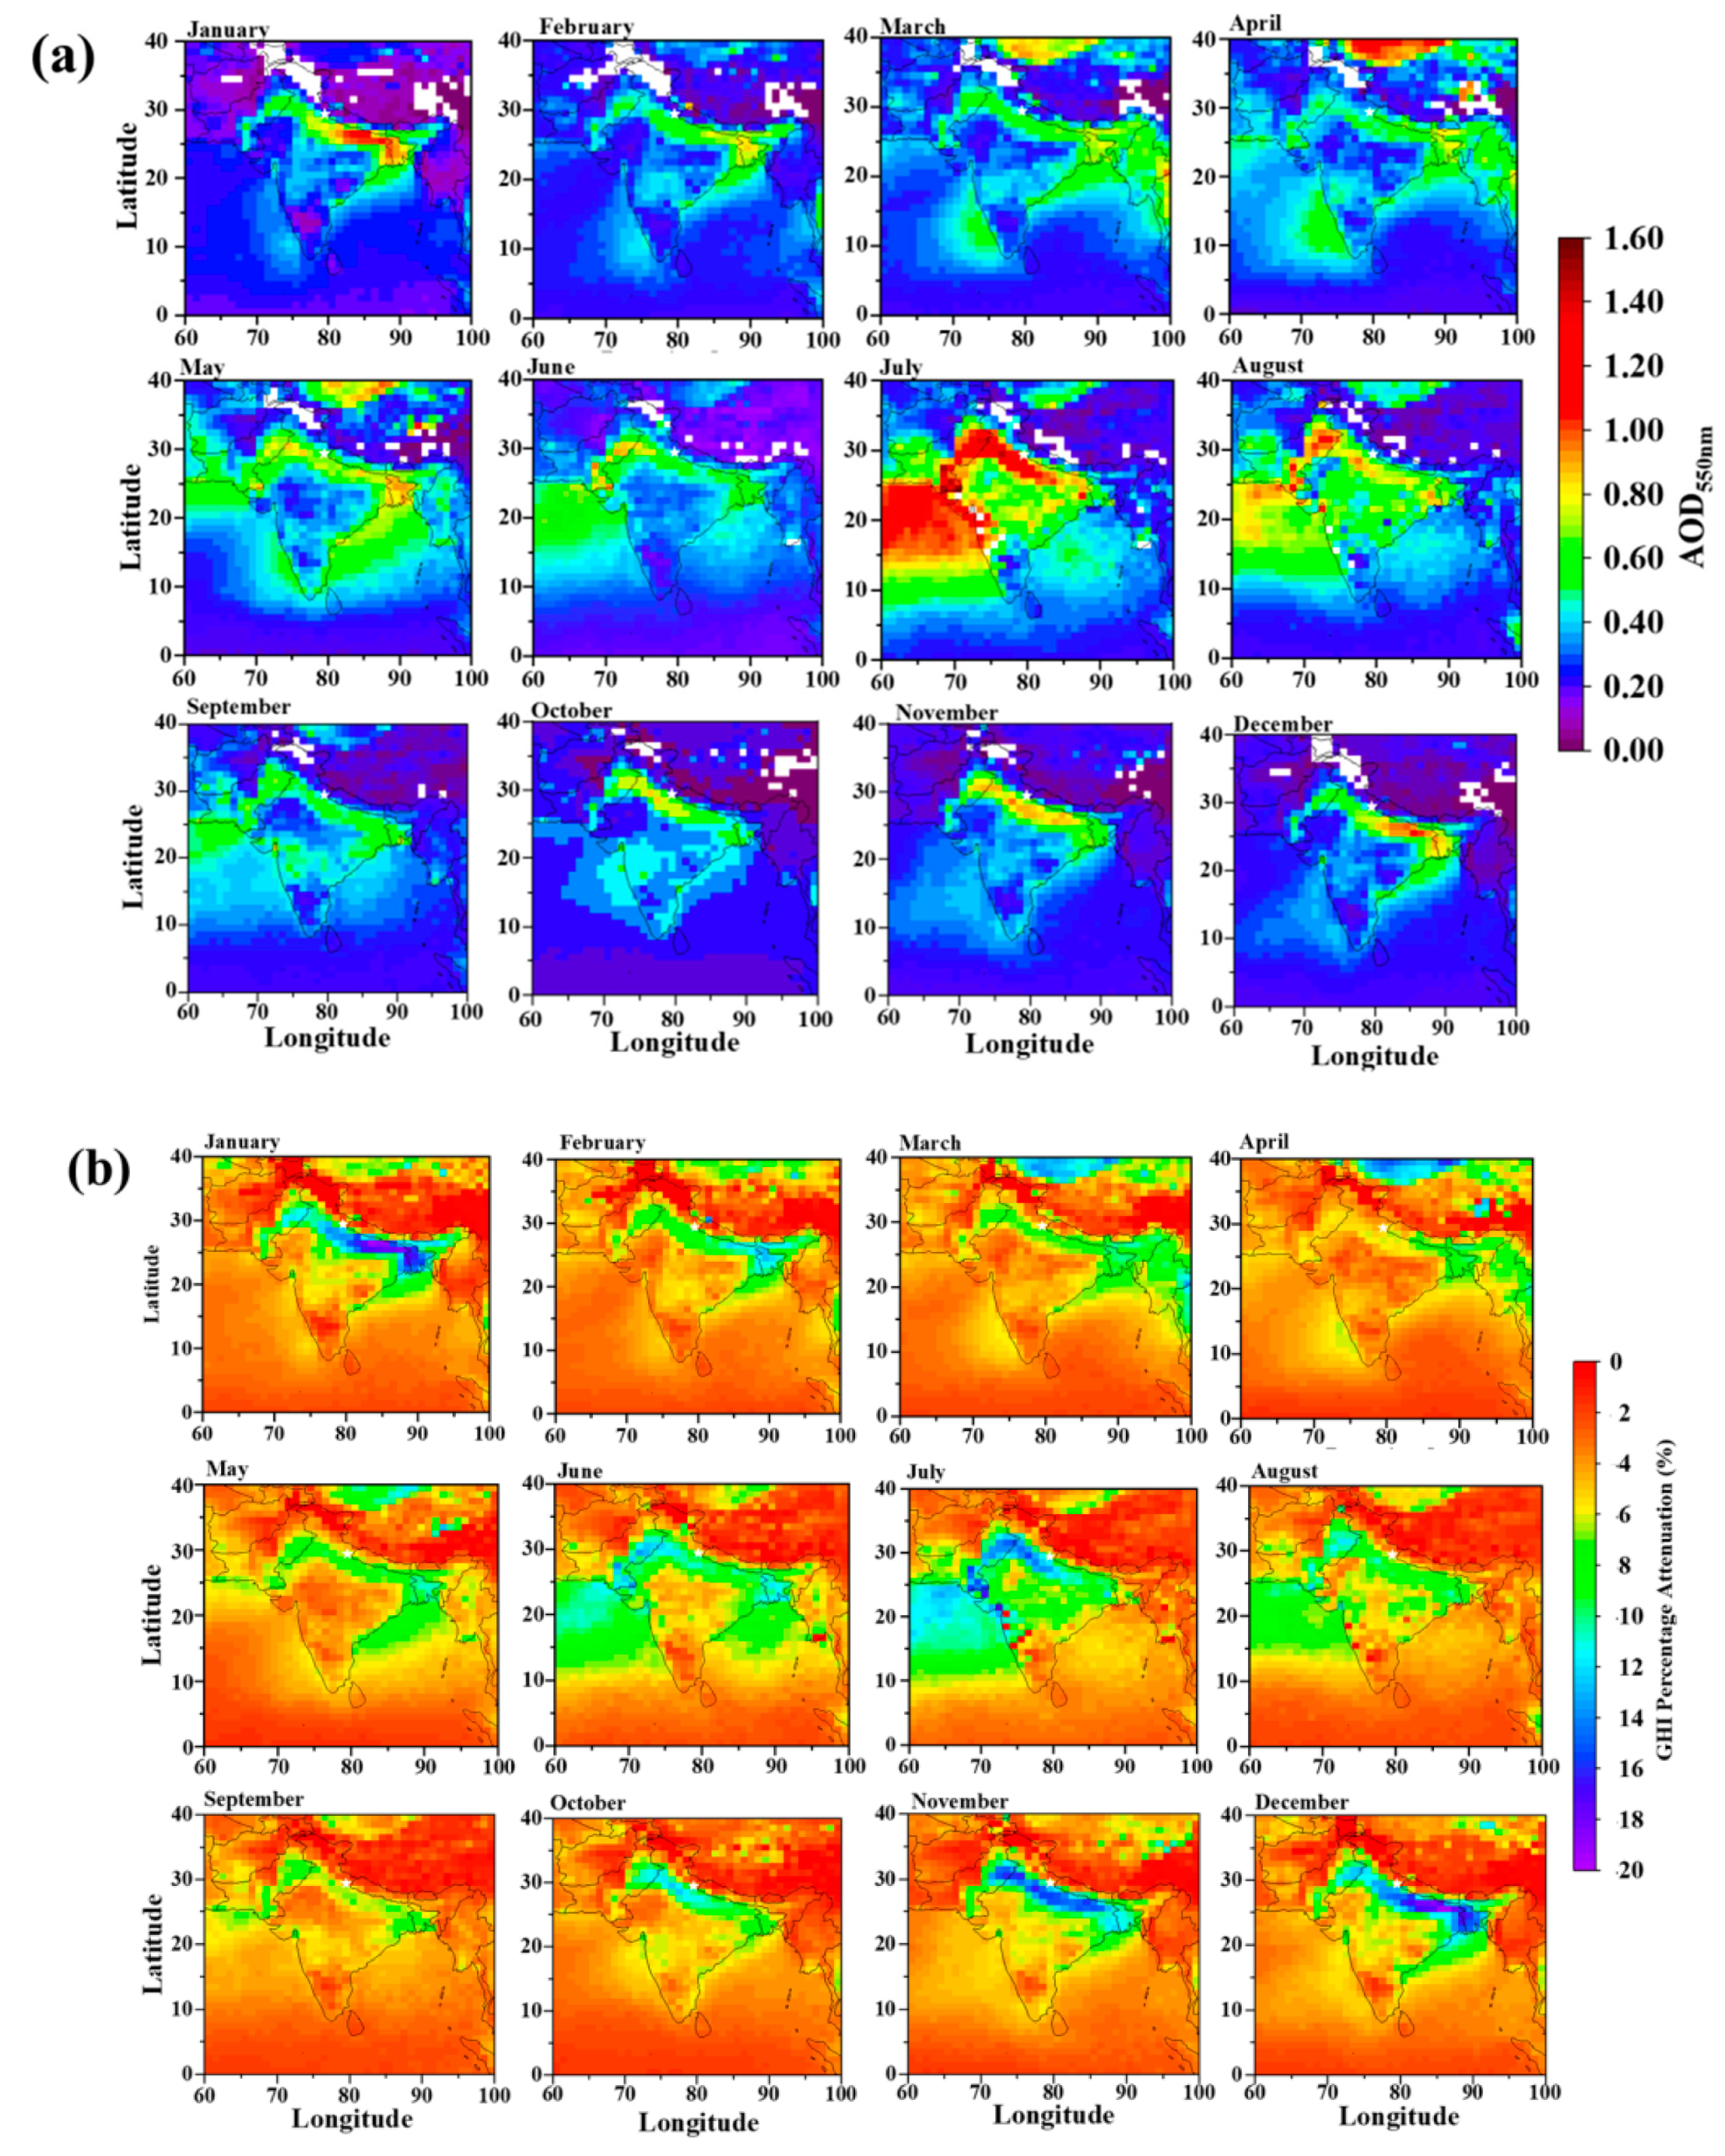
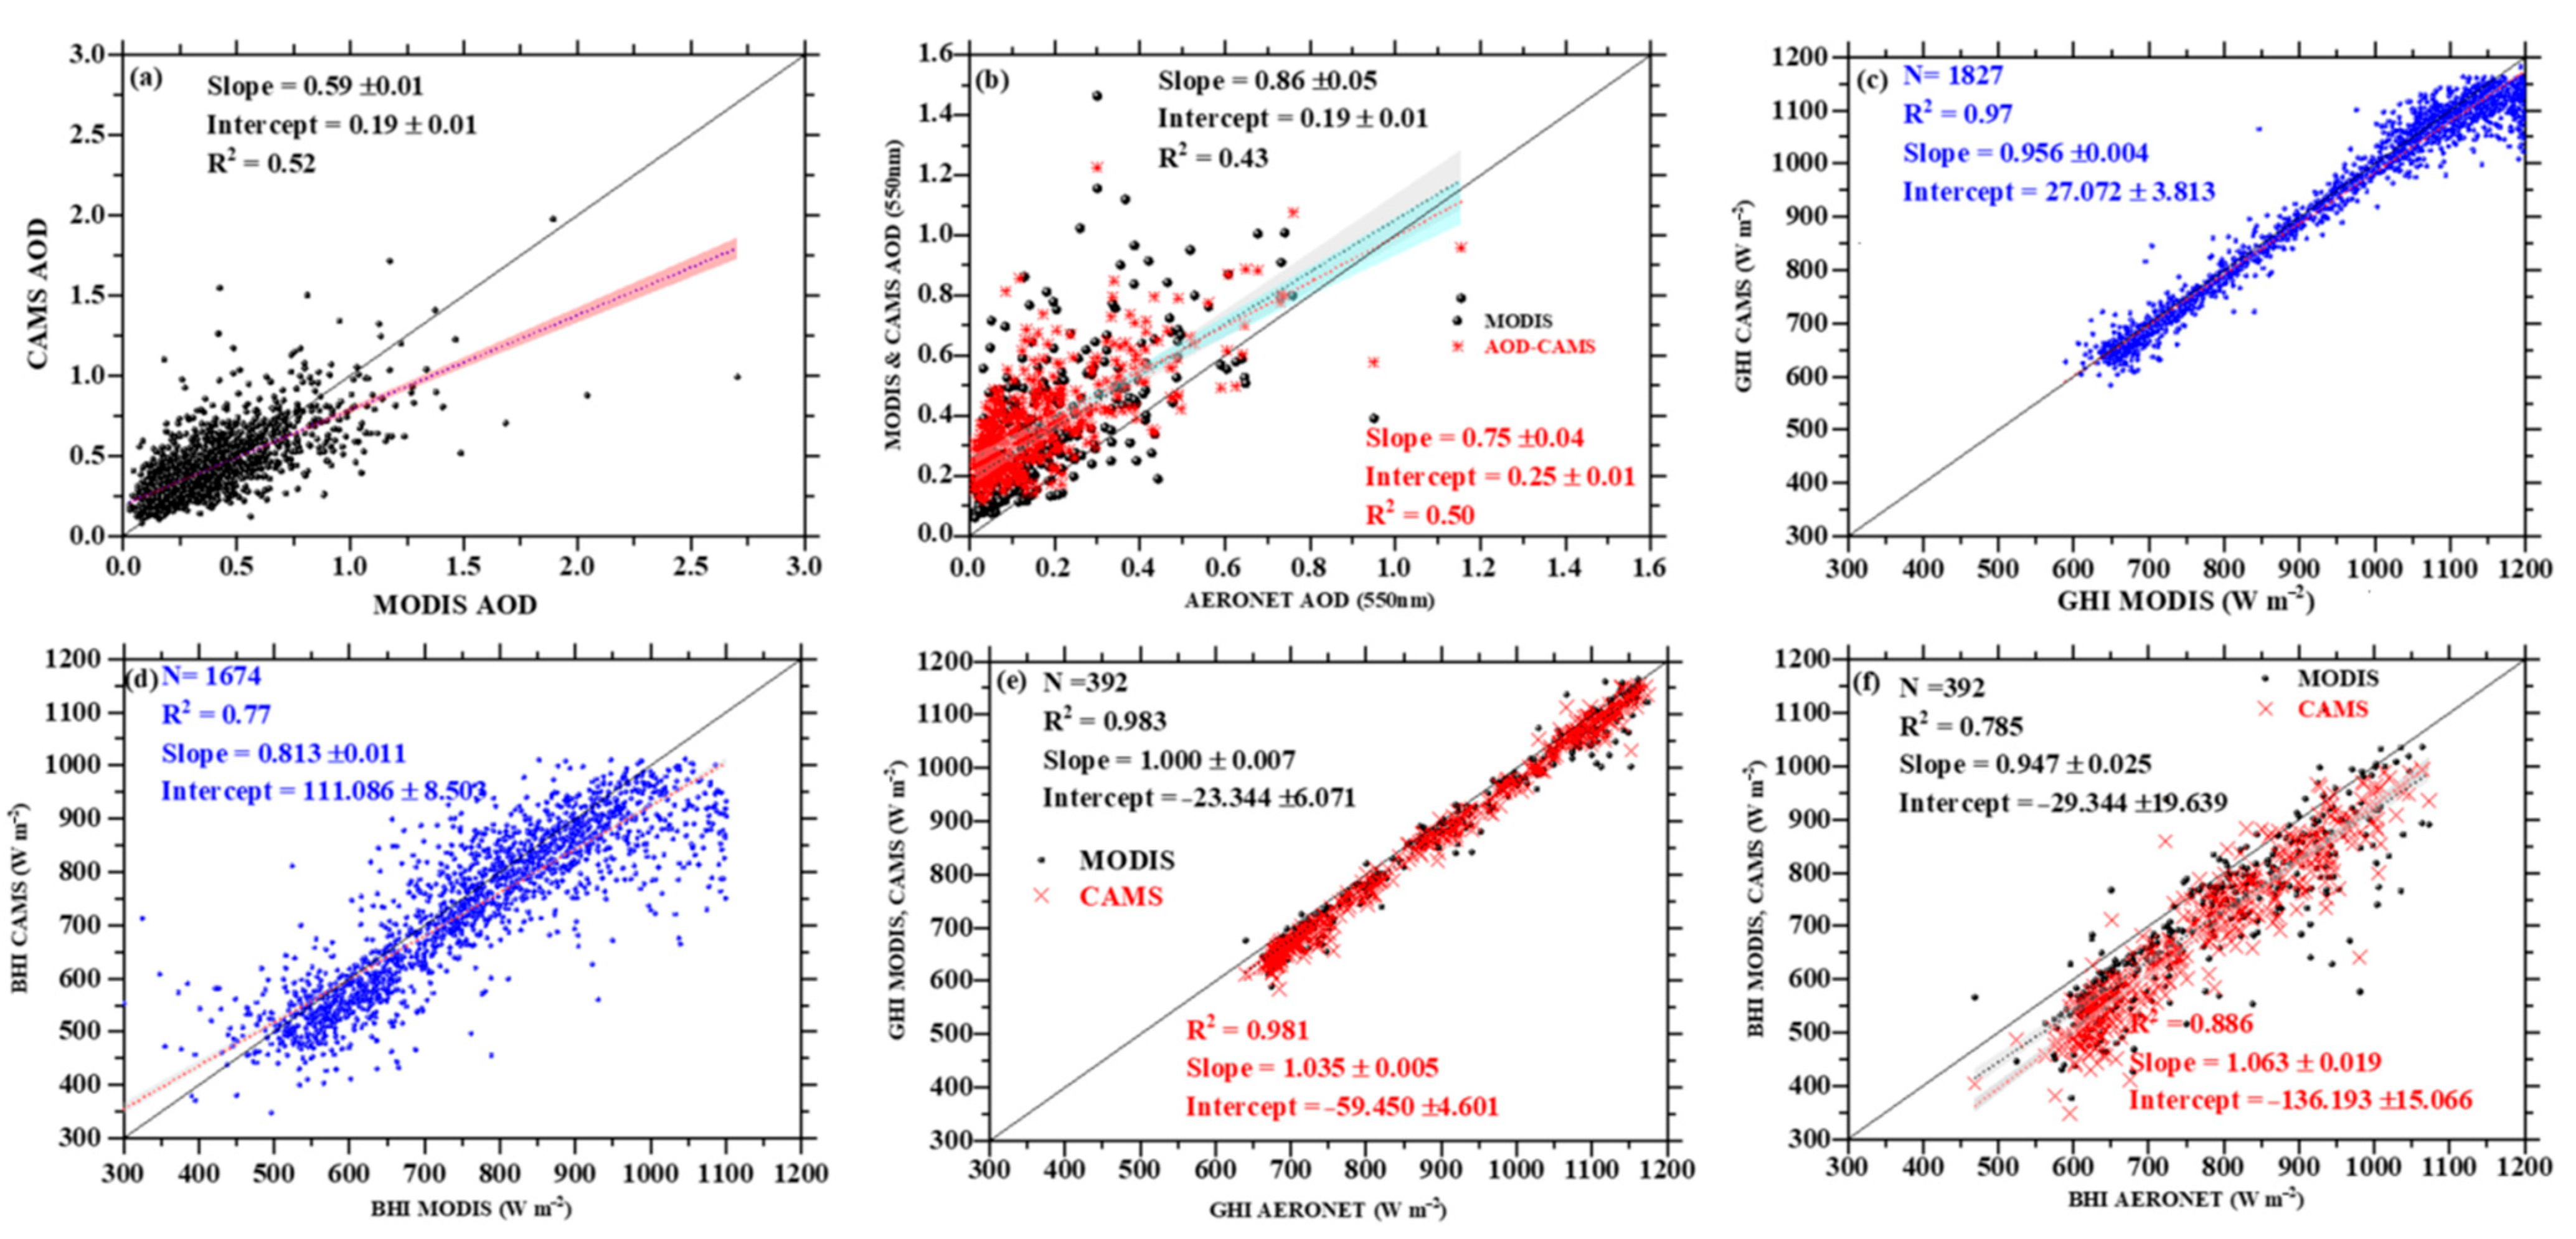
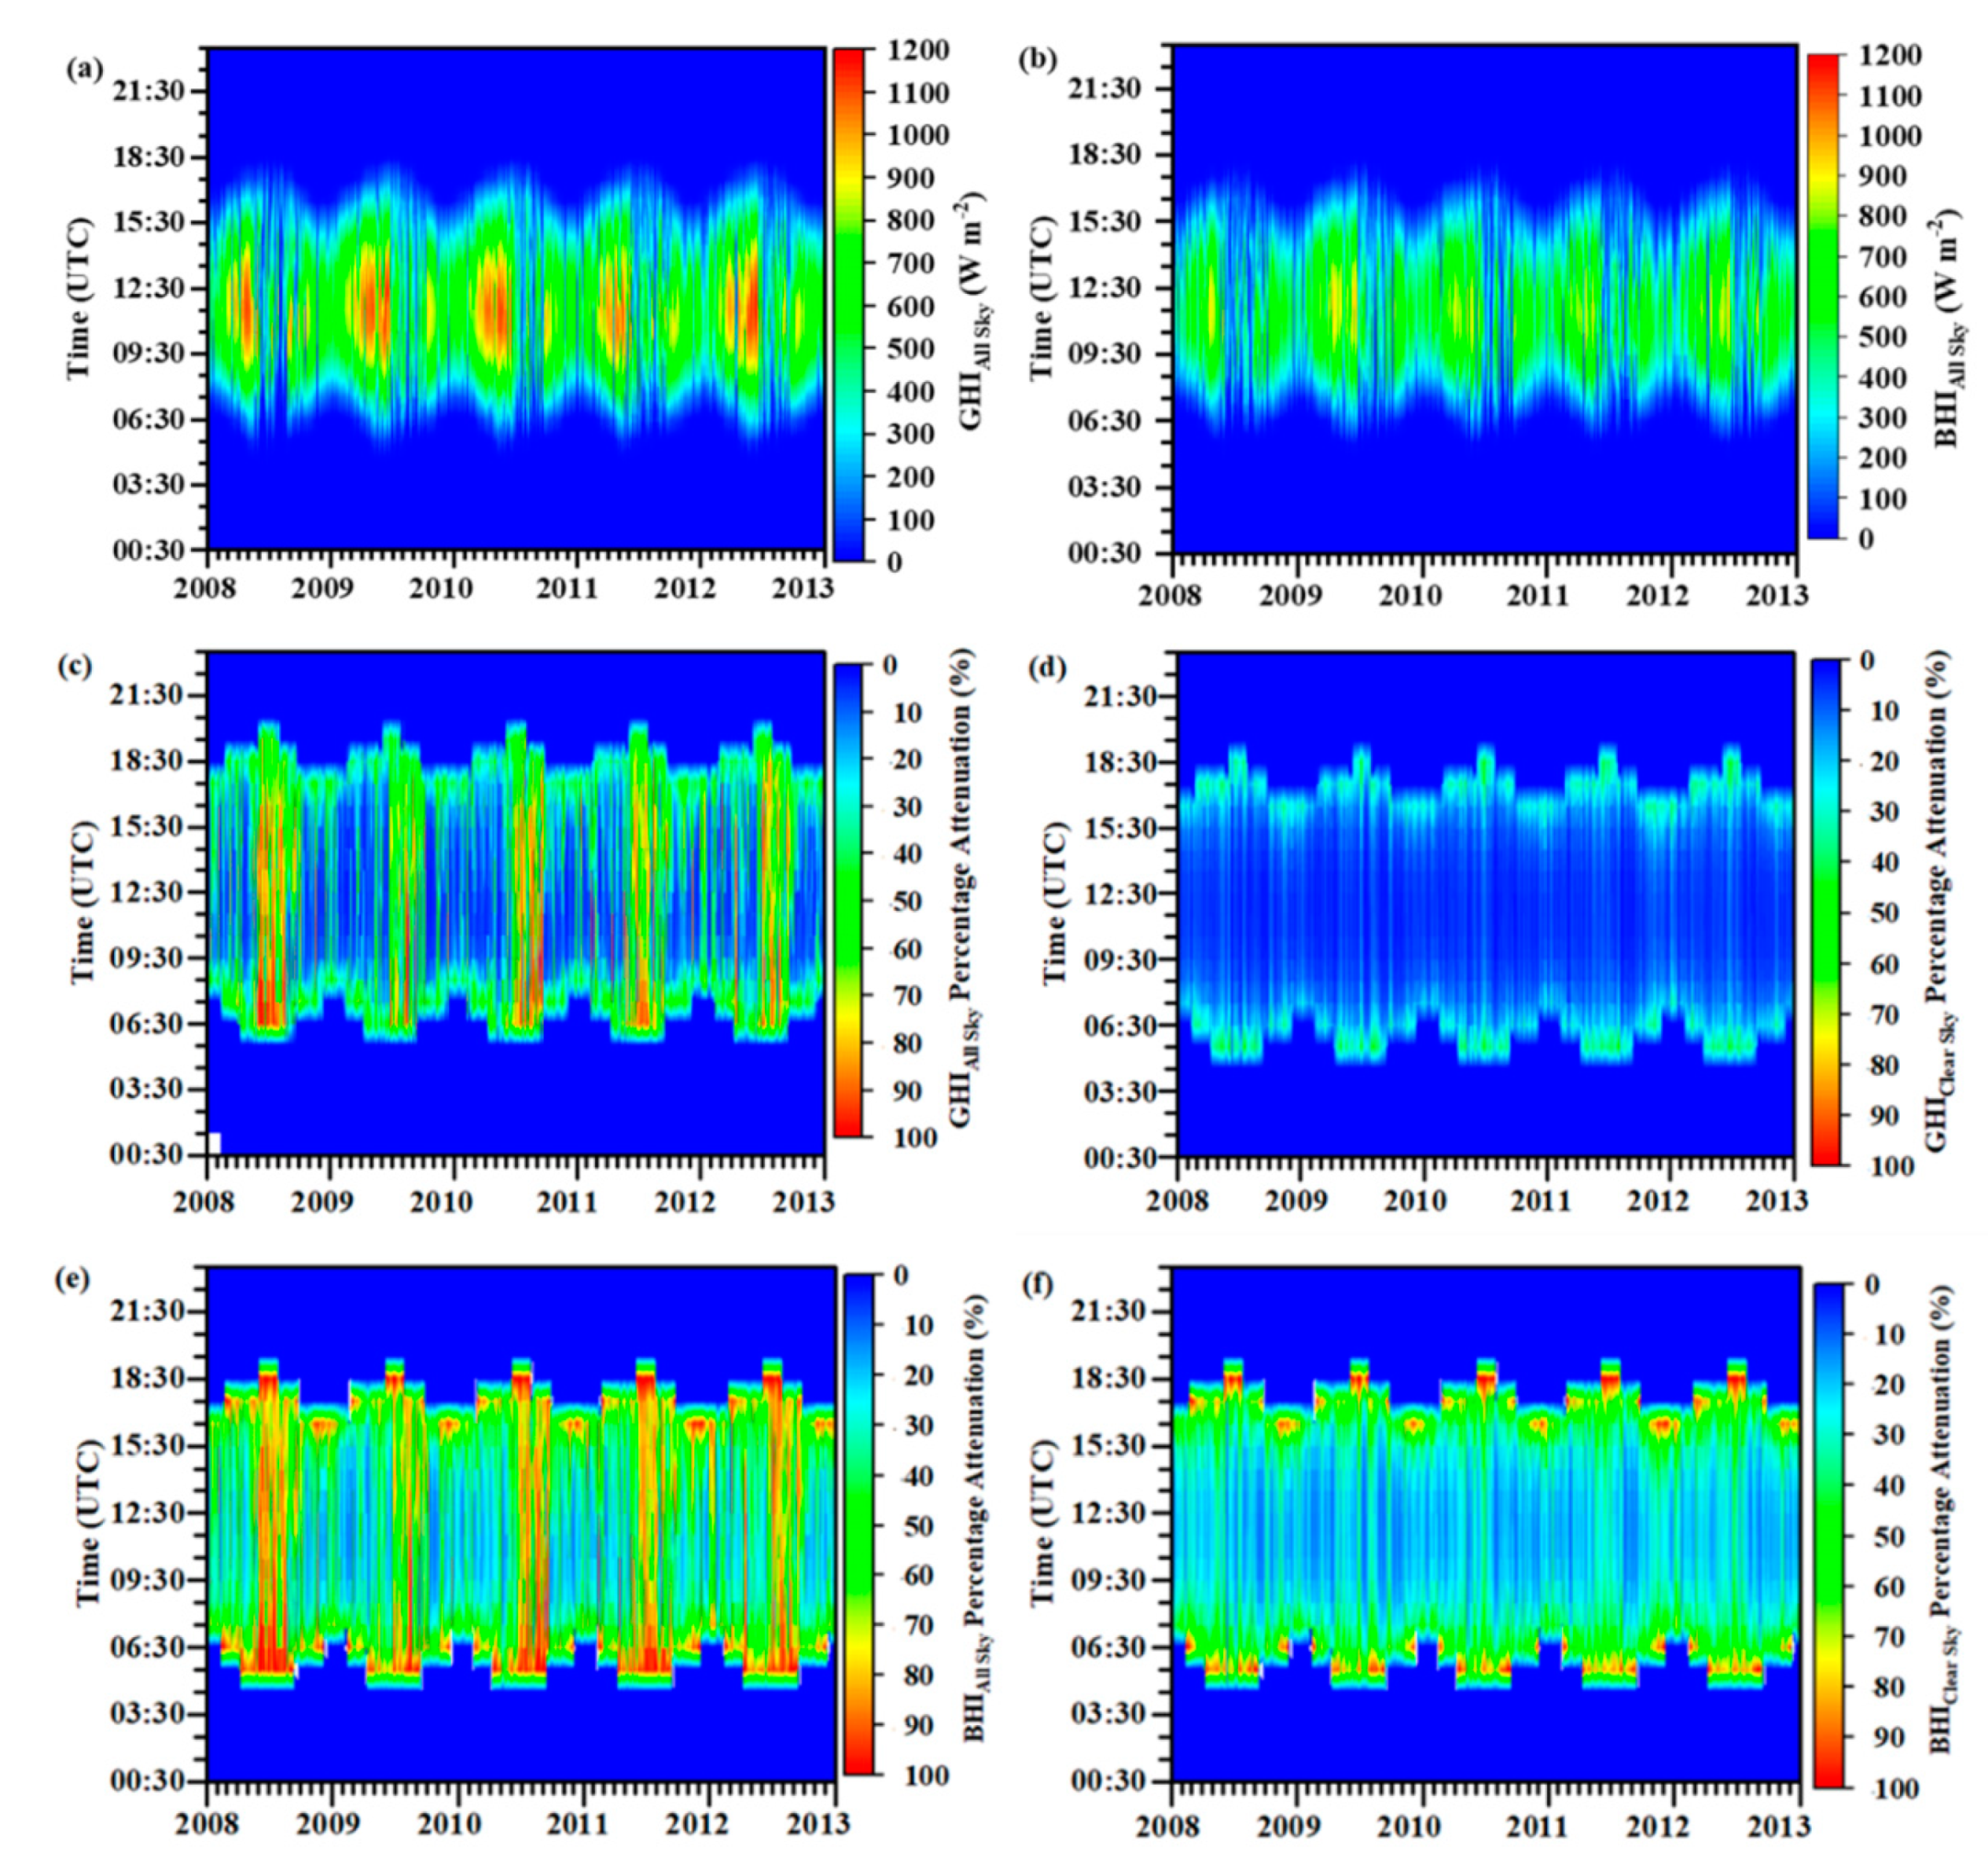
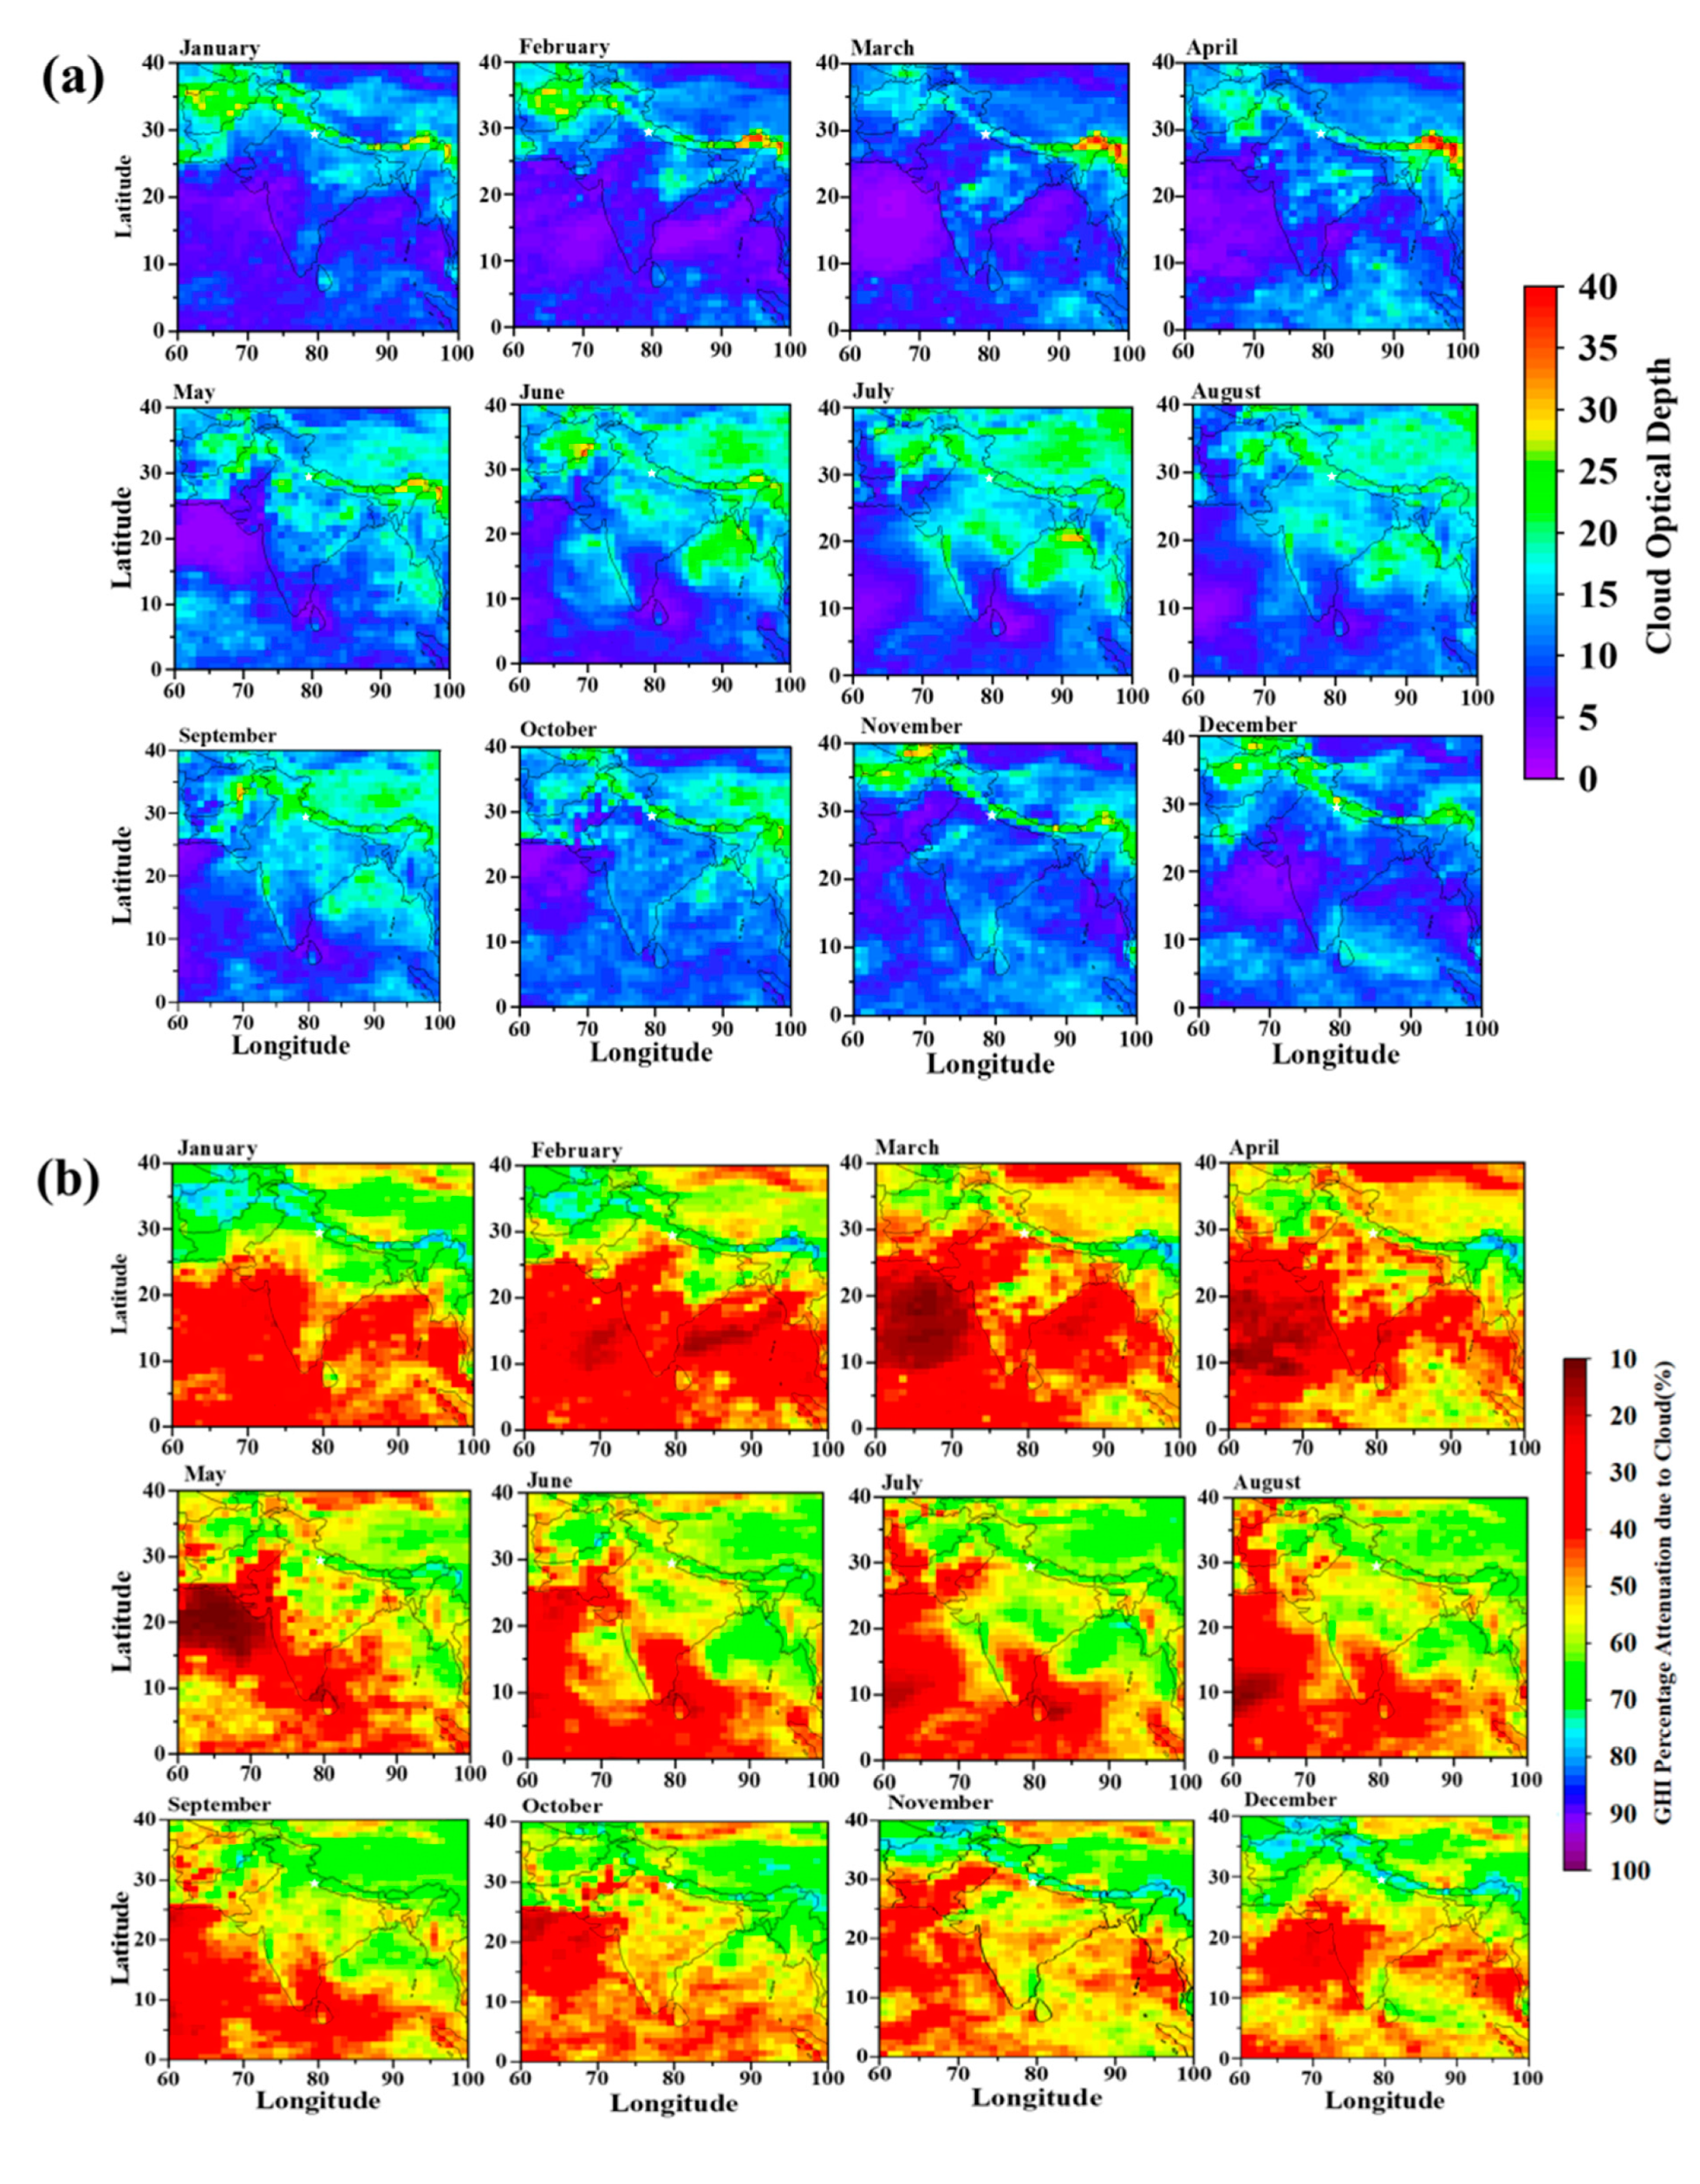
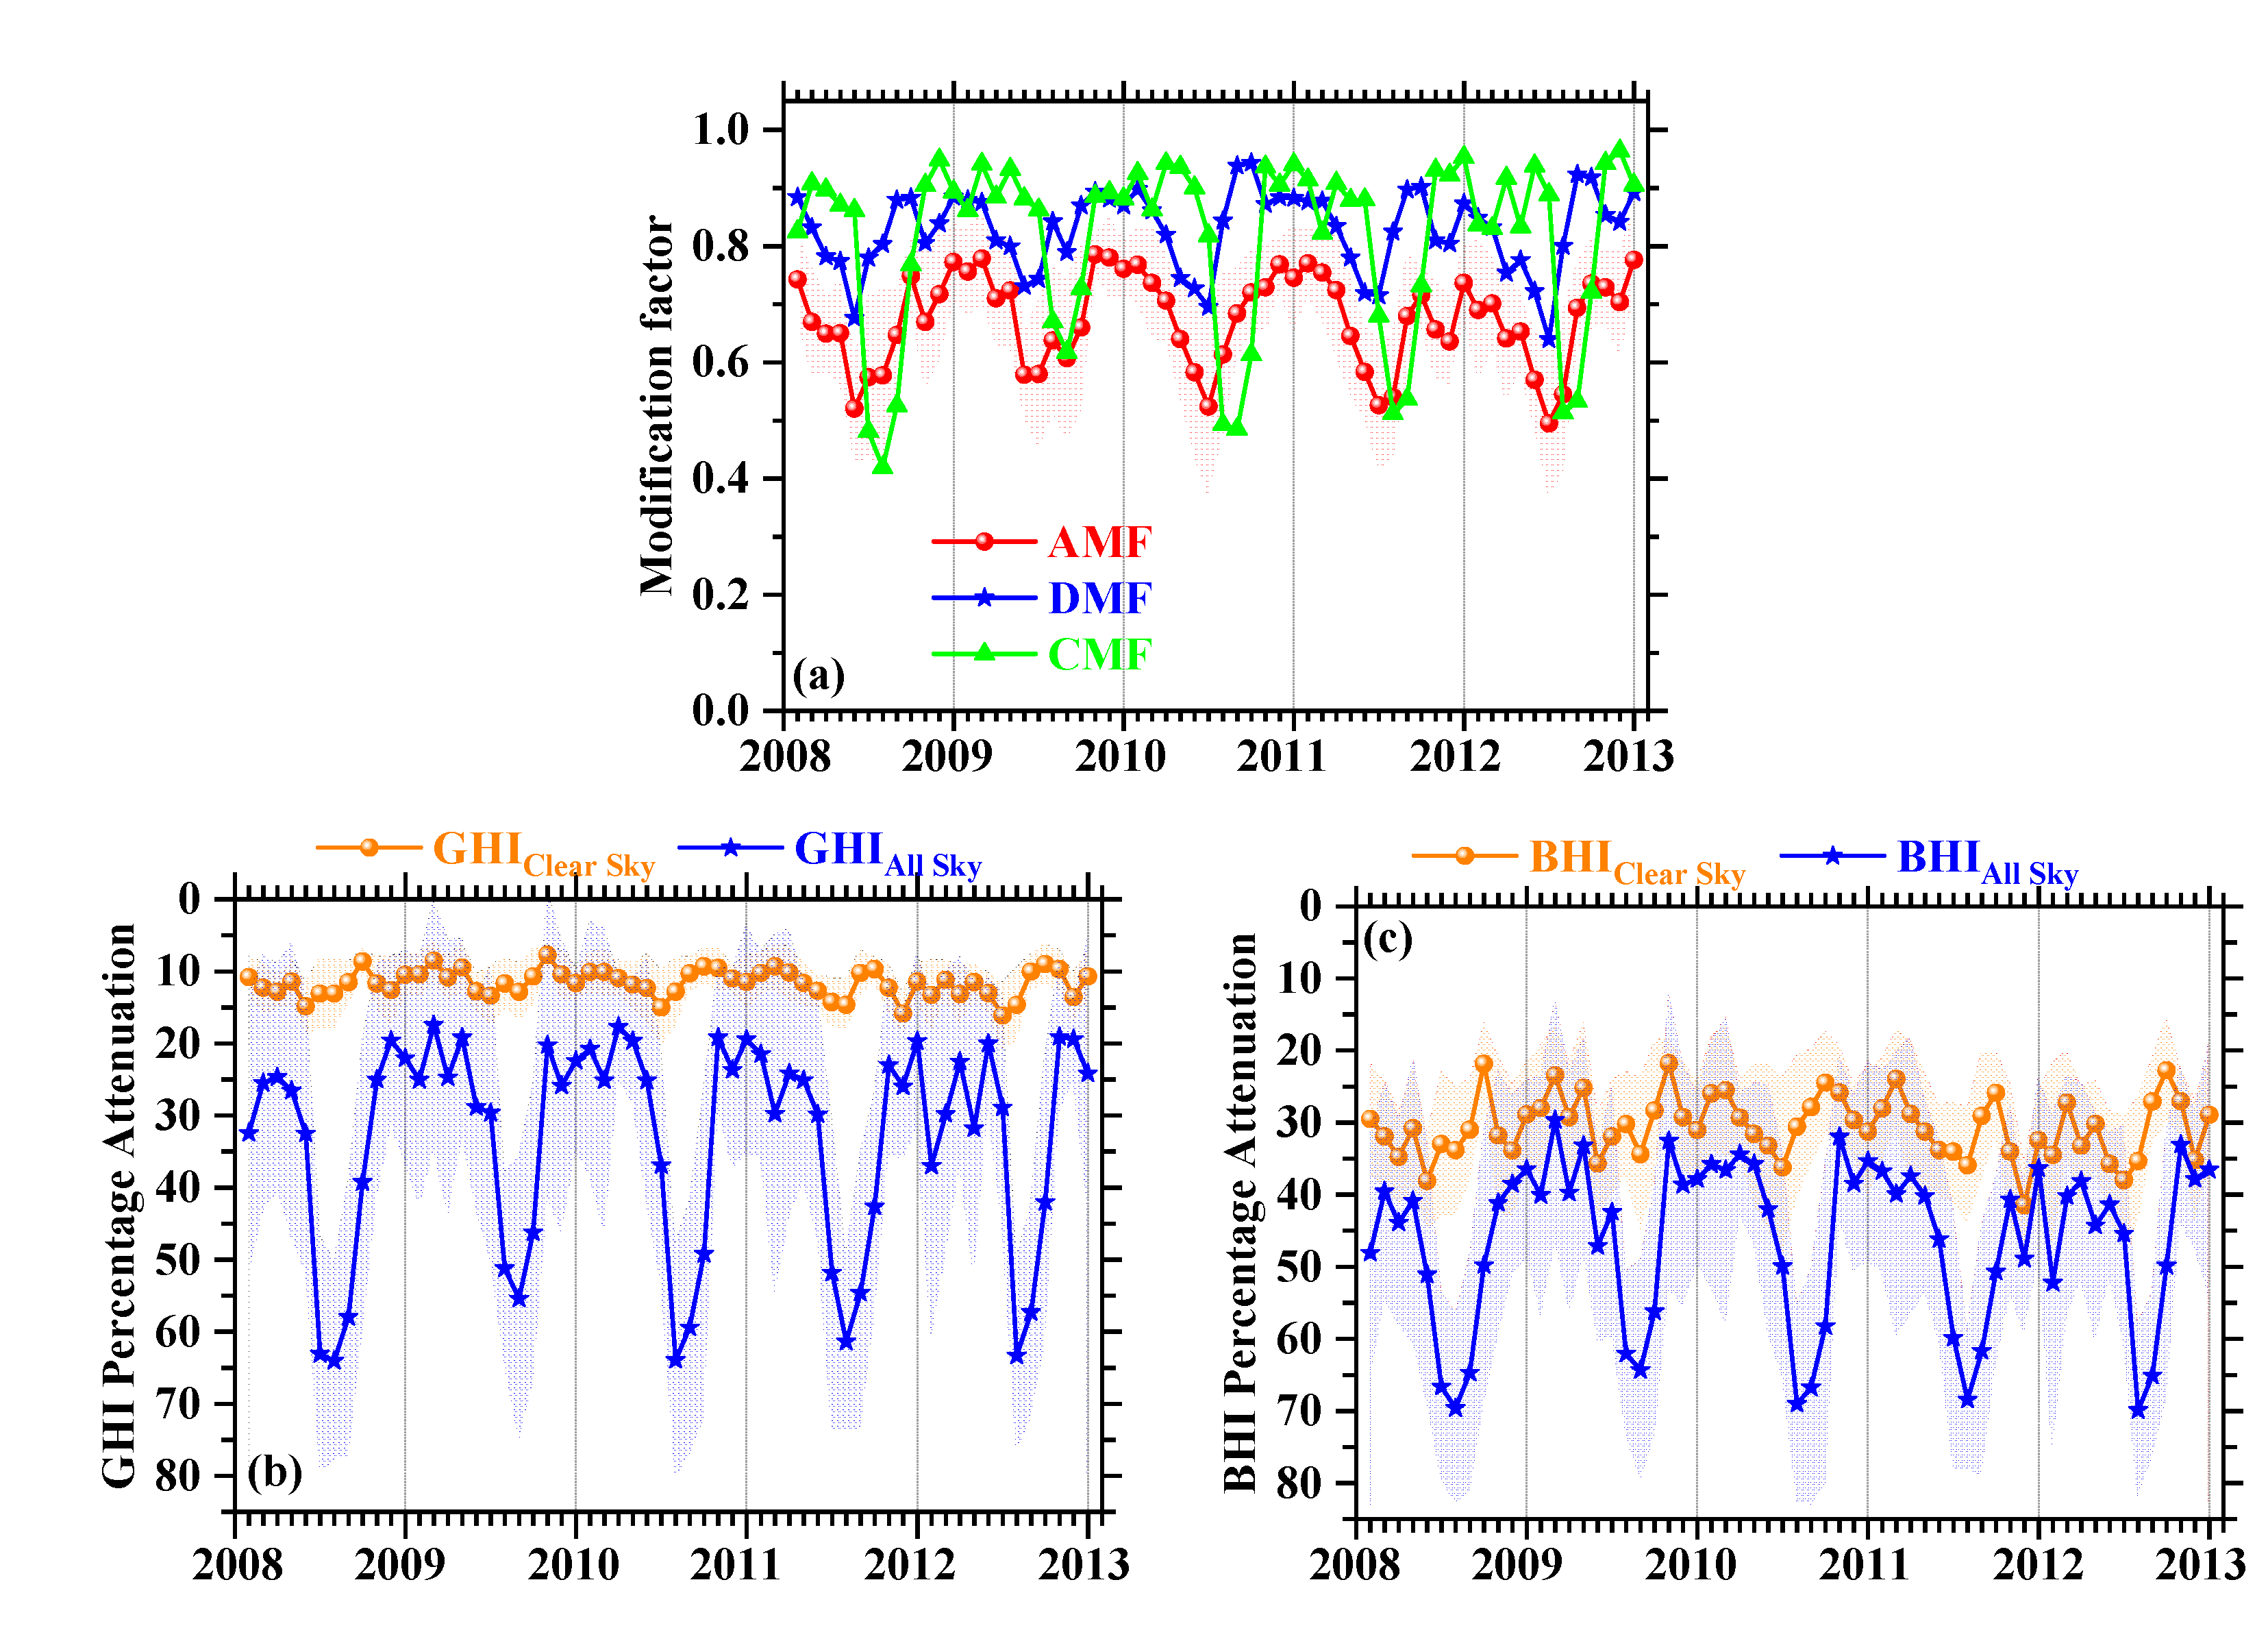
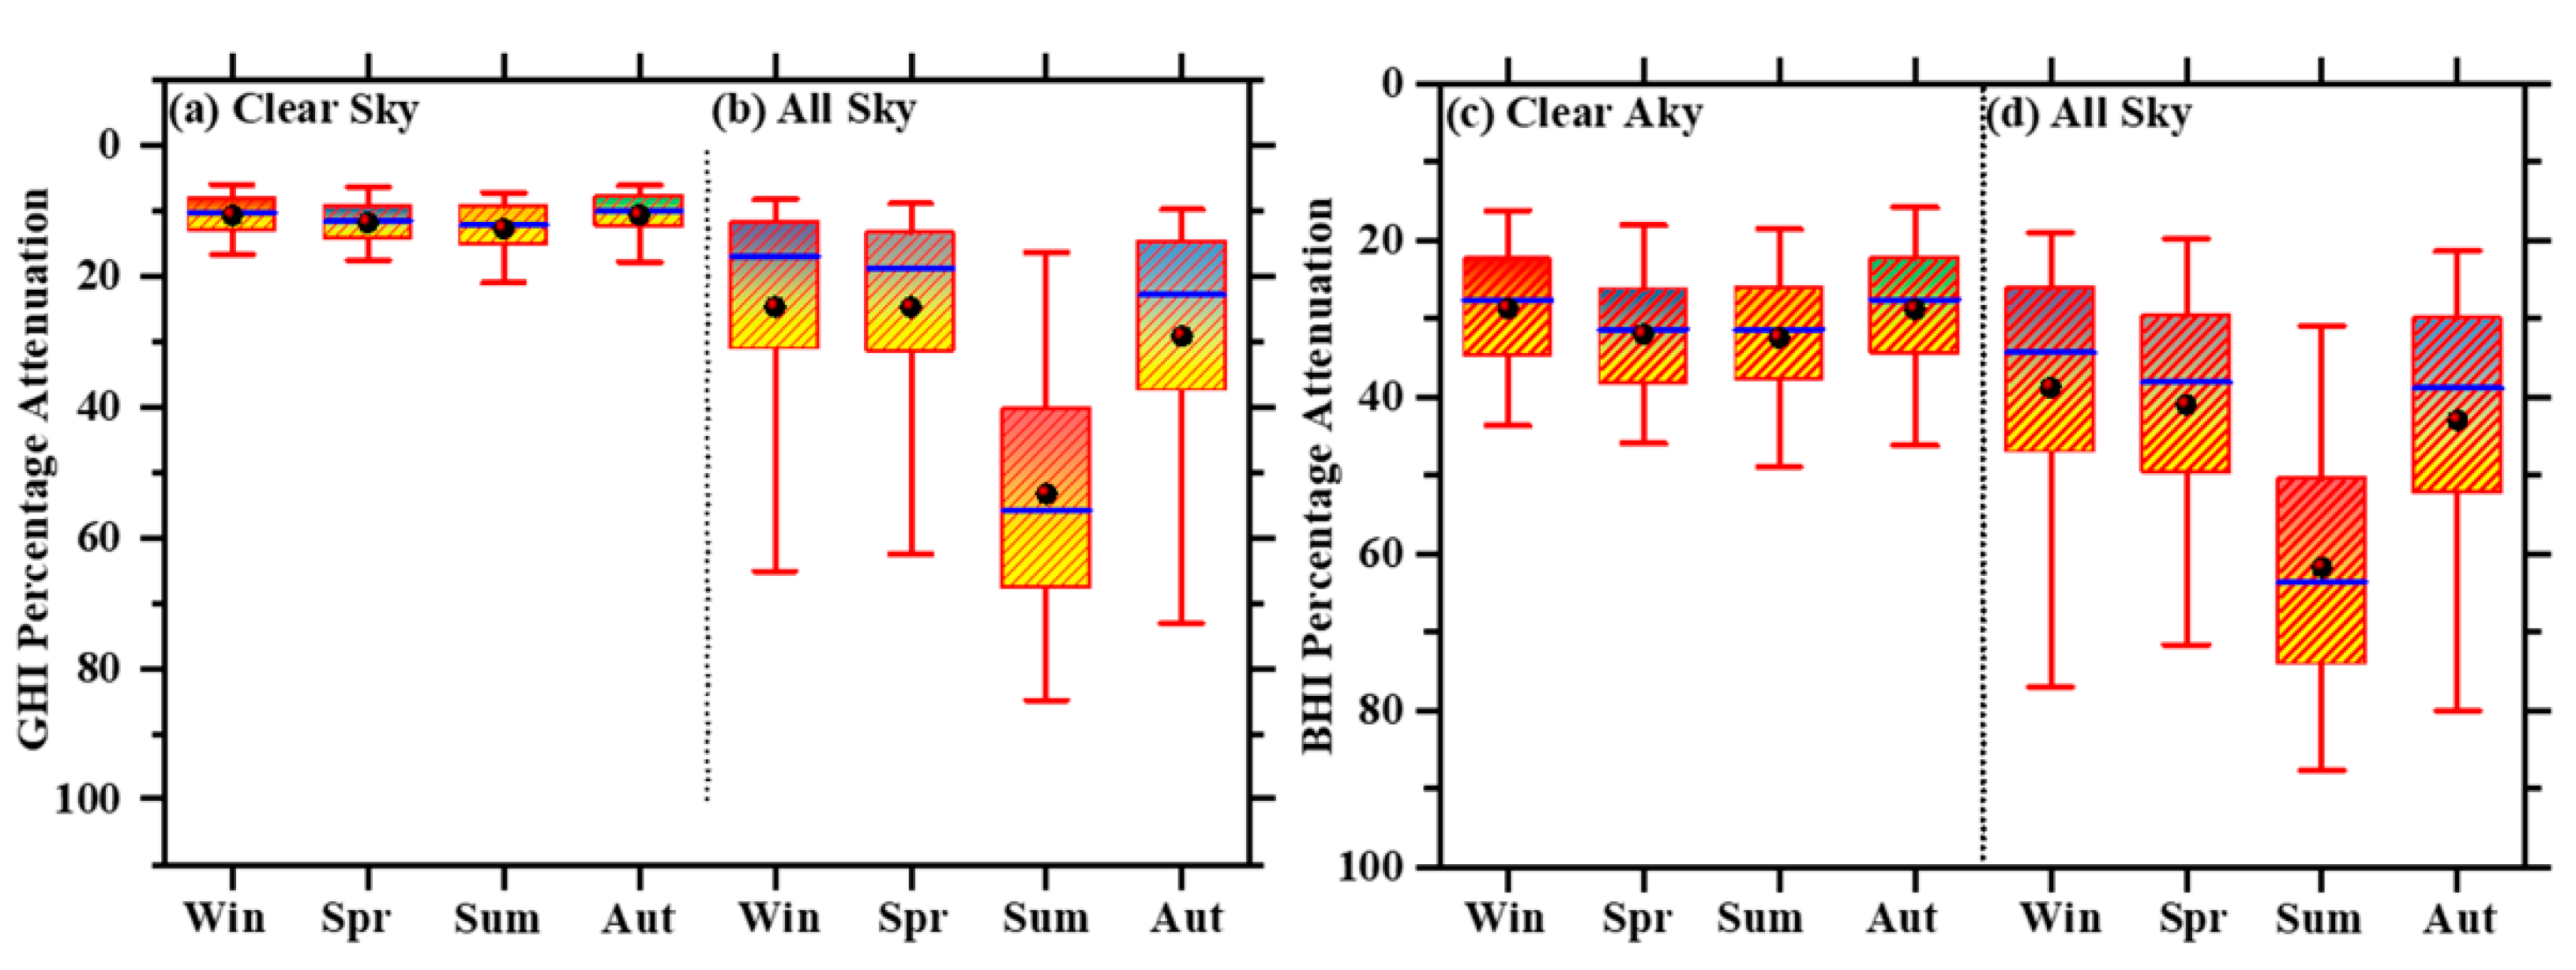
4.1. Clear-Sky Effect on Solar Energy

Since aerosol absorbs and scatters the incoming solar irradiance in the visible (0.38–0.78 µm) spectrum, the solar energy which strikes the solar cell is subjected to loss in the absorption/reflection of the incoming irradiance. 30% of the total energy coming from the sun is either reflected or absorbed by the clouds, oceans, and landmasses [73]. The diffused solar radiation (attributed due to the absorption, reflection, or refraction) produced a lower percentage of photo-electricity than the direct radiation [74]. Therefore, it is desirable to harness the remaining 70% of solar energy, subject to different sky conditions.
Figure 2a shows the five-year (2008–2012) climatological mean AOD at 550 nm over the Indian subcontinent using the dark target and deep blue combined product of MODIS (Terra and Aqua). The AOD was found to range from 0.01 to 1.65, indicating the strong presence of aerosols throughout the study period. The higher AOD can be attributed to the significant transport of dust from the western region [17,32,33,75], which is the largest arid region extending from the Thar Desert to the Saharan Desert, located in sub-tropical hot climatic conditions. The higher AOD during the summer (July–August) months can be explained by moderate BHI values. However, high BHI during November–December is somewhat strange when considering the moderate AOD values during the same time. Similar to aerosols, patterns are observed in the GHI and BHI percentage attenuations (Figure 2b,c). Here, the percentage attenuation was estimated by the RTM calculations using the AOD as input and then compared with the clean and clear sky conditions with aerosols set to zero. The range of GHI percentage attenuation was found to be 0 to 14%, whereas the corresponding BHI percentage attenuation values vary from 0 to 20%. These results are quite similar to the previous results which are comparable with a similar approach [70,71]. The results are quite important data for irradiance attenuation over the Indian subcontinent region [76,77,78]. The climatological monthly mean GHI over the Indian subcontinent is dominated from 16–20% as seen in Figure 2b, indicating that the high AOD during the months of July-August can be explained by moderate attenuation of BHI values (12–15%) over Nainital. However, the high attenuation in BHI values (14–16%) during November-December over the study region is somewhat strange when considering the moderate AOD values during the same time, as shown in Figure 2a,c. There are many studies demonstrating an impact of aerosols on the attenuation of solar irradiance over South Asia by 10–25% [79,80].
The aerosol concentrations in northern India are not only from wind-blown dust but also from anthropogenic sources such as biofuel, burning of biomass, and fossil fuel combustion that emit organic and elemental carbon [81,82]. It is reported that fine particulate matter (PM2.5) in northern India is dominated by non-dust species which often exceed the minimum health standard limits given by the WMO [83].
Figure 3 shows the seasonal frequency histogram of daily CAMS AOD at 550 nm, GHI, and BHI during Figure 3a winter (December–January–February), Figure 3b spring (March–April–May), Figure 3c summer (June–July–August), and Figure 3d autumn (September–October–November). During winter, ~70% of the AOD values fall in the range of 0.0 to 0.2, whereas during spring and summer, ~40–50% of the AOD values fall in the range from 0.0 to 0.4. Similar frequency distribution of spectral AOD obtained from the Multi-Wavelength Solar Radiometer (MWR) is shown in an earlier paper [45]. Similar to AOD, the peak frequency (40% & ~35%) of GHI and BHI are 4000 Wh m−2 and 3000 Wh m−2, respectively, during winter. A high value (~8000 Wh m−2, and 5000 Wh m−2) of GHI and BHI with a frequency of 25–40% is recorded for the spring and summer seasons (See Figure 3), whereas the frequency of occurrence of high values of GHI and BHI are lower in the autumn season. The high frequency of AOD (AOD less than 0.5) is associated with low BHI and GHI values (less than 3000 Wh m−2) during winter, while the low frequency of AOD (AOD more than 0.5) is associated with high BHI and GHI values (more than 3000 Wh m−2).
The validation of various simulated parameters such as AOD, GHI, and BHI are examined with the observation data from MODIS and AERONET Sun Photometer data for the study region. It is found that the observed AOD from MODIS and AERONET data show an almost similar coefficient of determination (R2 = 0.43–0.52) with the simulated AOD data using CAMS as shown in Figure 4a,b. Additionally, Figure 4 shows a 95% confidence band, intercept of the linear regression. On the other hand, the simulated GHI and BHI data show good agreement with the data obtained from MODIS and with the coefficient of determination 0.77 to 0.97 as shown in Figure 4c–f.
Figure 5, shows the scatter plots obtained from the multi-sensor aerosol products sampling system [84] (MAPSS) of the MODIS satellite AOD at 550 nm compared to the coincident ground-based AOD measured by CIMEL Sun Photometer AERONET [85]. These data points are free from outlier (as the percentage of the outliers represent less than 0.5% of the data) spanning the 5 years of 2006–2010. The spanning of 5 years includes ~55 K coincident values together with the ~168 values recorded locally at the Nainital site. The coefficient of determination between the MODIS satellite and the ground-based AOD are 0.81 and 0.86 (see Figure 5) along with low root mean squared errors of 0.09 and 0.10 for global and Nainital, respectively. In both cases, the high frequency of occurrence ranges from 0 ≤ AOD ≤ 0.4, which is similar to other studies over Europe [28] and India [86].

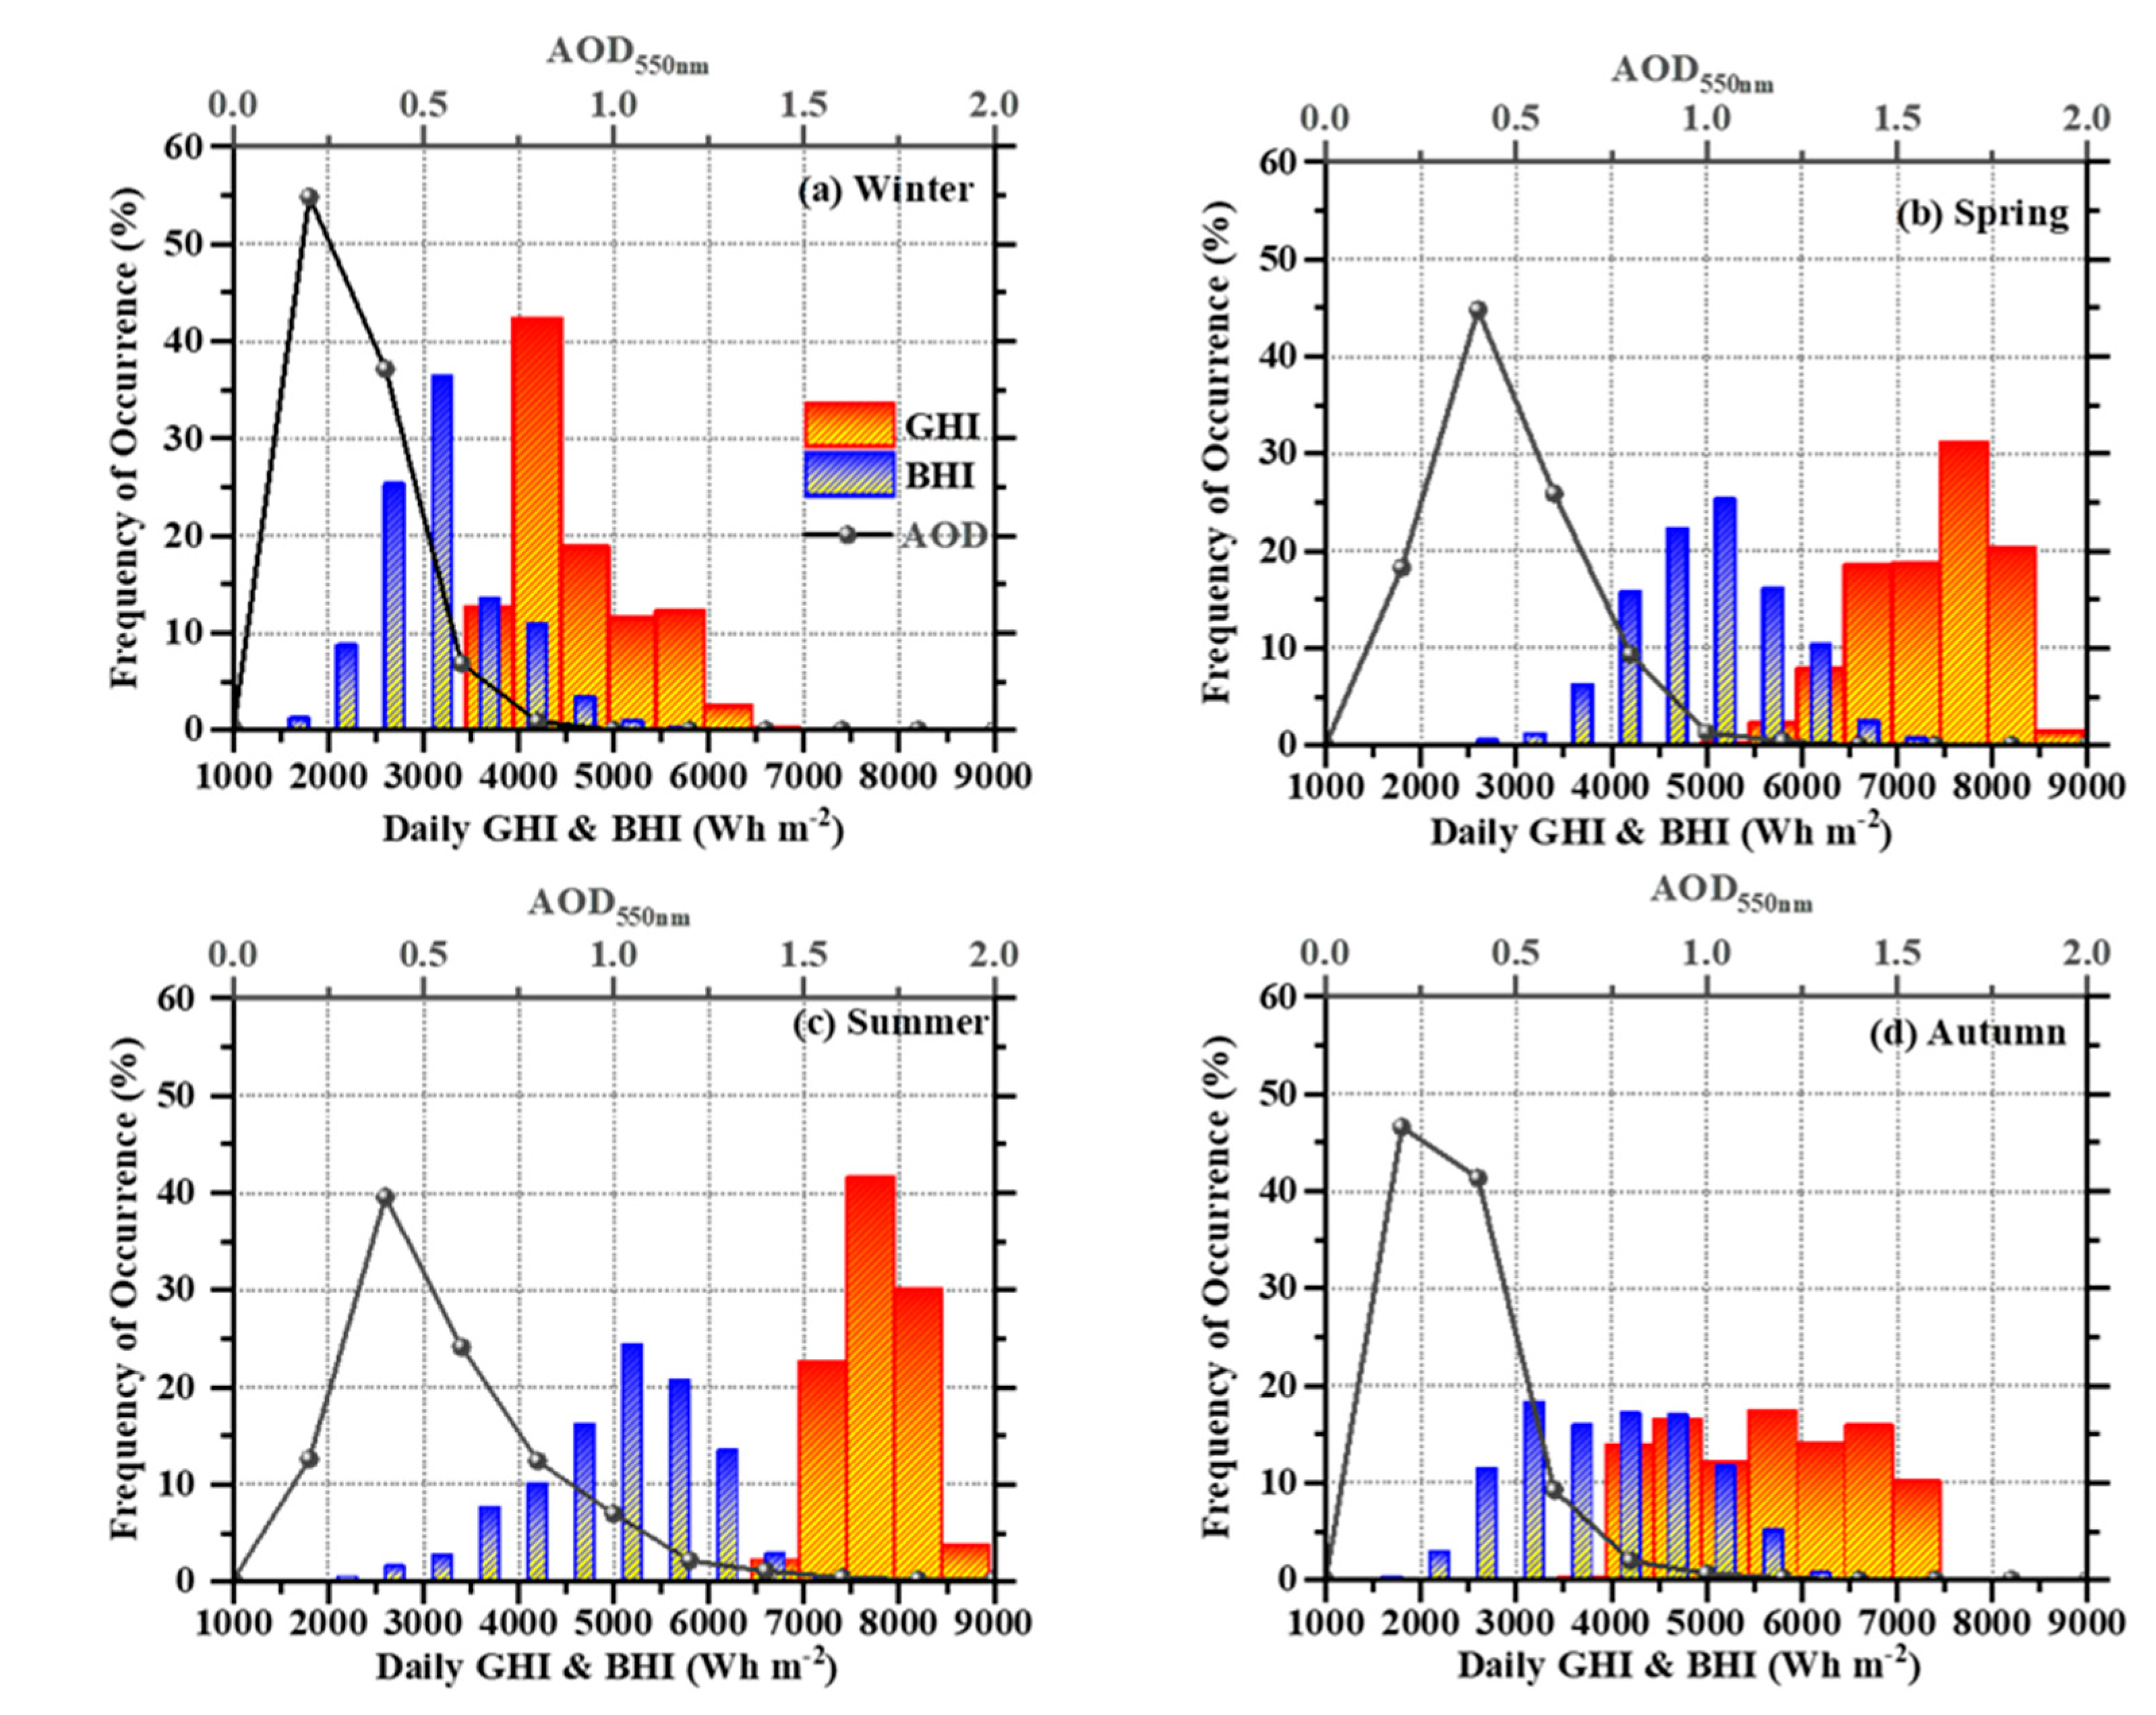
4.2. All-Sky Effect on Solar Energy

Figure 6 shows, in the form of contour plots, the GHI, BHI, and percentage attenuation under all sky and clear sky conditions in Nainital during the period under consideration, i.e., 2008–2012. The peaks of GHI and BHI, around 300–1100 W m−2 and 300–800 W m−2, respectively, are observed during 3–8 UTC for the multi-year data. On the other hand, the seasonal peak occurred during spring-summer with a minimum during autumn-winter seasons as seen in Figure 6. However, the summer season is also affected by the Indian summer monsoon clouds as presented in [86].
Figure 7a presents the COT climatology as calculated by the MSG datasets for the region of India. The summer months are followed by the monsoon clouds and the subsequent high COT average values. The autumn-winter months are characterized by less COT (Figure 7a). The cloud effect on GHI and BHI in terms of percentage attenuation was depicted in Figure 7b,c, respectively. The BHI presents higher attenuation levels than GHI especially in the northern part of India as a results of the Himalayan subtropical highland climate and the subsequent predominance of clouds. The higher COT during the monsoon period is also reflected in the higher attenuation levels of both GHI and BHI, indicating the necessity for such climatological analysis for better solar planning and management taking into account the impact of aerosol and cloud.
Figure 8a presents the monthly average fluctuation of the AMF, DMF, and CMF in Nainital as well as the percentage attenuation of GHI in Figure 8b and BHI in Figure 8c under all sky and clear sky conditions. The low values of AMF and DMF are a result of the high values of AOD which are observed during the spring and summer months. These values could be attributed to the transport of anthropogenic aerosols from the adjacent IGP region and dust from the west Asian region [17,52,75]. In particular, the low values of DMF are visible during dust storms where the CAMS AOD is able to reach values of up to 1.5 to 2. The DMF is significantly decreased and reaches up to 0.3 during the dust episodes. The variation of AOD is quite similar to the earlier studies reported by several investigators [41,43]. The CMF values are found to be mostly within the range of 0.6 to 0.9 with a lot of fluctuation around the monsoon months every year that corresponds to heavy cloud cover over the region during the monsoon season. The overall percentage attenuation of GHI is ~10% with a certain peak due to some dust storms. On the other hand, the percentage attenuation of BHI is comparable to ~30% in most cases. The average GHI percentage attenuation due to the presence of clouds shows high percentage variation from about 20–65%, and the corresponding BHI percentage attenuation is found to vary from again 30–70% with many more fluctuations than GHI.
Figure 9 shows the seasonal variation in percentage attenuation of GHI and BHI under clear sky and all sky conditions. The median of GHI percentage attenuation is found to be around 10% in all seasons for clear sky conditions with slightly more range in summers. However, there is a variation in the median of GHI percentage attenuation under all sky conditions with a more abrupt behaviour during summers. In case of BHI, the median of the percentage attenuation is found to close to 30% for clear sky conditions while again it shows an abrupt behaviour under all sky conditions, especially during summers, which can be attributed to the presence of heavy dust and cloud activities during these months. The seasonal mean values of AOD, AMF, DMF, CMF, GHI and BHI over Nainital can be found in Table A1 of the Appendix A.

4.3. Economic Impact

Figure 10a,b shows the financial analysis results for Nainital, a high-altitude remote location in the central Himalayan region, on the hypothetical 1 MW system by following the methodology given in several earlier papers [70,71]. Here, the economic and energy impact was quantified in terms of monthly means, total energy losses (EL), financial losses (FL), and solar energy potential. The annual PV and CSP energy potential for Nainital is 2308 kWh m−2 and 2769 kWh m−2, respectively. The corresponding annual revenue is 8.47 million INR and 6.66 million INR, respectively, for PV as well as CSP. The energy losses due to total aerosols (i.e., AOD) are 539 kWh m−2 in the case of GHI and high values (344 kWh m−2) in the case of BHI. The corresponding energy losses due to dust AOD are 278 kWh m−2 and 183 kWh m−2, respectively, and those due to cloud optical depth (COD) are 876 kWh m−2 and 806 kWh m−2, respectively. In the case of CSP systems, the annual aerosols, dust, and clouds impact on the produced solar energy are much larger (266 kWh m−2, 136 kWh m−2, and 271 kWh m−2, respectively, as the BHI/BHI are more affected than the GHI [28].
The economic impact for PV as well as CSP shows an annual FL of 1.05 million INR and 1.55 million INR, respectively, due to the total AOD (Figure 10). The corresponding FL due to dust and clouds are 0.56 and 2.47 million INR, respectively, for PV whereas the FL in the case of CSP are larger at 0.8 and 2.53 million INR, respectively, for dust and clouds (see Figure 10b). The annual revenues are of the order of 8.47 million INR and 6.66 million INR, respectively, for the cases of PV and CSP plants (Figure 10). This FL corresponds to the annual operating and maintenance costs of such a 1 MW system at Nainital, in the central Himalayan region [28,70,87]. These costs include the general inspections, cleaning of the systems, mechanical maintenance, mirror cleaning, checking of various components such as inverters, mounting/tracking storage, local taxes, site security, and administration costs [87,88]. The monthly generated energy increases from 210 kWh m−2 to 290 kWh m−2 and 170 kWh m−2 to 260 kWh m−2 from January to May, respectively, for the case of PV and CSP, then it decreases to a minimum of 150 kWh m−2 and 120 kWh m−2, respectively, for PV and CSP in the month of July (see Figure 10). A similar energy reduction between 0.7 % and 13% in GHI and 3% to 41% are seen in the case of BHI with maximum values during the spring due to the frequent dust storms over Egypt [70].

5. Summary and Conclusions

Recently, solar energy generation has been widely used in developing countries such as India, as they have a sufficient amount of solar resources; however, there is less development of small and medium PV and CSP systems (e.g., rooftop installations) for solar energy production. To achieve large-scale development of a solar system requires proper planning, and therefore there is a need to estimate the solar potential. In the current work, we studied the impact of aerosols and clouds in the production of solar energy for the first time over the central Himalayan region. The AOD, COT, and dust AOD are used as the main input parameters to the RTM and the effects on solar radiation and energy are revealed in the current study. The range of GHI percentage attenuation varied from 0 to 20% during clean and clear sky conditions over the Indian subcontinent. However, the attenuation increases to moderate from 16 to 20% during the seasonal AOD peak in July-August, followed by lower energy production levels. These results are consistent with 10–25% attenuation over South Asia from the work reported by several authors [71,86]. From the study of multi-year data, the estimated diurnal peaks of CAMS, GHI, and BHI exhibit around 300–700 Wm−2 during 5–6 UTC during the spring-summer season. Further, low and high attenuation of GHI are observed during autumn-winter and spring-summer, respectively. However, due to the prevailing monsoon cloud, a high attenuation of GHI is observed during the spring-summer seasons.
A strong presence of aerosols and comparable cloud presence was seen throughout the study period with AOD ranging from 0.01 to 1.65, which can be attributed to the significant transport of dust from the western region. The higher AOD was observed during the summer (July–August) months. The range of GHI percentage attenuation was found to be 0 to 14%, whereas the corresponding BHI percentage attenuation values vary from 0 to 20%, indicating the sensitivity of the direct component of the radiation to the aerosol load in the atmosphere. The validation of simulated AOD, GHI, and BHI was done with the observation data from MODIS and AERONET and it was found that the AOD data from MODIS and AERONET showed an almost similar coefficient of determination (R2 = 0.43 to 0.52) with the simulated AOD data using CAMS. Further, the simulated GHI and BHI data show good agreement with the data obtained from MODIS, with a coefficient of determination of 0.77 to 0.97. The economic impact of total AOD on PV and CSP shows an annual FL of 1.05 million INR and 1.55 million INR, respectively and the corresponding FL due to dust and clouds are 0.56 and 2.47 million INR, respectively, for PV whereas the FL in the case of CSP is greater than 0.8 and 2.53 million INR, respectively, for dust and clouds. The annual revenues were found to be of the order of 8.5 million INR and 6.7 million INR, respectively, for the cases of PV and CSP plants.
The results of this study will support the Indian solar energy producers and the electricity handling entities for efficient transmission and distribution system operations, grid stability optimization, and highlighting the effect of aerosols and clouds on energy planning and overall production. The next step is to connect the solar energy production levels and distribution with the consumption at selected local administrative units across India and quantify the aerosol and cloud effects into the solar forecasting and energy trading principles for a decentralized energy ecosystem.

Author Contributions

U.C.D. and P.G.K. designed and conceptualized the idea for this study. U.C.D., P.G.K. and S.S.N. analyzed the data and prepared the graphs. U.C.D., P.G.K. and A.M. wrote and formatted the manuscript. All authors have read and agreed to the published version of the manuscript.

Funding

The current research received no external funding.

Data Availability Statement

The AERONET observations were downloaded from the AERONET data base (https://aeronet.gsfc.nasa.gov/ (accessed on 25 March 2021)). The MODIS observations were downloaded from the MODIS database (https://giovanni.gsfc.nasa.gov/giovanni/ (accessed on 1 April 2021)). The MSG observations were downloaded from the EUMETSAT data base (https://navigator.eumetsat.int/start (accessed on 12 April 2021). The CAMS and SARAH data were retrieved from the Copernicus data center (https://atmosphere.copernicus.eu/data (accessed on 21 March 2021).

Acknowledgments

The authors thank Dipankar Banerjee, Director ARIES for his continuous support and encouragement of this study. A part of this work was supported by NASA and U.S Agency for International Development. We would like to acknowledge B. N. Holben (NASA, USA), S. N. Tripathi, and Harish Vishwakarma at IIT Kanpur for their support during the TIGERZ campaign. We thank the AERONET team for calibrating and maintaining the instruments and further processing the data. The part of this work is also carried out under the GVAX (https://www.arm.gov/research/campaigns/amf2011gvax, accessed on 7 June 2021) campaign under the Indo-US collaborations with DoE, IISc, SPL, ISRO and ARIES, Nainital. We would like to thanks all the participants of the campaign for their valuable support during the campaign. We thank the entire MODIS team for providing us valuable aerosol data. P.K. acknowledge the EuroGEO e-shape project under the grant agreement 820852 along with the Excelsior project under the grant agreement 857510 and the Eiffel project under grant agreement 101003518.

Conflicts of Interest

The authors declare no conflict of interest.

Appendix A

Table A1. Seasonal mean values of AOD, AMF, DMF, CMF, GHI and BHI over Nainital.
SeasonsAerosol Optical Depth at 550 nmAMF ± SDDMF ± SDCMF ± SD
MODIS
Mean ± SD
CAMS AOD
Mean ± SD
CAMS Dust
Mean ± SD
Aeronet AOD
Mean ± SD
Winter0.25 ± 0.160.30 ± 0.120.14 ± 0.050.39 ± 0.230.74 ± 0.080.74 ± 0.080.89 ± 0.15
Spring0.46 ± 0.230.47 ± 0.180.28 ± 0.110.36 ± 0.220.64 ± 0.110.64 ± 0.110.90 ± 0.12
Summer0.55 ± 0.340.55 ± 0.270.23 ± 0.180.35 ± 0.170.60 ± 0.140.60 ± 0.140.60 ± 0.24
Autumn0.27 ± 0.200.34 ± 0.150.15 ± 0.070.38 ± 0.230.72 ± 0.090.72 ± 0.090.85 ± 0.18
Global horizontal Irradiance (KWh m−2)Beam horizontal Irradiance (KWh m−2)
All Sky ± SDClear Sky ± SDClean Sky ± SDAll Sky ± SDClear sky ± SDClean Sky ± SD
Winter222.84 ± 74.26267.80 ± 43.11287.58 ± 43.38176.96 ± 64.43208.67 ± 40.75278.67 ± 35.31
Spring281.49 ± 78.71311.46 ± 58.57337.83 ± 56.26253.20 ± 79.66293.61 ± 51.49325.24 ± 55.84
Summer179.06 ± 90.33313.91 ± 59.99364.81 ± 49.01146.99 ± 84.20304.86 ± 54.97321.17 ± 61.22
Autumn239.67 ± 87.64299.13 ± 68.79316.77 ± 74.60191.79 ± 72.82253.95 ± 68.20307.43 ± 71.28

References

  1. Ellabban, O.; Abu-Rub, H.; Blaabjerg, F. Renewable energy resources: Current status, future prospects and their enabling technology. Renew. Sustain. Energy Rev. 2014, 39, 748–764. [Google Scholar] [CrossRef]
  2. Gielen, D.; Saygin, D.; Wagner, N.; Ghosh, A.; Chawla, K. Renewable Energy Prospects for India, a Working Paper Based on REmap; International Renewable Energy Agency: Abu Dhabi, United Arab Emirates, 2017. [Google Scholar]
  3. Gielen, D.; Boshell, F.; Saygin, D.; Bazilian, M.D.; Wagner, N.; Gorini, R. The role of renewable energy in the global energy transformation. Energy Strat. Rev. 2019, 24, 38–50. [Google Scholar] [CrossRef]
  4. Salvarli, M.S.; Salvarli, H. For sustainable development: Future trends in renewable energy and enabling technologies, Renewable Energy-Resources, Challenges and Applications. IntechOpen 2020. [Google Scholar] [CrossRef]
  5. Kumar, J.C.R.; Majid, M.A. Renewable energy for sustainable development in India: Current status, future prospects, challenges, employment, and investment opportunities. Sustain. Soc. 2020, 10, 2. [Google Scholar] [CrossRef]
  6. Ishii, T.; Otani, K.; Takashima, T.; Xue, Y. Solar spectral influence on the performance of photovoltaic (PV) modules under fine weather and cloudy weather conditions. Prog. Photovolt. 2013, 21, 481–489. [Google Scholar] [CrossRef]
  7. Allen, R.J.; Norris, J.R.; Wild, M. Evaluation of multi decadal variability in CMIP5 surface solar radiation and inferred underestimation of aerosol direct effects over Europe, China, Japan, and India. J. Geophys. Res. Atmos. 2013, 118, 6311–6336. [Google Scholar] [CrossRef]
  8. Dirnberger, D.; Blackburn, G.; Muller, B.; Reise, C. On the impact of solar spectral irradiance on the yield of different PV technologies. Sol. Energy Mater. Sol. Cells 2015, 132, 431–442. [Google Scholar] [CrossRef]
  9. Kosmopoulos, P.G.; Kazadzis, S.; Lagouvardos, K.; Kotroni, V.; Bais, A. Solar energy prediction and verification using operational model forecasts and ground-based solar measurements. Energy 2015, 93, 1918–1930. [Google Scholar] [CrossRef]
  10. Yang, J.; Li, X.; Peng, W.; Wagner, F.; Mauzerall, D.L. Climate, air quality and human health benefits of various solar photovoltaic deployment scenarios in China in 2030. Environ. Res. Lett. 2018, 13, 064002. [Google Scholar] [CrossRef] [Green Version]
  11. Iqbal, M. An Introduction to Solar Radiation; Elsevier Inc.: Amsterdam, The Netherlands; Academic Press: Cambridge, MA, USA, 1983; ISBN 978-0-12-373750-2. [Google Scholar] [CrossRef]
  12. Wielicki, B.; Cess, R.D.; King, M.D.; Randall, D.A.; Harrison, E.F. Mission to planet Earth: Role of clouds and radiation in climate. Bull. Am. Meteorol. Soc. 1995, 76, 2125–2153. [Google Scholar] [CrossRef]
  13. Ramanathan, V.; Crutzen, P.J.; Kiehl, J.T.; Rosenfeld, D. Aerosols, Climate, and the Hydrological Cycle. Science 2001, 294, 2119–2124. [Google Scholar] [CrossRef] [Green Version]
  14. Dey, S.; Girolamo, L.D. A climatology of aerosol optical and microphysical properties over the Indian subcontinent from 9 years (2000–2008) of Multiangle Imaging Spectroradiometer (MISR) data. J. Geophys. Res. 2010, 115, D15204. [Google Scholar] [CrossRef] [Green Version]
  15. Moorthy, K.K.; Babu, S.S.; Manoj, M.R.; Satheesh, S.K. Buildup of aerosols over the Indian region. Geophys. Res. Lett. 2013, 40, 1011–1014. [Google Scholar] [CrossRef]
  16. Dumka, U.C.; Kaskaoutis, D.G.; Srivastava, M.K.; Devara, P.C.S. Scattering and absorption properties of near-surface aerosol over Gangetic–Himalayan region: The role of boundary-layer dynamics and long-range transport. Atmos. Chem. Phys. 2015, 15, 1555–1572. [Google Scholar] [CrossRef] [Green Version]
  17. Dumka, U.C.; Kaskaoutis, D.G.; Francis, D.; Chaboureau, J.P.; Rashki, A.; Tiwari, S.; Singh, S.; Liakakou, E.; Mihalopoulos, N.L. The role of the Intertropical Discontinuity region and the heat low in dust emission and transport over the Thar desert, India: A Premonsoon case study. J. Geophys. Res. Atmos. 2019, 124, 13197–13219. [Google Scholar] [CrossRef]
  18. Rana, A.; Jia, S.; Sarkar, S. Black carbon aerosol in India: A comprehensive review of current status and future prospects. Atmos. Res. 2019, 218, 207–230. [Google Scholar] [CrossRef]
  19. Rupakheti, D.; Kang, S.; Rupakheti, M.; Cong, Z.; Panday, A.; Holben, B. Identification of absorbing aerosol types at a site in the northern edge of Indo-Gangetic Plain and a polluted valley in the foothills of the central Himalayas. Atmos. Res. 2019, 223, 15–23. [Google Scholar] [CrossRef]
  20. Rupakheti, D.; Kang, S.; Rupakheti, M. Two heavy haze events over Lumbini in southern Nepal: Enhanced aerosol radiative forcing and heating rates. Atmos. Environ. 2020, 236, 117658. [Google Scholar] [CrossRef]
  21. Gautam, R.; Hsu, N.C.; Lau, K.-M. Premonsoon aerosol characterization and radiative effects over the Indo-Gangetic Plains: Implications for regional climate warming. J. Geophy. Res. 2010, 115, D17208. [Google Scholar] [CrossRef]
  22. Lüthi, Z.L.; Škerlak, B.; Kim, S.W.; Lauer, A.; Mues, A.; Rupakheti, M.; Kang, S. Atmospheric brown clouds reach the Tibetan Plateau by crossing the Himalayas. Atmos. Chem. Phys. 2015, 15, 6007–6021. [Google Scholar] [CrossRef] [Green Version]
  23. Lau, W.K.M.; Sang, J.; Kim, M.K.; Kim, K.M.; Koster, R.D.; Yasunari, T.J. Impacts of snow darkening deposition of light-absorbing aerosols on hydroclimate of Eurasia during boreal spring and summer. J. Geophys. Res. 2018, 123, 8441–8461. [Google Scholar] [CrossRef] [Green Version]
  24. Das, S.; Giorgi, F.; Giuliani, G. Investigating the relative responses of regional monsoon dynamics to snow darkening and direct radiative effects of dust and carbonaceous aerosols over the Indian subcontinent. Clim. Dyn. 2020, 55, 1011–1030. [Google Scholar] [CrossRef]
  25. Kambezidis, H.D.; Kaskaoutis, D.G.; Kharol, S.K.; Moorthy, K.K.; Satheesh, S.K.; Kalapureddy, M.C.; Badrinath, K.V.S.; Sharma, A.R.; Wild, M. Molti-decadal variation of the net downward shortwave radiation over south Asia: The solar dimming effect. Atmos. Environ. 2012, 50, 360–372. [Google Scholar] [CrossRef]
  26. Intergovernmental Panel on Climate Change (IPCC). Climate Change 2013 the Physical Science Basis: Contribution of Working Group I to the Fifth Assessment Report 20 of the Intergovernmental Panel on Climate Change; Cambridge University Press: New York, NY, USA, 2013.
  27. Deng, J.; Zhang, Y.; Qin, B.; Shi, K. Long-term changes in surface solar radiation and their effects on air temperature in the Shanghai region. Int. J. Climatol. 2015, 35, 3385–3396. [Google Scholar] [CrossRef]
  28. Kosmopoulos, P.G.; Kazadzis, S.; Taylor, M.; Athanasopoulou, E.; Speyer, O.; Raptis, P.I.; Marinou, E.; Proestakis, E.; Solomos, S.; Gerasopoulos, E.; et al. Dust Impact on Surface Solar Irradiance Assessed with Model Simulations, Satellite Observations and Ground-Based Measurements. Atmos. Meas. Tech. 2017, 10, 2435–2453. [Google Scholar] [CrossRef] [Green Version]
  29. Zhang, G.; Ma, Y. Clear-sky surface soalr radiation and the radiative effects of aerosol and water vapour based on simultanions and satellite observations over Northern China. Remote Sens. 2020, 12, 1931. [Google Scholar] [CrossRef]
  30. Li, X.; Wagner, F.; Peng, W.; Yang, J.; Mauzerall, D.L. Reduction of solar photovoltaic resources due to air pollution in China. Proc. Natl. Acad. Sci. USA 2017, 114, 11867–11872. [Google Scholar] [CrossRef] [Green Version]
  31. Kaskaoutis, D.G.; Sinha, P.R.; Vinoj, V.; Kosmopoulos, P.G.; Tripathi, S.N.; Misra, A.; Sharma, M.; Singh, R.P. Aerosol Properties and Radiative Forcing over Kanpur during Severe Aerosol Loading Conditions. Atmos. Environ. 2013, 79, 7–19. [Google Scholar] [CrossRef]
  32. Kumar, R.; Barth, M.C.; Madronich, S.; Naja, M.; Carmichael, G.R.; Pfister, G.G.; Knote, C.; Brasseur, G.P.; Ojha, N.; Sarangi, T. Effects of dust aerosols on tropospheric chemistry during a typical pre-monsoon season dust storm in northern India. Atmos. Chem. Phys. 2014, 14, 6813–6834. [Google Scholar] [CrossRef] [Green Version]
  33. Kumar, R.; Barth, M.C.; Pfister, G.G.; Naja, M.; Brasseur, G.P. WRF-Chem simulations of a typical pre-monsoon dust storm in northern India: Influences on aerosol optical properties and radiation budget. Atmos. Chem. Phys. 2014, 14, 2431–2446. [Google Scholar] [CrossRef] [Green Version]
  34. Kumar, S.; Kumar, S.; Kaskaoutis, D.G.; Singh, R.P.; Singh, R.K.; Mishra, A.K.; Srivastava, M.K.; Singh, A.K. Meteorological, atmospheric and climatic perturbations during major dust storms over Indo-Gangetic Basin. Aeo. Res. 2015, 17, 15–31. [Google Scholar] [CrossRef]
  35. Li, G.; Fang, C.; Wang, S.; Sun, S. The effects of economic growth, urbanization and industrialization on fine particulate matter (PM2.5) concentration in China. Environ. Sci. Technol. 2016, 50, 11452–11459. [Google Scholar] [CrossRef] [PubMed]
  36. Liang, L.; Wang, Z.; Li, J. The effect of urbanization on environmental pollution in rapidly developing urban agglomerations. J. Clean. Prod. 2019, 237, 117649. [Google Scholar] [CrossRef]
  37. Anser, M.K.; Alharthi, M.; Aziz, B.; Wasim, S. Impact of urbanization, economic growth, and population size on residential carbon emissions in the SAARC countries. Clean Technol. Environ. Policy 2020, 22, 923–936. [Google Scholar] [CrossRef]
  38. Commercial Real Estate India. India 2030 Exploring the Future; Commercial Real Estate India: New Delhi, India, 2019. [Google Scholar]
  39. Bajpai, M.; Awasthi, N.; Singh, L. Electrical Power Scenario in Uttarakhand. Int. J. Sci. Eng. Res. 2017, 8, 96–98. [Google Scholar]
  40. Government of Uttarakhand. Renewable Energy. Available online: https://investuttarakhand.com/themes/backend/uploads/IP_UK_Renewable%20Energy%20SectorProfile-2019-05-21.pdf (accessed on 7 June 2021).
  41. Sagar, R.; Kumar, B.; Dumka, U.C.; Moorthy, K.K.; Pant, P. Characteristics of aerosol spectral optical depths over Manora Peak: A high-altitude station in the central Himalayas. J. Geophys. Res. 2004, 109, D06207. [Google Scholar] [CrossRef] [Green Version]
  42. Dumka, U.C.; Moorthy, K.K.; Kumar, R.; Hegde, P.; Sagar, R.; Pant, P.; Singh, N.; Babu, S.S. Characteristics of aerosol black carbon mass concentration over a high altitude location in the central Himalayas from multi-year measurements. Atmos. Res. 2010, 96, 510–521. [Google Scholar] [CrossRef]
  43. Dumka, U.C.; Bhattu, D.; Tripathi, S.N.; Kaskaoutis, D.G.; Madhavan, B.L. Seasonal inhomogeneity in cloud precursors over Gangetic Himalayan region during GVAX campaign. Atmos. Res. 2015, 155, 158–175. [Google Scholar] [CrossRef] [Green Version]
  44. Dumka, U.C.; Kaskaoutis, D.G.; Mihalopoulos, N.; Sheoran, R. Identification of key aerosol types and mixing states in the central Indian Himalayas during the GVAX campaign: The role of particle size in aerosol classification. Sci. Total. Environ. 2021, 761, 143188. [Google Scholar] [CrossRef]
  45. Dumka, U.C.; Moorthy, K.K.; Satheesh, S.K.; Sagar, R.; Pant, P. Short-period modulations in aerosol optical depths over the central Himalayas: Role of mesoscale processes. J. Appl. Meteorol. Climatol. 2008, 47, 1467–1475. [Google Scholar] [CrossRef] [Green Version]
  46. Sarangi, T.; Naja, M.; Ojha, N.; Kumar, R.; Lal, S.; Venkataramani, S.; Kumar, A.; Sagar, R.; Chandola, H.C. First simultaneous measurements of ozone, CO and NOy at a high altitude regional representative site in the central Himalayas. J. Geophys. Res. Atmos. 2014, 119, 1592–1611. [Google Scholar] [CrossRef]
  47. Sagar, R.; Dumka, U.C.; Naja, M.; Singh, N.; Phanikumar, D.V. ARIES, Nainital: A strategically important location for climate change studies in the Central Gangetic Himalayan region. Curr. Sci. 2015, 109, 703–715. [Google Scholar]
  48. Holben, B.N.; Tanre, D.; Smirnov, A.; Eck, T.F.; Slutsker, I.; Abuhassan, N.; Newcomb, W.W.; Schafer, J.S.; Chatenet, B.; Lavenu, F.; et al. An emerging ground-based aerosol climatology: Aerosol optical depth from AERONET. J. Geophys. Res. Atmos. 2001, 106, 12067–12097. [Google Scholar] [CrossRef]
  49. Dubovik, O.; Smirnov, A.; Holben, B.N.; King, M.D.; Kaufman, Y.J.; Eck, T.F.; Slutsker, I. Accuracy assessments of aerosol optical properties retrieved from Aerosol Robotic Network (AERONET) Sun and sky radiance measurements. J. Geophys. Res. Atmos. 2000, 105, 9791–9806. [Google Scholar] [CrossRef] [Green Version]
  50. Smirnov, A.; Holben, B.N.; Eck, T.F.; Dubovik, O.; Slutsker, I. Cloud screening and quality control algorithms for the AERONET data base. Remote Sens. Environ. 2000, 73, 337–349. [Google Scholar] [CrossRef]
  51. Eck, T.F.; Holben, B.; Sinyuk, A.; Pinker, R.; Goloub, P.; Chen, H.; Chatenet, B.; Li, Z.; Singh, R.P.; Tripathi, S.N.; et al. Climatological aspects of the optical properties of fine/coarse mode aerosol mixtures. J. Geophys. Res. 2010, 115, D19205. [Google Scholar] [CrossRef] [Green Version]
  52. Giles, D.M.; Holben, B.N.; Tripathi, S.N.; Eck, T.F.; Newcomb, W.W.; Slutsker, I.; Dickerson, R.R.; Thompson, A.M.; Mattoo, S.; Wang, S.-H.; et al. Aerosol properties over the Indo-Gangetic Plain: A mesoscale perspective from the TIGERZ experiment. J. Geophys. Res. 2011, 116, D18203. [Google Scholar] [CrossRef]
  53. Dumka, U.C.; Tripathi, S.N.; Misra, A.; Giles, D.M.; Eck, T.F.; Sagar, R.; Holben, B.N. Latitudinal variation of aerosol properties from Indo-Gangetic Plain to Central Himalayan foothills during TIGERZ campaign. J. Geophys. Res. Atmos. 2014, 119, 4750–4769. [Google Scholar] [CrossRef]
  54. Eck, T.F.; Holben, B.N.; Reid, J.S.; Dubovik, O.; Smirnov, A.; O’Neill, N.T.; Slutsker, I.; Kinne, S. Wavelength dependence of the optical depth of biomass burning, urban, and desert dust aerosols. J. Geophys. Res. 1999, 104, 31333–31349. [Google Scholar] [CrossRef]
  55. Giles, D.M.; Sinyuk, A.; Sorokin, M.G.; Schafer, J.S.; Smirnov, A.; Slutsker, I.; Eck, T.F.; Holben, B.N.; Lewis, J.R.; Campbell, J.R.; et al. Advancements in the Aerosol Robotic Network (AERONET) Version 3 database—Automated near-real-time quality control algorithm with improved cloud screening for Sun photometer aerosol optical depth (AOD) measurements. Atmos. Meas. Tech. 2019, 12, 169–209. [Google Scholar] [CrossRef] [Green Version]
  56. Sinyuk, A.; Holben, B.N.; Eck, T.F.; Giles, D.M.; Slutsker, I.; Korkin, S.; Schafer, J.S.; Smirnov, A.; Sorokin, M.; Lyapustin, A. The AERONET Version 3 aerosol retrieval algorithm, associated uncertainties and comparisons to Version 2. Atmos. Meas. Tech. 2020, 13, 3375–3411. [Google Scholar] [CrossRef]
  57. Atmospheric Monitoring Service, Copernicus. Available online: https://atmosphere.copernicus.eu/data (accessed on 16 November 2019).
  58. Schroedter-Homscheidt, M.; Hoyer-klick, C.; Killius, N.; Lefèvre, M. User’s Guide to the CAMS Radiation Service: Copernicus Atmosphere Monitoring Service; German Aerospace Center: Cologne, Germany, 2017. [Google Scholar]
  59. Levy, R.C.; Remer, L.A.; Kleidman, R.G.; Mattoo, S.; Ichoku, C.; Kahn, R.; Eck, T.F. Global evaluation of the Collection 5 MODIS dark-target aerosol products over land. Atmos. Chem. Phys. 2010, 10, 10399–10420. [Google Scholar] [CrossRef] [Green Version]
  60. Tripathi, S.N.; Dey, S.; Tare, V.; Satheesh, S.K.; Lal, S.; Venkataramani, S. Enhanced layer of black carbon in a north Indian industrial city. Geophys. Res. Lett. 2005, 32, L12802. [Google Scholar] [CrossRef]
  61. Jethva, H.; Satheesh, S.K.; Srinivasan, J. Seasonal variability of aerosols over Indo-Gangetic basin. J. Geophys. Res. 2005, 110, D21204. [Google Scholar] [CrossRef]
  62. Levy, R.C.; Mattoo, S.; Munchak, L.A.; Remer, L.A.; Sayer, A.M.; Patadia, F.; Hsu, N.C. The Collection 6 MODIS aerosol products over land and ocean. Atmos. Meas. Tech. 2013, 6, 2989–3034. [Google Scholar] [CrossRef] [Green Version]
  63. Météo-France. Algorithm Theoretical Basis Document for Cloud Products (CMa-PGE01 v3.2, CT-PGE02 v2.2 & CTTH-PGE03 v2.2); Technical Report SAF/NWC/CDOP/MFL/SCI/ATBD/01; Météo-France: Paris, France, 2013. [Google Scholar]
  64. Mayer, B.; Kylling, A. Technical note: The libRadtran software package for radiative transfer calculations—Description and examples of use. Atmos. Chem. Phys. 2005, 5, 1855–1877. [Google Scholar] [CrossRef] [Green Version]
  65. Emde, C.; Buras-Schnell, R.; Kylling, A.; Mayer, B.; Gasteiger, J.; Hamann, U.; Kylling, J.; Richter, B.; Pause, C.; Dowling, T.; et al. The libRadtran software package for radiative transfer calculations (version 2.0.1). Geosci. Model. Dev. 2016, 9, 1647–1672. [Google Scholar] [CrossRef] [Green Version]
  66. Kosmopoulos, P.G.; Kazadzis, S.; Taylor, M.; Raptis, P.I.; Keramitsoglou, I.; Kiranoudis, C.; Bais, A.F. Assessment of surface solar irradiance derived from real-time modelling techniques and verification with ground-based measurements. Atmos. Meas. Tech. 2018, 11, 907–924. [Google Scholar] [CrossRef] [Green Version]
  67. Ricchiazzi, P.; Yang, S.; Gautier, C.; Sowle, D. SBDART: A research and software tool for plane-parallel radiative transfer in the Earth’s atmosphere. Bull. Am. Meteorol. Soc. 1998, 79, 2101–2114. [Google Scholar] [CrossRef] [Green Version]
  68. Kato, S.; Ackerman, T.P.; Mather, J.H.; Clothiaux, E.E. The K-Distribution Method and Correlated-k Approximation for a Shortwave Radiative Transfer Model. J. Quant. Spectrosc. Radiat. Transf. 1999, 62, 109–121. [Google Scholar] [CrossRef]
  69. Shettle, E.P. Models of Aerosols, Clouds, and Precipitation for Atmospheric Propagation Studies. In Proceedings of the Atmospheric Propagation in the UV, Visible, IR and MM Wave Region and Related Systems Aspects, Copenhagen, Denmark, 9–13 October 1989. [Google Scholar]
  70. Kosmopoulos, P.G.; Kazadzis, S.; El-Askary, H.; Taylor, M.; Gkikas, A.; Proestakis, E.; Kontoes, C.; El-Khayat, M.M. Earth-Observation-Based Estimation and Forecasting of Particulate Matter Impact on Solar Energy in Egypt. Remote Sens. 2018, 10, 1870. [Google Scholar] [CrossRef] [Green Version]
  71. Masoom, A.; Kosmopoulos, P.; Kashyap, Y.; Kumar, S.; Bansal, A. Rooftop Photovoltaic Energy Production Management in India Using Earth-Observation Data and Modeling Techniques. Remote Sens. 2020, 12, 1921. [Google Scholar] [CrossRef]
  72. Mercom India. Available online: https://mercomindia.com/uttarakhand-generic-tariff-rooftop-solar/ (accessed on 7 June 2021).
  73. Panjwani, M.K.; Narejo, G.B. Effect of humidity on the efficiency of solar cell (photovoltaic). Int. J. Eng. Res. Gen. Sci. 2014, 2, 499–503. [Google Scholar]
  74. Gwandu, B.; Creasey, D.J. Humidity: A factor in the appropriate positioning of a photovoltaic power station. Renew. Energy 1995, 6, 313–316. [Google Scholar] [CrossRef]
  75. Verma, S.; Payra, S.; Gautam, R.; Prakash, D.; Soni, M.; Holben, B.; Bell, S. Dust events and their influence on aerosol optical properties over Jaipur in Northwestern India. Environ. Monit. Assess. 2013, 185, 7327–7342. [Google Scholar] [CrossRef] [PubMed]
  76. Nabat, P.; Somot, S.; Mallet, M.; Sevault, F.; Driouech, F.; Meloni, D.; Di Sarra, A.; Di Biagio, C.; Formenti, P.; Sicard, M.; et al. Dust aerosol radiative effects during summer 2012 simulated with a coupled regional aerosol-atmosphere-ocean model over the Mediterranean. Atmos. Chem. Phys. 2015, 15, 3303–3326. [Google Scholar] [CrossRef] [Green Version]
  77. Khalil, S.A.; Shaffie, A.M. Evaluation of transposition models of solar irradiance over Egypt. Renew. Sustain. Energy Rev. 2016, 66, 105–119. [Google Scholar] [CrossRef]
  78. Son, J.; Jeong, S.; Park, H.; Park, C.-F. The effect of particulate matter on solar photovoltaic power generation over the Republic of Korea. Environ. Res. Lett. 2020, 15, 084004. [Google Scholar] [CrossRef]
  79. Bergin, M.H.; Ghoroi, C.; Dixit, D.; Schauer, J.J.; Shindell, D.T. Large reductions in solar energy production due to dust and particulate air pollution. Environ. Sci. Technol. Lett. 2017, 4, 339–344. [Google Scholar] [CrossRef] [Green Version]
  80. Peters, I.M.; Karthik, S.; Liu, H.; Buonassisi, T.; Nobre, A. Urban haze and photovoltaics Energy. Environ. Sci. 2018, 11, 3043–3054. [Google Scholar]
  81. Villalobos, A.M.; Amonov, M.O.; Shafer, M.M.; Devi, J.J.; Gupta, T.; Tripathi, S.N.; Rana, K.S.; McKenzie, M.; Bergin, M.H.; Schauer, J.J. Source apportionment of carbonaceous fine particulate matter (PM2.5) in two contrasting cities across the Indo-Gangetic Plain. Atmos. Pollut. Res. 2015, 6, 398–405. [Google Scholar] [CrossRef] [Green Version]
  82. Vreeland, H.; Schauer, J.J.; Russell, A.G.; Marshall, J.D.; Fushimi, A.; Jain, G.; Sethuraman, K.; Verma, V.; Tripathi, S.N.; Bergin, M.H. Chemical characterization and toxicity of particulate matter emissions from roadside trash combustion in urban India. Atmos. Environ. 2016, 147, 22–30. [Google Scholar] [CrossRef]
  83. Dey, S.; Di Girolamo, L.; van Donkelaar, A.; Tripathi, S.N.; Gupta, T.; Mohan, M. Variability of outdoor fine particulate (PM2.5) concentration in the Indian Subcontinent: A remote sensing approach. Remote. Sens. Environ. 2012, 127, 153–161. [Google Scholar] [CrossRef]
  84. Petrenko, M.; Ichoku, C.; Leptoukh, G. Multi-sensor Aerosol Products Sampling System (MAPSS). Atmos. Meas. Tech. 2012, 5, 913–926. [Google Scholar] [CrossRef] [Green Version]
  85. Holben, B.N.; Eck, T.F.; Slutsker, I.; Tanre, D.; Buis, J.P.; Setzer, A.; Vermote, E.; Reagan, J.; Kaufman, Y.; Nakajima, T.; et al. AERONET—A federated instrument network and data archive for aerosol characterization. Remote Sens. Environ. 1998, 66, 1–16. [Google Scholar] [CrossRef]
  86. Masoom, A.; Kosmopoulos, P.; Bansal, A.; Kazadzis, S. Solar Energy Estimations in India Using Remote Sensing Technologies and Validation with Sun Photometers in Urban Areas. Remote Sens. 2020, 12, 254. [Google Scholar] [CrossRef] [Green Version]
  87. IRENA. Renewable Power Generation Costs in 2014, Report 2015. Available online: http://www.irena.org/media/Files/IRENA/Agency/Publication/2015/IRENA_RE_Power_Costs_2014_report.pdf (accessed on 9 November 2018).
  88. Haney, J.; Burstein, A. PV System Operations and Maintenance Fundamentals. Solar America Board for Codes and Standards Report 2013. Available online: http://www.solarabcs.org/about/publications/reports/operationsmaintenance/pdfs/SolarABCs-35-2013.pdf (accessed on 7 June 2021).
Figure 1. Map of the experimental site of Nainital.
Remotesensing 13 03248 g001
Figure 2. Monthly averages of (a) AOD at 550nm over Indian subcontinent using the dark target and deep blue combined products of MODIS Terra and Aqua for the period of 2008–2012, and (b) GHI and (c) BHI solar energy percentage attenuations relative to the aerosol free simulations under MODIS-based AODs.
Remotesensing 13 03248 g002aRemotesensing 13 03248 g002b
Figure 3. Seasonal frequency histogram of daily CAMS AOD at 550 nm, GHI and BHI (a) winter (December–to–February), (b) spring (March–to–May), (c) summer (June–to–August), and (d) autumn (September–to–November).
Remotesensing 13 03248 g003
Figure 4. Correlation plots of (a) MODIS vs. CAMS AOD at 550 nm, (b) AERONET vs. CAMS & MODIS AOD at 550 nm, (c) GHI in MODIS vs. CAMS, (d) BHI in MODIS vs. CAMS, (e) GHI in AERONET vs. MODIS & CAMS, and (f) BHI in AERONET vs MODIS & CAMS at Nainital. The black dotted line shows 1:1 and the solid line is the linear least square fit. The shaded area shows the 95% confidence band. The slope, intercept, and value of R2 are shown in each panel, respectively.
Remotesensing 13 03248 g004
Figure 5. Scatter plots of satellite AOD (550 nm) from MODIS/Terra vs. coincident AOD from AERONET for the five year period 2006–2010 with outliers removed: (a) global record and (b) Nainital site. The colour bar shows the percentage frequency of AOD values’ occurrence.
Remotesensing 13 03248 g005
Figure 6. Contour plots of the all sky GHI (a) and BHI (b) in Nainital as simulated by the RTM using as inputs the CAMS AOD and the MSG COT. Percentage attenuation of GHI (c,d) and BHI (e,f) under all sky (c,e) and clear sky (d,f) conditions during 2008–2012.
Remotesensing 13 03248 g006
Figure 7. Monthly averages of (a) cloud optical depth over the Indian subcontinent using COT product of MSG for the period of 2008–2012, and (b,c) GHI & BHI solar energy percentage attenuations relative to the cloud free simulations.
Remotesensing 13 03248 g007aRemotesensing 13 03248 g007b
Figure 8. Monthly average values of the AMF, DMF, and CMF (a). Percentage attenuation of the monthly GHI (b) and DNI (c) under clear sky and all sky conditions.
Remotesensing 13 03248 g008
Figure 9. Seasonal percentage attenuation in GHI (a,b) and BHI (c,d) under clear and all sky conditions. The boxes represent the 25th and 75th percentiles, while the in-box lines represent the median and the upper and lower whiskers the maximum and minimum attenuation values.
Remotesensing 13 03248 g009
Figure 10. Financial analysis of the aerosol, dust, and cloud impacts on the produced solar energy from CSP (a) and PV (b) installations with nominal power of 1 MW in the region. The impact was quantified in terms of monthly mean and total energy losses, financial losses, and solar energy potential.
Remotesensing 13 03248 g010
Publisher’s Note: MDPI stays neutral with regard to jurisdictional claims in published maps and institutional affiliations.

