Article

Gradient Boosting Estimation of the Leaf Area Index of Apple Orchards in UAV Remote Sensing

1
College of Mechanical and Electronic Engineering, Northwest A&F University, Yangling 712100, China
2
Apple Mechanized Research Base, Yangling 712100, China
3
Shannxi Key Laboratory of Apple, Yangling 712100, China
4
State Key Laboratory of Soil Erosion and Dryland Farming on Loess Plateau, Yangling 712100, China
*
Author to whom correspondence should be addressed.
Remote Sens. 2021, 13(16), 3263; https://0-doi-org.brum.beds.ac.uk/10.3390/rs13163263
Submission received: 18 July 2021 / Revised: 16 August 2021 / Accepted: 16 August 2021 / Published: 18 August 2021
(This article belongs to the Special Issue Remote Sensing Applications in Agricultural Ecosystems)

Abstract

:
The leaf area index (LAI) is a key parameter for describing the canopy structure of apple trees. This index is also employed in evaluating the amount of pesticide sprayed per unit volume of apple trees. Hence, numerous manual and automatic methods have been explored for LAI estimation. In this work, the leaf area indices for different types of apple trees are obtained in terms of multispectral remote-sensing data collected with an unmanned aerial vehicle (UAV), along with simultaneous measurements of apple orchards. The proposed approach was tested on apple trees of the “Fuji”, “Golden Delicious”, and “Ruixue” types, which were planted in the Apple Experimental Station of the Northwest Agriculture and Forestry University in Baishui County, Shaanxi Province, China. Five vegetation indices of strong correlation with the apple leaf area index were selected and used to train models of support vector regression (SVR) and gradient-boosting decision trees (GBDT) for predicting the leaf area index of apple trees. The best model was selected based on the metrics of the coefficient of determination (R2) and the root-mean-square error (RMSE). The experimental results showed that the gradient-boosting decision tree model achieved the best performance with an R2 of 0.846, an RMSE of 0.356, and a spatial efficiency (SPAEF) of 0.57. This demonstrates the feasibility of our approach for fast and accurate remote-sensing-based estimation of the leaf area index of apple trees.

1. Introduction

The leaf area index (LAI) was introduced by the British ecologist D. J. Watson in the 1940s and is defined as the total one-sided area of green leaves per unit land area [1,2,3,4,5]. This means that the LAI is a dimensionless quantity, characterized by a unit of (meter squared per meter squared), and it ranges from 0 (for a bare ground) to 5 (for dense orchards), but it might increase occasionally to over 10 (for highly dense forests such as the equatorial ones). The leaf area index of fruit trees plays a key role in controlling the amount of pesticide applied per unit volume of these trees. In fact, LAI-based pesticide management is important for improving spraying efficiency, achieving rational pesticide delivery, and reducing pest control costs [6,7,8,9].
The traditional LAI estimation methods, such as the square grid and leaf collection methods, mainly rely on manual field measurements, a practice which is not only wasteful of manpower but can also be extremely destructive to crops. With continuous developments in remote-sensing technologies, LAI estimation methods have been proposed based on remote sensing [2,3,10,11,12,13]. At present, satellites and unmanned aerial vehicles (UAVs) are two of the most popular systems for acquiring remote-sensing data. However, satellite remote-sensing data suffer from long re-entry times and poor real-time performance, and hence, timely and fast acquisition of data within specific ranges cannot be achieved. Additionally, while satellite remote sensing is suitable for large-scale areas, its resolution is somewhat limited in small-scale regional studies [12,13,14,
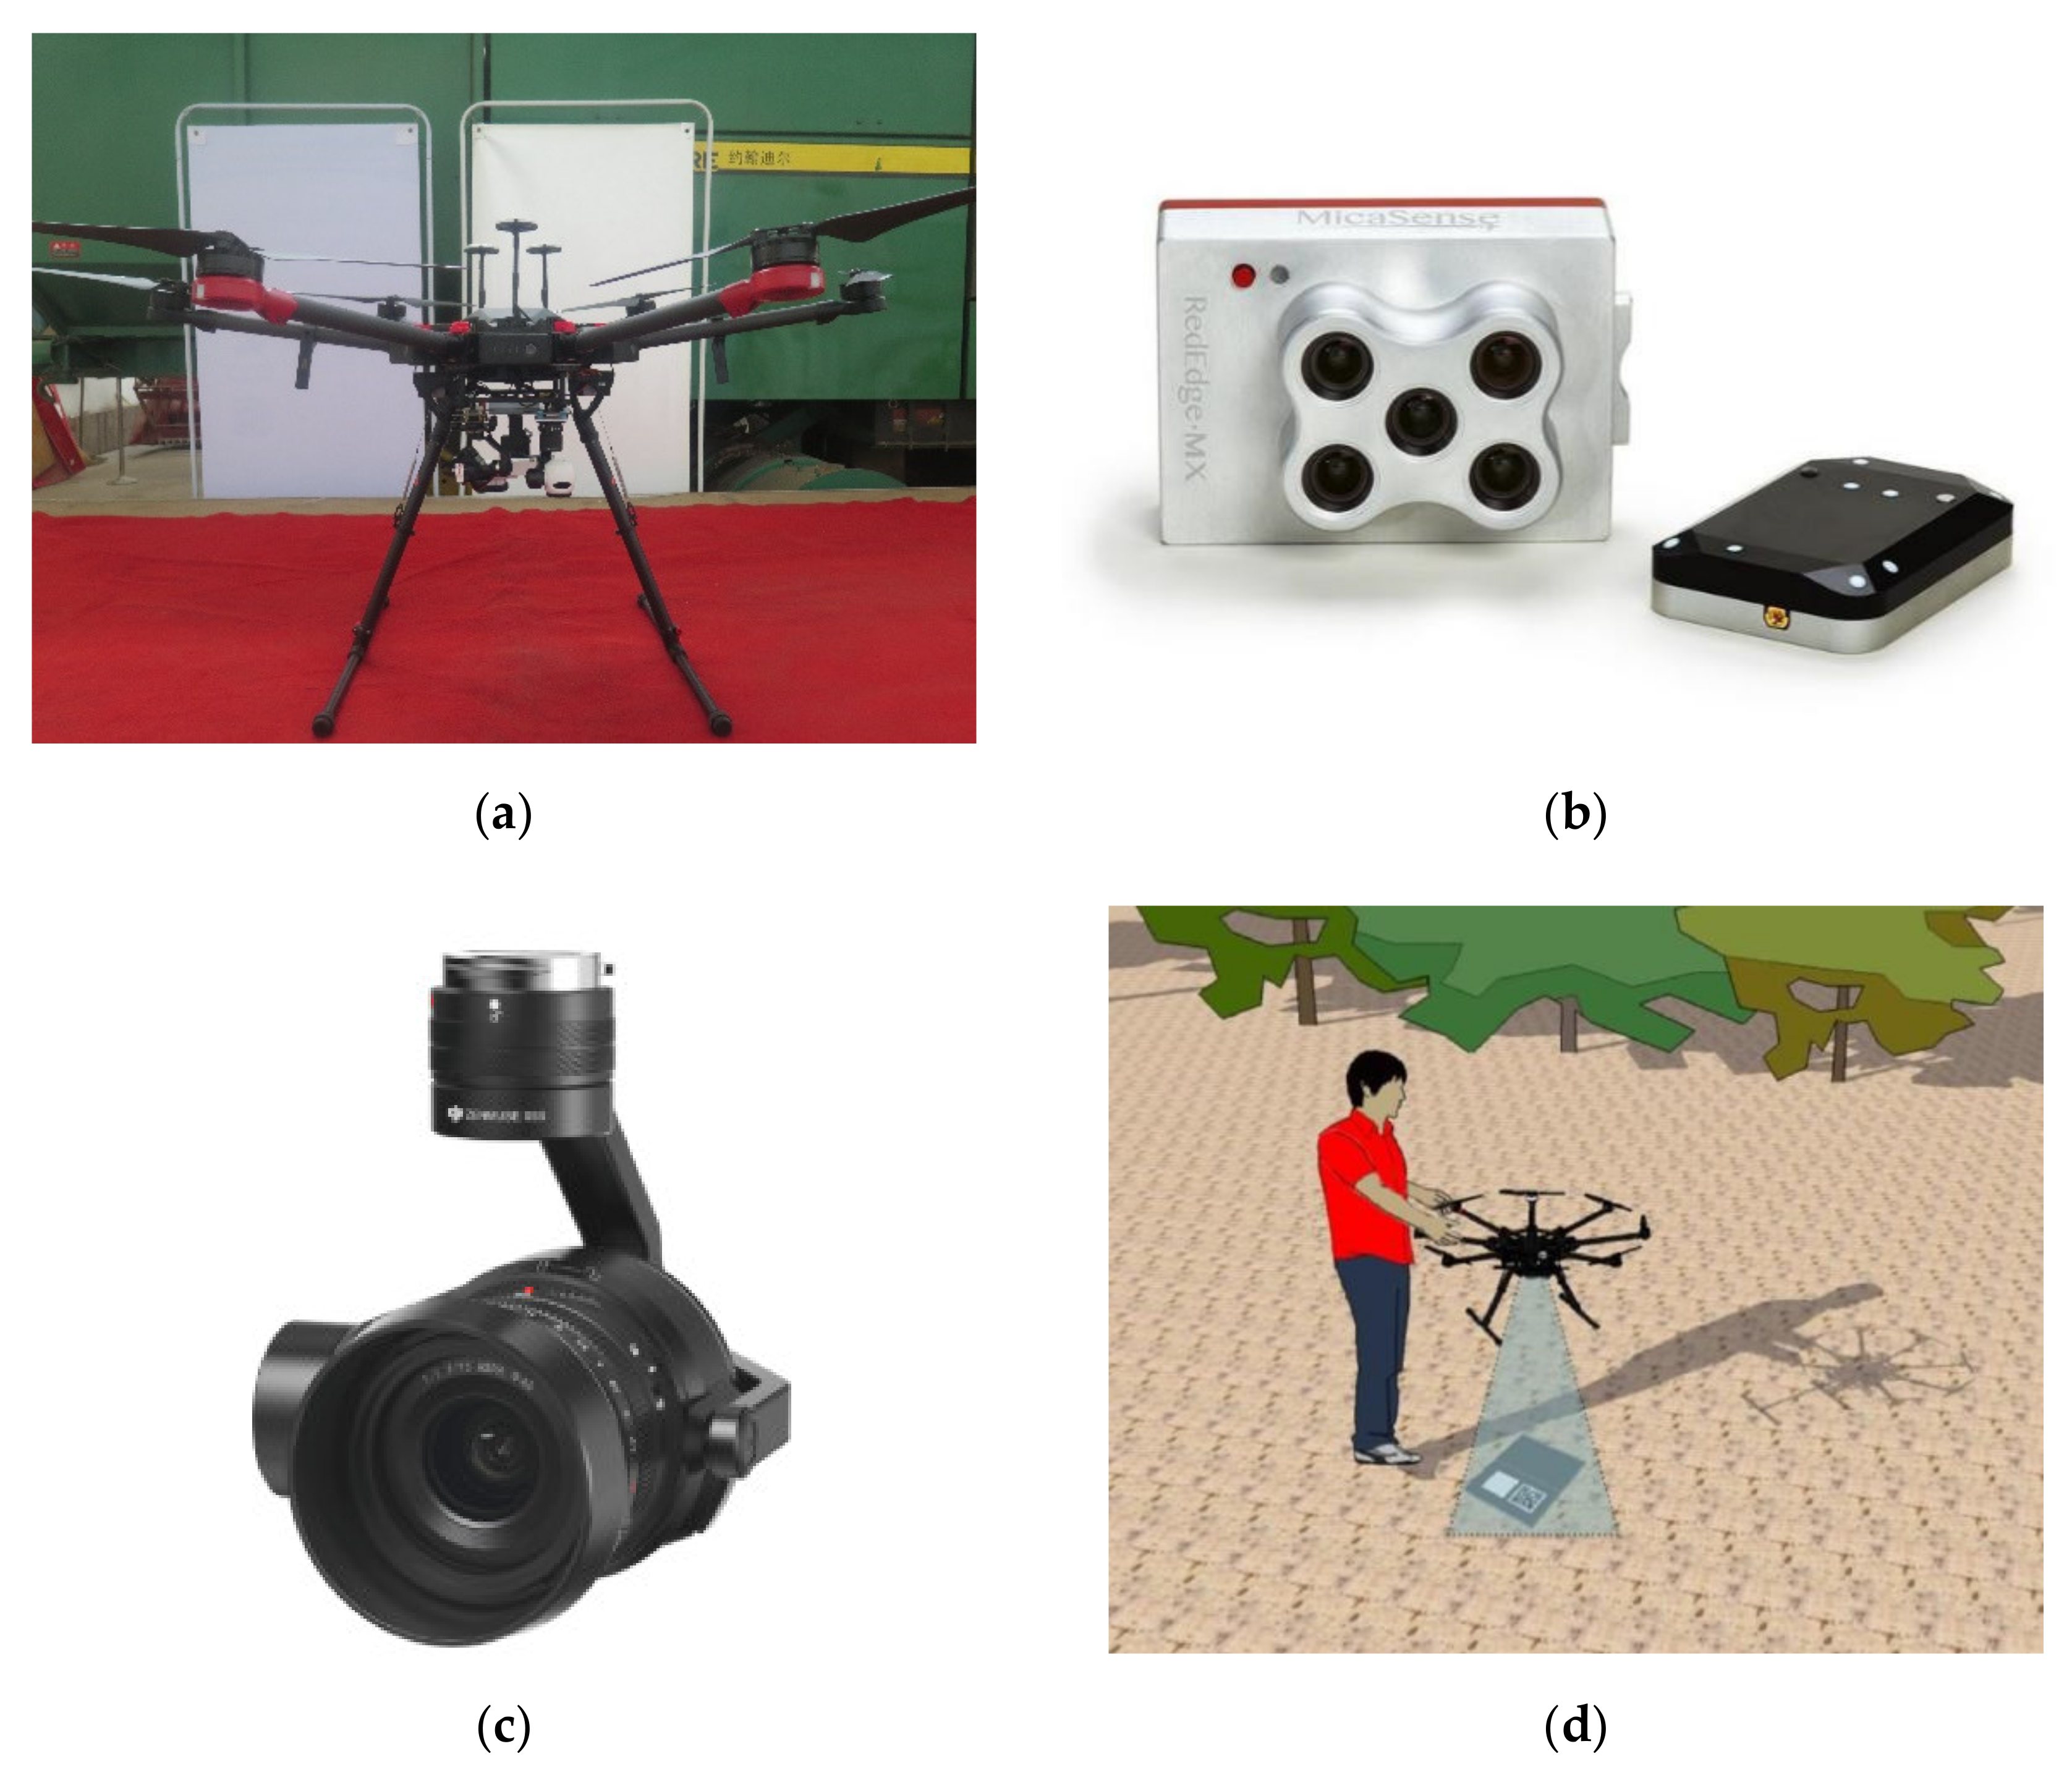
15]. With the development and popularization of agricultural information systems, UAV-based remote-sensing technology has been widely employed in agriculture. Platforms of this technology can carry different vision sensors of the visible, multispectral, hyperspectral, thermal, or infrared types. In comparison to satellite remote-sensing systems, these UAV platforms have relatively better advantages in terms of operational flexibility, time and effort savings, improved ground image resolution, fast and accurate LAI estimation, and finally, effective agricultural monitoring [16,17,18,19]. While earlier remote-sensing methods for LAI estimation have focused mainly on crops such as wheat and maize [17,20,21], relatively few studies have been conducted on LAI estimation for apple trees. This observation attests to the novelty and importance of our present work, which is devoted to the study of apple trees.
China is the world’s largest producer of apples [22]. In fact, China’s apple production is about 35 percent of the total world production, almost five times the apple production of the second-largest apple producer worldwide. At present, pest control in apple orchards is mainly based on chemical pesticides, whose traditional spraying methods often result in uneven distributions, large residues, and serious environmental impacts of these pesticides. To overcome these limitations, a precision spraying technology has been recently developed [6]. Furthermore, the leaf area index (LAI) is a significant parameter for assessing the growth conditions of apple trees, and it is also an important basis for accurate pesticide application to these trees [7,8,9]. Traditional remote-sensing methods for LAI estimation were based on a single vegetation index or a single waveband, which had different degrees of saturation that degraded the estimation performance [23,24,25,26,27]. More recent LAI estimation methods based on using multiple bands or multiple vegetation indices demonstrated superior performance compared to methods based on a single vegetation index or a single waveband [28,29]. Further, machine-learning approaches have been proposed in order to fuse multiple vegetation indices and other relevant data that are strongly correlated with LAI. In fact, the machine-learning models typically outperform single-factor models, can nonlinearly fit many related factors, show higher accuracy, minimize the overall prediction error, and demonstrate good generalization performance [30,31]. Hongming et al. [32] used the gradient-boosting decision tree (GBDT) algorithm to build a model for predicting the maize leaf area index from vegetation index maps. The constructed model achieved a relatively high estimation accuracy with a coefficient of determination (R2) of 0.7558 and a root-mean-square error (RMSE) of 0.0015. Xiong et al. [33] introduced a method for LAI estimation in forest lands using a random forest (RF) model, which resulted in a RMSE and a mean absolute error (MAE) of 0.509 and 0.414, respectively. The RF model accuracy was better than those obtained by a support vector regression (SVR) model and a back propagation (BP) model for the same period [33]. Srinet et al. [34] used an RF algorithm for tree canopy LAI prediction using several predictors, namely, the short-wave infrared bands (SWIR-1 and SWIR-2), the tasseled cap wetness, the moisture stress index (MSI), the normalized difference moisture index (NDMI), and the normalized difference vegetation index (NDVI). The RF model had RMSE and R2 values of 0.14 and 0.79, respectively, and the results showed that this model can be effectively applied to predict the LAI spatial distribution [34]. Qi et al. [35] used BP neural networks to build peanut LAI estimation models based on single and multiple vegetation indices, respectively. Among the compared vegetation indices, the following indices had higher pairwise correlation and higher correlation with the peanut LAI: the modified red-edge simple ratio (MSR) index, the ratio vegetation index (RVI), and the normalized difference vegetation index (NDVI). As well, peanut LAI estimation based on multiple vegetation indices was found to be better than that based on a single vegetation index [35]. The above research results show that the ensemble learning algorithm based on decision trees has strong noise immunity, generalized performance, and high accuracy in crop and wood LAI estimation.
The abovementioned studies show that machine-learning models have been successfully employed in numerous applications of crop parameter estimation from remote-sensing data. However, such models generally have the same key limitations of regression models, namely, model overfitting with limited training data and the difficulty of identifying the most influential factors among the model inputs. The gradient-boosting decision tree (GBDT) algorithm can largely solve these problems. This algorithm builds weak classifiers by allowing each tree to learn the residuals and results of all preceding trees in order to iteratively correct the original model errors and effectively improve the prediction accuracy. The GBDT algorithm can be used as an effective method for the estimation of the LAI of apple orchards. Although the aforementioned studies have created learning-based LAI estimation models with reasonable results, few of these studies addressed the problem of LAI estimation for apple trees.
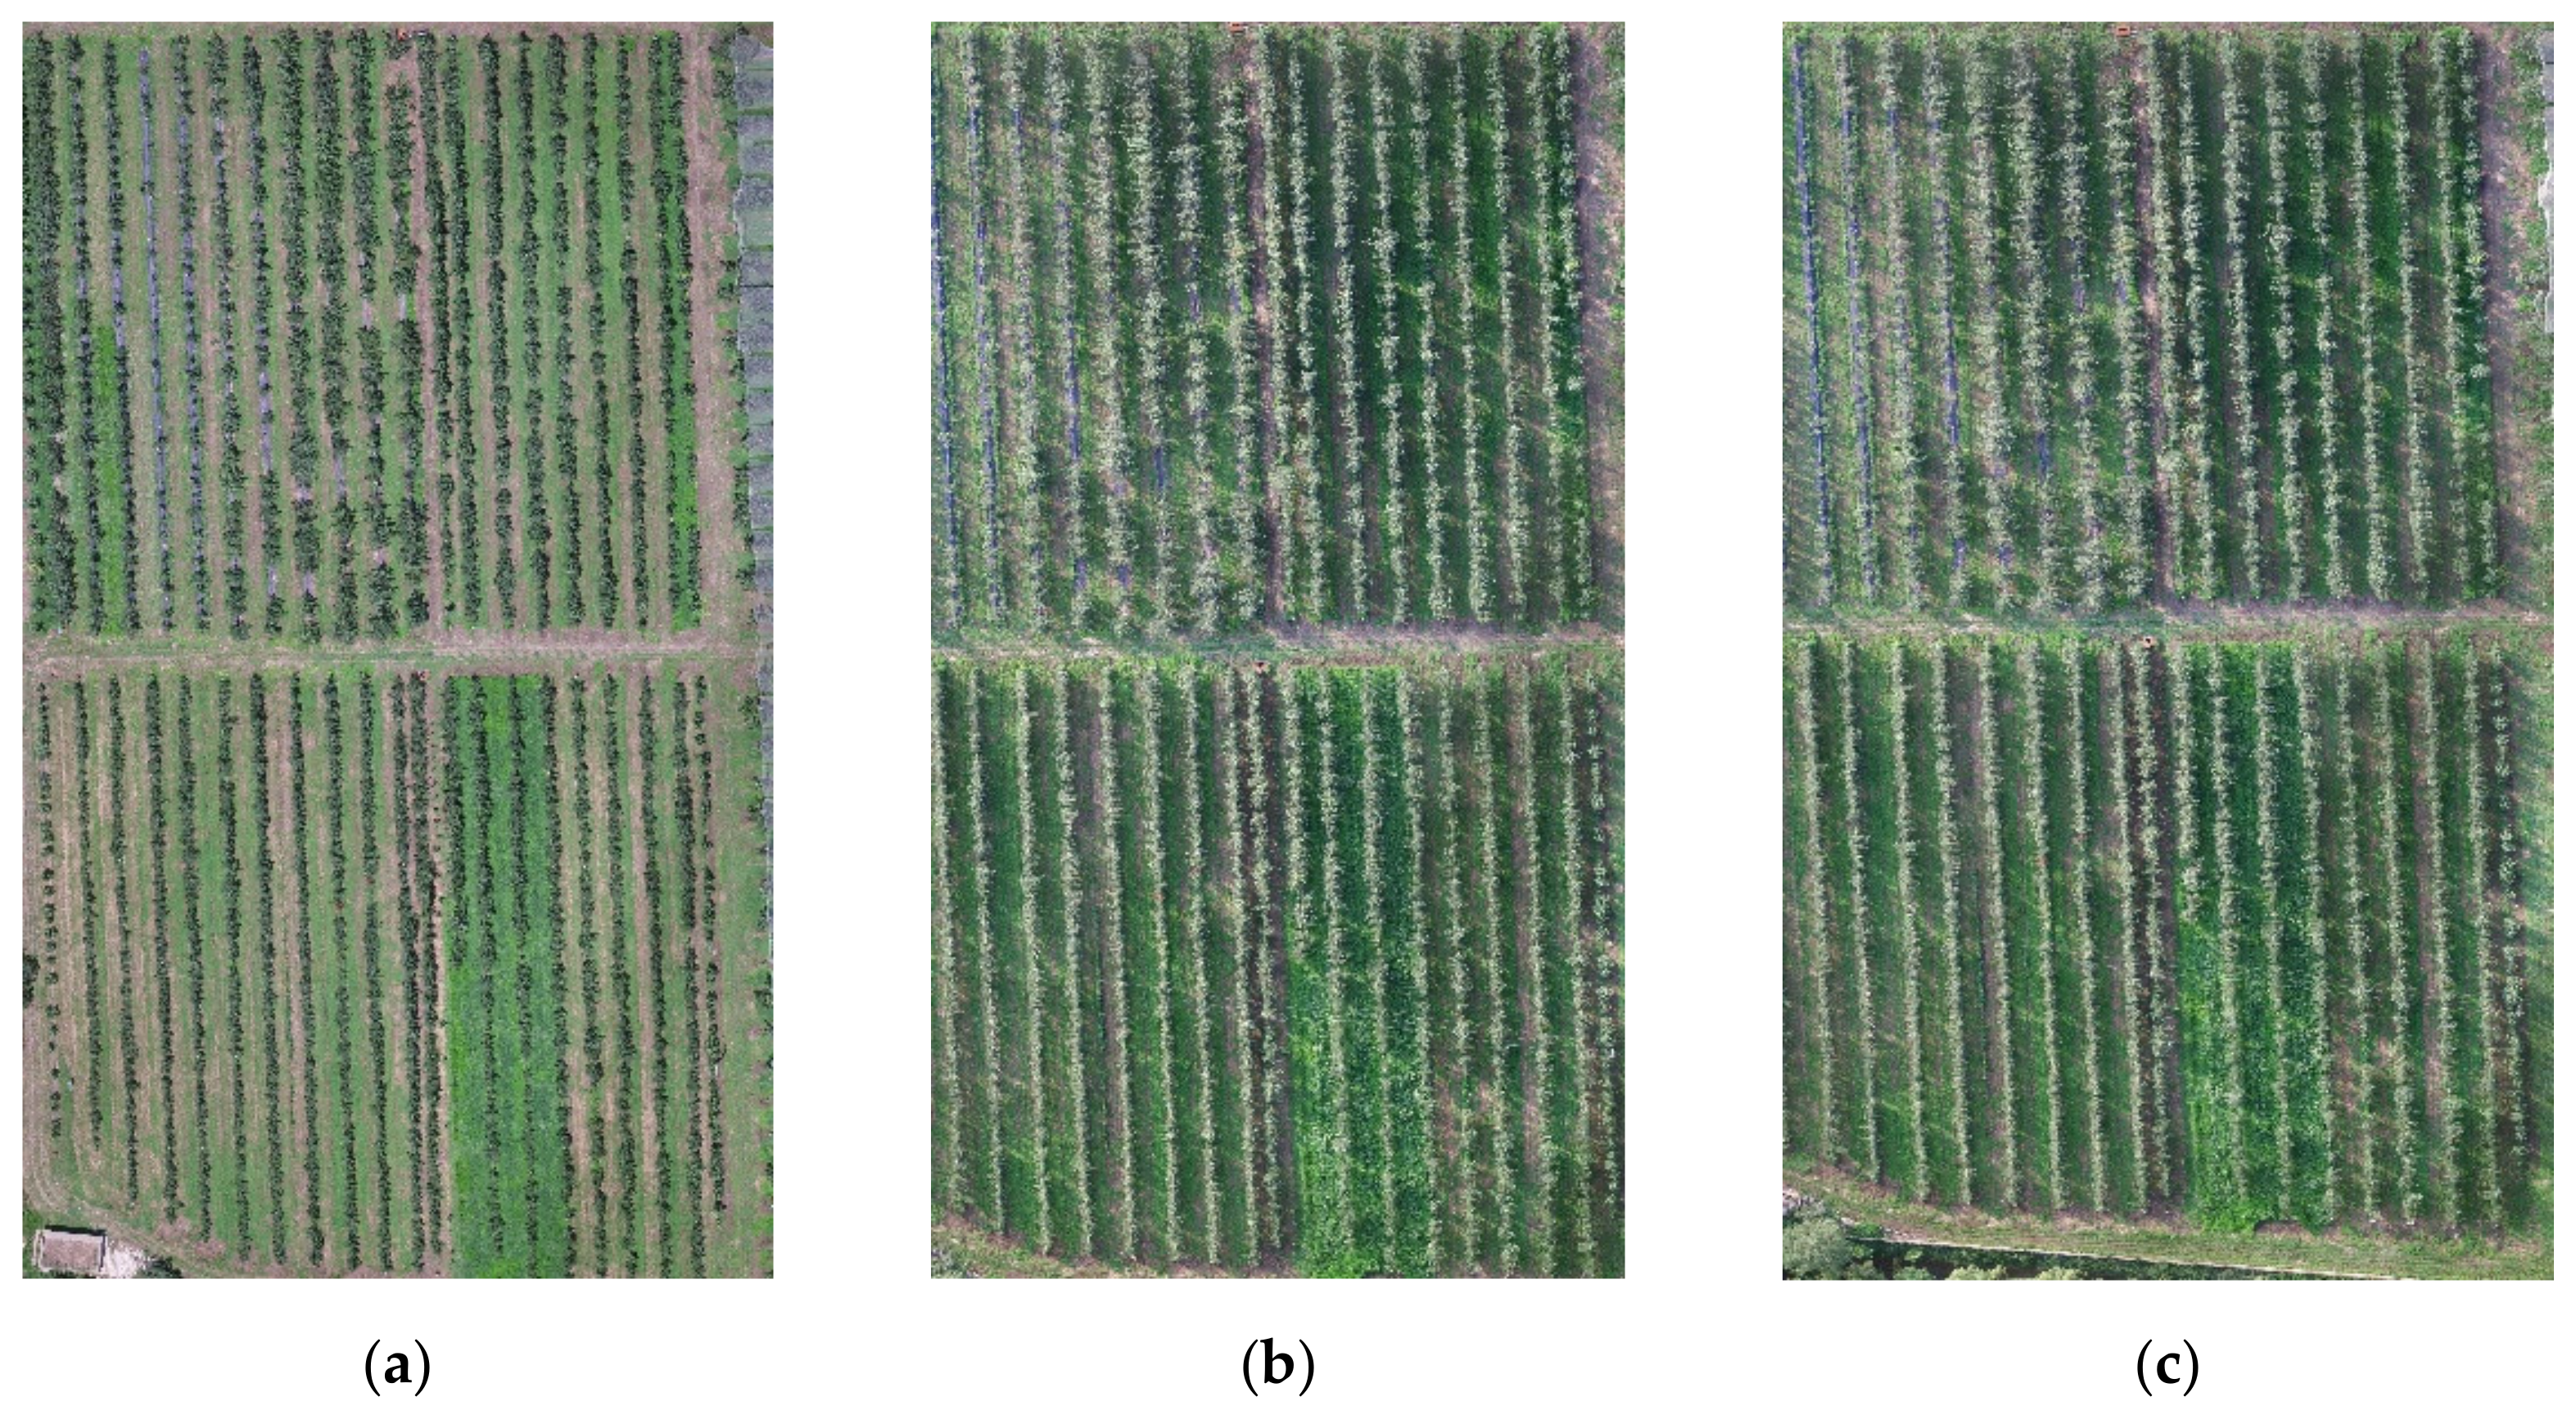
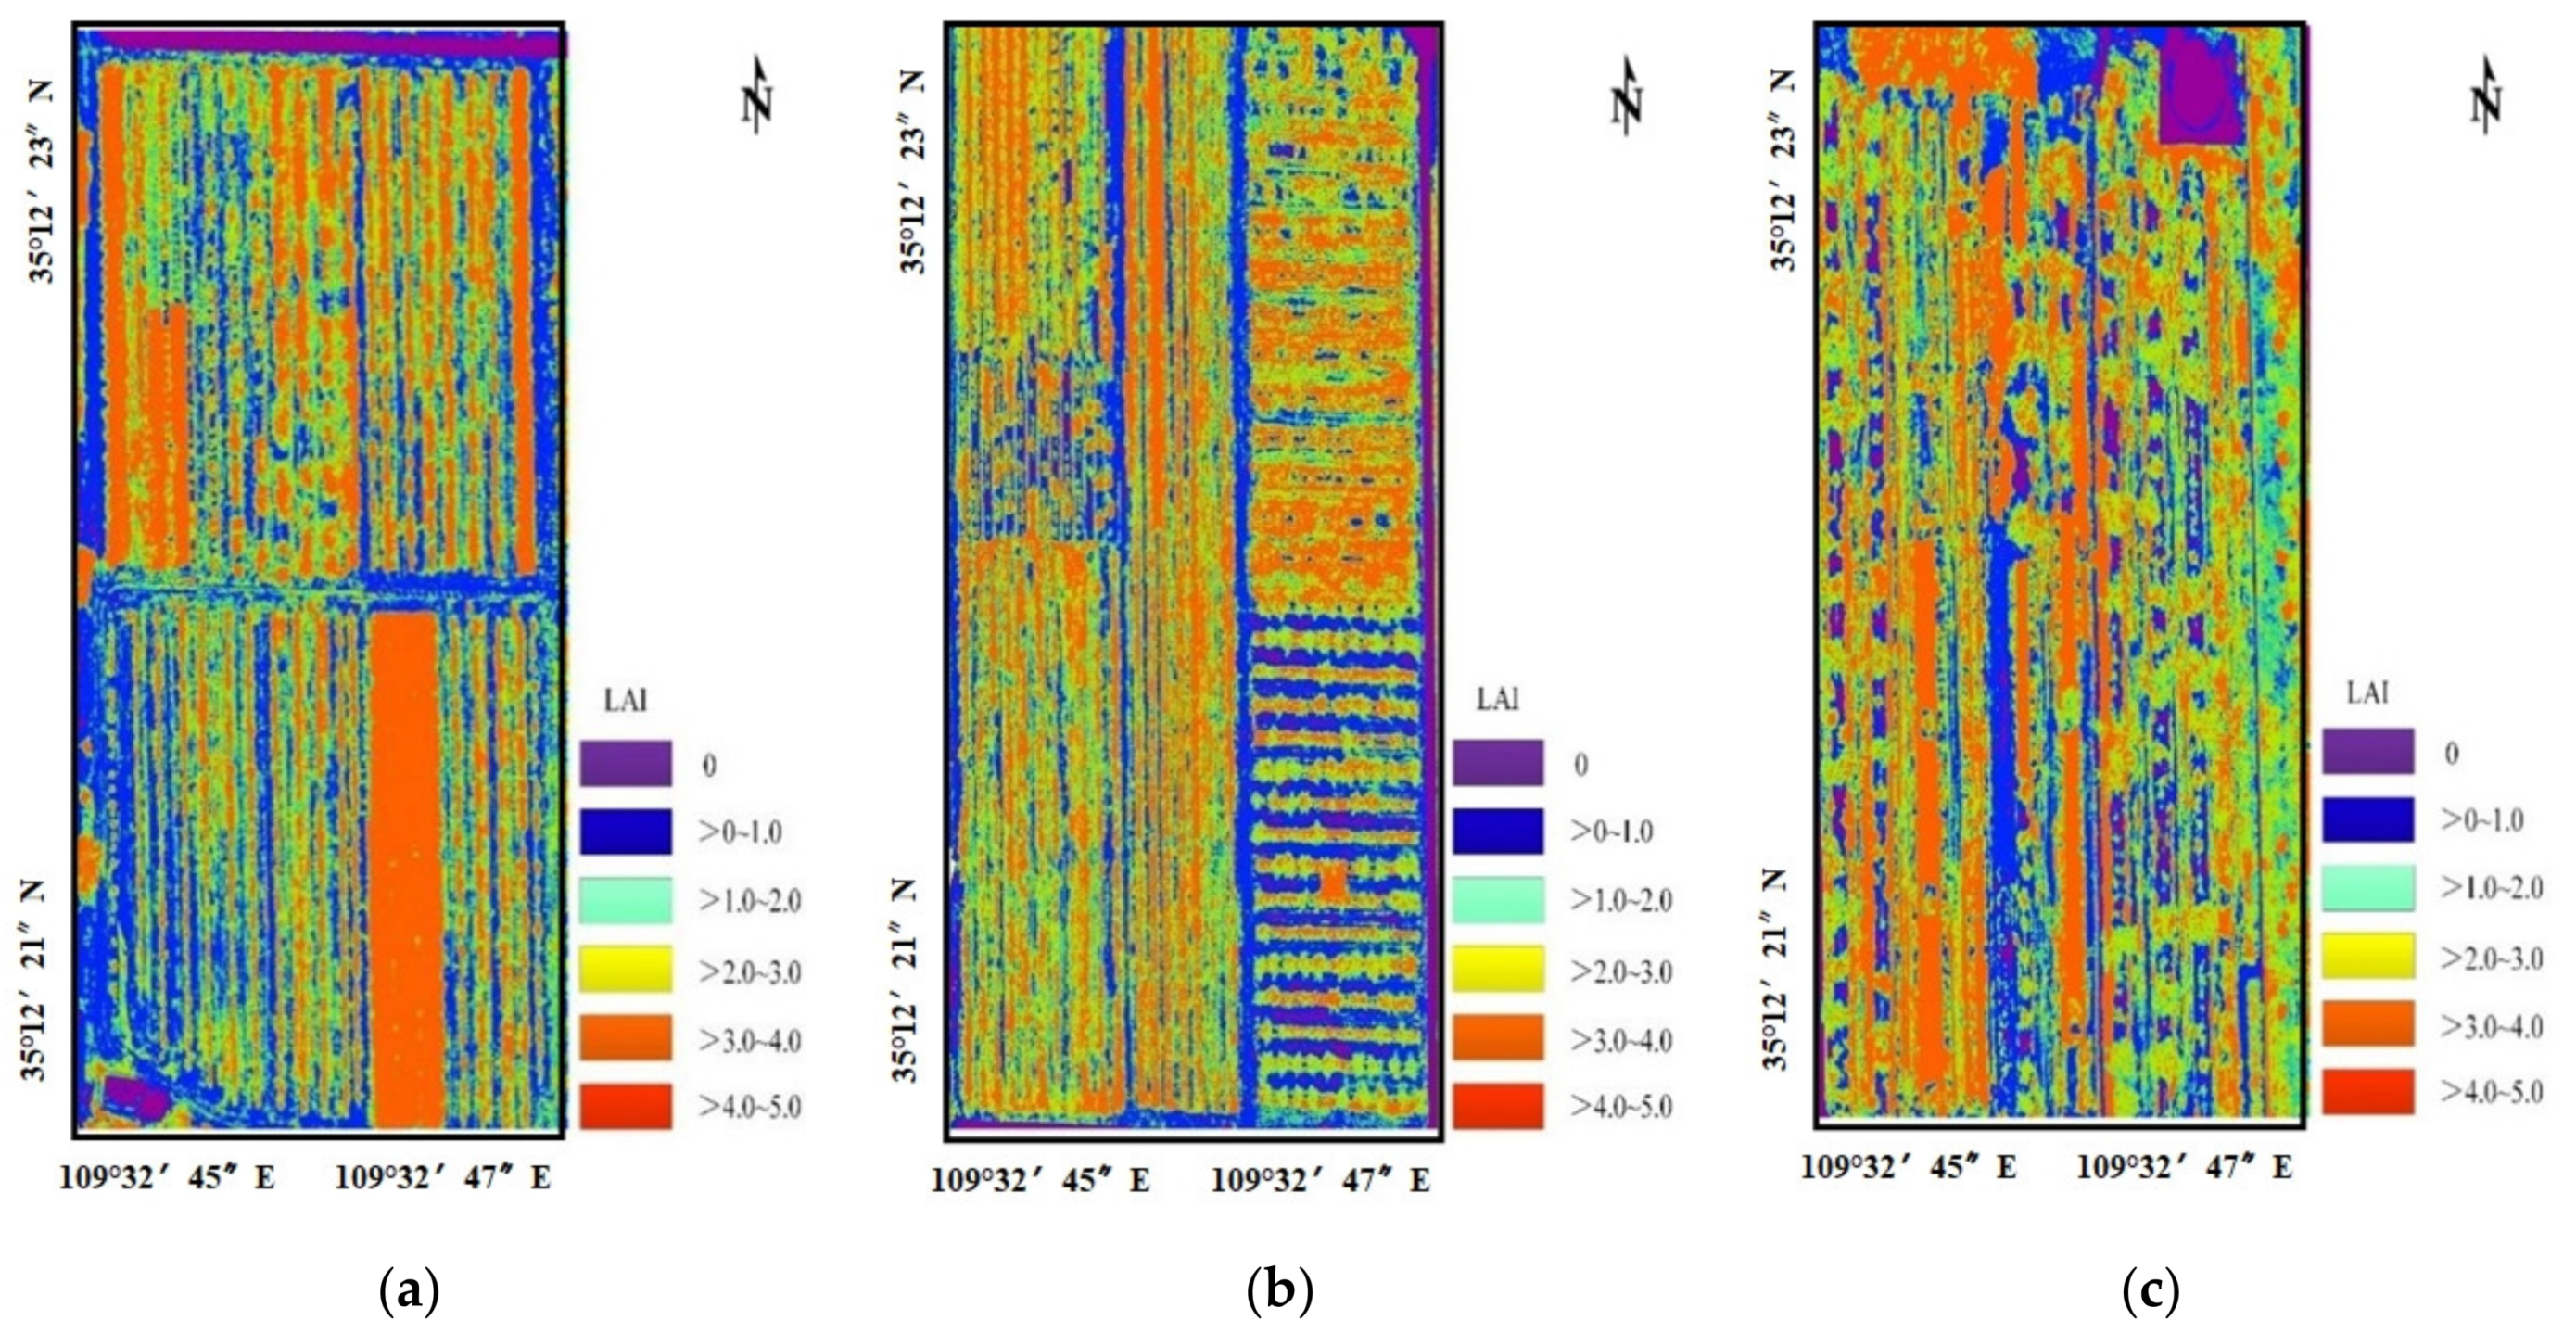
In the present study, five typical vegetation indices were employed for three growth periods of apple trees, namely, the fruit expansion period, the leaf differentiation period, and the new shoot-stopping period. The aim was to establish machine-learning models and select vegetation indices suitable for the remote-sensing estimation of the leaf area indices of apple trees, provide information to support decision making for large-scale apple orchards crops, and also provide a basis for high-precision apple orchard management.

2. Materials and Methods

2.1. Study Area

The study area is located at the Apple Experimental Station of the Northwest Agriculture and Forestry University in Baishui County, Shaanxi Province (35°12′25.46″N, 109°32′49.77″E), China. The geographical location of this area is shown in Figure 1. Baishui County has a temperate continental climate with an average annual temperature of 11.4 °C and a frost-free period of 211 days. The average number of annual sunshine hours is 2163.8 h, the total annual solar radiation is 128.13 kcal/cm2, and the average annual precipitation is 577.8 mm. These climate conditions make the region quite suitable for cultivating apple trees. This study focuses on the “Fuji”, “Golden Delicious”, and “Ruixue” apple trees, and the planting parameters of these apple types are shown in Table 1. In this study, UAV multispectral remote-sensing monitoring was conducted during the fruit expansion stage, the leaf differentiation stage, and the shoot-stopping stage for the three aforementioned types of apple trees grown in the experimental area. In addition, the planting area was divided into three sampling zones according to the dominantly planted species. Specifically, these are called Zone A, Zone B, and Zone C. These zones have apple trees of mainly the “Fuji”, “Golden Delicious”, and “Ruixue” types, respectively. Fifty representative sampling points were selected in each sampling zone, and a differential global positioning system (GPS) (Trimble R8s GNSS System, Trimble Inc., Sunnyvale, CA, USA) was employed. The longitude and latitude values of the northwest and southeast corners of each sampling point were recorded.

2.2. Data Acquisition and Preprocessing

2.2.1. Multi-Spectral Data Acquisition via an Unmanned Aerial Vehicle (UAV)

The equipment used in multispectral data acquisition in this study is shown in Figure 2. The employed drone (or unmanned aerial vehicle (UAV)) is the DJI M600 Pro Hexacopter (DJI Innovation Technology), which is shown in Figure 2a. The selected multispectral image acquisition system is a RedEdge 5-band multispectral camera (MicaSense Inc, USA), shown in Figure 2b. This camera has a resolution of 1280 × 960 pixels, and it is equipped with a light intensity sensor and a correction grey plate. The camera band information is shown in Table 2. Another camera used is a visible light camera, namely, the Zenith X3 HD visible-light camera (DJI Innovation Technology), shown in Figure 2c. During UAV aerial photography, the light intensity sensor is used to reduce the effects of the external light variability on the spectral imaging data. Additionally, the grey plate has a fixed reflectivity, which is exploited in correcting the reflectivity of the aerial images, as shown in Figure 2d.
The experimental testing of the proposed system was conducted on a clear, windless day with a uniform sky. The testing time was chosen from 11:30–14:30 Beijing time, and the UAV had a flight height of 70 m, a north–south flight direction, a heading overlap of 90%, and a side overlap of 80%. Meanwhile, the flight speed was 3 m/s, and an imaging mode with equidistant intervals was adopted. Ambient conditions and relevant parameters of the UAV remote-sensing data collection are shown in Table 3.
After completing each UAV image acquisition session, the captured images were time-stamped and imported into the Pix4D Mapper software (developed by the Swiss company Pix4D). Additionally, the ground image control points were obtained by the Real Time Kinematic (RTK) tool, and the Position and Orientation System (POS) data associated with each small map were imported. The Pix4D Mapper software performed geometric correction, stitching, and other pre-processing operations in order to produce a high-definition ortho-rectified multispectral image of the test area. Eight data collection sessions were carried out from the 20th of June 2020 to the 15th of August 2020, covering the apple growth stages of fruit expansion, leaf differentiation, and shoot stopping. After pre-processing the data samples by the Pix4D Mapper software, these samples were imported into the ENVI software. The multispectral images captured at each sampling point were cropped according to the GPS measurements of the longitude and latitude values of the northwest and southeast corners of that sampling point.

2.2.2. Ground-Truth LAI Measurements for Apple Orchards

Ground-truth LAI measurements were made in parallel with the UAV multispectral remote-sensing data acquisition sessions. The measuring instrument was the LAI-2200C Plant Canopy Analyzer (LI-COR, Lincoln, NE, USA), which is shown in Figure 3. LAI-2200C uses a non-destructive method for easy and accurate LAI measurement. This analyzer is based on the proven LAI-2000 technology platform and has a built-in GPS module that incorporates GPS information. The LAI data acquisition process may be influenced by the weather, sunlight, tree shadows, and other environmental factors. To account for these effects and ensure the truth and validity of the collected data, the LAI-2200C is scatter-corrected by using appropriate specifications. Additionally, as apple trees are essentially arranged in rows, the diagonal measurement method was chosen for LAI determination based on the LAI-2200C manual. This method requires the measurement of the B-value at evenly distributed points on the diagonal of each two rows of fruit trees. B-value is the value measured by a canopy analyzer from up to down For LAI measurement with the LAI-2200C analyzer, the shade cap was set to 270°, one A-value was measured in each sampling plot, and five B-values were measured at evenly distributed points on the diagonal between each two rows of fruit trees. For row-planted and dense-canopy vegetation such as apple trees, the diagonal measurement method used herein better reflects the uniformity of the spatial distribution.
A total of 1200 LAI sets was collected during the eight sessions. The LAI measurements had a maximum value of 4.36, a minimum value of 2.00, a maximum variance of 0.937, and a maximum standard deviation of 0.968 (see Table 4 for details).

2.3. Remote-Sensing Method for LAI Estimation

2.3.1. Vegetation Indices

The LAI values of the apple trees are strongly correlated with the visible bands (red, green, and blue) and the near-infrared bands of the spectral images of the apple trees. The absorption and scattering effects of the vegetation on the numbers of incident photons at different wavelengths result in characteristic spectral responses. In particular, the vegetation exhibits strong absorption and reflection phenomena in the red and near infrared bands, respectively, and numerous studies have demonstrated that these two bands are well correlated with vegetation cover and the LAI. In this study, nine vegetation indices (namely, NDVI, GNDVI, RVI, EVI, SAVI, DVI, IPVI, WDVI, and GARI) were investigated for accurate LAI estimation in apple trees during the fruit expansion, leaf differentiation, and shoot-stopping periods. Table 5 lists the abbreviation, full name, related bands, mathematical formula, and references for each of these nine vegetation indices.

2.3.2. Support Vector Regression

Support vector regression (SVR) is a machine-learning method based on statistical learning theory where learning is formulated as a quadratic programming problem and the optimal solution is obtained through the minimization of a structural risk criterion [46,47,48,49,50]. This method was originally used for solving classification problems and has eventually evolved to solve regression problems. Currently, the SVR method has been widely used for crop LAI estimation. Since the SVR-based prediction accuracy is largely determined by the kernel type and other related parameters, the determination of these parameters is the key design consideration in SVR modeling.

2.3.3. Gradient-Boosting Decision Trees

Gradient-boosting decision trees (GBDT) have been widely used in regression and classification tasks. In the GBDT method, predictive models are generated in the form of an ensemble of weak learners, which are then iteratively combined into a stronger learner [51,52,53]. Each decision tree is iteratively tuned to reduce the residuals of the preceding tree in the direction of the gradient. Specifically, a weak learner is sought where a classification and regression tree (CART) model is fit to the residuals of a preceding model in order to minimize the loss (or error) between the output and true values. The final predictive model at a specific iteration is obtained by summing the outputs of all models from the previous iteration. The GBDT algorithm has the advantages of flexibility in handling a wide range of data, high prediction accuracy, use of robust loss functions, and strong robustness to outliers.

2.4. Soil Interference Rejection in Remote-Sensing Images

Although the accuracy of the UAV remote-sensing imaging process is high, the soil background image components constitute a large proportion of the whole spectral image of the study area. In order to extract the vegetation components accurately, these soil components need to be identified and eliminated. In this study, the Otsu segmentation method was used for thresholding the vegetation index maps after stitching the images of the three growth periods [54]. The Otsu algorithm creates an image histogram and automatically selects a global segmentation threshold at which the interclass variance is maximized. The best segmentation threshold was found to be 0.4. This threshold was used to mask out and reject the soil background components. The technical process is shown in Figure 4.

2.5. Model Construction for the Apple Tree LAI Estimation

In this study, a total of 450 sets of data (with 150 sets for each of the three zones A, B, C) was collected during the fruit expansion stage. Additionally, a total of 435 sets of data was collected during the leaf differentiation stage, including 150 sets in Zone A, 145 sets in Zone B, and 140 sets in Zone C. As well, a total of 300 sets of data was collected during the shoot-stopping stage, including 100 sets in Zone A, 100 sets in Zone B, and 100 sets in Zone C. Figure 5 shows the change in the apple tree growth patterns in Zone A during the three growth stages.
The overall set of the collected LAI data is partitioned into training and test subsets in the ratio 3:1. The test data consist of 300 sets of data from Zone C, while the rest of the data constitute the training dataset. The distribution of the sets of data across various zones and stages is shown in Table 6.
The SVR and GBDT algorithms were implemented in Python and were, respectively, used to construct models for LAI estimation in each growth stage of the apple trees. For the prediction model in each growth stage, the vegetation indices were used as the independent variables, and the apple LAI value was used as the dependent variable.
The SVR model was implemented using the LIB-SVR library in Python. The radial basis function was chosen as the SVR kernel while the best values of the other parameters were set through the network search method. The penalty factor was set to c = 8, while the kernel function parameter was set to g = 0.36321. These settings led to a minimum cross-validation mean-square error of CVmse = 0.0079561. Likewise, the GBDT algorithm and the regression method were implemented in Python. In order to avoid overfitting, the number of sub-models (n-estimators) of each training set was set to 500, and the number of trees was determined through multiple experiments. The maximum depth (max-depth) was set to 4, and the minimum absolute deviation (1ad) was selected as the loss function (loss).

2.6. Model Evaluation

In this study, the coefficient of determination (R2), the root-mean-square deviation (RMSD) (also known as the root-mean-square error (RMSE)), and the spatial efficiency (SPAEF) metric were used to evaluate the accuracy of the estimation model [55,56,57].
The coefficient R2 takes a value between 0 and 1. The closer it is to 1, the closer the predicted LAI value is to the ground-truth measurement, and the better its prediction is. The coefficient R2 is expressed mathematically as [55,56]
R 2 = 1 i = 1 n x i y i 2 i = 1 n x i x ¯ 2
where x is the i-th measured LAI value, x ¯ is the mean of the LAI measurements, y i is the ith predicted LAI value, and n is the number of LAI samples.
The RMSD mainly reflects the difference between the predicted and measured LAI values. For the same sample, the smaller the RMSD value, the higher the accuracy of the constructed model is. The RMSD mathematical expression is
R M S D = i = 1 n ( y i x i ) 2 n - 1
where, as before, x i is the ith measured LAI value, y i is the ith predicted LAI value, and n is the number of LAI samples.
Spatial efficiency (SPAEF) is a metric that reflects the spatial variability of the model prediction accuracy [57,58]. This metric is mathematically expressed as
S P A E F = 1 ( α 1 ) 2 + ( β 1 ) 2 + ( γ 1 ) 2
where α is the Pearson correlation coefficient between the observed (obs) and predicted (pre) patterns, β is the fraction of the coefficient of variation representing spatial variability, and γ is the histogram intersection measure computed for the given n-bin histogram K of the observed patterns and the n-bin histogram L of the simulated patterns. The z score of the patterns is used to compute γ in order to enable the comparison of variables with different units and ensure bias insensitivity.

3. Results

3.1. Correlation Analysis

3.1.1. Correlation Analysis between the Apple LAI and Vegetation Indices

For the data obtained from the three stages, a total of 1200 sets of data was selected with different growth stages (or different acquisition times). The correlation analysis was carried out (using the SPSS software) between each of the vegetation indices in Table 7 and the measured LAI.
By consulting the correlation-coefficient significance-testing table, a correlation of 0.081 or more at a confidence level of 0.01 is considered significant for a sample of 1200. This shows significant LAI correlation with each of the five vegetation indices at a confidence level of 0.01, and hence, the experimental requirements are satisfied.

3.1.2. Data Autocorrelation Analysis

In order to assess the autocorrelation of all spatial variables, the Moran’s I statistic and the p value were employed. In particular, spatial autocorrelation analysis was conducted for the five vegetation indices and the LAI during the fruit expansion stage, the leaf differentiation stage, and the shoot-stopping stage. The analysis was carried out by the GeoDa and JMP software tools. The results are shown in Table 8.
As shown in Table 8, the Moran’s I statistic of each spatial variable is greater than 0, and the p-value is less than 0.05. Thus, the data in our study have significant spatial autocorrelation.

3.2. Model Performance Evaluation and Comparison

3.2.1. Analysis of Model Bias

The LAI prediction outcomes were obtained for the GBDT and SVR models based on the test dataset (which is separate from the training one). The prediction performance of each model was evaluated through comparing the predicted and ground-truth measurement values. Regression analysis was performed on the measured and predicted LAI data, and the corresponding regression lines were found for the GBDT and SVR models. Results and plots of these lines are shown in Table 9 and Figure 6, Figure 7 and Figure 8.
Table 10 shows the results of the t-test for the intercept a and the slope b of the curve fitted between the predicted and measured values.
It can be seen from Table 9 and Table 10 and Figure 6, Figure 7 and Figure 8 that the coefficient R2 of the GBDT model is above 0.770, while its RMSD is below 0.4 at different growth stages of the apple trees. Additionally, the evaluation indicators of the GBDT model are better than those of the SVR model. In fact, Figure 6, Figure 7 and Figure 8 show that the GBDT model can match the 1:1 line better than the SVR model, and this shows that the prediction accuracy of the GBDT model is also much higher than that of the SVR model. This superiority of the GBDT algorithm can be ascribed to its ability to improve the estimation accuracy by setting different loss functions with a relatively small tuning time. On the other hand, the SVR model is more sensitive to the selection of the kernel function and the other parameters. Hence, the SVR model typically shows less accurate estimates compared to the GBDT model and also suffers from the excessive computational burden to search for suitable kernel and parameter settings. For different growth stages, the GBDT model had the best prediction performance with an R2 of 0.846 and an RMSD of 0.356 at the shoot-stopping stage. The GBDT model predictions for the leaf differentiation and fruit expansion stages were generally similar, but still lagged behind those of the shoot-stopping stage. The relatively better performance during the shoot-stopping stage is because the apple orchards were weeded and sprayed with a nutrient solution, and thus, the fruit trees were more vigorous during this period while the external factors (such as weeds) had less influence on the collection of remote-sensing data. For the other two growth periods, the influence of the external factors (such as weeds) resulted in worse model estimates compared to the shoot-stopping stage.
In summary, both the SVR and GBDT models enable LAI inversion for apple trees, and the GBDT inversion results were more satisfactory compared to those of the SVR model. Therefore, the GBDT model should be more preferable for remote-sensing-based LAI estimation in apple orchards.

3.2.2. Performance Analysis Based on Spatial Metrics

The results of the evaluation of the spatial metrics of the GBDT and SVR models are shown in Table 11. Obviously, the GBDT model significantly outperforms the SVR model, with the optimal SPAEF value for the GBDT model reaching 0.57, while that of the SVR model is just 0.31.
In summary, the GBDT model outperforms the SVR model in terms of the SPAEF metric. This is the same conclusion when the model bias is evaluated in terms of spatial metrics.
The LAI of the apple trees in the study area was estimated by the GBDT model for the three apple growth periods, namely, the fruit expansion period, the leaf differentiation period, and the shoot-stopping period. The spatial LAI distributions for Ruixue apple orchards in the Baishui Apple Experimental Station were visualized based on the GBDT model using ArcGIS10.3, as shown in Figure 9, Figure 10 and Figure 11.
The LAI values of apple trees in the trial area ranged from 0 to 5, with Fuji having the largest LAI value, followed by Golden Delicious, and with Ruixue having the smallest value. This is mainly because Fuji and Golden Delicious are mainly densely planted and have tall canopies, and their LAI values are relatively large. On the other hand, the Ruixue apples represent a new variety with short saplings and small canopies, and this apple type is mainly planted on dwarf rootstocks, with relatively large row and plant spacing, and hence, has a relatively small LAI value. For the different growth periods, the LAI of apple trees in each sampling area gradually increases between the fruit expansion period and the shoot-stopping period. This is due to the fact that the orchards in the test area were thinned before the fruit expansion period, and the LAI of the fruit trees gradually increased after about two months of development.
In summary, the LAI estimation in apple trees based on the GBDT algorithm can well reflect the LAI temporal and spatial variations and can effectively realize the LAI estimation for apple trees.

4. Discussion

The UAV-based remote sensing is an important tool for quickly obtaining information on vegetation in large-scale areas of apple orchards. As well, the apple tree LAI is highly correlated with general vegetation indices of fruit trees. Most of the previous studies used a single vegetation index for remote-sensing estimation, and the number of investigated vegetation indices was relatively small. A single vegetation index contains information on only a single band and may have different degrees of saturation. Thus, poor generalization performance is typical in remote-sensing models for LAI estimation where a single vegetation index is used. In this study, the LAI of apple trees was estimated using multiple growth periods and multiple vegetation indices. This approach allowed relatively comprehensive LAI estimation for apple trees in different growth periods.
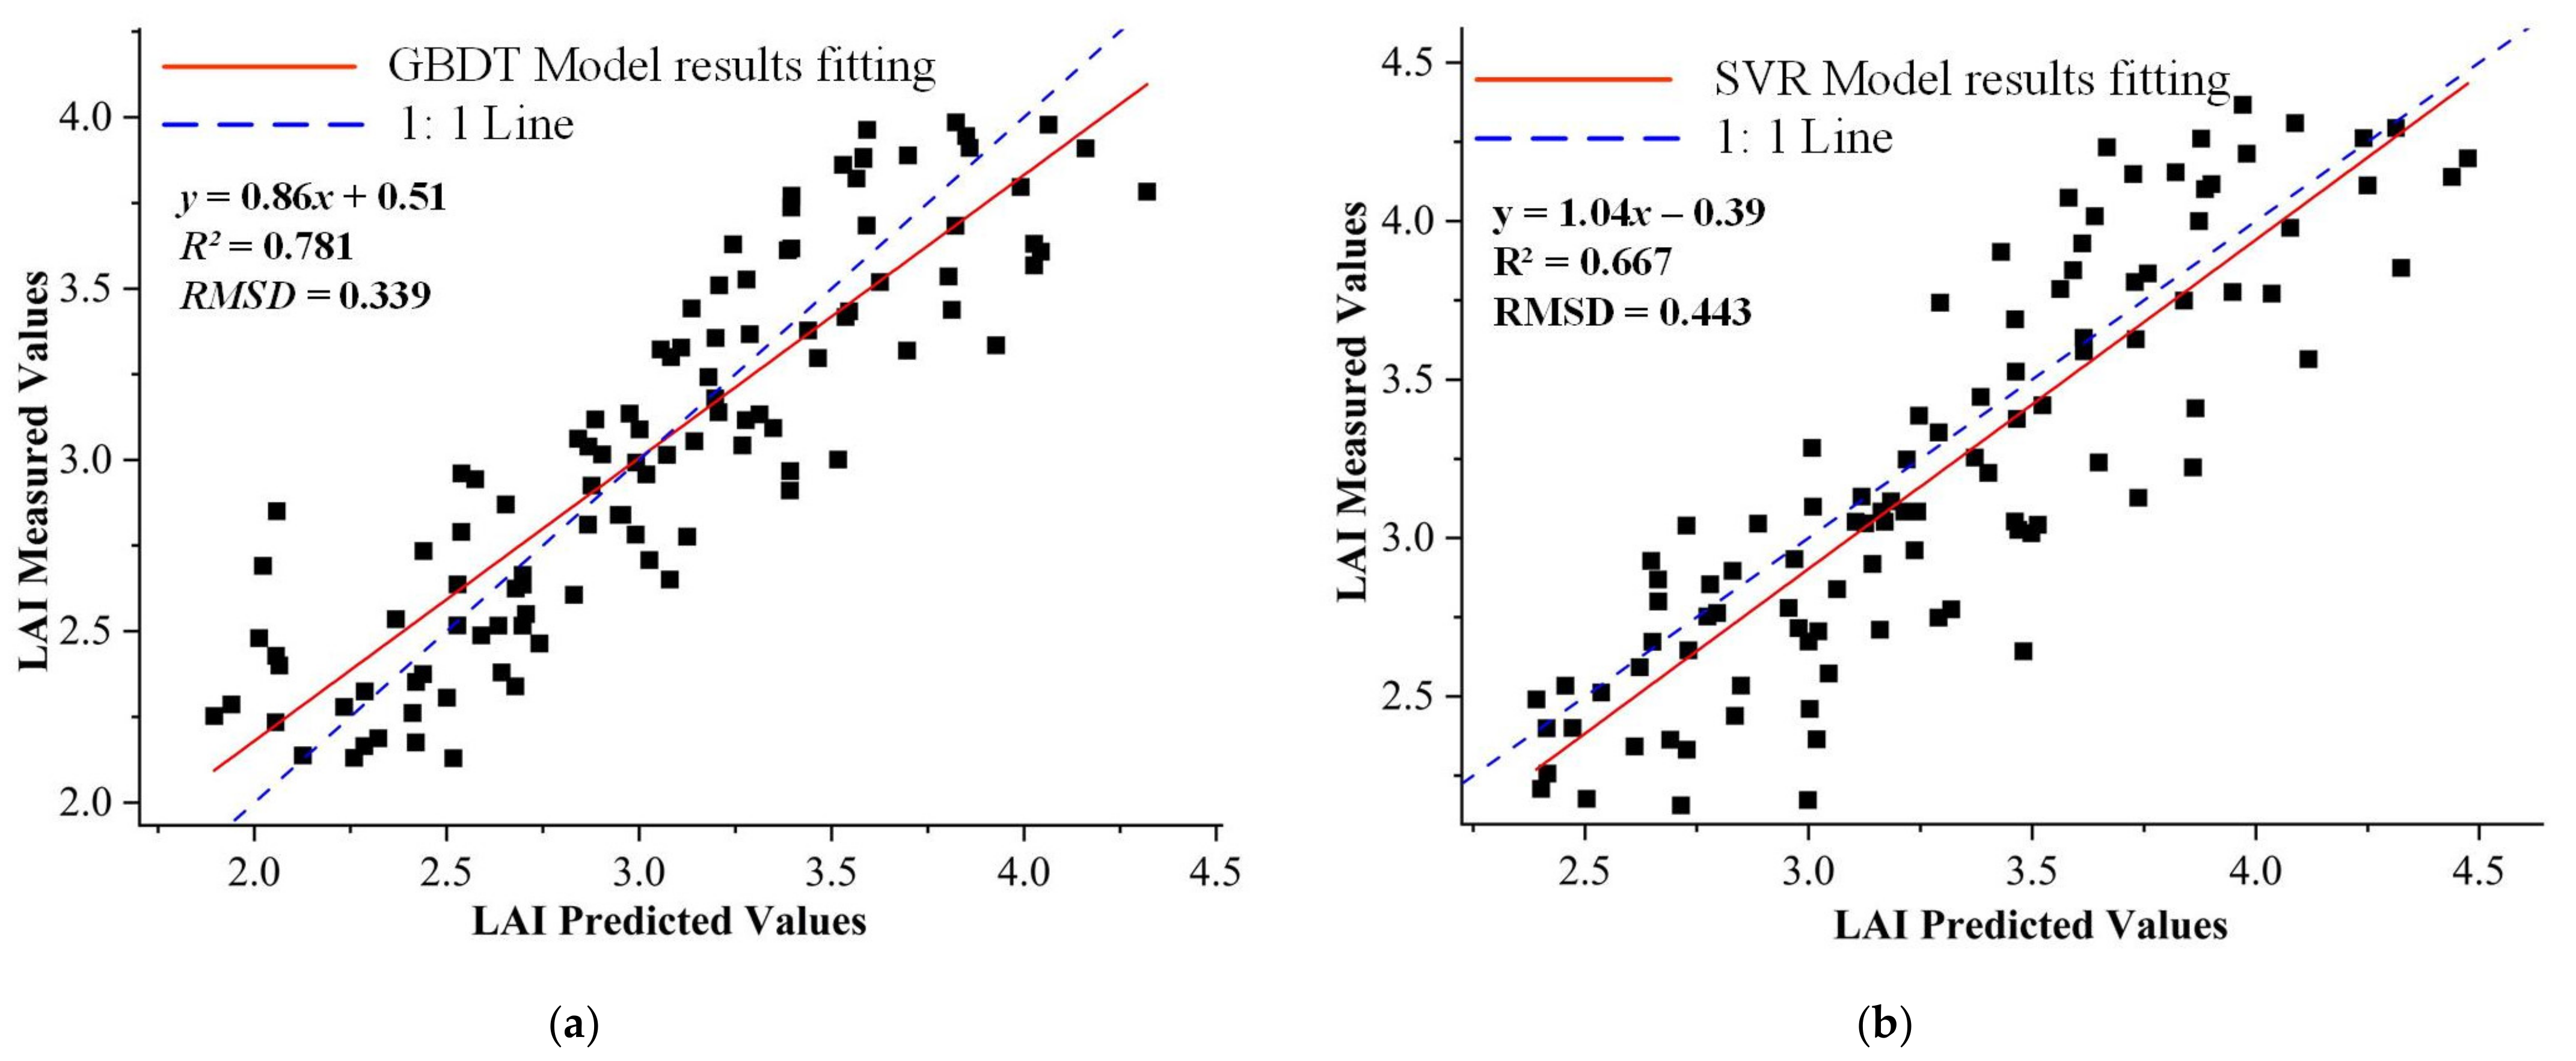
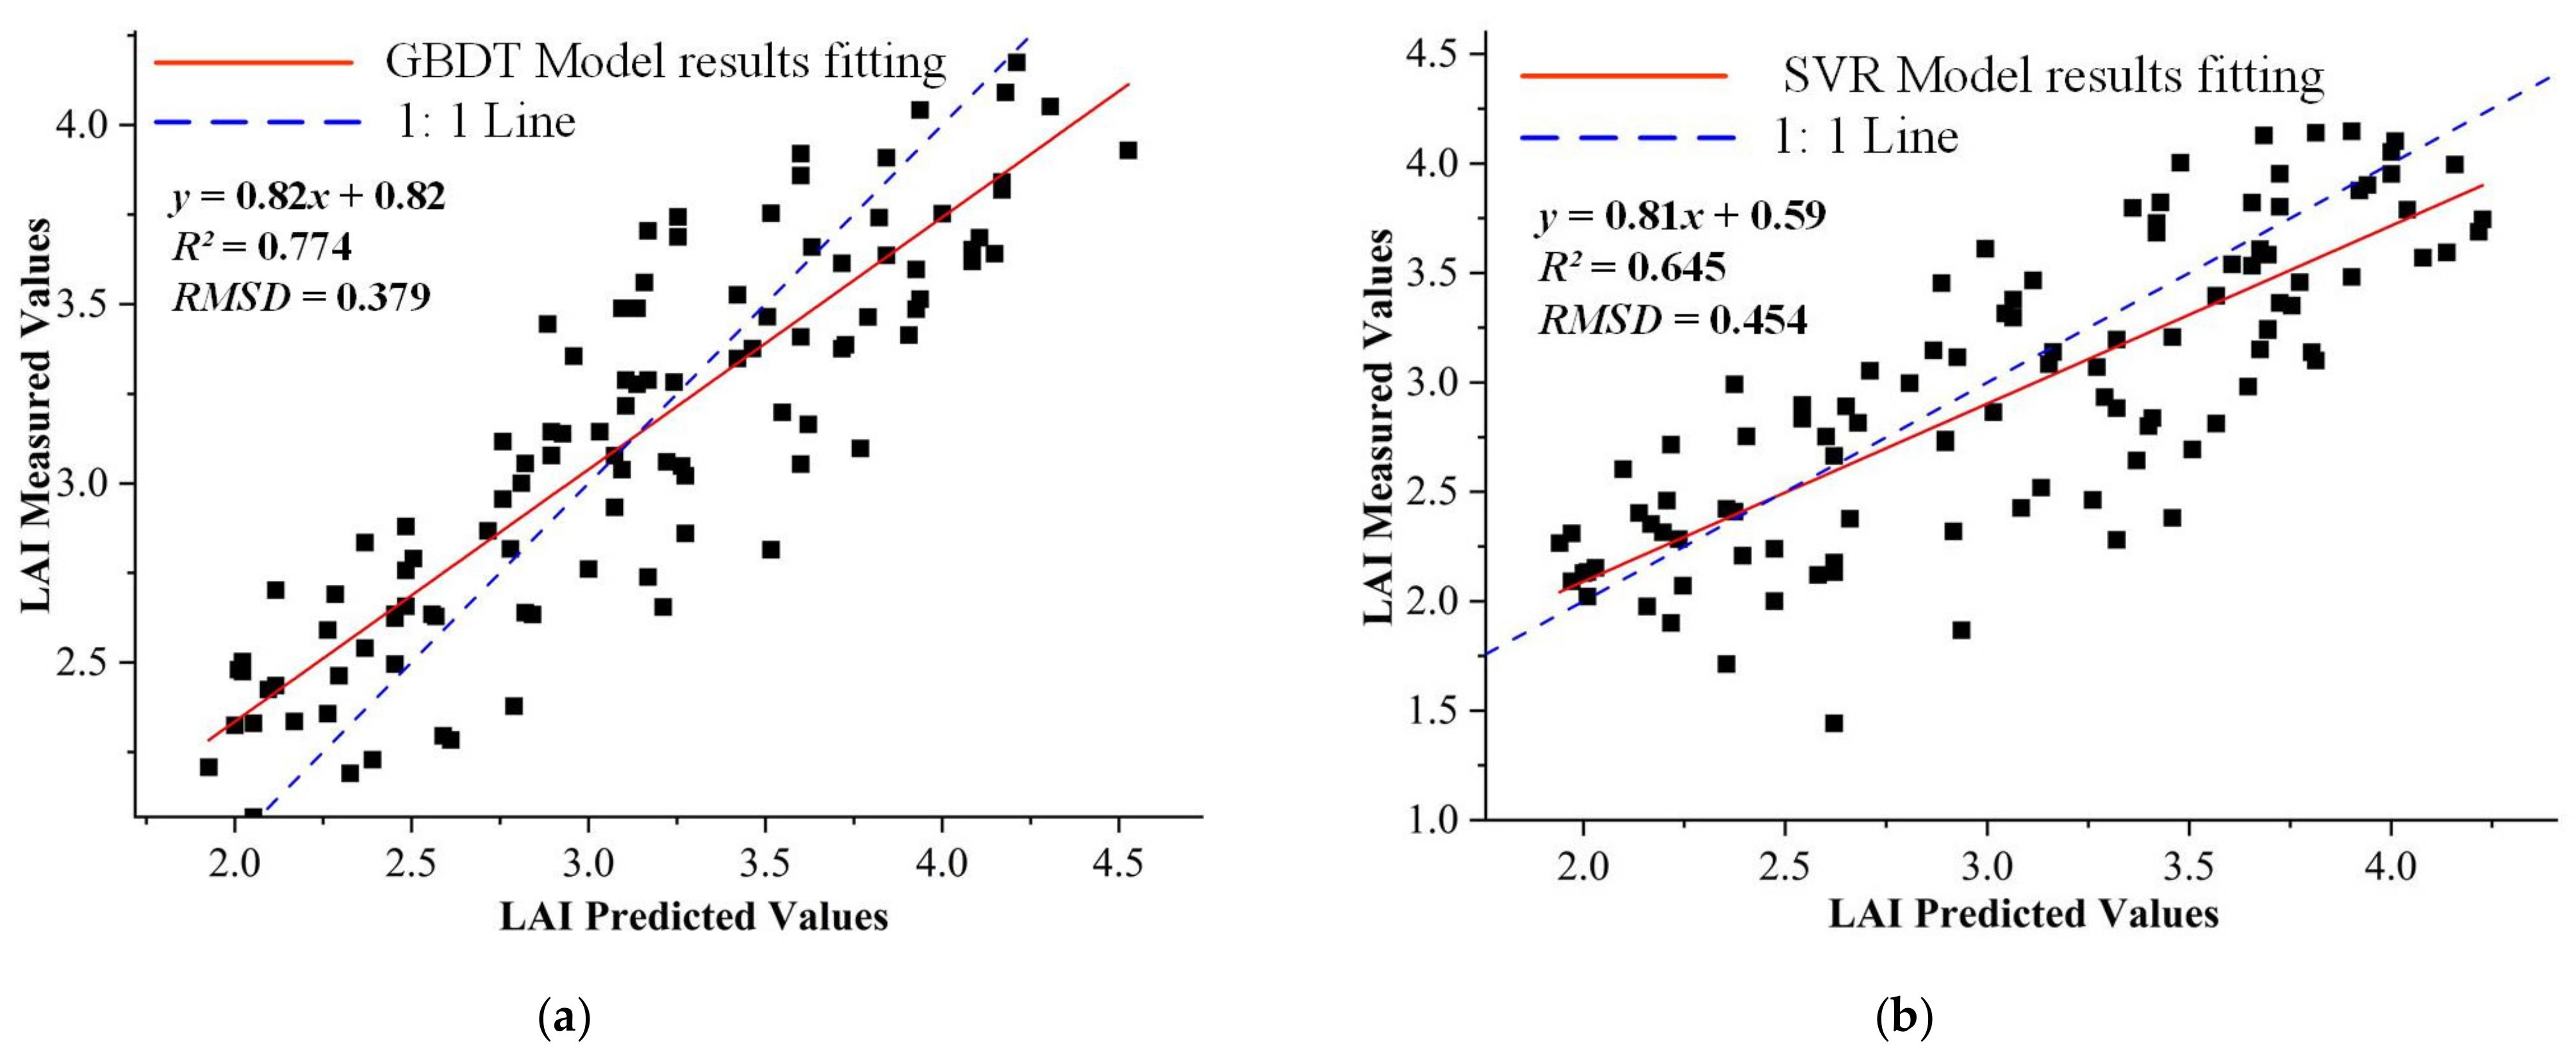
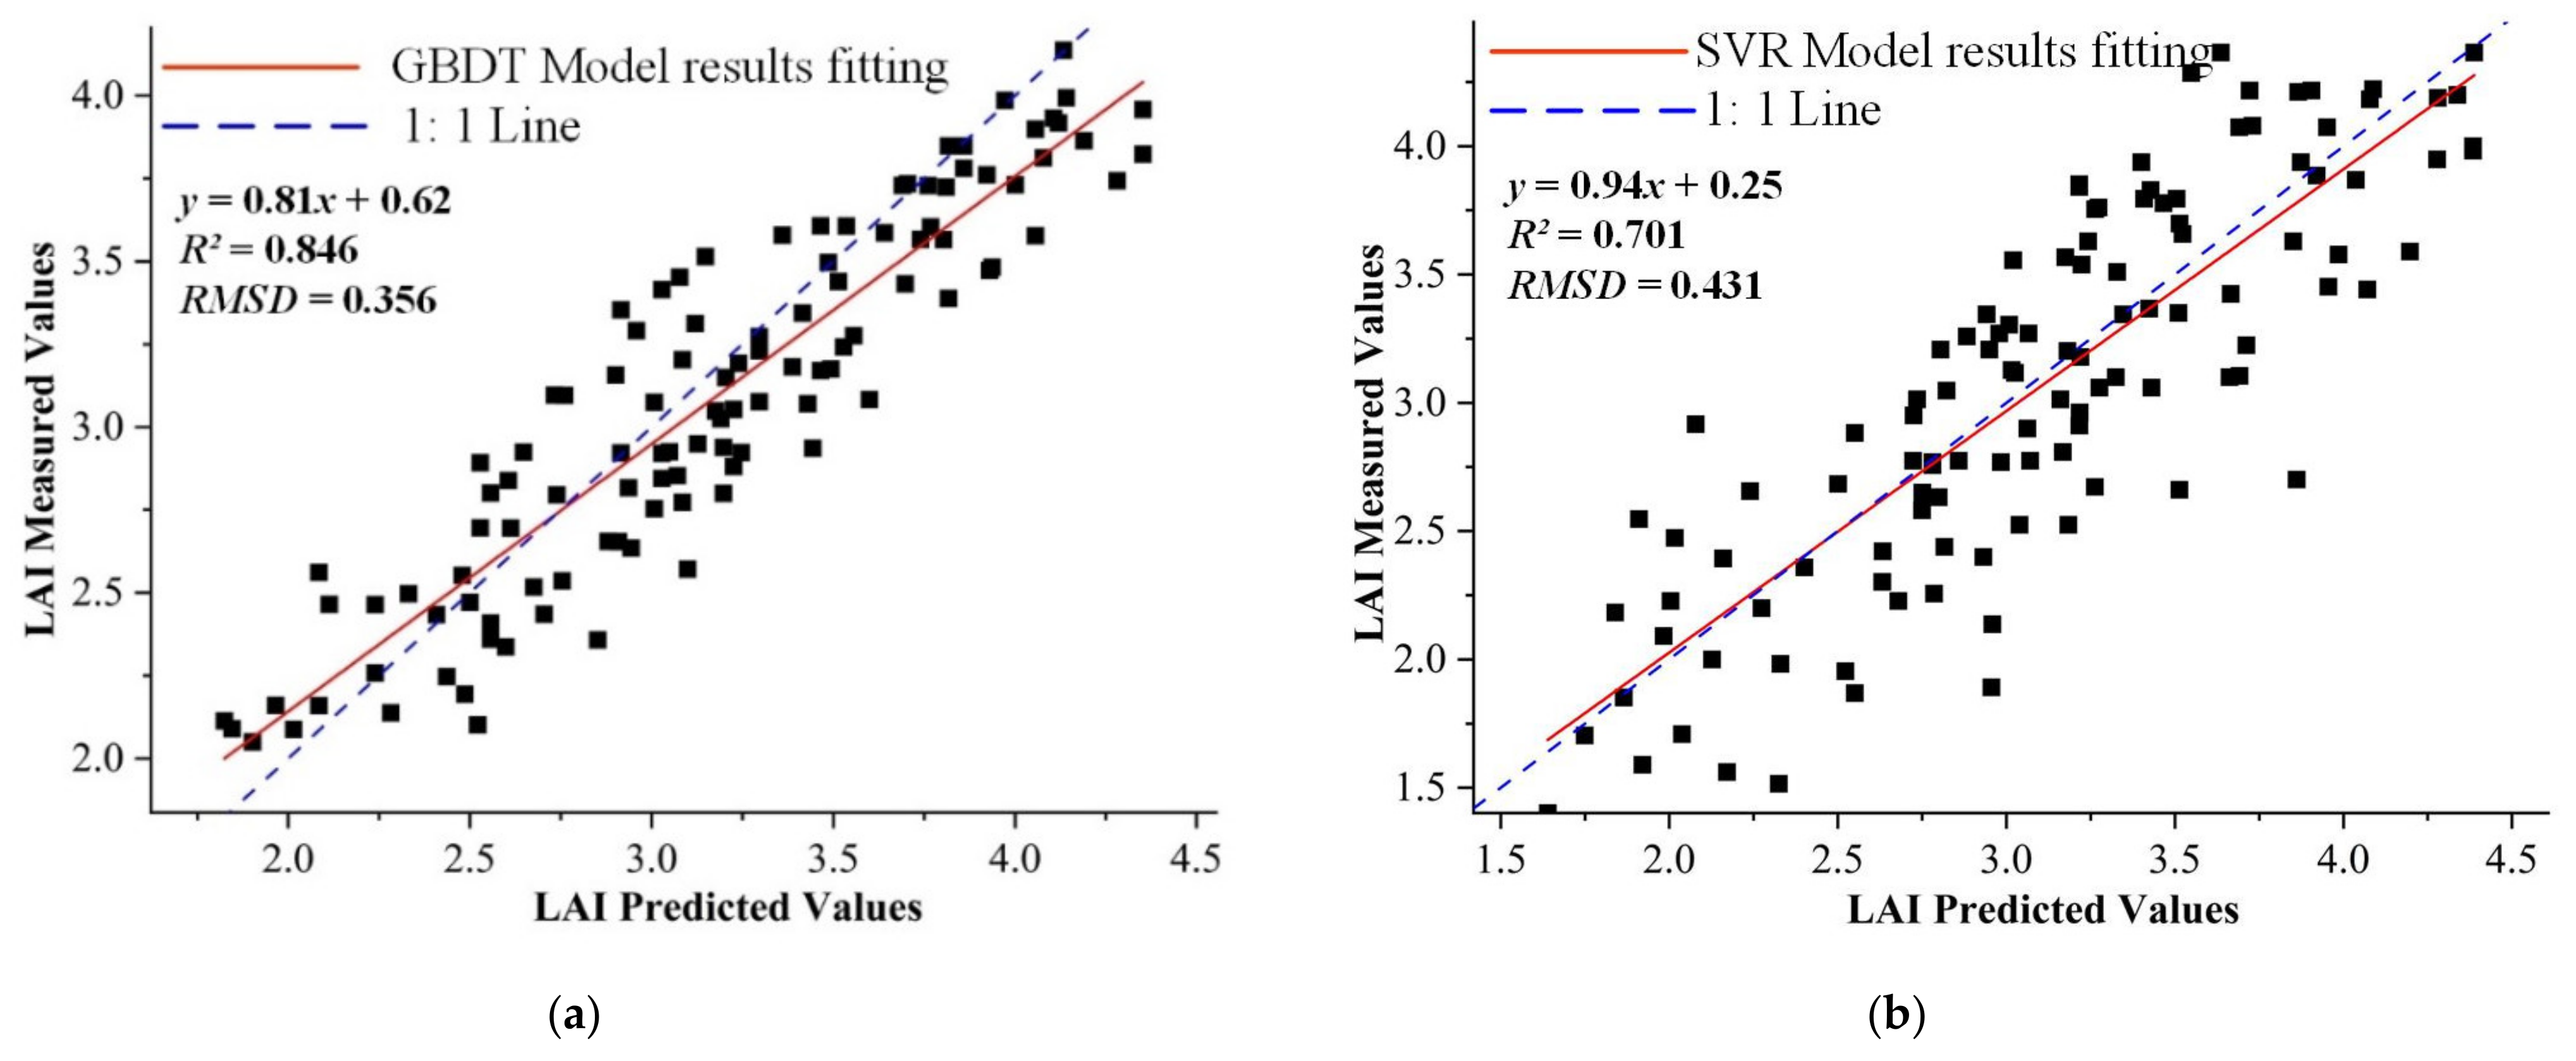
In addition to the selection of the independent variables (i.e., the vegetation indices), appropriate model selection is an important factor affecting the remote-sensing LAI monitoring in apple trees. Moreover, the selection of a suitable model can help improve the accuracy of remote-sensing prediction of the vegetation’s physical and chemical parameters. In this study, the gradient-boosting decision tree (GBDT) algorithm was introduced, for the first time, into the study of the apple-tree LAI estimation models. In addition, the LAI estimation was carried out for the three most important growth periods of the apple trees, namely, the fruit expansion period, the leaf differentiation period, and the shoot-stopping period. The obtained GBDT model was found to be significantly better than the SVR model, which is in line with previous studies [32]. The key advantage of the GBDT algorithm is its ability to combine several weak learners into a strong learner, whose outcome is the sum of multiple regression trees. The model constructed by this algorithm can flexibly process various types of continuous data (e.g., LAI) or discrete data (e.g., crop canopy temperature). For regression analysis with small samples, the GBDT algorithm can set different loss functions with a relatively small tuning time and, hence, can improve the estimation accuracy. The GBDT algorithm avoids the time complexity incurred by the SVR model for selecting suitable kernel functions and other parameters. Additionally, while the SVR algorithm assigns equal weights to all input factors and cannot judge the contribution of each factor, the GBDT algorithm solves these problems. Therefore, the GBDT algorithm is highly applicable in regression problems. However, two GBDT aspects need to be noted:
(1)
The GBDT algorithm is used to judge the influence of several similar vegetation indices in the red and near-infrared bands, a fact that highlights the advantages of the algorithm. Still, there is room for accuracy improvement via further studies.
(2)
There are dependencies between the base learners in the GBDT algorithm, and hence, parallel calculations can be generally difficult to perform. This paper has not considered the parallelism among the base learners. In future research, we should focus on how to realize parallel operations (at least partially) to further improve the estimation efficiency.
In the study, nine vegetation indices with a high correlation with the leaf area index (LAI) of apple trees were used, all of which were in the visible and near-infrared bands of the spectra, which are consistent with previous studies.
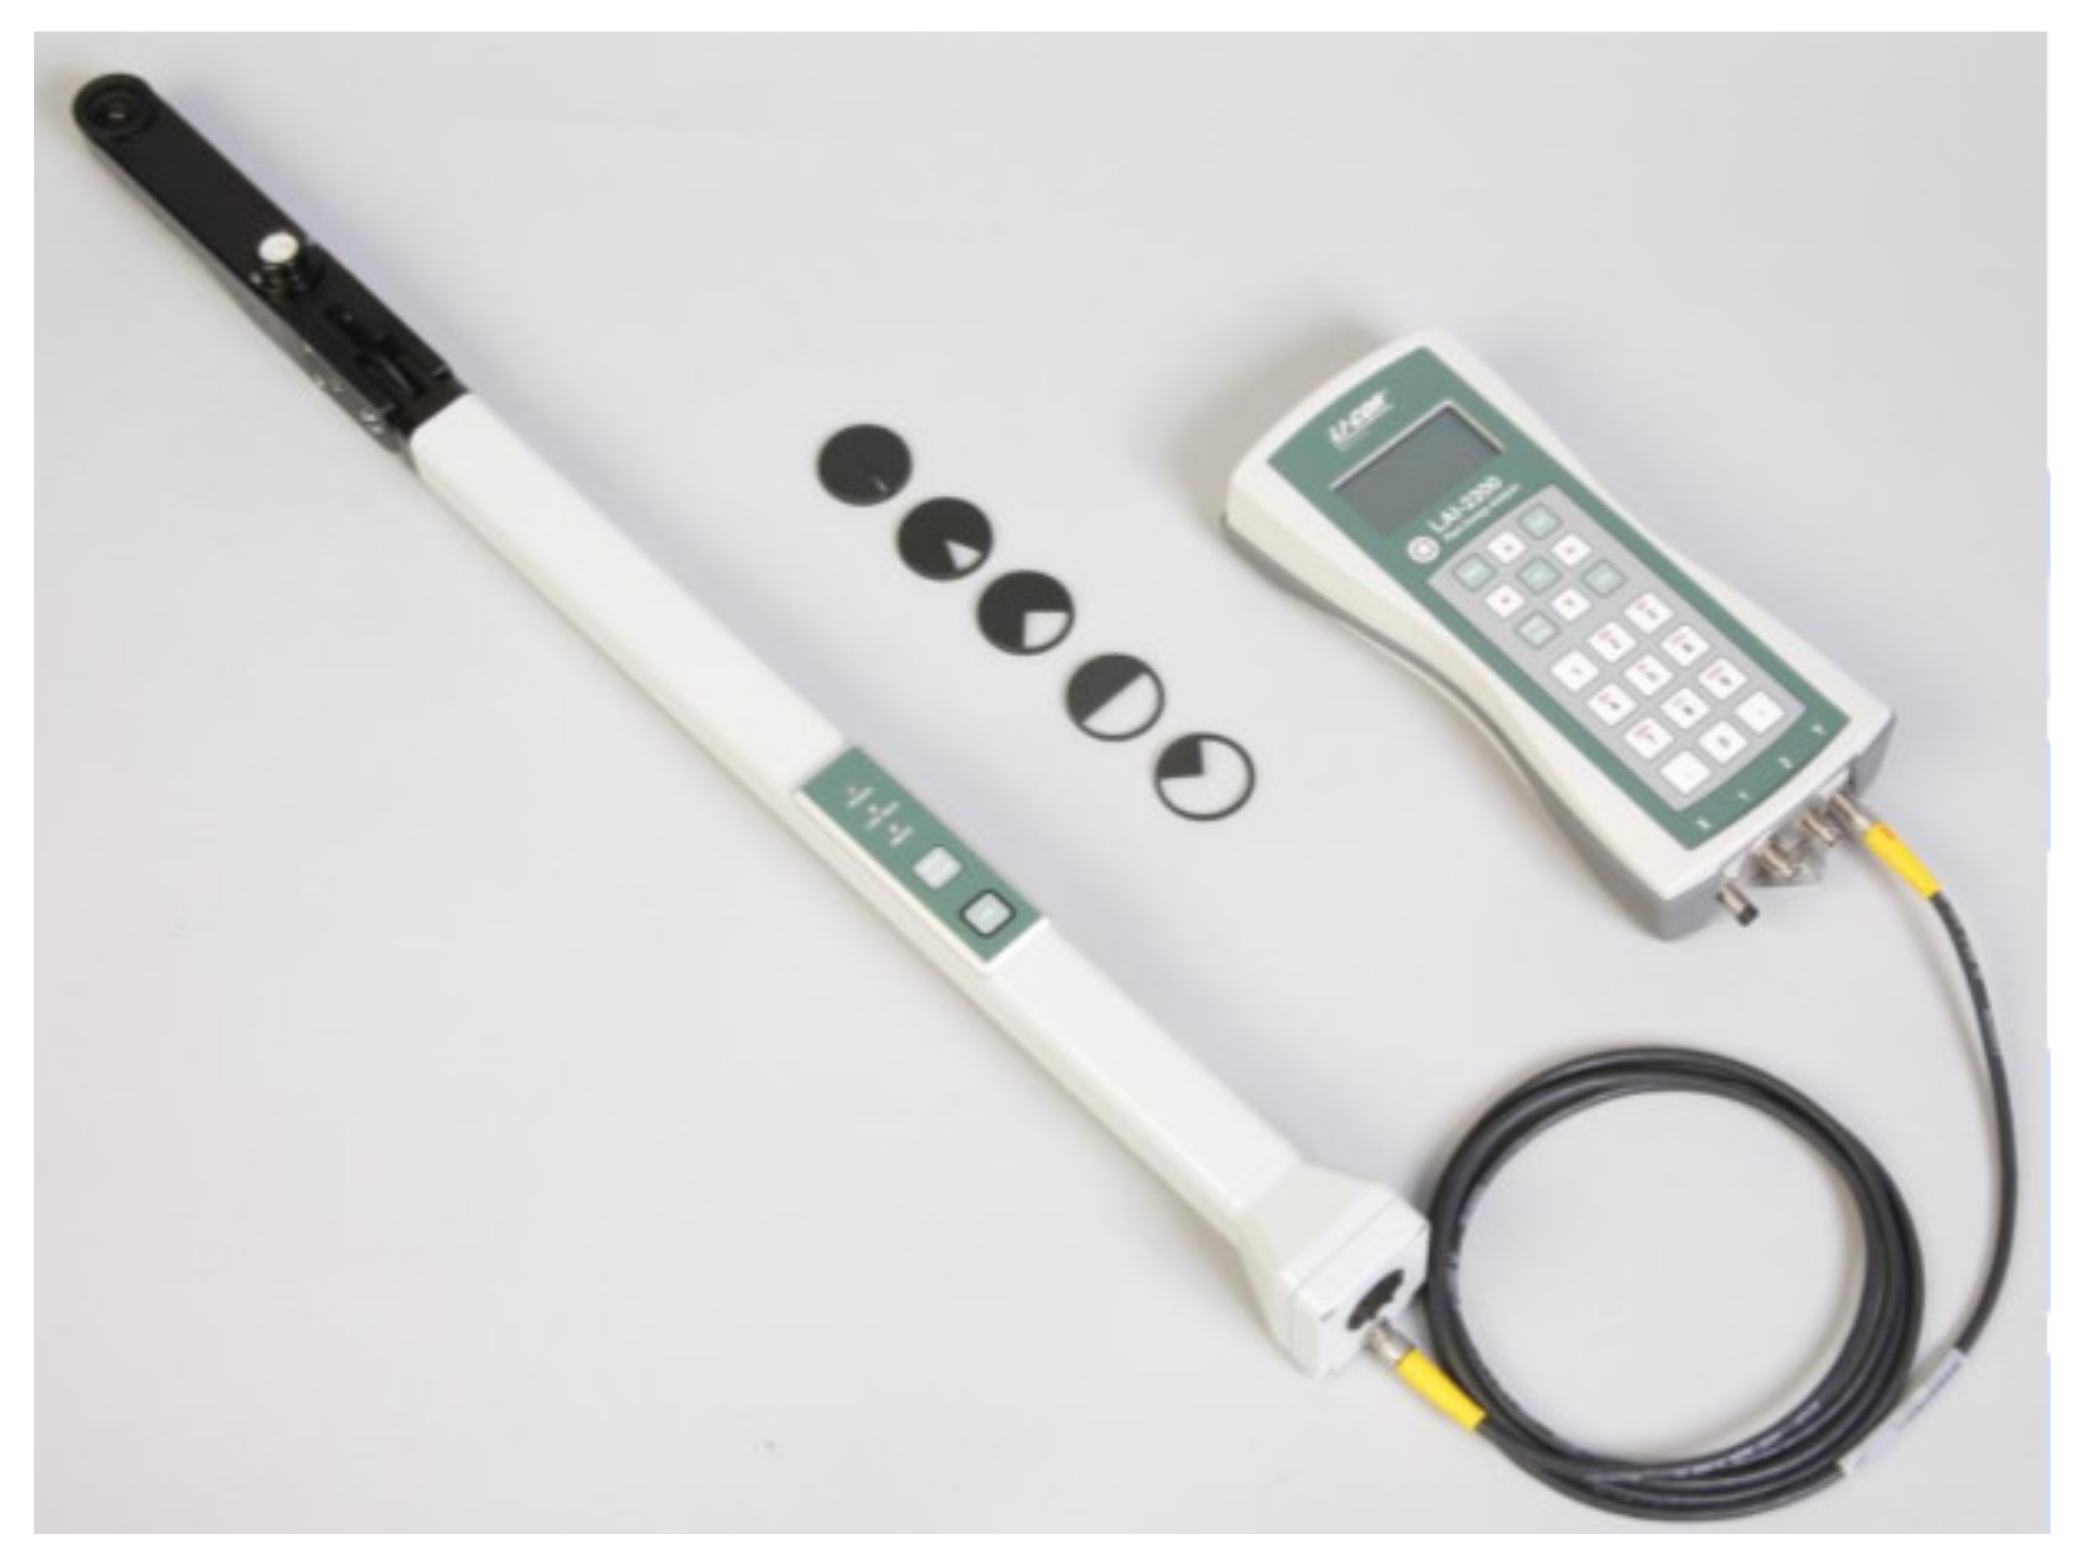
Previously, the acquisition of leaf area index in orchards was mainly based on ground measurements, and the main manual ground measurement methods are the instrumental measurement method (LAI-2200C) and hemispheric photography method. However, they can only respond to a small area of the leaf area index situation, and the measurement efficiency is low. This study is the first to apply UAV remote sensing to the measurement of a leaf area index of apple trees. Compared with manual ground measurement of apple tree LAI, it has the advantages of being high efficiency, time saving, and having wide application. Therefore, it is suitable for the acquisition of LAI in large apple orchards [58].

5. Conclusions

In this paper, we use UAV remote-sensing data and actual LAI measurements of apple trees, in combination with the GBDT and SVR models, for LAI estimation in apple trees. We can draw the following main conclusions:
(1)
The acquisition of large-scale remote-sensing images of apple orchards can be achieved using a multi-rotor UAV, the RedEdge multispectral camera, and its stabilized gimbal. The acquisition system enjoys several features including stability, easy maintenance and operation, data reliability, and accessibility.
(2)
All nine vegetation indices selected for this study have a strong correlation with the LAI. This is particularly true for the five indices of NDVI, GNDVI, RVI, EVI, and SAVI. Indeed, each of these five indices has a correlation coefficient greater than 0.5 at a confidence level of 0.01. This indicates a significant correlation between these five vegetation indices and the LAI.
(3)
The remote-sensing-based LAI estimation in apple trees can be combined with machine learning. In this case, the performance of the GBDT model is better than that of the SVR model. The GBDT model actually has strong noise immunity and generalization and is very suitable for remote-sensing estimation of the LAI for apple trees in different growth periods.

Author Contributions

P.G., Z.L. and F.Y. started the work, completed the detailed investigations, and prepared the paper with support of all the co-authors; H.L., P.Z. and C.F. helped us with remote-sensing data collection; P.F. and Z.L. helped us with orchard ground data measurements; X.L. and W.W. helped us with ground image control point measurements. All authors have read and agreed to the published version of the manuscript.

Funding

This research was funded by the Major Science and Technology Project of Shaanxi Province of China (Program No. 2020zdzx03-04-01), the National Key R&D Program of China “the 13th Five-Year Plan” (Program No. 2016YFD0700503).

Institutional Review Board Statement

Not applicable.

Informed Consent Statement

Not applicable.

Data Availability Statement

Not applicable.

Acknowledgments

We are grateful to Licai Shi and Pengpeng Yan for their help with the format of my writing.

Conflicts of Interest

The authors declare no conflict of interest.

References

  1. Watson, D.J. Comparative Physiological Studies on the Growth of Field Crops: I. Variation in Net Assimilation Rate and Leaf Area between Species and Varieties, and within and between Years. Ann. Bot. 1947, 11, 41–76. [Google Scholar] [CrossRef]
  2. Beeri, O.; Netzer, Y.; Munitz, S.; Mintz, D.F.; Pelta, R.; Shilo, T.; Horesh, A.; Mey-tal, S. K-c and LAI Estimations Using Optical and SAR Remote Sensing Imagery for Vineyards Plots. Remote Sens. 2020, 12, 3478. [Google Scholar] [CrossRef]
  3. Zhao, J.; Li, J.; Liu, Q.H.; Wang, H.Y.; Chen, C.; Xu, B.D.; Wu, S.L. Comparative Analysis of Chinese HJ-1 CCD, GF-1 WFV and ZY-3 MUX Sensor Data for Leaf Area Index Estimations for Maize. Remote Sens. 2018, 10, 20. [Google Scholar] [CrossRef] [Green Version]
  4. Meng, J.; Wu, B.; Li, Q. Method for estimating crop leaf area index of China using remote sensing. Trans. Chin. Soc. Agric. Eng. 2007, 23, 160–167. [Google Scholar] [CrossRef]
  5. Chen, J.M.; Black, T.A. Defining leaf area index for non-Flat leaves. Agric. For. Meteorol. 1992, 15, 421–429. [Google Scholar] [CrossRef]
  6. Zhai, C.; Zhao, C.; Wang, N.; Long, J.; Wang, X.; Weckler, P.; Zhang, H. Research progress on precision control methods of air-assisted spraying in orchards. Trans. Chin. Soc. Agric. Eng. 2018, 34, 1–15. [Google Scholar] [CrossRef]
  7. Wu, S.; Deng, W.; Wu, G. Research on LAI Detection in Precision Pesticide Application. J. Agric. Mech. Res. 2017, 39, 262–268. [Google Scholar] [CrossRef]
  8. Wu, W.B. Ground Measurements of Leaf Area Index of Fruit Trees. Ph.D. Thesis, South China Agricultural University, Guangzhou, China, 2007. [Google Scholar]
  9. Verrelst, J.; Rivera, J.P.; Veroustraete, F.; Muoz-Marí, J.; Clevers, J.P.W.; Camps-Valls, G.; Moreno, J. Experimental Sentinel-2 LAI estimation using parametric, non-parametric and physical retrieval methods—A comparison. ISPRS-J. Photogramm. Remote Sens. 2015, 108, 260–272. [Google Scholar] [CrossRef]
  10. Wu, W.; Zhang, Z.; Liu, F.; Liu, W.; Yang, X. The Research Progress of Leaf Area Index Estimation from the Hemispherical Photograph. Sci. Technol. Eng. 2018, 18, 156–162. [Google Scholar] [CrossRef]
  11. López-Calderón, M.J.; Estrada-Ávalos, J.; Rodríguez-Moreno, V.M.; Mauricio-Ruvalcaba, J.E.; Martínez-Sifuentes, A.R.; Delgado-Ramírez, G.; Miguel-Valle, E. Estimation of Total Nitrogen Content in Forage Maize (Zea mays L.) Using Spectral Indices: Analysis by Random Forest. Agriculture 2020, 10, 451. [Google Scholar] [CrossRef]
  12. Zhang, Y.Y.; Yang, J.; Liu, X.G.; Du, L.; Shi, S.; Sun, J.; Chen, B.W. Estimation of Multi-Species Leaf Area Index Based on Chinese GF-1 Satellite Data Using Look-Up Table and Gaussian Process Regression Methods. Sensors 2020, 20, 2460. [Google Scholar] [CrossRef]
  13. Franklin, S.E.; Lavigne, M.B.; Deuling, M.J.; Wulder, M.A.; Hunt, E.R., Jr. Estimation of forest Leaf Area Index using remote sensing and GIS data for modelling net primary production. Int. J. Remote Sens. 1997, 18, 3459–3471. [Google Scholar] [CrossRef]
  14. Rahman, M.F.F.; Fan, S.; Zhang, Y.; Chen, L. A Comparative Study on Application of Unmanned Aerial Vehicle Systems in Agriculture. Agriculture 2021, 11, 22. [Google Scholar] [CrossRef]
  15. Xun, L.; Wang, P.; Li, L.; Wang, L.; Kong, Q. Identifying crop planting areas using Fourier-transformed feature of time series MODIS leaf area index and sparse-representation-based classification in the North China Plain. Int. J. Remote Sens. 2018, 40, 2034–2052. [Google Scholar] [CrossRef]
  16. Yang, G.; Liu, J.; Zhao, C.; Li, Z.; Huang, Y.; Yu, H.; Xu, B.; Yang, X.; Zhu, D.; Zhang, X.; et al. Unmanned Aerial Vehicle Remote Sensing for Field-Based Crop Phenotyping: Current Status and Perspectives. Front. Plant Sci. 2017, 8, 1111. [Google Scholar] [CrossRef]
  17. Jiang, J.; Zhang, Z.; Cao, Q.; Liang, Y.; Krienke, B.; Tian, Y.; Zhu, Y.; Cao, W.; Liu, X. Use of an Active Canopy Sensor Mounted on an Unmanned Aerial Vehicle to Monitor the Growth and Nitrogen Status of Winter Wheat. Remote Sens. 2020, 12, 3684. [Google Scholar] [CrossRef]
  18. Mathews, A.J.; Jensen, J.L.R. Visualizing and Quantifying Vineyard Canopy LAI Using an Unmanned Aerial Vehicle (UAV) Collected High Density Structure from Motion Point Cloud. Remote Sens. 2013, 5, 2164–2183. [Google Scholar] [CrossRef] [Green Version]
  19. Xiao, J.-H.; Wu, L.-P. Application of UAV Remote Sensing Technology in modern mine surveying. World Nonferrous Met. 2018, 13, 23–24. [Google Scholar] [CrossRef]
  20. Qi, G.; Zhao, G.; Xi, X. Soil Salinity Estimation of Winter Wheat Areas Based on Satellite-Unmanned Aerial Vehicle-Ground Collaborative System in Coastal of the Yellow River Delta. Sensors 2020, 20, 6521. [Google Scholar] [CrossRef]
  21. Cheng, Z.; Meng, J.; Shang, J.; Liu, J.; Huang, J.; Qiao, Y.; Qian, B.; Jing, Q.; Dong, T.; Yu, L. Generating Time-Series LAI Estimates of Maize Using Combined Methods Based on Multispectral UAV Observations and WOFOST Model. Sensors 2020, 20, 6. [Google Scholar] [CrossRef] [PubMed]
  22. Na, W.; Wolf, J.; Fu-Suo, Z.; Systems, P.P.; Sciences, D.O.P.; University, W.; Resources, C.F.; Security, E.F.; University, C.A. Towards sustainable intensification of apple production in China—Yield gaps and nutrient use effi ciency in apple farming systems. J. Integr. Agric. 2016, 15, 716–725. [Google Scholar]
  23. Manninen, T.; Korhonen, L.; Voipio, P.; Lahtinen, P.J.R.S. Leaf Area Index (LAI) Estimation of Boreal Forest Using Wide Optics Airborne Winter Photos. Remote Sens. 2009, 1, 1380–1394. [Google Scholar] [CrossRef] [Green Version]
  24. Gitelson, A.A.; Andrés, V.; Arkebauer, T.J.; Rundquist, D.C.; Keydan, G.; Leavitt, B. Remote estimation of leaf area index and green leaf biomass in maize canopies. Geophys. Res. Lett. 2003, 30, 1. [Google Scholar] [CrossRef] [Green Version]
  25. Li, F.; Zhang, B.; Song, K.; Wang, Z.; Liu, H.; Yang, F. Research and Analysis of the Correlation between Hyperspectral Vegetation Index and Leaf Area Index. Remote Sens. Technol. Appl. 2007, 22, 586–592. [Google Scholar] [CrossRef]
  26. Liang, D.; Guan, Q.; Huang, W.; Huang, L.; Yang, G. Remote sensing estimation of leaf area index based on support vector machine regression in winter wheat. Trans. Chin. Soc. Agric. Mach. 2013, 117–123. [Google Scholar] [CrossRef]
  27. Yu, B.; Shang, S. Multi-Year Mapping of Maize and Sunflower in Hetao Irrigation District of China with High Spatial and Temporal Resolution Vegetation Index Series. Remote Sens. 2017, 9, 855. [Google Scholar] [CrossRef] [Green Version]
  28. Yao, X.; Wang, N.; Liu, Y.; Cheng, T.; Tian, Y.; Chen, Q.; Zhu, Y. Estimation of Wheat LAI at Middle to High Levels Using Unmanned Aerial Vehicle Narrowband Multispectral Imagery. Remote Sens. 2017, 9, 1304. [Google Scholar] [CrossRef] [Green Version]
  29. He, L.; Ren, X.; Wang, Y.; Liu, B.; Guo, T. Comparing methods for estimating leaf area index by multi-angular remote sensing in winter wheat. Sci. Rep. 2020, 10, 13943. [Google Scholar] [CrossRef]
  30. Li, W.; Fu, H.; Yu, L.; Cracknell, A. Deep Learning Based Oil Palm Tree Detection and Counting for High-Resolution Remote Sensing Images. Remote Sens. 2016, 9, 22. [Google Scholar] [CrossRef] [Green Version]
  31. Ndikumana, E.; Ho Tong Minh, D.; Baghdadi, N.; Courault, D.; Hossard, L. Deep Recurrent Neural Network for Agricultural Classification using multitemporal SAR Sentinel-1 for Camargue, France. Remote Sens. 2018, 10, 1217. [Google Scholar] [CrossRef] [Green Version]
  32. Zhang, H.; Liu, W.; Han, W.; Liu, Q.; Song, R.; Hou, G. Estimation of Summer Maize Leaf Area Index Based on Gradient Boosting Decision Tree Algorithm. Trans. Chin. Soc. Agric. Mach. 2019, 50, 251–259. [Google Scholar] [CrossRef]
  33. Yao, X.; Yu, K.Y.; Yang, Y.J.; Zeng, Q.; Zhanghao, Z.H.; Liu, J. Estimation of Forest Leaf Area Index Based on Random Forest Model and Remote Sensing Data. Trans. Chin. Soc. Agric. Mach. 2017, 48, 159–166. [Google Scholar]
  34. Srinet, R.; Nandy, S.; Patel, N.R. Estimating leaf area index and light extinction coefficient using Random Forest regression algorithm in a tropical moist deciduous forest, India. Ecol. Inform. 2019, 52, 94–102. [Google Scholar] [CrossRef]
  35. Qi, H.; Zhu, B.; Wu, Z.; Liang, Y.; Li, J.; Wang, L.; Chen, T.; Lan, Y.; Zhang, L. Estimation of Peanut Leaf Area Index from Unmanned Aerial Vehicle Multispectral Images. Sensors 2020, 20, 6732. [Google Scholar] [CrossRef]
  36. Liu, H.Q.; Huete, A. A feedback based modification of the NDVI to minimize canopy background and atmospheric noise. IEEE Trans. Geosci. Remote Sens. 1995, 33, 457–465. [Google Scholar] [CrossRef]
  37. Tucker, C.J. Red and photographic infrared linear combinations for monitoring vegetation. Remote Sens. Environ. 1979, 8, 127–150. [Google Scholar] [CrossRef] [Green Version]
  38. Gitelson, A.A.; Merzlyak, M.N. Remote sensing of chlorophyll concentration in higher plant leaves. Adv. Space Res. 1998, 22, 689–692. [Google Scholar] [CrossRef]
  39. Birth, G.S.; McVey, G.R. Measuring the Color of Growing Turf with a Reflectance Spectrophotometer. Agron. J. 1968, 60, 640–643. [Google Scholar] [CrossRef]
  40. Huete, A.; Didan, K.; Miura, T.; Rodriguez, E.P.; Gao, X.; Ferreira, L.G. Overview of the radiometric and biophysical performance of the MODIS vegetation indices. Remote Sens. Environ. 2002, 83, 195–213. [Google Scholar] [CrossRef]
  41. Huete, A.R. A soil-adjusted vegetation index (SAVI). Remote Sens. Environ. 1988, 25, 295–309. [Google Scholar] [CrossRef]
  42. Sripada, R.P.; Heiniger, R.W.; White, J.G.; Meijer, A.D. Aerial Color Infrared Photography for Determining Early In-Season Nitrogen Requirements in Corn. Agron. J. 2006, 98, 968–977. [Google Scholar] [CrossRef]
  43. Crippen, R.E. Calculating the vegetation index faster. Remote Sens. Environ. 1990, 34, 71–73. [Google Scholar] [CrossRef]
  44. Clevers, J.G.P.W. Application of a weighted infrared-red vegetation index for estimating leaf Area Index by Correcting for Soil Moisture. Remote Sens. Environ. 1989, 29, 25–37. [Google Scholar] [CrossRef]
  45. Gitelson, A.A.; Kaufman, Y.J.; Mark, N. Use of a green channel in remote sensing of global vegetation from EOS-MODIS. Remote Sens. Environ. 1996, 58, 289–298. [Google Scholar] [CrossRef]
  46. Judith, E.D.P.D.; Deleo, J.M. Artificial neural networks. Cancer 2001, 91, 1615–1635. [Google Scholar]
  47. Yao, X. Evolving artificial neural networks. Proc. IEEE 1999, 87, 1423–1447. [Google Scholar]
  48. Ghahramani, Z. Probabilistic machine learning and artificial intelligence. Nature 2015, 521, 452. [Google Scholar] [CrossRef] [PubMed]
  49. Rumelhart, D.E. Learning Internal Representation by Back Propagation. Nature 1986, 323, 533–536. [Google Scholar] [CrossRef]
  50. Breiman, L. Random forest. Mach. Learn. 2001, 45, 5–32. [Google Scholar] [CrossRef] [Green Version]
  51. Son, J.; Jung, I.; Park, K.; Han, B. Tracking-by-Segmentation with Online Gradient Boosting Decision Tree; IEEE: Piscataway, NJ, USA, 2016. [Google Scholar]
  52. Tian, D.; He, G.; Wu, J.; Chen, H.; Jiang, Y. An Accurate Eye Pupil Localization Approach Based on Adaptive Gradient Boosting Decision Tree; IEEE: Piscataway, NJ, USA, 2017. [Google Scholar]
  53. Liu, Y.; Luo, X.; Yang, M. Research on Passenger Flow Prediction of Bus Line Based on Gradient Boosting Decision Tree; IEEE: Piscataway, NJ, USA, 2020. [Google Scholar]
  54. Han, W.; Peng, X.; Zhang, L.; Niu, Y. Summer Maize Yield Estimation Based on Vegetation Index Derived from Multi-temporal UAV Remote Sensing. Trans. Chin. Soc. Agric. Mach. 2020, 51, 148–155. [Google Scholar] [CrossRef]
  55. Piepho, H.P. A coefficient of determination (R2) for generalized linear mixed models. Biometrical journal. Biometrische Zeitschrift. 2019, 61, 860–872. [Google Scholar]
  56. Ozer, D.J. Correlation and the coefficient of determination. Psychol. Bull. 1985, 97, 307–315. [Google Scholar] [CrossRef]
  57. Koch, J.; Demirel, M.C.; Stisen, S. The SPAtial EFficiency metric (SPAEF): Multiple-component evaluation of spatial patterns for optimization of hydrological models. Geosci. Model. Dev. 2018, 11, 1873–1886. [Google Scholar] [CrossRef] [Green Version]
  58. Wei, S.; Yin, T.; Dissegna, A. An assessment study of three indirect methods for estimating leaf area density and leaf area index of individual trees. Agric. For. Meteorol. 2020, 292, 108101. [Google Scholar] [CrossRef]
Figure 1. General overview of the study area. (a) Geographical location and distribution of the sampling points of the experimental area; (b) a schematic diagram of the distribution of the sampling points.
Remotesensing 13 03263 g001
Figure 2. Various pieces of equipment for multispectral data acquisition. (a) DJI M600 Pro Hexacopter UAV; (b) RedEdge five-band multispectral camera; (c) Zenith X3 visible-light camera; (d) multispectral camera setup with grey-plate correction.
Remotesensing 13 03263 g002
Figure 3. The LAI-2200C canopy analyzer.
Remotesensing 13 03263 g003
Figure 4. Soil background interference rejection using the Otsu thresholding method.
Remotesensing 13 03263 g004
Figure 5. Changes in the apple tree growth patterns in Zone A during: (a) the fruit expansion stage, (b) the leaf differentiation stage, and (c) the shoot-stopping stage.
Remotesensing 13 03263 g005
Figure 6. Regression lines between the measured and predicted LAI values for the fruit expansion stage: (a) results of the GBDT model; (b) results of the SVR model.
Remotesensing 13 03263 g006
Figure 7. Regression lines between the measured and predicted LAI values for the leaf differentiation stage: (a) results of the GBDT model; (b) results of the SVR model.
Remotesensing 13 03263 g007
Figure 8. Regression lines between the measured and predicted LAI values for the shoot-stopping stage: (a) results of the GBDT model; (b) results of the SVR model.
Remotesensing 13 03263 g008
Figure 9. Remote-sensing maps of the apple trees during the fruit expansion stage: (a) the Fuji apple trees; (b) the Golden Delicious apple trees; (c) the Ruixue apple trees.
Remotesensing 13 03263 g009
Figure 10. Remote-sensing maps of the apple trees during the leaf differentiation stage: (a) the Fuji apple trees; (b) the Golden Delicious apple trees; (c) the Ruixue apple trees.
Remotesensing 13 03263 g010
Figure 11. Remote-sensing maps of the apple trees during the shoot-stopping stage: (a) the Fuji apple trees; (b) the Golden Delicious apple trees; (c) the Ruixue apple trees.
Remotesensing 13 03263 g011
Table 1. Planting parameters for three varieties of apple trees.
VarietiesAge of Tree (Year)Tree Height (m)Spacing Between Trees (m)Row Spacing (m)
Fuji102.80.51.1
Golden Delicious122.80.51.2
Ruixue82.40.32.0
Table 2. Band information for the RedEdge five-band multispectral camera.
Band NumberBand NameCentral Wavelength (nm)Bandwidth (nm)
B1Blue47520
B2Green56020
B3Red66810
B4NIR84040
B5Red edge71710
Table 3. Ambient conditions and relevant parameters of the UAV remote-sensing data collection.
DateWeatherSample SizeSpeed of Flight (m/s)Flying Altitude(m/s)Course Overlap (%) Lateral Overlap (%)
20 June 2020Sunny1503709080
28 June 2020Sunny1503709080
6 July 2020Sunny1503709080
18 July 2020Sunny1453709080
29 July 2020Sunny1403709080
7 August 2020Sunny1503709080
15 August 2020Sunny1503709080
23 August 2020Sunny1503709080
Table 4. Basic statistics of the ground-truth LAI measurements for the studied apple trees during three growth stages.
Growth StageSample SizeMaximum MinimumMean ValueStandard Deviation
Fruit Expansion Stage4504.362.003.170.933
Leaf Differentiation Stage4314.152.073.090.968
Shoot-Stopping Stage3194.162.043.100.954
Table 5. Definitions, bands, and mathematical formulas for common vegetation indices of apple trees.
Vegetation IndexFull NameRelated Bands FormulaReferences
NDVINormalized Difference Vegetation IndexB4, B3 B 4 B 3 B 4 + B 3 [36,37]
GNDVIGreen Normalized Difference
Vegetation Index
B2, B4 B 4 B 2 B 4 + B 2 [38]
RVIRatio Vegetation IndexB4, B3 B 4 B 5 [39]
EVIEnhanced Vegetation IndexB4, B3, B1 2.5 B 4 B 3 B 4 + 6 B 3 7.5 B 1 + 1 [40]
SAVISoil Adjusted Vegetation IndexB4, B3 1.5 B 4 B 3 B 4 + B 3 + 0.5 [41]
DVIDifference Vegetation IndexB4, B3 B 4 B 3 [37,42]
IPVIInfrared Percentage
Vegetation Index
B4, B3 B 4 B 4 + B 3 [43]
WDVIWeighted Difference
Vegetation Index
B4, B3 B 4 0.5 B 3 [44]
GARIGreen Vegetation Atmospheric Resistant IndexB4, B3, B2, B1 B 4 ( B 3 ( B 2 B 1 ) ) B 4 + ( B 3 ( B 2 B 1 ) ) [45]
Table 6. The LAI data distribution by zones and growth stages.
Zone AZone BZone CTotal
Fruit expansion stage150150150450
Leaf differentiation stage150145140435
Shoot-stopping stage100100100300
Table 7. Results of the correlation analysis between the LAI measurements and the top five vegetation indices.
Data Acquisition TimeVegetation IndexCorrelation Coefficient
Fruit Expansion StageNDVI0.849
GNDVI0.716
RVI0.796
EVI0.53
SAVI0.802
DVI0.426
IPVI0.380
WDVI0.556
GARI0.409
Leaf Differentiation StageNDVI0.779
GNDVI0.842
RVI0.731
EVI0.631
SAVI0.625
DVI0.429
IPVI0.358
WDVI0.453
GARI0.422
Shoot-Stopping StageNDVI0.836
GNDVI0.596
RVI0.639
EVI0.555
SAVI0.653
DVI0.392
IPVI0.462
WDVI0.483
GARI0.399
Table 8. Results of the autocorrelation analysis of the spatial variables.
VariablesFruit Expansion StageLeaf Differentiation StageShoot-Stopping Stage
Moran’s Ip-ValueMoran’s Ip-ValueMoran’s Ip-Value
LAI0.48180.0050.42140.0080.39520.005
NDVI0.52110.0110.51460.0120.42630.011
GNDVI0.32150.0160.36540.0250.52440.021
RVI0.21480.0250.31250.0330.24110.026
EVI0.29790.0320.19560.0360.20060.034
SAVI0.36420.0290.40660.0310.31990.028
DVI0.19560.0210.25410.0360.32950.031
IPVI0.26420.0330.26490.0460.23540.047
WDVI0.33210.0350.36520.0490.34630.040
GARI0.20080.0420.25550.0370.42350.038
Table 9. Comparison of the evaluation indicators for the GBDT and SVR models of LAI prediction.
Evaluation IndicatorsFruit Expansion StageLeaf Differentiation StageShoot-Stopping Stage
GBDTSVRGBDTSVRGBDTSVR
R20.7810.6670.7740.6450.8460.701
RMSD0.3390.4430.3790.4540.3560.431
Table 10. The t-test statistics for the intercept a and the slope b of the curve fitted between the predicted and measured values.
ParametersFruit Expansion StageLeaf Differentiation StageShoot-Stopping Stage
GBDTSVRGBDTSVRGBDTSVR
a0.510.390.820.590.620.25
Significant difference between a and 0
(p-value)
0.2770.2150.3560.2650.2960.231
b0.861.040.820.810.810.94
Significant difference between b and 1
(p-value)
0.5570.5120.4620.4860.4130.321
Table 11. Comparison of the SPAEF metric of LAI prediction for the GBDT and SVR models.
Evaluation IndicatorsFruit Expansion StageLeaf Differentiation StageShoot-Stopping Stage
SVRGBDTSVRGBDTSVRGBDT
SPAEF0.220.480.310.570.290.53
Publisher’s Note: MDPI stays neutral with regard to jurisdictional claims in published maps and institutional affiliations.

