Article

The Water Availability on the Chinese Loess Plateau since the Implementation of the Grain for Green Project as Indicated by the Evaporative Stress Index

1
Department of Earth and Environmental Science, School of Human Settlements and Civil Engineering, Xi’an Jiaotong University, Xi’an 710049, China
2
China Institute of Water Resources and Hydropower Research, Beijing 100038, China
3
School of Water and Environment, Chang’an University, Xi’an 710054, China
*
Author to whom correspondence should be addressed.
Remote Sens. 2021, 13(16), 3302; https://0-doi-org.brum.beds.ac.uk/10.3390/rs13163302
Submission received: 24 July 2021 / Revised: 13 August 2021 / Accepted: 18 August 2021 / Published: 20 August 2021
(This article belongs to the Special Issue Remote Sensing in Natural Resource and Water Environment)

Abstract

:
The vegetation coverage on the Loess Plateau (LP) of China has clearly increased since the implementation of the Grain for Green Project in 1999, but there is a debate about whether the improved greenness was achieved at the expense of the balance between the supply and demand of water resources. Therefore, developing reliable indicators to evaluate the water availability is a prerequisite for maintaining ecological sustainability and ensuring the persistence of vegetation restoration. This study was designed to evaluate water availability on the LP during 2000–2015, using the evaporative stress index (ESI) derived from a remote sensing dataset. The relative dependences of the ESI on climatic and biological factors (including temperature, precipitation and land cover change) were also analyzed. The results showed that the leaf area index (LAI) in most regions of the LP showed a significant increasing trend (p < 0.05), and larger gradients of increase were mainly detected in the central and eastern parts of the LP. The evapotranspiration also exhibited an increasing trend in the central and eastern parts of the LP, with a gradient greater than 10 mm/year. However, almost the whole LP exhibited a decreased ESI from 2000 to 2015, and the largest decrease occurred on the central and eastern LP, indicating a wetting trend. The soil moisture storage in the 0–289-cm soil profiles showed an increasing trend in the central and eastern LP, and the area with an upward trend enlarged with the soil depth. Further analysis revealed that the decreased ESI on the central and eastern LP mainly depended on the increase in the LAI compared with climatic influences. This work not only demonstrated that the ESI was a useful indicator for understanding the water availability in natural and managed ecosystems under climate change but also indicated that vegetation restoration might have a positive effect on water conservation on the central LP.

Graphical Abstract

1. Introduction

Vegetation is one of the most important land surface components, not only because it contributes to land surface greening, but also because it regulates land surface energy partitioning and the water cycle by interacting with the hydrosphere, atmosphere and biosphere [1,2,3]; thus, vegetation dynamics can be viewed as a key indicator of environmental quality and ecological function [4,5]. Water availability is a vital prerequisite for vegetation growth and sustainable ecological development, particularly in an ecologically fragile arid and semi-arid region [6,7]. However, vegetation can deplete soil moisture and result in water loss in the form of evapotranspiration (ET) in soil profiles, consequently leading to vegetation deterioration due to increasing soil moisture stress [8,9,10]. The Loess Plateau (LP) region of China (covering an area of approximately 640,000 km2) is one of the most prominent regions in terms of balancing the trade-off between ecological water demand and water resources [11,12]. Therefore, it is imperative to identify the water availability in the LP region to better understand the links between ET and vegetation health.
The LP region, located in the middle reach of the Yellow River and the transition zone between the southeast humid monsoon climate and northwest inland arid climate, is well known for severe soil erosion and chronic water scarcity [13]. In 1999, the Chinese government launched the largest vegetation restoration program called the Grain for Green Project. This project is a rapid landscape scale shift in land use and ground cover and also known as the conversion of cropland to forest and grassland program or the sloping land conversion program, in which a large proportion of sloping (more than 15°) croplands and barren land were converted into forest or grassland. With the increase in vegetation coverage, soil erosion has been controlled effectively, and the sediment yield in the mainstream Yellow River and its tributaries has been reduced significantly [13]. Despite these achievements, the water discharge of the Yellow River has decreased, and extensive forestation has consumed more of the limited water resources and has resulted in reduced soil moisture, which is detrimental to vegetation growth and threatens ecosystem services [14,15]. Moreover, the temperature has persistently increased on the LP in recent decades, and the precipitation pattern (including annual precipitation, seasonal distribution of precipitation and precipitation intensity) has changed accordingly [16,17]. Climate change increases the difficulty of assessing the availability of water resources because of the complexity of the interaction between vegetation growth and water availability under the context of global warming.
In recent years, many studies have focused on the hydrological response to vegetation restoration and climate change in the LP region, including the contributions of land cover change and climate change to water discharge and sediment load [18,19,20], soil moisture dynamics under vegetation restoration [14,21,22] and the ET estimations associated with revegetation [23,24,25]. However, these studies have focused on comparative analyses of hydrological variability in different land covers, and few have quantified changes attributed purely to land cover change. Indeed, it is challenging to quantify the water availability at the regional scale due to the heterogeneities of the land surface, the complexity of hydrometeorological processes and the multiple impact factors including climate, land cover change and human activities.
An accurate identification of the current water status is a prerequisite for initiating early drought warnings; thus, the development of robust drought indicators has become an alternative to comprehensively assess the water availability of a regional ecosystem. Currently, several indices have been applied to monitor drought characteristics and their spatial extent, such as the standardized precipitation index (SPI), Palmer drought severity index (PDSI) and standardized precipitation evaporation index (SPEI). The SPI is expressed as standard deviations, and the observed precipitation deviates from the long-term mean; thus, the SPI depends only on precipitation and represents anomalous precipitation [26]. Although a precipitation deficit is an important factor in drought quantification and can provide valuable information concerning hydrologic and meteorological drought, other climatic factors can be important drivers in the depletion of soil moisture and lead to drought. The PDSI was developed by Palmer (1965), who attempted to identify droughts using more than just precipitation data by considering the temperature, precipitation and moisture stored in the soil [27]. Nonetheless, some studies have demonstrated that the potential ET (PET) is a useful variable in quantifying drought severity [28,29,30], because the biophysical processes of the land surface involving water and energy exchange play an important role in controlling soil moisture conditions and drought occurrence. A newly developed drought index, the SPEI, is an extension of the SPI and is designed to consider both precipitation and PET in determining drought [31]. From hydrological and ecological perspectives, drought represents an imbalance between the water supply and demand, which has inevitably had profound influences on vegetation growth, while vegetation exerts an important influence on regional hydrology and climate, and the ecological function varies among plant species. However, the abovementioned metrics have limitations in characterizing the ecological impacts of hydroclimatic change if a region experiences large-scale land cover change. Hence, there is a growing need to use physically based drought metrics to consider the feedback between the land surface and atmosphere in assessing water availability.
A high evaporative demand of vegetation under high temperature and low precipitation, especially when combined with a limited soil moisture supply, can induce plant water stress. To reduce water loss and maintain physiological metabolic activity, water-stressed plants typically close their stomata, leading to growth restrictions and a greater susceptibility to disease and insects. A remote sensing-based indicator proposed by Anderson et al. (2007), the evaporative stress index (ESI), can convey useful information about the magnitude and direction of short- and long-term moisture stress [32]. The ESI combines the influences of terrestrial and climatic variables on land surface moisture status and can, therefore, provide early warning of drought initiation and intensification [33,34]. In this study, we first investigated the land cover change and vegetation dynamics on the LP since the implementation of the Grain for Green Project based on remote sensing products. Then, the ESI was applied to quantify the water status and the percentage of an area experiencing and affected by water stress. Finally, the potential drivers of ESI change and its connection to the known drought indices were examined.

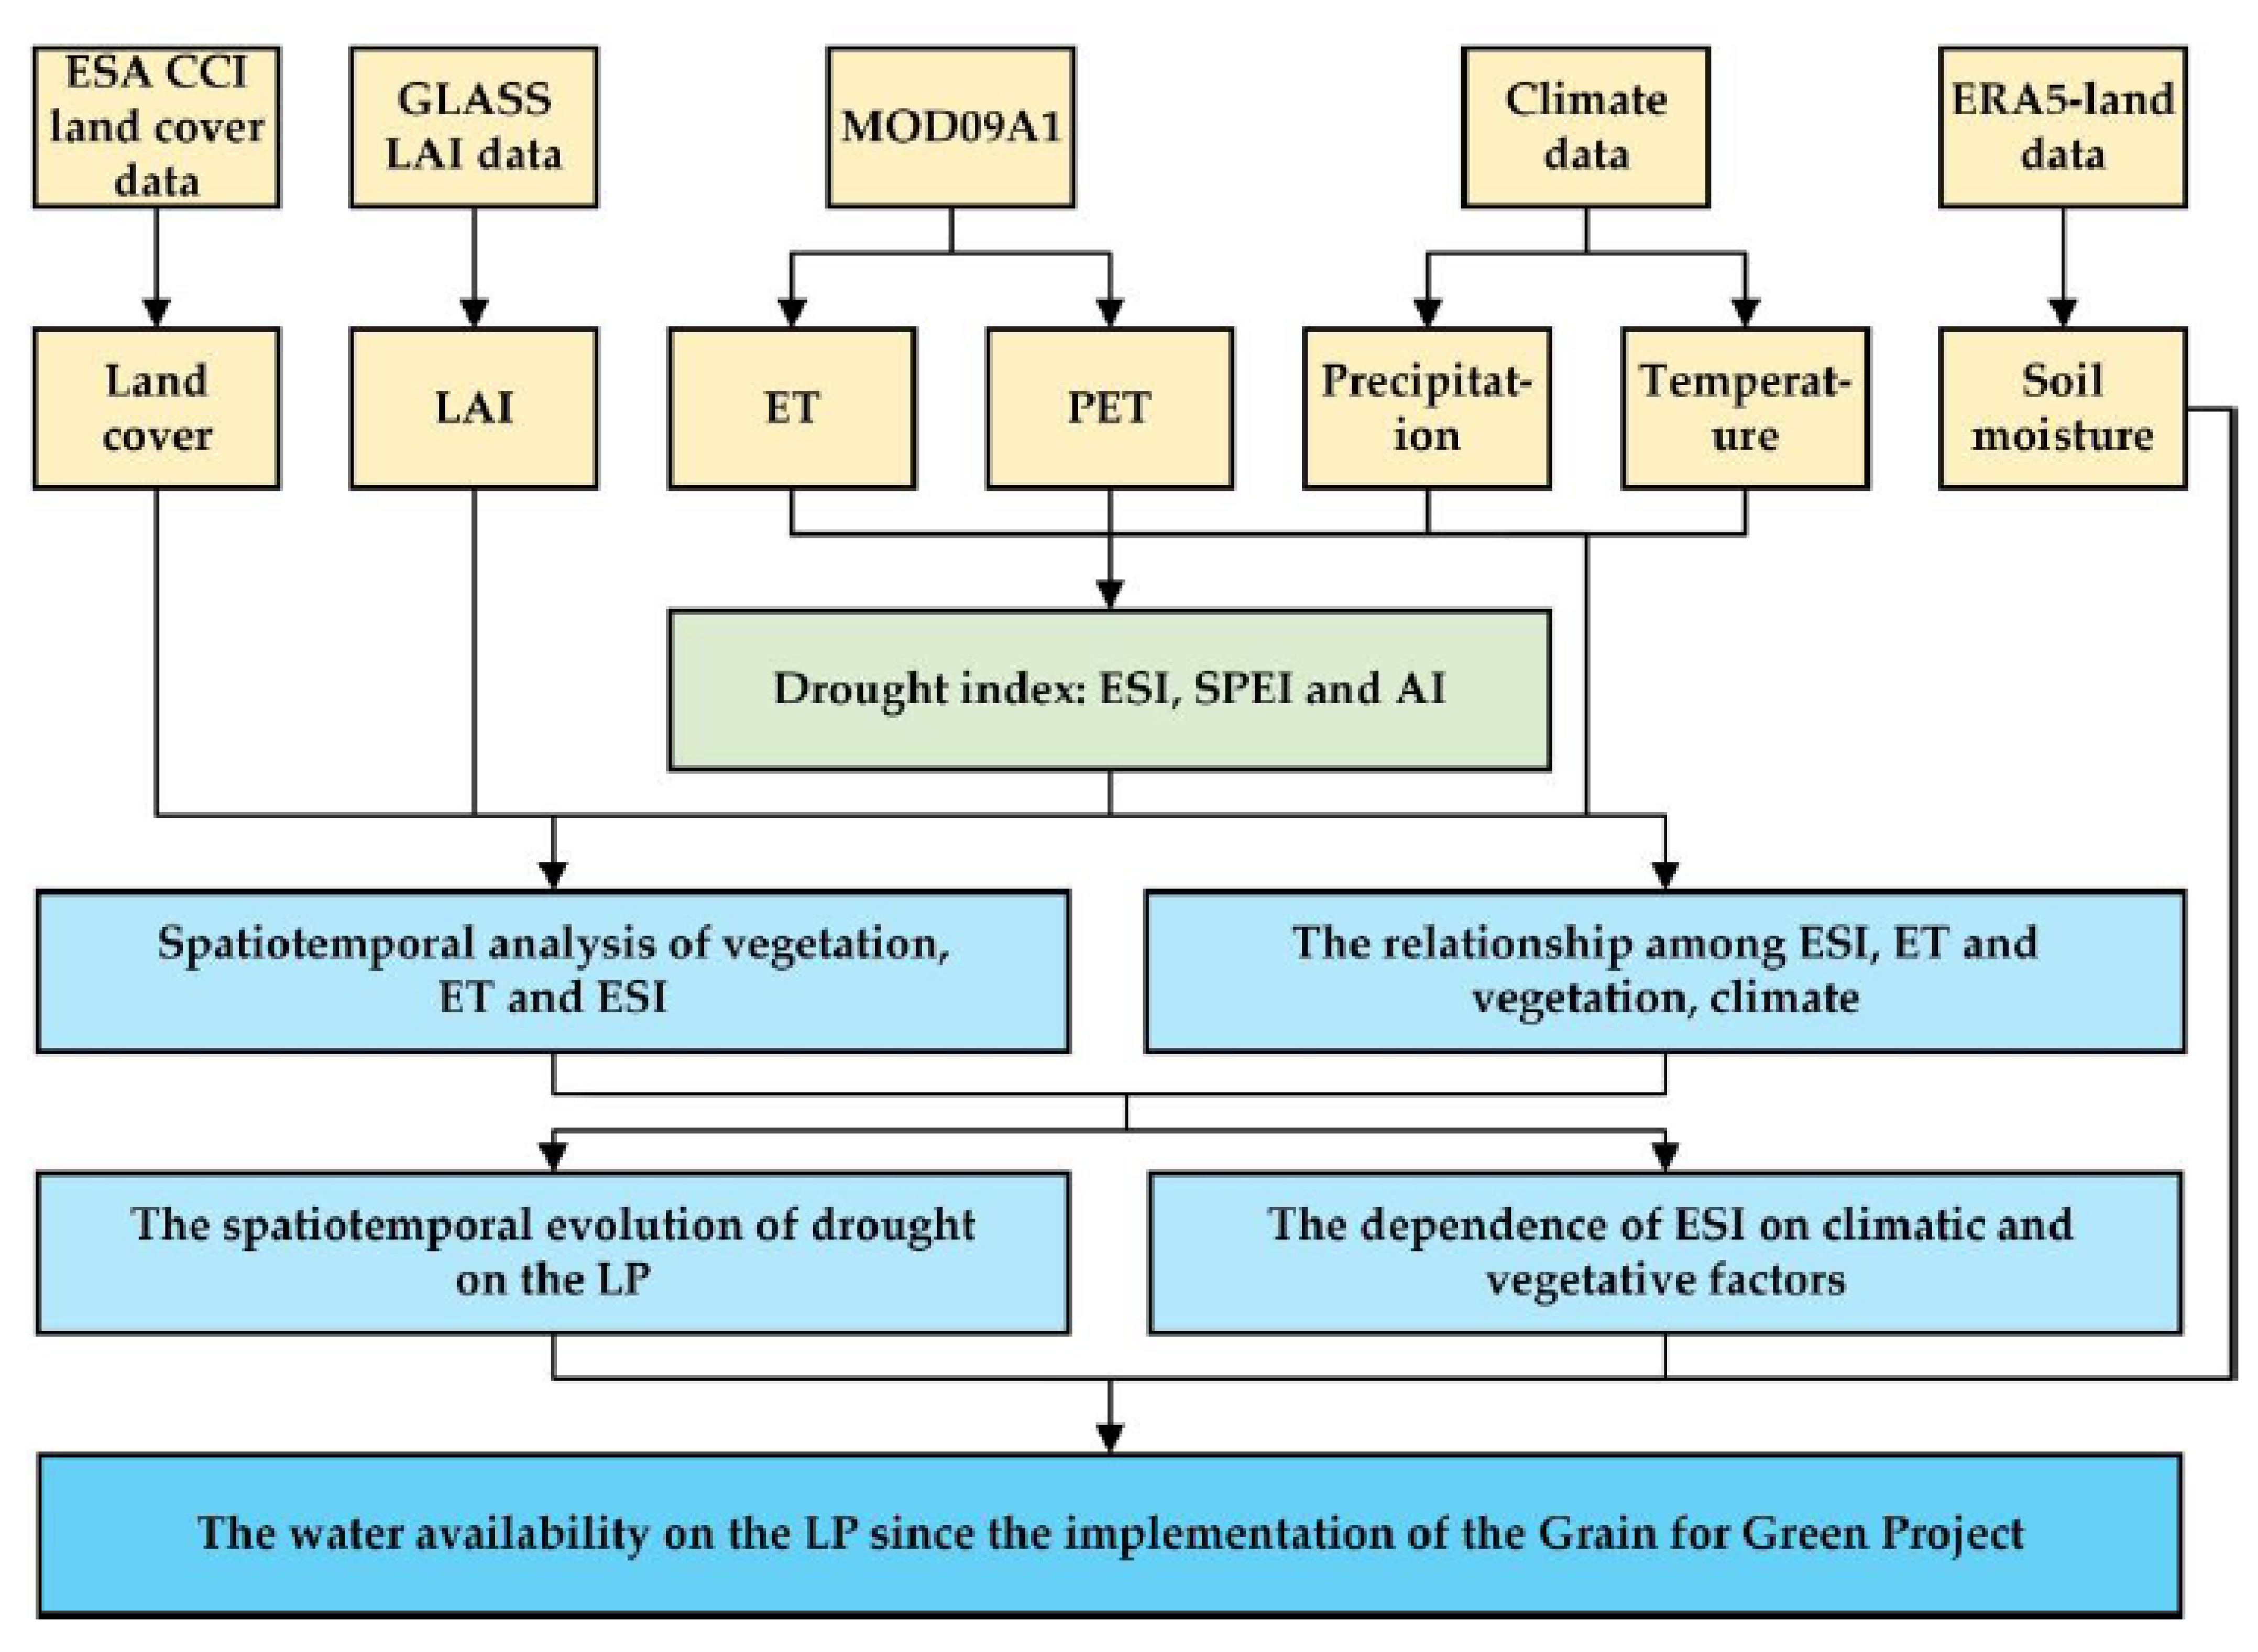
2. Materials and Methods

2.1. Datasets

The annual land cover types from 2000 to 2015 in the LP region were acquired from satellite observation-based global land cover datasets, which were produced by the European Space Agency (ESA) Climate Change Initiative (CCI) land cover project (http://www.esa-landcover-cci.org/; accessed on: 16 August 2020). The ESA CCI version 2.0 land cover data describe the Earth’s terrestrial surface in 37 original land cover classes based on the United Nations Land Cover Classification System, with a 300-m spatial resolution at an annual scale during 1992–2015. To simplify the analysis, the original land cover classes of the ESA CCI were grouped into the following six major land cover classes: crop, forest, grass, shrub, mosaic vegetation and non-vegetated (Table 1). The leaf area index (LAI) data used for monitoring vegetation growth from 2000 to 2015 on the LP were obtained from the Global Land Surface Satellite (GLASS) LAI product (downloaded from the National Earth System Science Data Center, http://www.geodata.cn; accessed on: 1 August 2020), and these data were generated and released by the Center for Global Change Data Processing and Analysis of Beijing Normal University [35]. The GLASS LAI product is derived from the Moderate Resolution Imaging Spectroradiometer (MODIS) reflectance data (MOD09A1) and has a spatial resolution of 1 km and a temporal resolution of eight days.
Monthly 2-m air temperature and precipitation data for the period of 2000–2015 in the LP region, with a spatial resolution of 1 km, were acquired from a dataset developed by Peng et al. (2017) [36] and released by the National Tibetan Plateau Data Center (http://data.tpdc.ac.cn accessed on: 16 August 2020). The dataset was spatially downscaled from the Climatic Research Unit TS v4.02 dataset with the climatology dataset of WorldClim v2.0 and was evaluated using 496 weather stations in China. ET and PET datasets, with a spatial resolution of 500 m, were obtained from the global eight-day (MOD16A2) terrestrial ecosystem ET dataset, which was released by the Land Processes Distributed Active Archive Center of the United States Geological Survey (https://lpdaac.usgs.gov/products/mod16a2v006/ accessed on: 16 August 2020). The MOD16 algorithm is based on the logic of the Penman–Monteith equation, which uses daily meteorological reanalysis data and 8-day remotely sensed vegetation property dynamics from MODIS as inputs [37]. The spatiotemporal change in soil moisture during 2000–2015 on the LP was investigated using the ERA5-land reanalysis product, which combines historical observations (including satellite data and in situ data provided by WMO WIS) into advanced modelling and data assimilation systems to provide a consistent view of global land-surface and water resource estimates [38]. ERA5-land provides soil moisture estimates at four soil profiles, including 0–7, 7–28, 28–100, and 100–289 cm, and the data have a latitude/longitude grid of 0.1° × 0.1° with a monthly time step. To compare land-surface and atmospheric variables from a consistent spatial resolution, all datasets were resampled to 1-km resolution using bilinear interpolation.

2.2. Drought Indices

The ESI is a physically based drought index linked to evaporative demand that includes land surface (via ET) and atmospheric feedbacks (via PET). The ESI was calculated as follows: ESI = 1 − (ET/PET) [32]. It is a dimensionless index that ranges from 0 to 1, depending on the evaporative demand of the land surface and atmosphere. When the ESI is close to 0, there is ample moisture and no water stress, while when the ESI is close to 1, the ecosystem indicates water stress due to stomatal closure and/or complete depletion of the soil moisture. To convey convincing information about the water status on the LP, the robustness of the ESI for monitoring water stress was assessed using the SPEI and aridity index (AI). A lower SPEI indicated that drought severity increased in the study period, while a higher SPEI reflected that environmental conditions tended to be wet. The AI is the ratio of PET to annual precipitation [39]. Generally, the water status can be divided into the following five types: humid (AI ≤ 1.0), semi-humid (1.0 < AI ≤ 1.5), semi-arid (1.5 < AI ≤ 4.0), arid (4.0 < AI ≤ 16.0), severe arid (AI > 16.0).

2.3. Data Analysis

The Mann–Kendall nonparametric statistical test (M–K) was used to examine the change tendency of variables in a temporal series [40,41], and a significance level of 0.05 was applied to examine the statistical significance of the trend. We used the Sen slope test to detect the slope of trend [42]. The partial correlation coefficients between the ESI and the atmospheric and land surface variables were calculated to examine their relative dependence, and the t-test at the 95% confidence level was applied to assess the significance of the correlations. To identify the primary drivers of ESI variability, we used multiple regression analysis and partial correlation analysis between the time series of the ESI and the climatic variable and LAI changes [43]. A summary of the methods used in this study is shown in Figure A1.

3. Results

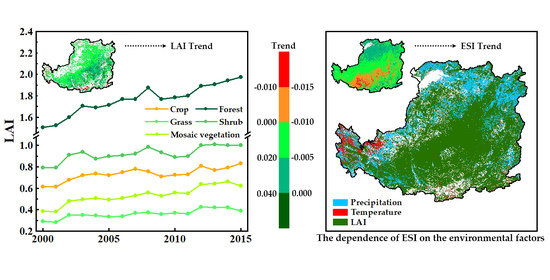
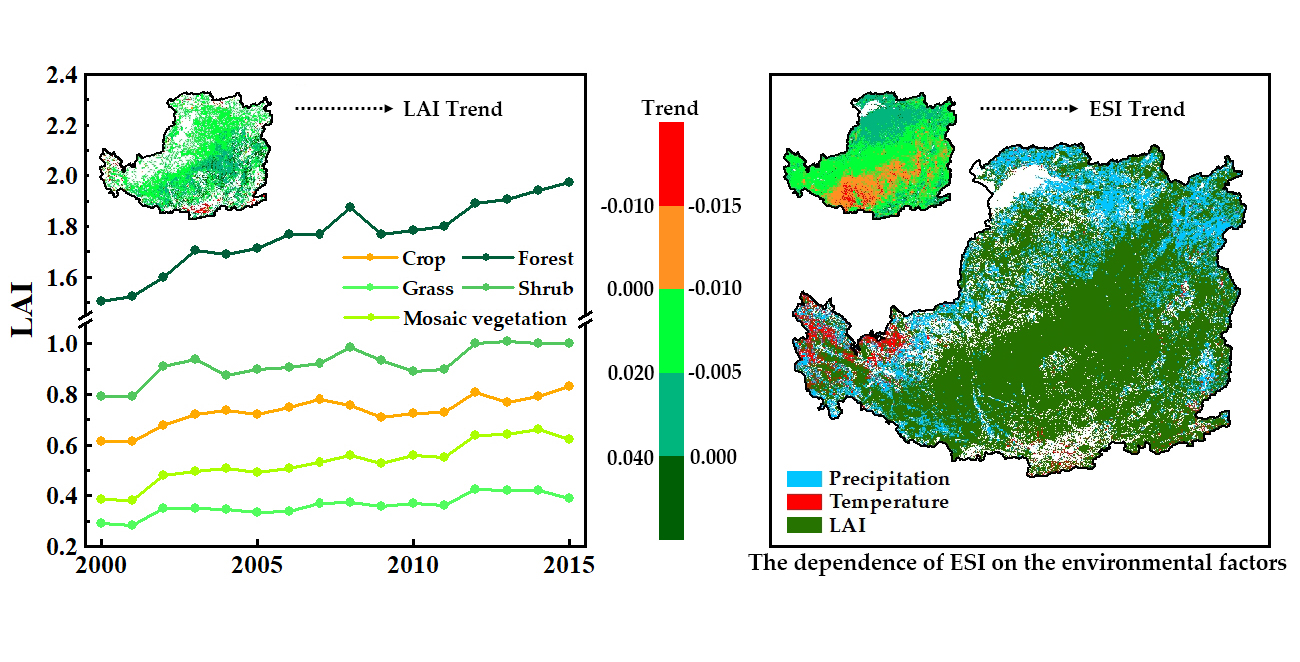
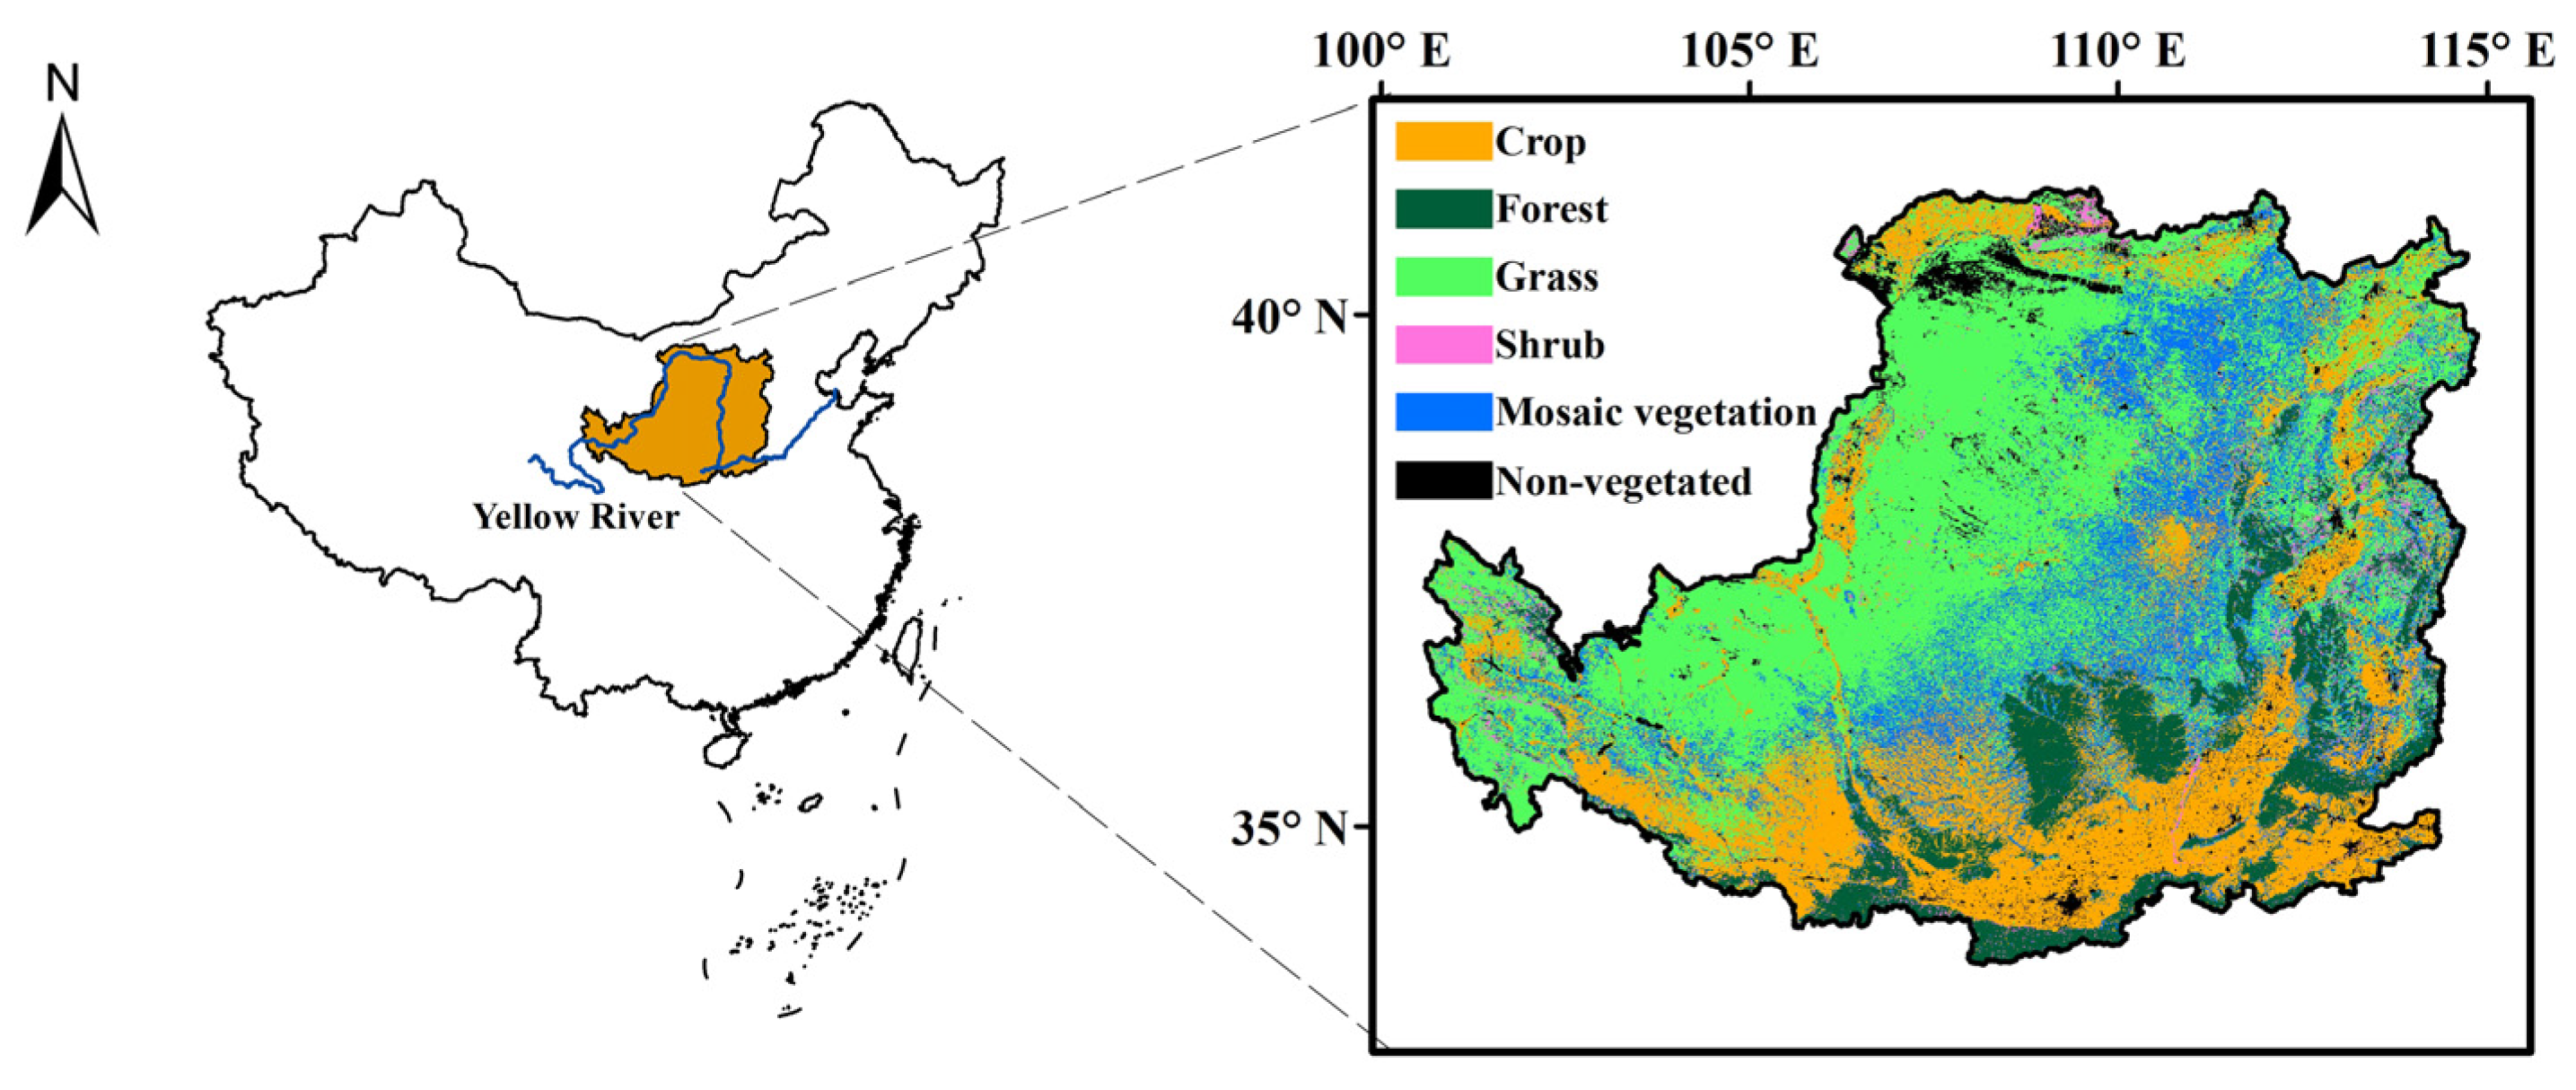
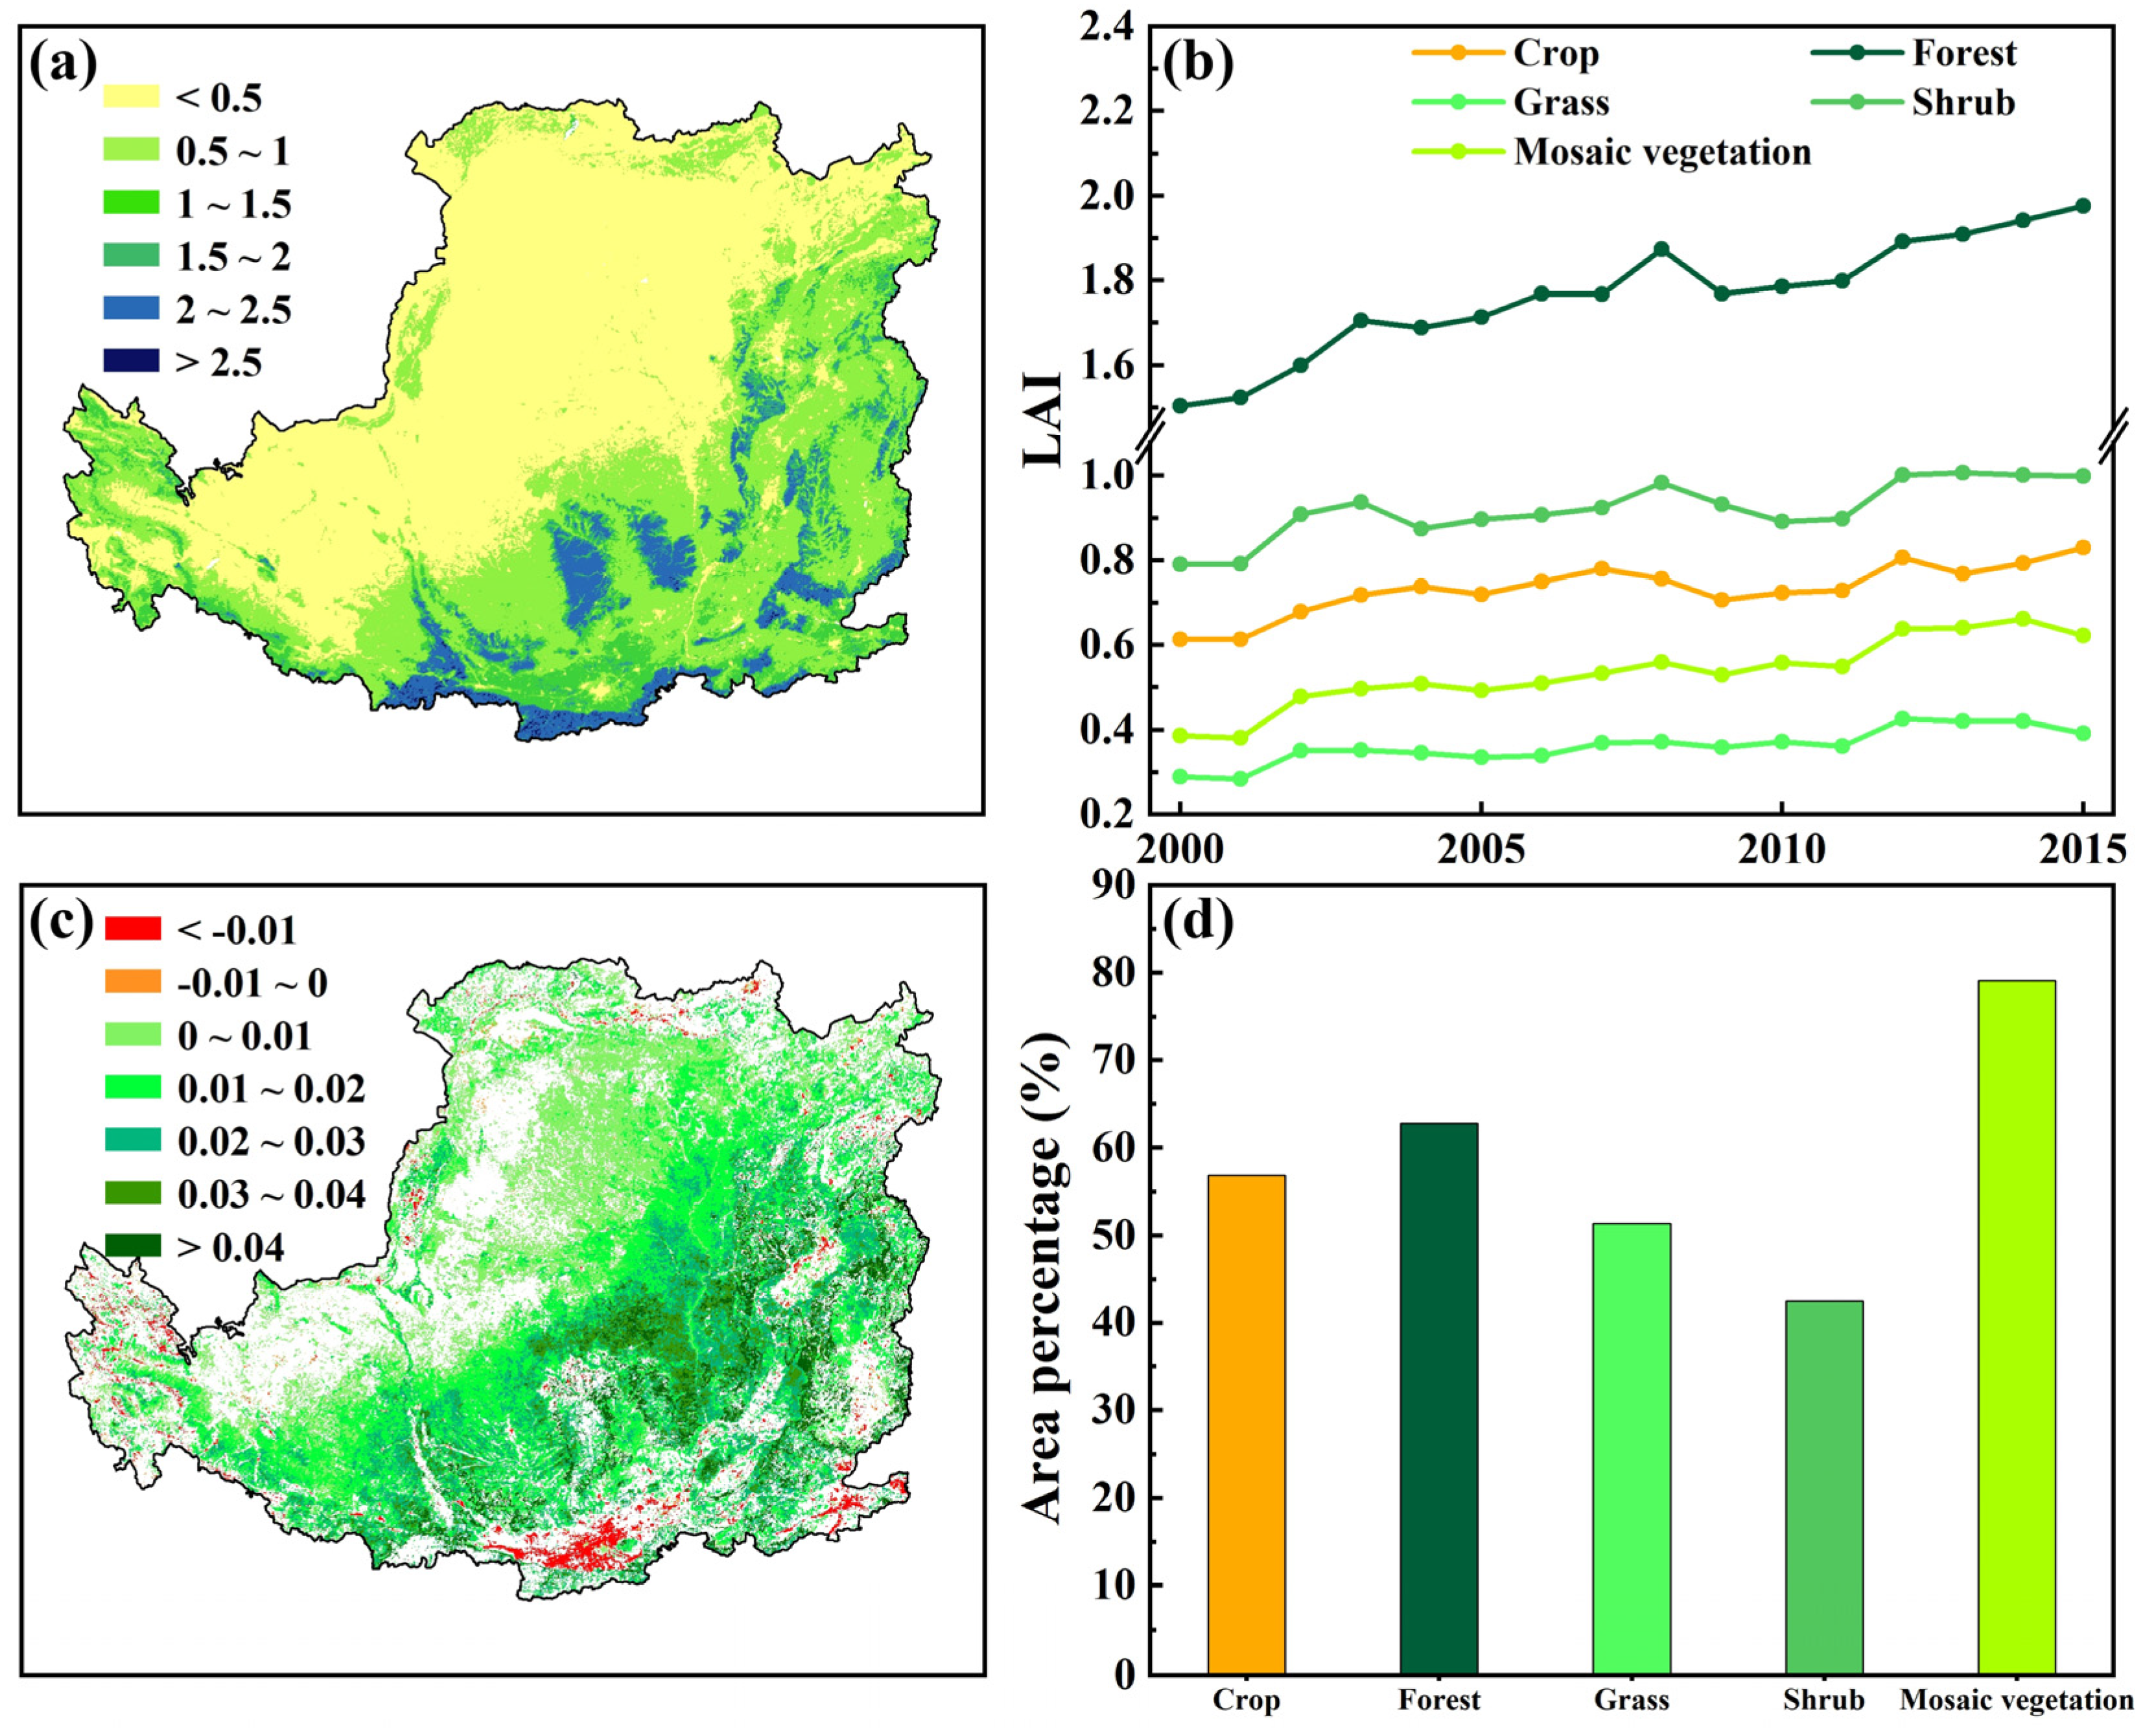
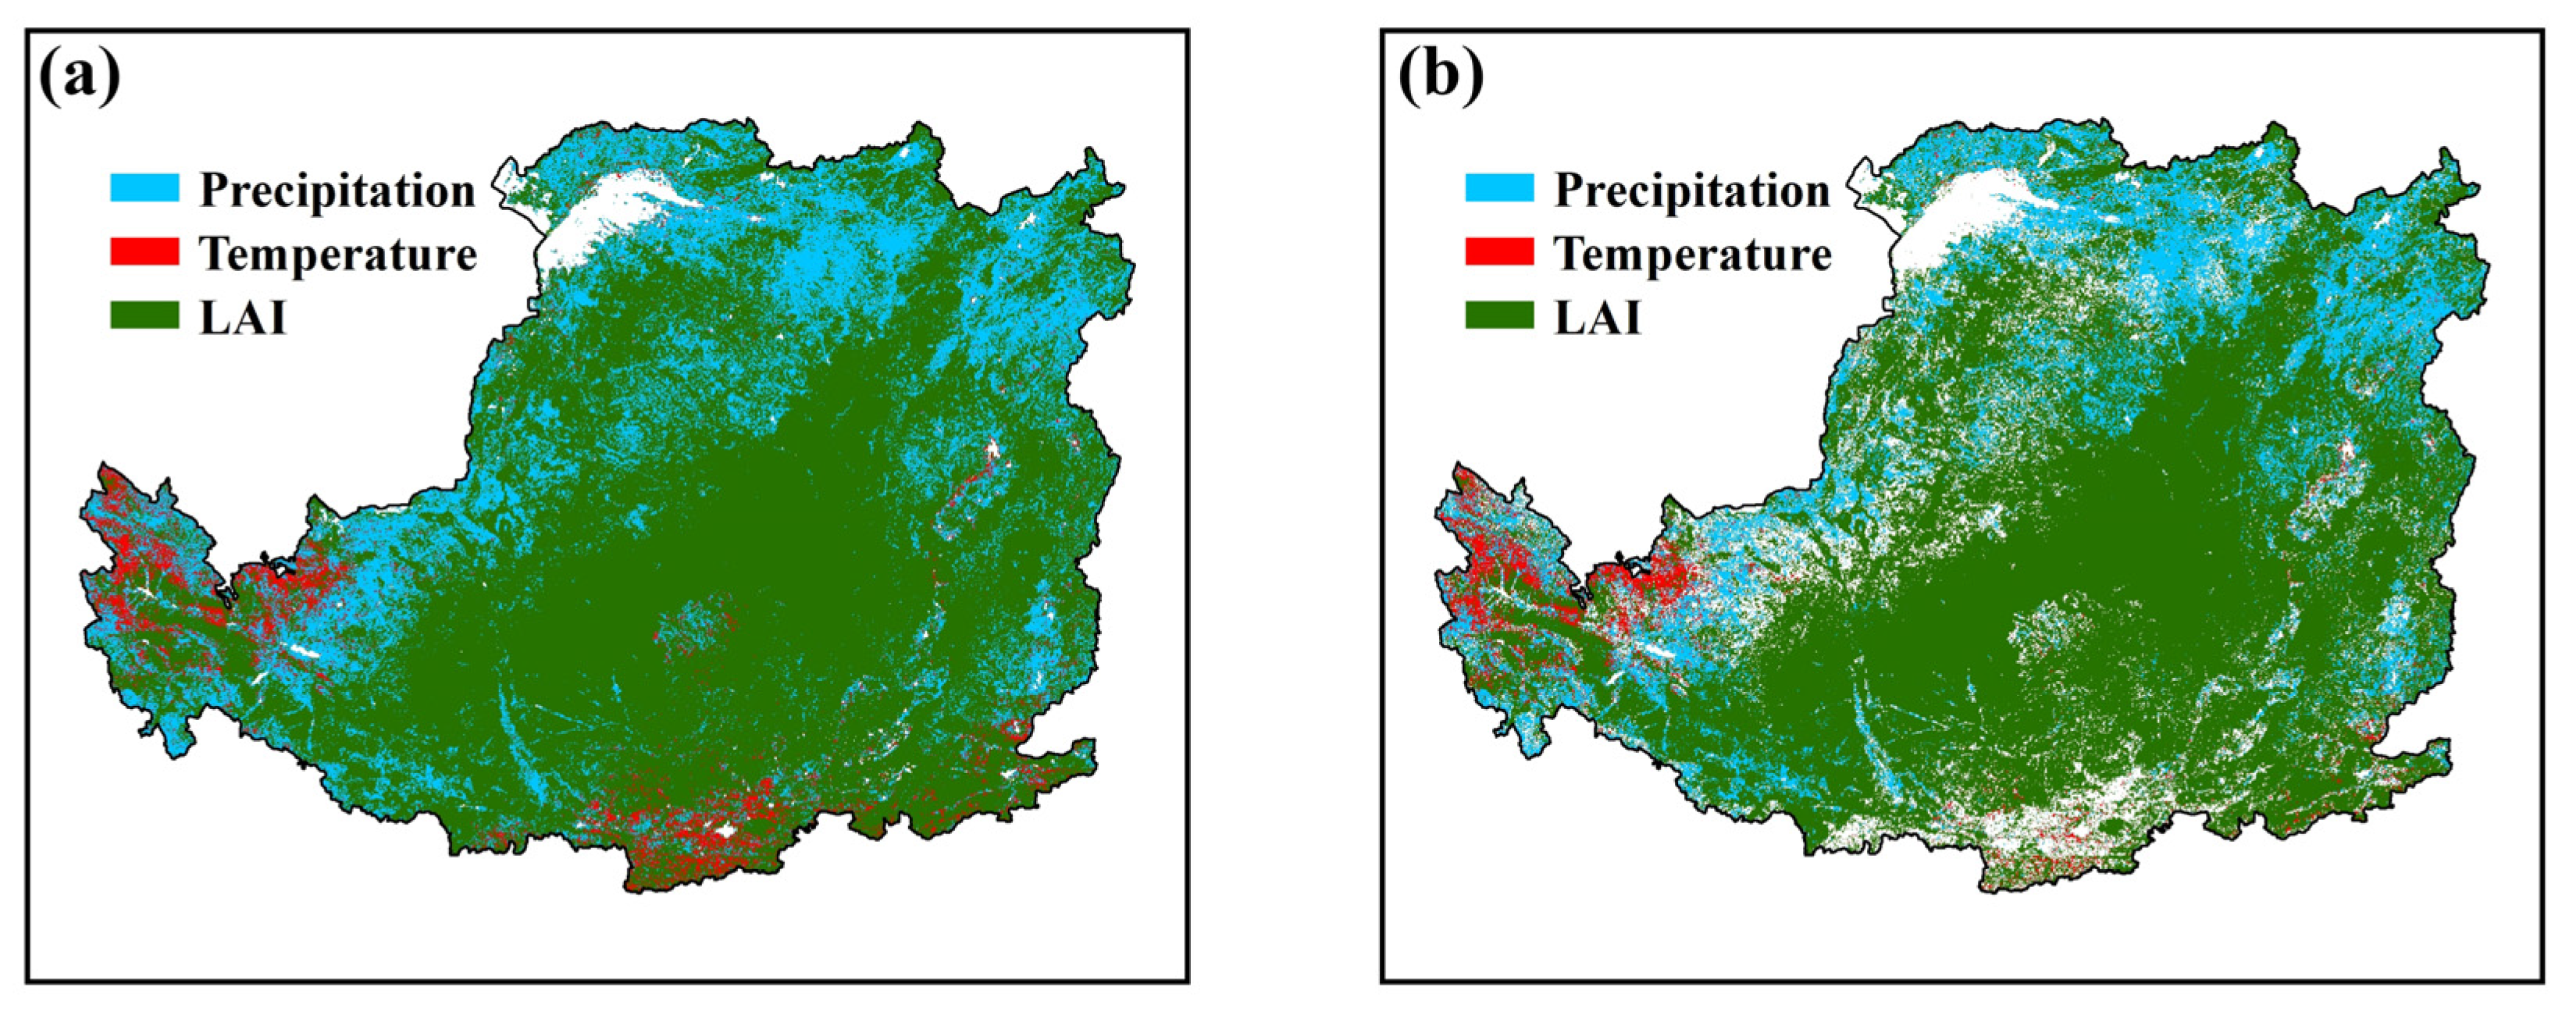
3.1. Vegetation Cover Changes from 2000 to 2015

According to the merged land cover classification data, the land cover types on the LP exhibited evident zonal distributions (Figure 1). In the northwestern LP, the dominant land cover type was grass, accounting for approximately 40% of the area on the LP (Table 2). The main land cover types for the southeastern LP were crops and forests, which occupied 25% and 11% of the area on the LP, respectively. Shrubs were sparsely distributed on the LP and had the smallest area, with percentages below 3%. The central and northwestern parts of the region comprise the transition zone, which is mainly distributed with mosaic vegetation, including forests, shrubs and grass, with an area percentage of approximately 18%. As a result, the LAI on the LP exhibited an increasing trend from the northwest to southeast (Figure 2a). Although the occupied area of all land cover types has remained stable since 2000 (Table 2), the LAI exhibited an increasing trend (Figure 2b). In particular, the LAI for forests had the largest increase, with values from 1.5 in 2000 to 2.0 in 2015, followed by mosaic vegetation, with an increased magnitude of 0.2. Spatially, the LAI in most regions of the LP showed a significant increasing trend, and larger gradients of increase were mainly detected in the central-eastern part of the LP (Figure 2c), where the regions are mainly covered by forest and mosaic vegetation. After calculating the area percentage of the LAI with a significant increasing trend (Figure 2d), the region with a significant increasing trend for all land cover types except shrubs accounted for approximately more than 50% of the respective area, with the largest percentage of 78% detected for mosaic vegetation.

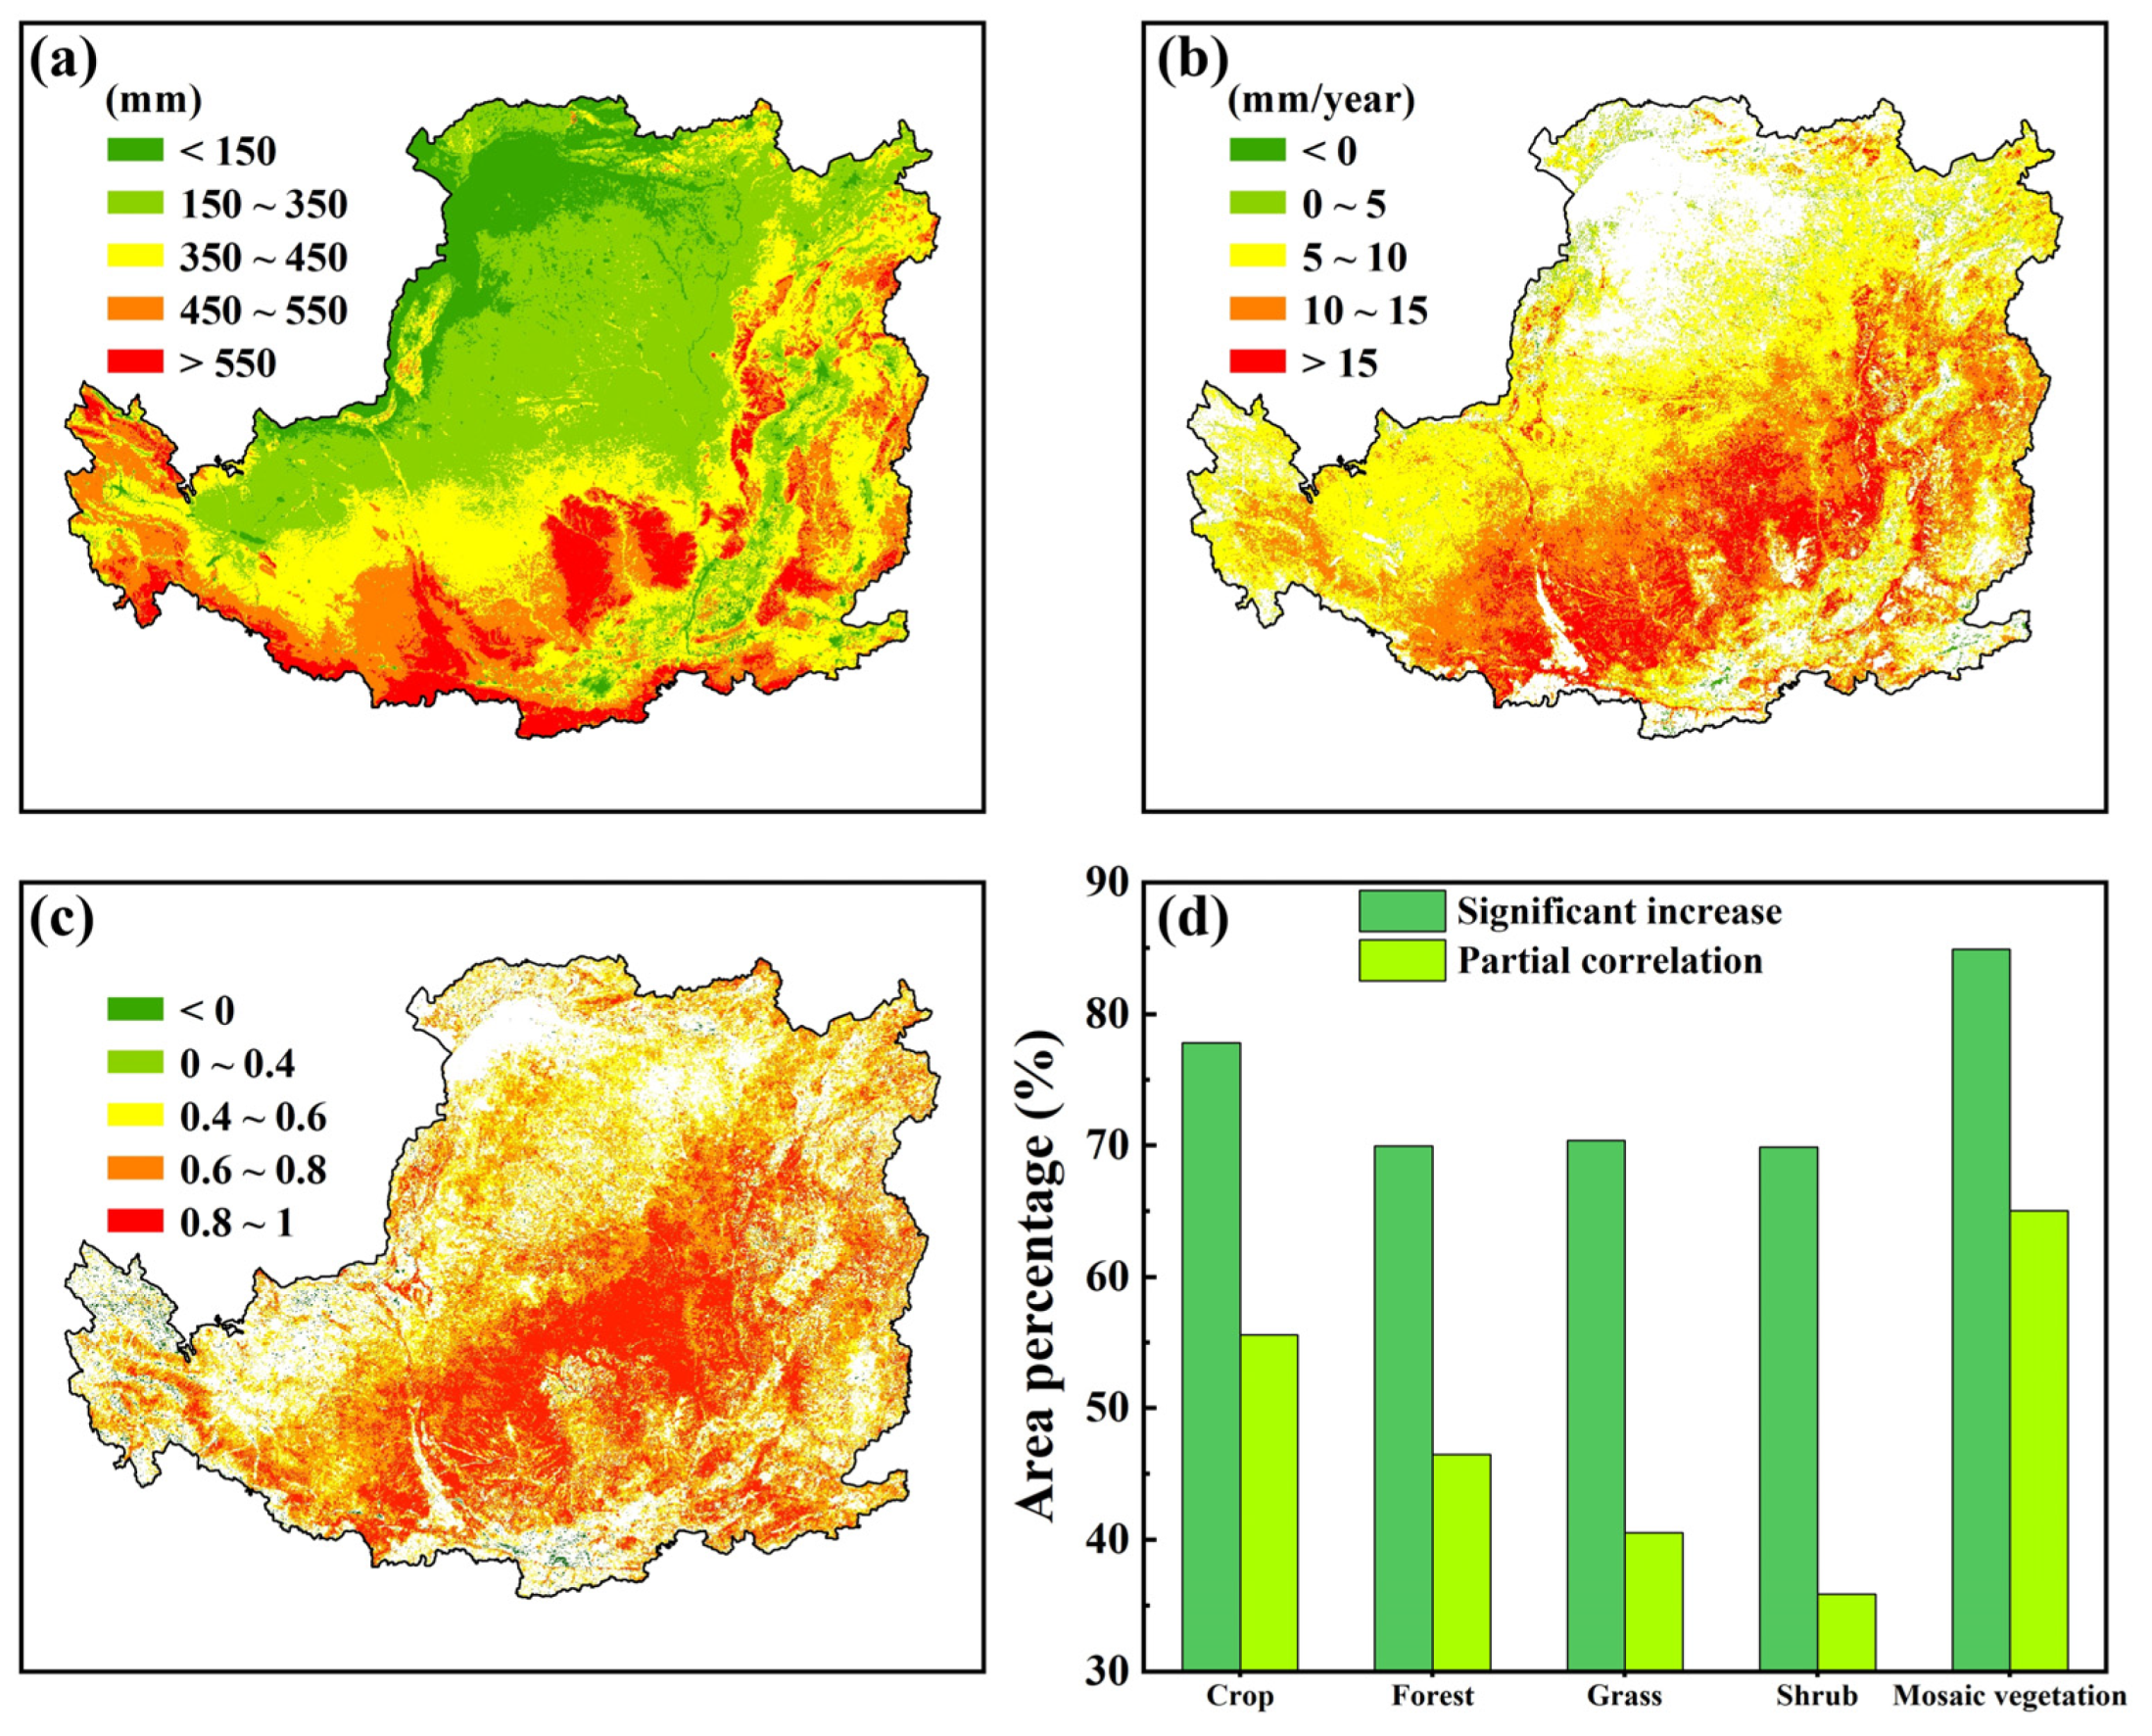
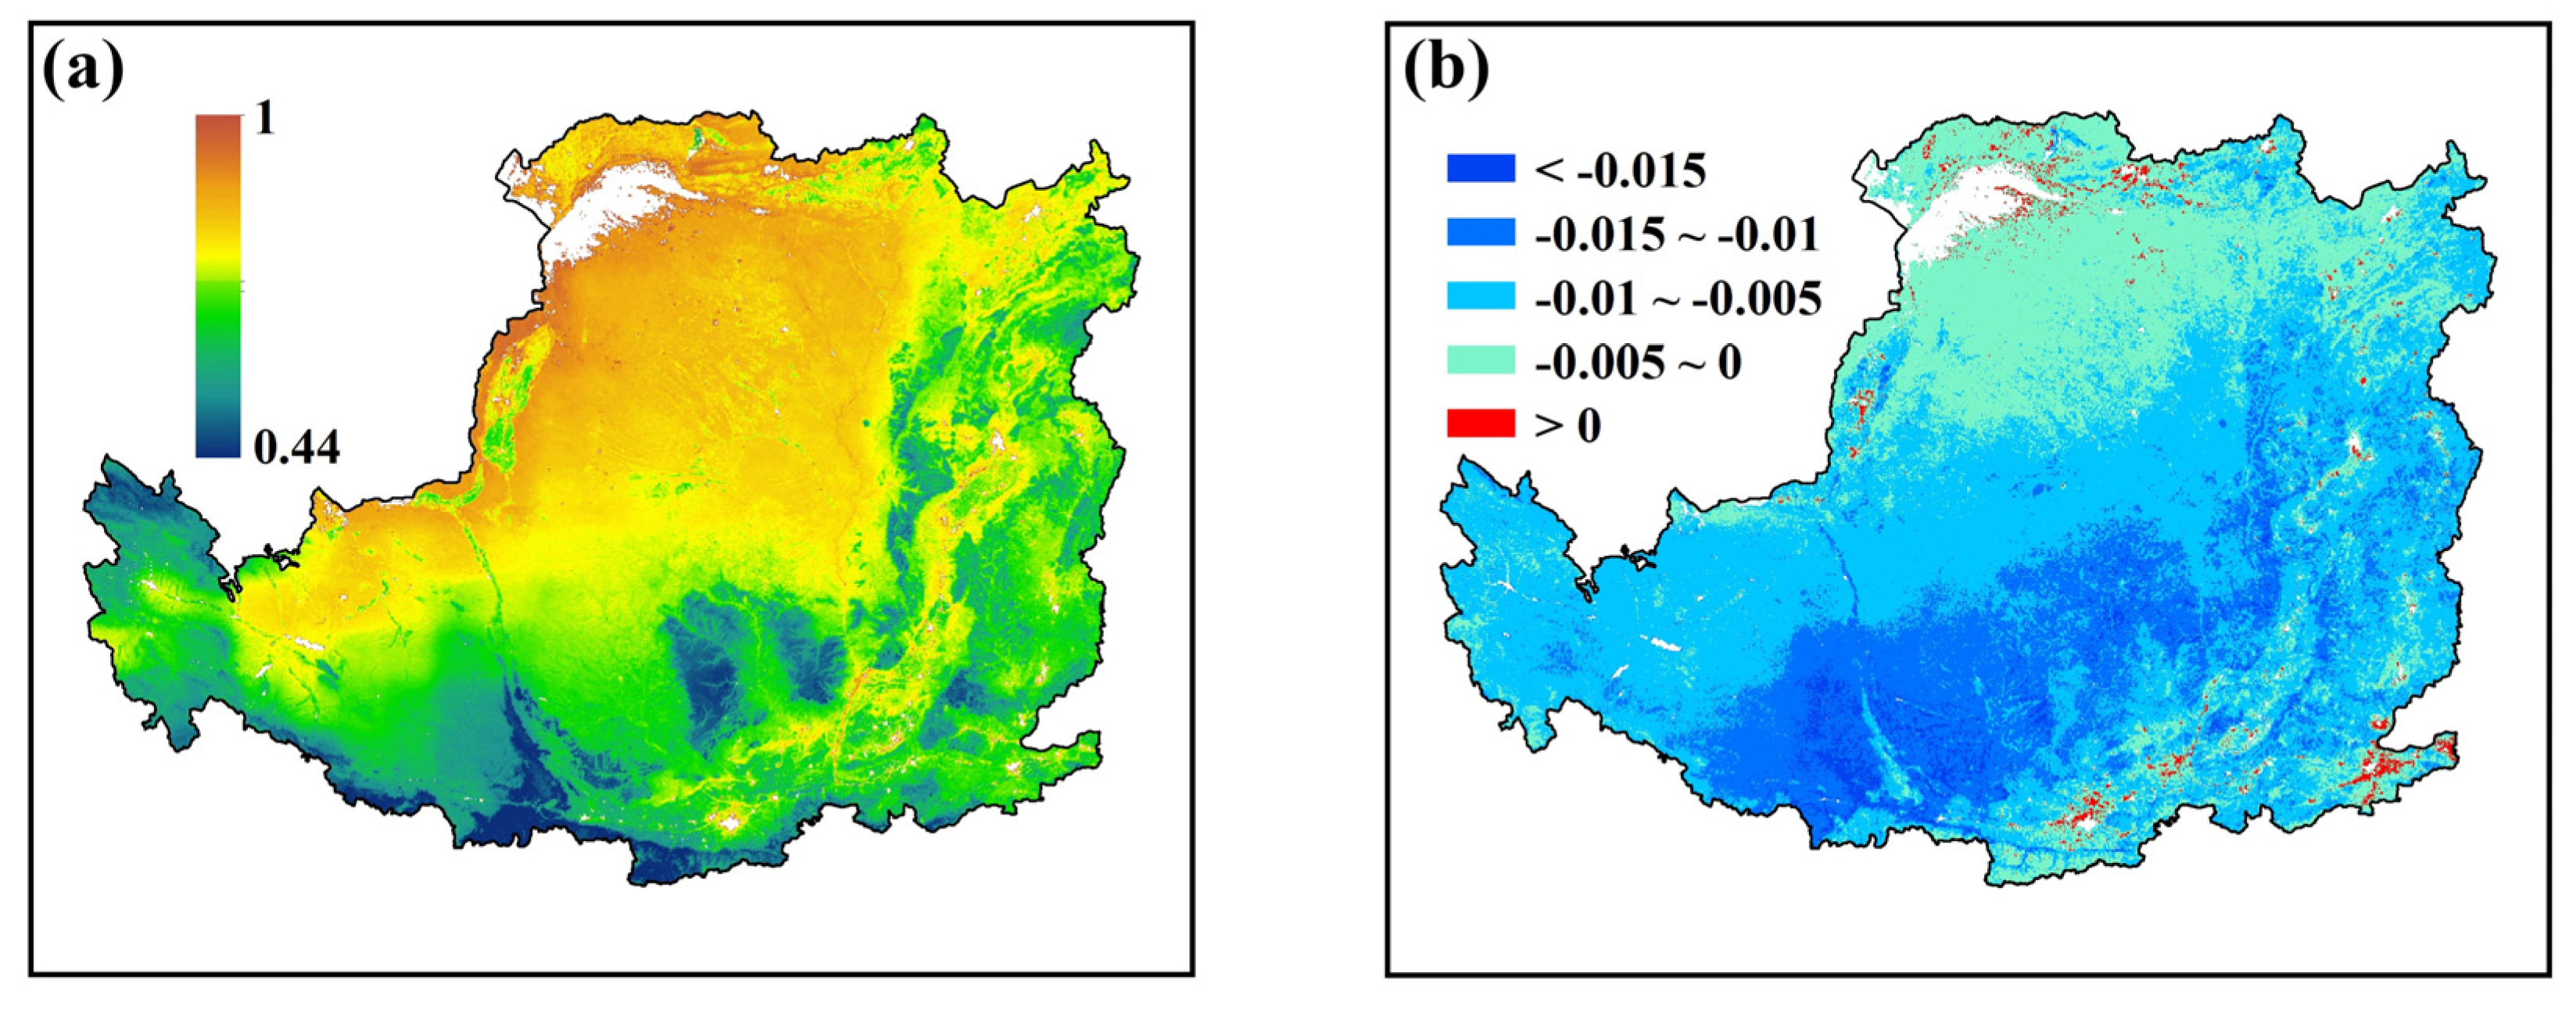
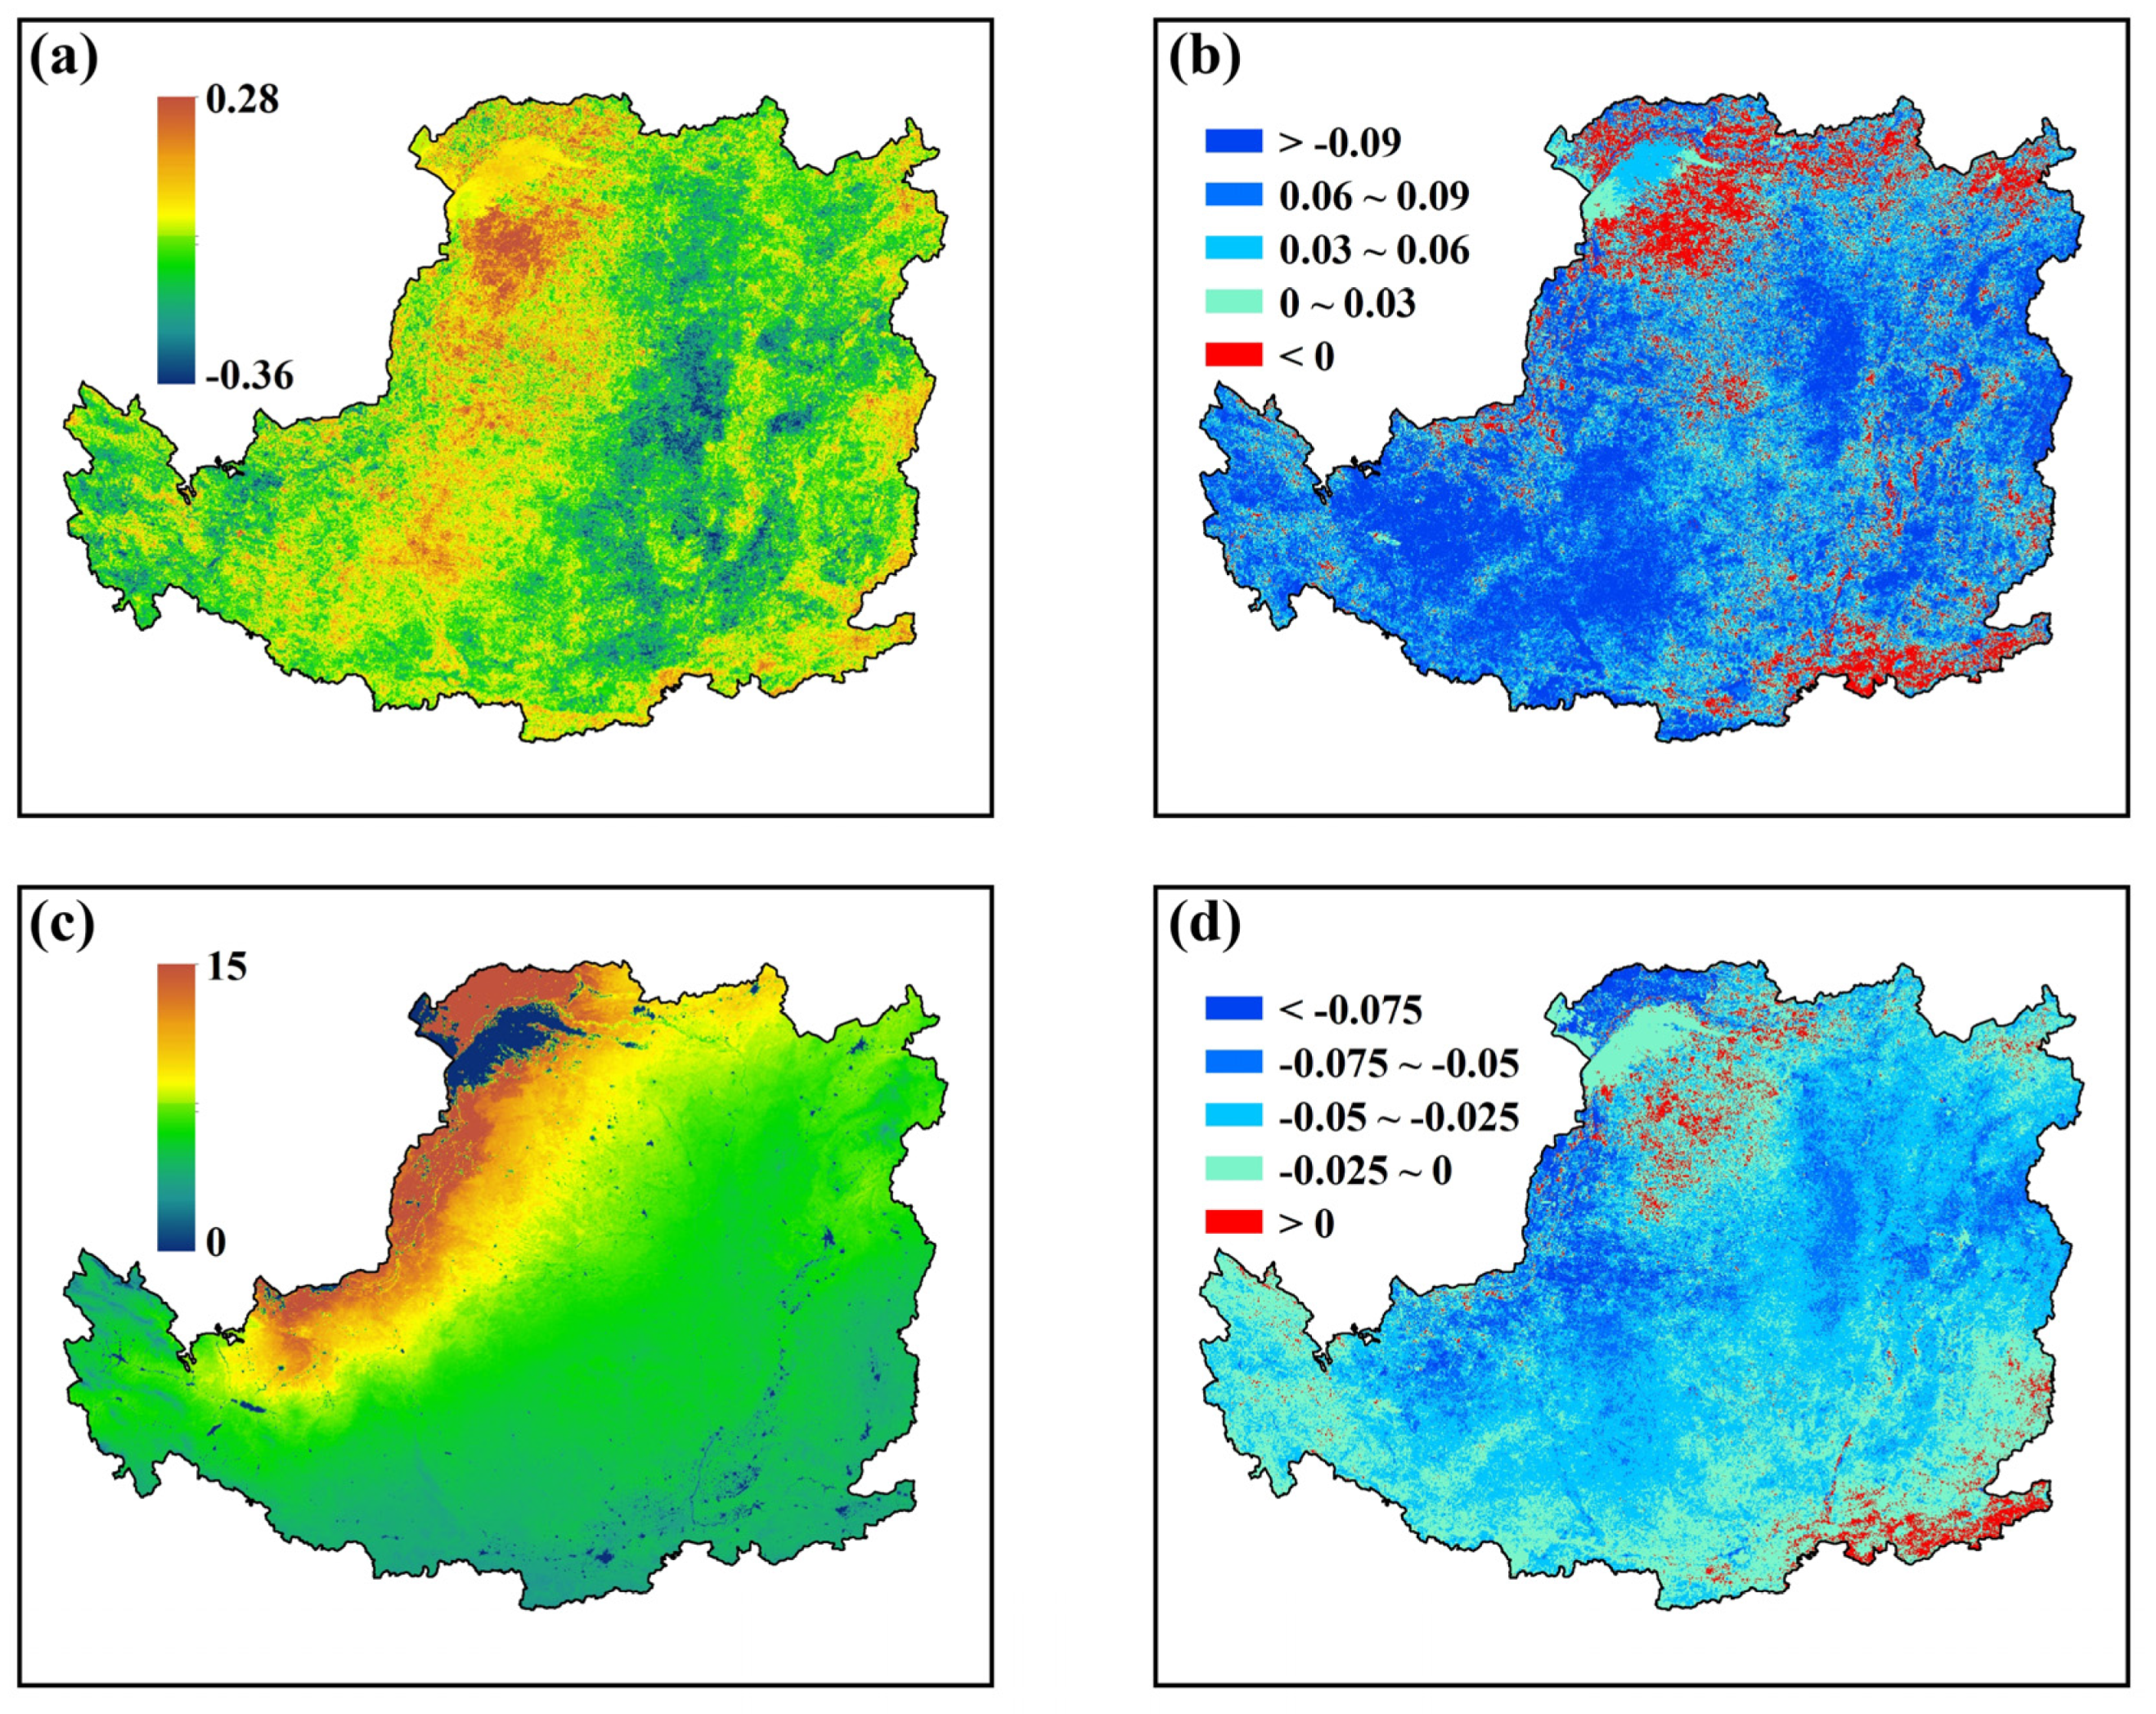
3.2. Characteristics of ET and ESI on the LP

The annual average ET during 2000–2015 on the LP showed clear zonal variation (Figure 3a). The northwestern LP had less ET, with values less than 350 mm, while most regions in the southeastern LP had more ET, with values larger than 450 mm. Overall, the spatial pattern of ET was consistent with the land cover distribution on the LP. From 2000 to 2015, the ET on the whole LP showed an increasing trend, with a statistical significance level of 0.05 (Figure 3b). The largest increases were detected in the central and southeastern LP, where the LAI had a clear increase (Figure 2c), with a trend slope greater than 10 mm/year. The partial correlation between ET and LAI that eliminated the influences of precipitation and temperature was further analyzed, and larger correlation coefficients were obtained in the central and southeastern LP, with values ranging from 0.8 to 1 (Figure 3c). Notably, the area of increased ET for different land cover types with statistical significance (p < 0.05) accounted for approximately 70% of the respective area, and the approximately 65% of the area with an increased ET for mosaic vegetation had a strong connection with increased LAI (Figure 3d).
The annual average ESI on the LP during 2000–2015 showed evident spatial variation, with a smaller ESI in the southeastern LP and a larger ESI in the northwestern LP (Figure 4a); additionally, the largest ESI was detected in the region where the dominant land cover was grass, indicating that grassland had the greatest evaporative stress. Almost the whole LP exhibited a decreased ESI from 2000 to 2015, while the temporal trends were spatially uneven (Figure 4b). The northern LP had the smallest slope of the decreasing trend, and the slopes of the decreasing trend intensified southward. Most of the zonal region from the southwestern LP to eastern LP had the largest slopes of the decreasing trend, which was similar to the temporal variation in the LAI on the LP (Figure 2c).

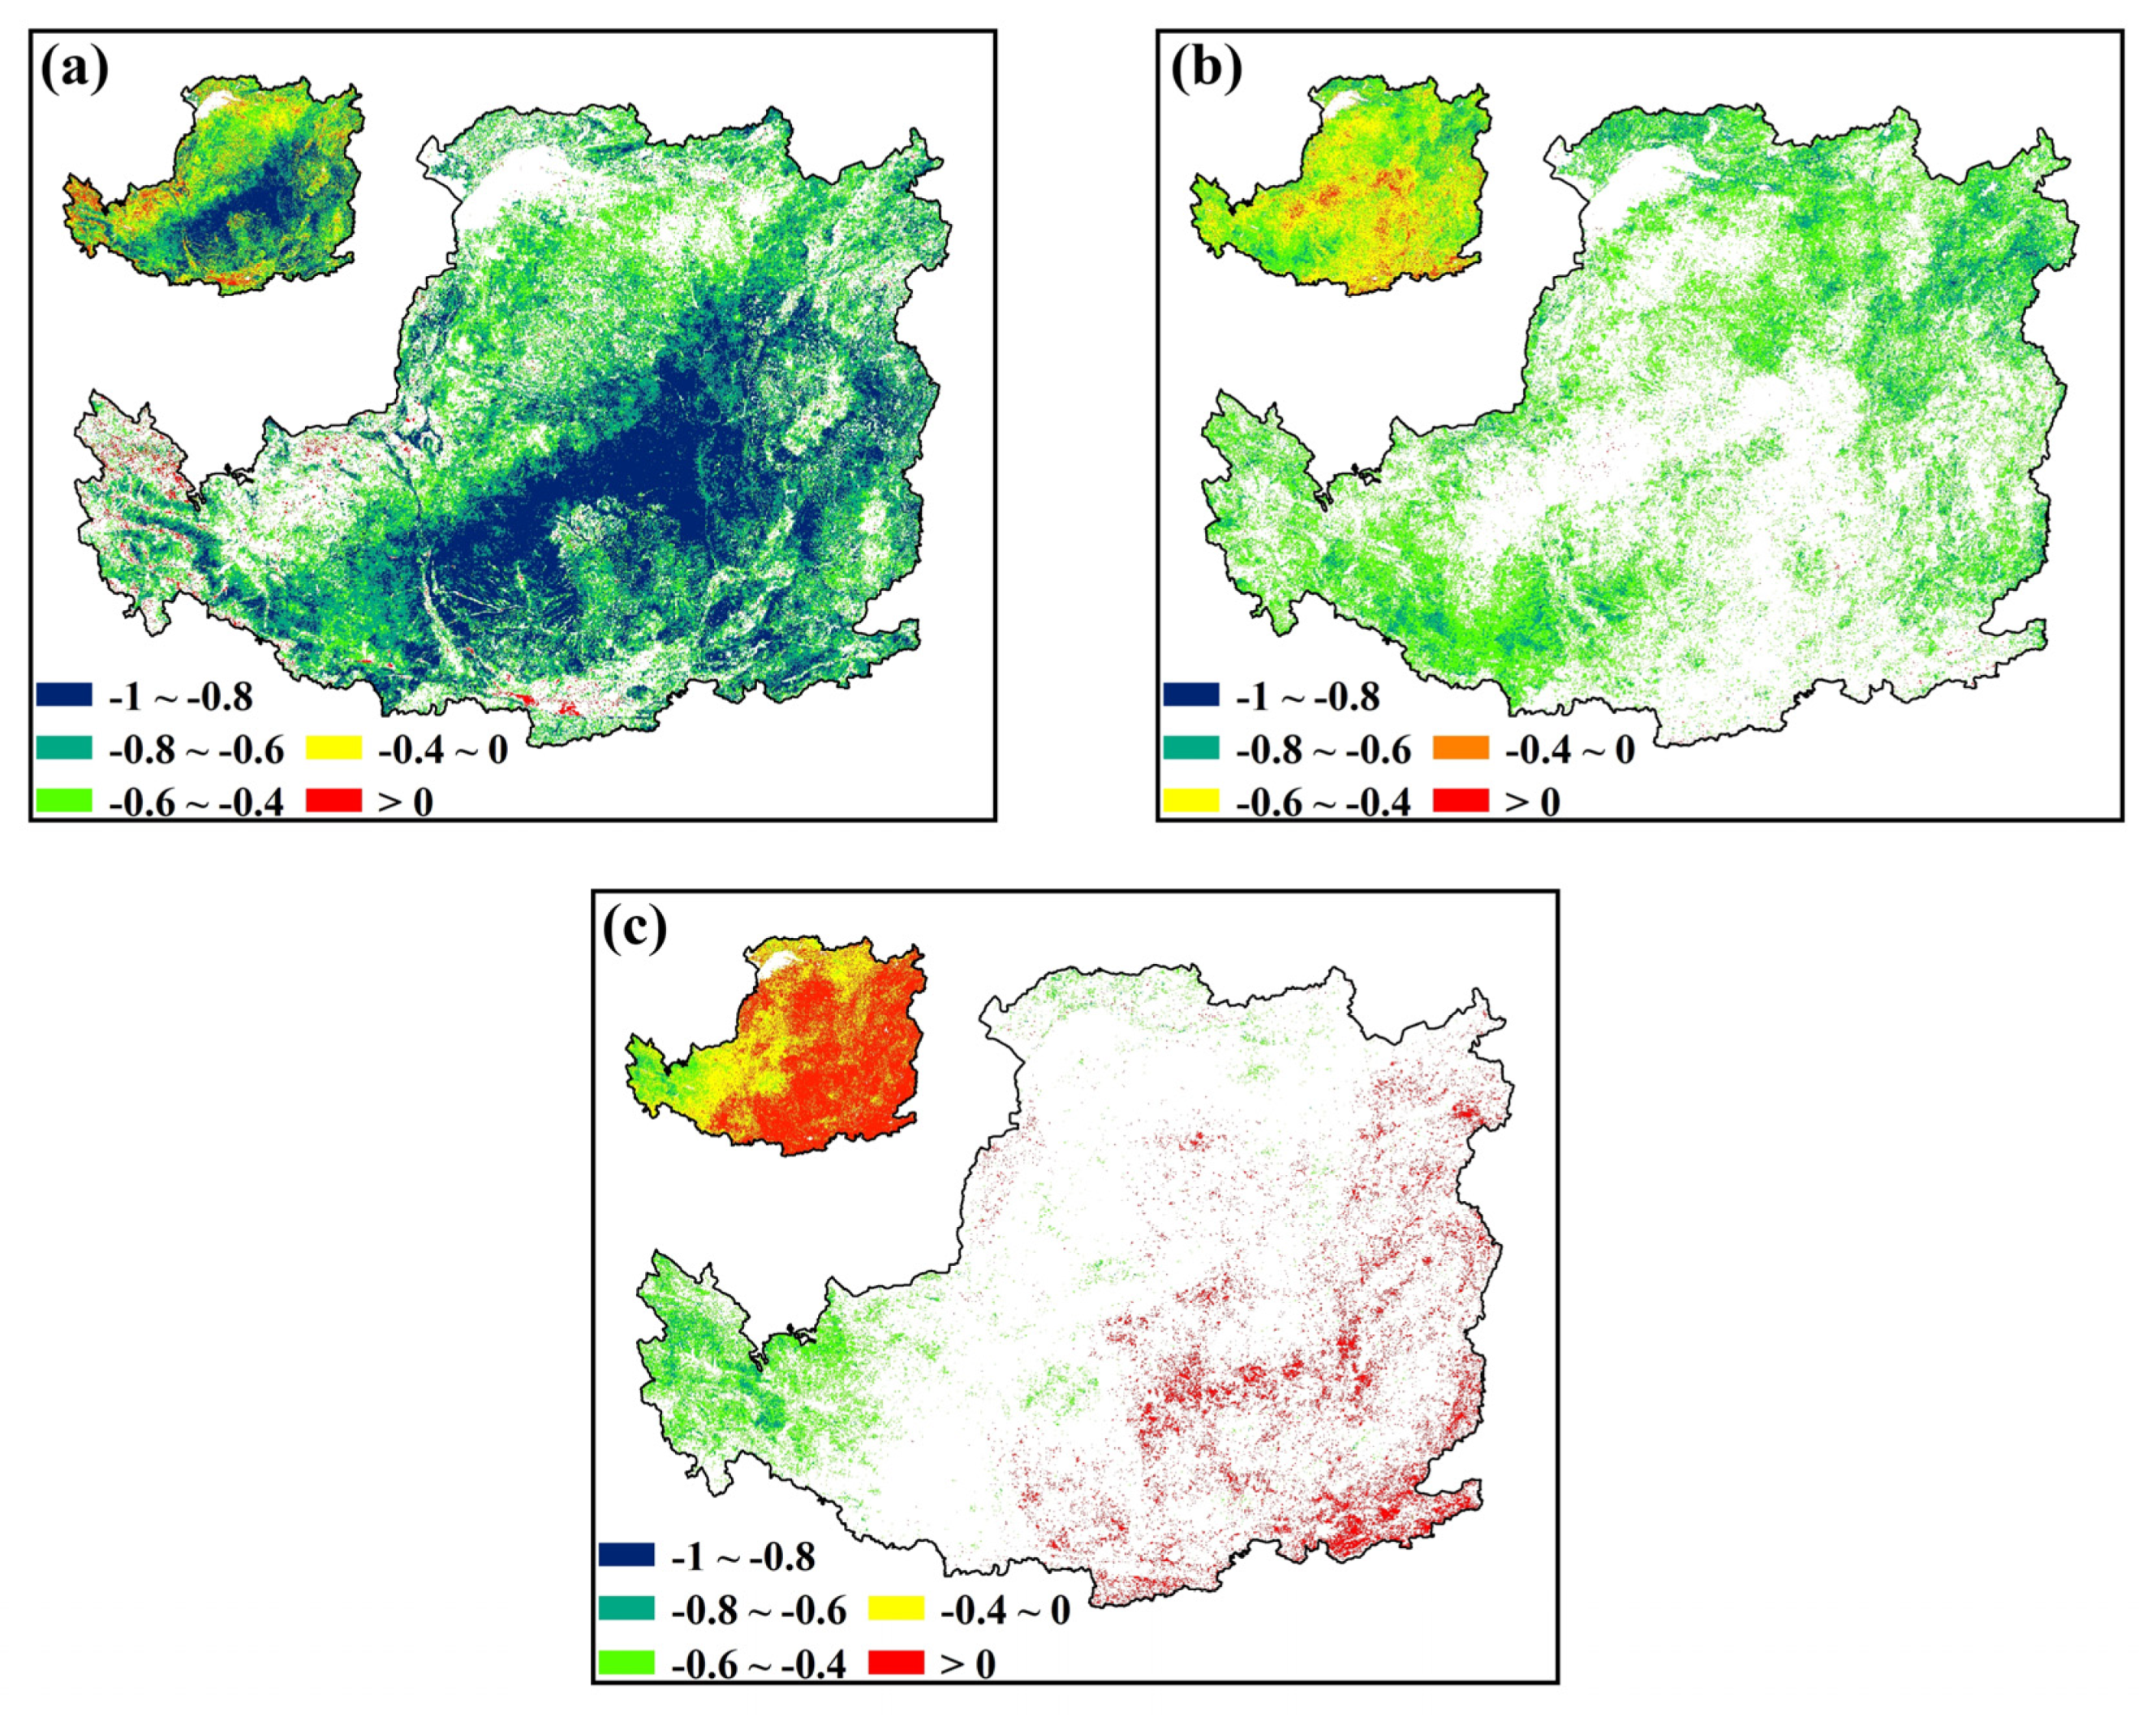
3.3. Identifying the Dependence of ESI on Climatic and Vegetative Factors

The spatial distributions of annual average temperature and precipitation during 2000–2015 are shown in Figure 5. The lowest temperature was observed in the northern and western LP (<8 °C), where the annual temperature increased at slopes greater than 0.01 °C, while the highest temperature was located on the southern edge of the LP (>12 °C), where the annual average temperature exhibited a decreasing trend (Figure 5b). The annual average precipitation on the LP was characterized by a clear zonal pattern, and the precipitation gradually increased from the northwestern to the southwestern LP (Figure 5c), with the lowest precipitation of less than 300 mm in the northwestern LP and the highest value of more than 600 mm in the southeastern LP. Trend analysis revealed that precipitation tended to increase in most regions of the LP (Figure 5d), and the highest magnitudes of trends were found in the central and southeastern LP with slopes greater than 6 mm/year.
To examine the dependence of the ESI on the potential driving factors, the partial correlation between the ESI and the LAI was plotted and is shown in Figure 6a, and the obtained coefficients were generally negative at the statistically significant level of 0.05, with the strongest correlations (coefficients ranging from −1 to −0.8) occurring for the central and southeastern LP; this result indicated that the evaporative stress decreased with increasing LAI in these regions. Similarly, the western and northeastern LP showed a negative partial correlation between the ESI and precipitation, with coefficients ranging from −0.8 to −0.6 (Figure 6b), meaning that the decreased ESI mainly relied on increases in precipitation in these regions. In contrast, a positive partial correlation was found between the ESI and temperature in the southeastern LP (Figure 6c), indicating that the evaporative stress decreased with the decreasing temperature in the southeastern LP. Obviously, the dependences of ESI in different regions varied among the driving factors. To clearly identify the potential drivers in different regions, the calculated relative dependences were plotted and are shown in Figure 7. Both multiple regression analysis (Figure 7a) and partial correlation analysis (Figure 7b) had consistent results. In most parts of the central and southeastern LP, there was a good relationship between the decreased ESI and LAI change; thus, the decreased evaporative stress was mainly driven by the increased LAI. Along the northwestern edge of the LP, the evaporative stress mainly depended on precipitation, and the increased precipitation was the main reason for the decreased evaporative stress. In the western LP, the precipitation, temperature and LAI were found to be the important factors influencing evaporative stress.

4. Discussion

4.1. Suitability of the ESI for Indicating the Status of Water Availability on the LP

As a multivariate phenomenon influenced by climatic and environmental factors, ET links the water-energy cycle between the land surface and atmosphere and plays a key role in water resource management. Thus, the ESI calculated from ET can reflect the status of water availability at the regional scale [44]. In this study, the ESI showed a decreasing trend from 2000 to 2015, indicating that the LP became wetter during this period. To validate this finding, the spatiotemporal patterns of drying or wetting indicated by the SPEI and AI, based on climatological records, are plotted in Figure 8. Overall, there was good spatial correspondence among the ESI, SPEI and AI at the annual scale (Figure 4a and Figure 8a,c). Moreover, the tendency toward wetting displayed by the ESI agreed well with that indicated by the SPEI and AI in most regions of the LP (Figure 4b and Figure 8b,d). On the northern and southern edges of the LP, there was no good agreement among the three indices. One explanation for why the SPEI and AI did not convey consistent information with the ESI is that the northern LP had higher magnitudes of increased temperature and relatively stable precipitation, which was beneficial for capturing drought information using the SPEI and AI [45]. Another possible reason was that the LAI of grass in the northern LP had a weak increase along with vegetation restoration, and the current climatic conditions may have enabled grass to continue to meet elevated evaporative demand with increased transpiration, consequently leading to a decreased ESI [46]. Some previous studies also reported that the ESI had reasonable spatial and temporal correlations with the SPI, SPEI and PDSI [44,47], while these three indices were calculated over a relatively long time scale and were, therefore, limited as indicators of short-term drought monitoring [48].
In terms of the wetting trend on the LP, a similar result was reported by Zhao et al. (2018), who investigated the spatiotemporal evolution of drought on the LP from 1998–2014 using multi-satellite precipitation data and found that the LP region has become wetter since the implementation of the Grain for Green Project [16]. However, Wu et al. (2018) evaluated drought characteristics on the LP and concluded that the LP experienced an increased tendency toward both meteorological and hydrological droughts over the period 1961–2013 [49]. The inconsistent results mentioned above are mainly due to different research periods. For example, Li et al. (2019) compared different climate change trends before and after 1999 on the LP and found a warming and drying trend during 1982–1999 and a wetting trend during 1999–2015 [50]. Some of previous studies indicate that the sea surface temperature (SST) anomalies in the western Pacific and Indian Ocean are the important driver of climate variability in the LP of China [51,52].

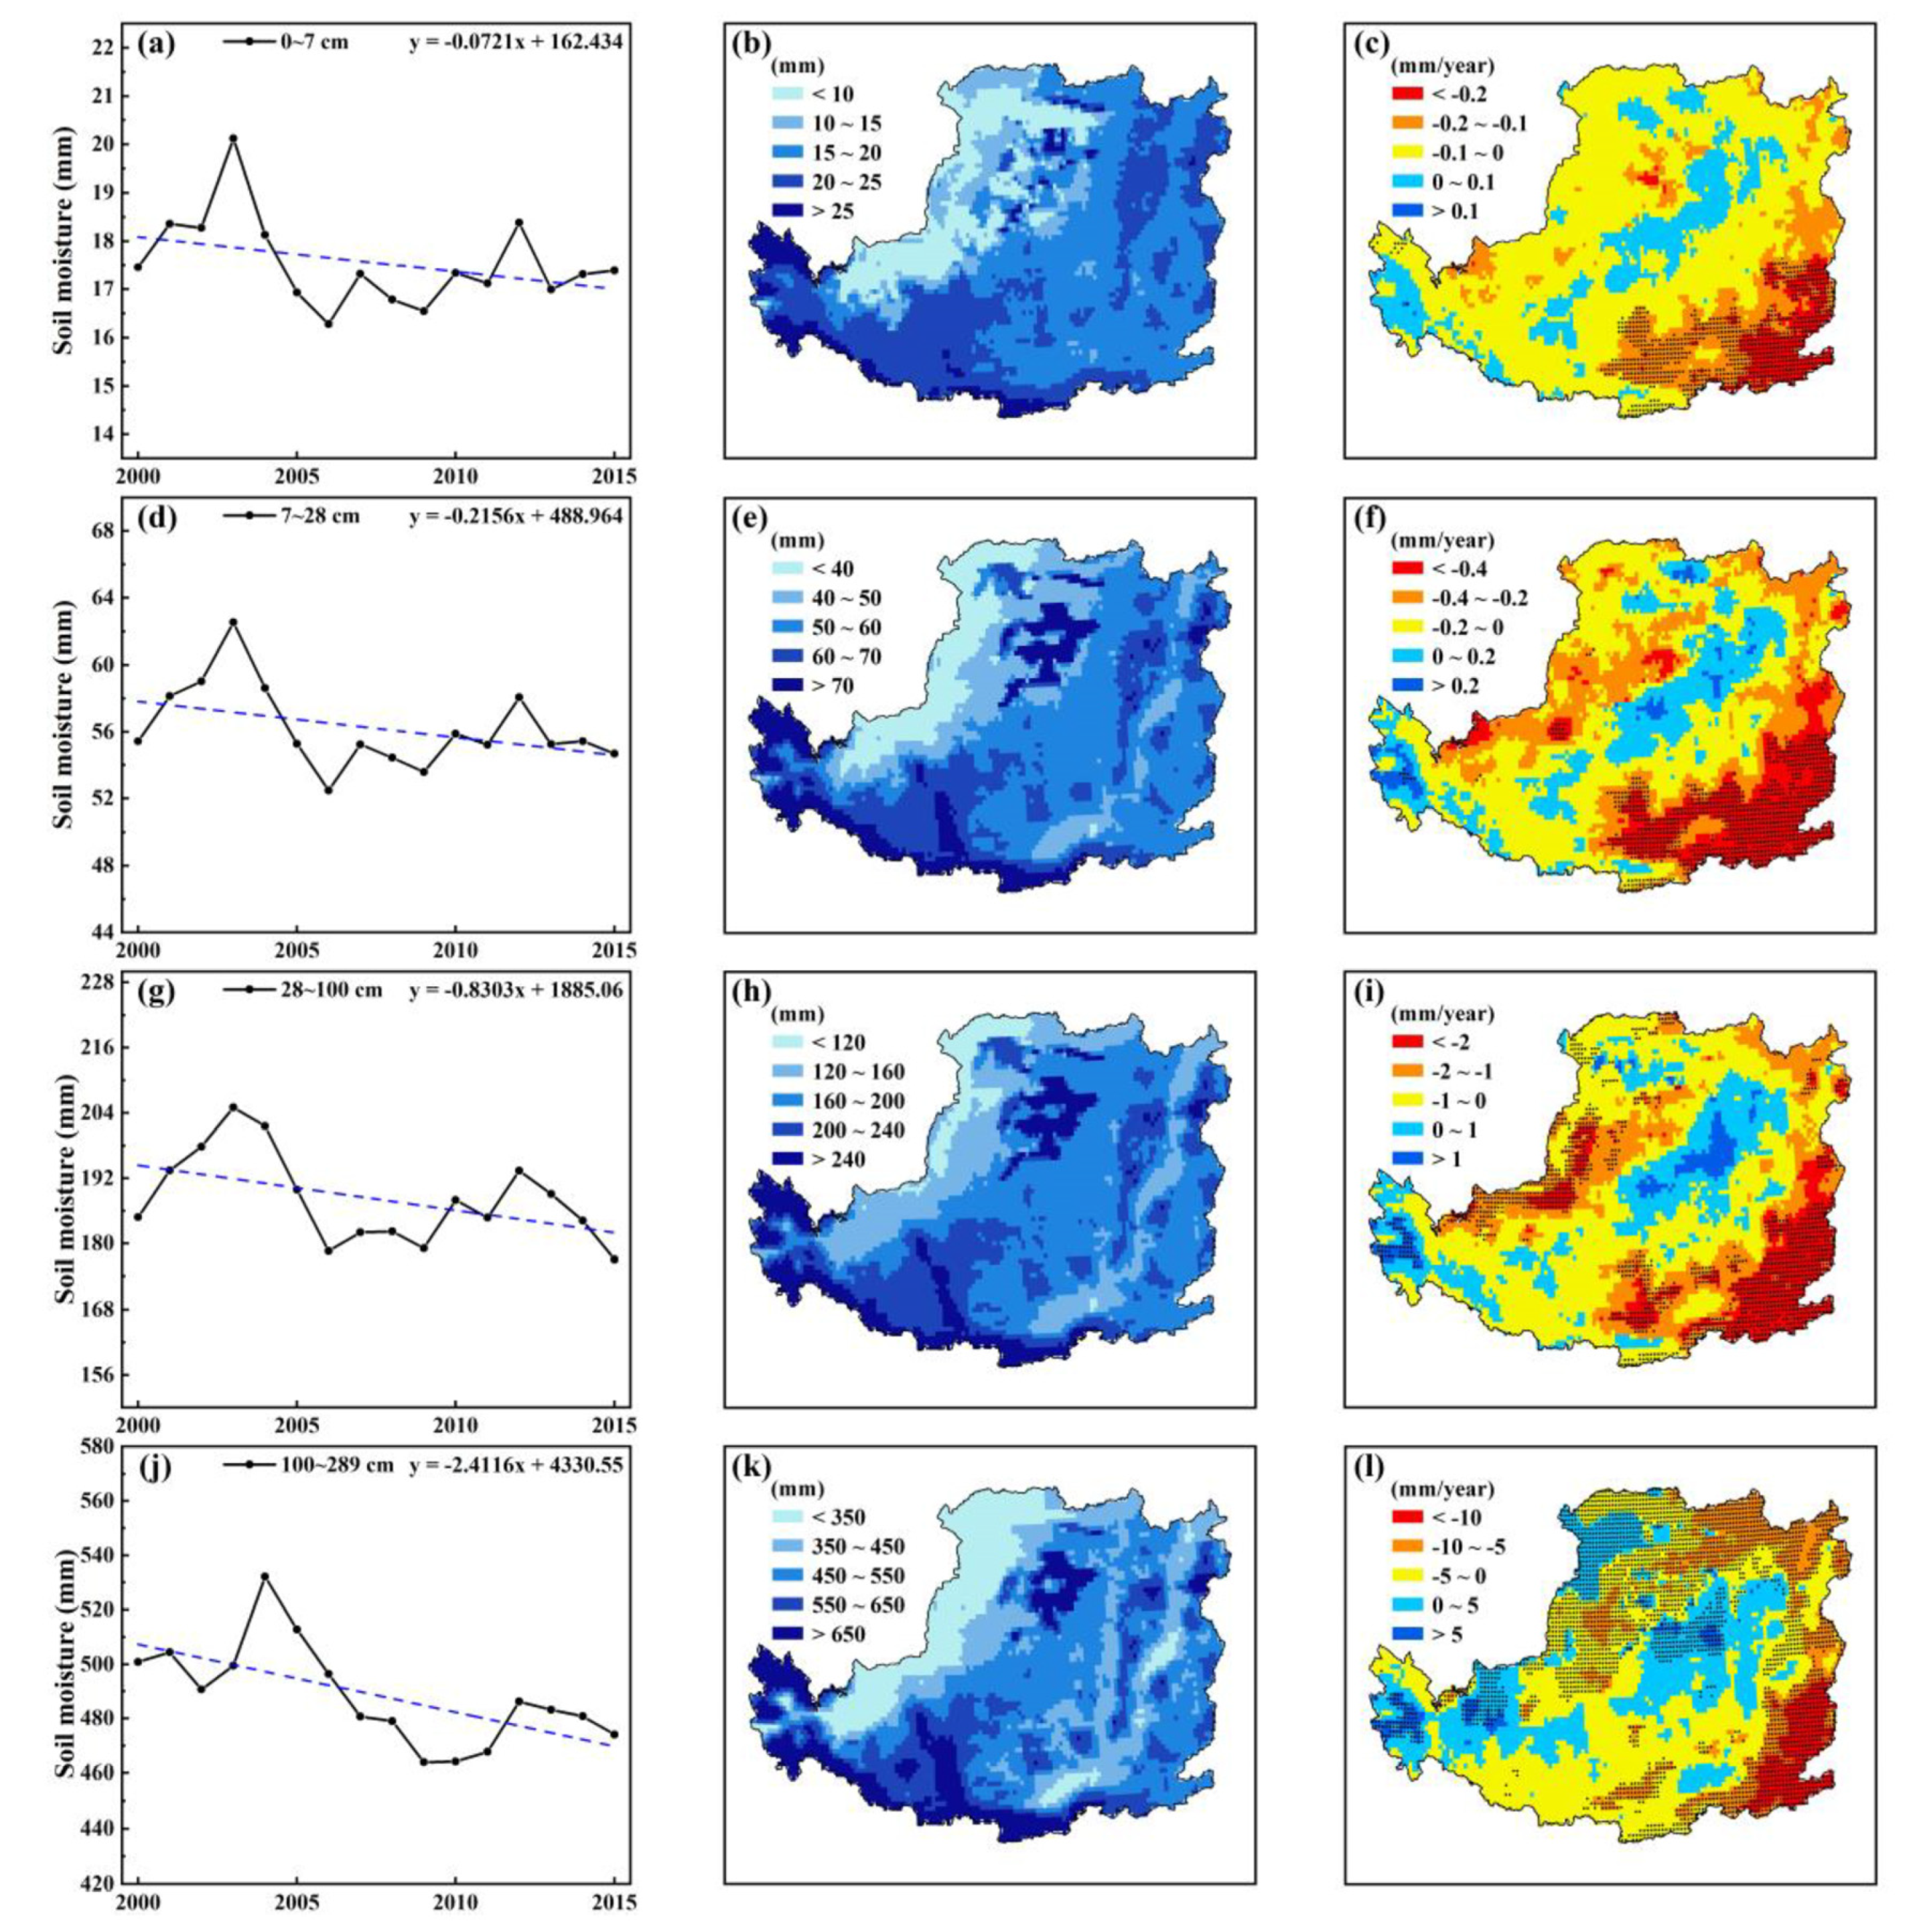
4.2. The Responses of Soil Water Availability to the Grain for Green Project

After the implementation of the Grain for Grain Project in 1999, the vegetation coverage in most of the LP increased significantly, and the water demand of vegetation inevitably increased. Fortunately, there was a warming and wetting trend on the LP, which could provide more water resources for vegetation growth and promote carbon sequestration [53]. According to the calculated ESI, we found that the current status of water availability could satisfy the evaporative demand of increased vegetation coverage because the ESI exhibited a decreasing trend on almost the whole LP. For arid and semiarid regions, water is the dominant factor affecting vegetation growth, and, therefore, these results raised the question of whether the increased water demand for ET could be replenished by a wetting climate. To answer this question, we analyzed the spatiotemporal change in the soil moisture in the 0–289-cm soil layers based on the ERA5-land dataset (Figure 9). The area-averaged annual soil moisture in the different soil layers showed a decreasing trend because the increased precipitation could not replace the additional water demand of ET caused by vegetation restoration. As a consequence, the restored vegetation might consume more soil moisture and likely trigger drought. However, it is notable that increased soil moisture was observed in the central and eastern LP, and the area with increased soil moisture enlarged with increasing soil depth (Figure 9c,f,I,l). In other words, increased vegetation coverage exerted a positive effect on local water resources in the central and eastern LP. A similar conclusion was reported by Wang et al. (2019), who used four normalized soil water indices to assess the drought intensity on the LP and found increased water storage in the eastern LP during 2001–2016 [54]. Mosaic vegetation, including grass, forests and shrubs, occupied a large proportion of the central and eastern LP, and had the function of water resources conservation [15].

4.3. The Sustainability and Prospect of the Grain for Green Project on the LP

The concrete measures of the Grain for Green Project are also an important aspect for planning and implementing revegetation activities. In our study, we found that the effects of vegetation cover on soil moisture conservation were evident in the central and eastern LP, where the regions are mainly covered by mosaic vegetation. Moreover, the precipitation in these regions tended to increase, providing more water for vegetation growth and ET enhancement. Notably, our result showed that the ET in the central and eastern LP had an increasing trend, which might exacerbate the water consumption. Consequently, it not only influenced water availability but also threatened ecosystem services and environmental health. The central part of the LP is the main region of the implementation of Grain for Green Project, and the main land cover type is mosaic vegetation, implying that the vegetation composition was an important determinant of water availability on the LP. Previous studies reported that the different vegetation types and vegetation compositions had different effects on the regional water availability. For example, Cheng et al. (2019) found that the natural shrub was the best vegetation type to conserve soil moisture and exerted a positive effect on soil moisture conversation on the LP [55]. Yan et al. (2021) analyzed the response of the soil moisture to the different vegetation types and found that the shrubs with moderate coverage had a higher soil moisture content and ground water recharge relative to other vegetation types [56]. Duan et al. (2016) suggested that the BOL (Bothriochloa ischaemum L) was the most suitable species on the steep slopes of the LP region by investigating the water balance change in the context of revegetation, because the region covered by BOL had the lowest runoff, which was beneficial to the vegetation growth [57]. Furthermore, Yang et al. (2014) highlighted that the high planting density was the main driving factor for the severe depletion of soil moisture on the LP [58]. Although we found mosaic vegetation was beneficial to water availability under the condition of increased precipitation, the hydrological effects of specific vegetation types remained unclear. Further study should explore the potential impacts of specific vegetation types on the water availability, especially under climate change conditions, to provide guidance for improving water availability on the LP.

5. Conclusions

This study explored the water availability on the LP during 2000–2015 using the ESI in the context of vegetation restoration coupled with climate change as well as the relative roles of biological and climatic factors in the ESI change. Along with the implementation of the Grain for Green Project, the evaporative stress decreased in most regions of the LP, largely attributable to the increases in the LAI and precipitation. In particular, the region occupied by mosaic vegetation had the largest decrease in the ESI, which mainly occurred in the central and eastern LP. However, our study did not illustrate how the vegetation species and structure influence the water resource dynamics, thus more attention needs to be paid to optimizing vegetation composition and function to explore a more sustainable approach for implementing ecological restoration in the LP. Combined with the soil moisture analysis, we found that the increased LAI and decreased ESI did not occur at the cost of consuming more soil moisture in the central and eastern LP, even though the area-averaged soil moisture had a decreasing trend, reflecting the positive effect of vegetation restoration on soil water conservation in these regions. These updated results from this study may have important implications, not only for understanding the hydrological effect of vegetation restoration under climate change, but also for guiding future ecological restoration strategies. However, for future studies, we encourage conducting sensitivity simulation experiments to assess the hydrological effects of different vegetation cover species, compositions and ages at the regional scale, seeking an optimum restoration plan.

Author Contributions

Conceptualization, L.Q. and Y.W.; formal analysis, L.Q., Y.C., Z.S., Q.X. and F.Z.; funding acquisition, L.Q. and Y.W.; methodology, L.Q. and Y.C.; validation, Y.C. and W.W.; visualization, Y.C., X.L. and W.L.; writing—original draft, L.Q.; writing—review and editing, Y.W. All authors have read and agreed to the published version of the manuscript.

Funding

This study was funded by the Natural Science Foundation in Shaanxi Province of China (2019JM-457), the National Natural Science Foundation of China (32071590, 31961143011), the Strategic Priority Research Program of Chinese Academy of Sciences (XDB40020205), Innovation Team of Shaanxi Province in China (2021TD-52), Shaanxi Major Theoretical and Practical Program (20ST-106) and the Fundamental Research Funds for the Central Universities (xzy012019011).

Institutional Review Board Statement

Not applicable.

Informed Consent Statement

Not applicable.

Data Availability Statement

The data presented in this study are available on request from the corresponding author for research purposes.

Acknowledgments

We thank the HPCC Platform at Xi’an Jiaotong University for the computing equipment and computer maintenance.

Conflicts of Interest

The authors declare no conflict of interest.

Appendix A

Figure A1. Overview of the methods used in this study.
Remotesensing 13 03302 g0a1

References

  1. Qiu, L.; Wu, Y.; Yu, M.; Shi, Z.; Yin, X.; Song, Y.; Sun, K. Contributions of vegetation restoration and climate change to spatiotemporal variation in the energy budget in the Loess Plateau of China. Ecol. Indic. 2021, 127, 107780. [Google Scholar] [CrossRef]
  2. Bagley, J.E.; Kueppers, L.M.; Billesbach, D.P.; Williams, I.N.; Biraud, S.C.; Torn, M.S. The influence of land cover on surface energy partitioning and evaporative fraction regimes in the U.S. Southern Great Plains. J. Geophys. Res. Atmos. 2017, 122, 5793–5807. [Google Scholar] [CrossRef] [Green Version]
  3. Zhu, Y.; Luo, P.; Zhang, S.; Sun, B. Spatiotemporal analysis of hydrological variations and their impacts on vegetation in semiarid areas from multiple satellite data. Remote Sens. 2020, 12, 4177. [Google Scholar] [CrossRef]
  4. Lawley, V.; Lewis, M.; Clarke, K.; Ostendorf, B. Site-based and remote sensing methods for monitoring indicators of vegetation condition: An Australian review. Ecol. Indic. 2016, 60, 1273–1283. [Google Scholar] [CrossRef] [Green Version]
  5. Lal, R. Restoring soil quality to mitigate soil degradation. Sustainability 2015, 7, 5875–5895. [Google Scholar] [CrossRef] [Green Version]
  6. Xie, X.; He, B.; Guo, L.; Miao, C.; Zhang, Y. Detecting hotspots of interactions between vegetation greenness and terrestrial water storage using satellite observations. Remote Sens. Environ. 2019, 231, 111259. [Google Scholar] [CrossRef]
  7. Liu, S.; Huang, S.; Xie, Y.; Wang, H.; Huang, Q.; Leng, G.; Li, P.; Wang, L. Spatial-temporal changes in vegetation cover in a typical semi-humid and semi-arid region in China: Changing patterns, causes and implications. Ecol. Indic. 2018, 98, 462–475. [Google Scholar] [CrossRef]
  8. Mozny, M.; Trnka, M.; Zalud, Z.; Hlavinka, P.; Nekovar, J.; Potop, V.; Virag, M. Use of a soil moisture network for drought monitoring in the Czech Republic. Theor. Appl. Clim. 2011, 107, 99–111. [Google Scholar] [CrossRef]
  9. Robinson, N.; Harper, R.J.; Smettem, K.R.J. Soil water depletion by Eucalyptus spp. integrated into dryland agricultural systems. Plant Soil 2006, 286, 141–151. [Google Scholar] [CrossRef]
  10. Wang, Y.; Shao, M.; Liu, Z. Vertical distribution and influencing factors of soil water content within 21-m profile on the Chinese Loess Plateau. Geoderma 2013, 193–194, 300–310. [Google Scholar] [CrossRef]
  11. Feng, X.; Fu, B.; Piao, S.; Wang, S.; Ciais, P.; Zeng, Z.; Lü, X.F.B.F.S.W.Y.; Zeng, Y.; Li, Y.; Jiang, X.; et al. Revegetation in China’s Loess Plateau is approaching sustainable water resource limits. Nat. Clim. Chang. 2016, 6, 1019–1022. [Google Scholar] [CrossRef]
  12. Chen, Y.; Wang, K.; Lin, Y.; Shi, W.; Song, Y.; He, X. Balancing green and grain trade. Nat. Geosci. 2015, 8, 739–741. [Google Scholar] [CrossRef]
  13. Fu, B.; Wang, S.; Liu, Y.; Liu, J.; Liang, W.; Miao, C. Hydrogeomorphic ecosystem responses to natural and anthropogenic changes in the Loess plateau of China. Annu. Rev. Earth Planet. Sci. 2017, 45, 223–243. [Google Scholar] [CrossRef]
  14. Wei, X.; Wang, N.; Luo, P.; Yang, J.; Zhang, J.; Lin, K. Spatiotemporal assessment of land marketization and its driving forces for sustainable urban-rural development in Shaanxi province in China. Sustainability 2021, 13, 7755. [Google Scholar] [CrossRef]
  15. Jiang, C.; Zhang, H.; Wang, X.; Feng, Y.; Labzovskii, L. Challenging the land degradation in China’s Loess Plateau: Benefits, limitations, sustainability, and adaptive strategies of soil and water conservation. Ecol. Eng. 2018, 127, 135–150. [Google Scholar] [CrossRef]
  16. Zhao, Q.; Chen, Q.; Jiao, M.; Wu, P.; Gao, X.; Ma, M.; Hong, Y. The temporal-spatial characteristics of drought in the loess plateau using the remote-sensed TRMM precipitation data from 1998 to 2014. Remote Sens. 2018, 10, 838. [Google Scholar] [CrossRef] [Green Version]
  17. Wang, Q.-X.; Wang, M.-B.; Fan, X.-H.; Zhang, F.; Zhu, S.-Z.; Zhao, T.-L. Trends of temperature and precipitation extremes in the Loess Plateau Region of China, 1961–2010. Theor. Appl. Clim. 2016, 129, 949–963. [Google Scholar] [CrossRef]
  18. Qiu, L.; Wu, Y.; Wang, L.; Lei, X.; Liao, W.; Hui, Y.; Meng, X. Spatiotemporal response of the water cycle to land use conversions in a typical hilly–gully basin on the Loess Plateau, China. Hydrol. Earth Syst. Sci. 2017, 21, 6485–6499. [Google Scholar] [CrossRef] [Green Version]
  19. Miao, C.; Ni, J.; Borthwick, A.G.L. Recent changes of water discharge and sediment load in the Yellow River basin, China. Prog. Phys. Geogr. Earth Environ. 2010, 34, 541–561. [Google Scholar] [CrossRef] [Green Version]
  20. Wang, S.; Fu, B.; Piao, S.; Lü, Y.; Ciais, P.; Feng, X.; Wang, Y. Reduced sediment transport in the Yellow River due to anthropogenic changes. Nat. Geosci. 2015, 9, 38–41. [Google Scholar] [CrossRef]
  21. Deng, L.; Yan, W.; Zhang, Y.; Shangguan, Z. Severe depletion of soil moisture following land-use changes for ecological restoration: Evidence from northern China. For. Ecol. Manag. 2016, 366, 1–10. [Google Scholar] [CrossRef]
  22. Qiu, L.; Wu, Y.; Shi, Z.; Yu, M.; Zhao, F.; Guan, Y. Quantifying spatiotemporal variations in soil moisture driven by vegetation restoration on the Loess Plateau of China. J. Hydrol. 2021, 600, 126580. [Google Scholar] [CrossRef]
  23. Li, T.; Xia, J.; Zhang, L.; She, D.; Wang, G.; Cheng, L. An improved complementary relationship for estimating evapotranspiration attributed to climate change and revegetation in the Loess Plateau, China. J. Hydrol. 2020, 592, 125516. [Google Scholar] [CrossRef]
  24. Shao, R.; Zhang, B.; Su, T.; Long, B.; Cheng, L.; Xue, Y.; Yang, W. Estimating the increase in regional evaporative water consumption as a result of vegetation restoration over the Loess Plateau, China. J. Geophys. Res. Atmos. 2019, 124, 11783–11802. [Google Scholar] [CrossRef]
  25. Qiu, L.; Wu, Y.; Shi, Z.; Chen, Y.; Zhao, F. Quantifying the responses of evapotranspiration and its components to vegetation restoration and climate change on the Loess plateau of China. Remote Sens. 2021, 13, 2358. [Google Scholar] [CrossRef]
  26. McKee, T.B.; Doesken, N.J.; Kleist, J. The relationship of drought frequency and duration to time scales. In Proceedings of the Proceedings of the 8th Conference on Applied Climatology, Anaheim, CA, USA, 17–22 January 1993; pp. 179–183. [Google Scholar]
  27. Palmer, W.C. Meteorological Drought; US Department of Commerce, Weather Bureau: Washington, DC, USA, 1965; Volume 30. [Google Scholar]
  28. Shenbin, C.; Yunfeng, L.; Thomas, A. Climatic change on the Tibetan Plateau: Potential Evapotranspiration Trends from 1961–2000. Clim. Chang. 2006, 76, 291–319. [Google Scholar] [CrossRef]
  29. Narasimhan, B.; Srinivasan, R. Development and evaluation of Soil Moisture Deficit Index (SMDI) and Evapotranspiration Deficit Index (ETDI) for agricultural drought monitoring. Agric. For. Meteorol. 2005, 133, 69–88. [Google Scholar] [CrossRef]
  30. Schindler, D.W.; Donahue, W.F. An impending water crisis in Canada’s western prairie provinces. Proc. Natl. Acad. Sci. USA 2006, 103, 7210–7216. [Google Scholar] [CrossRef] [Green Version]
  31. Vicente-Serrano, S.M.; Beguería, S.; Lopez-Moreno, I. A multiscalar drought index sensitive to global warming: The standardized precipitation evapotranspiration index. J. Clim. 2010, 23, 1696–1718. [Google Scholar] [CrossRef] [Green Version]
  32. Anderson, M.C.; Norman, J.M.; Mecikalski, J.R.; Otkin, J.; Kustas, W.P. A climatological study of evapotranspiration and moisture stress across the continental United States based on thermal remote sensing: 2. Surface moisture climatology. J. Geophys. Res. Space Phys. 2007, 112. [Google Scholar] [CrossRef]
  33. Anderson, M.; Hain, C.; Jurecka, F.; Trnka, M.; Hlavinka, P.; Dulaney, W.; Otkin, J.; Johnson, D.; Gao, F. Relationships between the evaporative stress index and winter wheat and spring barley yield anomalies in the Czech Republic. Clim. Res. 2016, 70, 215–230. [Google Scholar] [CrossRef] [Green Version]
  34. Yue, P.; Zhang, Q.; Li, H.; Yang, Y.; Zeng, J.; Wang, S. Long-term variations in energy partitioning and evapotranspiration in a semiarid grassland in the Loess Plateau of China. Agric. For. Meteorol. 2019, 278. [Google Scholar] [CrossRef]
  35. Xiao, Z.; Liang, S.; Wang, J.; Xiang, Y.; Zhao, X.; Song, J. Long-time-series global land surface satellite leaf area index product derived from MODIS and AVHRR surface reflectance. IEEE Trans. Geosci. Remote Sens. 2016, 54, 5301–5318. [Google Scholar] [CrossRef]
  36. Peng, S.; Ding, Y.; Liu, W.; Li, Z. 1 km monthly temperature and precipitation dataset for China from 1901 to 2017. Earth Syst. Sci. Data 2019, 11, 1931–1946. [Google Scholar] [CrossRef] [Green Version]
  37. Running, S.; Mu, Q.; Zhao, M. Mod16a2 Modis/Terra net Evapotranspiration 8-Day l4 Global 500m sin Grid v006; NASA EOSDIS Land Processes DAAC; NASA: Washington, DC, USA, 2017. [Google Scholar] [CrossRef]
  38. Muñoz-Sabater, J.; Dutra, E.; Agustí-Panareda, A.; Albergel, C.; Arduini, G.; Balsamo, G.; Boussetta, S.; Choulga, M.; Harrigan, S.; Hersbach, H. ERA5-Land: A state-of-the-art global reanalysis dataset for land applications. Earth Syst. Sci. Data Discuss. 2021, 1–50. [Google Scholar] [CrossRef]
  39. Zhang, Z.; Huang, M.; Yang, Y.; Zhao, X. Evaluating drought-induced mortality risk for Robinia pseudoacacia plantations along the precipitation gradient on the Chinese Loess Plateau. Agric. For. Meteorol. 2020, 284, 107897. [Google Scholar] [CrossRef]
  40. Mann, H.B. Nonparametric tests against trend. Econom. J. Econ. Soc. 1945, 13, 245–259. [Google Scholar] [CrossRef]
  41. Kendall, M.G. Rank Correlation Methods, 4th ed.; Griffin: London, UK, 1948. [Google Scholar]
  42. Sen, P.K. Estimates of the regression coefficient based on Kendall’s tau. J. Am. Stat. Assoc. 1968, 63, 1379–1389. [Google Scholar] [CrossRef]
  43. Peng, X.; Wu, W.; Zheng, Y.; Sun, J.; Hu, T.; Wang, P. Correlation analysis of land surface temperature and topographic elements in Hangzhou, China. Sci. Rep. 2020, 10, 10451. [Google Scholar] [CrossRef]
  44. Anderson, M.C.; Hain, C.R.; Wardlow, B.; Pimstein, A.; Mecikalski, J.R.; Kustas, W.P. Evaluation of drought indices based on thermal remote sensing of evapotranspiration over the Continental United States. J. Clim. 2011, 24, 2025–2044. [Google Scholar] [CrossRef]
  45. Yang, T.; Ding, J.; Liu, D.; Wang, X.; Wang, T. Combined use of multiple drought indices for global assessment of dry gets drier and wet gets wetter paradigm. J. Clim. 2019, 32, 737–748. [Google Scholar] [CrossRef]
  46. Cooley, S.S.; Williams, C.A.; Fisher, J.B.; Halverson, G.H.; Perret, J.; Lee, C.M. Assessing regional drought impacts on vegetation and evapotranspiration: A case study in Guanacaste, Costa Rica. Ecol. Appl. 2019, 29, e01834. [Google Scholar] [CrossRef] [PubMed]
  47. Wu, R.; Liu, Y.; Xing, X. Evaluation of evapotranspiration deficit index for agricultural drought monitoring in North China. J. Hydrol. 2021, 596, 126057. [Google Scholar] [CrossRef]
  48. Guttman, N.B. Comparing the palmer drought index and the standardized precipitation index. JAWRA J. Am. Water Resour. Assoc. 1998, 34, 113–121. [Google Scholar] [CrossRef]
  49. Wu, J.; Miao, C.; Zheng, H.; Duan, Q.; Lei, X.; Li, H. Meteorological and hydrological drought on the Loess plateau, China: Evolutionary characteristics, impact, and propagation. J. Geophys. Res. Atmos. 2018, 123, 11569–11584. [Google Scholar] [CrossRef]
  50. Li, G.; Sun, S.; Han, J.; Yan, J.; Liu, W.; Wei, Y.; Lu, N.; Sun, Y. Impacts of Chinese Grain for Green program and climate change on vegetation in the Loess Plateau during 1982–2015. Sci. Total Environ. 2019, 660, 177–187. [Google Scholar] [CrossRef] [PubMed]
  51. Peng, Z.; Wang, Q.; Bennett, J.; Pokhrel, P.; Wang, Z. Seasonal precipitation forecasts over China using monthly large-scale oceanic-atmospheric indices. J. Hydrol. 2014, 519, 792–802. [Google Scholar] [CrossRef]
  52. Feng, S.; Hu, Q. Variations in the teleconnection of ENSO and summer rainfall in Northern China: A role of the Indian summer monsoon. J. Clim. 2004, 17, 4871–4881. [Google Scholar] [CrossRef]
  53. Jiang, C.; Zhang, H.; Zhang, Z. Spatially explicit assessment of ecosystem services in China’s Loess Plateau: Patterns, interactions, drivers, and implications. Glob. Planet. Chang. 2018, 161, 41–52. [Google Scholar] [CrossRef]
  54. Wang, Y.; Magliulo, V.; Yan, W.; Shangguan, Z. Assessing land surface drying and wetting trends with a normalized soil water index on the Loess Plateau in 2001–2016. Sci. Total Environ. 2019, 676, 120–130. [Google Scholar] [CrossRef] [PubMed]
  55. Cheng, R.-R.; Chen, Q.-W.; Zhang, J.-G.; Shi, W.-Y.; Li, G.; Du, S. Soil moisture variations in response to precipitation in different vegetation types: A multi-year study in the loess hilly region in China. Ecohydrology 2020, 13, e2196. [Google Scholar] [CrossRef]
  56. Yan, W.; Zhou, Q.; Peng, D.; Wei, X.; Tang, X.; Yuan, E.; Wang, Y.; Shi, C. Soil moisture responses under different vegetation types to winter rainfall events in a humid karst region. Environ. Sci. Pollut. Res. 2021, 1–12. [Google Scholar] [CrossRef]
  57. Duan, L.; Huang, M.; Zhang, L. Differences in hydrological responses for different vegetation types on a steep slope on the Loess Plateau, China. J. Hydrol. 2016, 537, 356–366. [Google Scholar] [CrossRef]
  58. Yang, L.; Wei, W.; Chen, L.; Chen, W.; Wang, J. Response of temporal variation of soil moisture to vegetation restoration in semi-arid Loess Plateau, China. CATENA 2014, 115, 123–133. [Google Scholar] [CrossRef]
Figure 1. The geographical location of the LP and the spatial distribution of land cover types on the LP.
Remotesensing 13 03302 g001
Figure 2. Spatiotemporal change in the LAI on the LP during 2000–2015: (a) the spatial distribution of the mean annual LAI; (b) the annual average LAI for different land cover types; (c) the spatial features of the annual trend of the LAI at the statistically significant level of 0.05; and (d) the area percentage of different land cover types with a significant increasing trend (p < 0.05).
Remotesensing 13 03302 g002
Figure 3. (a) The spatial distribution of the mean annual ET on the LP during 2000–2015; (b) the spatial features of the annual trend of ET with a statistically significant level of 0.05; (c) the spatial distribution of the partial correlation coefficients between ET and LAI eliminating the influences of precipitation and temperature, with a statistically significant level of 0.05; and (d) the area percentage of the region exhibiting an upward trend of ET and partial correlation coefficients greater than 0.6 between the LAI and ET, with a statistically significant level of 0.05.
Remotesensing 13 03302 g003
Figure 4. The spatial distribution of the mean annual ESI on the LP during 2000–2015 (a) and its slope trends (b).
Remotesensing 13 03302 g004
Figure 5. The spatial distributions of the annual mean temperature (a) and precipitation (c), and the slopes of the trends of temperature (b) and precipitation (d).
Remotesensing 13 03302 g005
Figure 6. (a) The spatial distribution of the partial correlation coefficients between the ESI and LAI, eliminating the influences of precipitation and temperature; (b) the spatial distribution of the partial correlation coefficients between the ESI and precipitation, eliminating the influences of LAI and temperature; (c) the spatial distribution of the partial correlation coefficients between the ESI and temperature, eliminating the influences of LAI and precipitation. The small insets in all plots show the spatial distribution of the partial correlation coefficients, while the large insets show only the partial correlation coefficients with a statistically significant level of 0.05.
Remotesensing 13 03302 g006
Figure 7. Calculated relative dependence of the ESI on precipitation, temperature and the LAI based on (a) multiple regression analysis and (b) partial correlation analysis.
Remotesensing 13 03302 g007
Figure 8. Spatiotemporal change in the SPEI and AI on the LP during 2000–2015: (a,c) show the spatial distribution of the annual mean SPEI and AI, respectively; (b,d) show the slope of the trends for the SPEI and AI, respectively.
Remotesensing 13 03302 g008
Figure 9. Spatiotemporal features of soil moisture on the LP during the period of 2000–2015. The left column shows the spatial pattern of linear trends (mm/year) in the 0–7-cm (a), 7–100-cm (d), 100–289-cm (g) and 0–289-cm (j) soil layers. The middle column shows the annual mean soil moisture for the 0–7-cm (b), 7–100-cm (e), 100–289-cm (h) and 0–289-cm (k) soil layers, and the areas with a significant change (p < 0.05) based on t-test are stippled. The right column shows the area-averaged annual soil moisture and its linear trends (mm/year) in the 0–7-cm (c), 7–100-cm (f), 100–289-cm (i) and 0–289-cm (l) soil layers.
Remotesensing 13 03302 g009
Table 1. Land cover reclassification in this study based on ESA-CCI classification.
Land Cover Types Used in This StudyCode in ESA-CCIESA-CCI Classification
Crop10, 11, 12Cropland, rainfed
20Cropland, irrigated or post-flooding
Forest50Tree cover, broadleaved, evergreen, closed to open (>15%)
60, 61Tree cover, broadleaved, deciduous, closed to open (>15%)
70Tree cover, needle-leaved, evergreen, closed to open (>15%)
170Tree cover, flooded, saline water
Grass130Grassland
Shrub100Mosaic tree and shrub (>50%)/herbaceous cover (<50%)
110Mosaic herbaceous cover (>50%)/tree and shrub (<50%)
120, 122Shrubland
150Sparse vegetation (tree, shrub, herbaceous cover) (<15%)
180Shrub or herbaceous cover, flooded, fresh/saline/brackish water
Mosaic vegetation30Mosaic cropland (>50%)/natural vegetation (tree, shrub, herbaceous cover) (<50%)
40Mosaic cropland (<50%)/natural vegetation (tree, shrub, herbaceous cover) (>50%)
Non-vegetated190Urban areas
200, 201, 202Bare areas
210Water bodies
220Permanent snow and ice
Table 2. The area percentage change of the main land cover types on the LP from 2000 to 2015.
YearLand Cover Types
CropForestGrassShrubMosaic VegetationNon-Vegetated
200025.32%10.58%39.84%2.75%18.61%2.90%
200525.17%10.88%40.86%2.24%17.90%2.95%
201025.03%10.93%41.04%2.18%17.65%3.17%
201524.80%10.94%41.12%2.17%17.54%3.43%
Publisher’s Note: MDPI stays neutral with regard to jurisdictional claims in published maps and institutional affiliations.

