1. Introduction
During the last few years, the protection, enhancement and promotion of cultural heritage (CH) has become a strategic priority for Italy, a country which counts as one of the richest archaeological and architectural assets in the world. At the same time, this asset is often problematic and difficult to manage so that Italian cultural sites are often in a situation of inaccessibility or abandoned to neglect and looting. In this challenge, made more difficult by poor investment (according to EU statistics Italy is second-last in Europe for public funding of culture) [
1], the impulses given by digitization can represent valid elements of acceleration. Moreover, digital surveys have also been recognized as essential for the investigation, diagnostics and monitoring of cultural sites and monuments as they can support ordinary conservation, preventing risks of damages and avoiding expensive emergency interventions [
2,
3,
4]; its role in the preservation of the memory of artifacts, in case of destructive events, is well known [
5].
Nowadays, the use of portable and performing devices, and their combination with IT (information technologies), computer vision algorithms, 3d modeling, GIS/BIM (Geographic Information System/Building Information Modeling) platforms and immersive reality systems (virtual tour, augmented reality, etc.) allow the fast recreation of effective digital copies of existing analogue artifacts or archaeological sites [
6]. These virtual replicas are the result of monitored and checked workflows, performed with scientific rigor from data acquisition up to the publication of final deliverables; for this reason, they have become more and more reliable in terms of metric accuracy (sub-centimeter for terrestrial laser scanner models is possible) and suitable for a wide range of use, from study to dissemination. The systematic application of these methods has led, in the last few years, to the creation of a new ‘digital heritage’, defined by UNESCO as the whole of “computer-based materials of enduring value that should be kept for future generations” [
7]; it consists of cultural and educational resources “born-digital” or converted from existing analogue resources, distributed and accessed in digital form. Digital heritage, according to the UNESCO’s Charter for the Preservation of Digital Heritage [
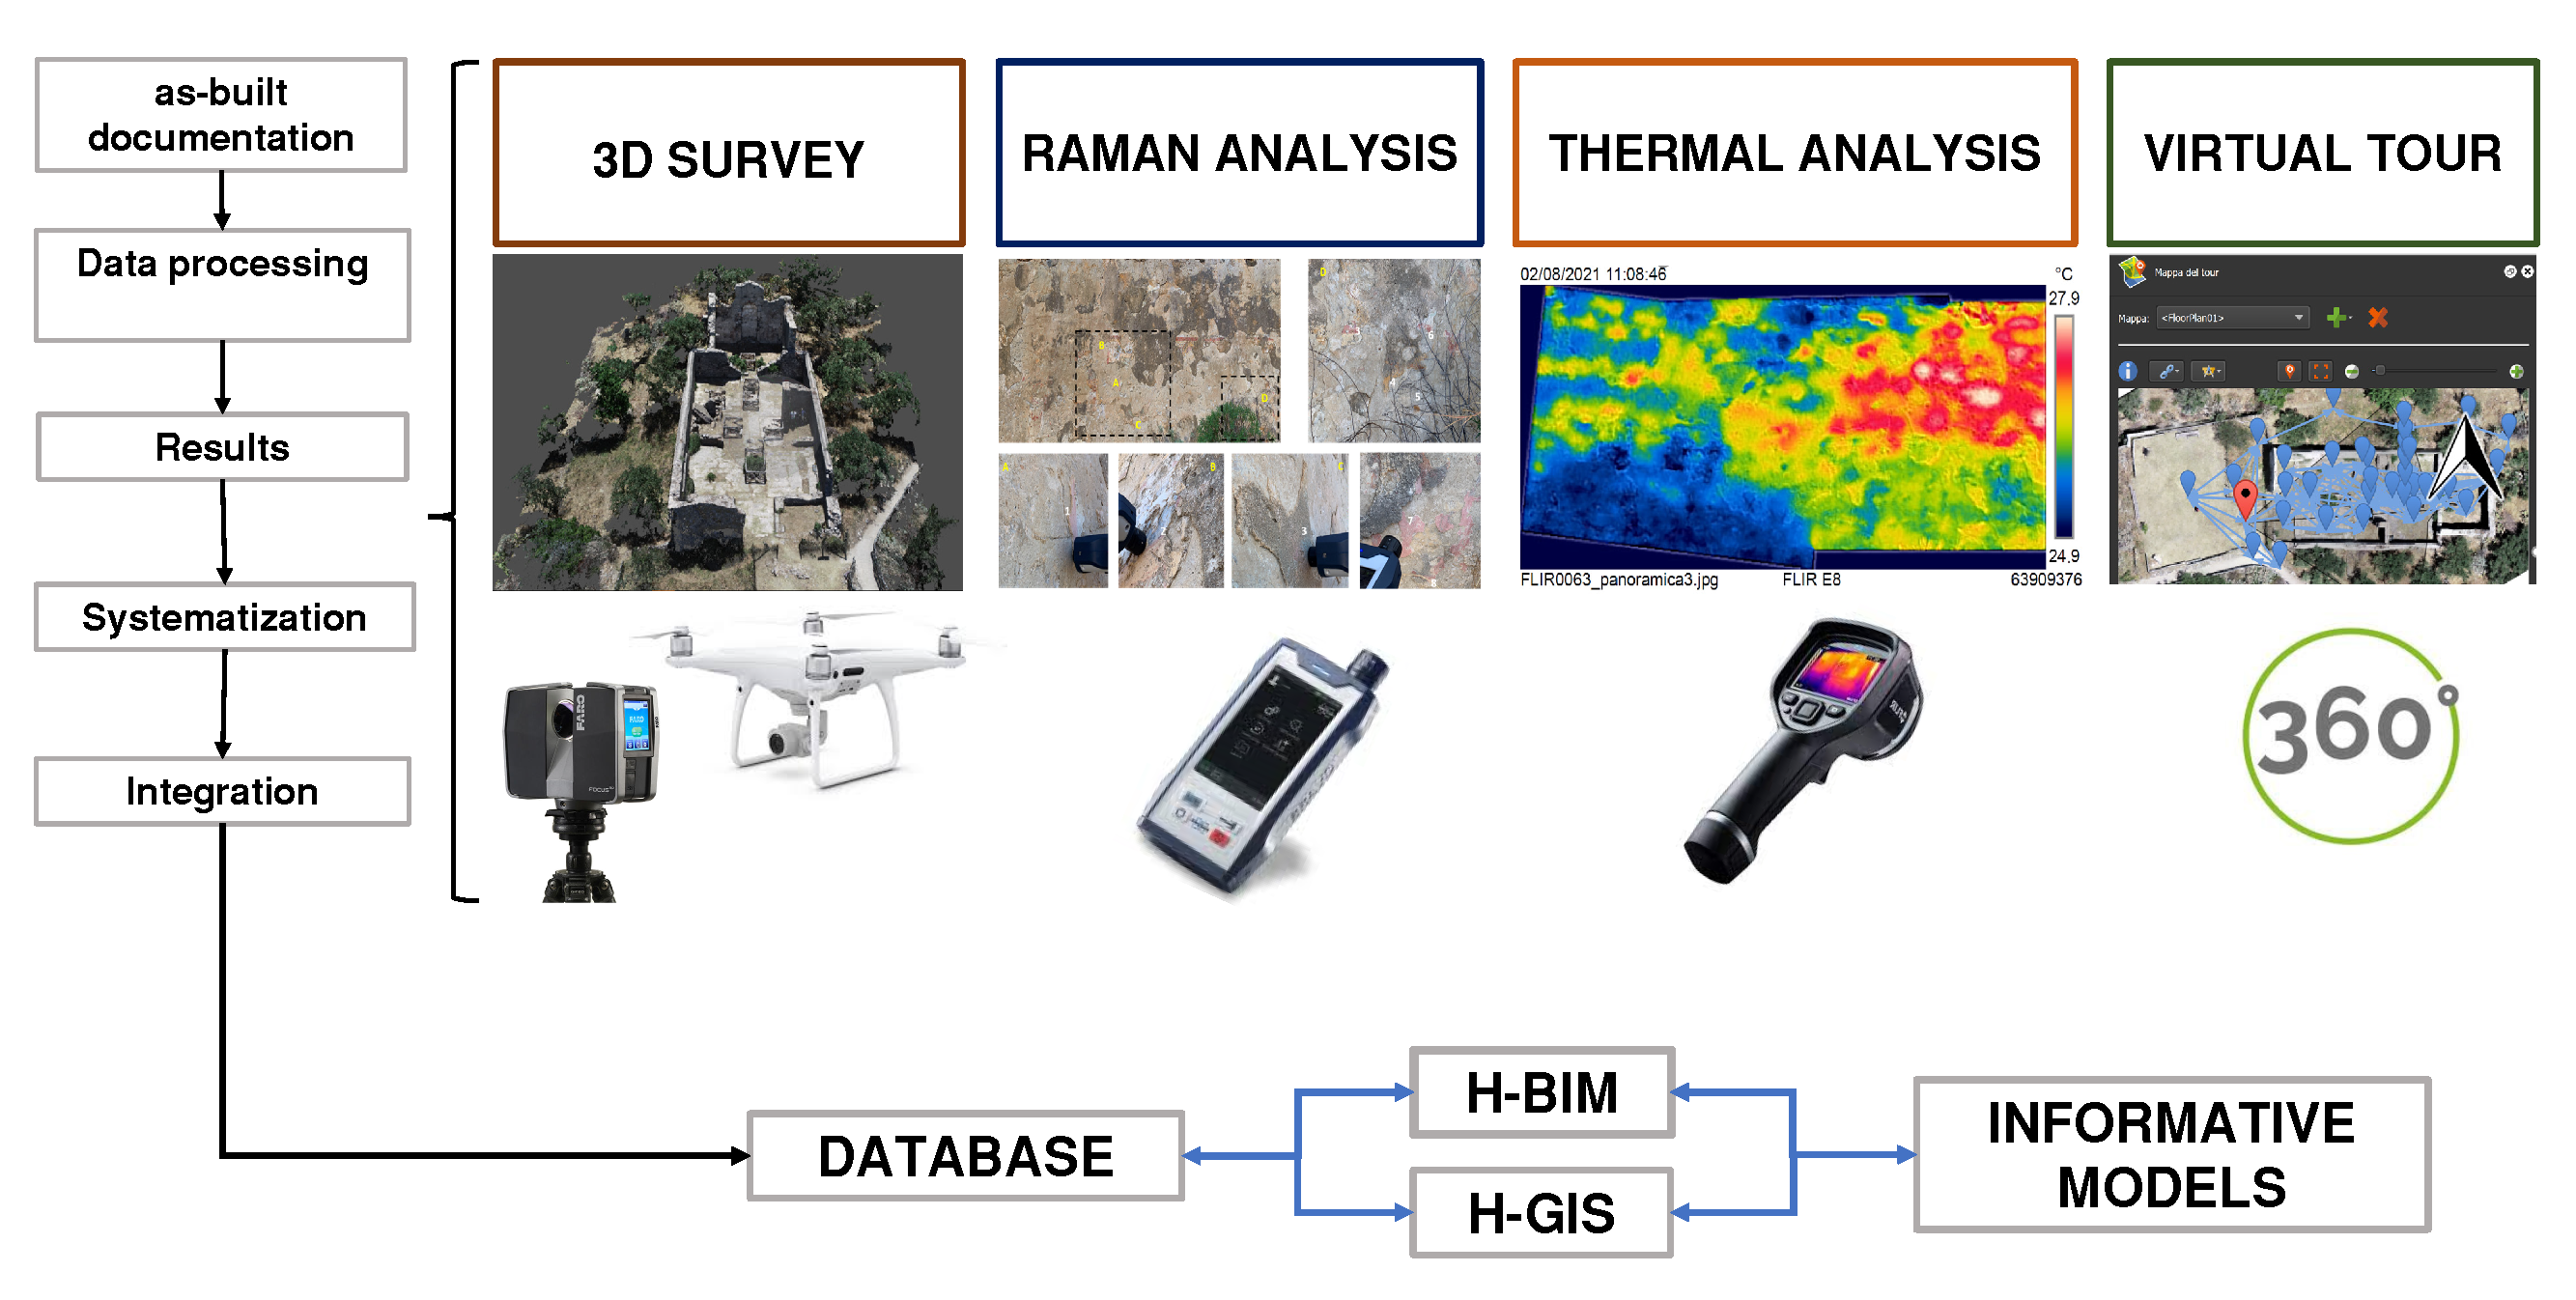
8], can contribute equally to the physical resource by preserving the memory of the past for future generations and in affirming the cultural values of modern societies. With these ambitions, in 2018 the Municipality of Reggio Calabria launched the project “Circuito delle Aree Archeologiche Urbane di Reggio Calabria”, financed by POR Calabria FESR 2014–2020, which has included the systematic digitization and the enhancement of six archaeological sites located within the metropolitan borders of Reggio C. (five in the city centre and outside).
The works, entrusted for the executive part to the Institute for Chemical and Physical Processes of National Research Council (IPCF-CNR) of Messina, have specifically involved the following areas (
Figure 1).
The Roman Thermae located in Viale I. Falcomatà;
The Greek Walls, located along the same street, near the seafront;
The s.c. Hypogeum, a hypogeal archaeological area located below Piazza Italia;
The Odéon/Bouleuterion located in via XXIV Maggio;
The Aragonese Castle, located in Piazza Castello;
The ancient settlement of Motta Sant’Agata, in the hamlet of Cataforio.
For each of these sites, the goals to be reached were numerous and various: (1) to create digital 3D models of the structures with high resolution and metric accuracy useful for the needs related to conservation, restoration, monitoring of degradation processes and recovery interventions; (2) to perform spectroscopy analyses in order to acquire data about material composition (e.g., pigments of wall paintings), useful for the hypothesis of attribution, provenience or dating; (3) to monitor the state of preservation of some surfaces through infrared (IR) thermal imaging acquisition; (4) to develop digital products and media for dissemination and remote visit through websites and smartphone apps. These issues were propaedeutic to the overall objective: to generate an integrated fruition circuit for tourists and local people consisting of several attractions, which are able to generate dynamic and permanent cultural activities [
9], based on the social value of the historical and archaeological heritage of the city.
This work is focused on a single study case, the archaeological site of Motta Sant’Agata, an important medieval and post-medieval center, which preserves numerous structures in a state of ruin. Among these, two interesting medieval churches have been systematically investigated through a multi-approach methodology. The area, only recently embedded among the number of archaeological sites under the protection of the superintendence, was, until a few years ago, in a state of semi-abandonment, covered with dense vegetation and subject to uncontrolled looting; currently, it is under the management of the Municipality of Reggio C., which takes care of the site with the collaboration of local associations. A first systematic study of the site, from the historical, archaeological and architectural point of view, was carried out by the architect Valeria Varà, who, in 2018, published a first volume [
10] for dissemination purposes (almost a tourist and historical guide), which includes a first general and descriptive section on the history of the site and of the Sant’Agata Valley, followed by a second volume entirely dedicated to the study of the ruins of the Church dedicated to San Nicola, one of the most imposing structures, characterized by five hypogeal funeral crypts. This section is enriched by a virtual reconstruction of the building in its different life stages, produced from 2D drawings, the result of a direct survey performed “stone by stone” and orthorectified images. Since these data are accessible only in paper format, the realization of a new UAV (unmanned aerial vehicle) topographic survey was necessary in order to produce a photorealistic up-to-date 3D map of the hillfort and the main structures. All of these operations have been performed combining non-destructive and contactless methods, i.e., TLS (terrestrial laser scanner) and UAV photogrammetry.
As a part of the above-mentioned program, a particular focus has been dedicated to the ruins of the churches of San Nicola and San Basilio. For the first of these, a new 3D architectural survey was performed in order to upgrade the previous documentation and to include the underground burial chamber, never documented before, with metrically accurate methods. For the second building, in a very bad state of preservation, the aim was to produce an as-built survey in order to plan consolidation intervention on walls and plaster. Moreover, the building still preserves, along the northern aisle wall, some traces of a “byzantine-style” fresco, which has been investigated with spectroscopy methods in order to characterize the composition of pigments used in the different wall painting layers and to evaluate any changes in materials in the different chronological phases. The painted surface has also been subjected to IR (infrared) thermal imaging acquisition in order to obtain a documentation of the current state; the same analyses will be periodically repeated for monitoring purposes. The final intent is to acquire a set of data from different methodologies and to create an “integrated digital archive” that can be used to provide information at different levels of detail. This can expand the knowledge of the structures and their features, and generate interest from scholars and tourists.
Given that the site is placed outside of the usual tourist circuits of the urban area, the case study can represent a benchmark to put a value on the benefit and impact of digitization intervention in attracting tourists and local people. In this regard, a type of interactive museum embedding virtual tour and augmented reality, available both via web browser and smartphone, is under development; this will help in making the site more accessible during particular events (e.g., ordinary maintenance works, pandemic emergency, etc.) and more inclusive for people with motor disabilities.
2. Study Area
2.1. Location and History
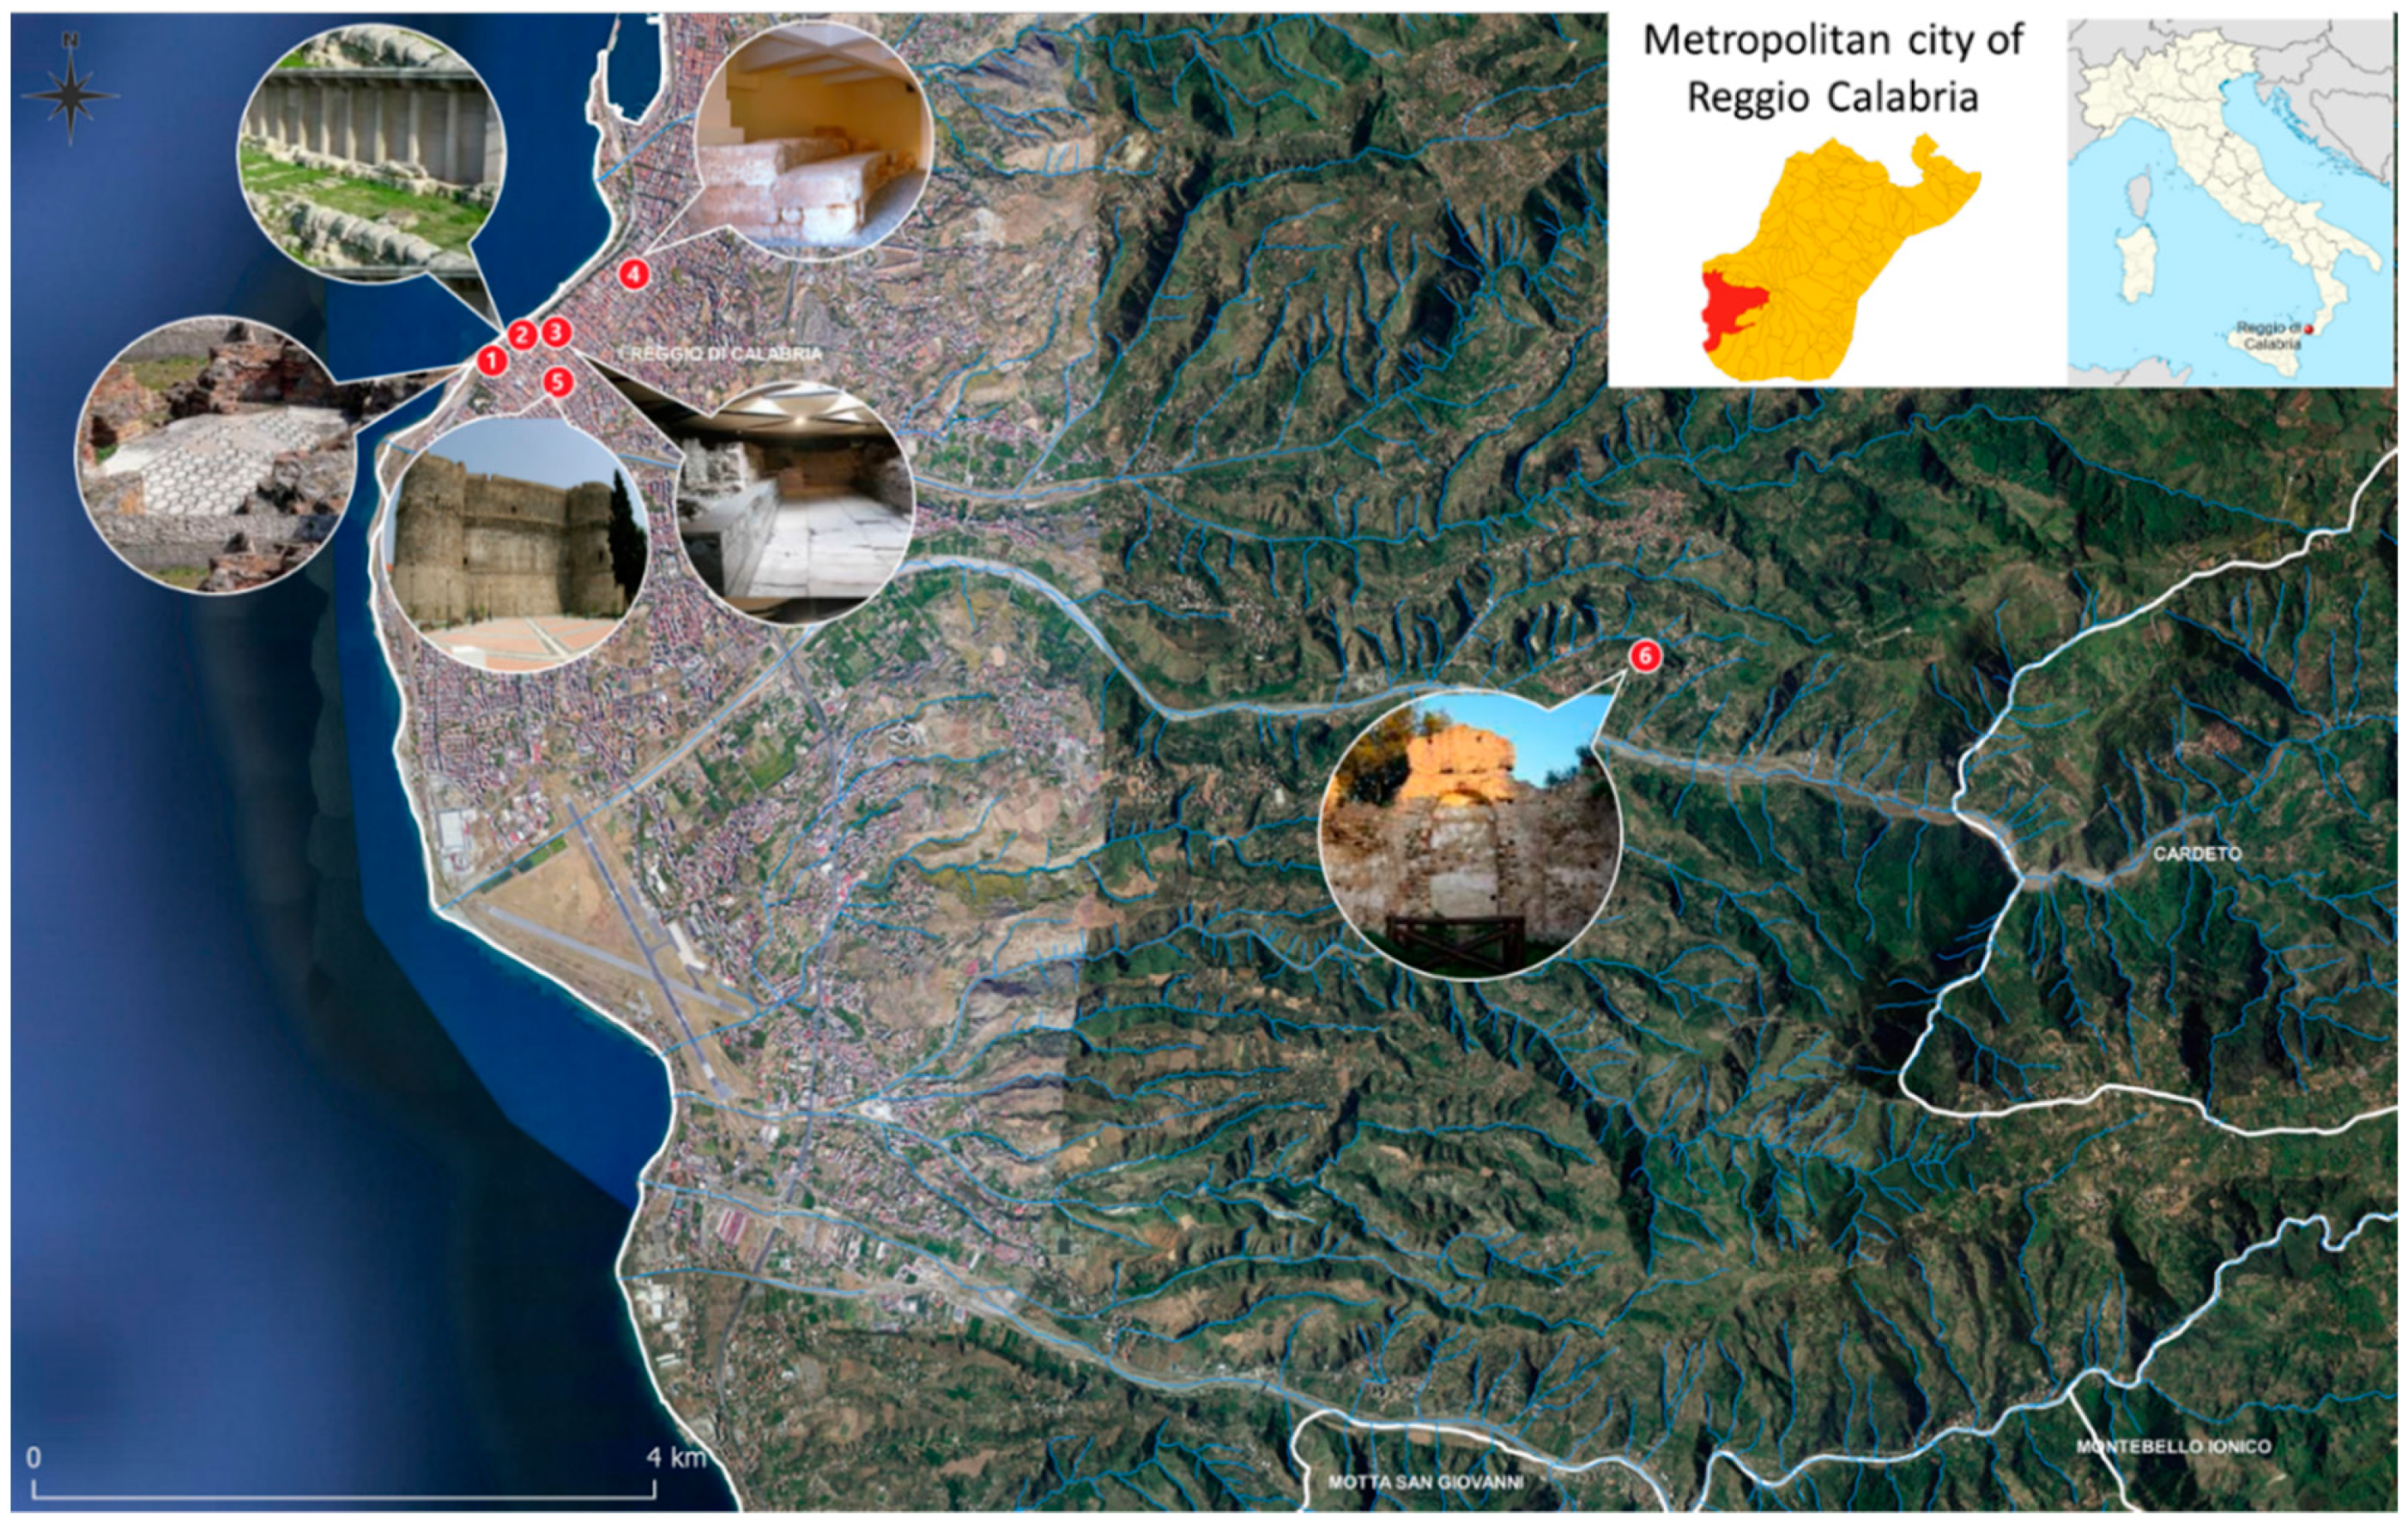
Motta Sant’Agata is located about 8 km away from the urban center of Reggio C. (lat. 38°5′21.87″ N, long. 15°43′26.75″ E), near the hamlets of Cataforio and San Salvatore. The ancient settlement was developed on the summit of a hill (350 m a.s.l.), today Suso, overlooking the strait area (
Figure 2).
The cliff has a narrow and elongated shape (approx. 480 m × 75 m) and is bordered by the municipal road S. Lorenzello and by the stream of Sant’Agata (
Figure 3); this waterway, probably navigable, was a great environmental resource in ancient times [
11,
12,
13,
14].
It is probable that the site was inhabited prehistory and during Greek and Roman times, even if the phase of major development dates back to the Byzantine times. The settlement responds to the model of Byzantine
kastron, with a castle or fortress as a part of wider defense systems, generally located on naturally defended cliffs between two watercourses. This kind of settlement generally included a “castle”, built on the highest point and used as a refuge during sieges [
15], and “villages” developing around the lower ridges, surrounded by cultivated lands.
Starting from the Norman age with the encastellation process and the reorganization of the territories of Calabria, Sant’Agata was endowed with a clear defensive function, which was maintained throughout the 13th, 14th and 15th centuries. In this period, the site became part of a network of garrisons (
motte) located within the strip between Capo d’Armi, Punta Calamizzi and Scilla, at different altitudes (between 330 m and 700 m a.s.l.), which included at least six sites [
10] (pp. 20–24) (Motta dei Mori, Calanna, Motta Rossa, Motta Anomeri, Motta San Quirillo, Sant’Agata di Reggio, San Niceto), several waterways and roads. In the Angevin period the city remained immune to the feudal system and enjoyed municipal autonomy both from nearby Reggio C. and from other feuds.
Around the 16th century the settlement reached its expansive peak: the analysis of a tax register of this period allows us to estimate the presence of 265 families, equal to about 1000 inhabitants. The history of the site, well summarized by V. Varà [
10] (pp. 19–39), was abruptly interrupted by the destruction caused by the violent earthquake that occurred on 5 February 1783, which led to the definitive abandonment of the site and the transfer of the surviving inhabitants to
Piano delle Galline, today Gallina, on the opposite side of Sant’Agata stream [
10] (pp. 32, 37).
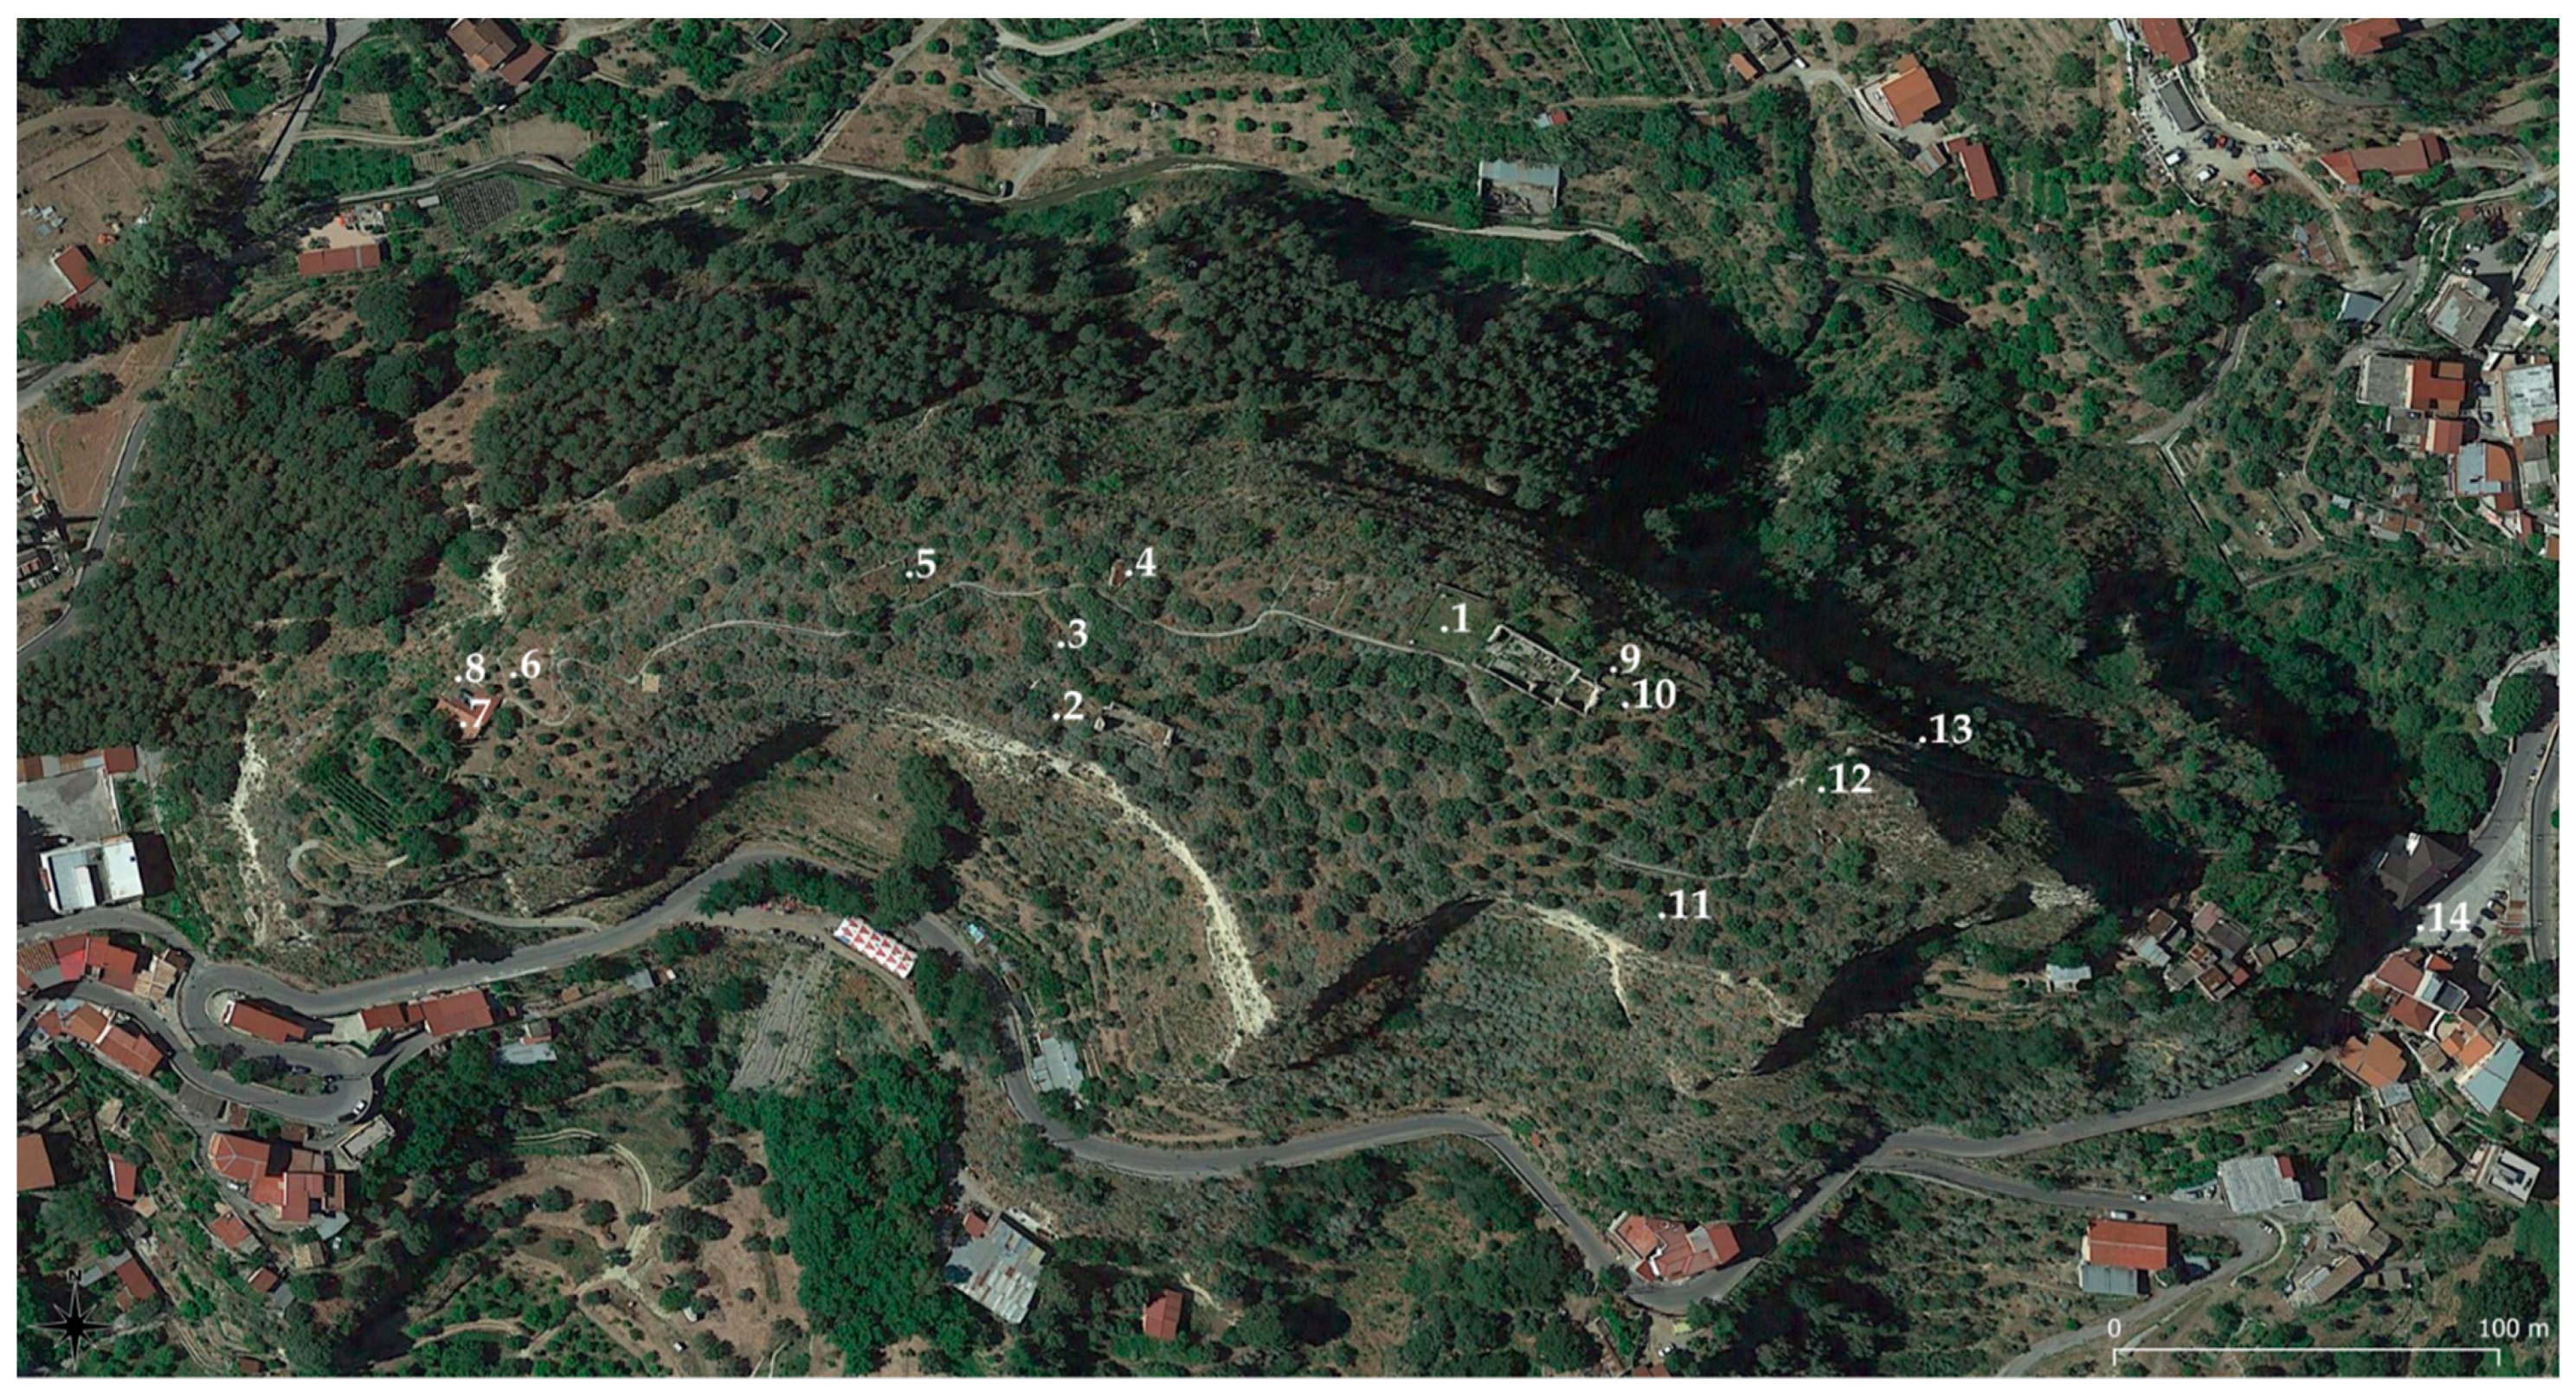
2.2. Archaeological Evidence
The hill of Sant’Agata, today Suso, preserves the remains of many structures that testify to the ancient origins and the prosperity of the settlement starting from the late Middle Ages. The most important and imposing buildings, preserved in a state of ruin, are the Church of San Nicola (
Figure 3, no. 1), located in the flat area at the center of the site, and the church of San Basilio (
Figure 3, no. 2), about 170 m from the first. Each of them will be discussed, as case studies, in two dedicated section of this paper (
Section 2.3 and
Section 2.4).
Beyond these, the fortification system is noteworthy: it consists of two impenetrable wall circuits surrounding the hill at different altitudes (
Figure 3, no. 6), the upper enceinte enclosed only the ‘tower-castle’ (
Figure 3, no. 12), a structure located on the highest part of the cliff equipped with a cistern; the lower part followed the natural orographic boundaries of the hill, including the suburb of San Teodoro (
Figure 3, no. 8), and was interrupted by the presence of overhanging slopes [
16]. The function of the double fortification wall has been well examined by F. Martorano [
17]. The lower fortification included two gates: the first, called Porta di Terra (
Figure 3, no. 13), was a fortified passage placed along the steep path on the northern side of the cliff. Only a worn threshold consisting of three large granite stones [
18] are visible today. The second gate, called “Porta di Mare”, was located southwest, along the side of the nearby river, and was accessible by a stairway carved into the rock.
Other important structures, visible today, deserve to be mentioned: the Church del Soccorso (
Figure 3, no. 7;, Church della Provvidenza (
Figure 3, no. 10); a noble palace belonging to the Columbo family (
Figure 2, no. 11); Mazzone Palace (
Figure 3, no. 4); Borruto Palace (
Figure 3, no. 3); the s.c. Governor’s Palace (
Figure 3, no. 5); residential houses of different typology grouped into “convicini” (houses belonging to the same neighborhood); productive structures (such as oil mills); canalization systems connected to cisterns for the collection of rainwater. Some ancient caves carved into the rock (sandstone rich in fossils), similar to those found throughout the surrounding area, are also preserved along the side of the hill.
The site is reachable from Piazza Arghelle (
Figure 3, no. 14) by means of a narrow and steep pedestrian path consisting of some steps carved in the stone; once on the top of the hill the path runs along the ridge to reach the western edge, where it then goes down toward the road San Lorenzello. In 2016, the Municipality of Reggio C. renovated the paths, put in the fence, and placed information panels.
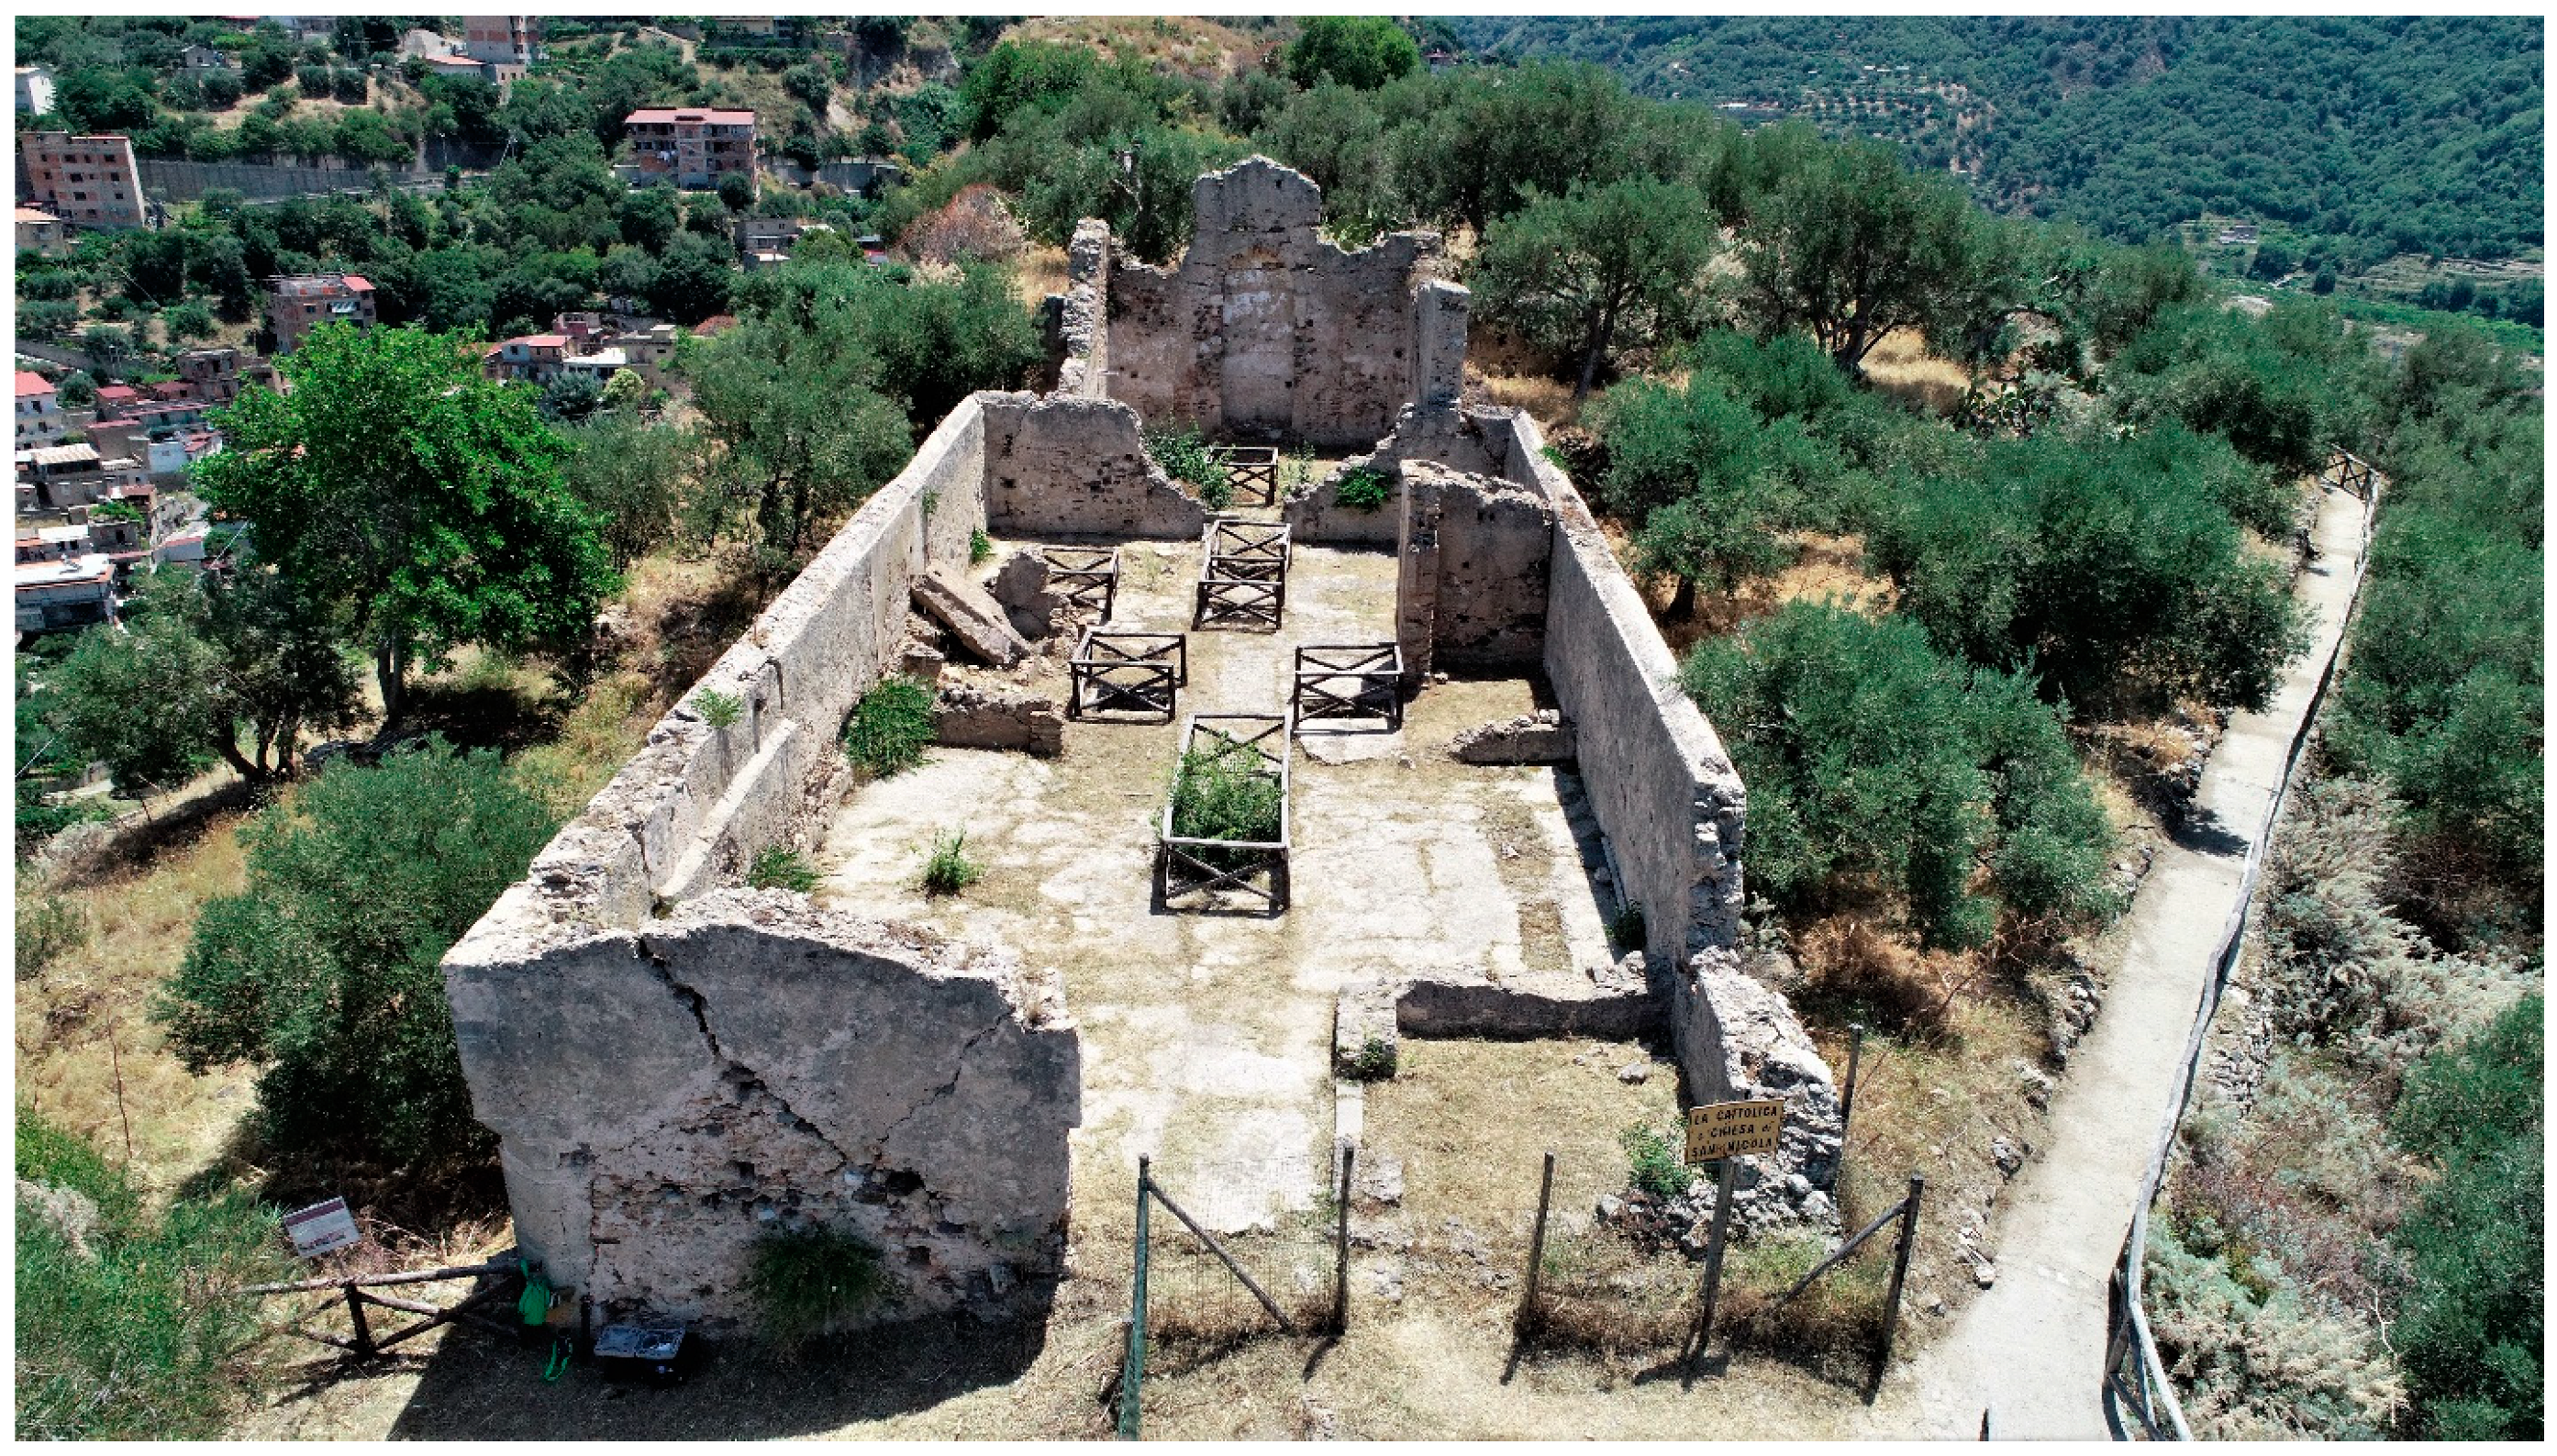
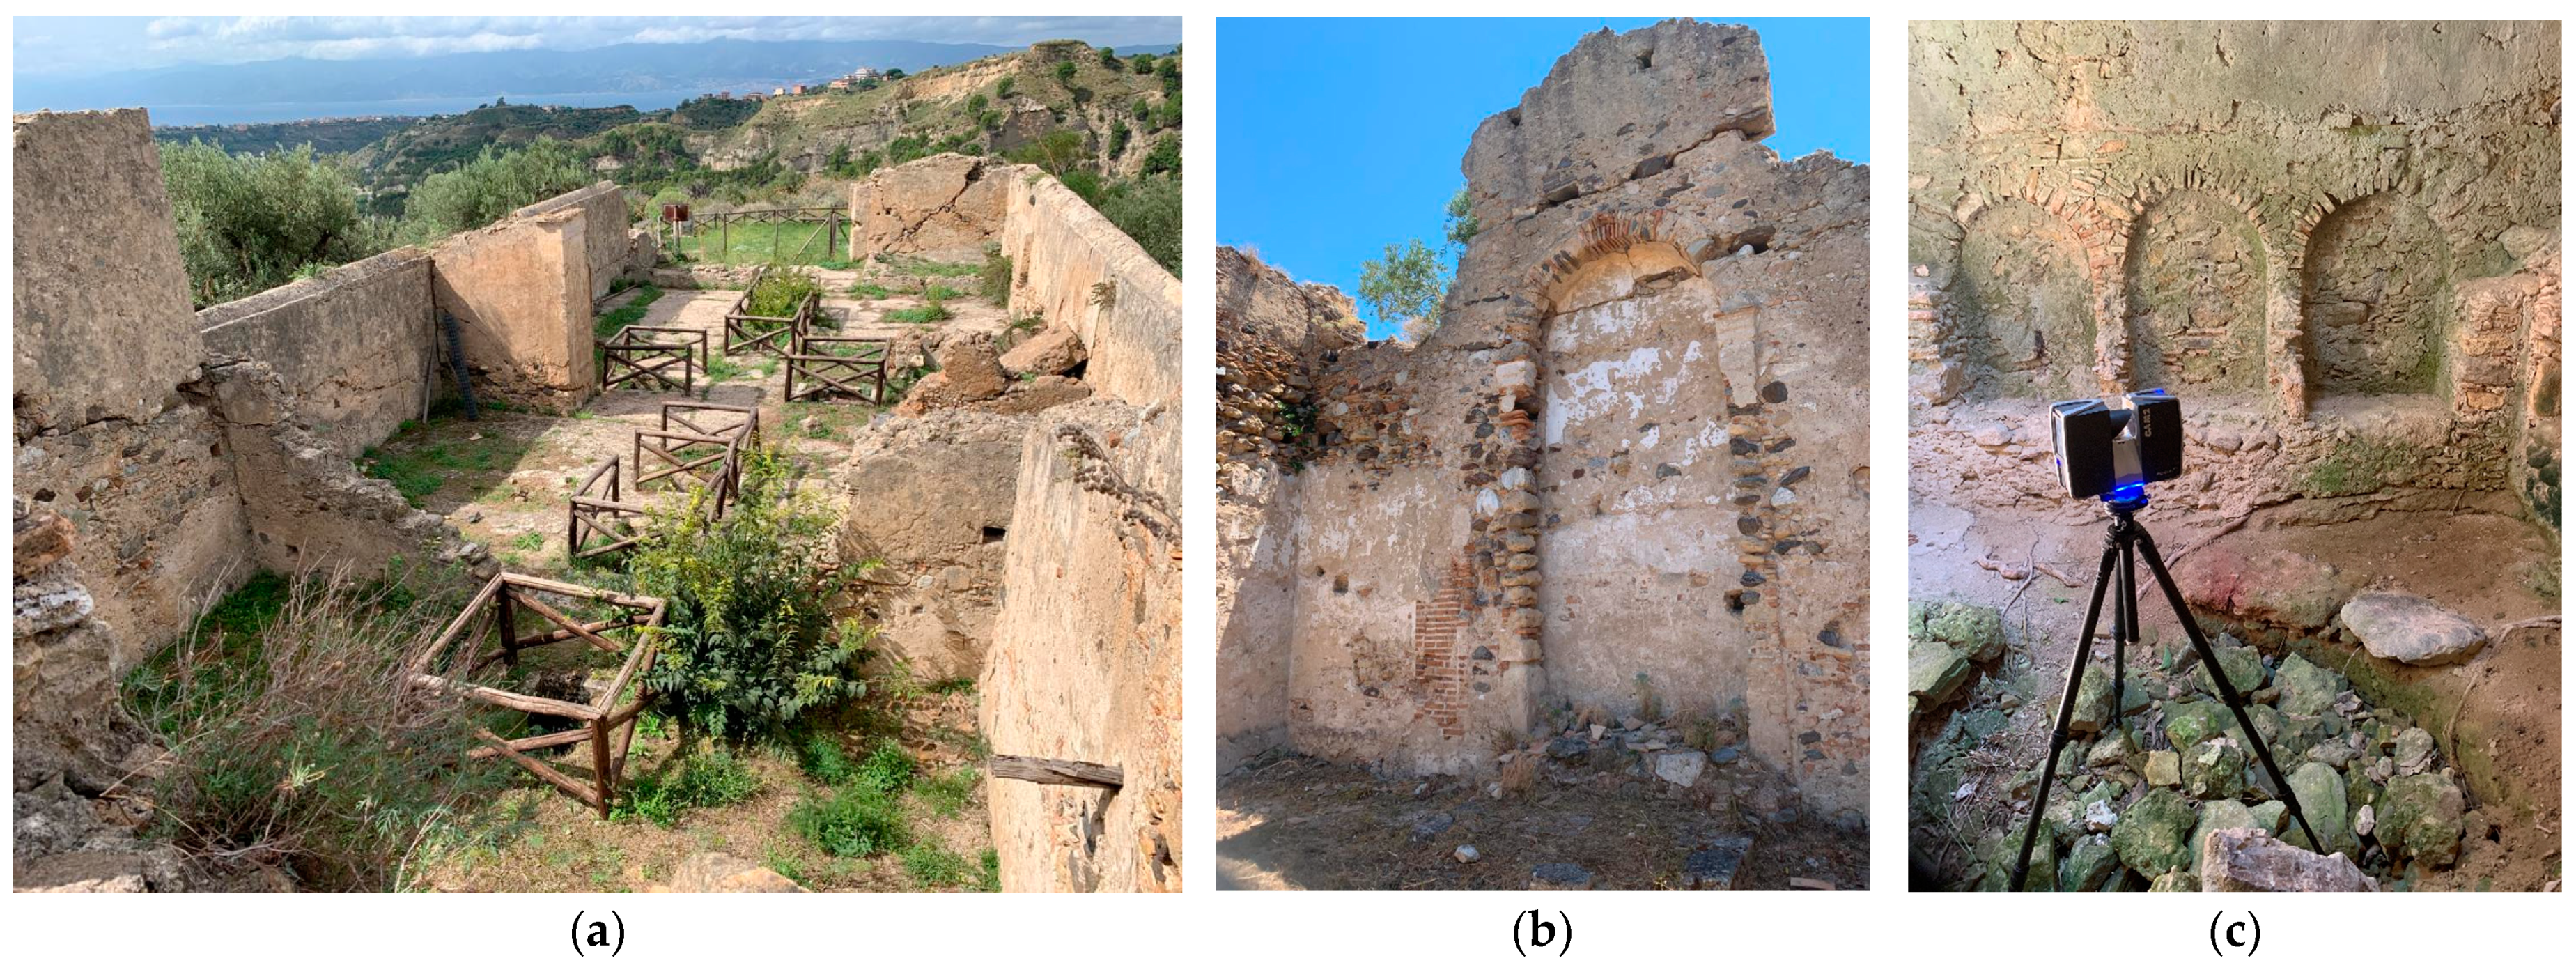
2.3. The Protopapal Church of San Nicola
The Protopapal church of San Nicola (
Figure 4 and
Figure 5) was the biggest and the most imposing religious building in Motta Sant’Agata. The church, preserved in a state of ruin, is also called
Cattolica del Salvatore, a Greek term which means “Universal Church”. Its remains, located at the center of the hill (38°05′21.91″N, 15°43′27.18″E), are reachable by walking 320 m from Piazza Arghelle to the top of the hill.
The building (31.67 m in length × 12.72 m in width) consists of a single nave (length 24.57 m) oriented to the east and separated from the presbytery by means of an iconostasis, a wall where the icons of Byzantine saints were hung. The presbytery area (7.10 × 7.60 m) still preserves parts of the pavement in square terracotta tiles (size of a palm, 26.46 cm); here are also visible the remains of an altar dedicated to the Byzantine saint, Nicholas of Myra, characterized by a Greek cross engraved on the plaster of the left wall. In this area, there was a wooden bench where the ecclesiastical dignities sat.
The aisle is characterized by four noble chapels. Along the nave, at the level of the floor, we can see the accesses to five hypogeal funeral crypts, once used for the inhumation of corpses and closed by large stone slabs called by the Arabic term “balate”.
The main crypt, placed below the presbytery, was accessible from the nave; it includes 11 cavities, equipped with stone draining-seats placed around a central well (
Figure 5c): here the bodies of ecclesiastical dignities were inhumated through the particular method of
thanato-metamorphosis [
19]. The bodies were seated and held erect by means of a stake while their organic remains in decomposition were channeled in the central well. Among the other four crypts, worthy of note is the one located along the northern side, which has an exit that led outside of the building toward the Chapel of the Holy Sacrament, located near the Bell Tower (
Figure 3, no. 9). Burials inside the churches were carried out during the Middle Ages, but they ceased with the edict of Saint-Cloud by Napoleon, which prohibited burial inside churches and required the construction of cemeteries outside the perimeter of inhabited areas [
10] (p. 102).
Nothing remains of the roof, which probably had to be wooden with a double pitch and roof tiles.
Outside, the main entrance is preceded by a square courtyard dedicated to the Theotokos (Mother of God). In the right corner of the facade, a block of lava stone is visible with a sculpted Norman floral motif, probably belonging to an earlier building. On the northern side of the presbytery there are the remains of a bell tower.
The current state of knowledge does not allow researchers to date the construction phases of the church; some recent hypotheses, advanced by V. Varà [
10] (pp. 103–134), suggest that the presbytery area and the main crypt placed underneath, belonged to the first construction intervention, while the nave and the chapels were added some time later (around the seventeenth century). Moreover, the scholar, on the basis of historical archive documents, proposes a virtual reconstruction which recreates the appearance of the building during the three main phases of use: (1) originary phase, from the 13th century to 1783, the year of its destruction (even if the church is mentioned for the first time in 1310, the building model has been dated to the second half of the 13th century; several restoration interventions have been evidenced until the late 16th century); (2) cemetery phase, from 1841 to 1889 and from 1906 to 1908 [
11,
12]; (3) current ruin, from 1908 until today [
14,
16,
20].
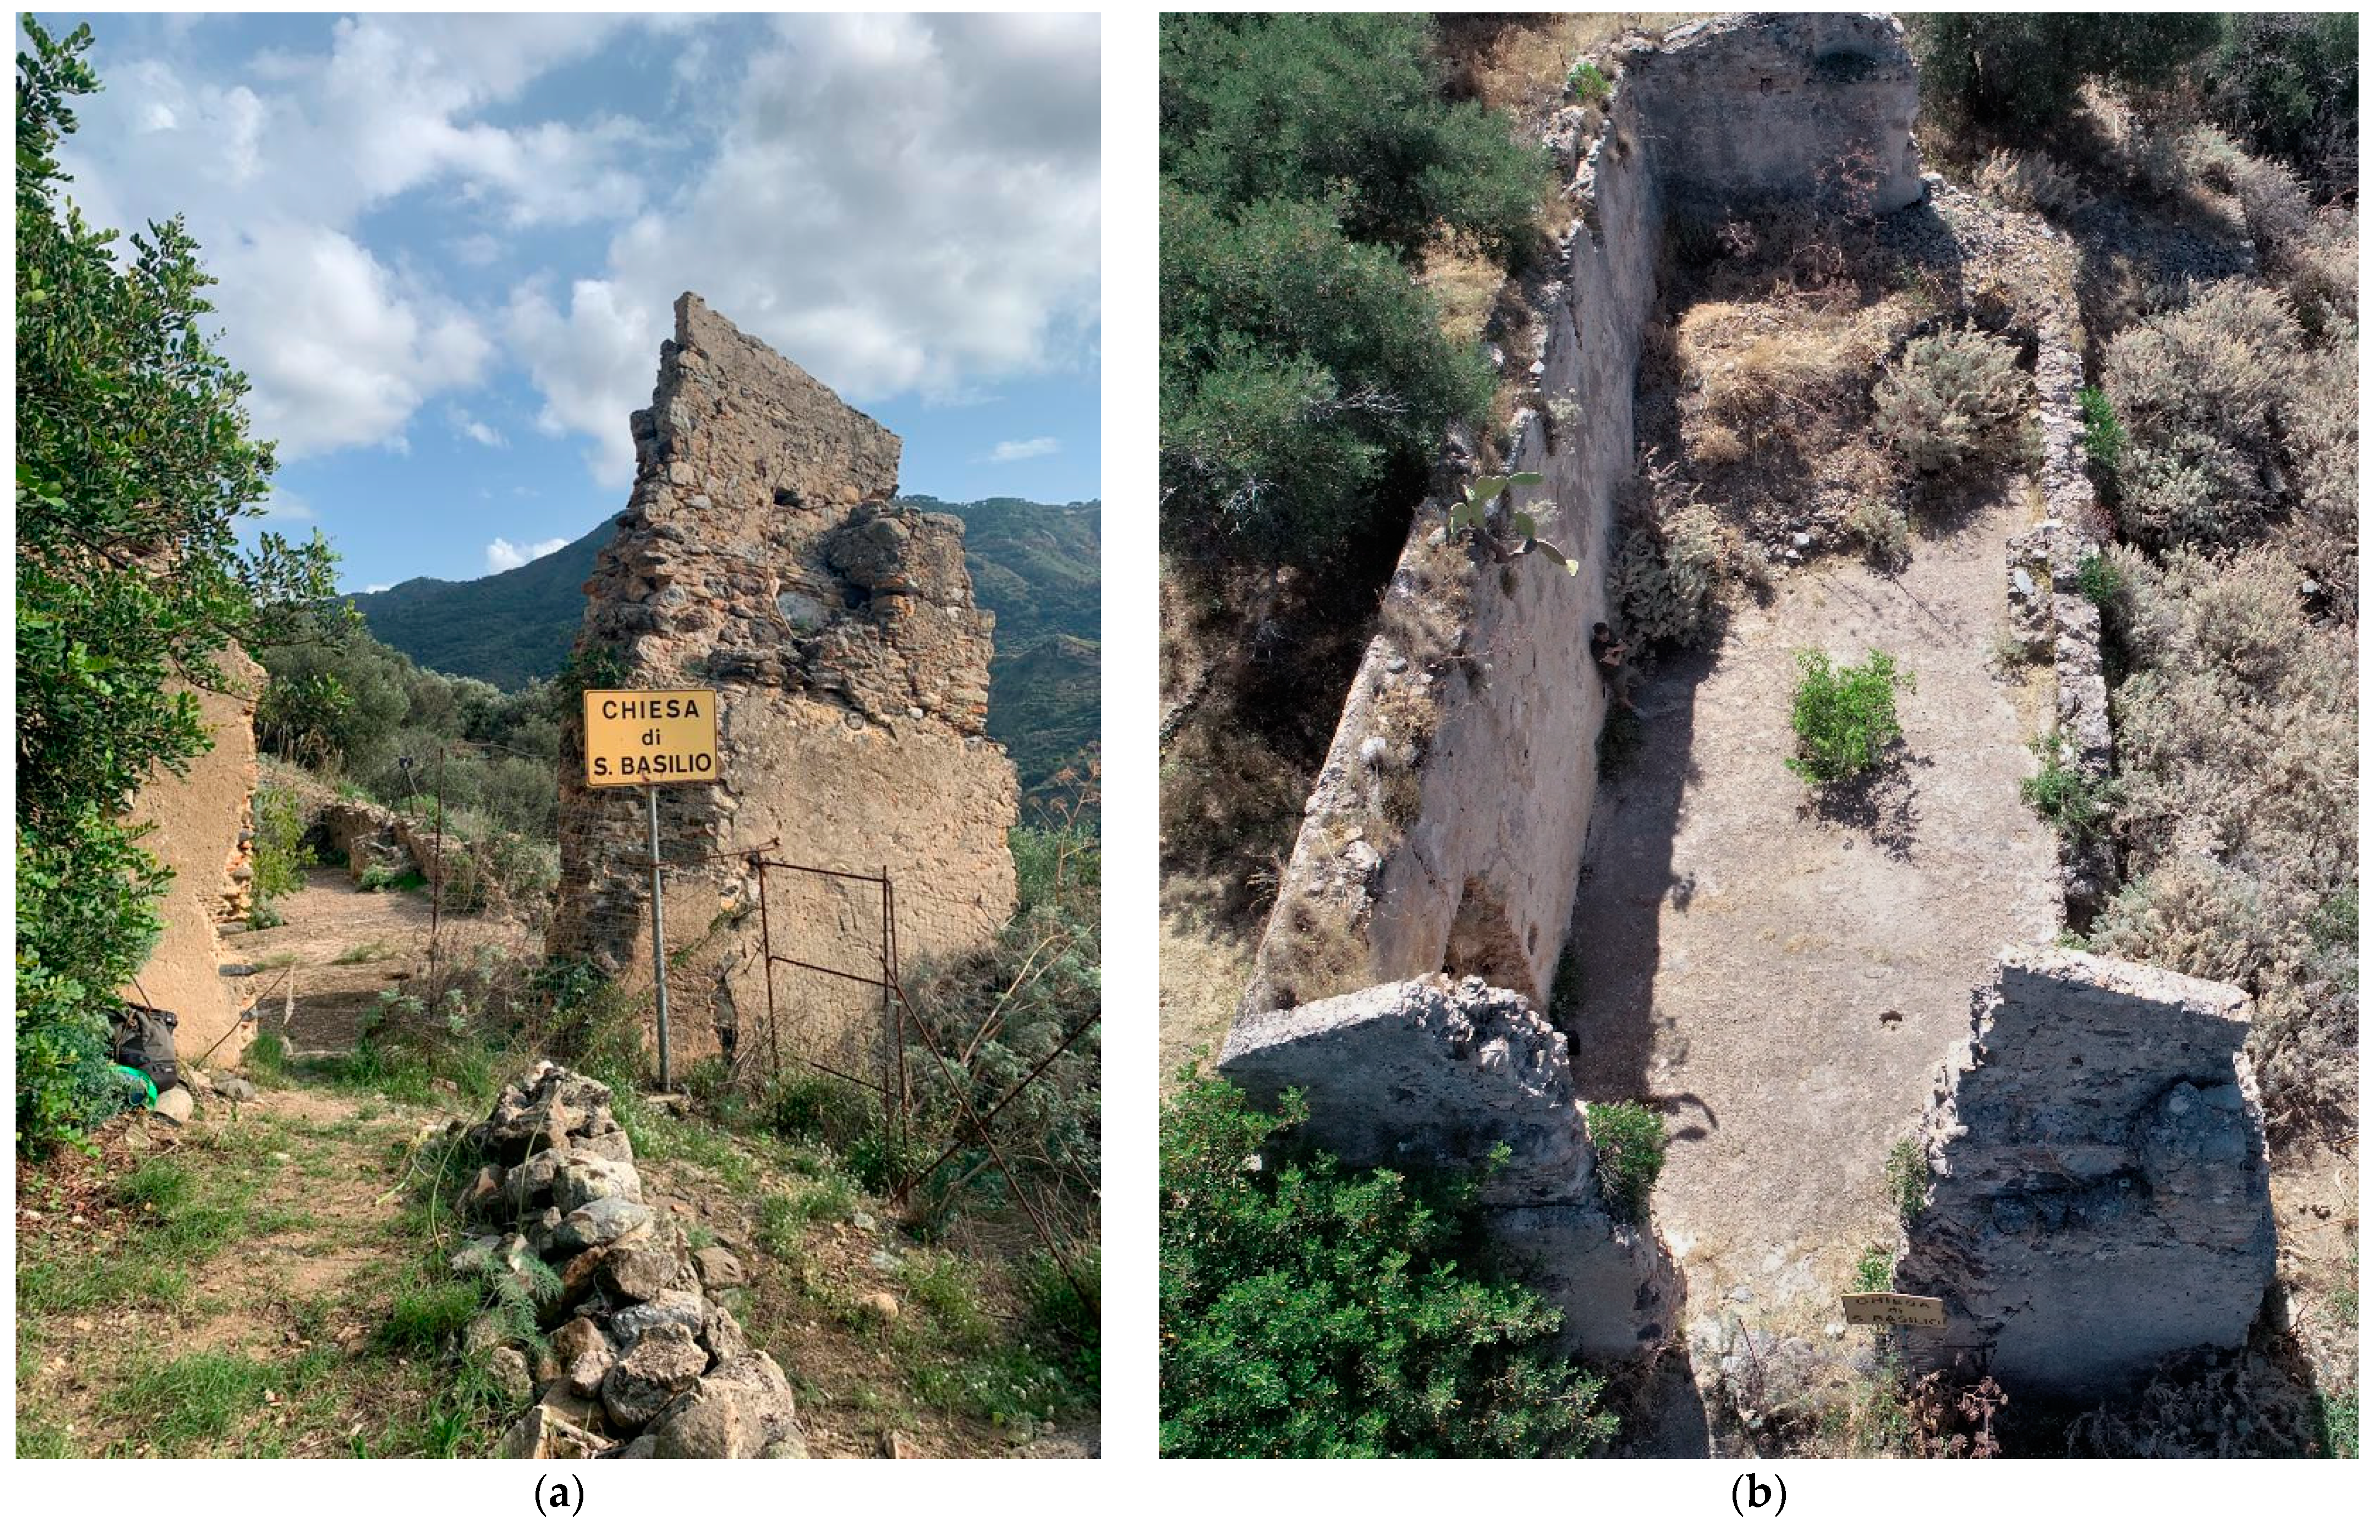
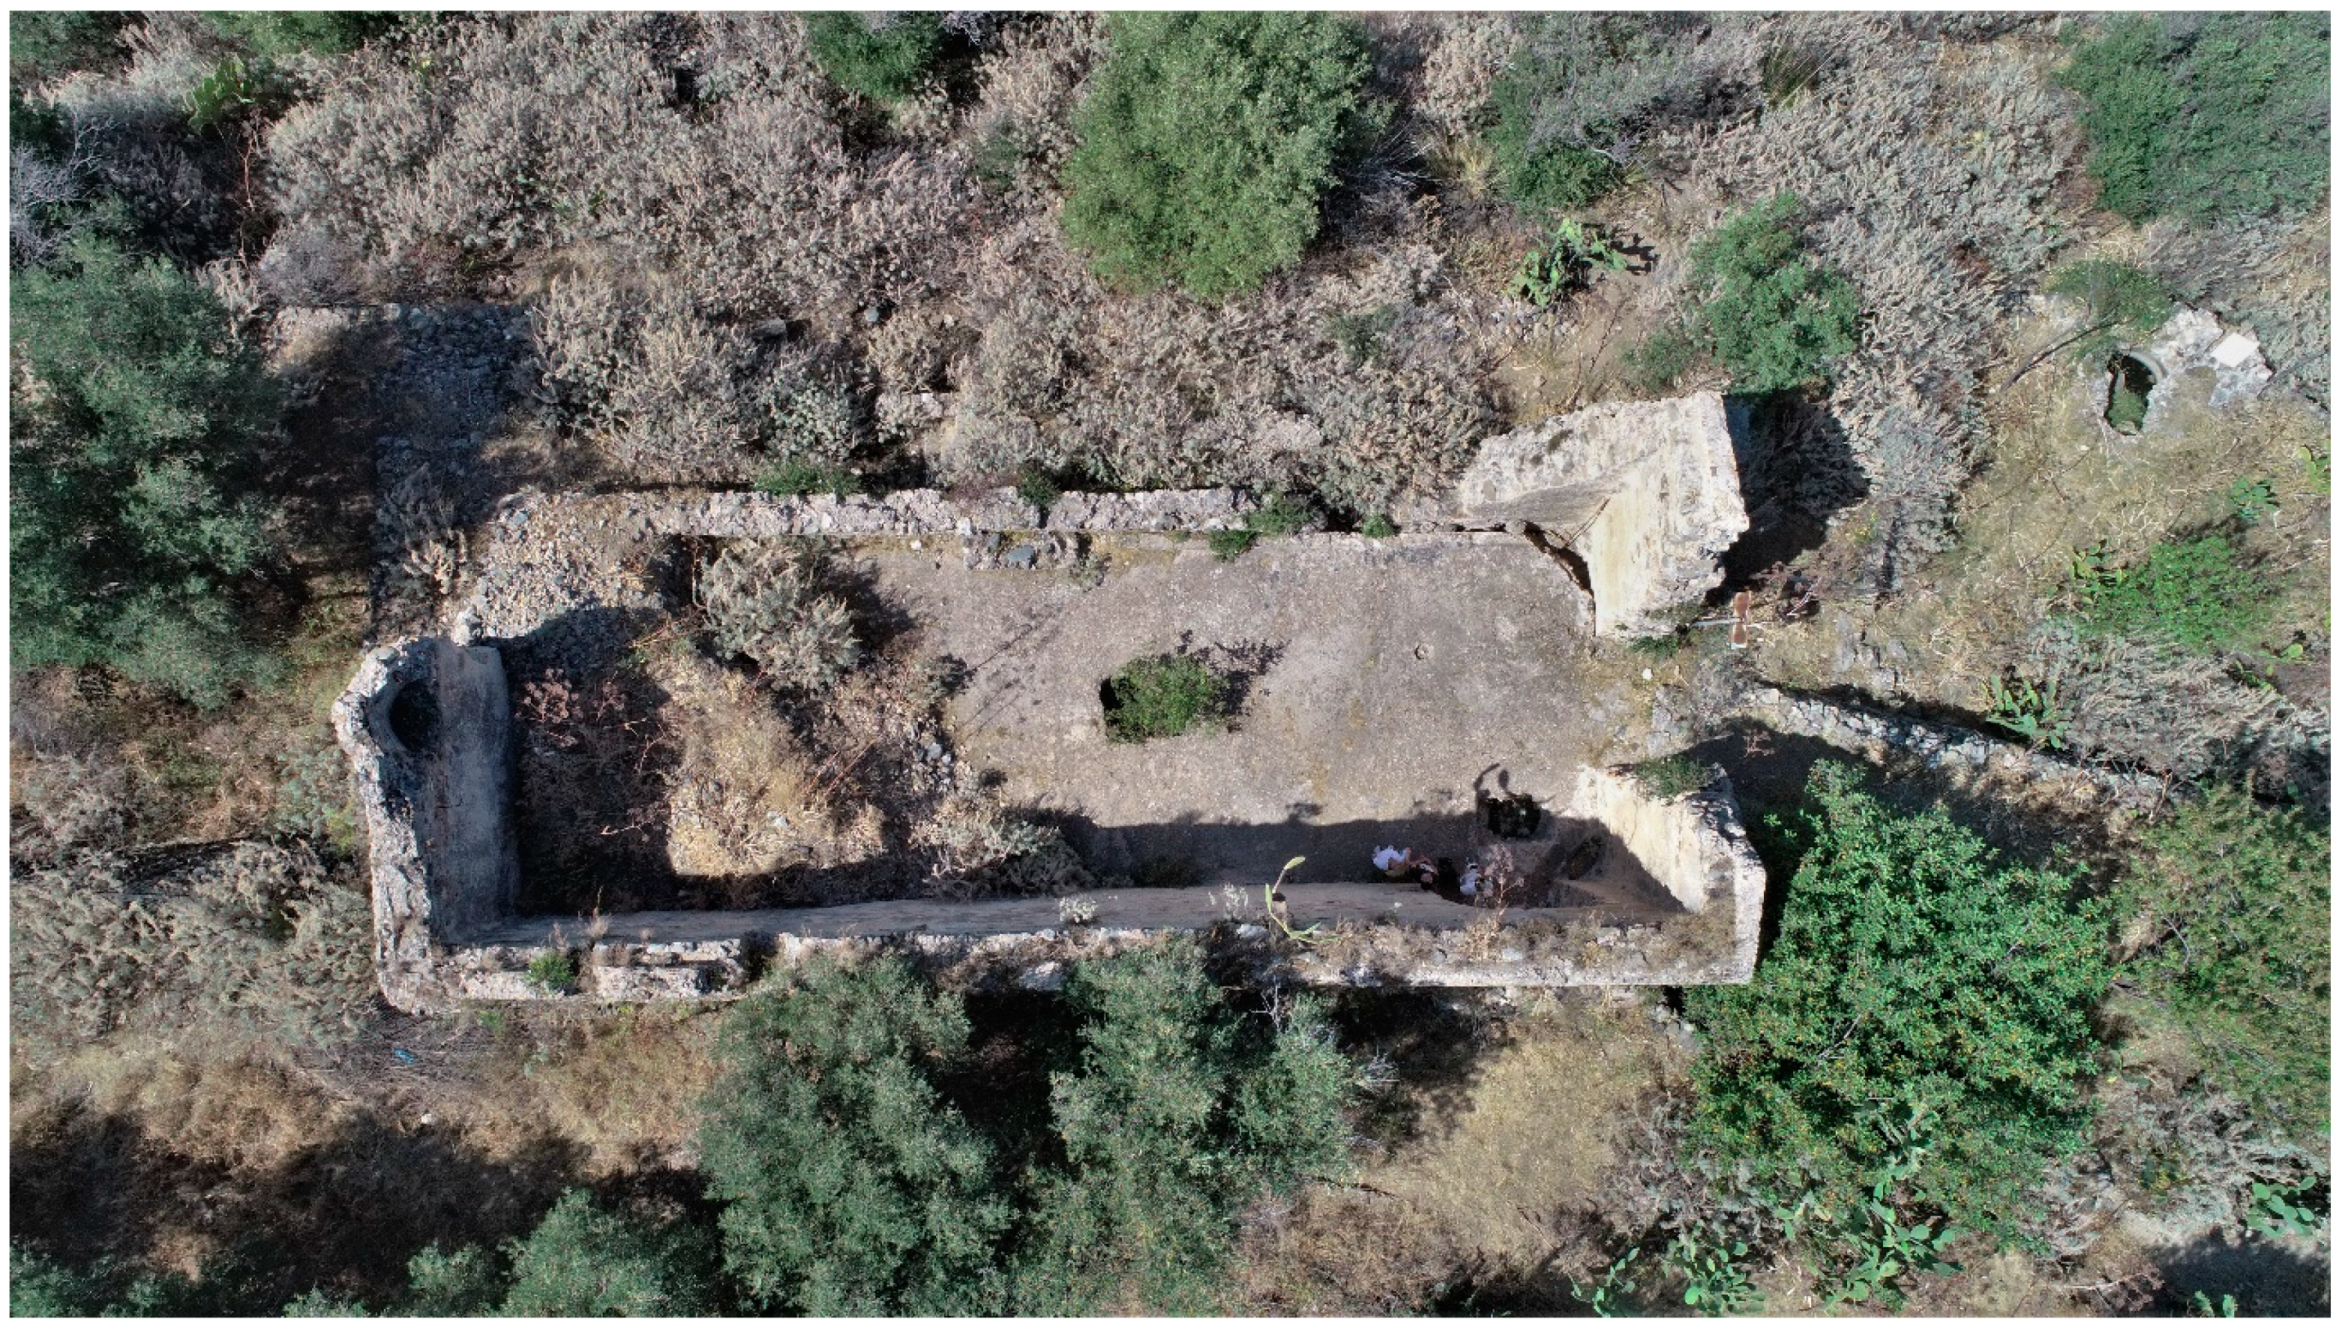
2.4. The Church of San Basilio
The church of San Basilio is located about 85 m linear southwest from
Theodokos (Mother of God) square (coordinates 38°5′21.37″N, 15°43′23.14″E) (
Figure 6 and
Figure 7). The building [
11,
12,
14,
16,
18,
20] was dedicated to a saint of oriental origin, Saint Basil the Great of Caesarea, founder of the order of the Basilians and present in the territory of S. Agata with a long tradition. Oriented towards the east, it preserves the remains of a single nave (18 m long and 6 m wide) with a terminal apse and a chapel carved into the masonry located on the left side of the entrance. Once, in a wooden case located on the right side, there was a Carrara marble statue of San Basilio, made in 1535 by the Tuscan sculptors Gianbattista and Giandomenico Mazzolo, which is now located in the church of Gesù e Maria in Cataforio [
21].
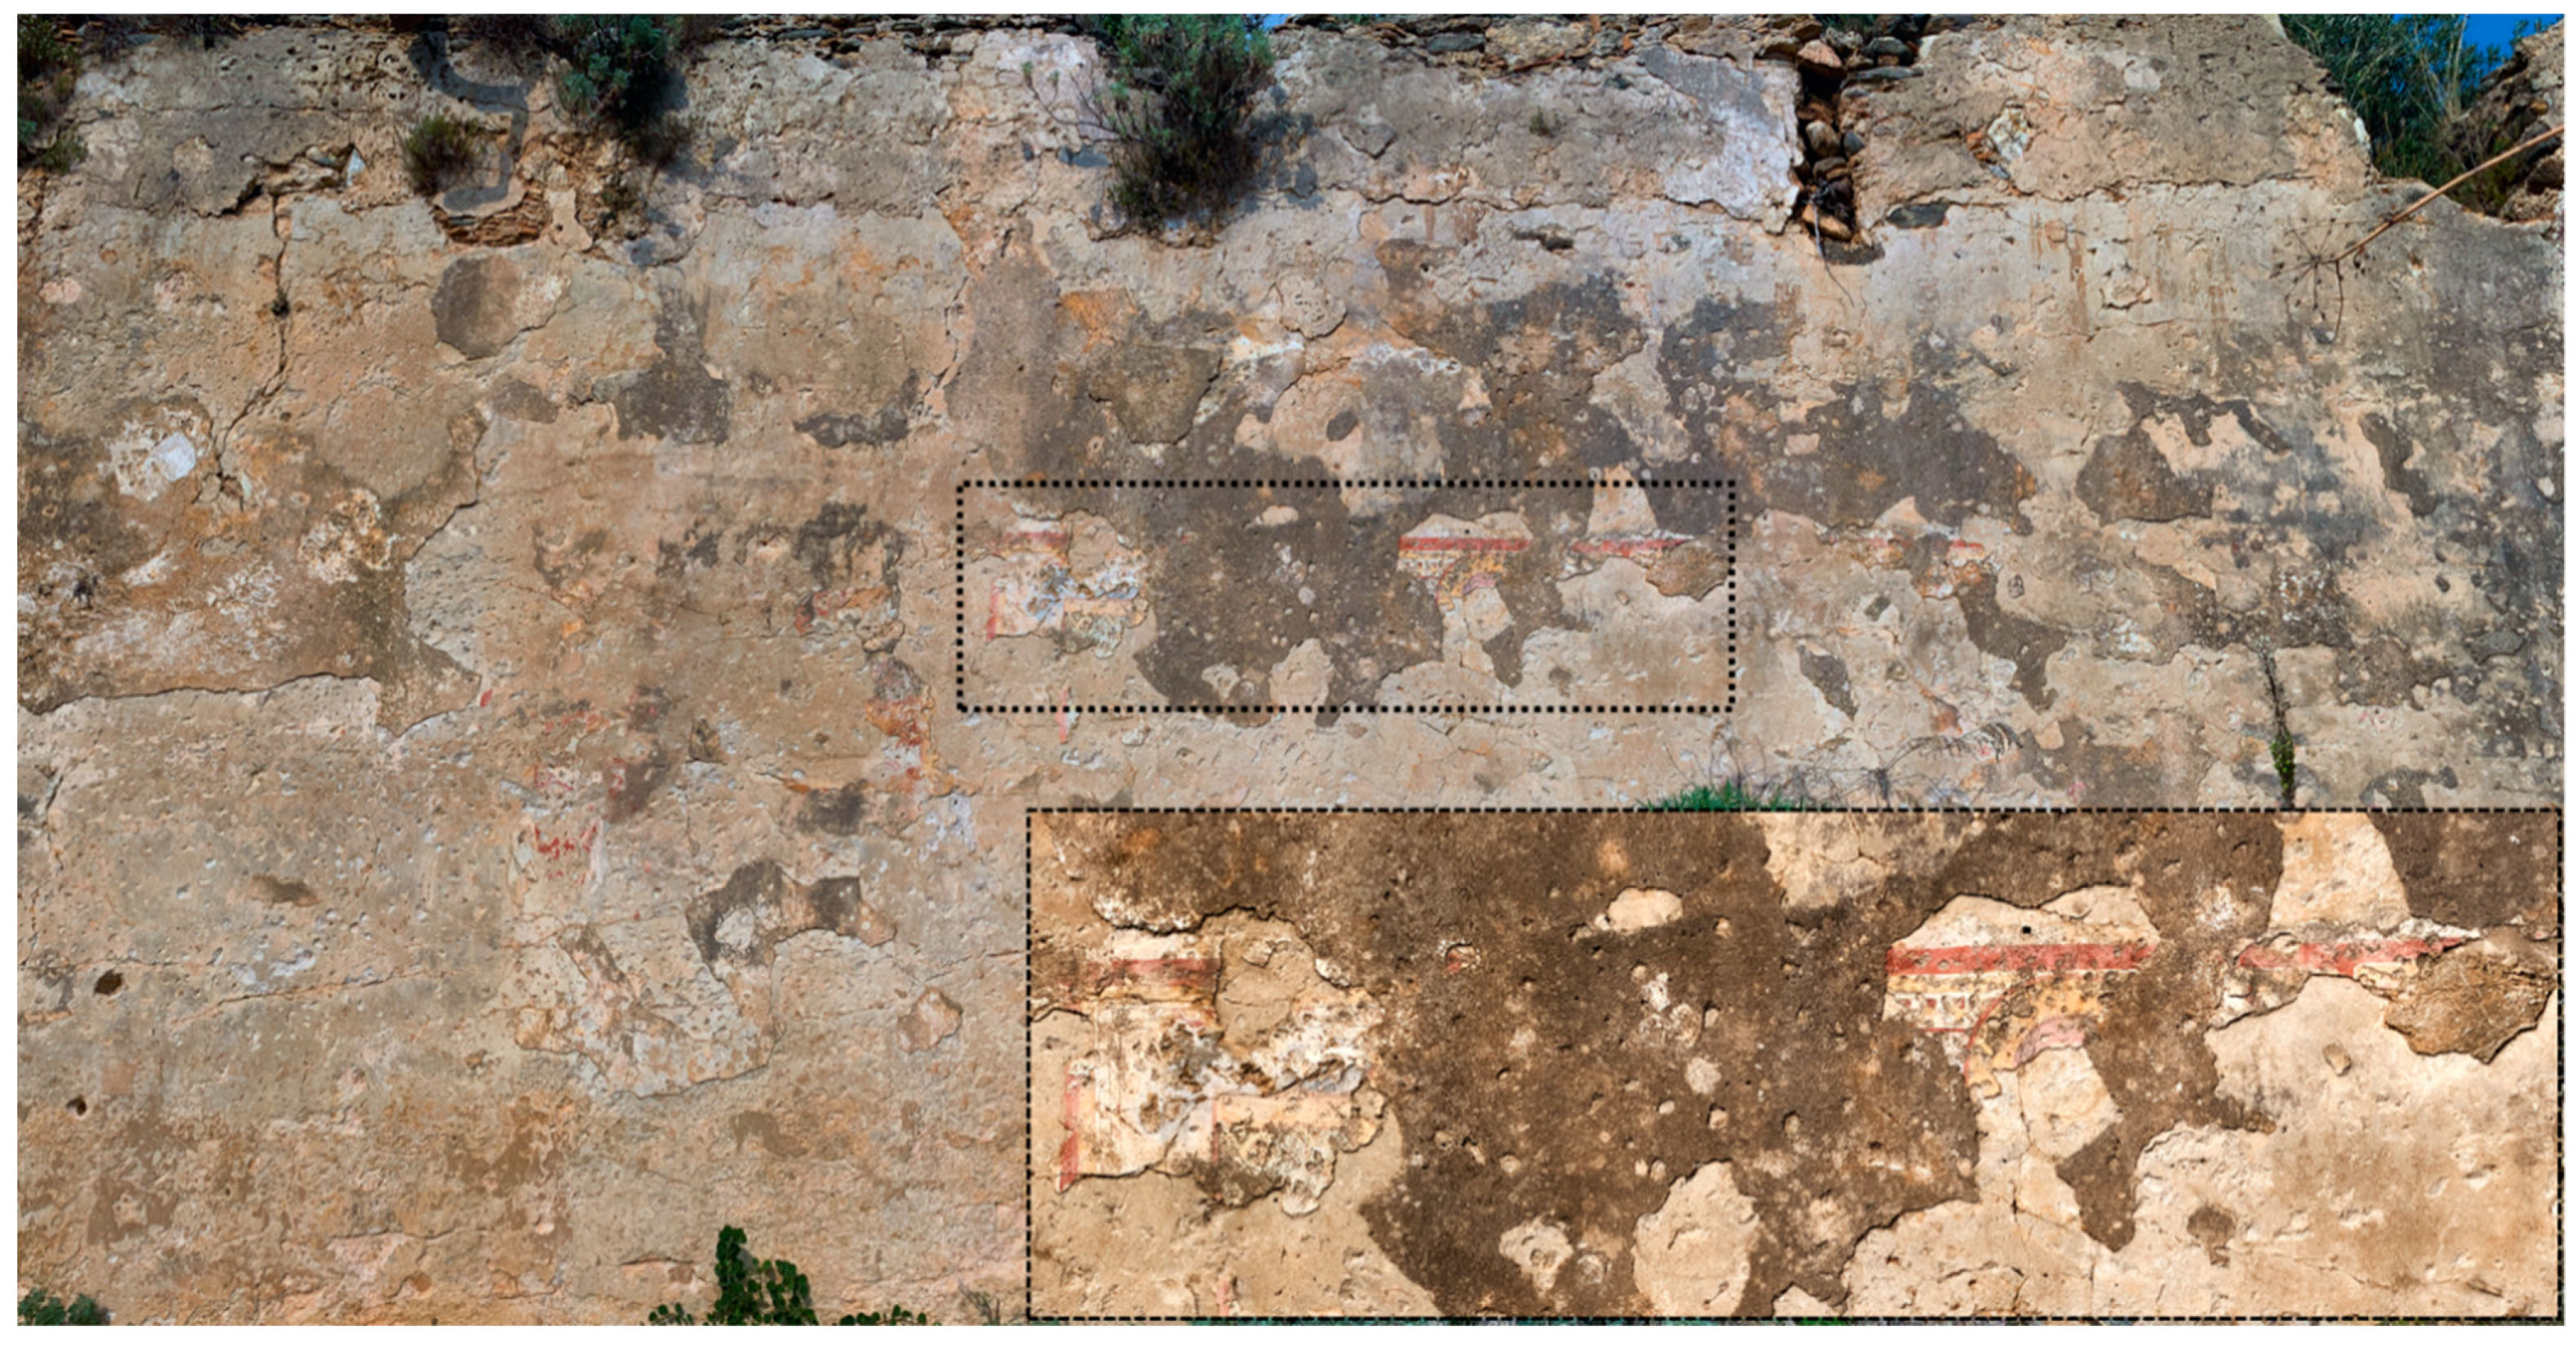
The great part of the southern nave wall is now missing, while, on the northern wall, a cycle of frescoes depicting a theory of saints (
Figure 8) is still visible; due to its bad state of preservation, in line with the general state of the church, the painted figures are undistinguishable. The frescoes, which recall the Byzantine tradition, were then covered by a layer of plaster, perhaps during the period of transition from the Greek to the Latin rite, historically dated to 1595.
The church was
ius patronatus (right of patronage), which means that it belonged to a noble family, the Mazzone, who had been granted the right to maintain and equip the structure with what was necessary for the celebrations [
10] (p. 72). In the chapel, on the left side where there is a heraldic coat of arms, some members of the family were in fact buried. Outside of the church there is a well for water supply with its canalization system. Some elements, such as the size of the perimeter walls, the particular shape, the floor in
opus signinum (‘cocciopesto’ made of tiles broken up into very small pieces, mixed with mortar) and the presence of a canalization system on the east wall, suggest a different original use of the building, which probably was transformed into a church only in a second phase. The archaeologist F. Cuteri argued that it was originally a big tank, which only in the late middle ages was turned into a church [
22]. An excavation carried out in 2012 under the direction of the superintendence of Calabria unearthed a monumental staircase that led to an underground room on the south side of the church.
3. State-of-the-Art Methods
As mentioned in the previous sections, we used a multi-methodological approach to create a topographic model of the hillfort using close-range photogrammetry to map all of the evidences and to create 3D models of the churches, characterizing materials through chemical analyses (by Raman spectroscopy) and monitoring the surfaces with thermal imaging. Three-dimensional metric documentation was combined with Raman spectroscopy and IR thermal imaging analyses for the study of the wall painting preserved in the chapel of San Basilio. The combination of different techniques guarantees a complete description of the artworks. In particular, if until a few decades ago the documentation of cultural heritage consisted only of hand measurements and drawings, nowadays researchers can count on a broad number of automatic and indirect survey methods based on portable and handheld devices, which are able to suit the various contexts and situations and to produce detailed digital twins of artifacts, thus saving resources and time during fieldwork. Among these, the most affirmed are the range-based methods, such as terrestrial laser scanning (TLS) and image-based scanning such as terrestrial and unmanned aerial vehicle (UAV) photogrammetry [
23]. The automatic survey is based on devices equipped with active or passive sensors, which are able to measure and record autonomously everything that falls within their “range of action”, providing metric and morphological details.
Photogrammetry is a survey technique based on the triangulation principle, through which a set of photos taken from different viewpoints are turned into 3D models [
24,
25]. The transformation of images into a 3D model is the result of a complex procedure involving specific computer vision algorithms (e.g., structure from motion) that are able to collimate common points from a set of convergent and overlapping photos and, thus, to reconstruct the position, the shape and the size of the scene taken in investigations [
26,
27,
28]. UAV photogrammetry is currently the most popular in architecture and archaeology, used to create digital maps, texture, 3D models, calculate volume and document historical buildings, thanks to the possibility of using low-cost instruments.
Laser scanning is a metric survey technique based on range measuring by means of the properties of electromagnetic radiations. Specifically, a monochromatic light beam emitted from a solid state or semi-conductor laser is used to measure the distance between a sensor system and a target, deriving three-dimensional coordinates (x, y, z) in the scene defined by the instrumental range of action [
29]. Depending on the different principles used for measuring the distances between the detector and the target, and for processing the signal, we can distinguish different types of EDM (electronic distance measurement) devices, differing in precision and each one suitable for a certain range envelope [
30,
31]: (a) triangulation; (b) time of flight; (c) modulation or phase difference.
The phase shift technology uses as a signal source a laser transmitter diode that, instead of sending discrete signals (as in time-of-flight technology), generates a continuous wave, which is processed to modulate the signal, typically using amplitude modulation. This, compared to time-of-flight systems, guarantees higher precision, in the domain of millimeters, and higher measurement rates, returning rich and detailed point clouds.
The current trend is to combine range-based techniques, such as laser scanning [
32], with image-based methods, such as digital photogrammetry [
33,
34], with the aim of getting the benefits of both techniques [
35,
36]. If, on the one hand, the biggest advantage of UAV-supported photogrammetry is the possibility of reaching the highest part of the buildings, then, on the other hand, the main advantage of the laser scanning technique is the direct creation of point clouds that define the object or scene: in photogrammetry, in fact, the point cloud can be produced after several processing steps. Another important difference is that, in terrestrial laser scanning, point quality and density are determined before scanning, while in UAV photogrammetry, the density of the points is decided in office work.
Moreover, there has been a growing tendency to use panoramic images (360° photos and videos) as the basis for the creation of highly effective immersive virtual tours [
37]. A virtual tour is a simulation of an existing location, composed by a sequence of images taken from different vantage point [
38]. Example studies on the 3D reconstruction of cultural heritage have been performed by merging image data with the output of a 3D laser scanner [
39,
40,
41]. Three-dimensional virtual tour technology has been increasingly used in the documentation and preservation of historic sites and monuments that are at risk of being razed or undergoing restricted public access.
Raman spectroscopy is an analytical technique that has gained attention as a molecular technique for the investigation of objects of art. In particular, the non-destructive properties of the method make this application suitable for the in situ analysis of artefacts [
42]. Thanks to the use of Raman spectroscopy, we can characterize the pigments and binding of paintings. It is well known that the study and characterization of pigments or ligand is a very interesting tool for cultural heritage field operators. The different materials used by artists have a particular chronology and the study of these can increase the knowledge about a particular culture or civilization; it can also be a support to define the technique used by the artist and aid the eventual restoration. In this case, we used the spectroscopy approach in order to detect the visible pigments.
Finally, infrared thermography is a close-range sensing diagnostic technique, whose use is now well-consolidated for the study of buildings, paintings and finds. It is a non-invasive and non-destructive imaging approach that uses a sensor in order to record the emitted infrared radiations from a surface, returning a thermal map (a raster where the single cells contain temperature values) [
43]. When the thermal emission of an object is monitored under natural conditions, it is referred to as passive thermography. The presence of strong or moderate local temperature differences, visible as anomalies on the pseudo-color image, can reveal the presence of different situations or problems in the surface or subsurface [
44,
45]. Specifically, its application in the field of heritage includes the identification of different materials in the same area of interest (original and replaced) that are invisible to the naked eye (as well as hidden defects), the assessment of plaster conditions, cracks and detachments, the documentation of moisture and other details useful to monitor the object surface or evaluate its state of decay, and the type of restoration and consolidation interventions to be applied. Moreover, thermal data can be recorded inside a database and integrated with 2D and 3D metric models inside a heritage GIS or BIM [
44,
45,
46,
47].
4. Materials and Methods
The multi-analytical method proposed in this research combines UAV photo-scansion and TLS methods [
48] for different purposes: the first was to generate a 3D topographic map of the hillfort and to enhance the topographical context to which the architectures belong; the second was to acquire a complete colored and metric 3D model in order to characterize the architectural features of the two buildings and extract 2D drawings, a 3D model and other media which can help the study, preservation [
49] and management [
50].
Moreover, Raman spectroscopy analyses were performed on the painted surfaces preserved in the aisle wall of the church of San Basilio in order to characterize the composition of pigments used in the three different paint layers. These had previously been subjected to IR thermal imaging acquisition.
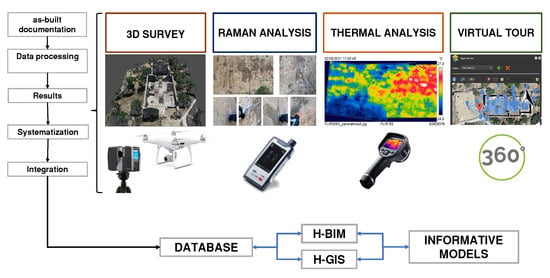
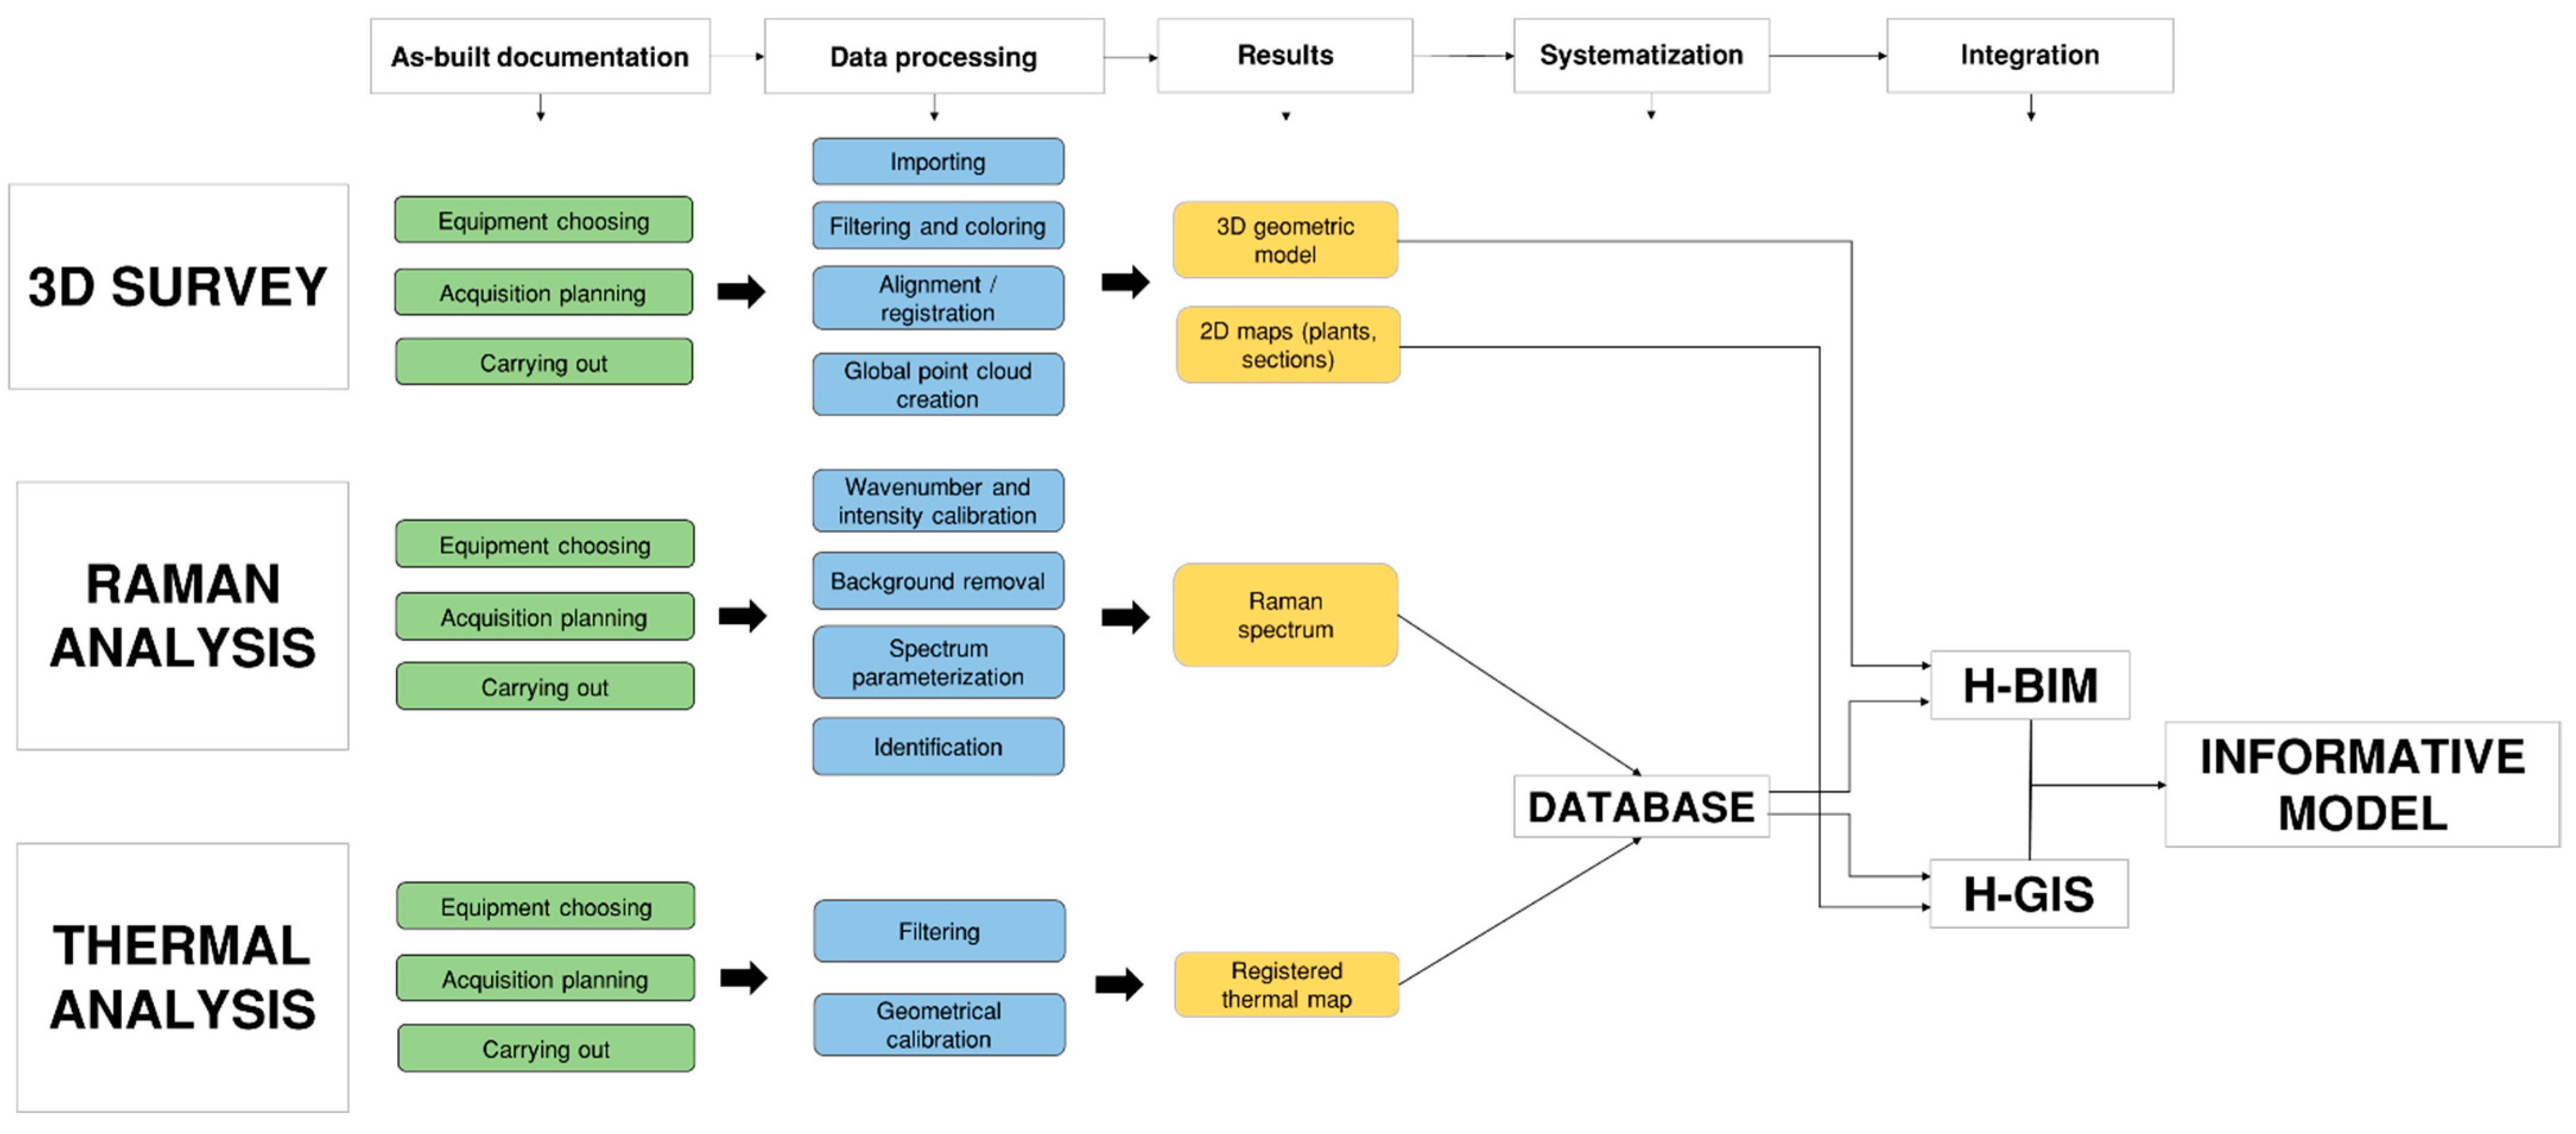
The flowchart (
Figure 9) includes three main steps that include many tasks:
Survey, i.e., as-built metric documentation and registration of existing state and features of the structures: for each technique, this step includes the choosing of equipment according to the goals of the survey project [
51,
52], the preliminary inspection and the acquisition planning and the survey performing.
Data processing (different for each technique used, as in
Figure 9).
Result visualization (extracting of deliverables and information).
Data systematization into specific geodatabase based on R-DBMS (relational database management system).
Data integration: the set of data collected from the different techniques, once systematized into a database, will be suitable for GIS or H-BIM visualization; in this environment, all the information needed to manage the building, the results of other analyses, etc., can be extracted.
The result is a type of database-based informative model, made up by attribute tables connected to the 3D geometries and suitable for query operations on different levels of details based on the kind of information required by the user.
4.1. Topographic and Architectural Survey Workflow
4.1.1. Equipment Choosing
For the photogrammetric survey we used a DJI Phantom 4 pro device, an aircraft composed of a frame, in which the engines, the electronics and landing gear are fixed. The device is equipped with electronic gyroscope, accelerometer, barometer, magnetometer (electronic compass) and GPS connected to the FCB (flight control board), which is the control unit to which motors, antennas and sensors are connected. The integrated RGB camera (20 MP in resolution) is installed on a structure that allows it to move independently from the drone.
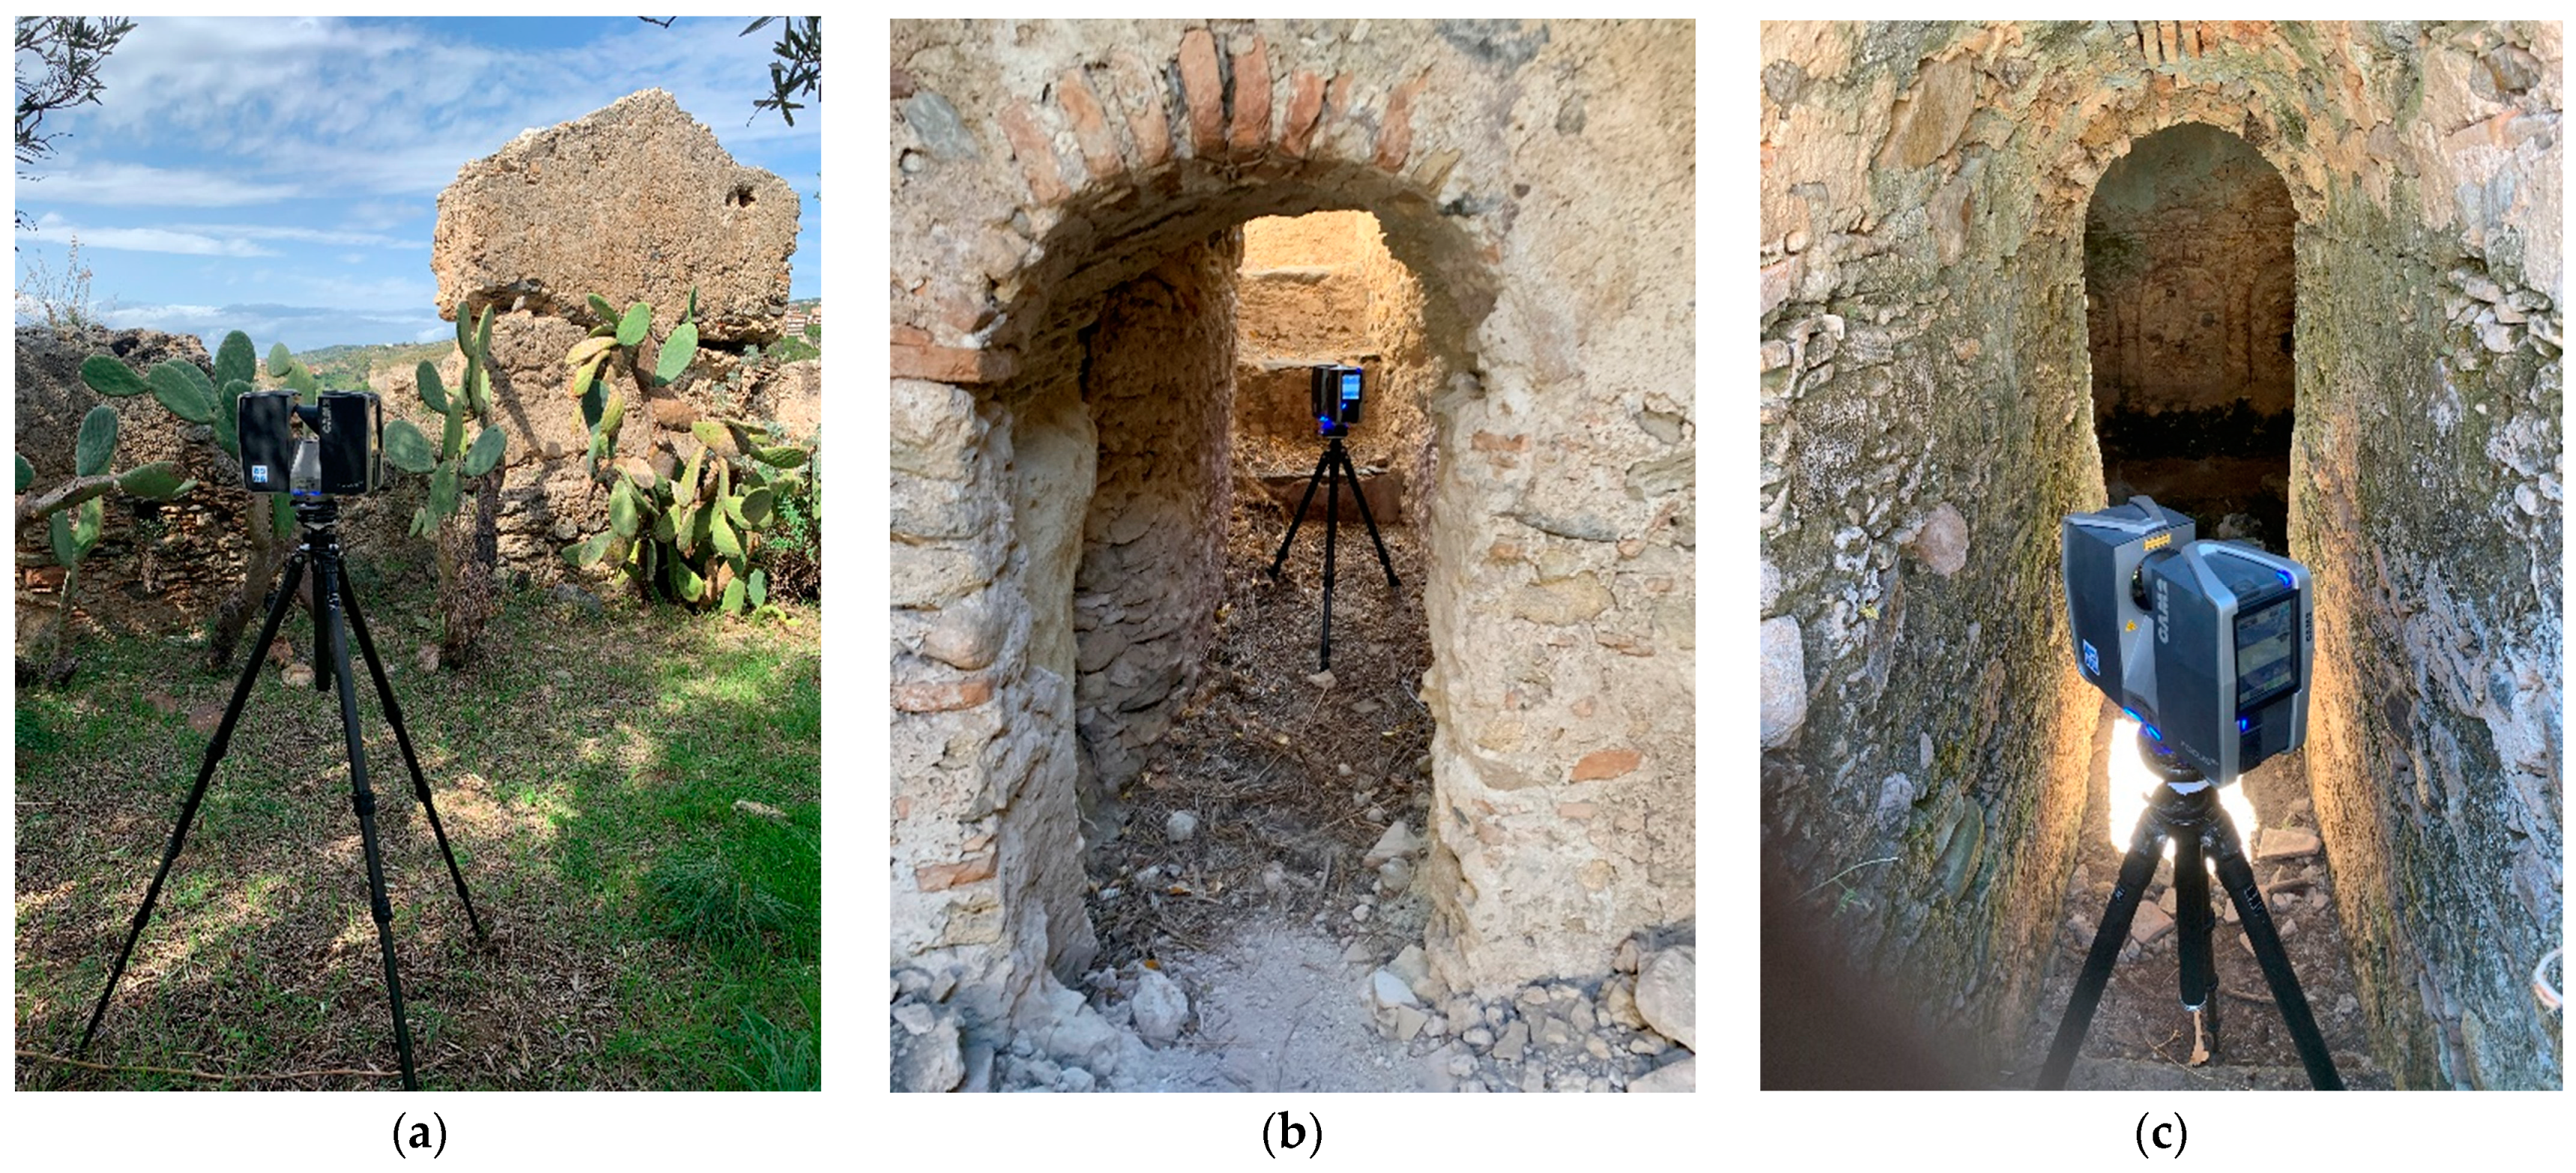
The architectural survey was carried out using the terrestrial laser scanner Faro Focus 3D S120: it is a phase shift digital device able to automatically acquire 3S spatial coordinates of a given scene (area, building or object) and to return three-dimensional photorealistic and metrically correct models [
53]. The instrument, equipped with motorized mechanical parts and a wide field of view (360° on the horizontal axis and 305° on the vertical), offers an operating range from 0.6 m to 120 m, with a linear distance error of ±2 mm between 10 m and 25 m [
54]. The acquisition speed can reach 976,000 points per second [
55]. The device has an integrated coaxial camera with a resolution of 70 megapixels, which allows photographing of images with the same reference system as the point clouds and to simultaneously associate RGB color values to each measured point. Miniaturization (5 kg weight) and flexibility of use of this laser scanner have favored its application in a wide range of contexts, including both internal and external scenarios.
Given the dimensions and the complex features of the buildings, with particular reference to the church of San Nicola, characterized by the presence of hypogeal burial chambers, the technical characteristics and the performance of the TLS FARO Focus 3D made this the most suitable instrument for this type of survey.
By the preliminary setting of specific parameters, which determine the scan quality and resolution (and, consequently, the scan times), the instrument records the 3D coordinates of all the points with which the laser beam interacts and generates a single TLS file per scan.
4.1.2. Data Acquisition
The fieldwork was carried out across five days (between June and October 2020) and organized into two sessions: the first involved aerial survey; the second terrestrial laser scanning. As preliminary task, a topographic survey of the hillfort (an area of about 6.5 ha) was carried out, with the aim of obtaining a georeferenced and metrically correct digital model from which to extract DEM (digital elevation model), contour lines, sections and 2D orthophotos. For this step, aero-photogrammetry, combined with GNSS (global navigation satellite system) positioning systems, was used according to an approach already successfully tested during other work [
36]. The flights for topography were carried out using a “double grid” scheme. The flight path was tested first on a satellite map using a specialized software (Pix4Dcapture App for IoS); then, we performed the UAV flight under manual control according to the present path. The topographical flight was made with the following parameters: camera position = nadiral; altitude = 40 m (from the square located in front of the Church of San Nicola); front overlap = 80%; side overlap = 60%. With these parameters, the area was covered with 302 images. Given the camera setup and the altitude, the GSD calculated for the topographic survey was approx. 1.10 cm/px. The structures of interest (San Nicola and San Basilio) were, additionally, documented combining convergent oblique and zenithal images, acquired according to a non-stereoscopic scheme, approximately 5 m off the evidence. This method made it possible to obtain, in a short time (compared to other techniques), a complete and detailed photographic coverage (because it was performed with low-altitude flights) of all the structures.
The first step for TLS data acquisition consisted of the planning of scan stations using as a support the plan of the two churches: the distance between adjacent scans depended on several factors, such as the presence of obstacles or elements that might interfere with scanning and the size of the scene (smaller inside the burial chambers). In order to guarantee the best alignment conditions, scans were acquired with enough overlapping. Artificial markers or “targets” were not used in the scanning process.
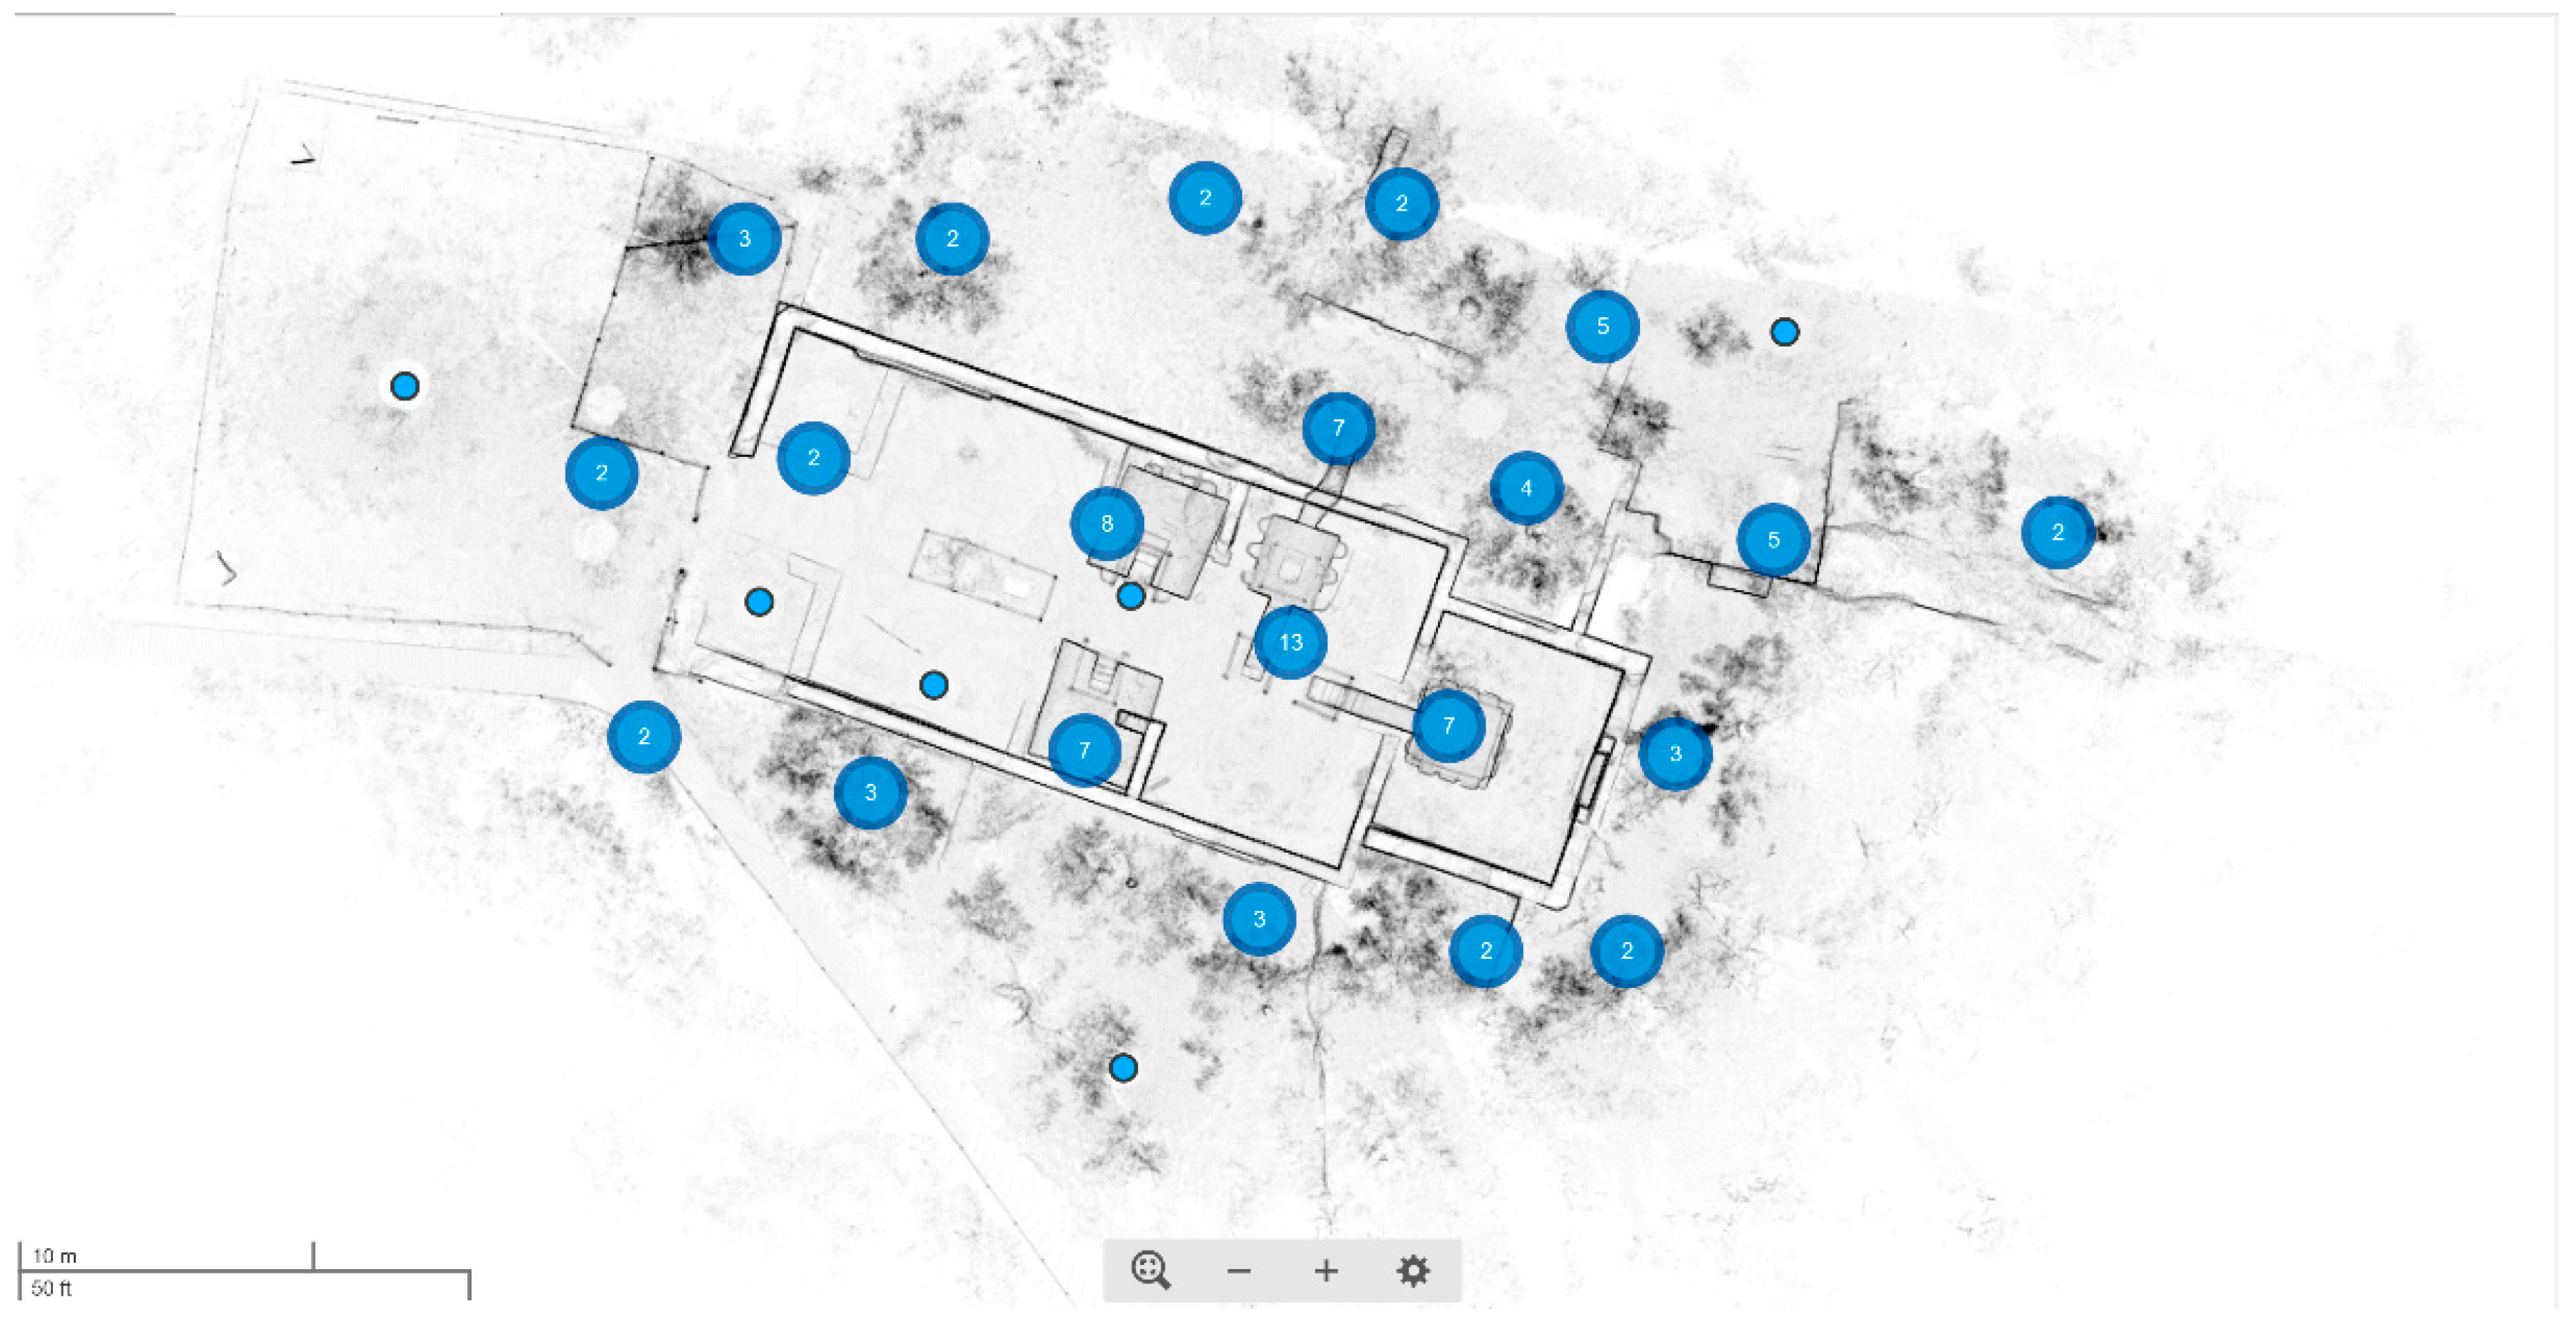
In order to cover the whole area of the Church of San Nicola (nave, crypts and external perimeter walls), 94 scanning stations, placed irregularly were needed (
Figure 10).
The laser scanner survey of the church of San Basilio was completed with 16 scans, which included the well located outside, in front of the current access. In this case, it was not possible to detect the elevations of the external walls of the naves and the presbytery due to the dense vegetation.
Different scanning parameters were used on the basis of the characteristics of the scene to be acquired: the survey of the external walls and churchyard was performed selecting a scan profile that allowed us to acquire data in external environments where distances from the scanner to the main objects of interest were less than 20 m; the nave, the presbytery and the crypts were, instead, acquired using a profile that allowed us to scan outdoors where the distances from the scanner to the main objects of interest were less than 10 m. The capture resolution varied from 1/5 to 1/4, and the quality was set to 4x.
The laser scanner survey produced a total of 110 scans, which covered the whole area of the churches of San Nicola and San Basilio: the dimensions amounted to 11.3 GB. These scans consisted of single blocks of three-dimensional point clouds associated with spherical images captured by the camera that was integrated with the instrument, capable of giving each acquired point the RGB colorimetric data.
The northern internal wall of the nave of the Church of San Basilio was subjected to a further photogrammetric survey in order to record updated information about its state of conservation. The fresco is, in fact, in a very bad state of conservation and even with the naked eye it was possible to notice several problems of detachment of the laying plaster layer. The wall is perpetually exposed to bad weather, atmospheric agents and changes in climatic conditions. In this regard, 25 shots were taken to cover the fresco along the wall.
4.1.3. Data Processing
The data processing took place in the laboratory “Ar3DigiLab”, located inside the IPCF-CNR of Messina. A high-performance computer, equipped with a 4 Gb graphics card, a processor Intel (R) Xeon CPU E5-2620 v4 (2.10 GHz) and 32 GB of RAM was used. According to the different types of acquisition, the following software were used:
- -
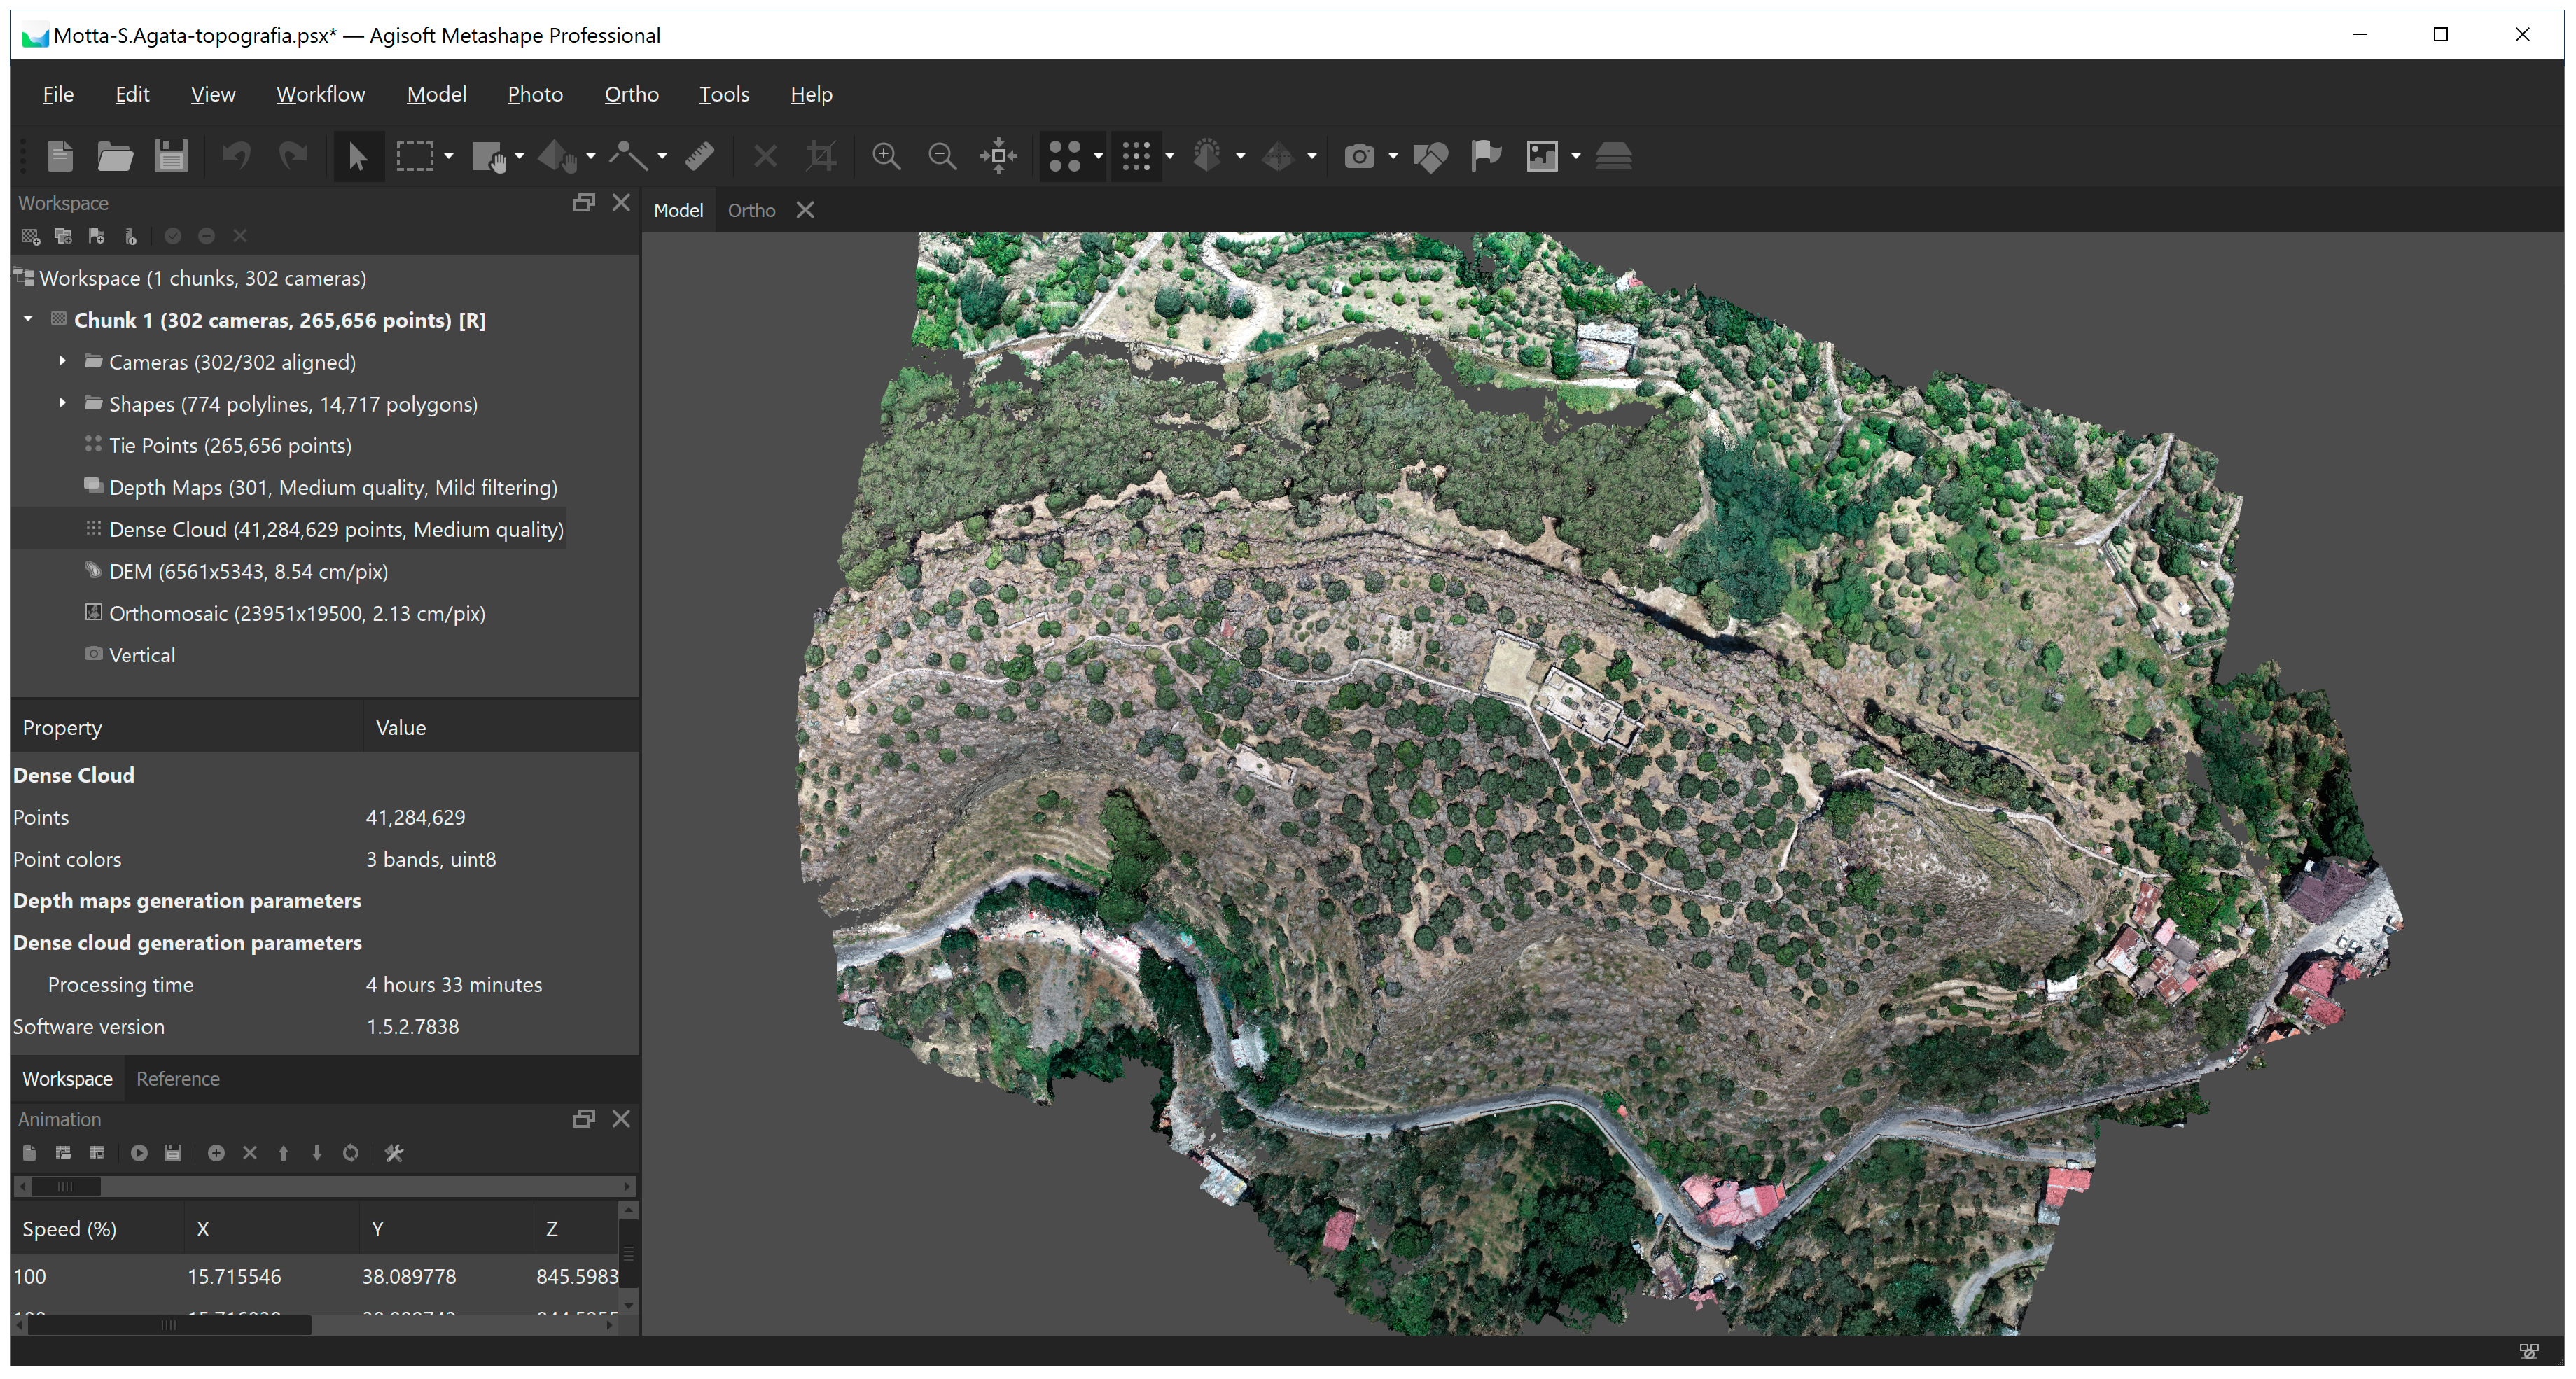
Agisoft Metashape v. 1.5.2, for photogrammetric data processing.
- -
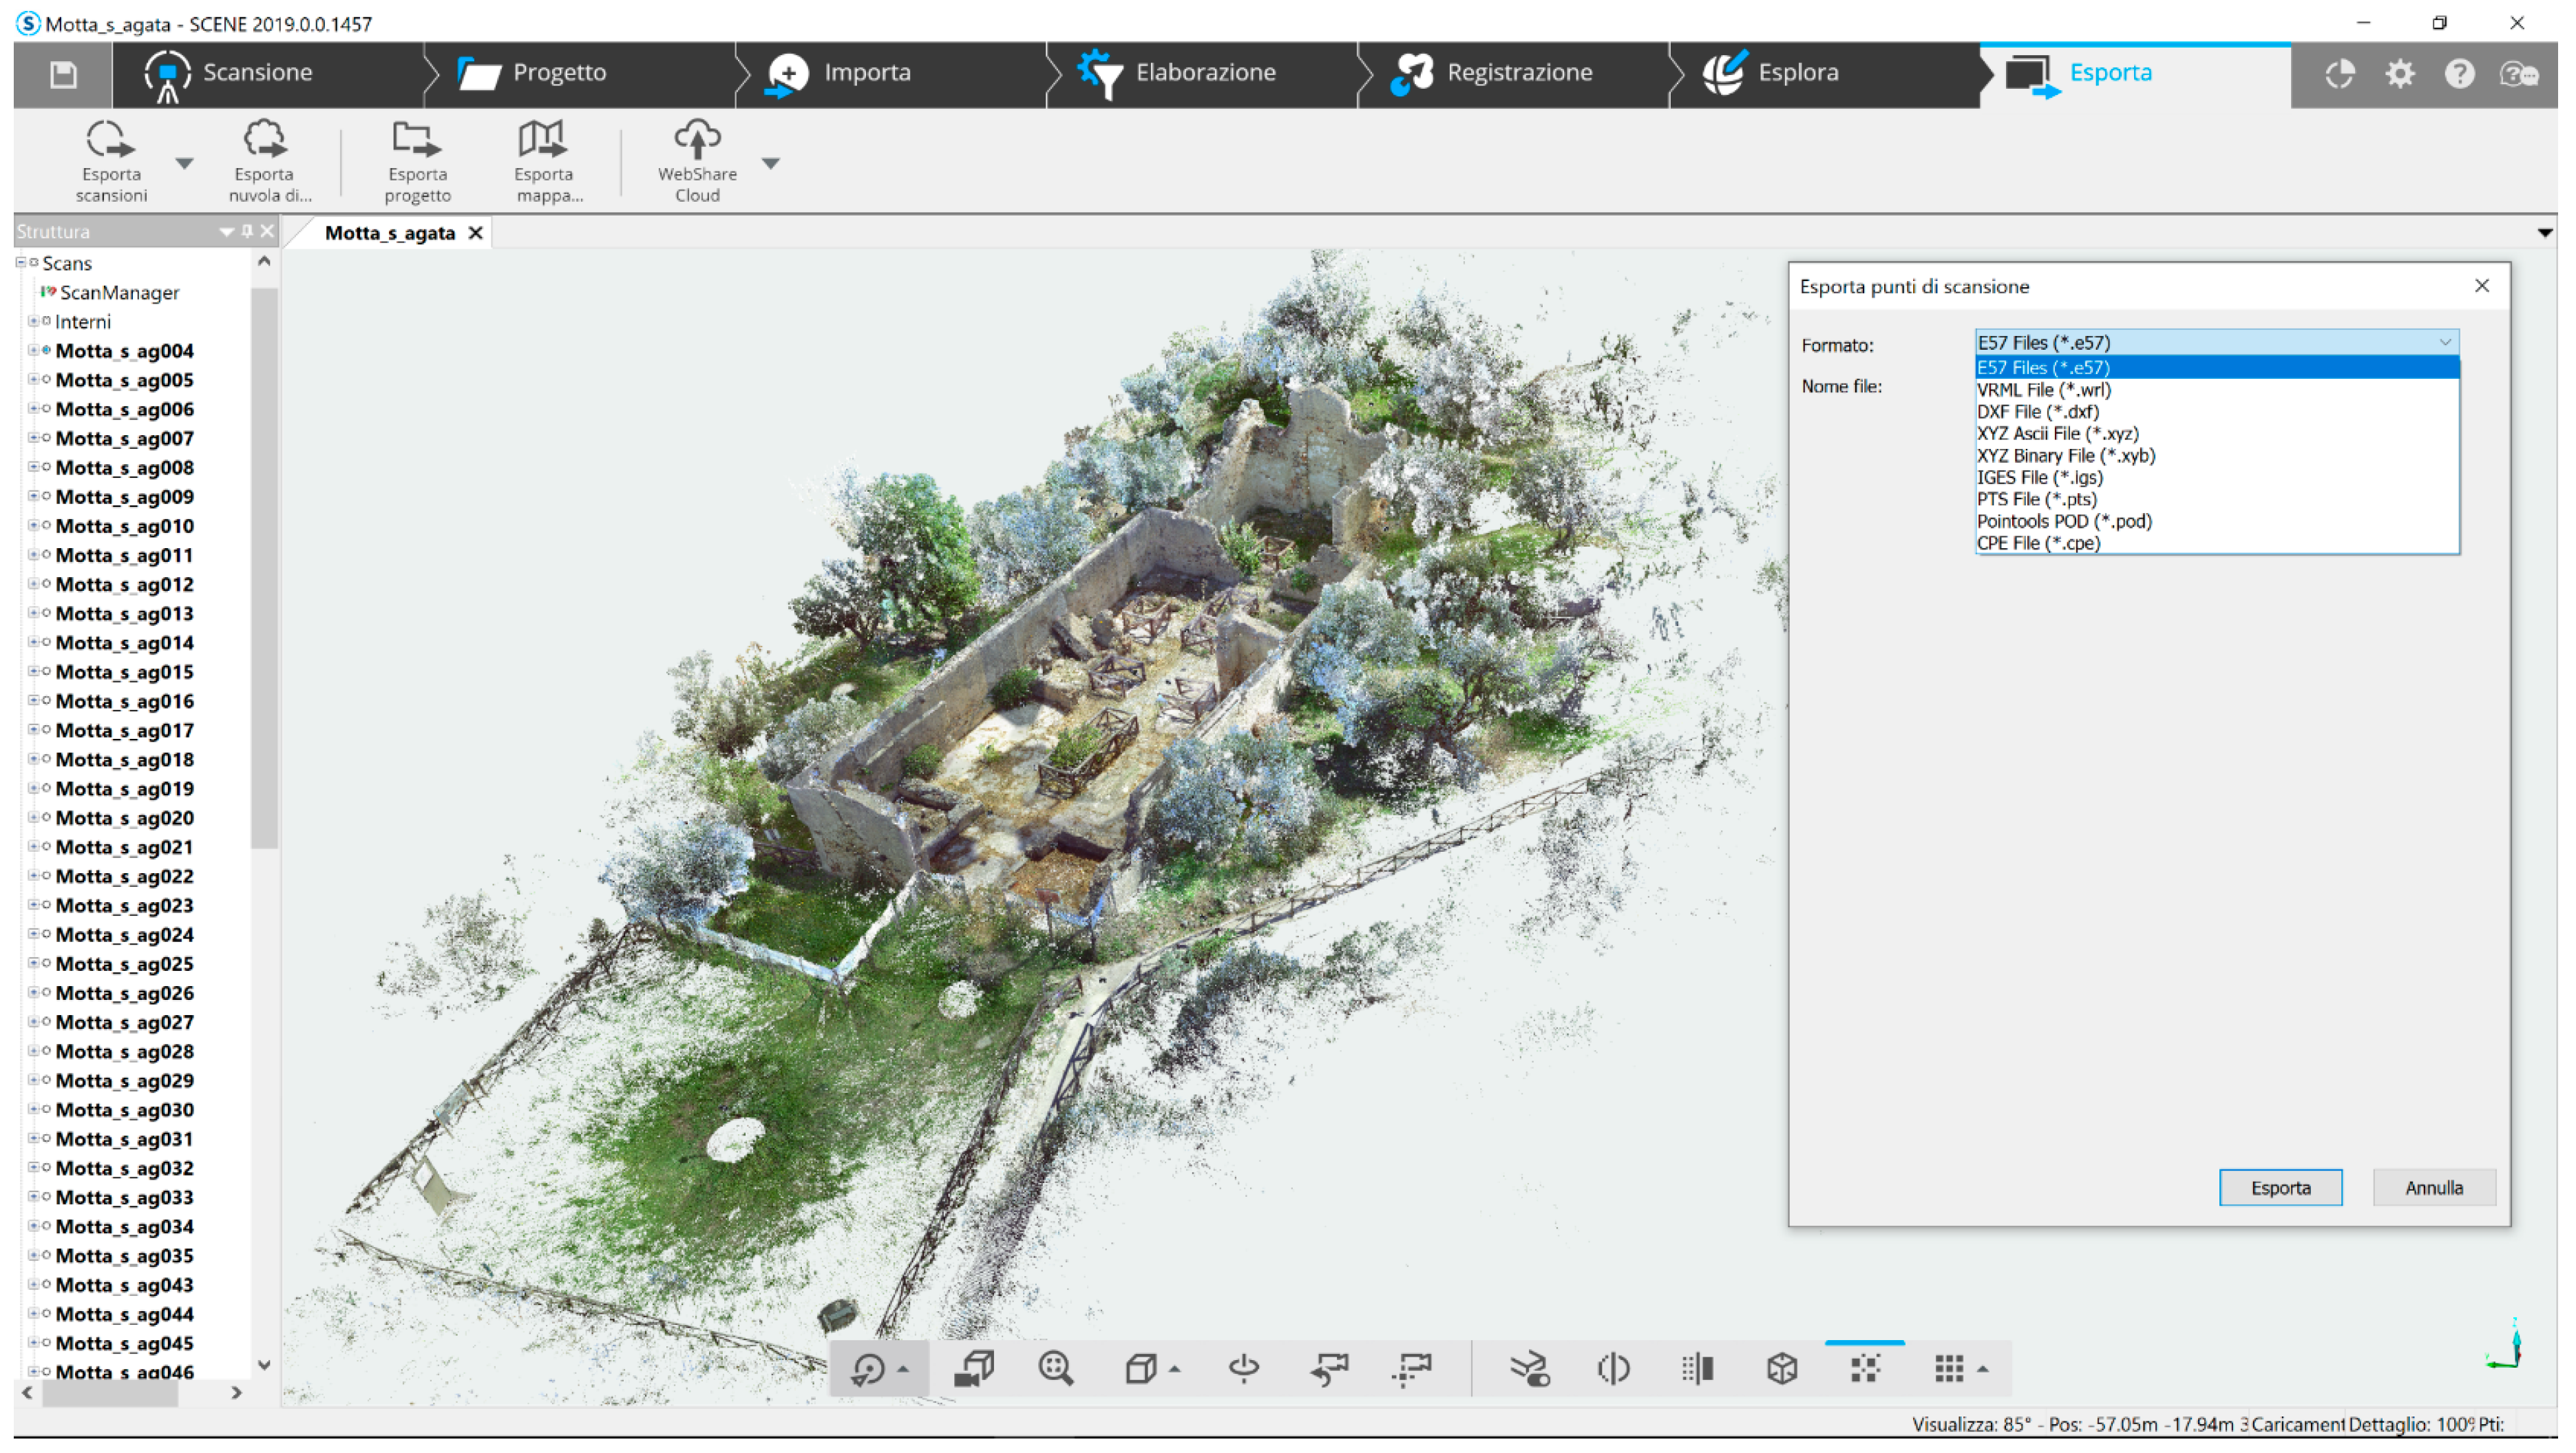
Faro Scene versions 2019.0.0.1457, for TLS registration and processing.
- -
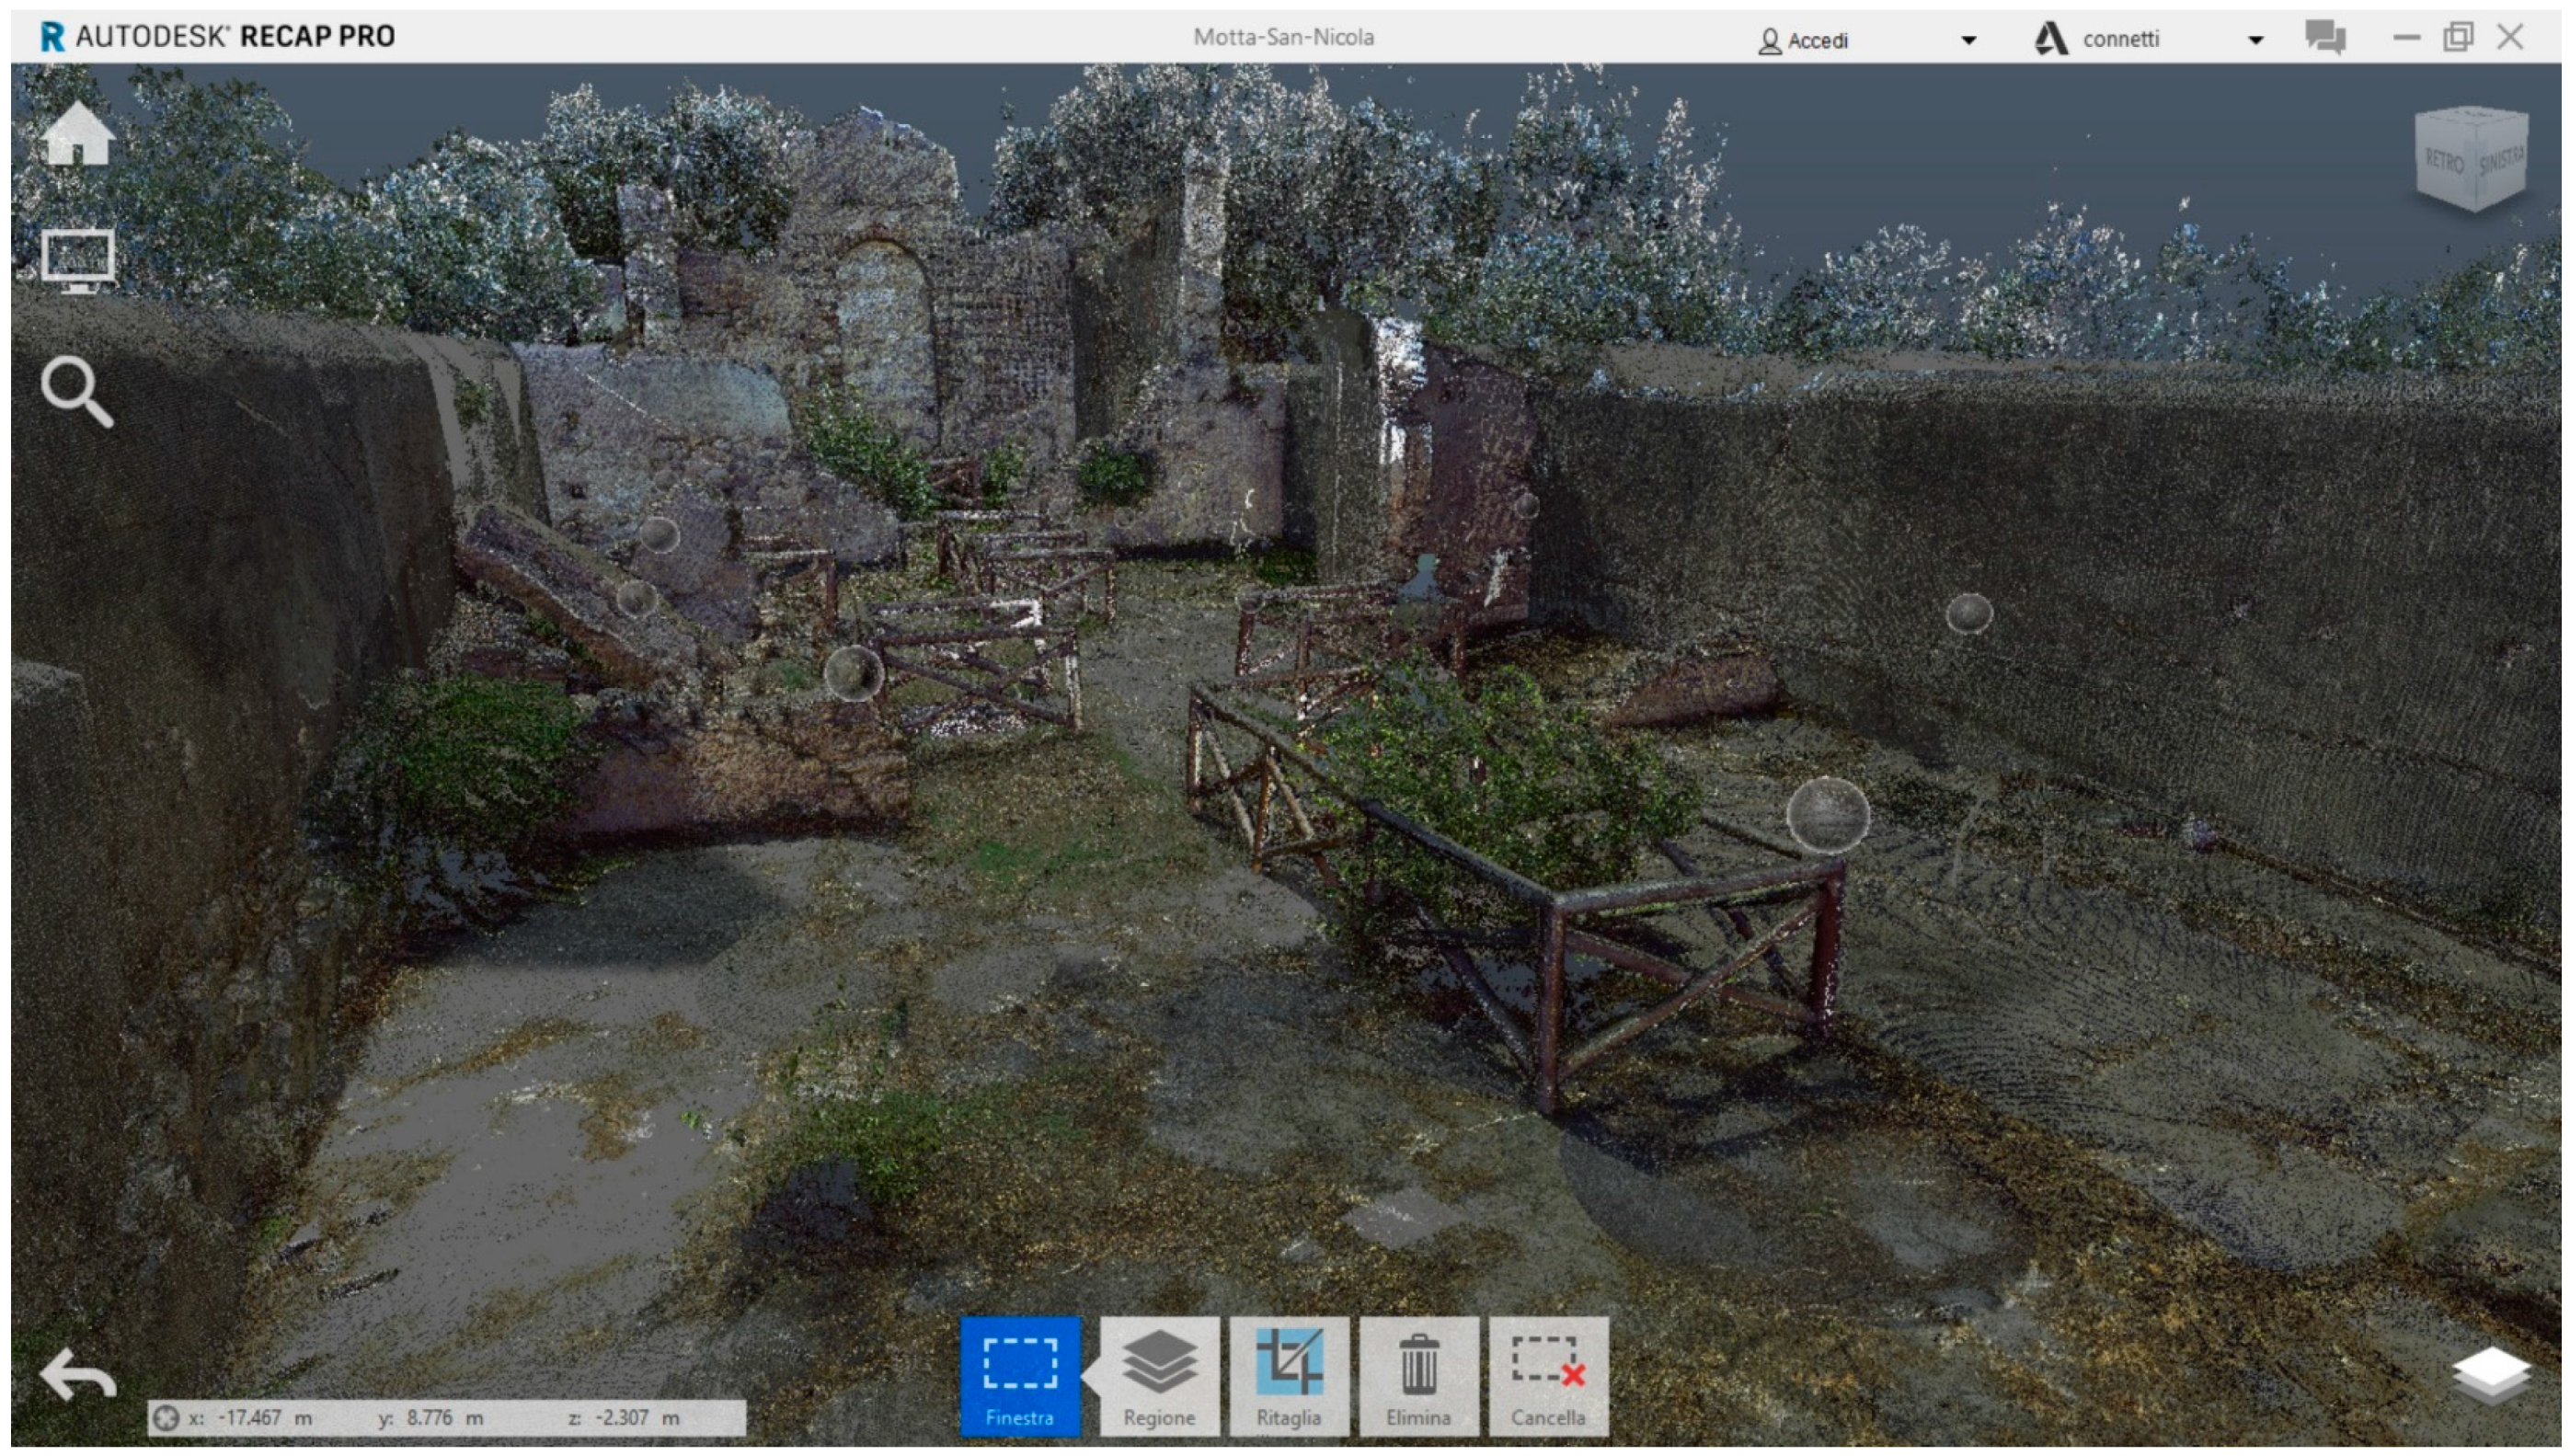
Autodesk Recap Pro v. 6.0.0.123, for scan-to-BIM process.
- -
GGnome Pano2VR v. 6.0.6, for the creation of virtual tours: in particular, it allows to import the spherical photos acquired by the camera integrated with the Faro scanner and export the final projects in HTML5, a data format that can be used as a web page from any browser and from any device.
Agisoft Metashape was used in order to process the UAV images. The procedure included several phases: (1) Preliminary calibration of the camera using Lens, an Agisoft® plug-in; (2) Alignment; (3) Creation of dense cloud (medium quality); Mesh creation; (4) TIN (Triangulated Irregular Network) model extracting; (5) Texture application; (6) DTM (digital terrain model) calculation (only from ground points); (7) Vector contour lines calculation with 1 m of equidistance; (8) GeoTIFF orthophoto (reference system WGS-83/UTM 33N) production and exporting.
From the photogrammetric project it was possible to extract orthophotos, corrected and georeferenced aerial photography, 3D models and sections and plans of buildings.
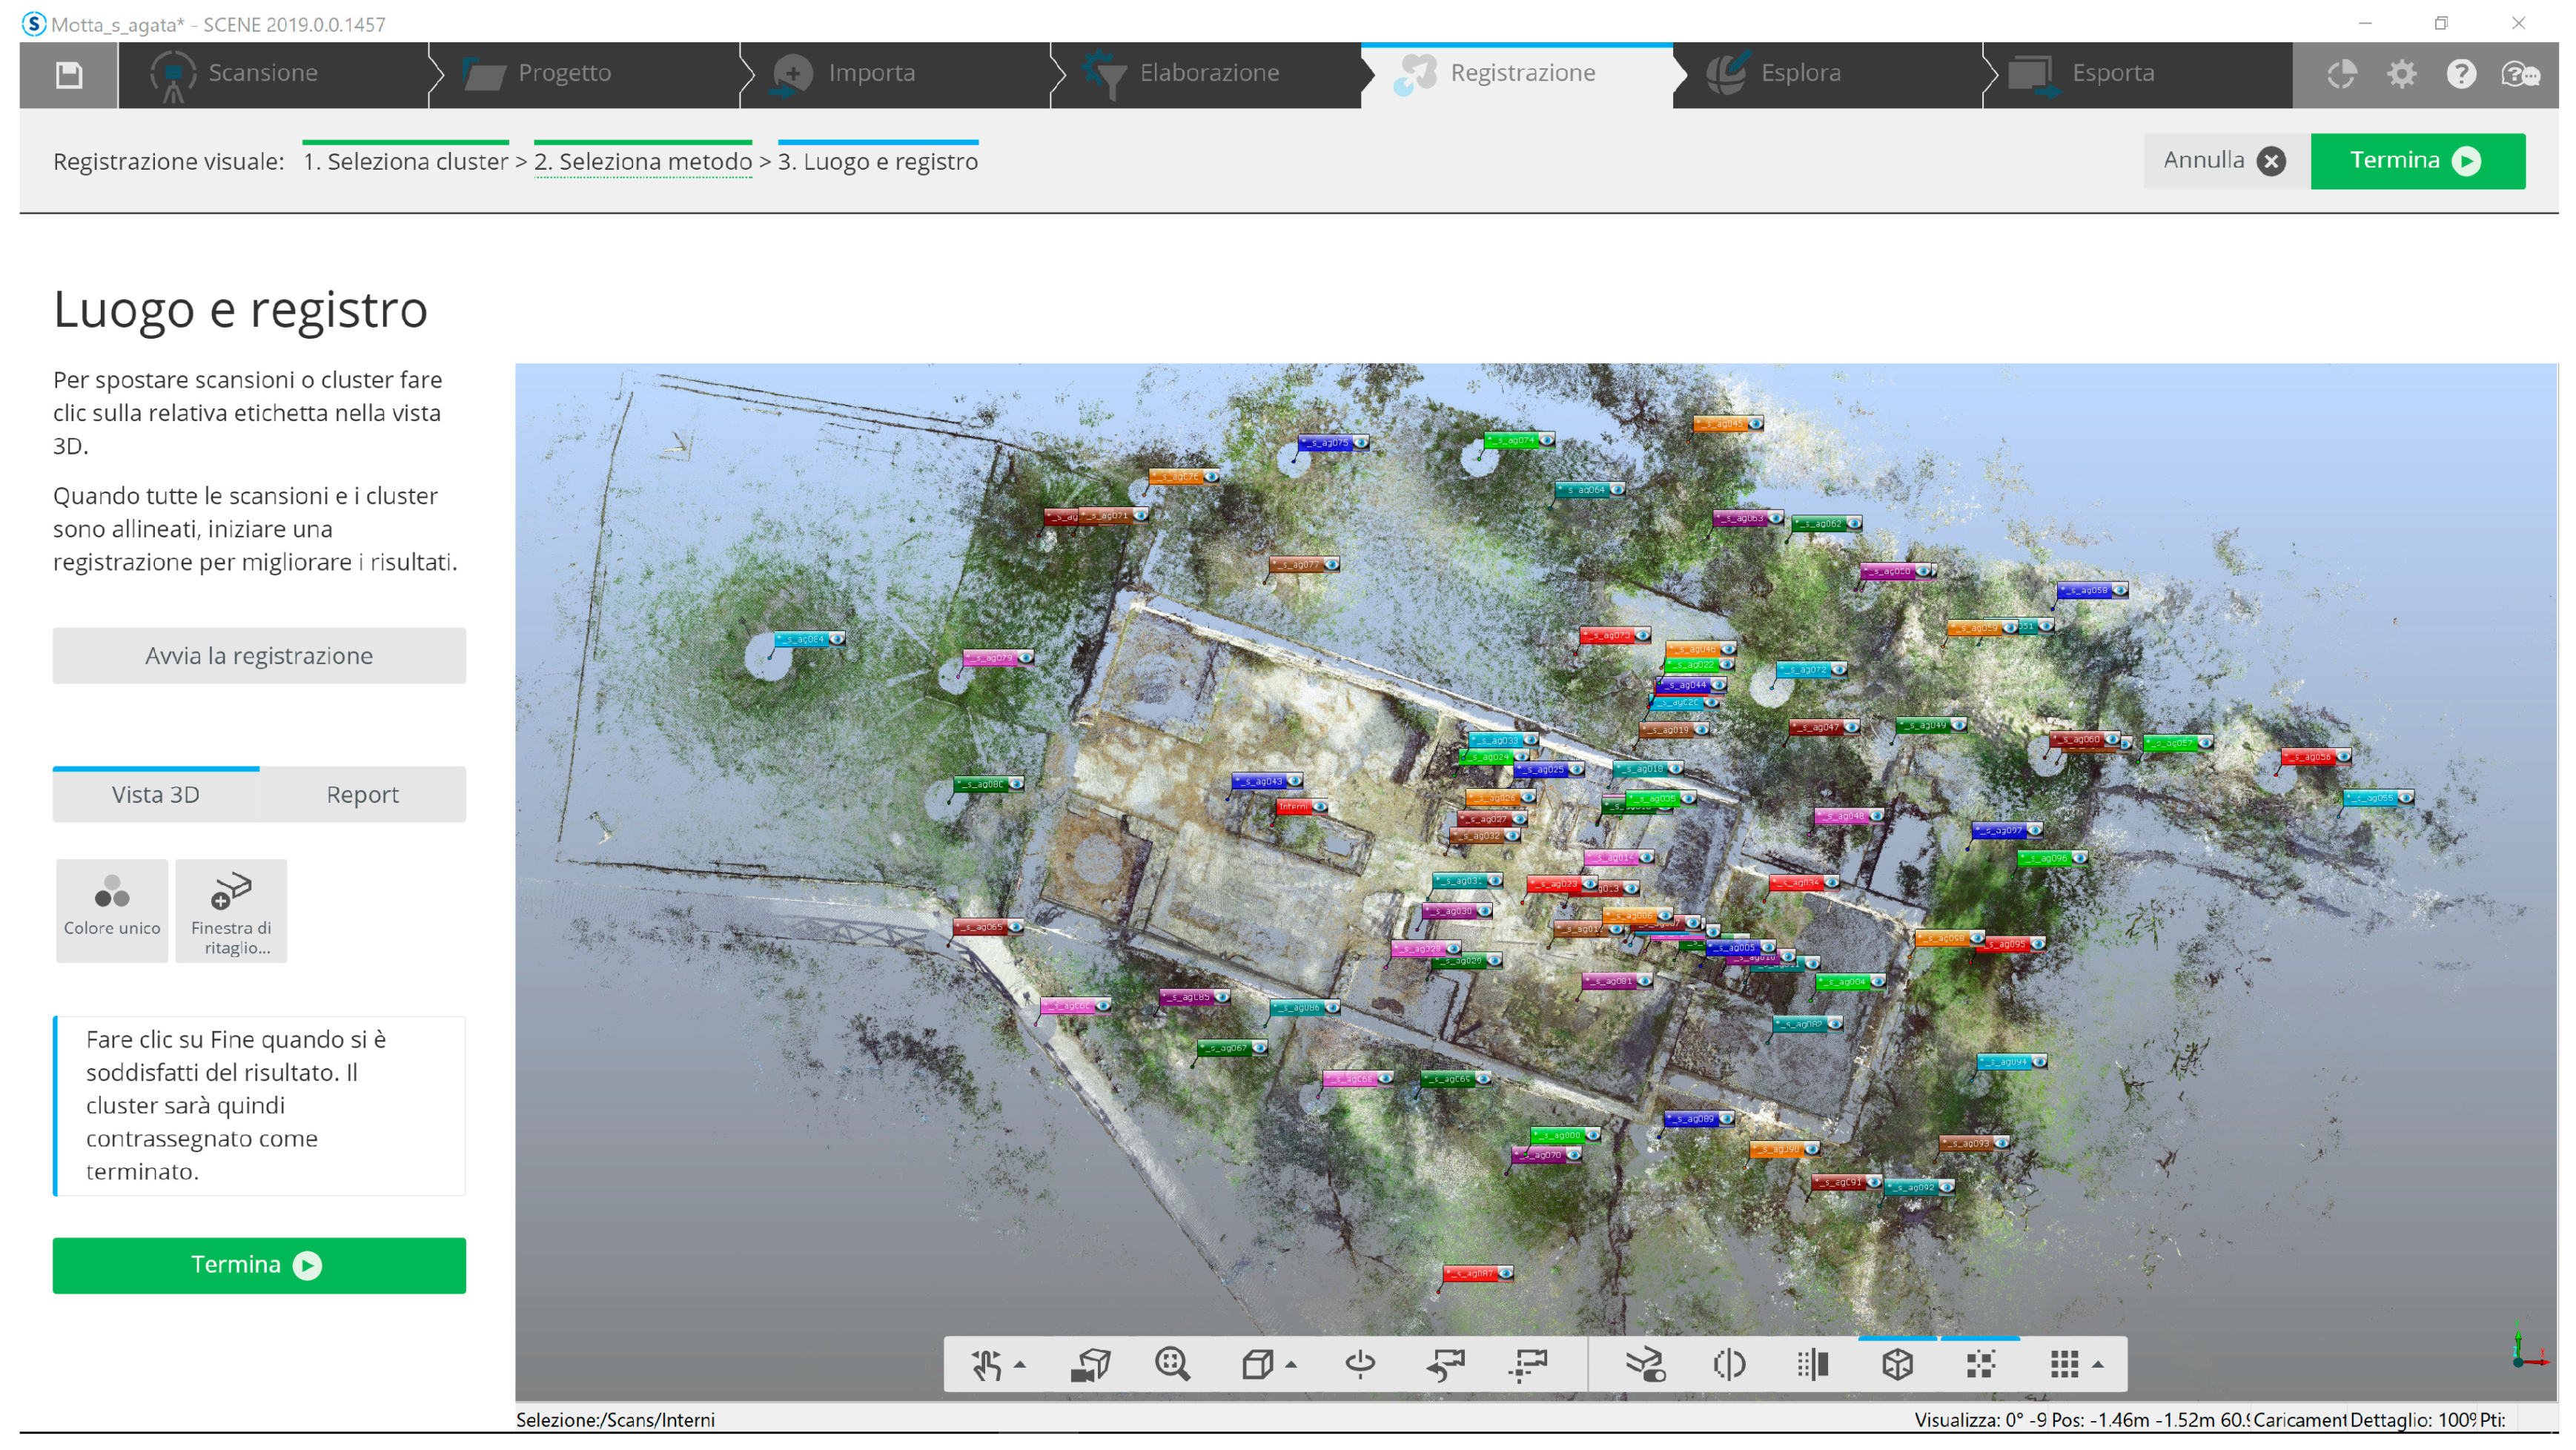
The TLS scans acquired during the field survey phase were uploaded into FARO SCENE (Figures 13 and 14). This program, in relation to the instrument used, represents the most efficient solution for data processing and management and the creation of high-quality color points.
The workflow included the following stages:
Importing and automatic filtering for the elimination of points with reflectance lower than a certain preset value that could interfere with the readability and reliability of the obtained geometries.
Coloring: in this step an RGB color was associated to each point, generating a realistic view (
Figure 11 and
Figure 12).
Manual alignment and automatic location. In SCENE, three different registration methods can be chosen: cloud to cloud, target and survey points. The first is performed using homologous points between scans to roto-translate point clouds in at least two scan frames in the same reference; it requires at least two scans with at least 40% overlap between each other. In order to facilitate the processing phases, the files were grouped into several project folders (clusters). A first approximate manual alignment was performed for each cluster: the individual clouds were overlapped by recognizing pairs of corresponding points in the common areas between one scan and another. In this case, reference was made to clearly distinguishable points (e.g., the edges of the detected space) both in plan and in section. Only later was the automatic placement of the scans performed according to the following settings:
- -
Placement mode: cloud to cloud
- -
Maximum number of iterations: 30
- -
Maximum search distance: 10 m
Then, an optimization of the placement of the individual scans was carried out; with this step, the noise reduction compensates for the scanner error by moving the points to the statistically correct positions resulting in a more uniform arrangement of the points. At the end of this operation, the program generates a report that provides the minimum and maximum error and its deviation. Only when the process returns to green and the maximum error falls within the tolerance threshold is the result obtained considered satisfactory.
Overall optimization. The placement and optimization processes were applied globally in order to reduce the maximum error below the acceptable limits (
Figure 13).
Creation of the overview map. Finally, for each project, a “panoramic map” of the model was generated through the specific function in the workspace. This map, which can be exported in raster or vector format, represents the different scan locations through marker clusters (
Figure 14).
Switching to Autodesk ReCap (
Figure 15). Autodesk ReCap software (
Figure 16) was very useful in the process of management of the point cloud as well as a viewer of the final products. In this environment it was possible to intelligently clean and treat the point clouds already registered to optimize the modeling.
4.2. Raman Spectroscopy Workflow
A next-generation handheld Raman Spectrometer (BRAVO), manufactured by BRUKER, was used to collect Raman spectra in situ. In many cases, raw material validation by Raman spectroscopy is not allowed due to fluorescence phenomena. The instrument uses a patented technology (SSE—sequentially shifted excitation, patent number US8570507B1) [
56] to mitigate fluorescence phenomena, and it is equipped with two excitation lasers with wavelengths (DuoLaser) centred at 785 and 853 nm [
57]. Lasers work together to mitigate the fluorescence, and it is not possible to separate them by means of the experimental setup. Spectra were collected in the 300–3200 cm
−1 range, the complete range for Bruker BRAVO, in automatic setup mode, and, subsequently, the identification of Raman shift was made by comparison with a spectral database of reference materials. However, it is important to highlight that with BRAVO, we could not register a signal under 320 cm
−1 because of the limit of the detector. For this reason, pigments with Raman bands less than 300 cm
−1 could not be detected.
Raman spectra on samples were acquired using an HR800 micro-Raman spectrometer (Horiba Jobin-Yvon, Grenoble, France). Spectra were excited by the 632.8 nm He–Ne laser line, employing 600 lines grating and a 50x long working distance objective. Laser energy density and integration times were chosen in order to maximize signal-to-noise ratio and to avoid sample degradation. The spectra were collected in the 300–3500 cm
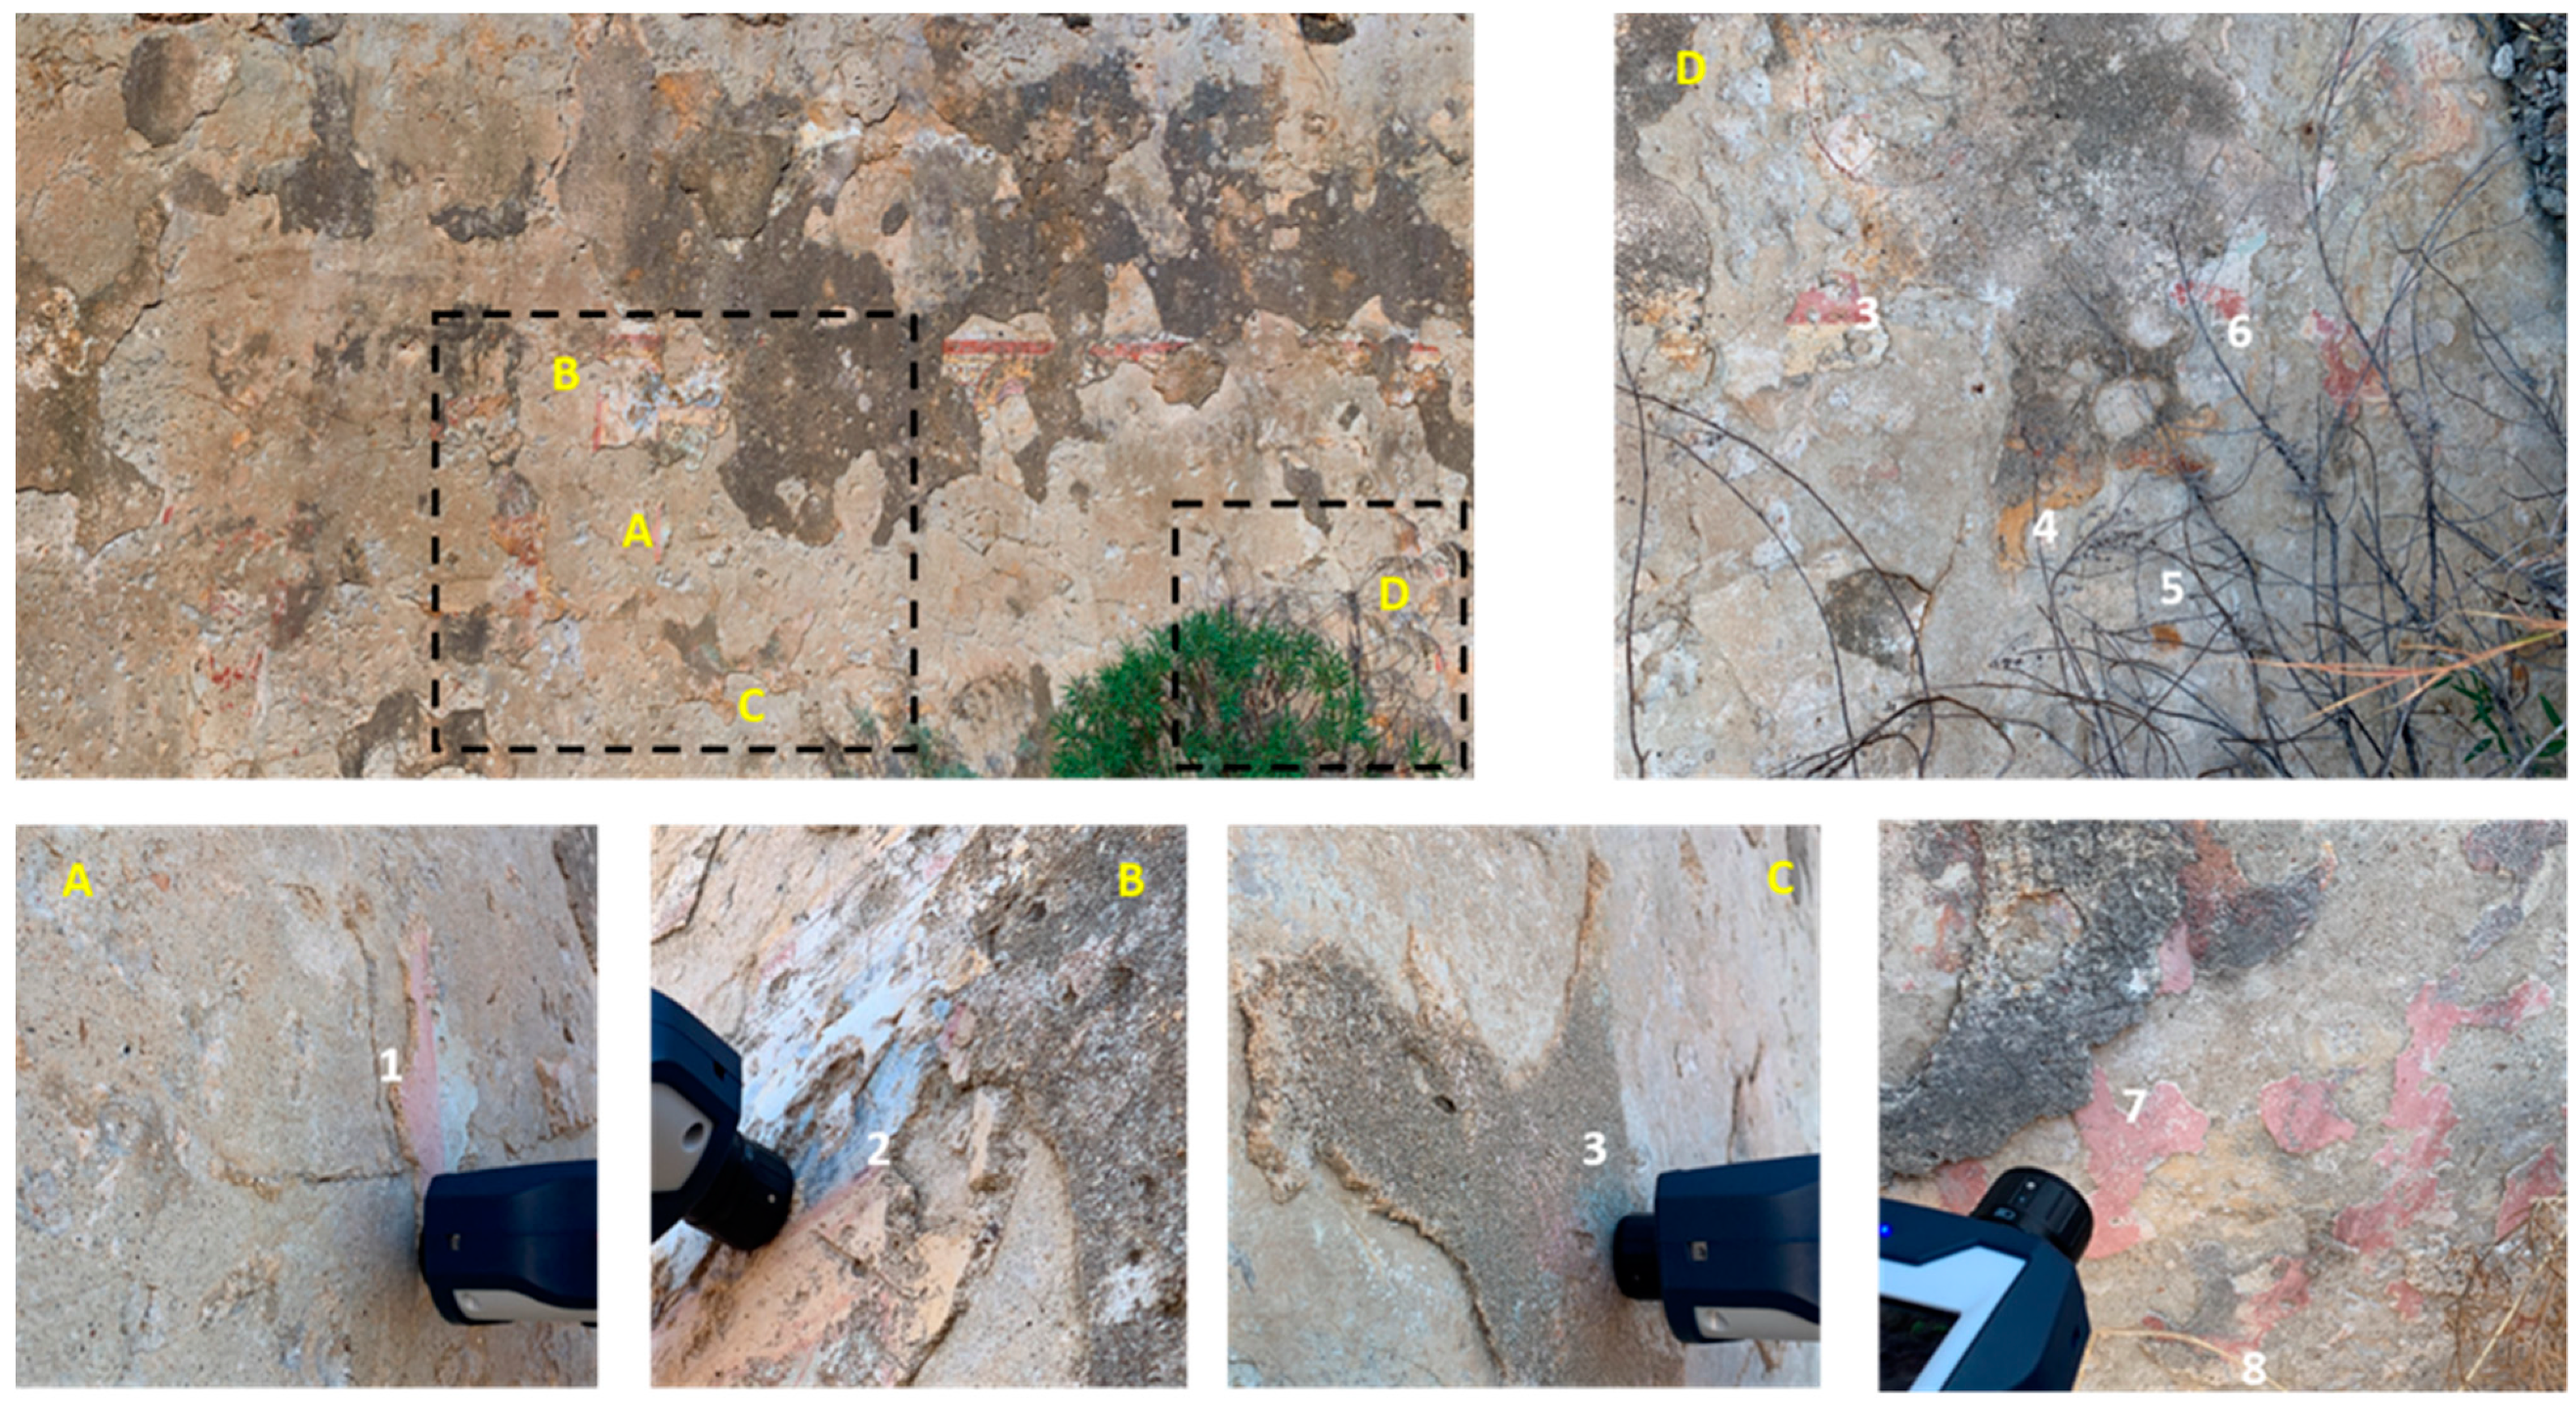
−1 range with integration times no longer than 60 s. On site measurements were performed on about 10 points (
Figure 17). In relation to the non-movable nature of artworks, the measurements are necessary in order to characterize all different areas without a large number of withdrawals. In general, the best strategy is the application of portable/handheld instrumentation to obtain results in situ and complement them with a limited number of samples. In our study, in order to obtain information about the pigments, some detached samples were analyzed by in lab instrument.
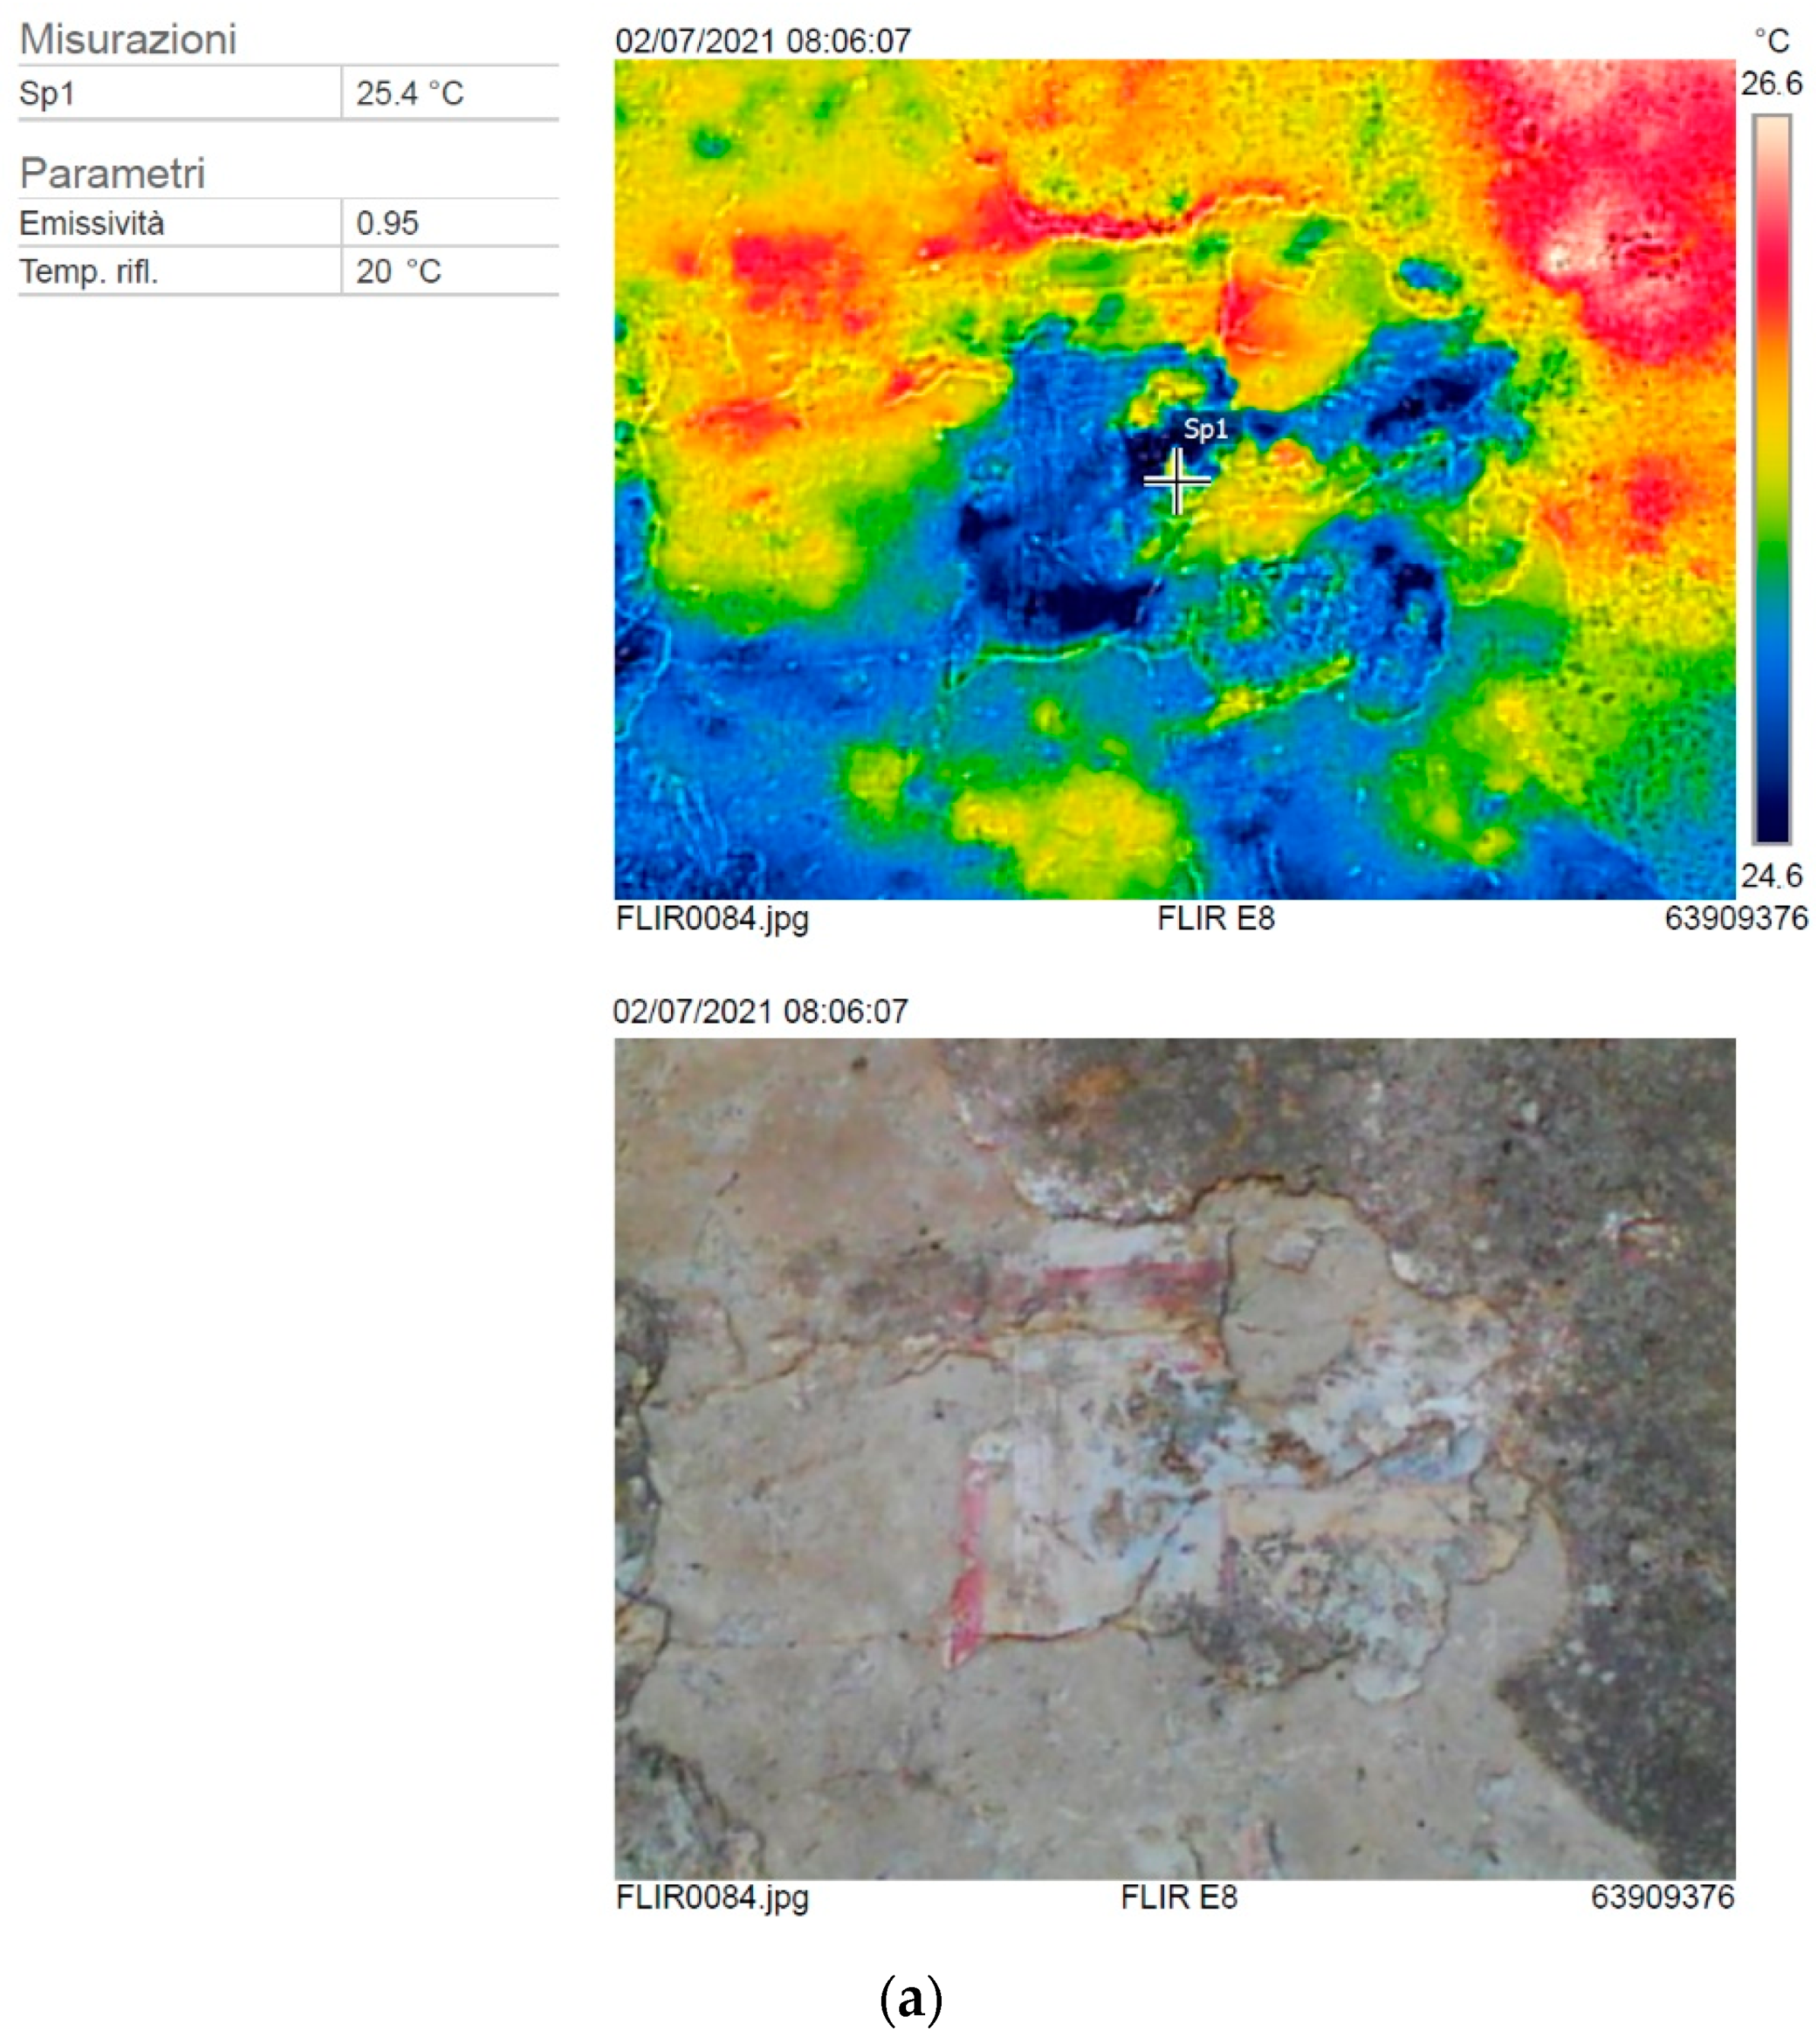
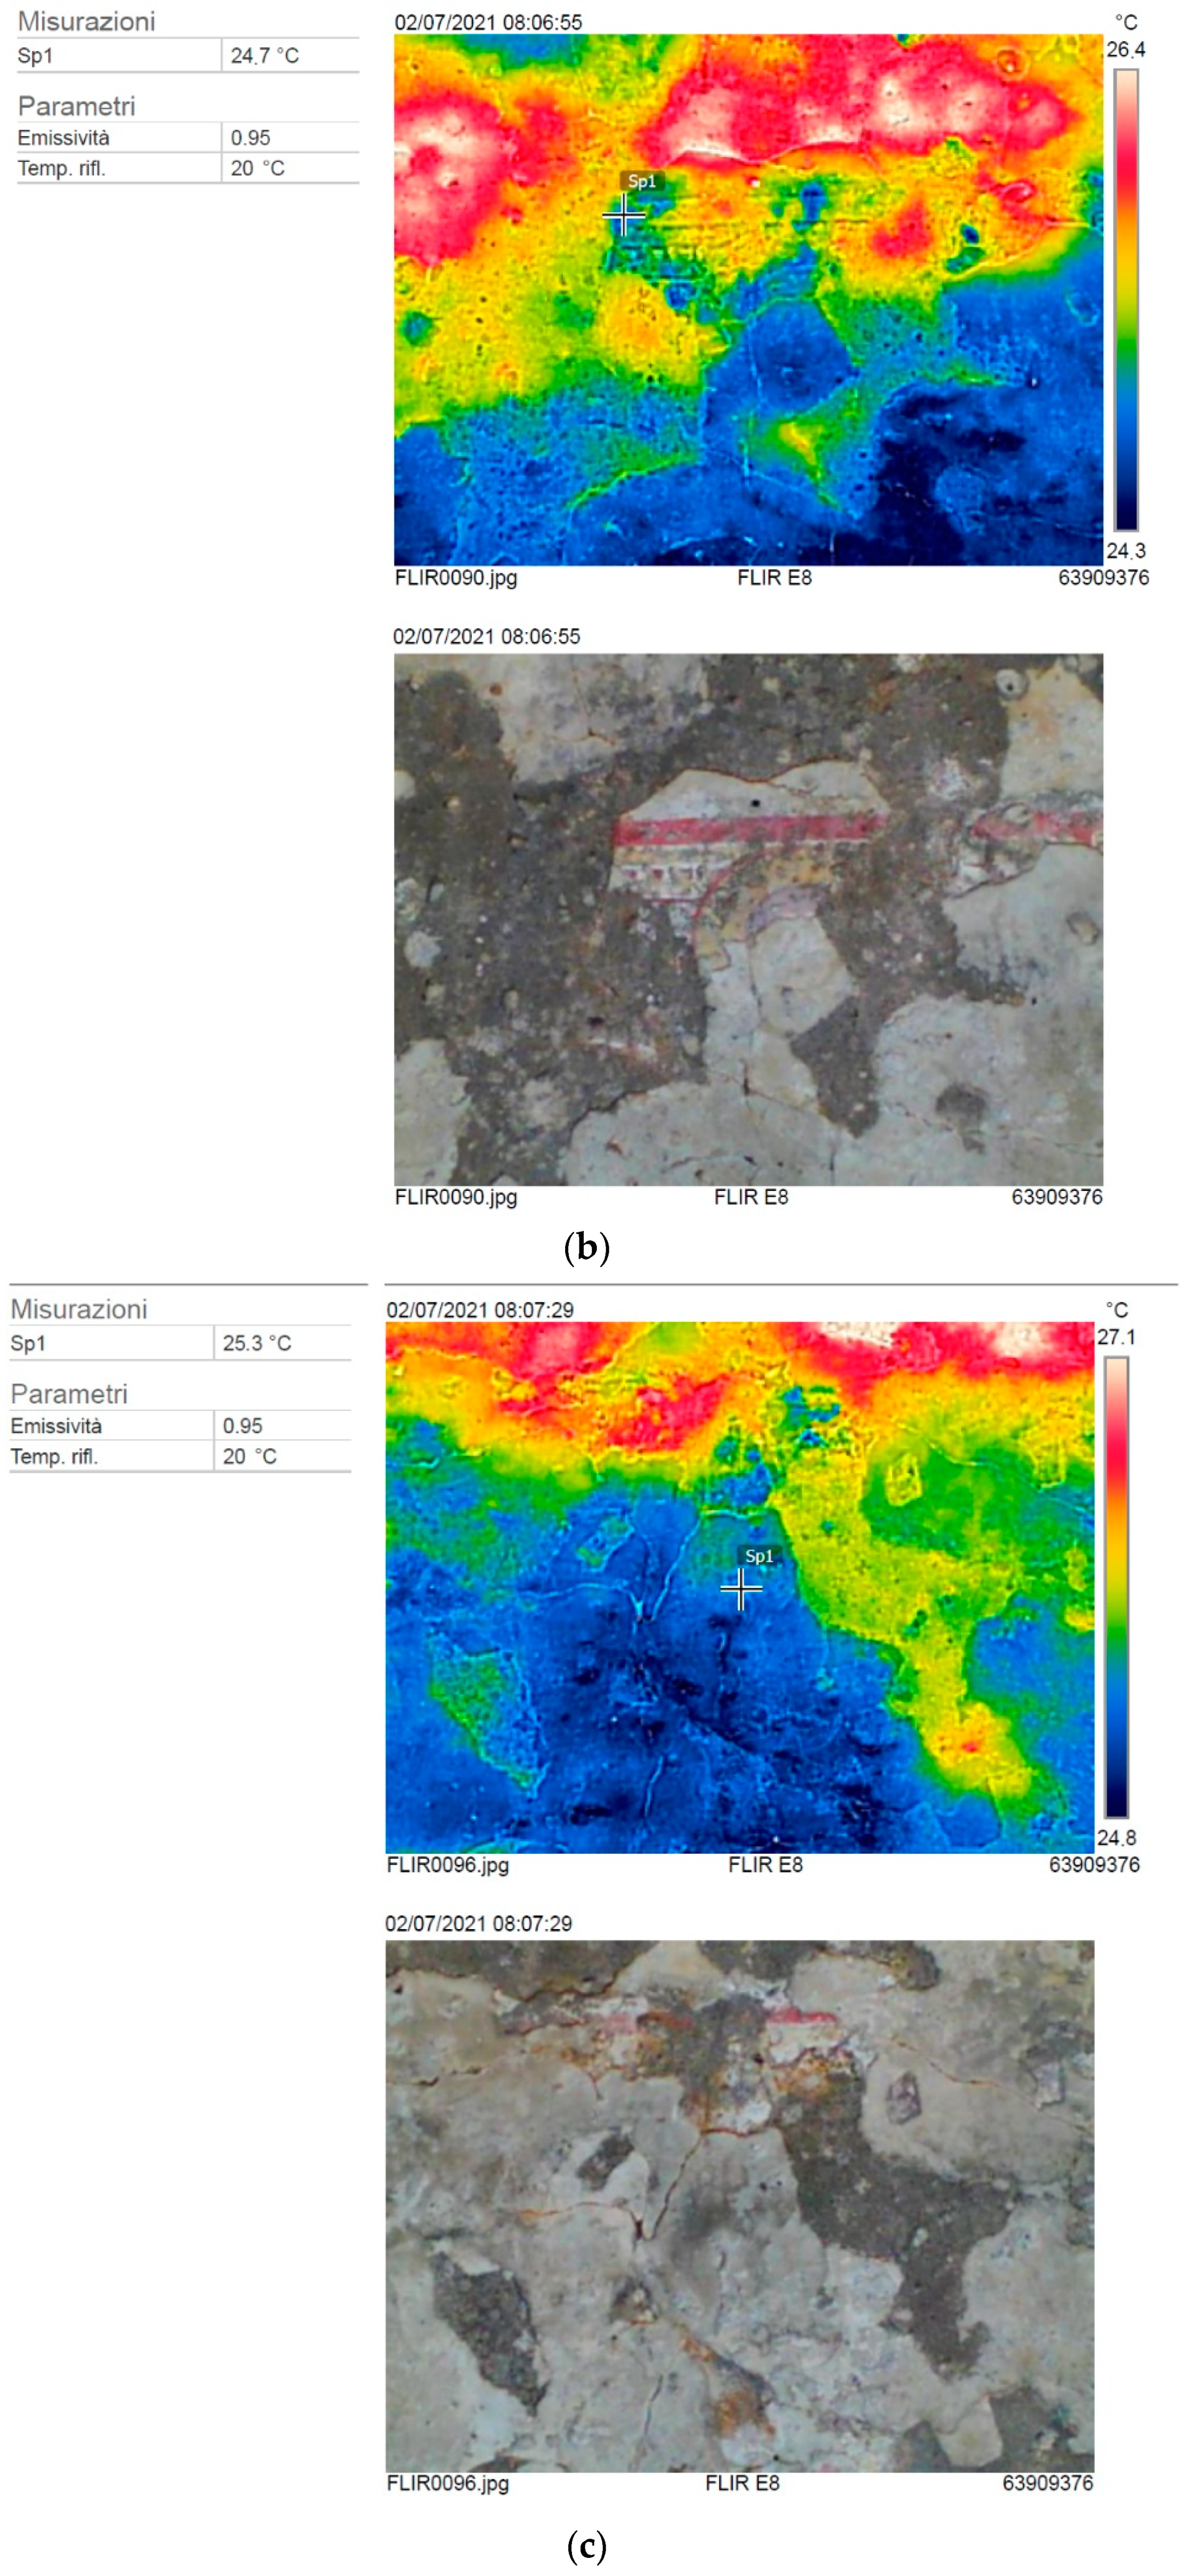
4.3. Infrared Thermal Acquisition
The wall painting, preserved in traces and in a very bad state, has never been subjected to consolidation or restoration interventions until now. For this reason, we decided to perform periodic non-destructive analyses in order to observe how the materials respond to continuous environmental and temperature variations (exposition to atmospheric agents, heat or light sources) that may damage its integrity. For this purpose, infrared (IR) thermography was used as it is considered the most effective method for this type of application [
58,
59], as better specified above.
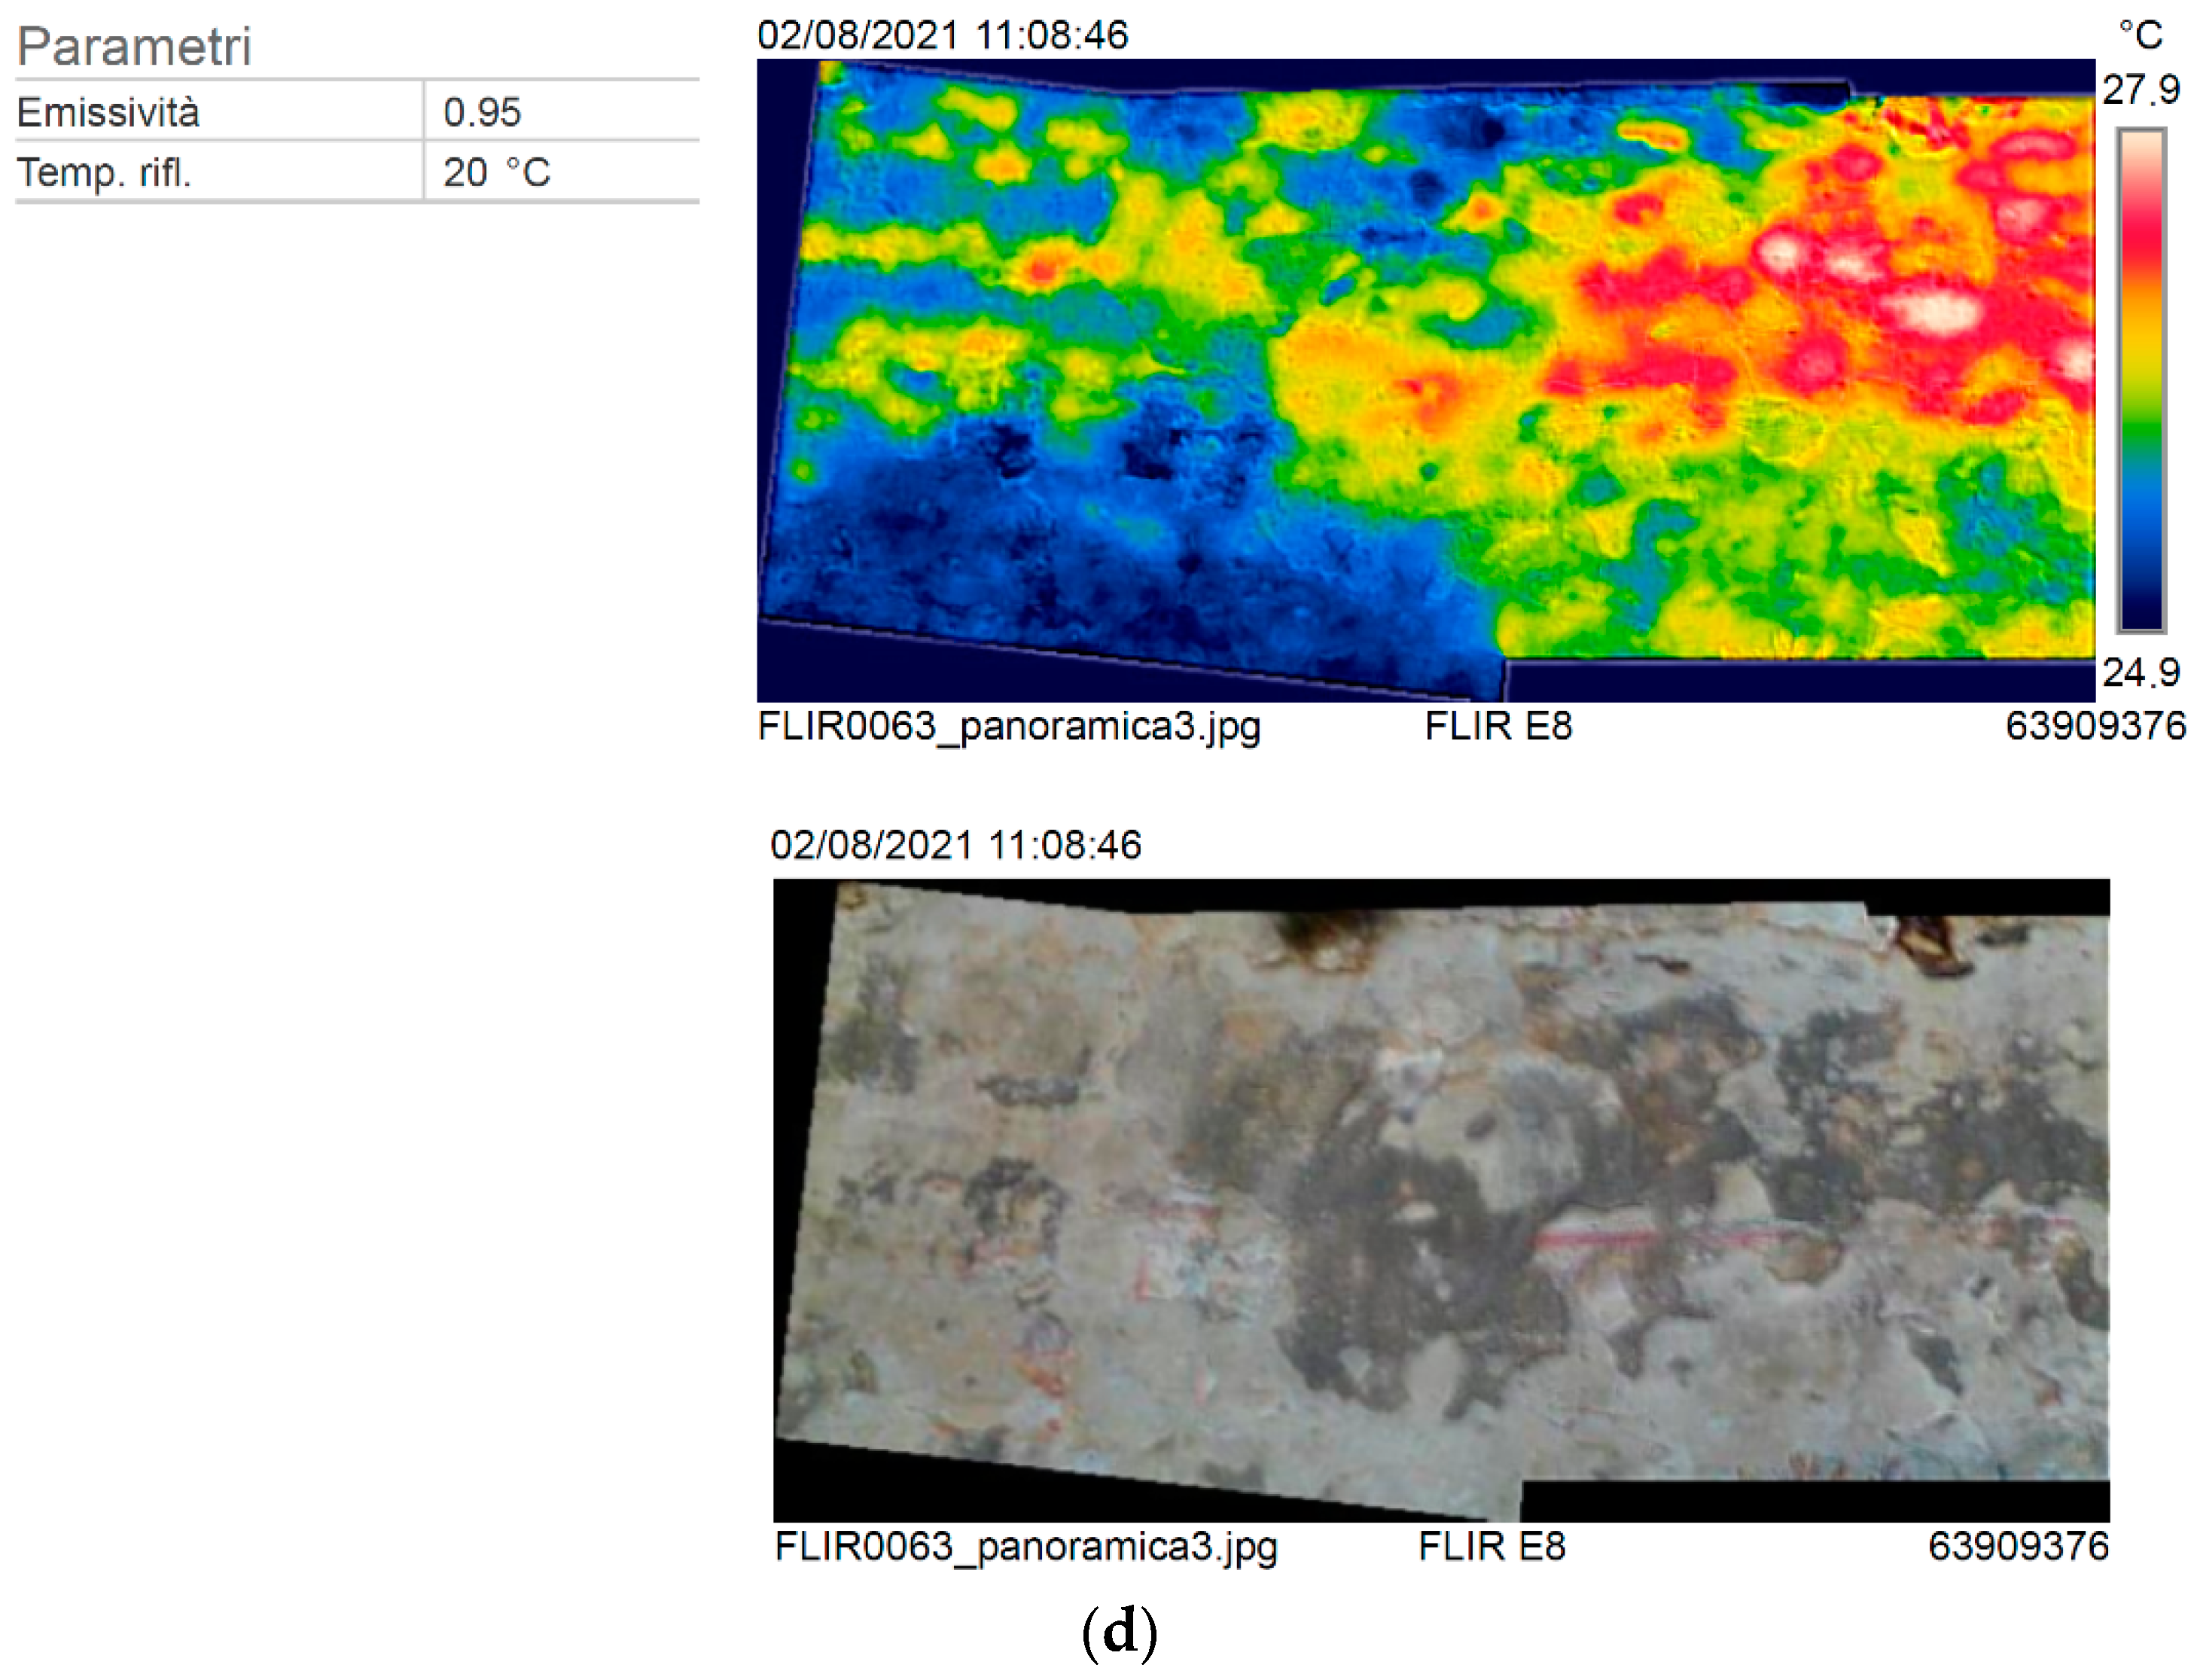
The instrument used was a FLIR E8 thermal imaging camera. It is a point-and-shoot and lightweight tool, characterized by an uncooled microbolometer sensor that can measure in a range between 7.5 and 13 µm with an infrared spatial resolution of 320 × 240 pixels (image frequency 9 Hz). The field of view (FOV) is 45° × 34° and the minimum focus distance 0.5 m. For measurements, the temperature range of the object can range from −20 °C to +250 °C (−4 °F to +482 °F). The as-built software allows many interactive imaging options, including merging with a visible image captured by an integral conventional digital camera. All the acquisitions were performed passively, without any artificial heating: this means that the infrared signatures derive totally from local environmental conditions. In fact, in some situations the paintings were thermally stimulated (heated or cooled) in order to induce a temperature difference between damaged and undamaged areas.
The acquisition, which was carried out on 2 July 2021, involved the painted surface preserved on the wall of the church of San Basilio facing south–southwest. In order to avoid the surfaces under investigation being too hot at the time of the analysis and that the instrument returned saturation values compromising the final reading of the data, the acquisitions were carried out in the morning between 7:45 am and 8:45 am. Specifically, a set of 30 images was collected from a distance of 2 m from the wall in order to obtain greater spatial resolution and, to have the possibility of creating a wide photomosaic with the instrument software.
5. Results
5.1. Point-Based and Image-Based Documentation
The data processing generated two types of output:
3D colored point clouds: representation of the scenarios detected, in which each point represents measured (x, y, z) coordinates.
Image-based virtual tours: multimedia projects based on 360° panoramic photography, in which the user can interactively navigate sets of images by moving between different observation points.
A topographic 3D model of the whole hillfort, usable as a tool for monitoring the state of conservation, was produced from photogrammetric processing. It includes the limits of the fortified area of the hill and the evidence placed inside. From this model, we derived geo-referred and orthorectified base maps, to be used in the GIS (
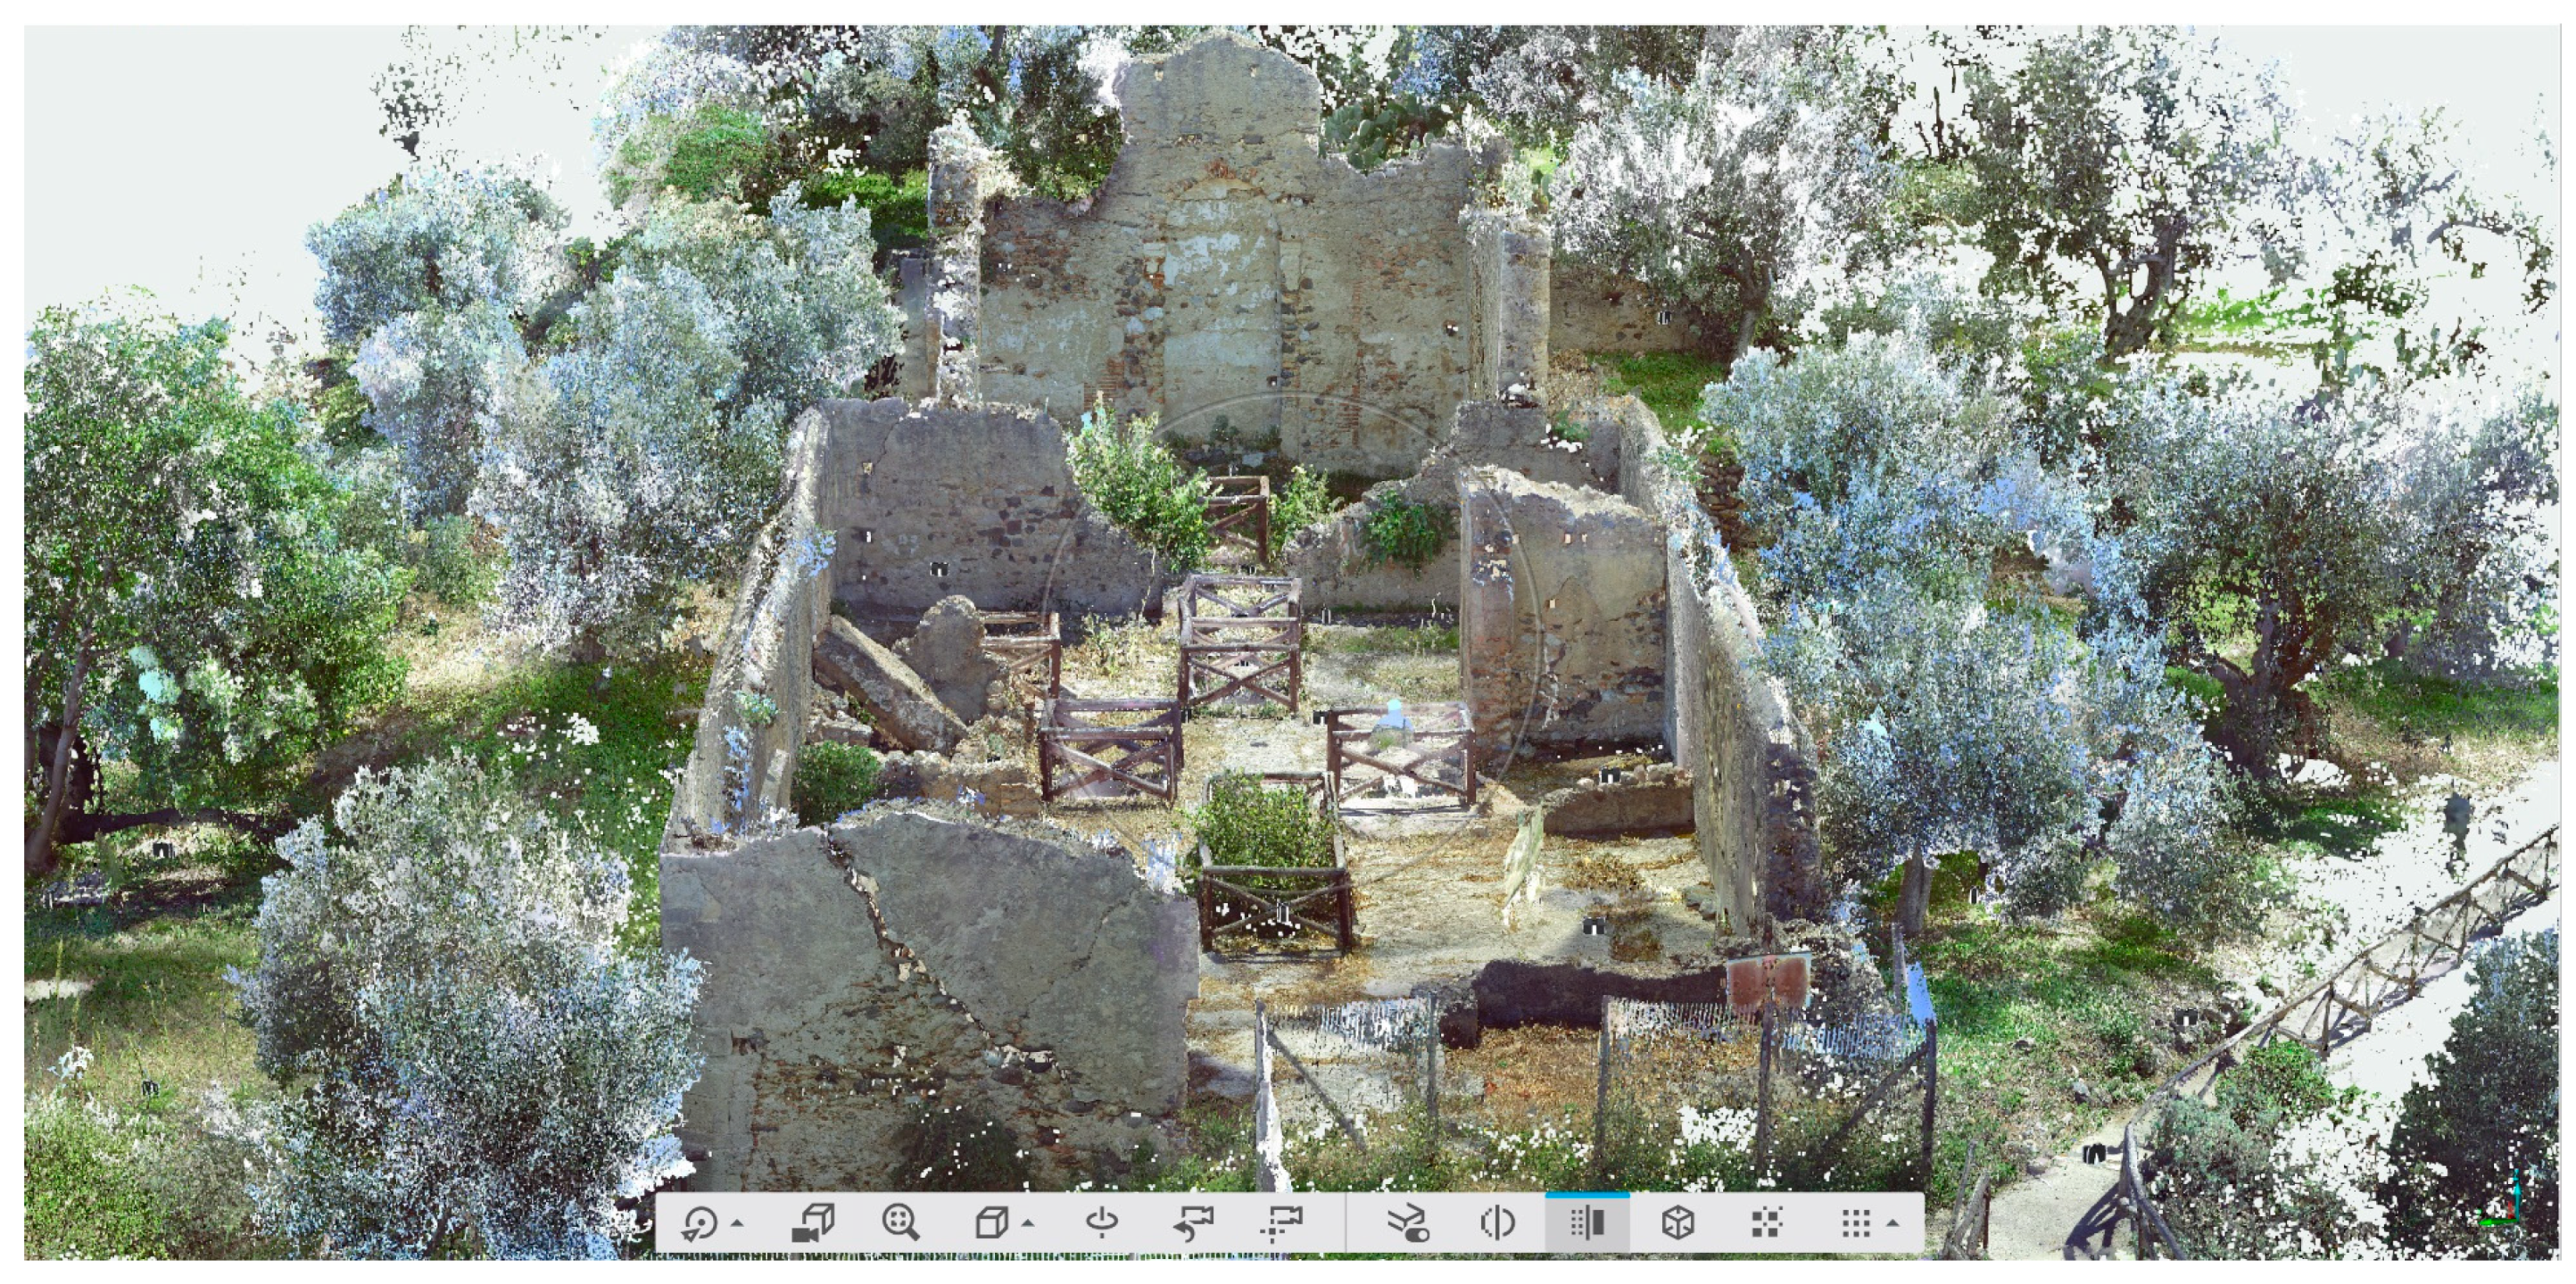
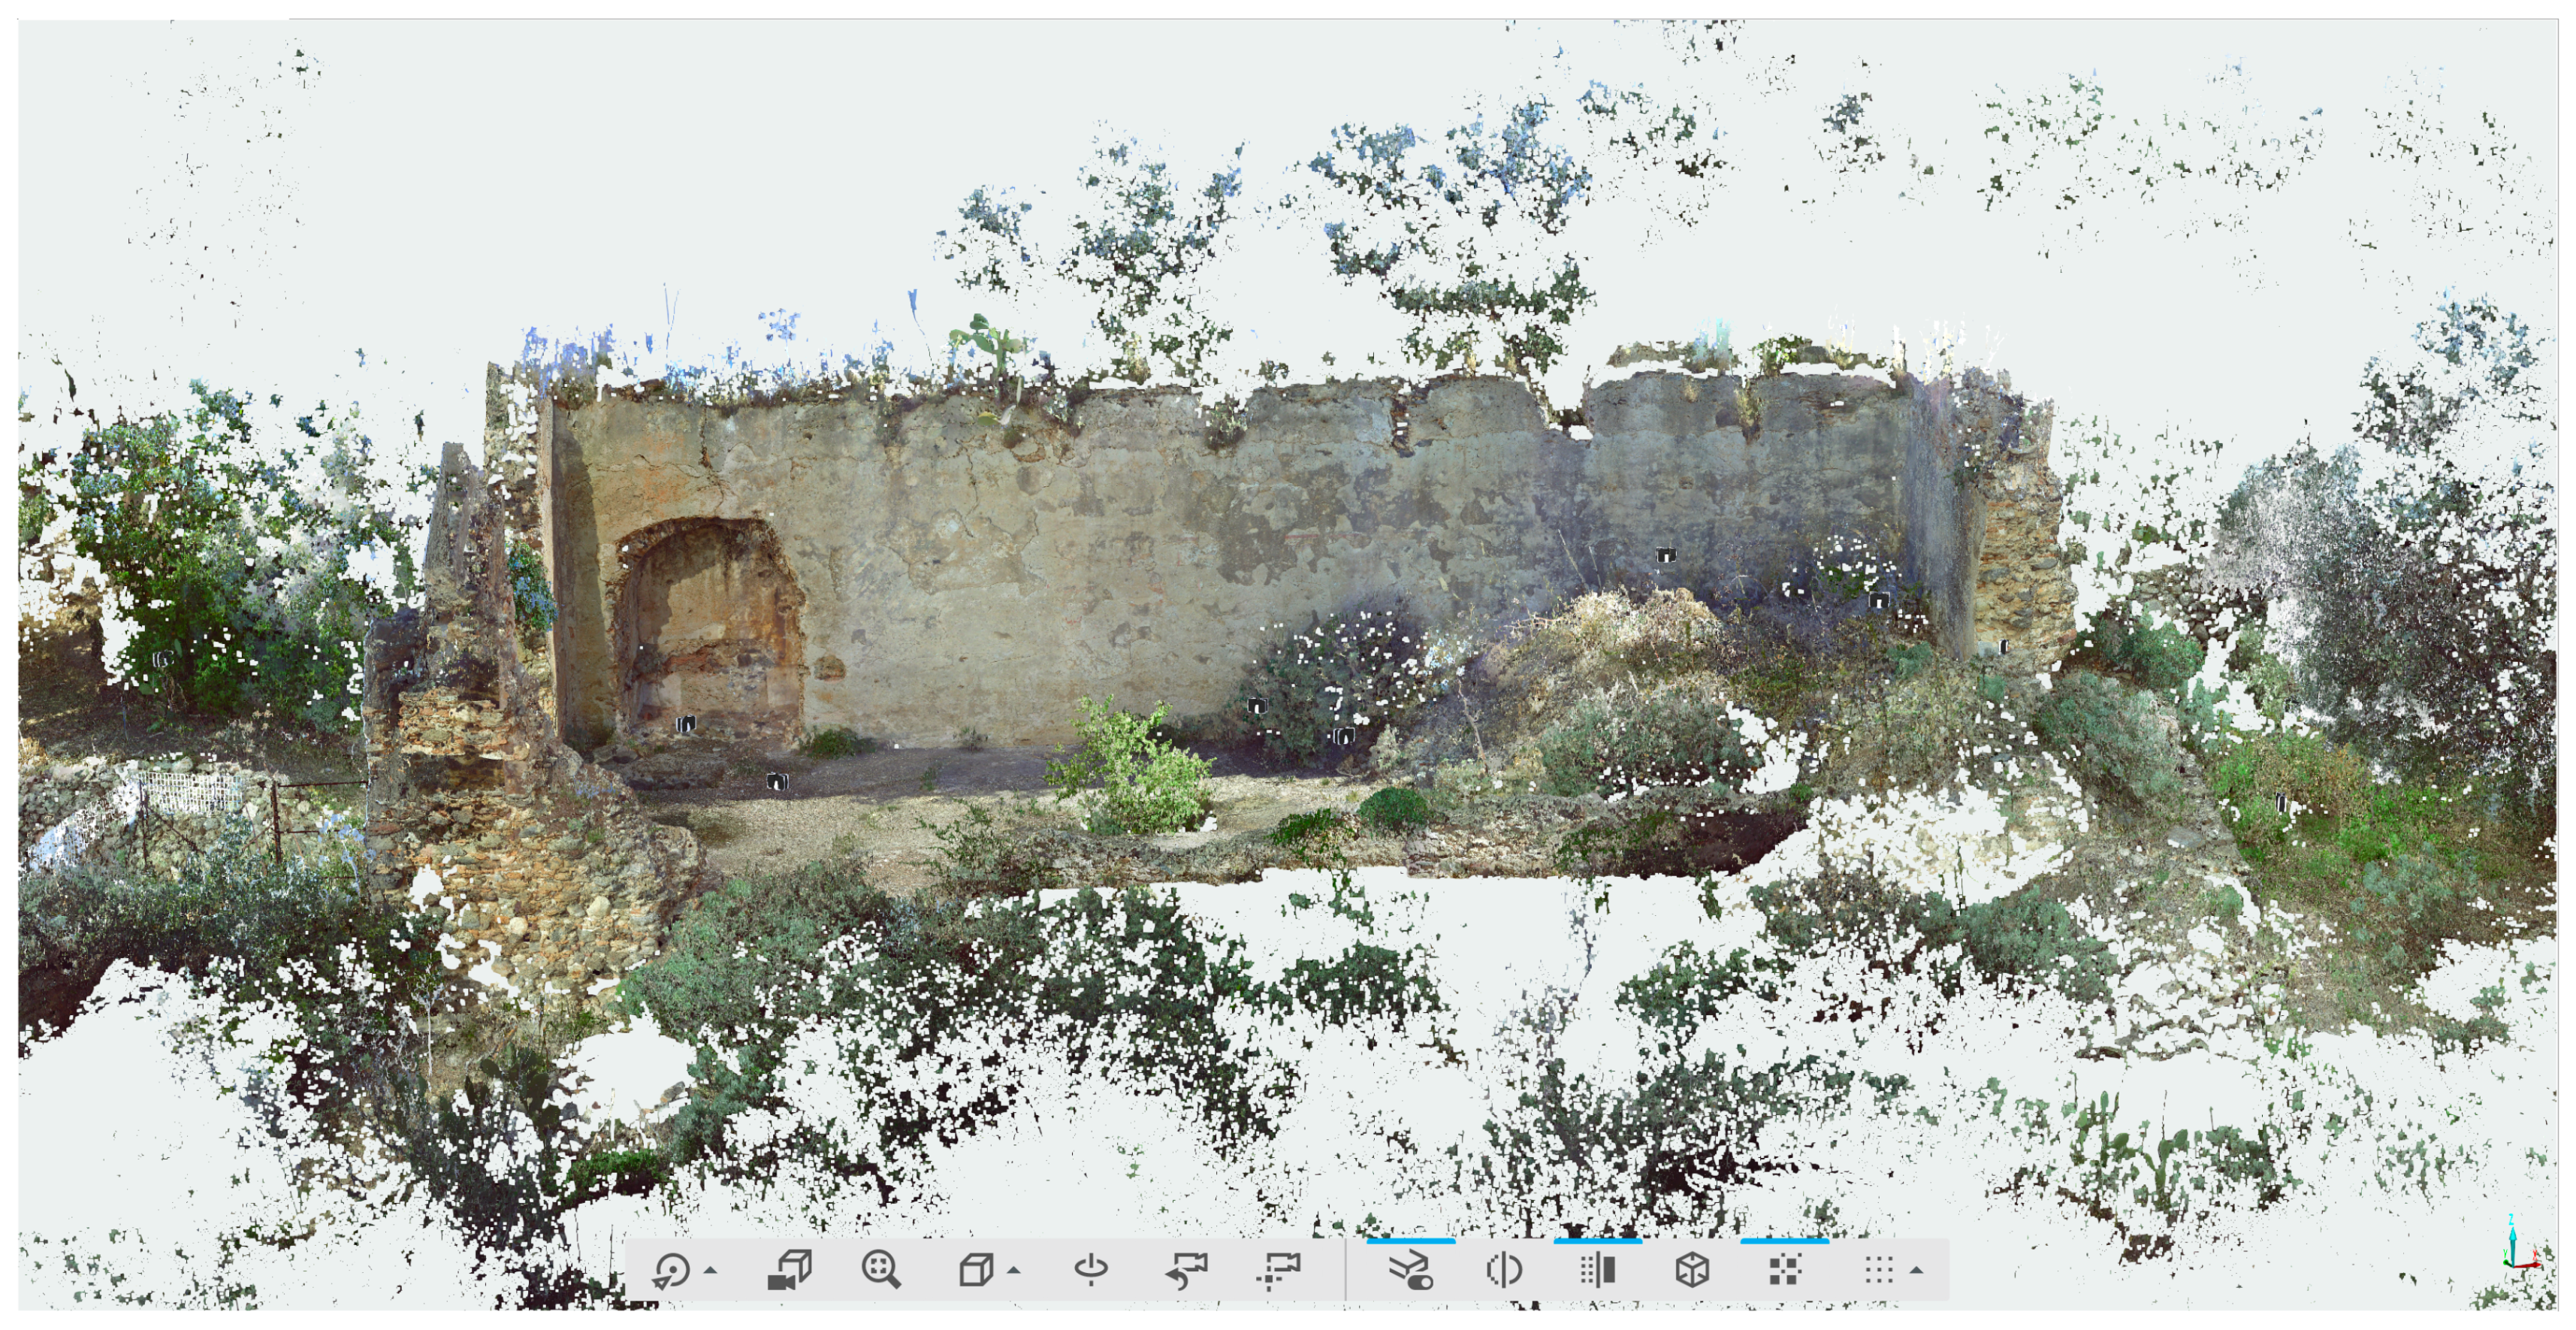
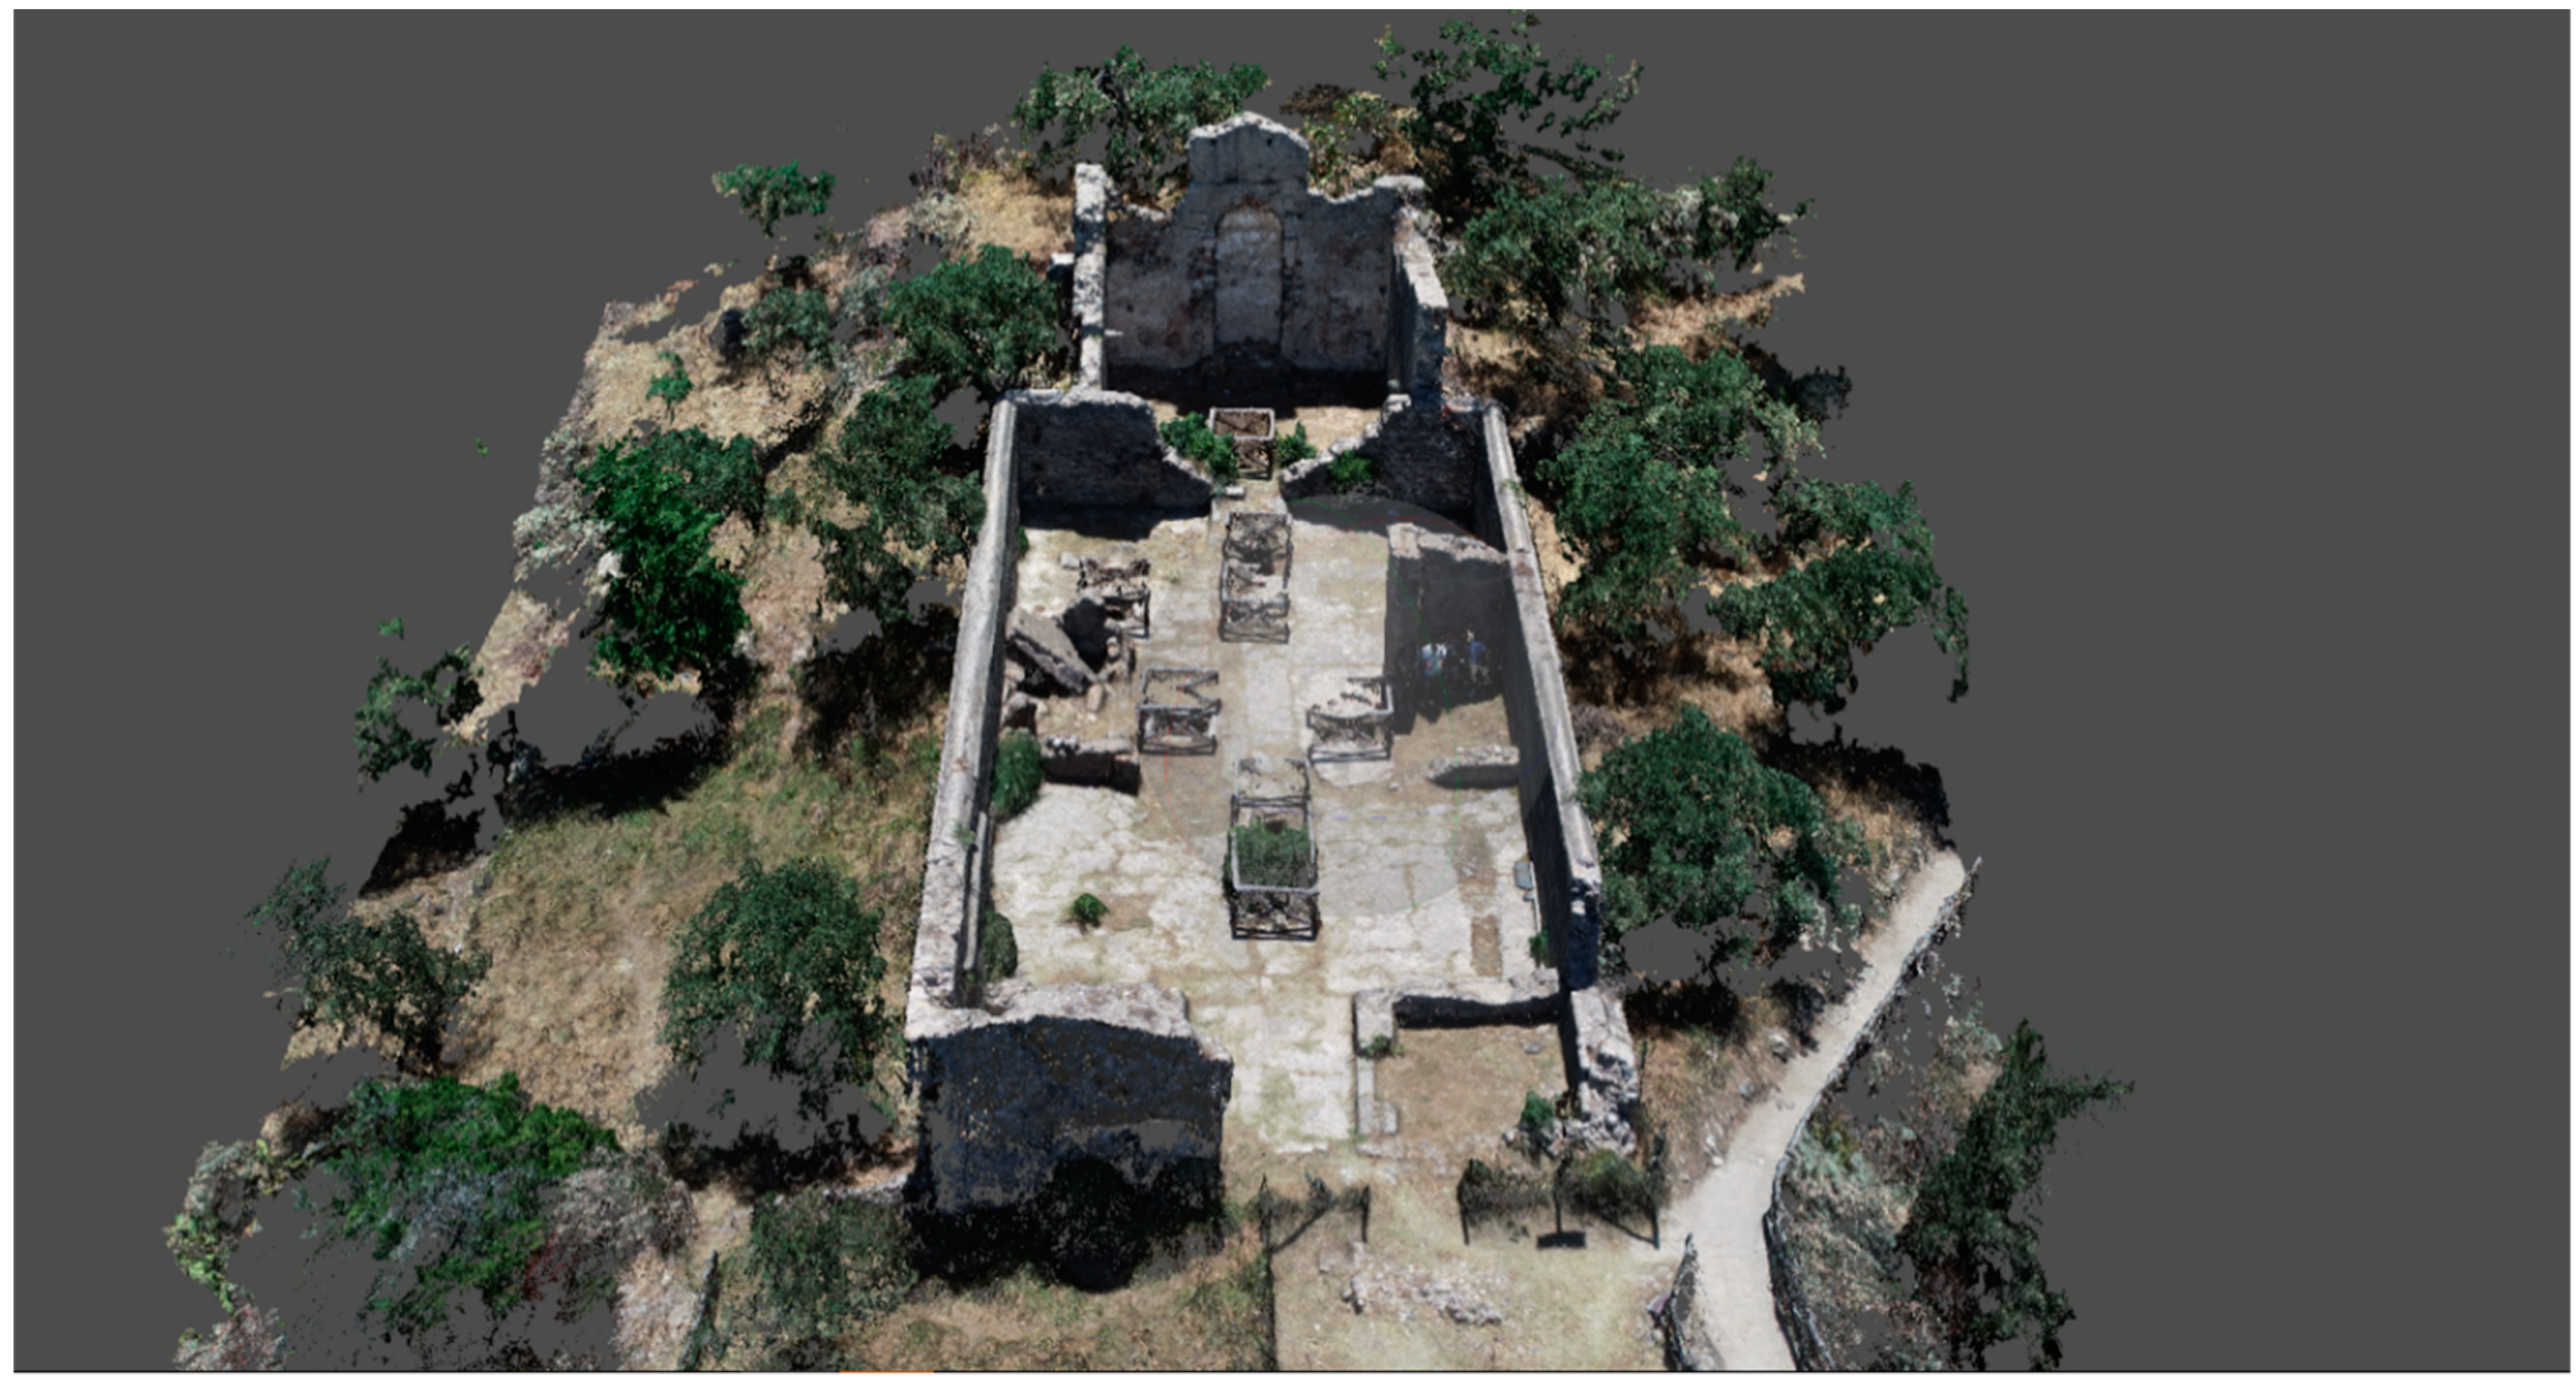
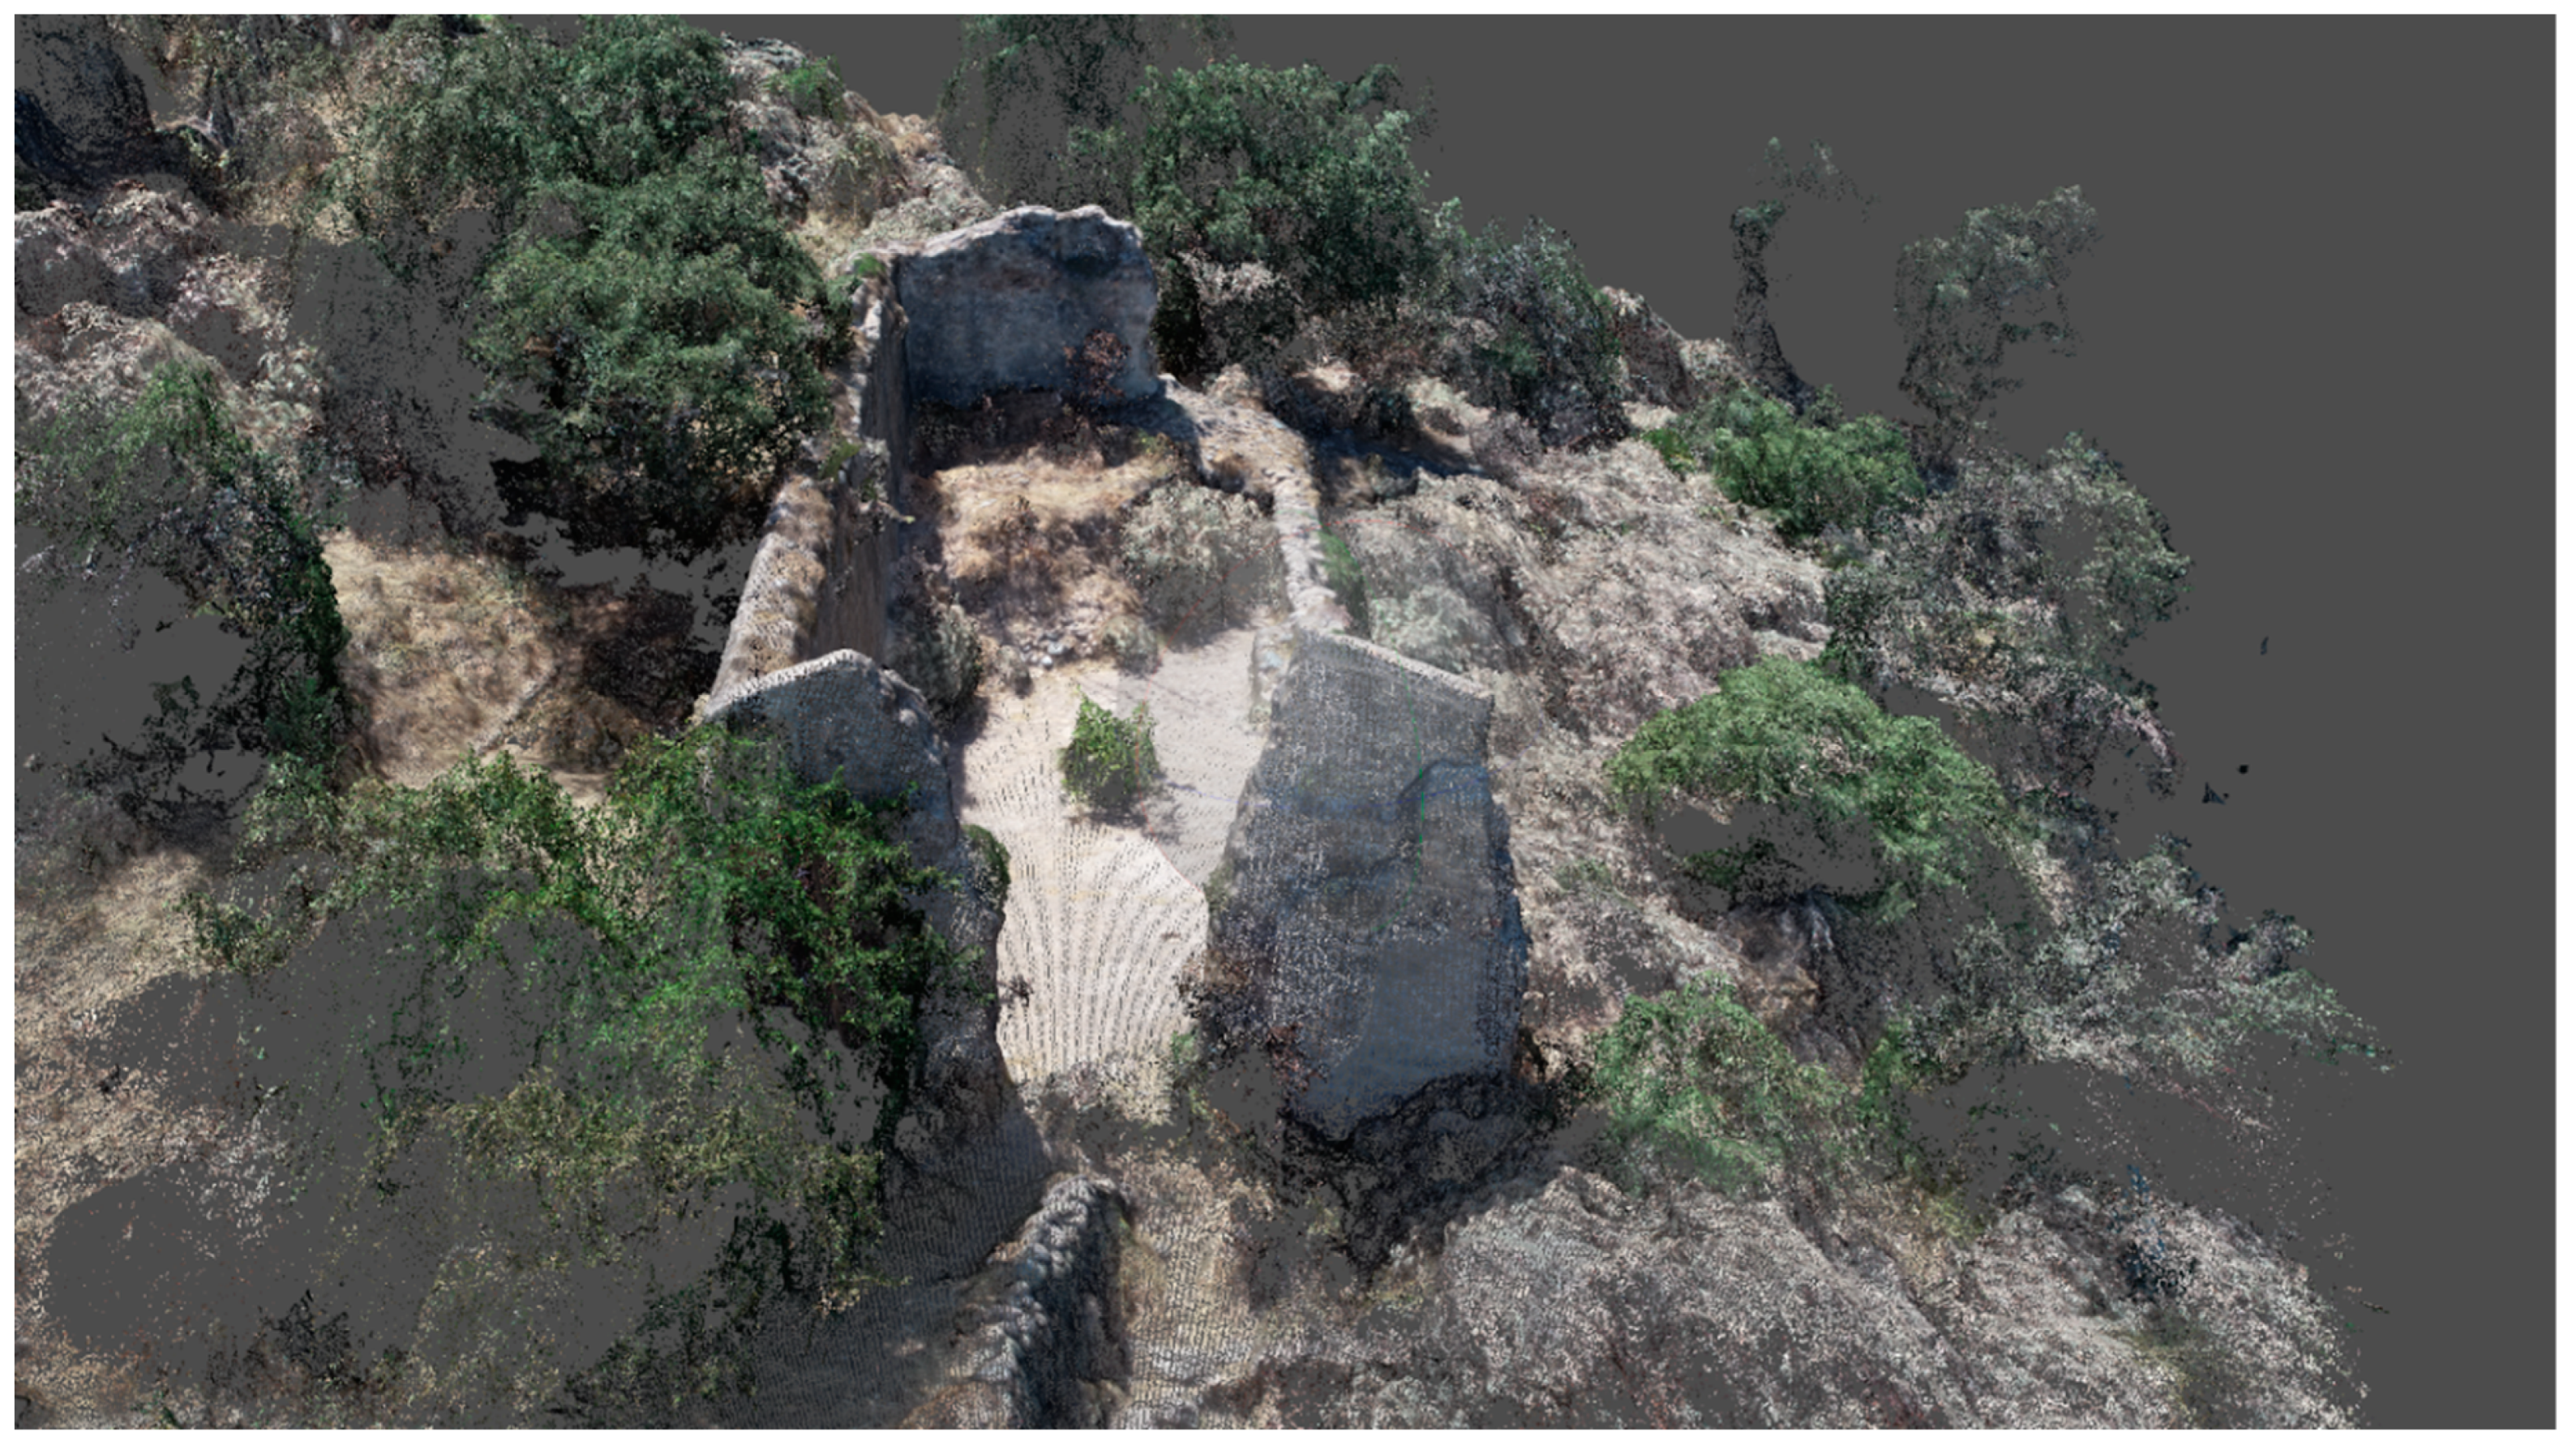
Figure 18). For each church examined (San Nicola and San Basilio), two detailed 3D models were created (
Figure 19 and
Figure 20), carrying out surveys on an architectural scale: one (point-based) produced by processing the point cloud acquired by scanning laser; the other (image-based), generated by photogrammetric acquisitions. The TLS final products consisted of the following point clouds available in the two formats “isproj” (SCENE) and “rcp” (ReCap):
a global cloud of 362.645.583 points for the church of San Nicola (
Figure 11 and
Figure 15), divided into two registration groups and recorded with an average error of 6.2 mm;
a global cloud of 38.754.346 points for the church of San Basilio (
Figure 12) consisting of one registration group recorded with an average error of 5.1 mm.
These navigable models include accurate geometric, colorimetric and intensity data. They allow the extraction, whenever necessary, of horizontal and vertical sections and other specific views to be used as the basis to derive specific drawings in the CAD or BIM environment. Moreover, the application of lidar intensity for structures can provide interesting results in the field of damage detection [
60,
61]. The survey carried out on the fresco preserved inside the church of San Basilio will be used as the basis for the mapping of decay as well as to provide information about the state of the surface.
In this work, a web-based virtual tour system was also generated using the 360° photographs recorded by the Faro scanner, through Pano2VR software (
Figure 21). The VT provides tourists with an opportunity to visit art of the site remotely and to move around freely inside the monuments, interacting with them.
The St. Nicola’s Church tour consists of 36 observation points, while the tour of San Basilio’s Church was created using 12 observation points. The VT was also populated with several points of interest containing information; by clicking on specific icons placed along the path it is possible to get more details [
62]. Both tours are equipped with an interactive base map that has a dual function: to locate the active observation point and to move quickly to another observation point without going through all the tour nodes in sequence.
5.2. Results of Spectroscopy Measurements
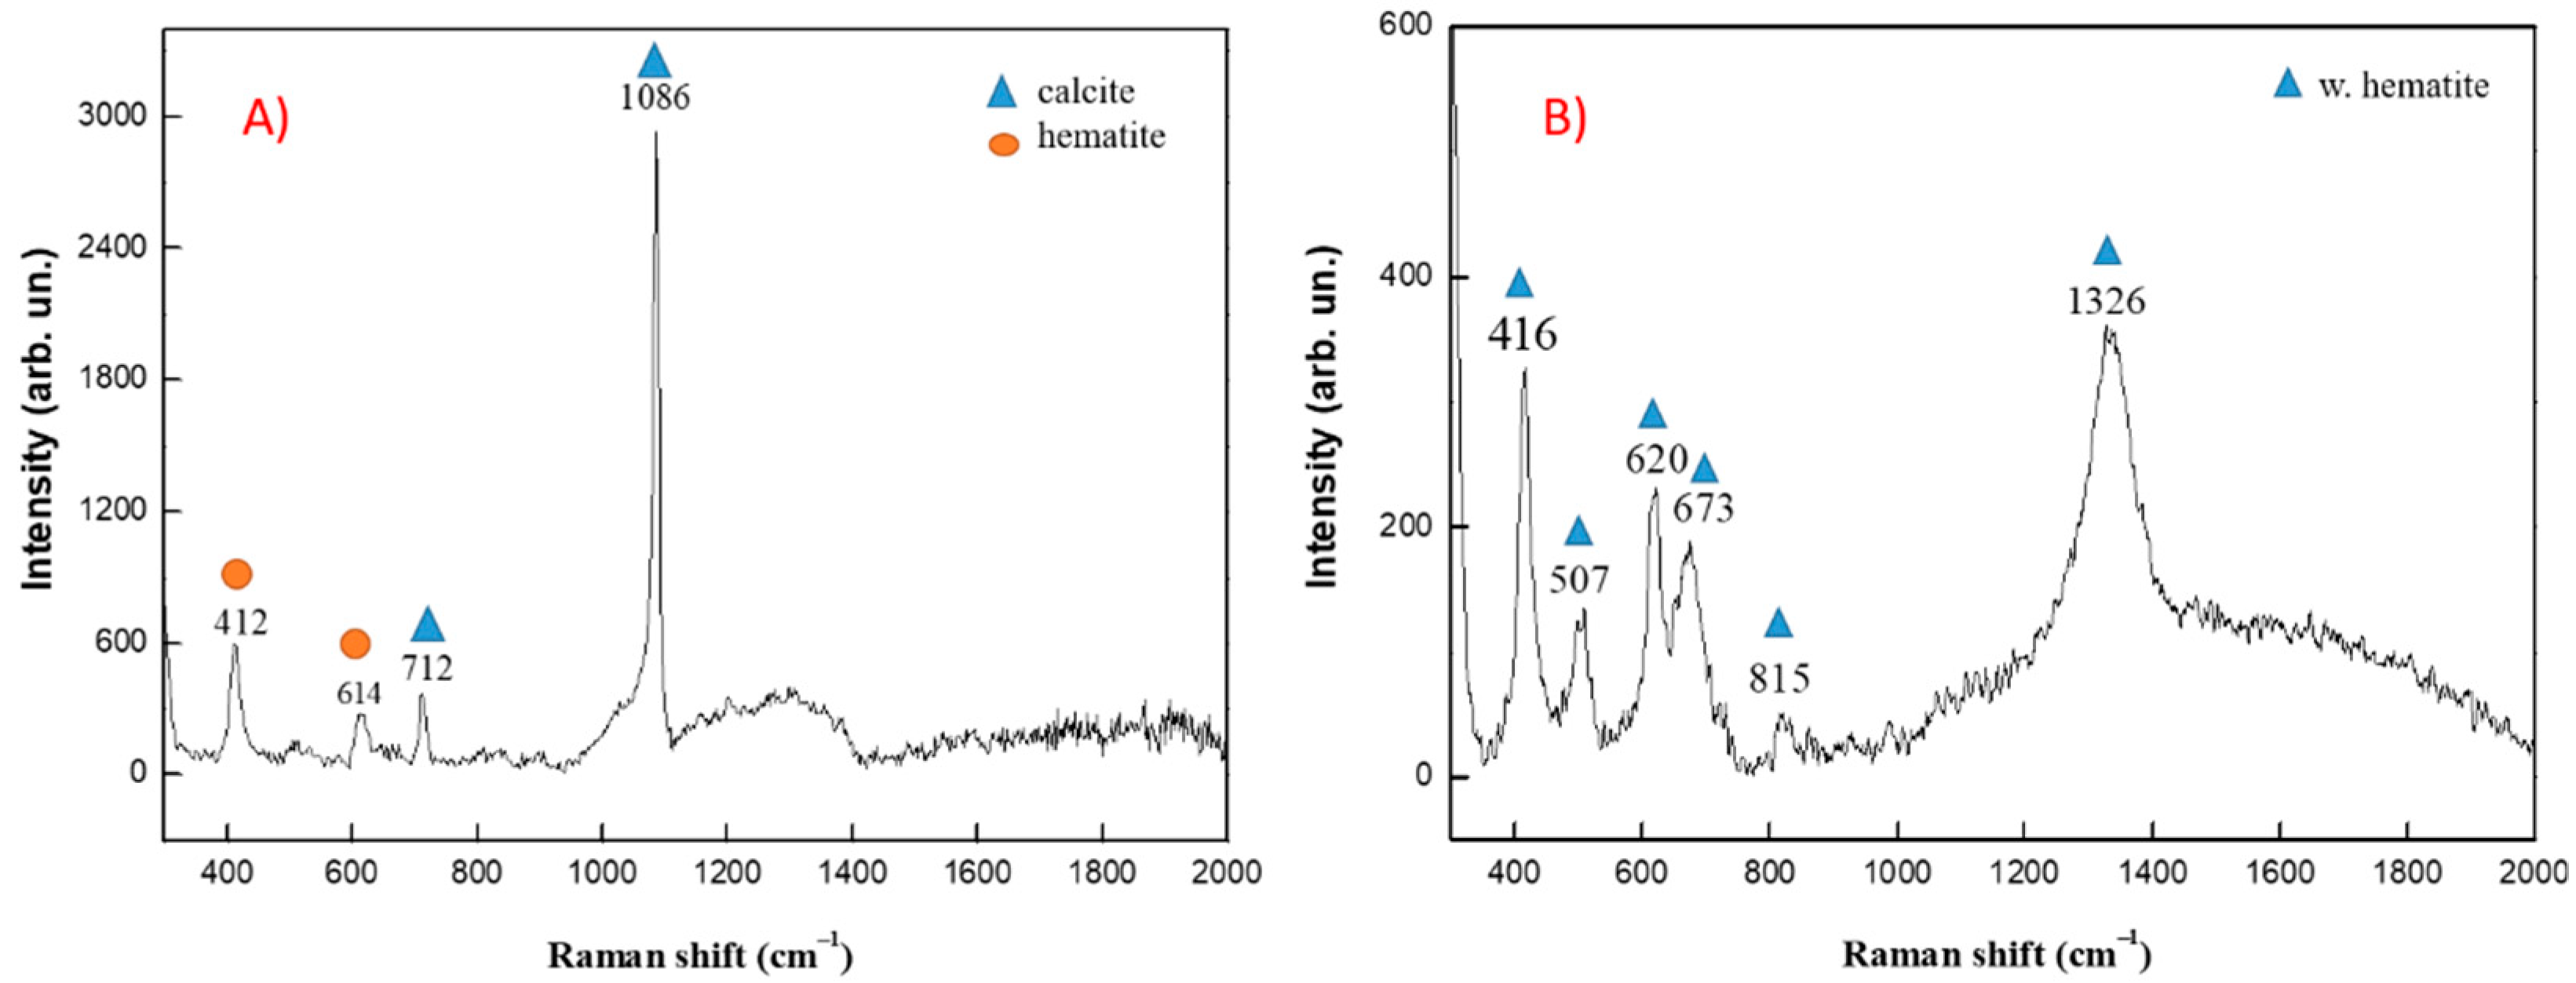
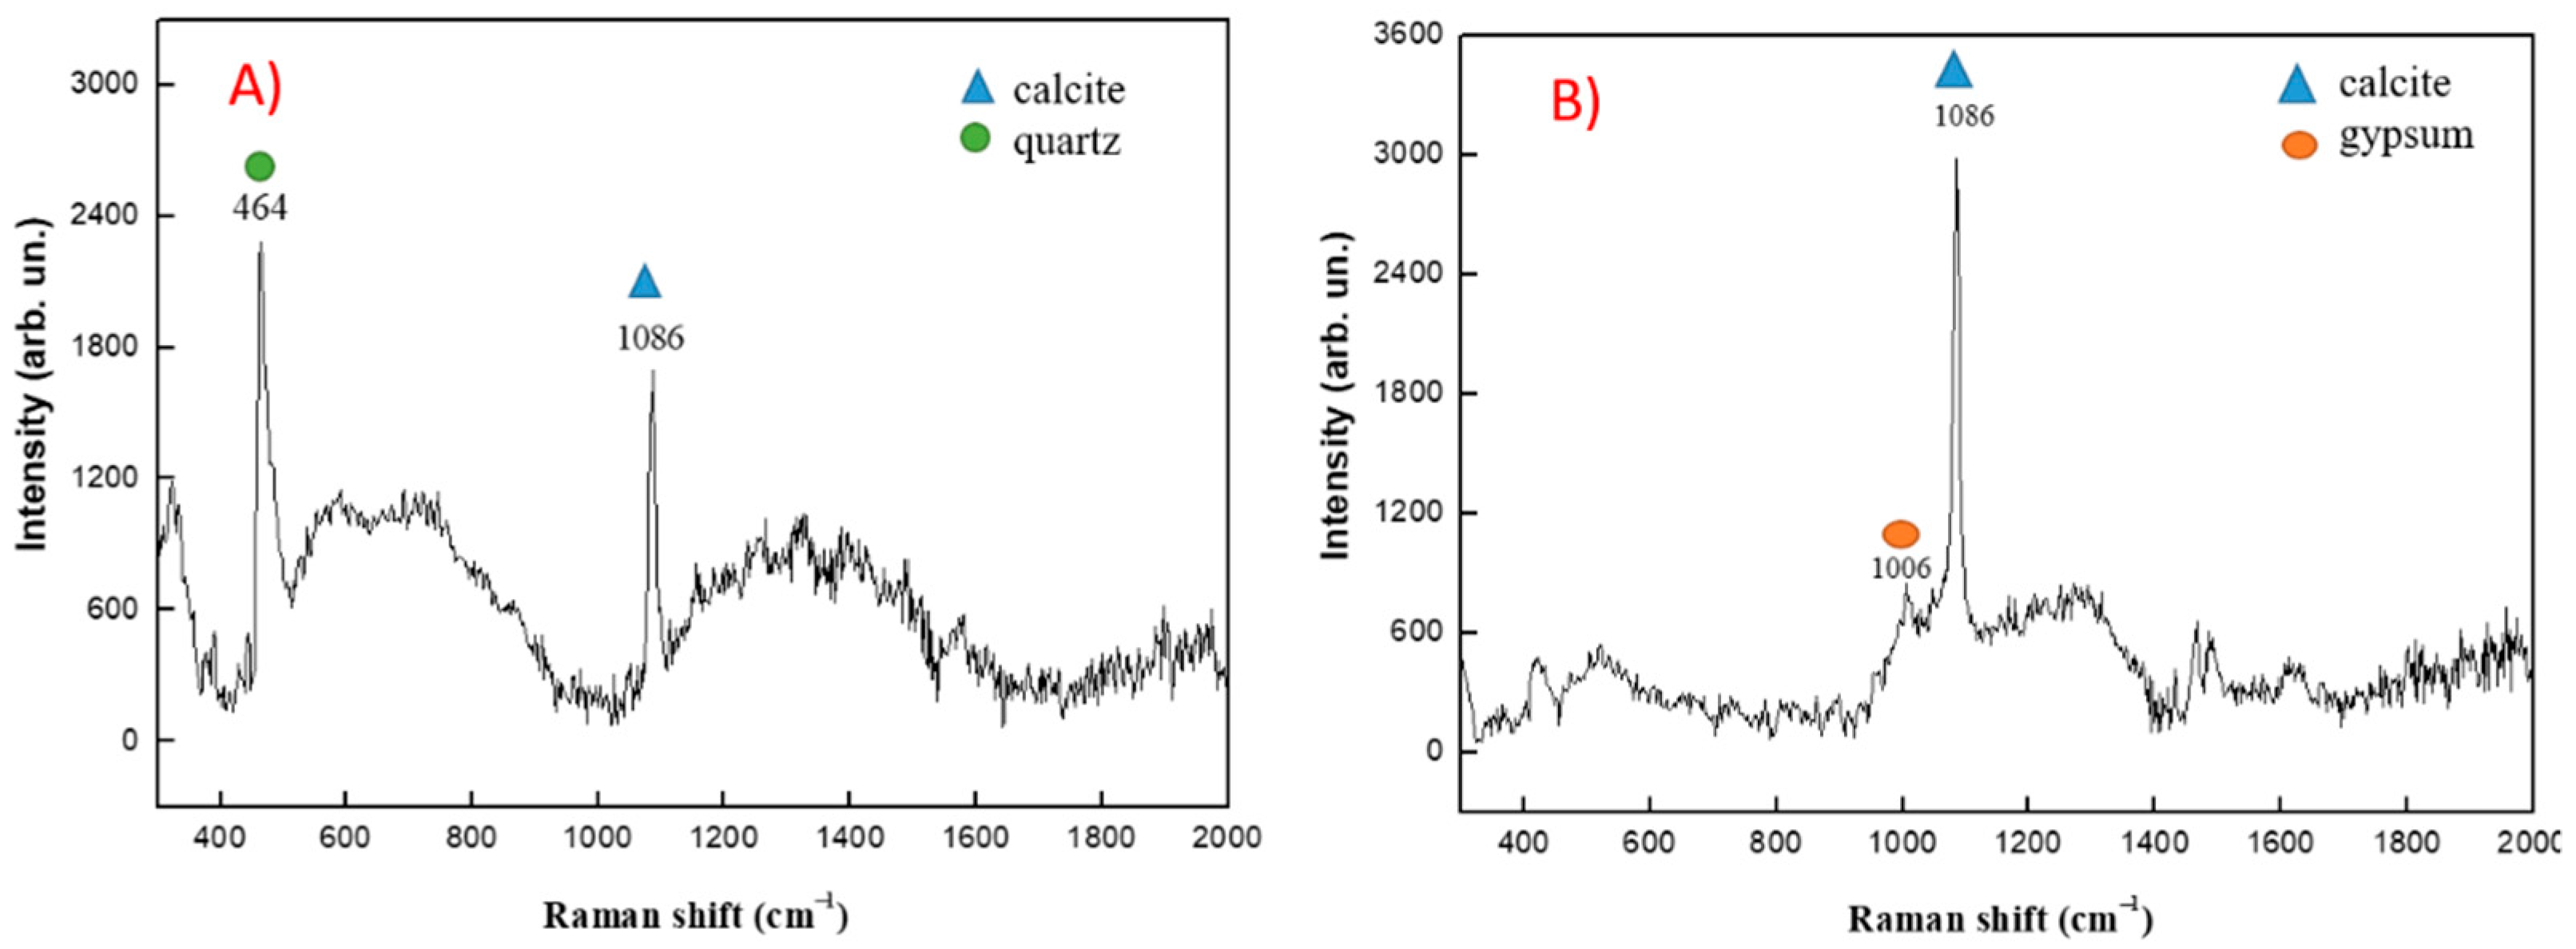
Raman spectroscopy proved to be very useful for red and pink pigments as we show below, while the analysis of the blue–black and yellow areas did not give significant Raman shift for pigment identification. Raman spectrum on the red area analyzed in situ (
Figure 22) shows bands at 412 and 614 cm
−1 imputable to hematite (Fe
2O
3) in addition to calcite (CaCO
3) that has characteristic bands at 712 and 1086 cm
−1 in accordance with the literature [
63]. Instead, the Raman spectrum of the sample (red area—probably a different phase of painting) shows typical bands of weathered hematite at 416, 507, 620, 673, 815 and 1326 cm
−1) [
64].
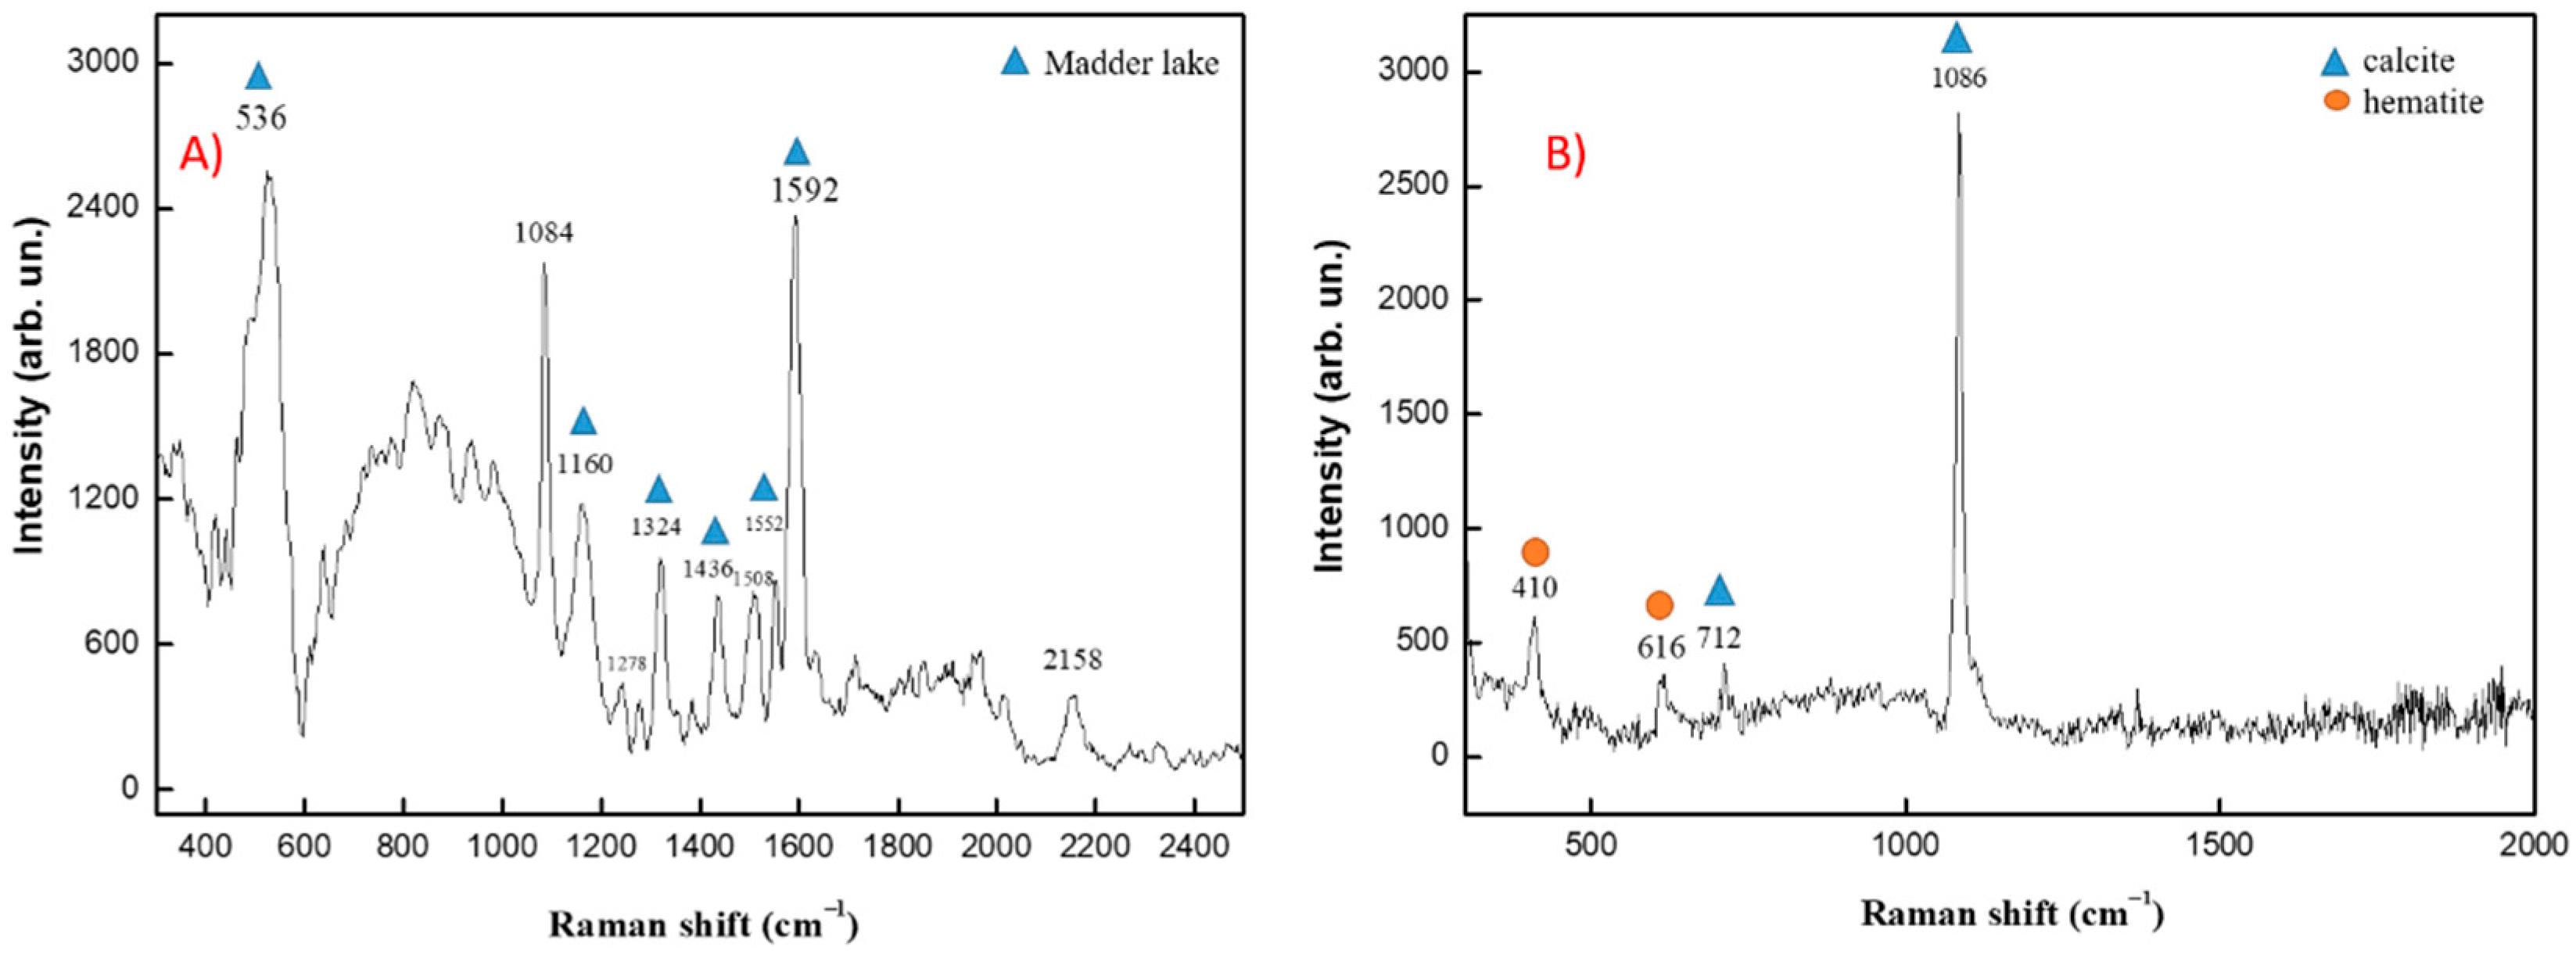
The pink point analyzed in situ (
Figure 23 and
Figure 24) shows bands representative of madder lake at 536, 1160, 1278, 1324, 1436, 1505 and 1592 cm
−1, probably used together with a white that was used to tone the coloration. In general, madder lake, as with other organic pigments, is rarely found in wall paintings because of its similarity to other organic compounds [
65], and because of its susceptibility to degradation. However, it has been found, for example, in mixtures with Egyptian blue, in fragments from Roman and Hellenistic sites [
66].
On the contrary, the pink pigment analyzed in the sample shows the typical band of hematite together with calcite. For yellow and black–blue the Raman spectra showed only calcite, quartz (464 cm
−1) and gypsum (1006 cm
−1). Neither case gave significant shifts that were attributable to pigments. We supposed that gypsum was probably derived from the sulphation phenomena affecting the paintings [
67].
It is important to note that the difference in the spectra relating to the red and pink pigments could be attributed to the phases of the painting (two overlaps) or to the complexity of the same painting, now illegible in its entirety because it has completely degraded. In fact, only some parts are visible (as shown in the figure) and it is not possible to build the whole scene.
5.3. Results of IR Thermal Imaging Analyses
The resulting imagery was processed using the proprietary software FLIR Tools in order to extract useful information. Unfortunately, the application of infrared thermography on painted surfaces is strongly influenced by non-uniform heating and by the emissivity of frescoes surfaces that is determined by the different pigments used. The different measurements carried out made it possible to identify many detached areas in the painted surface (
Figure 25). Although not much other information was obtained from this application, the acquisition was important to have comparison data on the state of conservation, to be used during future thermal prospecting. For the first time, the wall painting has been studied using different techniques, and the results obtained during the diagnostic campaign have been a support for the work of restorers.
6. Discussion
The multidisciplinary methodology described in this paper has proven to be useful for the achievement of the initial goals: the production of 3D and 2D graphic documentation of the site and its main buildings for the needs of conservation, restoration and monitoring of the degradation processes (in combination with other techniques); the systematization of data deriving from different analytical approaches in order to implement the database-based informative models; the creation of digital media for dissemination and remote visits (virtual tours and augmented reality).
The 3D survey answered the need for full high-resolution documentation, providing a detailed representation of the state of preservation of the evidence with high levels of precision and accuracy. Different advanced automated methods, such as TLS, digital photogrammetry and UAV, were used. These methods must not be seen as a substitute for traditional methods of survey but, instead, they are a new type of documentation, complementary to photographs, which allows new forms of representation. Laser scanning revealed a high data acquisition rate in the perpendicular direction, while photogrammetry returned high-level planar point clouds. Thus, a convergence between terrestrial laser scanning and UAV photogrammetry is crucial in all situations that aim to reconstruct topography as well as building shapes.
Generally, a cloud of points is obtained from these techniques; however, a common problem can be the optimization from point cloud to 3D model, and the exportation step can still be difficult and time-consuming due to the dimension of the file. Three-dimensional digital models were, in our case-study, effective tools to aid the analysis and perception of the complexity of the volumes of the site, churches and crypts.
Beyond the traditional visualization and conservation purposes, the final 3D models will also be helpful to support the study of the pathologies and the degradation process of the buildings in combination with periodic IR thermal analyses; one of the most representative cases of Motta S. Agata is the painting preserved inside the church of San Basilio. The frescoed surfaces are visibly characterized by ongoing degradation processes, which, if not treated in time, may cause the irreparable destruction of the work. Here, the 3D model has served as a basis to schedule a spectroscopic campaign in situ with handheld instrumentation (portable Raman and FT-IR) aimed at characterizing the composition of the pigments used in the three different painted layers and to check the current state of degradation. The whole aisle wall has also been investigated with IR thermal imaging. Among the major pathologies that emerged upon the first reading were the presence of: decohesion, detachment and pulverization, which are causing the lack of localized adhesion between the support layers to the paint film. Moreover, the presence of vegetation and the constant exposure to atmospheric agents are causing the detachment and the falling of layers of plaster and fresco. However, we recently collected some test data in situ, which are currently being studied (following a decision made by the study group these data will be published in a later work).
For the conservation purposes of the pictorial apparatus, an attempt was made to reach a “critical use” of the acquired data, thus providing a valid decision-making and planning tool for restoration. Finally, the colorimetric, geometric, morphological and intensity data acquired by laser scanning and photogrammetry will be integrated with the results of chemical analyses and embedded in a wider “digital archive” queryable by users.
The site of Motta Sant’Agata can now count on a rich archive in the form of colored point clouds and high-resolution photos to which chemical analyses will be soon associated. In both of the study cases, the modelling examples have demonstrated that different types of 3D models can be generated to facilitate the understanding, the conservation, the protection and the dissemination of the site; moreover, the final point cloud can be used for H-BIM implementing: in fact, quality point clouds can be used as the basis of 3D modeling methodologies.
One of the last but not least applications of the integrated image-based/point-based model involves the implementation of a cloud-based hosting platform such as Faro WebShare Cloud. This tool offers real-time access to the latest reality data for project management and BIM workflows [
68]. It supports 3D reality data of an unlimited size to be stored, viewed, evaluated and shared by authorized persons or with open contents, anywhere and at any time using a web browser.
For this purpose, it is important to point out that all of the output was delivered and made available to the Municipality of Reggio C., which is going to develop a website and an app involving other archaeological sites. These, with the help of VT, aim to assist the process of learning and the dissemination of information related to the area [
69].
7. Conclusions
In the coming years, Italy will be called upon to take on a series of challenges related to the diversity of interventions on ICH (immovable cultural heritage). These will require specific skills and the acquisition of a broad variety of information about spatial properties and the properties of materials. This paper has presented all of the steps addressed for the surveying and modeling using terrestrial laser scanning data of two ancient churches preserved at the site of Motta Sant’Agata, located within the territory of Reggio Calabria (Italy). Moreover, 3D metric documentation has been integrated with Raman spectroscopy and IR thermal imaging analyses to study the wall painting preserved in traces on the internal wall of the chapel of San Basilio.
The main metric survey was conducted with a terrestrial laser scanner, but this was integrated with a suitable photographic documentation of the structures in order to capture more interesting details and by UAV photogrammetry in order to generate a topographic survey of the hillfort.
The final output of this work could be of great interest for different stakeholders: (1) researchers and students: for the spatial and chronological analysis of the archaeological settlement, data interpretation and for the advantage given by the remote 3D inspection, interaction and the integration of thematic information; (2) public authorities: for the monitoring, the intervention planning and the dissemination of archaeological information using media, video, etc., (3) general users who can enjoy accessibility to the archaeological site with an added value, both remotely and physically.
The experiences carried out in the last few years have clearly proven how photogrammetry and TLS has made a significant contribution to the field of architectural survey, construction, conservation and restoration as well for the creation of informative models. TLS survey has a twofold utility for understanding the architectural artefact: on the one hand, it immediately returns accurate metric data, innovative graphics and three-dimensional models directly from the point cloud processing; on the other hand, it provides a “document” related to a temporally defined state of affairs.
The availability of digital replicas is a valuable resource for management, as it allows analyses of the building that require comparisons with a previous status. The final goal is, in fact, to implement a spatial database to systematise all of the collected data and to set a GIS and BIM platform that allows users to extract alphanumeric and metric information. The use of these systems also represents a step forward for the integration of multi-source data that facilitate the management of information, their continuous updating [
70] and their accessibility for technicians, architects, historians, archaeologists and public authorities.
The models and outputs derived from the application of the three techniques represent (as a photograph) the exact status of conservation of the structures at the moment of survey; this element makes them useful in change detection analyses and in the study of the causes and mechanisms that have produced the change. The latter can be generated from a wide range of internal and external factors, such as environmental agents (humidity, sun exposition, etc.) or structural collapses caused by the decay of material, seismic events or natural degradation processes.
Moreover, the final 3D model can contribute to the preservation of the history and memories of these architectural and historical heritage and cultural landscapes, as well as support economic growth by stimulating cultural tourism. In fact, as a part of a wider project including six other areas located within the municipal territory of Reggio Calabria, we are implementing a website and a smartphone app, which will provide the possibility of enjoying a virtual visit of the site, thanks to the numerous media and data collected.
The creation of a type of interactive museum, embedding virtual tours and augmented reality, available both via web browser and smartphone, will certainly help in making the site more accessible and inclusive during particular events (e.g., ordinary maintenance works, pandemic emergency, etc.). Finally, given that Motta Sant’Agata is located outside of the usual urban tourist circuits of Reggio Calabria, this case study can represent a benchmark in valuing the benefit and the impact of digitization intervention in attracting tourists and local people, the final goal of this project. Moreover, the process carried out in this work is applicable to other case studies, as the rules or strategies indicated are well suited to most of the surviving buildings in the existing built landscape.
In conclusion, this study has provided an interesting contribution to the knowledge of the sites of Motta S. Agata and, in particular, of the churches of San Nicola and San Basilio, whose wall painting had never been studied before. The production of this article can also represent an example of how it is possible to make regional cultural heritage accessible to everyone through digital media.


 ,
, 


