
Indoor Activity and Vital Sign Monitoring for Moving People with Multiple Radar Data Fusion


1
School of Artificial Intelligence, Beijing University of Posts and Telecommunications, Beijing 100876, China
2
School of Information and Communication Engineering, Beijing Information Science and Technology University, Beijing 100192, China
*
Author to whom correspondence should be addressed.
Remote Sens. 2021, 13(18), 3791; https://0-doi-org.brum.beds.ac.uk/10.3390/rs13183791
Submission received: 6 August 2021
/
Revised: 12 September 2021
/
Accepted: 13 September 2021
/
Published: 21 September 2021
(This article belongs to the Special Issue Radar Signal Processing and System Design for Urban Health)
Abstract
:The monitoring of human activity and vital signs plays a significant role in remote health-care. Radar provides a non-contact monitoring approach without privacy and illumination concerns. However, multiple people in a narrow indoor environment bring dense multipaths for activity monitoring, and the received vital sign signals are heavily distorted with body movements. This paper proposes a framework based on Frequency Modulated Continuous Wave (FMCW) and Impulse Radio Ultra-Wideband (IR-UWB) radars to address these challenges, designing intelligent spatial-temporal information fusion for activity and vital sign monitoring. First, a local binary pattern (LBP) and energy features are extracted from FMCW radar, combined with the wavelet packet transform (WPT) features on IR-UWB radar for activity monitoring. Then the additional information guided fusing network (A-FuseNet) is proposed with a modified generative and adversarial structure for vital sign monitoring. A Cascaded Convolutional Neural Network (CCNN) module and a Long Short Term Memory (LSTM) module are designed as the fusion sub-network for vital sign information extraction and multisensory data fusion, while a discrimination sub-network is constructed to optimize the fused heartbeat signal. In addition, the activity and movement characteristics are introduced as additional information to guide the fusion and optimization. A multi-radar dataset with an FMCW and two IR-UWB radars in a cotton tent, a small room and a wide lobby is constructed, and the accuracies of activity and vital sign monitoring achieve 99.9% and 92.3% respectively. Experimental results demonstrate the superiority and robustness of the proposed framework.
1. Introduction
With the rapid development of the Internet of Things, remote human sensing has received considerable attention for health-care applications. Measuring humans’ activity and physiological information is crucial for diverse remote monitoring scenarios, ranging from elder fall detection to patient monitoring [1,2].
Various sensors have been applied for remote health-care. Compared with contact devices, such as electrocardiogram (ECG) and photoplethysmograph (PPG), non-contact sensing not only avoids inconvenience and discomfort, but also provides daily health monitoring. Non-contact sensors are mainly classified as vision-based, infrared-based and radio-based. Vision-based sensors suffer from insufficient illumination and raise privacy concerns, while the infrared-based solutions are temperature-sensitive. In radio-based sensors, the radio frequency identification (RFID) tags and Wi-Fi require the participant to be equipped with the dedicated devices, which limit the application scenarios [3]. Radar systems are not affected by light and temperature conditions, leveraging reflected signals from the human body to analyze the activity and vital sign information. Radar systems also show outstanding performance in personnel recognition [4], people counting [5], gait classification [6], human activity recognition (HAR) [7,8,9,10,11,12], vital sign monitoring [13,14] and human identification [15].
To provide multiple observations and more accurate measurements, utilizing multiple radars and fusing multisensory information have been investigated for human sensing. In [16], a bidirectional Long Short Term Memory (LSTM) neural network and a Naive Bayes Combiner (NBC) are combined to fuse data from four radars for human gait classification. A deep learning approach is proposed in [17] for fall detection using Range-Doppler radars. In [18], an adaptive Kalman filtering algorithm is designed to fuse radar data from multiple channels to detect the respiration. [19] develops a distributed MIMO radar system with iterative adaptive approach to localize multiple objects and estimate their respiration rates and heartbeat rates. Although these studies discuss activity detection or respiration monitoring with multiple radars, there still lacks a framework to monitor the activity and vital signs simultaneously for moving people in the indoor environment. Dense and superposed multipaths from multiple people with body movements in a narrow and confined environment bring difficulties for activity monitoring. Moreover, different activities of people lead to varying distances and angles between the radar antenna and the target’s chest, while a large angle and changing distances badly affect the vital sign monitoring accuracy. In addition, the diverse movements of the human body create serious distortions of the vital signals, making it a challenge to extract valid vital sign information.
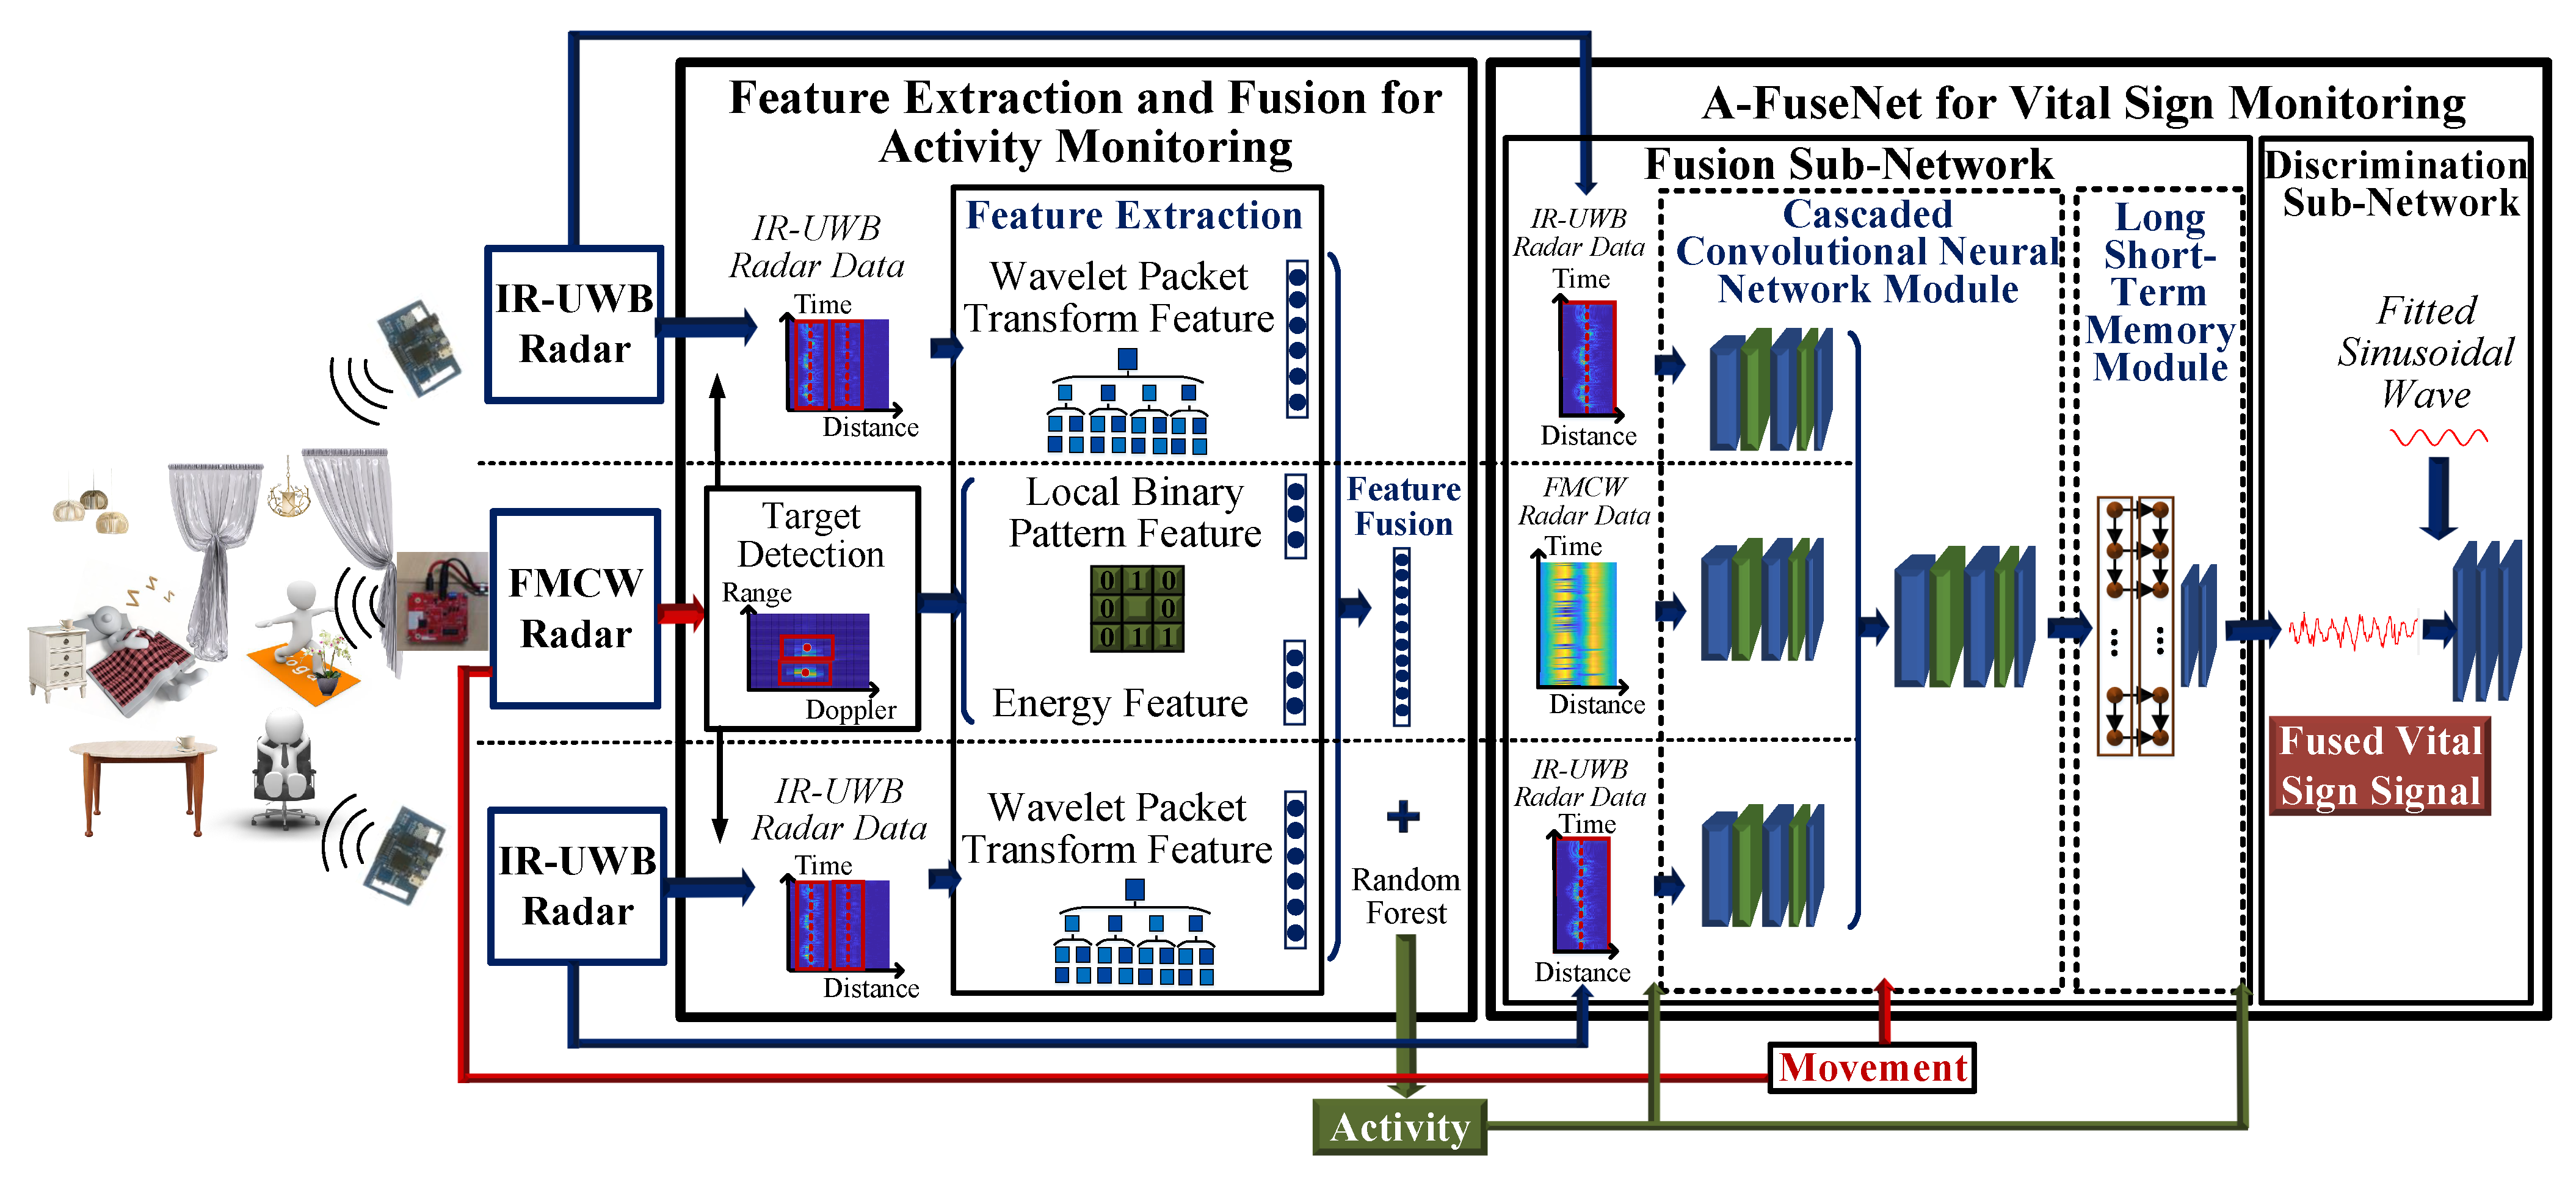
This paper proposes a framework to address these problems, achieving intelligent spatial-temporal information fusion on Frequency Modulated Continuous Wave (FMCW) and Impulse Radio Ultra-Wideband (IR-UWB) radars for indoor activity and vital sign monitoring for moving people. Figure 1 shows the flowchart of the proposed framework, composed by the feature extraction and fusion for activity monitoring, and the A-FuseNet for vital sign monitoring. The main contributions are listed as follows:
- A novel feature extraction and fusion method is proposed with FMCW and IR-UWB radars for activity monitoring with various body movements, combining global and local spatial-temporal distribution information in 3-D space. For FMCW radar, the energy features of the Range-Doppler map (RDM) are extracted as the global spatial distribution, while the local binary pattern (LBP) features of the azimuth-elevation angle spectrum are proposed to complement the local contrast of angles. In addition, continuously received signals in IR-UWB radar are regarded as a 2-D radar matrix for extracting the spatial-temporal texture features with 2-D wavelet packet transform (WPT). These features are concatenated as a vector and combined with a random forest for activity classification.
- The additional information guided fusion network (A-FuseNet) is proposed for robust vital sign monitoring against distortions caused by body movements, to extract, recover and fuse valid heartbeat information. It is proposed with the modified generative and adversarial structure, comprised of a fusion sub-network to generate the fused vital sign signal, and a discrimination sub-network for optimization. Considering the spatial variability and temporal correlation of data from different radars, the fusion sub-network is designed with a Cascaded Convolutional Neural Network (CCNN) module for vital sign information extraction and fusion, as well as an LSTM module to analyze and generate the heartbeat signal with temporal relevance. The discrimination sub-network optimizes the fused signal with a real sample. Moreover, the activity and body movement characteristics are introduced to A-FuseNet as additional information to guide the fusion and optimization.
- A dataset is constructed with an FMCW and two IR-UWB radars in three indoor environments for activity and vital sign monitoring, including a narrow and confined cotton tent, a small room with many sundries, and a wide and empty lobby. The multi-radar data are generated for two people performing three different activities including sitting, standing and lying, with four kinds of body movements including keeping still, arms and legs moving randomly, the upper body waggling back and forth, and turning left and right periodically. Six testers participated in the experiments, and a total of 352 min × 3 radar data were collected. This dataset is now available at https://github.com/yangxiuzhu777/Multi-Radar-Dataset (accessed on 1 July 2021). The accuracies of activity and vital sign monitoring achieve 99.9% and 92.3% respectively on the constructed dataset. Different classifiers and four other methods are compared for activity monitoring, while four other methods are conducted for comparison in vital sign monitoring. The results verify the effectiveness and robustness of the proposed framework.
The remainder of this paper is organized as follows: Section 2 describes the experimental setup and dataset generation. Section 3 presents the proposed feature extraction and fusion for activity monitoring. In Section 4, the proposed A-FuseNet for vital sign monitoring is described in detail. Section 5 presents the experimental results and analysis, while Section 6 concludes this paper.
2. Experimental Setup and Dataset Generation
2.1. Dataset Generation
In this paper, the multi-radar dataset for activity and vital sign monitoring is constructed with an FMCW and two IR-UWB radars. The IR-UWB radar is a System on Chip (SoC) with a built-in transmitter and receiver, based on the XeThru X4M03 chip produced by Novelda AS, Oslo, Norway. It has a center frequency of 7.29 GHz, the bandwidth in the −10 dB concept of 1.5 GHz, and the sampling rate at the receiver of 23.328 GHz. This chip has two differential antennas for transmitter and receiver respectively, which are directional patch antennas with the central angle of 65 on azimuth and elevation. The datasheet and hardware configurations of the X4M03 chip is public available in [20]. The FMCW radar system consists of the IWR1843BOOST module with three transmitting antennas and four receiving antennas, and the DCA1000 data-capture adapter for raw data collection, produced by Texas Instruments Inc Dallas, TX USA. The FMCW transceiver operates at 76 GHz to 81 GHz, with the transmitting power of 12 dBm. The horizontal and elevation angle of the onboard antennas are 50 and 20 in the 6 dB-beamwidth concept, respectively. More hardware and datasheet information about the IWR1843 chip is described in [21]. The personal computer controls two IR-UWB and an FMCW radars by the USB cables, and collects the raw data from three radars.
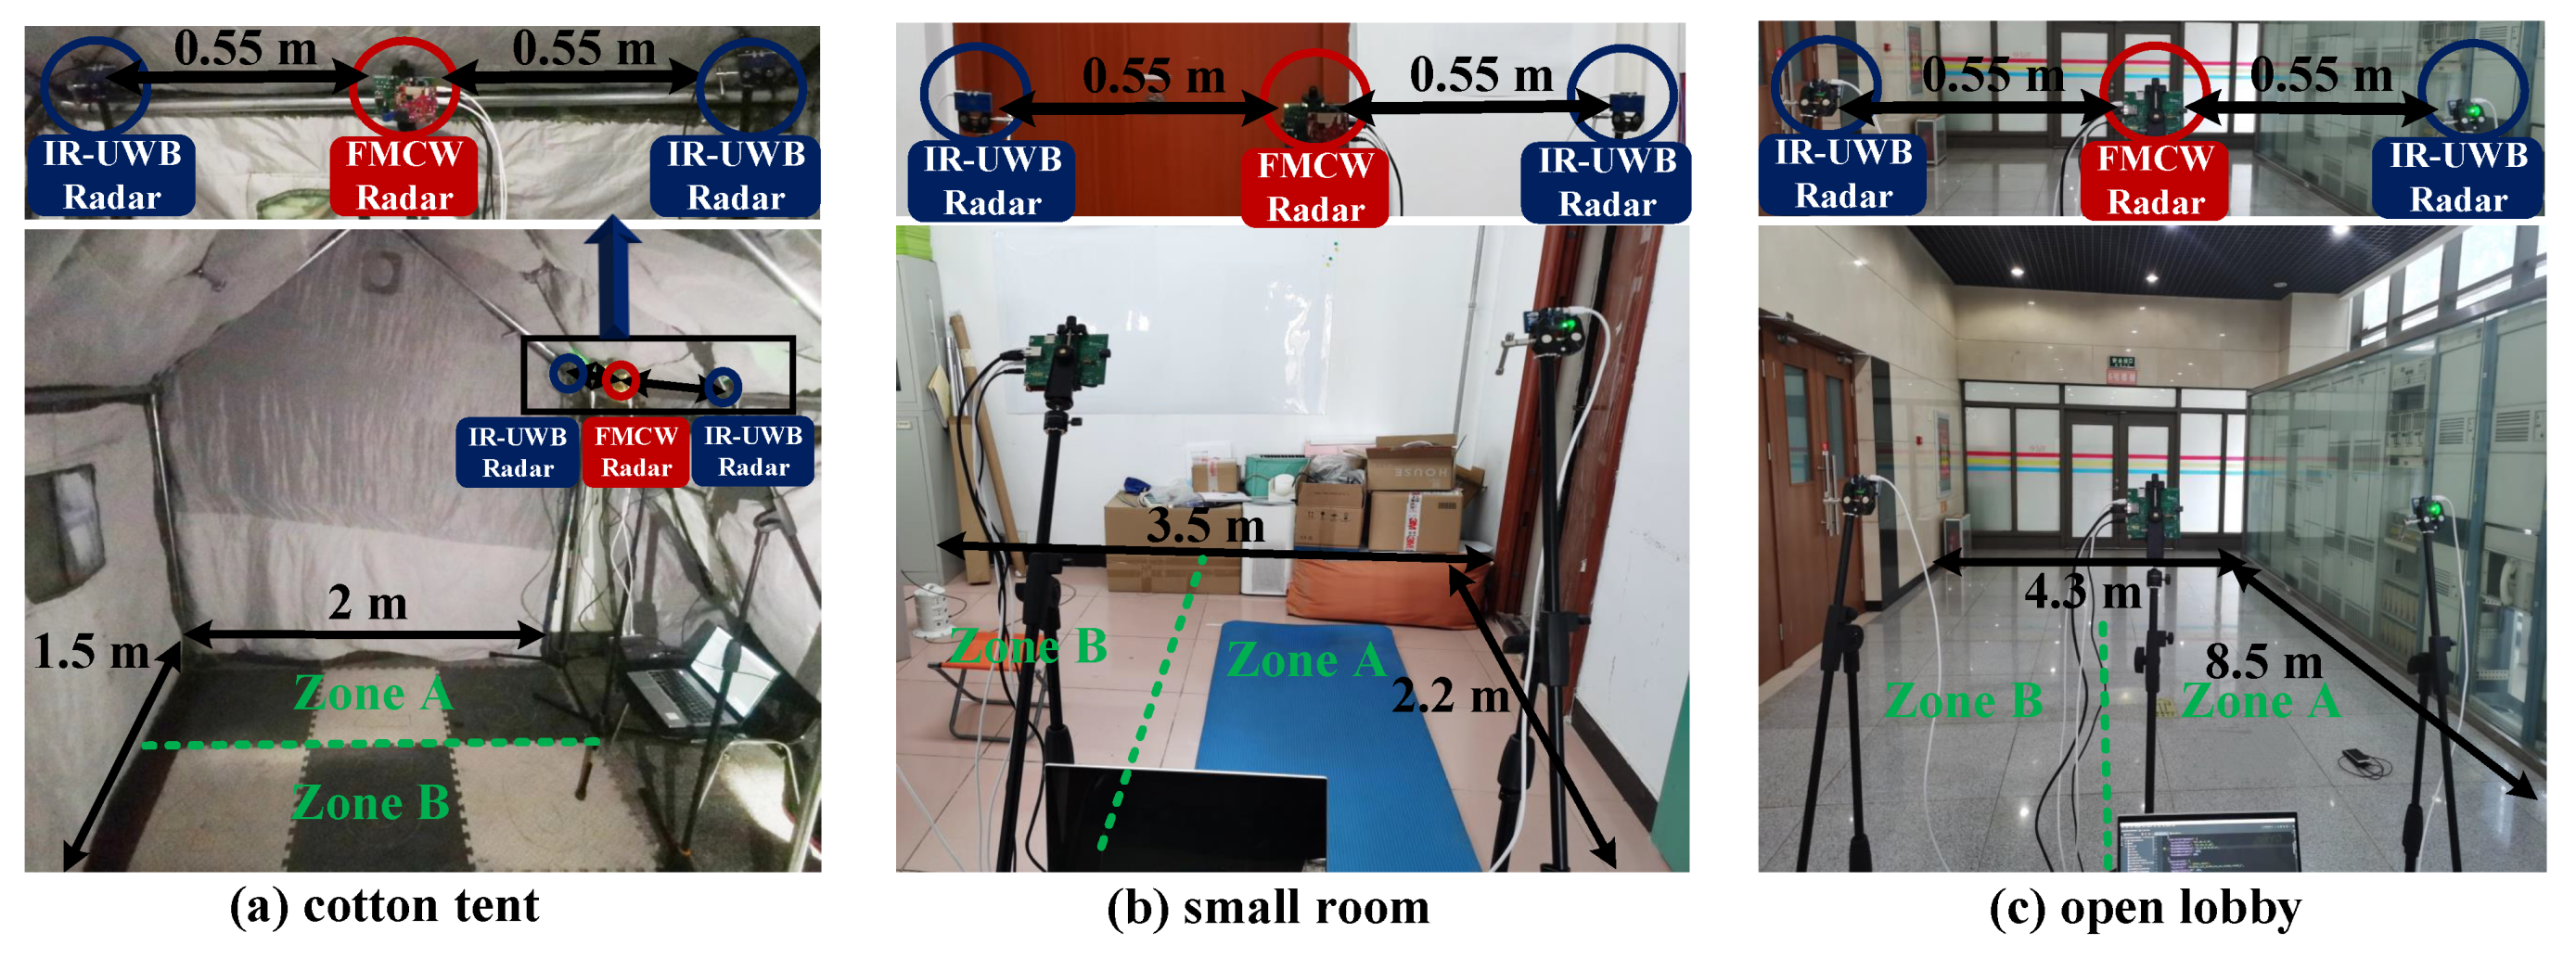
The experimental setup is shown in Figure 2. An FMCW and two IR-UWB radars were employed along a linear baseline at a height of 1.45 m for data collection. The FMCW radar was deployed at the midpoint of two IR-UWB radars, 0.55 m apart from them. In order to validate the performance of the proposed framework, three different indoor environments at Beijing University of Posts and Telecommunications were considered for multi-radar data collection. These indoor environments included: (a) a narrow and confined cotton tent with an area of 1.5 m × 2 m; (b) a 3.5 m × 2.2 m small room with many sundries; and (c) a wide and empty lobby with an area of 4.3 m × 8.5 m, as shown in Figure 2a–c respectively. Participants were required to perform different activities with various body movements in front of three radars. All the radars collected data at 20 frames-per-second. The oximeter with FDA certification served as the reference for vital sign monitoring, and was equipped for each person to record heartbeat rate. These three radars began data collection with multi-thread, and the timestamp was attached to each recorded signal from three radars and the oximeter for data synchronization.
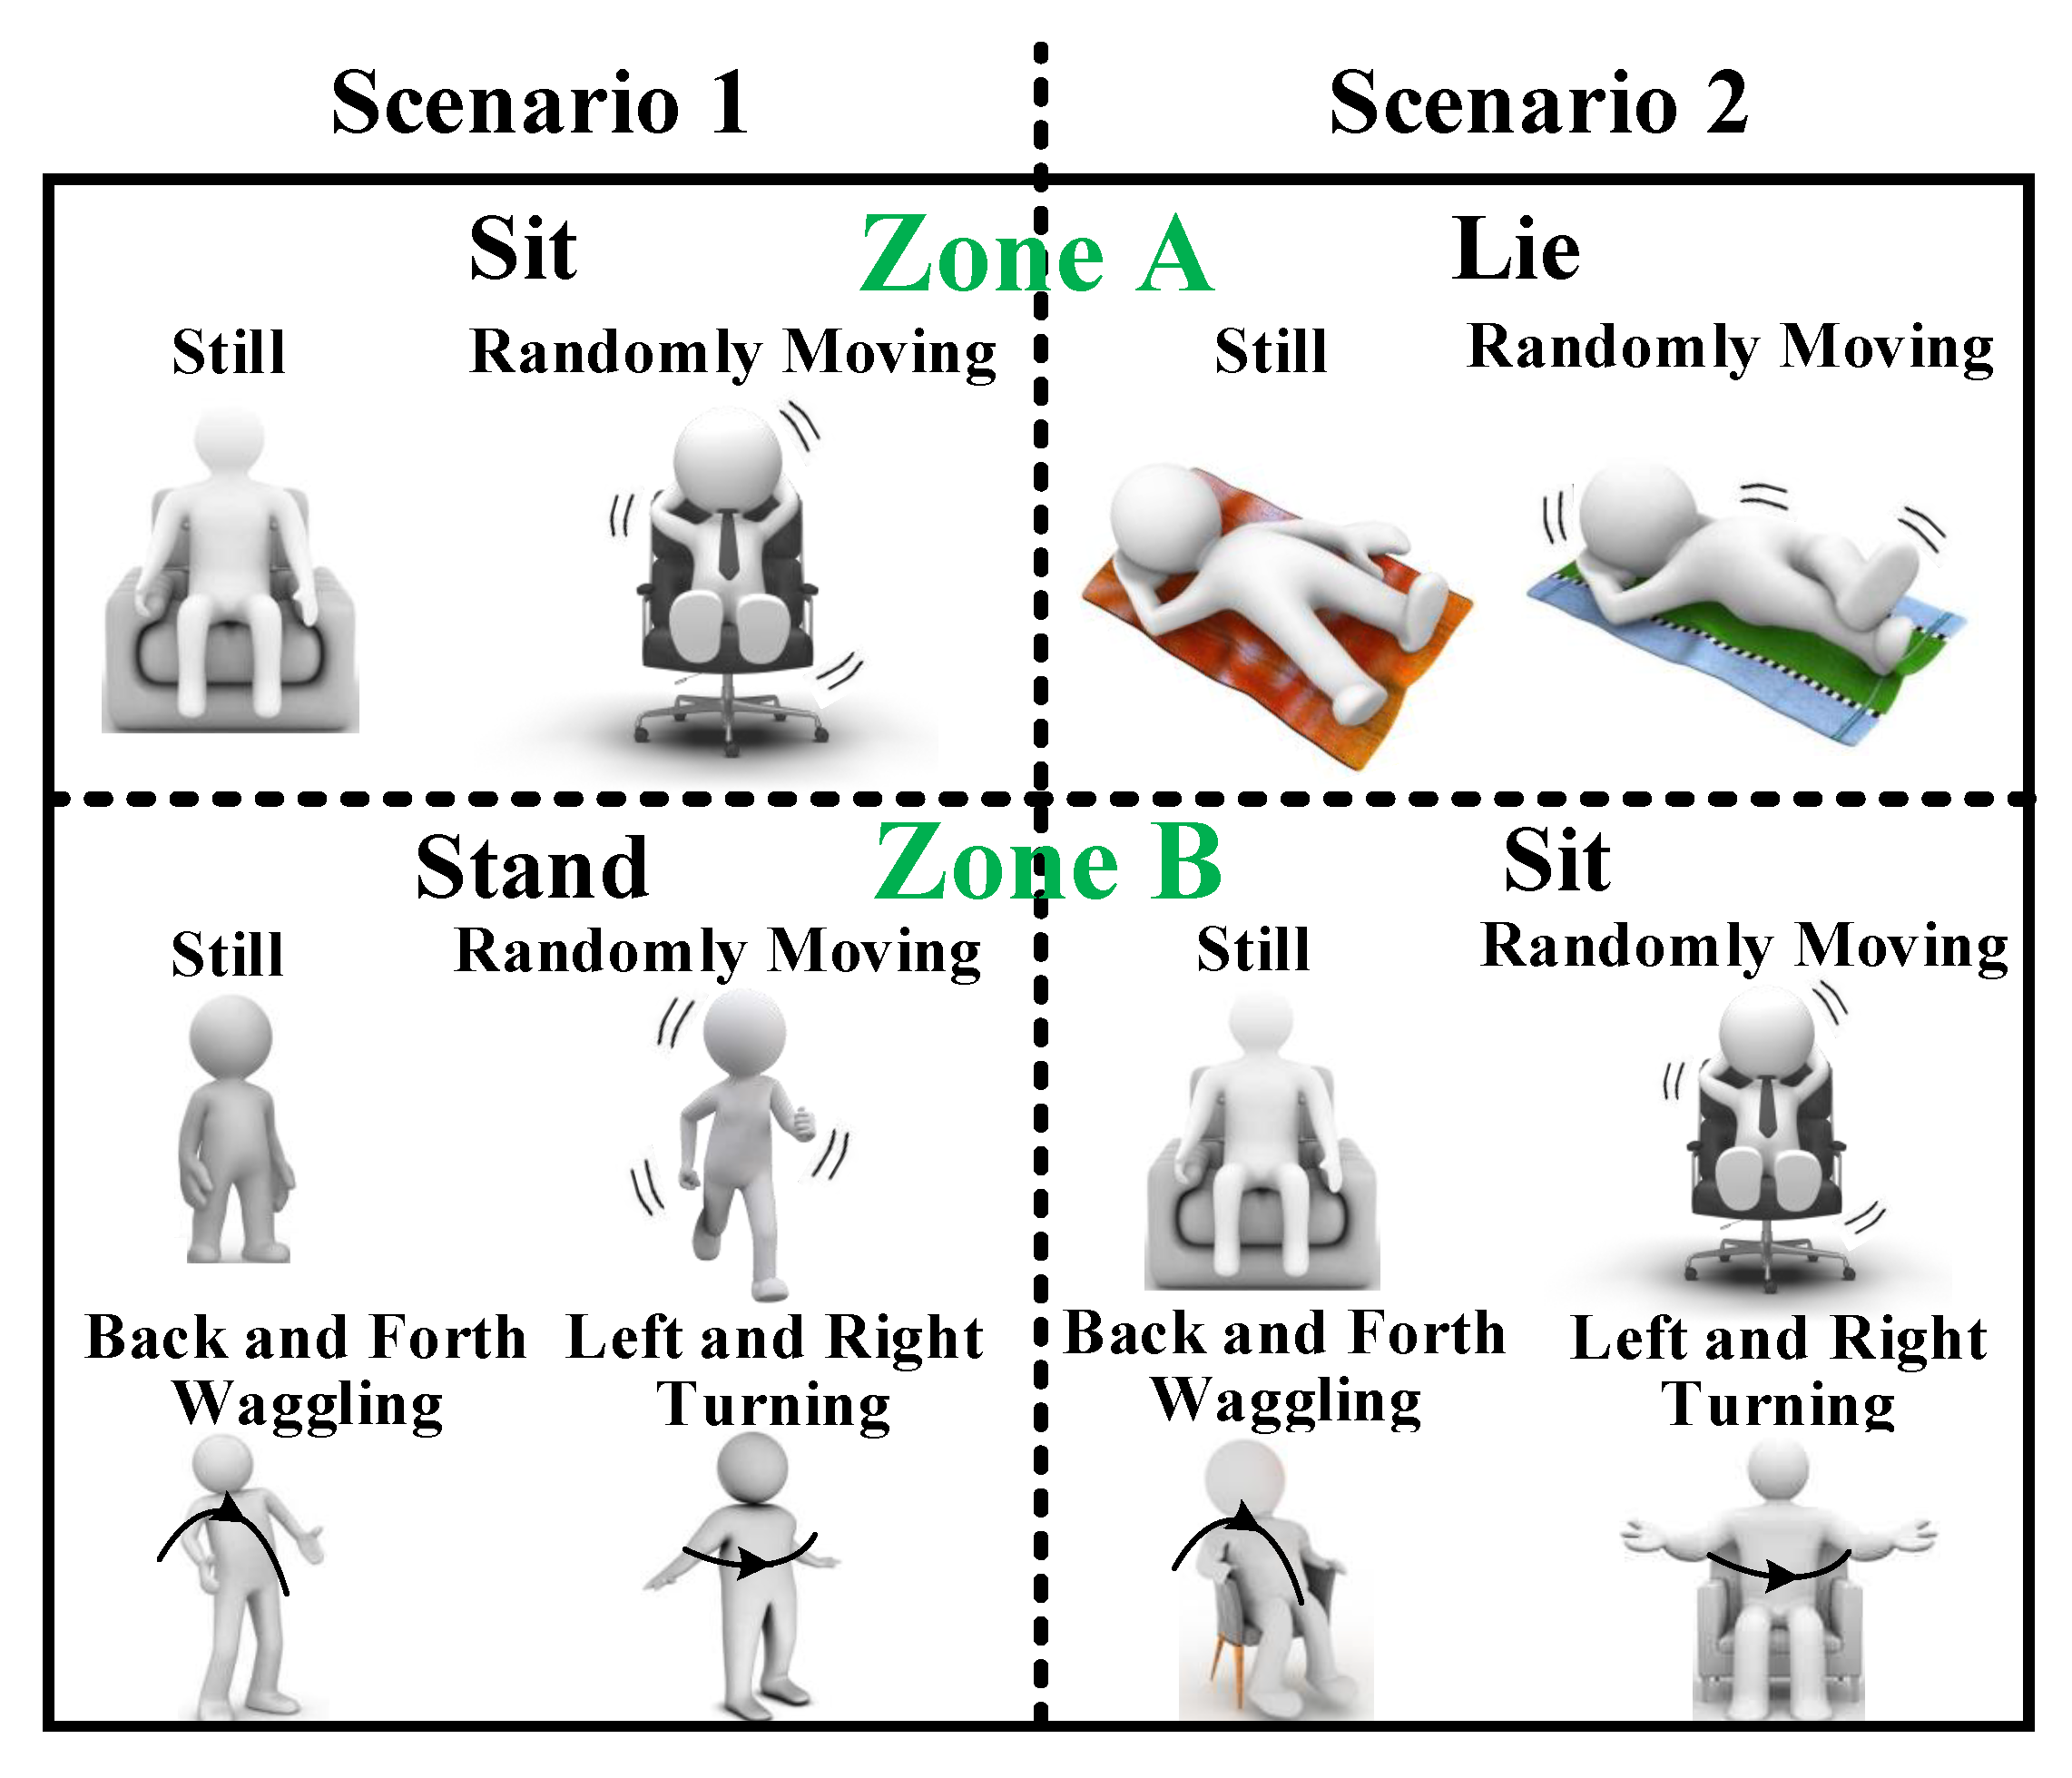
To demonstrate the performance of the proposed framework for activity and vital sign monitoring, two scenarios with 12 conditions were designed for multi-radar data collection. The detecting area was equally divided into two zones A and B. Thus, zones A and B were of equal geometric size, which was 0.75 m × 2 m in the cotton tent, 1.75 m × 2.2 m in the small room, and 2.15 m × 8.5 m in the empty lobby, respectively. Two people performed three different activities with four kinds of body movements in each zone respectively. In scenario 1, as the first column in Figure 3 shows, the people in zone A sat and the other people stood in zone B, with their bodies facing the radars. Scenario 2 involved two people lying down and sitting in zones A and B, respectively, as presented in the second column in Figure 3. In each scenario, the people in zone A kept still or with arms and legs moving randomly, while the other people in zone B performed four different body movements, including keeping still, arms and legs moving randomly, the upper body waggling back and forth, and turning left and right periodically. Eight measurements of different activities and body movements were recorded in each scenario.
Six volunteers participated in the experiments, and a total of 352 min × 3 radar data were collected in these two scenarios. A brief physical description of these participants is listed in Table 1. In this paper, the radar sample was selected for each person with a 10 s duration and a 5-second overlapping, and a total of 6176 × 3 samples were generated.
2.2. FMCW and IR-UWB Radar Signal Model
In the multi-radar dataset, signals from an FMCW radar and two IR-UWB radars were recorded. The IR-UWB radar [22] transmits and receives the impulse signal with a wide bandwidth, providing accurate ranging and strong penetration. The received IR-UWB radar signal is represented as follows:
where denotes the signal echoes from the static environment, and represents the reflected signals from the i-th people. N is the number of detected people. indicates the fast time along signal propagation, while t represents the slow time for accumulating received signals.
The FMCW radar continuously radiates an electromagnetic wave with linear frequency variation during the modulation period. Compared with the IR-UWB radar, the FMCW radar provides multidimensional information including target range, velocity and angle with multiple antennas. The FMCW signal of the i-th detected people with a 2-D MIMO antenna array is expressed as follows [23]:
where r and v represent range and velocity, respectively. is the amplitude coefficient. and indicate the range and velocity resolutions of the FMCW radar. k is the instantaneous wave number. denotes the impulse response function of ranging. For simplicity, it is assumed to be a unit rectangular window. The formulation of f(·) is given as:
The array distance factors and are the projections of the position offset of the a-th Tx and the b-th Rx antennas relative to the array center perpendicular to the radial direction toward to the i-th people.
Sensor fusion has demonstrated advantages in providing abundant information and increasing reliability. In this paper, the FMCW and IR-UWB radars with multiple observations in different positions and angles were combined to obtain heterogeneous and complementary information for activity and vital sign monitoring.
3. Feature Extraction and Fusion for Activity Monitoring
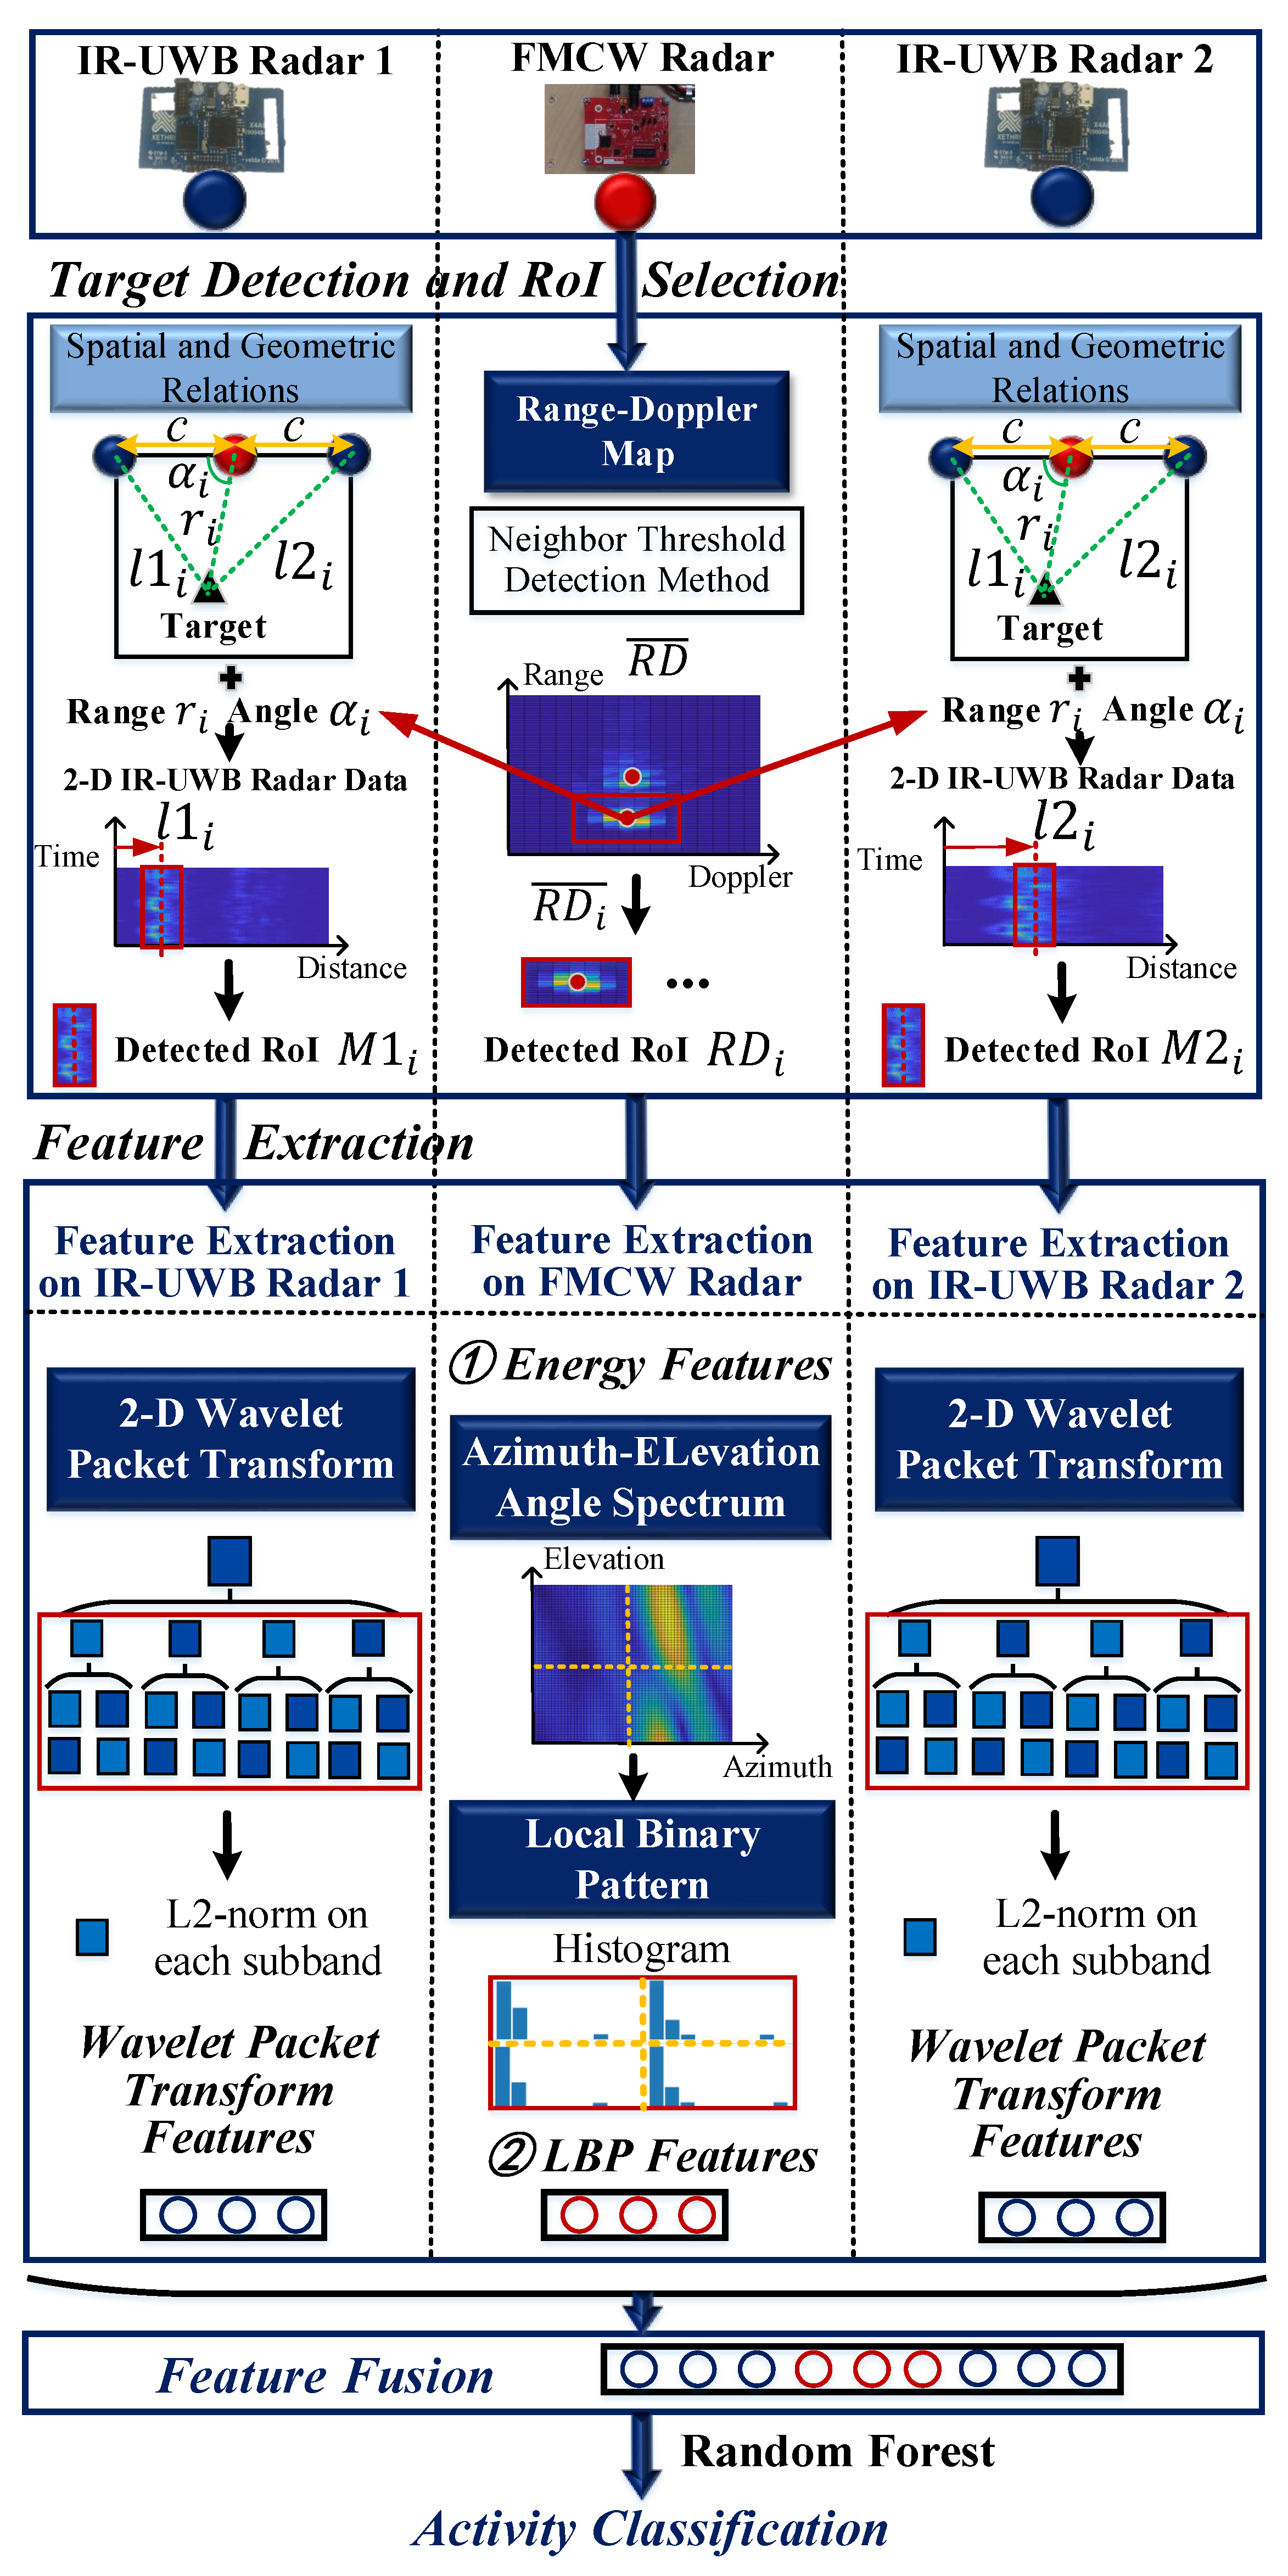
This section introduces the proposed feature extraction and fusion method, to effectively obtain and combine both FMCW and IR-UWB features for activity monitoring. The schematic diagram is shown in Figure 4.
3.1. Target Detection and RoI Selection
Considering the capability of measuring range and angle simultaneously in multitarget situations, the FMCW radar is utilized in this paper to detect and localize two people in the indoor environment. Firstly, the Range-Doppler map (RDM) was obtained by performing 2-D FFT [24] on the raw signal from the FMCW radar. The RDM was then averaged over time to obtain for target detection. The neighbor threshold detection method [23] was applied iteratively to select the point with the local maximal amplitude in , detecting the distance and velocity of the i-th target. The azimuth angle was then computed with angle FFT. According to the spatial and geometric relations of the relative positions between the FMCW radar and two IR-UWB radars, as well as the range and angle , the radar-to-target distances and of the i-th target on IR-UWB radars 1 and 2 were computed respectively, as shown in Figure 4.
In order to obtain sufficient and consistent information on each target with multipaths, the Region of Interests (RoI) of FMCW and IR-UWB radars were selected in the areas containing multiple reflected signals from the target. Dense multipaths make it unstable and unreliable for detecting the activity with a single received signal. Therefore, the RoIs were obtained during a period of time to include the time-varying information from continuously received signals. The RoIs for the i-th target of an FMCW and two IR-UWB radars are , and respectively, which are defined as follows:
where and are the distance and velocity of the RoI in FMCW radar, of which the central points are and of the i-th target. and represent the distances in RoIs with IR-UWB radars 1 and 2 respectively, with the central distances of and . and indicate half of the distance and velocity ranges of RoI in FMCW radar, while is half of the distance range with that of IR-UWB radar. To discriminate each person from the dense multipath signals, the spatial range of RoI should be similar to a certain physical parameter, such as a person’s height or shoulder width [5]. Therefore, the distance of RoIs in all three radars was set as the ordinary width of a person’s shoulder—40 cm—for more detailed personal information extraction. The bin numbers in RoIs along the distance range of the FMCW radar and two IR-UWB radars are 9 and 63, respectively. Accordingly, and were 20 cm, while was set as 0.3 m per second to include the range of movement speed from a person. The selected RoIs in an FMCW and two IR-UWB radars were then applied for feature extraction.
3.2. Energy and LBP Feature Extraction on FMCW Radar
In FMCW radar, the global spatial distribution and general intensity of people with different activities was first extracted by the averaging energy feature from . In addition, considering that various activities in the 3-D space lead to dissimilar dynamic scattering in both the transverse and longitudinal angle dimensions, a 2-D angle-FFT [25] was conducted to obtain the azimuth-elevation angle spectrum for feature extraction.
Local binary pattern (LBP) is a texture analysis algorithm, and has been widely used in image classification. It describes the local contrast of image texture by comparing the value of a central pixel with that of the neighboring pixels in a circle. LBP thresholds the pixels and creates a binary code to measure the local distribution of textures. In this paper, the LBP was introduced on the azimuth-elevation angle spectrum to extract the local changing and divergent features on different angles. The rotation invariant uniform (riu2) mapping of LBP [26] has a lower dimension of the histogram, which is calculated as follows:
where and represent the gray values of the central pixel and the neighboring pixels respectively. I is the number of neighbors and R denotes the radius. represents the signum function. is defined as:
The histogram of LBP is listed as a feature, which describes the local distinction in the azimuth-elevation angle with various activities. In order to obtain more detailed local distribution information, the azimuth-elevation angle spectrum was divided into four equal-size blocks, and LBP was performed on each block for feature extraction.
3.3. Wavelet Packet Transform Feature Extraction on IR-UWB Radar
Considering the motion continuity and time consistency, the activity information in a 2-D IR-UWB radar matrix is regarded as textures with spatial-temporal distribution. The wavelet packet transform (WPT) [27] decomposes signals into low and high frequencies as a tree of subspaces. Compared with the wavelet transform, WPT provides a higher time-frequency resolution to obtain more refined detailed information. In this approach, the IR-UWB radar data is decomposed at various scales with both detail and approximation information. The scaling function and the wavelet function with the j-th scale and k-th subband index in WPT are shown as:
where represents the dilation parameter for scaling and is the translation parameter for wavelet locating.
In this paper, 2-D WPT is introduced to decompose the IR-UWB radar data into two layers with 4 and 16 subbands respectively. Different activities and movements of the human body create various local spatial-temporal distributions in radar data, leading to changes in both approximation and detail scales. To characterize radar signals at all scales, the wavelet packet coefficient sequences in all 20 subbands were selected for feature extraction. The low-frequency coefficients represent the general distributions and tendencies of the radar data caused by different activities, while the high-frequency coefficients show the refined edge information varying with slight body movements and multipaths. To describe the energy level of each subband with general and refined information, the L2-norms of each wavelet packet coefficient sequence were computed as features. The WPT features were extracted from two IR-UWB radars for multiple observation information from different angles.
3.4. Feature Fusion for Activity Monitoring
The energy and LBP features extracted from the FMCW radar, as well as the WPT features obtained from two IR-UWB radars were then directly concatenated as a feature vector for activity monitoring. Random forest served as an ensemble classifier consisting of decision trees, and was utilized and combined with the feature vector to classify activities.
4. A-FuseNet for Vital Sign Monitoring
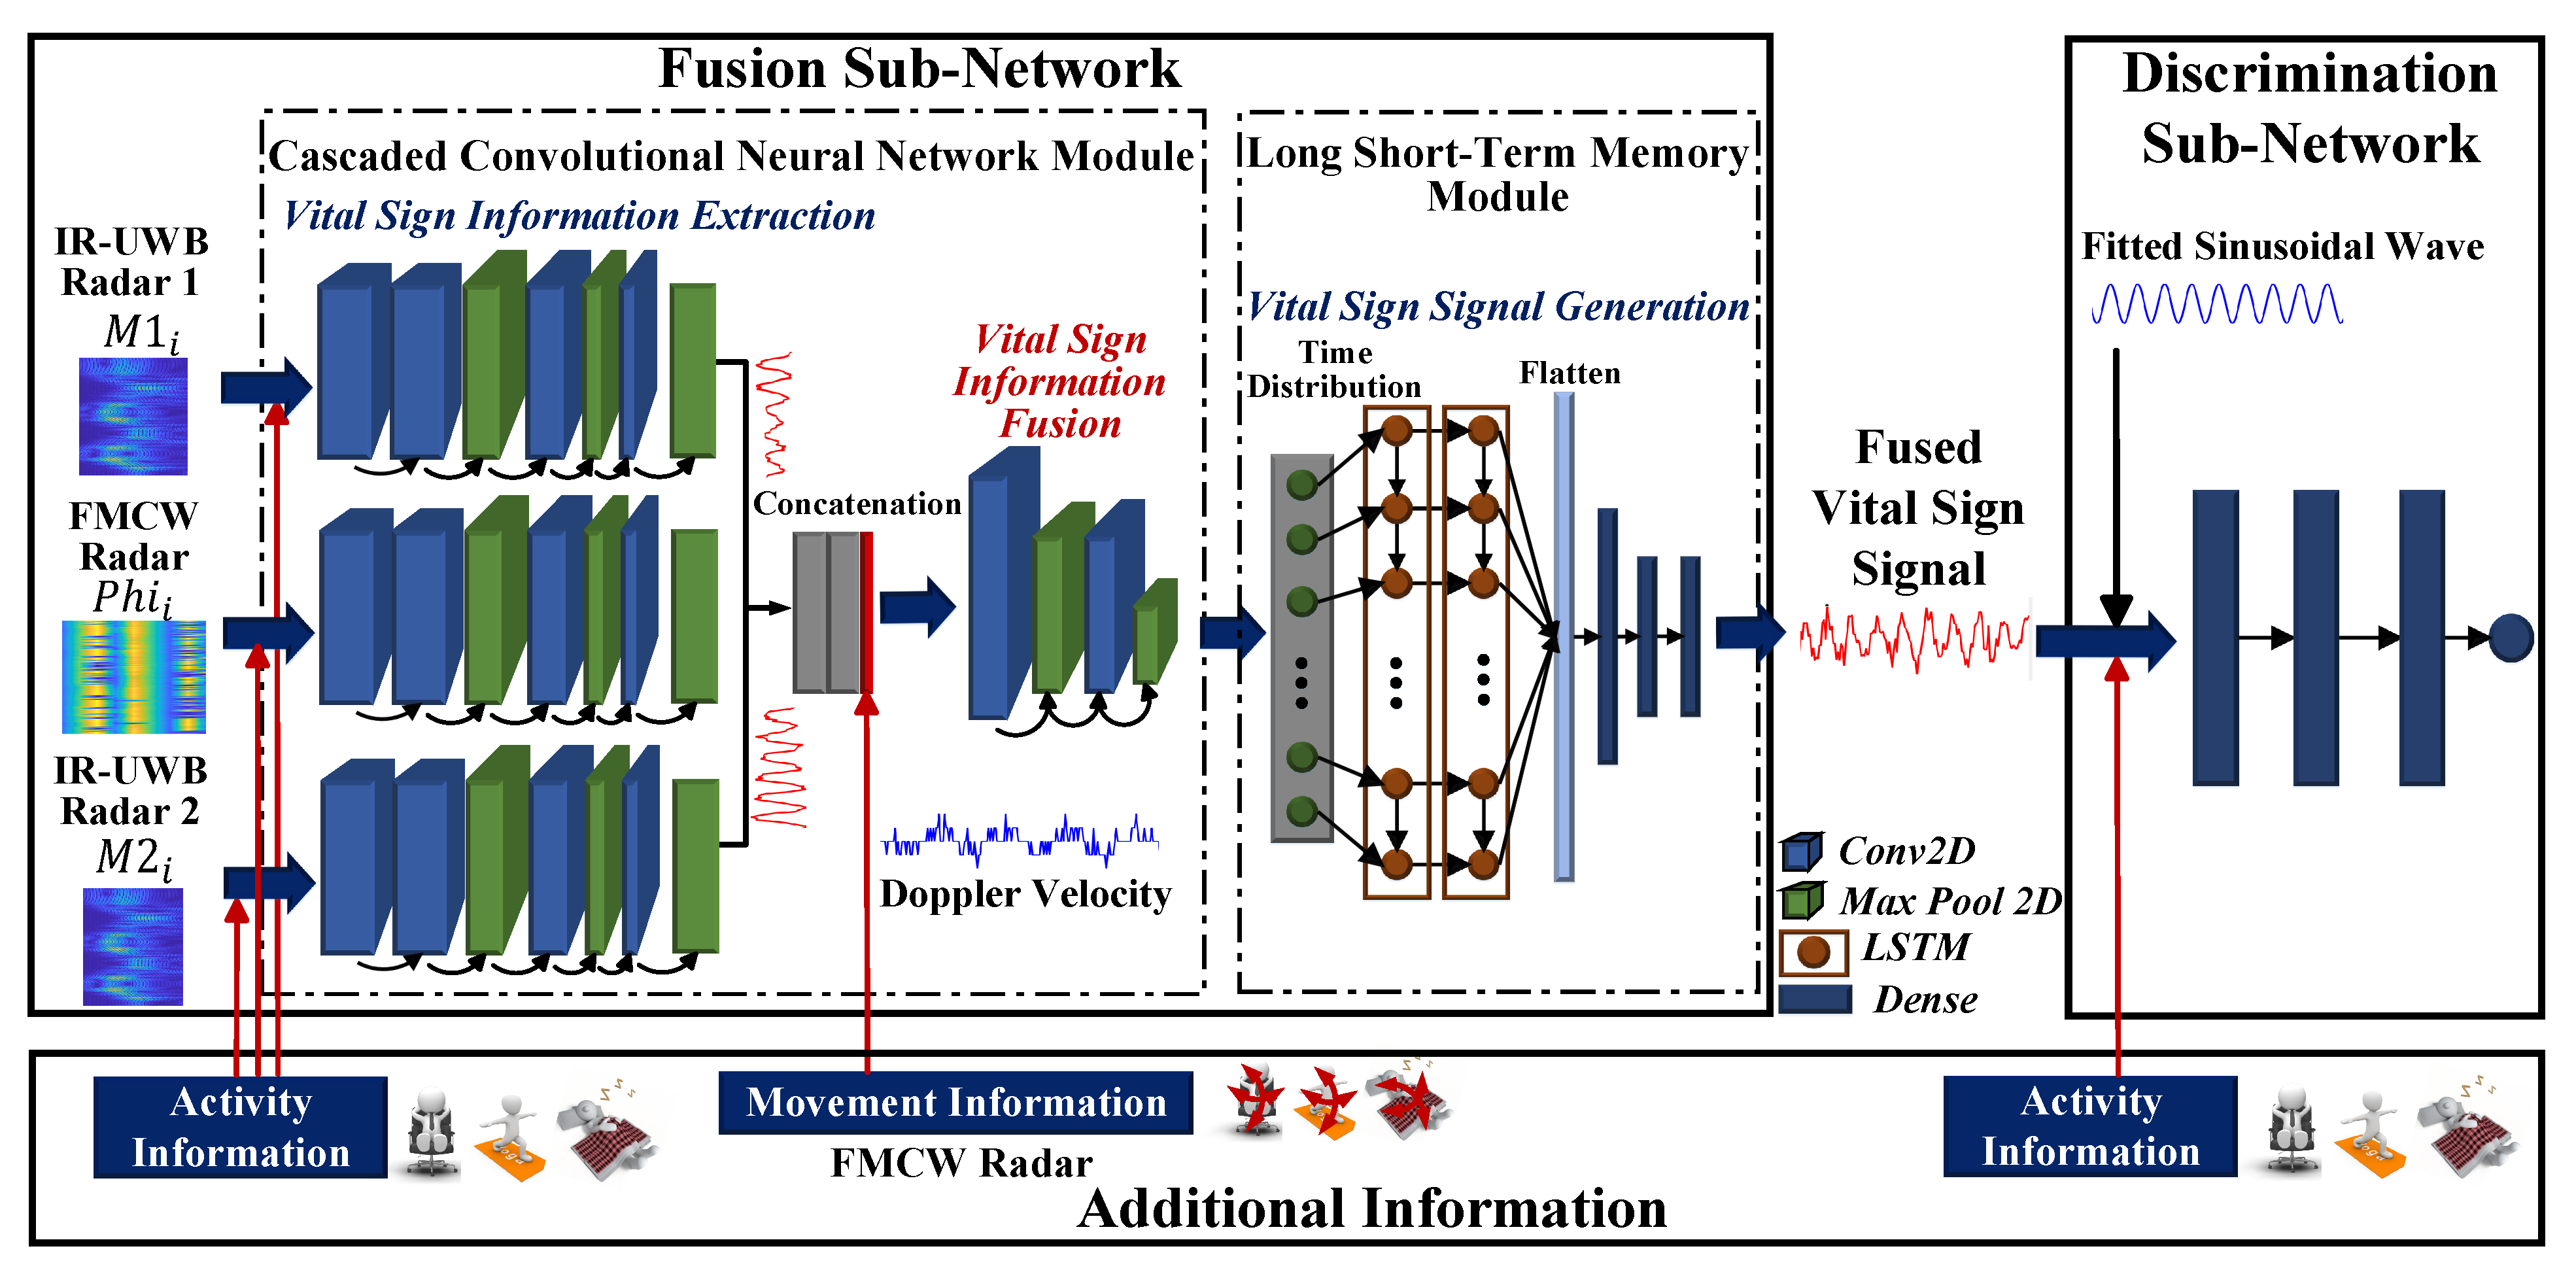
Besides human activities, vital signs serve as one of the most significant indicators for human health monitoring. IR-UWB and FMCW radars measure the chest movement with high resolution, and have been widely investigated for vital sign monitoring. Moreover, FMCW radar provides more abundant movement information such as velocity. In this paper, two IR-UWB and an FMCW radars were utilized for providing different observations of the target’s cardiopulmonary activity, and the FMCW radar was also used for complementing the additional movement information. This section introduces the proposed additional information guided fusing network (A-FuseNet) to generate effective vital sign signals, and the structure is shown in Figure 5.
4.1. Structure of A-FuseNet
The deep neural network has exhibited potential for multimodal data fusion and detection [28]. In order to deal with signal distortions and achieve an effective fusion, this paper proposes A-FuseNet to recover, extract and fuse vital sign signals, combining the spatial-temporal and correlation information from several radars.
The movement of a human chest measured by IR-UWB radar was modeled as the summation of the target-to-antenna distance and the displacement caused by the cardiopulmonary activity, presented as follows:
The cardiopulmonary displacement is approximately sinusoidal, which is caused by the heaving chest due to breathing and heartbeat motions. and represent the displacement amplitudes of respiration and heartbeat. and denote the respiration and heartbeat frequencies respectively. Traditional signal processing methods select the signal with the maximal variance or energy as the most vital sign information, and decompose it to obtain respiration and heartbeat signals. However, the vital sign signals are reflected from many points of the human chest, and some of them are distorted during body motions. The decomposition on a single signal leads to the loss of valid vital sign information. Therefore, the detected RoIs and of the i-th people from IR-UWB radars 1 and 2 with more complete information are utilized for vital signal generation. In FMCW radar, the cardiopulmonary activity information is captured from the phase , which is given by:
where denotes the wavelength of FMCW radar. represents the distance between the radar and the i-th human’chest, which is the summation of the target-to-antenna distance and the physiological displacement distance due to the breathing and heartbeat activities. Considering that body movements conceal and distort the vital signals, it is also unreliable for analyzing the single phase in a fixed range of FMCW radar. Accordingly, the phase matrix was selected with the spatial range of the detected RoI from FMCW radar to include more complete vital sign information. For IR-UWB and FMCW radars, , and contain the distance variation information caused by human cardiopulmonary activity and the body movement interference, which include the reflections from the same motion condition and share the tendency of movement changes. In addition, they both capture the tiny movements of the human chest for vital sign monitoring, and the high range resolution in IR-UWB radar and the high sensitivity of phase information in FMCW radar complement each other. Therefore, , and were input to A-FuseNet for body movement cancellation, heartbeat signal extraction and vital sign information fusion.
A-FuseNet is proposed with the modified generative and adversarial structure, consisting of two adversarial sub-networks. The fusion sub-network F combines two IR-UWB radar data (, ) and the FMCW radar data , extracting vital sign information from them and generating the fused vital signal . The discrimination sub-network D distinguishes the fused signal from the real vital sign signal o with a binary classification. Considering that various activities and movements bring different distortions to the radar signals, the additional information is added in two sub-networks to guide the fusion and discrimination. In the optimization process [29], D is trained to maximize the discrimination , while F is to minimize . The objective function of A-FuseNet is defined as follows:
In the fusion sub-network, considering the spatial variability and temporal correlation of data from three radars, a Cascaded Convolutional Neural Network (CCNN) module was designed to extract vital sign information from each radar and the correlations observed in different positions for effective fusion. To further analyze the temporal relevance in heartbeat waveform, a Long Short-Term Memory (LSTM) module was followed to generate the fused vital sign signal. In CCNN module, three channels of 2-D CNN each with four layers were first applied to two IR-UWB and an FMCW radar data respectively to remove motion interference and extract valid vital sign information. The produced 2-D feature maps in three channels were then concatenated, and two CNN layers were followed to fuse the vital sign features from different observations. Each layer of CNN includes the batch normalization and ReLU activation, and max-pooling layers were applied. Considering the temporal continuity of time-varying vital sign signals, the LSTM module with two layers was designed to recover periodic heartbeat waveform features by capturing temporal dependency in the feature sequence. Each LSTM layer has the hyperbolic tangent (tanh) activation function. Finally, three fully connected layers were utilized to integrate features and generate the fused heartbeat signal.
The discrimination sub-network was implemented to optimize the fused vital sign signal with a real sample. In this paper, the real sample was a sinusoidal wave fitted from an oximeter with the measured frequency of the heartbeat rate. The fused heartbeat signal from the fusion sub-network was regarded as the fake waveform, while the fitted sinusoidal wave was the real waveform. The discrimination sub-network consisted of three fully connected layers to obtain periodic features, map them to the sample space and output the probability of the real or fake waveform. The sigmoid function was utilized to activate the output layer of the discrimination sub-network. During the training process, the fusion and discrimination sub-networks were trained alternately to optimize the fused vital sign signal. The Adam optimizer was used in both sub-networks for the weights update.
4.2. Additional Information
Different activities lead to various radar-to-target angles and distances, which have distinct effects on received signals from three radars. Furthermore, different body movements bring diverse types and degrees of distortions on the vital sign signals. Considering that activities and body movements are significant and the major influence in vital sign signal extraction, they were introduced into A-FuseNet to serve as additional information to guide the fusing process. The additional information assists in generating the desirable fused vital sign signal with specific conditions [30] as a reference, which produces the heartbeat signal conditioned on different activity and body movement status.
4.2.1. Additional Activity Information
The radar-to-target angles and distances, as well as the distribution of multipaths reflected from the human body, vary among diverse activities. Moreover, the changes in received signals are different in three radars deployed at different observation locations. Thus the activity category obtained from Section 3 was introduced in the fusion sub-network to assist vital sign information extraction for two IR-UWB and the FMCW radars respectively. Furthermore, the additional activity information was also added to the discrimination sub-network to guide and modify the vital sign signal optimization.
4.2.2. Additional Movement Information
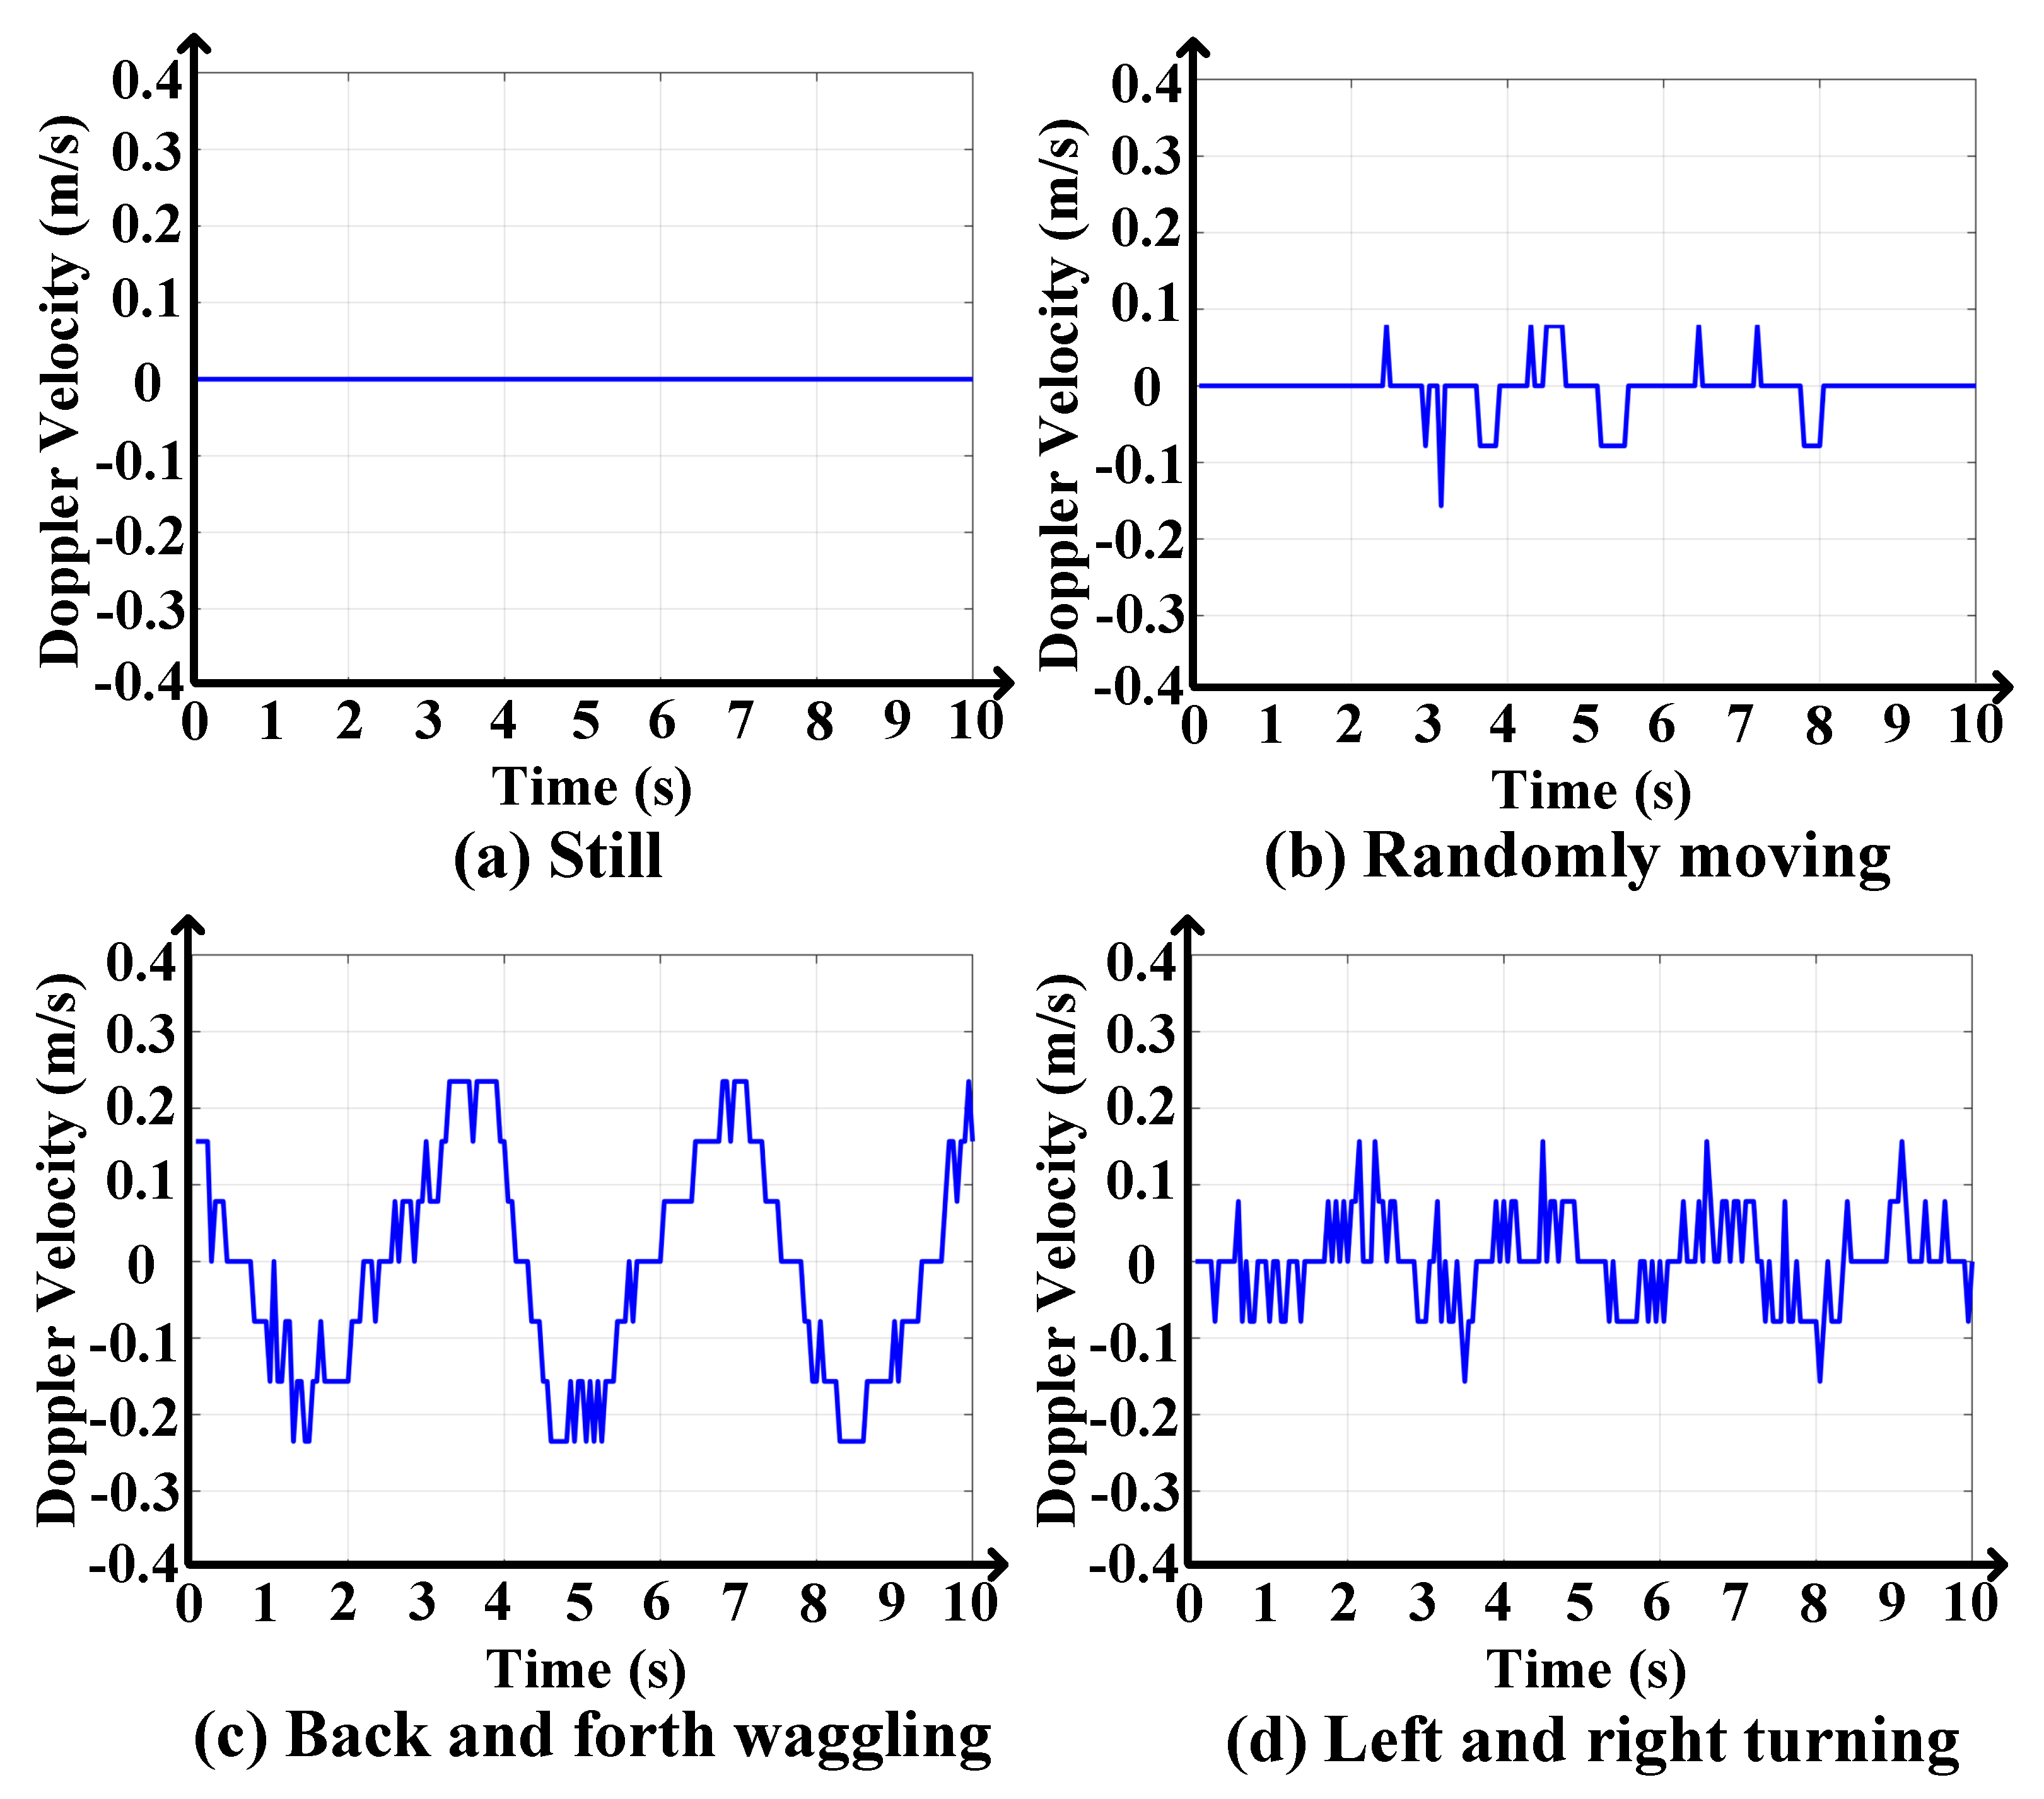
Different body movements distort the vital sign signals in various modes and degrees. Thus, the movement information is crucial for appropriately selecting and recovering the vital sign information with deteriorations in conditions of various motions. The variation of Doppler velocity from the FMCW radar represents the changing tendencies and degrees with different sorts of movements in diverse manners [31]. Therefore, the Doppler velocity trajectory was obtained from the RoI of FMCW radar as the following equation to describe the variations on Doppler velocity:
where identifies the target-to-radar distance trajectory, and represents the Doppler velocity trajectory.
The Doppler velocity trajectories for four different body movements during 10 s of sitting people are illustrated in Figure 6, including staying still, moving randomly, the upper body waggling back and forth periodically, and turning left and right periodically. As Figure 6a shows, the Doppler velocity keeps 0 m/s for people staying still, whereas it fluctuates positively and negatively with body motions in Figure 6b–d. The periodicity of body movements is obviously observed in both back and forth waggling and left and right turning, while the random motion leads to irregular changes on Doppler velocity. Moreover, the variation difference in back-and-forth movement is larger and the trajectory is smoother than that with left-and-right turning, presenting more distinct velocity changes. The Doppler velocity trajectories present the body movement features in dissimilar ways, which provide prior-knowledge of movement status and assist in recovering the heartbeat signal in the condition of different distortion levels and modes. They were introduced as the additional movement information in the fusion sub-network to assist vital sign features recovery and heartbeat signal generation.
5. Experimental Results and Analysis
In this section, experimental results on the constructed dataset for activity and vital sign monitoring are analyzed. In addition, the performance of the proposed framework is evaluated by comparing it with different methods.
5.1. Performance Analysis and Evaluation with Different Classifiers for Activity Monitoring
The multi-radar features were utilized to train a classifier and determine the activity category. The proposed feature sample is a vector with a size of 1 × 113, which is the concatenation of a 1 × 1 energy feature vector and a 1 × 72 LBP feature vector from the FMCW radar, and a 1 × 40 WPT feature vector from two IR-UWB radars. In order to validate the effectiveness of the proposed feature extraction and fusion, three classifiers including a decision tree, a random forest and an AdaBoost are compared. The decision tree is a tree structure to divide cases into subtrees at each leaf node. 500 decision trees are combined to construct the random forest classifier in this paper. The AdaBoost concatenates a succession of weak learners with SAMME.R algorithm.
In the experiments for activity monitoring, four metrics, including accuracy, precision, recall and F1 scores are computed to evaluate the classification performance [32]. True positive (TP) and true negative (TN) are the numbers of samples which are correctly predicted of the positive and negative classes respectively. False positive (FP) is the outcome of the model incorrectly predicts the positive class, while false negative (FN) represents the numbers of incorrect predictions of the negative class. The evaluation metrics are calculated as shown below:
Of the feature samples, 80% are randomly selected to train the classifiers, whereas the remaining samples are utilized for testing and calculating the evaluation metrics. This procedure is repeated 20 times on each classifier with the randomly chosen samples.
The results of classification performance for activity monitoring with different classifiers are presented in Table 2. The accuracies with three classifiers all exceed 98.0%, proving the effectiveness and stability of the proposed features for activity classification. The random forest achieves the highest accuracy of 99.9%, while both the random forest and the decision tree have the highest precision, recall and F1 scores with 100%.
Table 3 shows the confusion matrix of activity classification with the random forest. Standing achieves the best performance with an accuracy of 100%, while lying has the lowest accuracy of 99.7% and 0.3% of this activity is misclassified as sitting. This result is conceivable because the reflected signals of lying and sitting people have weaker variations, which makes it hard to distinguish them from the interference from four kinds of body movements. Table 4 indicates the activity monitoring accuracies in three indoor environments and on the whole dataset. It is observed that the wide lobby presents the highest accuracy of 100%, while the small room has the lowest accuracy of 99.7%. The small room with many sundries brings dense and complex multipaths, which makes it difficult to distinguish the activities from the various body movements of people. In contrast, the wide and empty lobby conducts fewer obstructions and reflections, achieving the best monitoring performance. The cotton tent is a narrow and confined space, which yields dense multipaths for two people’s activity monitoring. The accuracies of the three indoor environments all exceed 99.7%, demonstrating the effectiveness of the proposed framework, and the robustness of activity monitoring in different indoor environments. Table 5 presents the activity monitoring accuracies for participants P1 to P6 described in Table 1. The accuracies for P1, P4, P5 and P6 all achieve 100%, while the lowest accuracy is obtained for P2 and P3 at 99.7%. The results validate the activity classification capability of the proposed framework for different persons. The activity monitoring accuracies in 12 conditions described in Figure 3 are presented in Table 6. The monitoring accuracies of lying in Zone A with randomly moving and sitting in Zone B with randomly moving in scenario 2 are 99.0% and 99.5% respectively, while the accuracies in other conditions all achieve 100%. In scenario 2, the activities of lying and sitting while randomly moving are misclassified. It is explained that the reflections from the human body are relatively weak when lying down, and different random movements increase the error rate.
Figure 7 illustrates the classification accuracies with different proportions of training feature samples for activity monitoring based on random forest. It is shown that larger proportions of training samples bring a better performance, and the accuracy tends to be stable when the proportion reaches 70%. The classification accuracy is over 97.5% even with only 10% of training samples, demonstrating the robustness of the proposed feature extraction and fusion.
5.2. Performance Comparison with Other Features for Activity Monitoring
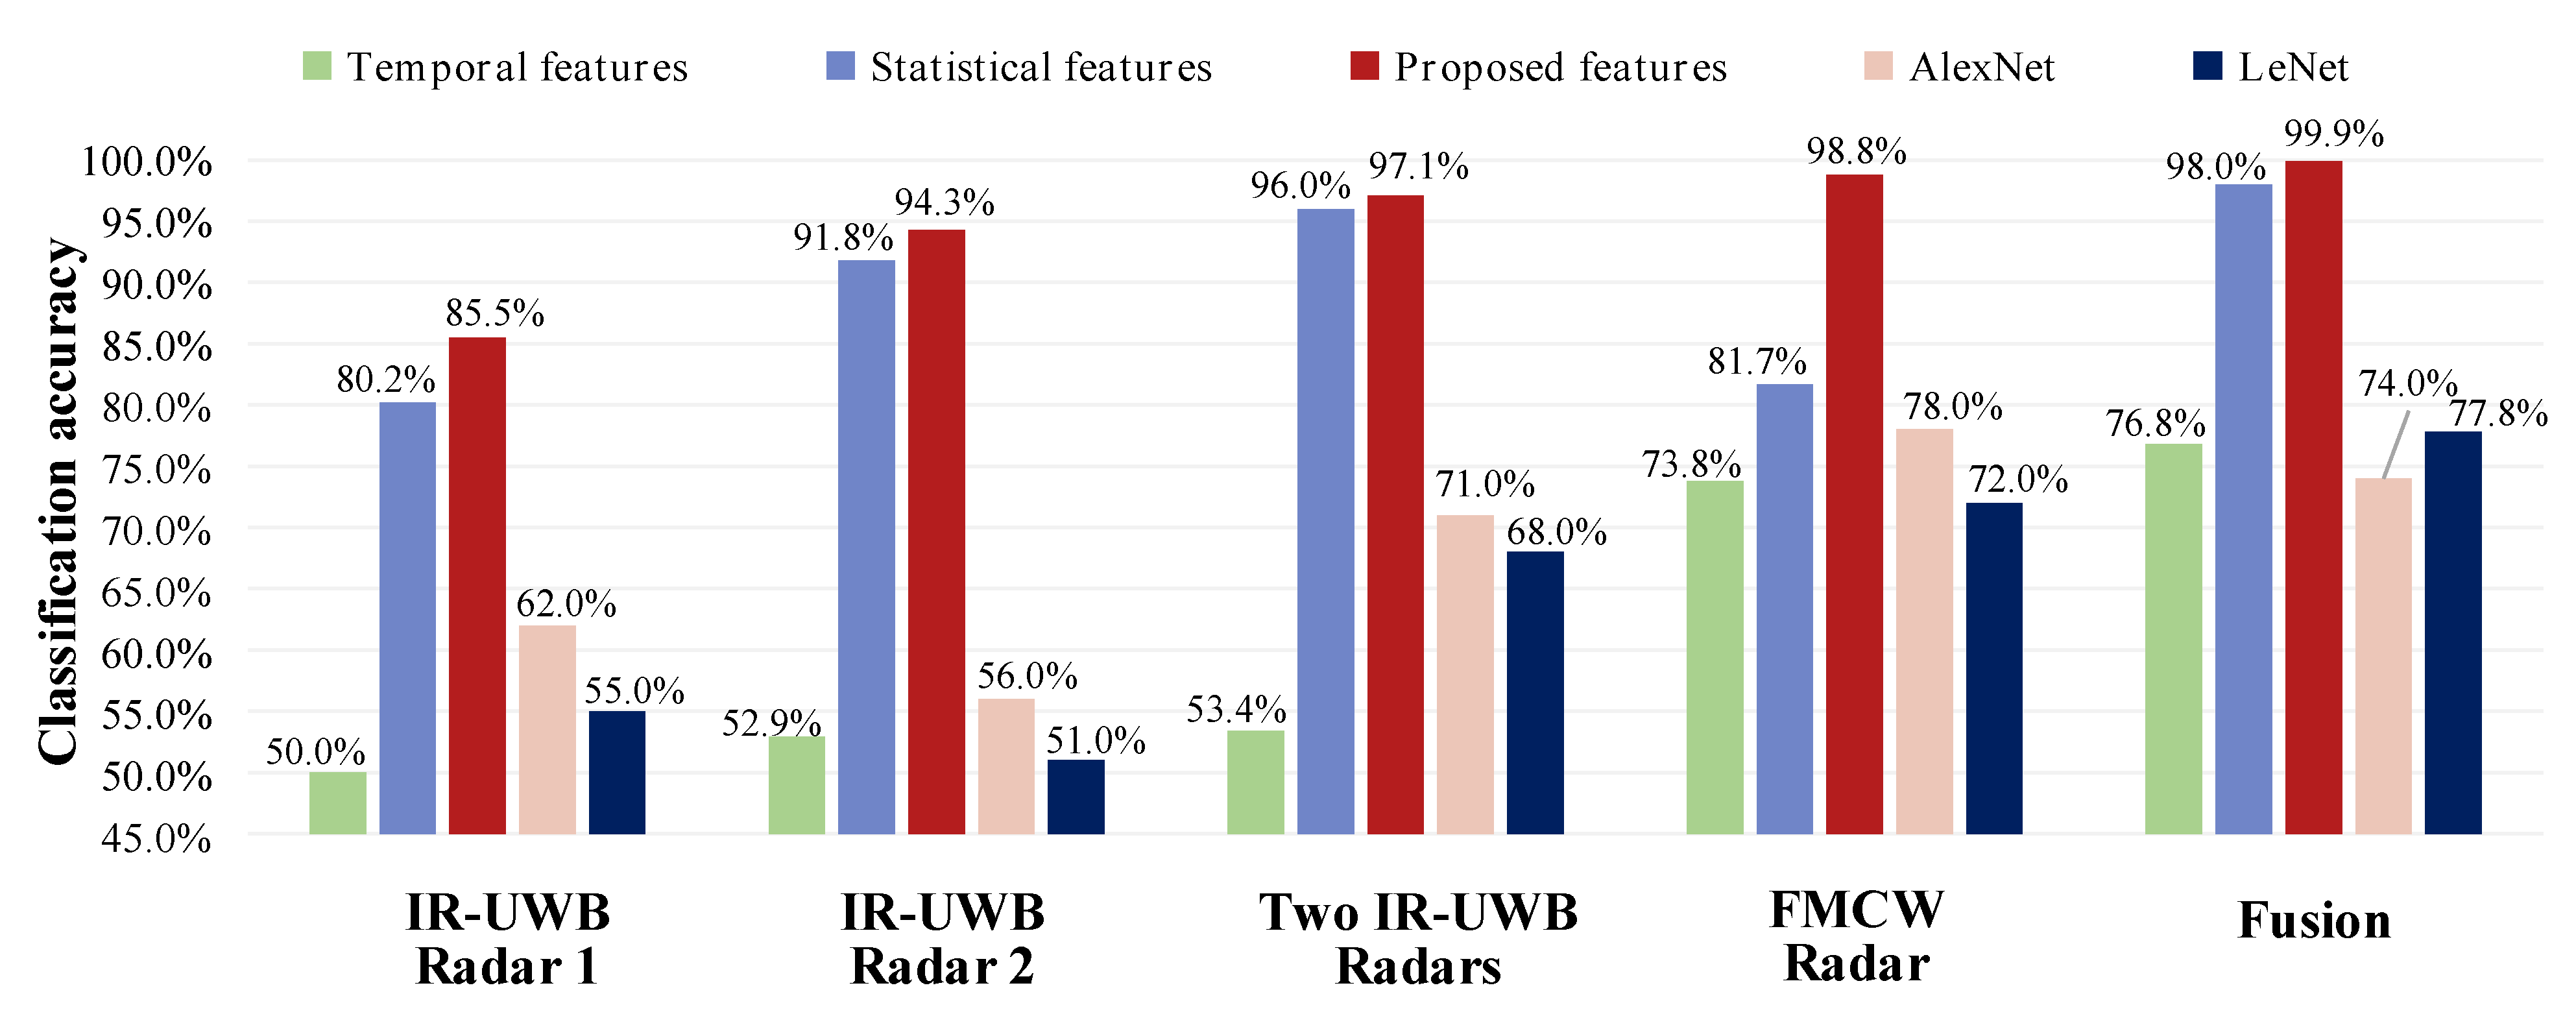
To verify the superiority of the proposed feature extraction and fusion, comparisons with other methods are carried out on the dataset in this paper for activity classification. Four methods are employed for comparison, including the temporal features in the multichannel proposed in [24], the statistical features for people sensing in [33], and two classical neural networks, AlexNet and LeNet [34]. The temporal features consist of the scattering center tracking features, the low level descriptor of RDM, and the relationship features between channels. The statistical features are composed of the mean, variance, coefficient variance, kurtosis, skewness, maximum value, and the argument of maximum value of radar signals. These features are combined with the random forest classifier for comparison. The AlexNet and LeNet serve as end-to-end classification methods, directly taking the radar data as the input and classifying the activities.
The comparison results on each radar and multi-radar fusion with the five methods are illustrated in Figure 8. The proposed features present the best performance among all of these methods on both IR-UWB and FMCW radars as well as their combinations. The classification accuracies on each single radar all exceed 85.5% with the proposed features, and are clearly better than those of the other four methods. Results prove the robustness and superiority of the proposed features on different radars and for data fusion. In addition, it is observed that the accuracies of all three feature-based methods present improvements with feature fusion compared with that of each radar, demonstrating the effectiveness of radar information fusion.
5.3. Performance Analysis for Vital Sign Monitoring
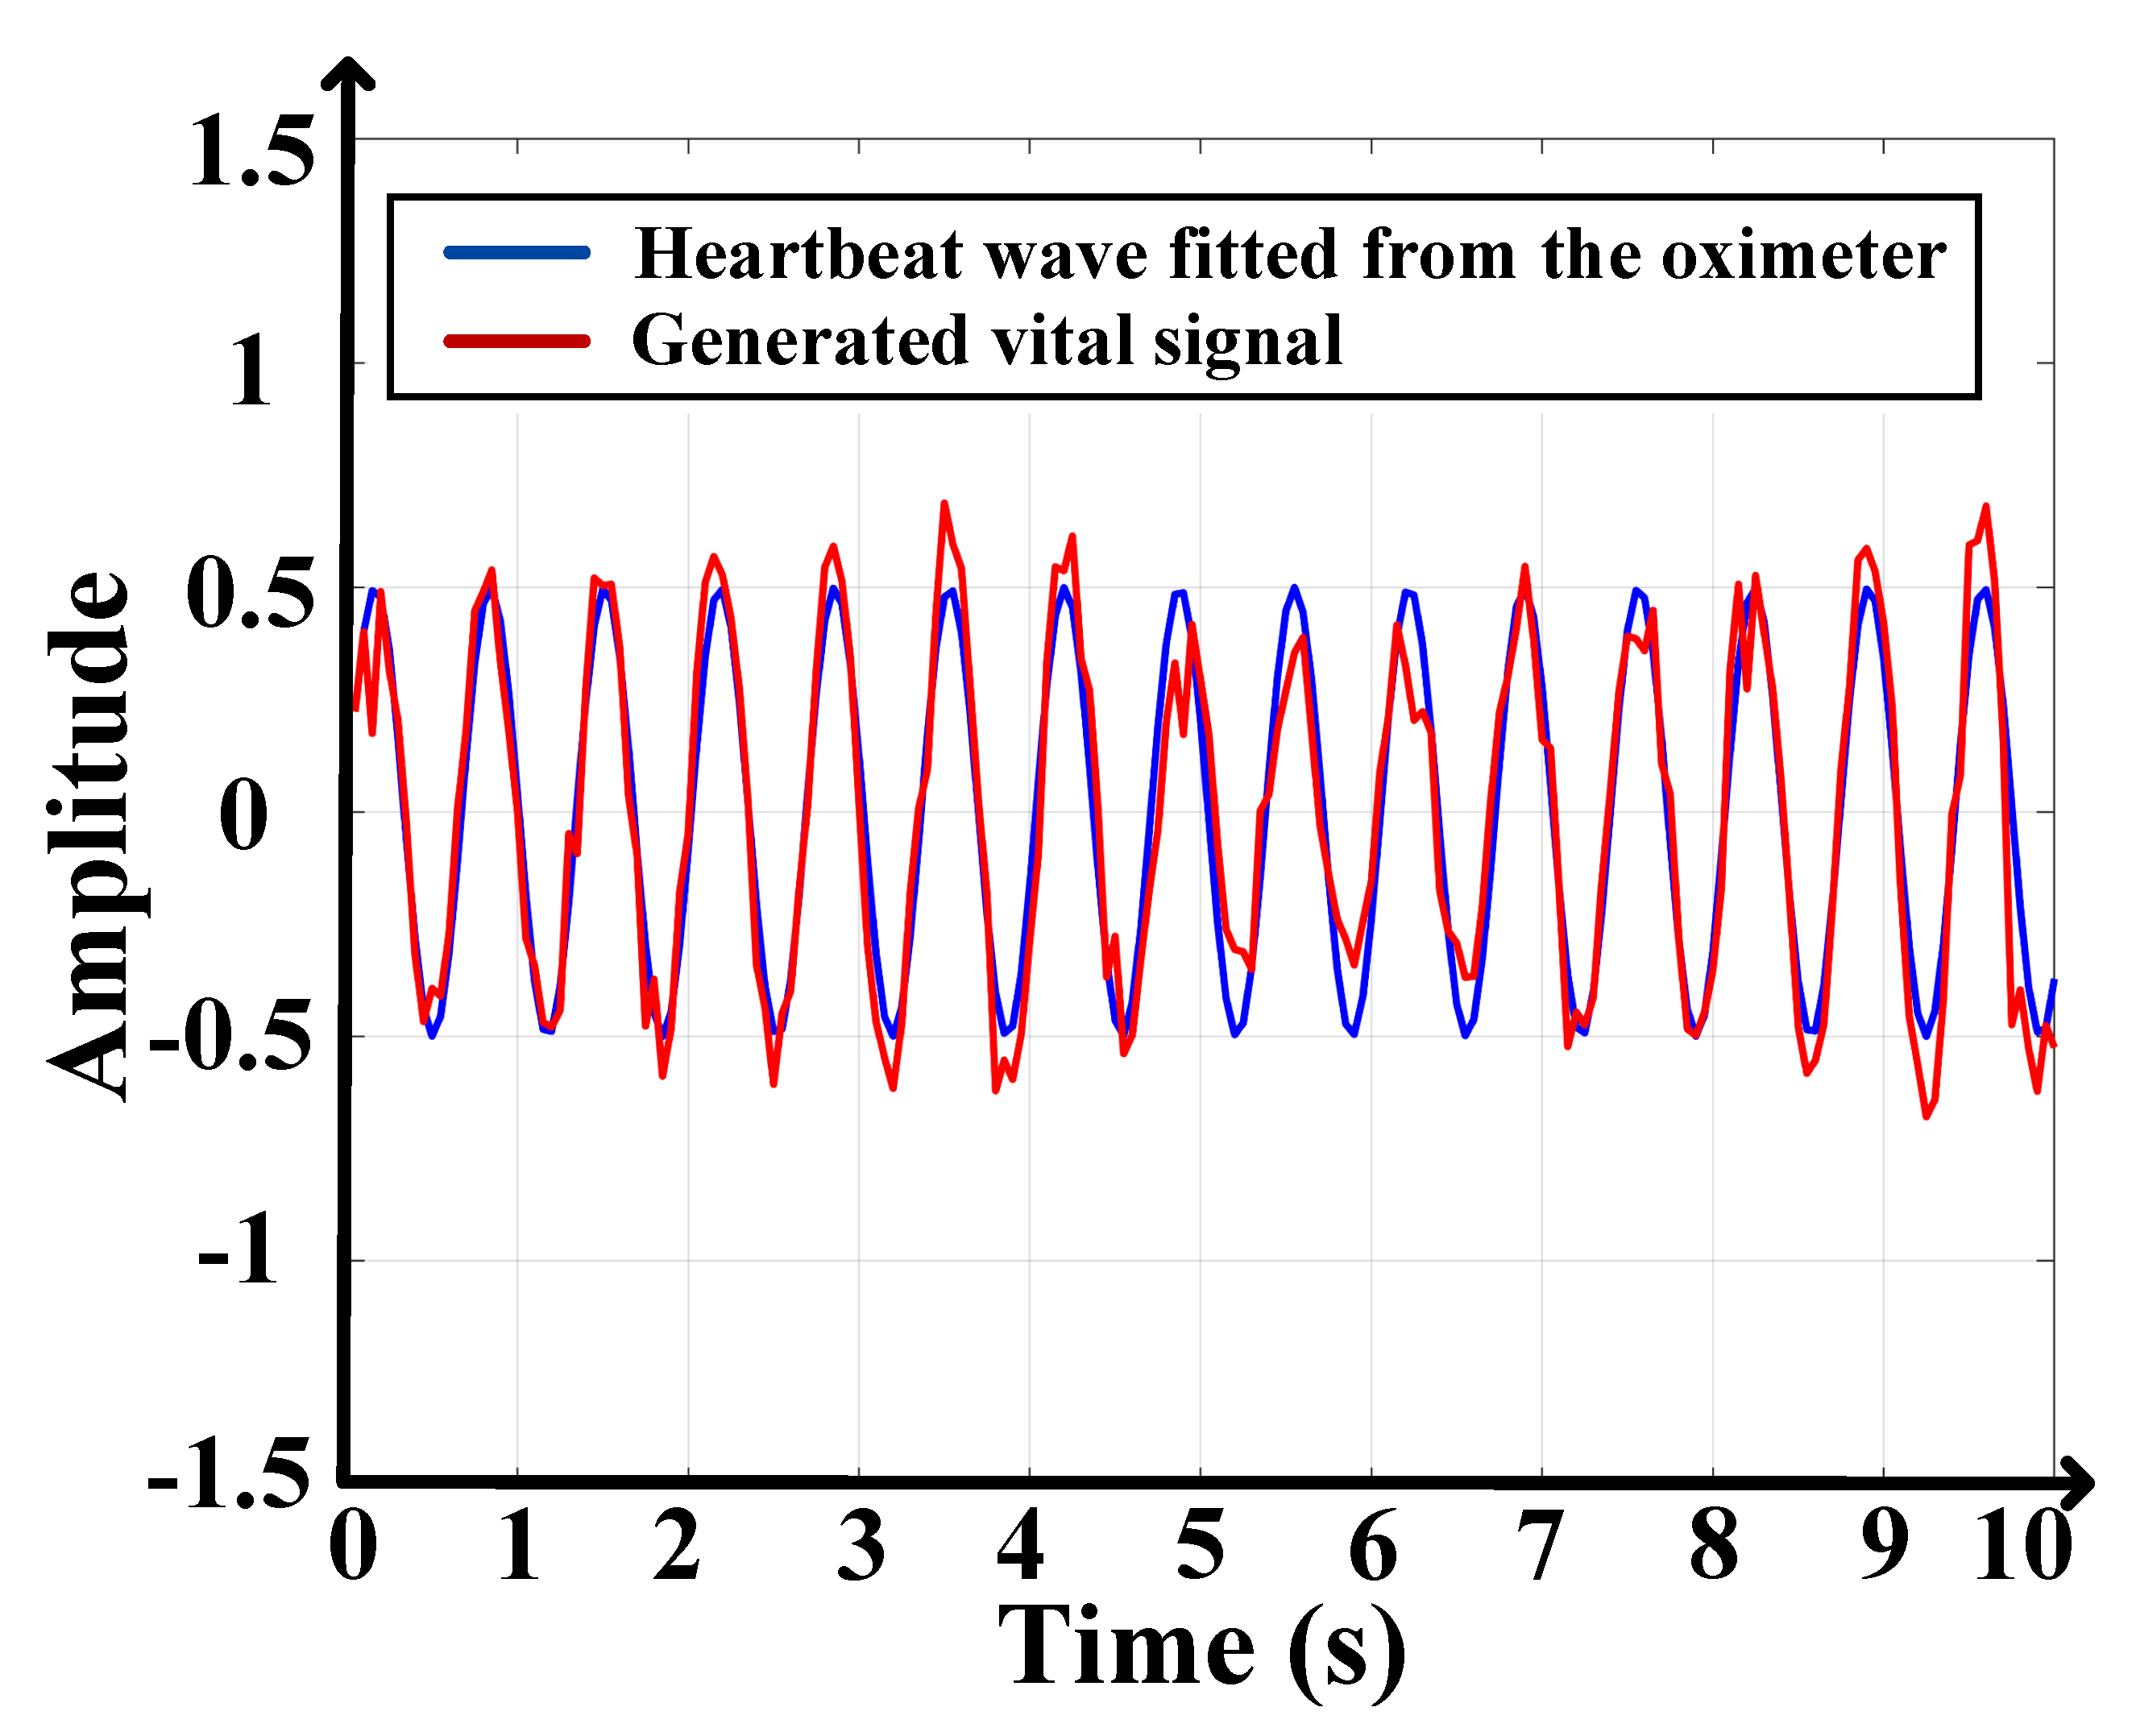
In the experiments on vital sign monitoring, 80% of the radar data is randomly chosen to train A-FuseNet, and the other 20% is utilized for testing. Figure 9 indicates a fused vital sign signal generated by A-FuseNet and a reference of the synchronous waveform. The red line represents the generated heartbeat signal with 10 s, while the blue line is the sinusoidal waveform fitted with the heartbeat frequency recorded by the oximeter synchronously. As illustrated, the waveform profile of the generated signal effectively fits with the reference, proving the reliability of A-FuseNet for generating vital sign signals. It is observed that there exists a partial deformation in the amplitude of the generated signal, but the frequency is perfectly matched with that of the reference. Since that FFT is applied on the generated signal to estimate heartbeat rate in this paper, it is acceptable with the deviation of amplitudes. In the future, the synchronous ECG signal could be utilized as the reference to optimize A-FuseNet, and it is possible to obtain a more informative heartbeat waveform with PQRST characteristics. PQRST denotes the P, Q, R, S and T waves, indicating the turning points of a heartbeat waveform in the ECG signal, of which the amplitude and duration describe more detailed information about cardiac movement.
The accuracy of the heartbeat rate estimation is calculated on each sample, defined as:
where denotes the estimated heartbeat rate from A-FuseNet, and is the heartbeat rate measured by oximeter. The average accuracy is utilized for performance evaluation. The vital sign monitoring accuracies in the 12 conditions described in Figure 3 are listed in Table 7. The highest accuracies are obtained for the sitting activity with back and forth waggling, and left and right turning movements, reaching 95.3% and 95.4%, respectively. The results indicate the satisfactory capability of A-FuseNet to recover the heartbeat signal with interference from regular body movements. It appears that the monitoring accuracies with random movements and keeping still are slightly lower compared to back and forth waggling and left and right turning movements, but still exceed 91.2%. Table 8 presents the vital sign monitoring accuracies for six participants, the physical description of which is presented in Table 1. The highest accuracy is achieved for P5 of 96.3%, while P1 has the lowest accuracy of 91.4%. It is observed that the performance of heartbeat monitoring has greater variation for different persons compared with activity monitoring in Table 5, which is caused by the individual differences and variability of human physiological signs. The accuracies for six participants all exceed 91.4%, revealing the effectiveness of the proposed framework for vital sign monitoring of different persons.
5.4. Performance Comparison with Other Methods for Vital Sign Monitoring
To verify the feasibility of A-FuseNet for vital sign monitoring, four other methods were employed for comparison. The method with FFT [35], the Variational Mode Decomposition (VMD) [36], the Heartbeat Estimation And Recovery (HEAR) proposed in [37] and the adaptive Kalman filtering presented in [18] are conducted for heartbeat rate estimation. For the methods with FFT and VMD, the signal with the maximal energy is selected as having the most heartbeat information, and FFT and VMD algorithms are applied respectively for decomposition. HEAR is designed to extract heartbeat signals with body movement interference. It acquires vital sign signals by mapping maximum echo amplitudes and compensating for large body movements, combined with the variational nonlinear chirp mode decomposition (VNCMD) for heartbeat rate monitoring. In this paper, FFT, VMD and HEAR are applied on IR-UWB radars 1 and 2 to estimate the heartbeat of each person, and their results are averaged on two radars. Adaptive Kalman filtering fuses two IR-UWB radar signals with an adaptive Kalman filter and estimates the heartbeat rate by applying FFT. In addition, the A-FuseNet structure without additional information is implemented for comparison to prove the effect of activity and movement information. The training and testing process repeats five times for comparison, and the results in three indoor environments and on the whole dataset are shown in Table 9.
According to Table 9, the proposed A-FuseNet outperforms the other four methods on vital sign monitoring in all three environments, achieving the highest averaging accuracies of 90.8%, 94.9%, 94.4% and 92.3% in the cotton tent, the small room, the wide lobby and all environments respectively. The cotton tent is narrow and confined, causing heavy obstruction and superposition of cardiopulmonary signals from two people, which leads to the lowest heartbeat estimation accuracy. The average accuracy of A-FuseNet in all environments is 6.9%, 12.6%, 7.5% and 9.6% higher than those with FFT, VMD, HEAR and adaptive Kalman filtering respectively. The performances of these compared methods are affected by various activities and body movements, while A-FuseNet shows the ability to extract and recover valid vital sign information during body motions. Moreover, A-FuseNet has the capability of generating the heartbeat waveform, benefiting from the modified generative and adversarial structure, which provides more information and has the potential for future heartbeat waveform analysis. The additional information improves the average accuracy of A-FuseNet by 1.1%, 3%, 0.9% and 1.4% in the cotton tent, the small room, the wide lobby and all of three environments respectively, demonstrating the significance of activity and movement information. It is noted that there still exist 7.7% of errors for heartbeat monitoring with A-FuseNet. It is explained that A-FuseNet is trained with data from all the participants, while the significant individual differences in heartbeat may require personalized training.
5.5. Time Processing of the Proposed Framework for Activity and Vital Sign Monitoring
Table 10 presents the processing time of each step of the proposed framework for activity and vital sign monitoring, which is averaged on each testing sample. The experiment is carried out on a workstation equipped with Ubuntu 16.04.7 LTS system, Intel Xeon E5-2630 CPU and NVIDIA GeForce GTX 1080 Ti graphic card. It is shown that the total processing time is 3.719 s, and the RoI selection occupies most of this time at 3.157 s, while the feature extraction, activity classification and A-FuseNet for heartbeat signal generation only take 0.052 s. Considering that each sample has a 10 s duration, this total processing time is acceptable for real time processing. In the future, the processing time for RoI selection could be reduced, and the system could be established at home for real time activity and vital sign monitoring.
6. Conclusions
In this paper, a framework for indoor activity and vital sign monitoring with an FMCW and two IR-UWB radars is proposed. LBP, energy and WPT features are extracted from three radars to represent the spatial-temporal distribution information, and are combined with a random forest for activity monitoring. Moreover, A-FuseNet is proposed with the modified generative and adversarial structure, consisting of a fusion sub-network with CCNN-LSTM modules for heartbeat signal generation, as well as a discrimination sub-network for optimization. The additional activity and movement information is introduced to guide the fusion process. A multi-radar dataset is constructed in three indoor environments, including a cotton tent, a small room and an empty lobby to validate the performance of the proposed framework. The accuracy of activity monitoring reaches 99.9%, 23.1%, 1.9%, 25.9%, and 22.1% higher than those with temporal features, statistical features, AlexNet and LeNet, respectively. For vital sign monitoring, this framework achieves an average accuracy of 92.3%, 6.9%, 12.6%, 7.5% and 9.6% higher than those with FFT, VMD, HEAR and adaptive Kalman filtering methods, respectively. The results prove the effectiveness and superiority of the proposed framework for human sensing. In future work, more multi-radar data will be collected and analyzed with more complex scenarios to further validate the feasibility of the proposed framework. ECG signals will be applied to optimize A-FuseNet for more informative heartbeat waveform generation, and the real time monitoring system will be optimized for intelligent households.
Author Contributions
Conceptualization, X.Y. and L.Z.; methodology, X.Y.; validation, formal analysis, X.Y., X.Z. and Y.D.; data curation, writing—original draft preparation, X.Y.; writing—review and editing, funding acquisition, L.Z. All authors have read and agreed to the published version of the manuscript.
Funding
This research was funded by the Natural Science Foundation of Beijing Municipality (Grant no. 4192040), the National Natural Science Foundation of China (Grant no. 61971056).
Data Availability Statement
The data presented in this study are available in https://github.com/yangxiuzhu777/Multi-Radar-Dataset (accessed on 1 July 2021).
Acknowledgments
This work was supported in part by the Natural Science Foundation of Beijing Municipality under Grant 4192040, and in part by the National Natural Science Foundation of China under Grant 61971056.
Conflicts of Interest
The authors declare no conflict of interest.
Abbreviations
The following abbreviations are used in this manuscript:
| FMCW | Frequency Modulated Continuous Wave |
| IR-UWB | Impulse Radio Ultra-Wideband |
| LBP | Local Binary Pattern |
| WPT | Wavelet Packet Transform |
| CCNN | Cascaded Convolutional Neural Network |
| LSTM | Long Short-Term Memory |
| RDM | Range-Doppler Map |
| RoI | Region of Interest |
References
- Shahzad, A.; Kim, K. FallDroid: An Automated Smart-Phone-Based Fall Detection System Using Multiple Kernel Learning. IEEE Trans. Ind. Inform. 2019, 15, 35–44. [Google Scholar] [CrossRef]
- McGrath, S.; Perreard, I.; Garland, M. Improving Patient Safety and Clinician Workflow in the General Care Setting with Enhanced Surveillance Monitoring. IEEE J. Biomed. Health Inform. 2019, 23, 857–866. [Google Scholar] [CrossRef] [PubMed]
- Bartoletti, S.; Conti, A.; Win, M. Device-Free Counting via Wideband Signals. IEEE J. Sel. Areas Commun. 2017, 35, 1163–1174. [Google Scholar] [CrossRef]
- Li, X.; Li, Z.; Fioranelli, F.; Yang, S.; Romain, O.; Kernec, J.L. Hierarchical Radar Data Analysis for Activity and Personnel Recognition. Remote Sens. 2020, 12, 2237. [Google Scholar] [CrossRef]
- Yang, X.; Yin, W.; Li, L.; Zhang, L. Dense People Counting Using IR-UWB Radar With a Hybrid Feature Extraction Method. IEEE Geosci. Remote Sens. Lett. 2019, 16, 30–34. [Google Scholar] [CrossRef]
- Seifert, A.; Amin, M.; Zoubir, A. Toward Unobtrusive In-Home Gait Analysis Based on Radar Micro-Doppler Signatures. IEEE Trans. Biomed. Eng. 2019, 66, 2629–2640. [Google Scholar] [CrossRef] [Green Version]
- Ding, W.; Guo, X.; Wang, G. Radar-based Human Activity Recognition Using Hybrid Neural Network Model with Multi-domain Fusion. IEEE Trans. Aerosp. Electron. Syst. 2021, in press. [Google Scholar] [CrossRef]
- Lai, G.; Lou, X.; Ye, W. Radar-Based Human Activity Recognition With 1-D Dense Attention Network. IEEE Geosci. Remote Sens. Lett. 2021, in press. [Google Scholar] [CrossRef]
- Li, X.; He, Y.; Fioranelli, F.; Jing, X. Semisupervised Human Activity Recognition With Radar Micro-Doppler Signatures. IEEE Trans. Geosci. Remote Sens. 2021, in press. [Google Scholar] [CrossRef]
- Li, H.; Shrestha, A.; Heidari, H.; Le Kernec, J.; Fioranelli, F. Bi-LSTM Network for Multimodal Continuous Human Activity Recognition and Fall Detection. IEEE Sens. J. 2020, 20, 1191–1201. [Google Scholar] [CrossRef] [Green Version]
- Qiao, X.; Amin, M.G.; Shan, T.; Zeng, Z.; Tao, R. Human Activity Classification Based on Micro-Doppler Signatures Separation. IEEE Trans. Geosci. Remote Sens. 2021, in press. [Google Scholar] [CrossRef]
- Erol, B.; Amin, M.G. Radar Data Cube Processing for Human Activity Recognition Using Multisubspace Learning. IEEE Trans. Aerosp. Electron. Syst. 2019, 55, 3617–3628. [Google Scholar] [CrossRef]
- Schires, E.; Georgiou, P.; Lande, T. Vital Sign Monitoring Through the Back Using an UWB Impulse Radar With Body Coupled Antennas. IEEE Trans. Biomed. Circuits Syst. 2018, 12, 292–302. [Google Scholar] [CrossRef] [PubMed]
- Antolinos, E.; García-Rial, F.; Hernández, C.; Montesano, D.; Godino-Llorente, J.I.; Grajal, J. Cardiopulmonary Activity Monitoring Using Millimeter Wave Radars. Remote Sens. 2020, 12, 2265. [Google Scholar] [CrossRef]
- Cao, P.; Xia, W.; Li, Y. Heart ID: Human Identification Based on Radar Micro-Doppler Signatures of the Heart Using Deep Learning. Remote Sens. 2019, 11, 1220. [Google Scholar] [CrossRef] [Green Version]
- Li, H.; Mehul, A.; Kernec, J. Sequential Human Gait Classification with Distributed Radar Sensor Fusion. IEEE Sens. J. 2021, 21, 7590–7603. [Google Scholar] [CrossRef]
- Jokanović, B.; Amin, M. Fall Detection Using Deep Learning in Range-Doppler Radars. IEEE Trans. Aerosp. Electron. Syst. 2018, 54, 180–189. [Google Scholar] [CrossRef]
- Lv, H.; Qi, F.; Zhang, Y.; Jiao, T.; Liang, F.; Li, Z.; Wang, J. Improved Detection of Human Respiration Using Data Fusion Basedon a Multistatic UWB Radar. Remote Sens. 2016, 8, 773. [Google Scholar] [CrossRef] [Green Version]
- Shang, X.; Liu, J.; Li, J. Multiple Object Localization and Vital Sign Monitoring Using IR-UWB MIMO Radar. IEEE Trans. Aerosp. Electron. Syst. 2020, 56, 4437–4450. [Google Scholar] [CrossRef]
- X4 Datasheet; Novelda: Oslo, Norway, 2020. Available online: https://novelda.com/content/wp-content/uploads/2021/01/NOVELDA-x4-datasheet-revF.pdf (accessed on 3 March 2020).
- IWR1843 Datasheet; Texas Instruments Inc.: Dallas, TX, USA, 2019. Available online: https://www.ti.com/lit/ds/swrs228/swrs228.pdf (accessed on 1 September 2019).
- Choi, J.; Kim, J.; Kim, K. People Counting Using IR-UWB Radar Sensor in a Wide Area. IEEE Internet Things J. 2021, 8, 5806–5821. [Google Scholar] [CrossRef]
- Xia, Z.; Luomei, Y.; Zhou, C.; Xu, F. Multidimensional Feature Representation and Learning for Robust Hand-Gesture Recognition on Commercial Millimeter-Wave Radar. IEEE Trans. Geosci. Remote Sens. 2020, 59, 4749–4764. [Google Scholar] [CrossRef]
- Ryu, S.; Suh, J.; Baek, S. Feature-Based Hand Gesture Recognition Using an FMCW Radar and its Temporal Feature Analysis. IEEE Sens. J. 2018, 18, 7593–7602. [Google Scholar] [CrossRef]
- Kim, Y.; Alnujaim, I.; Oh, D. Human Activity Classification Based on Point Clouds Measured by Millimeter Wave MIMO Radar with Deep Recurrent Neural Networks. IEEE Sens. J. 2021, 21, 13522–13529. [Google Scholar] [CrossRef]
- Xiao, B.; Wang, K.; Bi, X. 2D-LBP: An Enhanced Local Binary Feature for Texture Image Classification. IEEE Trans. Circuits Syst. Video Technol. 2019, 29, 2796–2808. [Google Scholar] [CrossRef]
- Cao, S.; Zheng, Y.; Ewing, R. A Wavelet-Packet-Based Radar Waveform for High Resolution in Range and Velocity Detection. IEEE Trans. Geosci. Remote Sens. 2015, 53, 229–243. [Google Scholar]
- LaHaye, N.; Ott, J.; Garay, M. Multi-Modal Object Tracking and Image Fusion With Unsupervised Deep Learning. IEEE J. Sel. Top. Appl. Earth Obs. 2019, 12, 3056–3066. [Google Scholar] [CrossRef]
- Wang, J.; Guo, S.; Huang, R. Dual-Channel Capsule Generation Adversarial Network for Hyperspectral Image Classification. IEEE Trans. Geosci. Remote Sens. 2021, in press. [Google Scholar] [CrossRef]
- Kim, J.; Ryu, S.; Jeong, J.; So, D.; Ban, H.; Hong, S. Impact of Satellite Sounding Data on Virtual Visible Imagery Generation Using Conditional Generative Adversarial Network. IEEE J. Sel. Top. Appl. Earth Obs. Remote Sens. 2020, 13, 4532–4541. [Google Scholar] [CrossRef]
- Ding, C.; Chae, R.; Wang, J. Inattentive Driving Behavior Detection Based on Portable FMCW Radar. IEEE Trans. Microw. Theory Tech. 2019, 67, 4031–4041. [Google Scholar] [CrossRef]
- Zheng, J.; Xu, Q.; Chen, J. The On-Orbit Noncloud-Covered Water Region Extraction for Ship Detection Based on Relative Spectral Reflectance. IEEE Geosci. Remote Sens. Lett. 2018, 15, 818–822. [Google Scholar] [CrossRef]
- Lim, S.; Lee, S.; Jung, J.; Kim, S. Detection and Localization of People Inside Vehicle Using Impulse Radio Ultra-Wideband Radar Sensor. IEEE Sens. J. 2020, 20, 3892–3901. [Google Scholar] [CrossRef]
- Yap, M.; Pons, G.; Martí, J. Automated Breast Ultrasound Lesions Detection Using Convolutional Neural Networks. IEEE J. Biomed. Health Inform. 2018, 22, 1218–1226. [Google Scholar] [CrossRef] [PubMed] [Green Version]
- Mostafa, M.; Chamaani, S.; Sachs, J. Applying singular value decomposition for clutter reduction in heartbeat estimation using M-sequence UWB Radar. In Proceedings of the 2018 19th International Radar Symposium (IRS), Bonn, Germany, 20–22 June 2018; pp. 1–10. [Google Scholar]
- Wang, P.; Zhang, Y.; Ma, Y.; Liang, F.; An, Q.; Xue, H.; Yu, X.; Lv, H.; Wang, J. Method for Distinguishing Humans and Animals in Vital Signs Monitoring Using IR-UWB Radar. Int. J. Environ. Res. Public Health 2019, 16, 4462. [Google Scholar] [CrossRef] [PubMed] [Green Version]
- Yin, W.; Yang, X.; Li, L.; Zhang, L.; Kitsuwan, N.; Oki, E. HEAR: Approach for Heartbeat Monitoring with Body Movement Compensation by IR-UWB Radar. Sensors 2018, 18, 3077. [Google Scholar] [CrossRef] [PubMed] [Green Version]
Figure 1.
Flowchart of the proposed framework, composed by the feature extraction and fusion for activity monitoring and the A-FuseNet for vital sign monitoring.
Figure 1.
Flowchart of the proposed framework, composed by the feature extraction and fusion for activity monitoring and the A-FuseNet for vital sign monitoring.

Figure 2.
Experimental setup.

Figure 3.
Dataset generation scenarios.

Figure 4.
Schematic diagram of proposed feature extraction and fusion for activity monitoring.

Figure 5.
Structure of the proposed A-FuseNet for vital sign monitoring.

Figure 6.
Doppler velocity for different body movements.

Figure 7.
Classification performance with different proportions of training samples for activity monitoring.
Figure 7.
Classification performance with different proportions of training samples for activity monitoring.

Figure 8.
Classification performance comparison of different methods for activity monitoring.

Figure 9.
A generated heartbeat signal from A-FuseNet.


Table 1.
Brief physical description of the participants.
| Participant | Gender | Age (yr) | Weight (kg) | Height (m) |
|---|---|---|---|---|
| P1 | Male | 23 | 78 | 1.86 |
| P2 | Male | 24 | 54 | 1.70 |
| P3 | Male | 23 | 102 | 1.87 |
| P4 | Female | 24 | 54 | 1.63 |
| P5 | Male | 23 | 72 | 1.85 |
| P6 | Female | 23 | 54 | 1.68 |
Table 2.
Activity monitoring performance of different classifiers with proposed features.
| Accuracy | Precision | Recall | F1 | |
|---|---|---|---|---|
| AdaBoost | 98.0% | 97.8% | 97.8% | 97.8% |
| Random Forest | 99.9% | 100% | 100% | 100% |
| Decision Tree | 98.0% | 100% | 100% | 100% |
Table 3.
Confusion matrix of classification on three activities.
| Predict Class | ||||
|---|---|---|---|---|
| Target Class | Sit | Stand | Lie | |
| Sit | 99.9% | 0.0% | 0.1% | |
| Stand | 0.0% | 100.0% | 0.0% | |
| Lie | 0.3% | 0.0% | 99.7% | |
Table 4.
Activity monitoring accuracies in three indoor environments and for the whole dataset.
| Accuracy | |
|---|---|
| Cotton Tent | 99.9% |
| Small Room | 99.7% |
| Wide Lobby | 100% |
| All of three environments | 99.9% |
Table 5.
Activity monitoring accuracies for six participants.
| P1 | P2 | P3 | P4 | P5 | P6 | |
|---|---|---|---|---|---|---|
| Accuracy | 100% | 99.7% | 99.7% | 100% | 100% | 100% |
Table 6.
Activity monitoring accuracies in 12 conditions.
| Scenario 1 | Scenario 2 | |||
|---|---|---|---|---|
| Zone A | Sit | Lie | ||
| Still | Randomly Moving | Still | Randomly Moving | |
| 100% | 100% | 100% | 99.0% | |
| Zone B | Stand | Sit | ||
| Still | Randomly Moving | Still | Randomly Moving | |
| 100% | 100% | 100% | 99.5% | |
| Back and Forth Waggling | Left and Right Turning | Back and Forth Waggling | Left and Right Turning | |
| 100% | 100% | 100% | 100% | |
Table 7.
Vital sign monitoring accuracies in 12 conditions.
| Scenario 1 | Scenario 2 | |||
|---|---|---|---|---|
| Zone A | Sit | Lie | ||
| Still | Randomly Moving | Still | Randomly Moving | |
| 92.9% | 93.2% | 92.7% | 91.9% | |
| Zone B | Stand | Sit | ||
| Still | Randomly Moving | Still | Randomly Moving | |
| 91.2% | 92.7% | 93.5% | 94.6% | |
| Back and Forth Waggling | Left and Right Turning | Back and Forth Waggling | Left and Right Turning | |
| 93.8% | 93.3% | 95.3% | 95.4% | |
Table 8.
Vital sign monitoring accuracies for six participants.
| P1 | P2 | P3 | P4 | P5 | P6 | |
|---|---|---|---|---|---|---|
| Accuracy | 91.4% | 94.3% | 92.8% | 94.0% | 96.3% | 95.4% |
Table 9.
Vital sign monitoring accuracy in three indoor environments with different methods.
| Cotton Tent | Small Room | Wide Lobby | All Environments | |
|---|---|---|---|---|
| FFT [35] on IR-UWB radar 1 | 82.1% | 80.8% | 82.5% | 82.0% |
| FFT [35] on IR-UWB radar 2 | 81.6% | 81.0% | 82.4% | 81.7% |
| Average on two radars with FFT [35] | 85.8% | 84.7% | 86.3% | 85.4% |
| VMD [36] on IR-UWB radar 1 | 75.3% | 78.5% | 77.2% | 76.4% |
| VMD [36] on IR-UWB radar 2 | 76.1% | 78.7% | 77.6% | 77.1% |
| Average on two radars with VMD [36] | 78.6% | 81.9% | 80.6% | 79.7% |
| HEAR [37] on IR-UWB radar 1 | 84.5% | 82.6% | 85.6% | 84.4% |
| HEAR [37] on IR-UWB radar 2 | 84.5% | 82.7% | 85.6% | 84.4% |
| Average on two radars with HEAR [37] | 85.0% | 82.9% | 85.9% | 84.8% |
| Adaptive Kalman filtering [18] | 82.7% | 81.6% | 83.3% | 82.7% |
| A-FuseNet | 90.8% | 94.9% | 94.4% | 92.3% |
| A-FuseNet without additional information | 89.7% | 91.9% | 93.5% | 90.9% |
Table 10.
Time processing for activity and vital sign monitoring.
| Process | Time (Seconds) |
|---|---|
| Preprocessing | 0.510 |
| RoI Selection | 3.157 |
| FMCW Radar Feature Extraction | 0.007 |
| UWB Radar Feature Extraction | 0.039 |
| Random Forest Classifier | 3 × |
| A-FuseNet | 0.006 |
| Total | 3.719 |
Publisher’s Note: MDPI stays neutral with regard to jurisdictional claims in published maps and institutional affiliations. |
© 2021 by the authors. Licensee MDPI, Basel, Switzerland. This article is an open access article distributed under the terms and conditions of the Creative Commons Attribution (CC BY) license (https://creativecommons.org/licenses/by/4.0/).
Share and Cite
MDPI and ACS Style
Yang, X.; Zhang, X.; Ding, Y.; Zhang, L. Indoor Activity and Vital Sign Monitoring for Moving People with Multiple Radar Data Fusion. Remote Sens. 2021, 13, 3791. https://0-doi-org.brum.beds.ac.uk/10.3390/rs13183791
AMA Style
Yang X, Zhang X, Ding Y, Zhang L. Indoor Activity and Vital Sign Monitoring for Moving People with Multiple Radar Data Fusion. Remote Sensing. 2021; 13(18):3791. https://0-doi-org.brum.beds.ac.uk/10.3390/rs13183791
Chicago/Turabian StyleYang, Xiuzhu, Xinyue Zhang, Yi Ding, and Lin Zhang. 2021. "Indoor Activity and Vital Sign Monitoring for Moving People with Multiple Radar Data Fusion" Remote Sensing 13, no. 18: 3791. https://0-doi-org.brum.beds.ac.uk/10.3390/rs13183791
Note that from the first issue of 2016, this journal uses article numbers instead of page numbers. See further details here.