
Early-Season Mapping of Winter Crops Using Sentinel-2 Optical Imagery


1
International Joint Laboratory for Geospatial Technology of Henan, College of Geography and Environmental Science, Henan University, Kaifeng 475004, China
2
Key Laboratory of Geospatial Technology for the Middle and Lower Yellow River Regions, Henan University, Ministry of Education, Kaifeng 475004, China
3
Collaborative Innovation Center on Yellow River Civilization Jointly Built by Henan Province and Ministry of Education, Key Research Institute of Yellow River Civilization and Sustainable Development, Henan University, Kaifeng 475001, China
*
Author to whom correspondence should be addressed.
Remote Sens. 2021, 13(19), 3822; https://0-doi-org.brum.beds.ac.uk/10.3390/rs13193822
Submission received: 26 August 2021
/
Revised: 21 September 2021
/
Accepted: 21 September 2021
/
Published: 24 September 2021
(This article belongs to the Topic High-Resolution Earth Observation Systems, Technologies, and Applications)
Abstract
:Sentinel-2 imagery is an unprecedented data source with high spatial, spectral and temporal resolution in addition to free access. The objective of this paper was to evaluate the potential of using Sentinel-2 data to map winter crops in the early growth stage. Analysis of three winter crop types—winter garlic, winter canola and winter wheat—was carried out in two agricultural regions of China. We analysed the spectral characteristics and vegetation index profiles of these crops in the early growth stage and other land cover types based on Sentinel-2 images. A decision tree classification model was built to distinguish the crops based on these data. The results demonstrate that winter garlic and winter wheat can be distinguished four months before harvest, while winter canola can be distinguished two months before harvest. The overall classification accuracy was 96.62% with a kappa coefficient of 0.95. Therefore, Sentinel-2 images can be used to accurately identify these winter crops in the early growth stage, making them an important data source in the field of agricultural remote sensing.
1. Introduction
Food security is a very important global issue [1]. Detailed data on the spatio-temporal distributions of crop plots are vital for guaranteeing food security [2]. The continuous development of remote sensing technologies, such as classification algorithms and satellite or unmanned aerial vehicle (UAV) imagery, provides many potential solutions for mapping crop types [3,4,5,6,7]. Mapping crop plots in the early growth stage is very helpful for informing decision-making related to food security and other policies [8,9] because such early season crop maps are the basis of crop yield and drought risk predictions. However, early season mapping has not received enough attention because the most common approach to the mapping of crop types relies on the relationship between full-season image features and crop type classes.
In addition to poor timeliness, existing cropland maps also face a problem of low accuracy. For example, the spatial resolution of the Moderate Resolution Imaging Spectroradiometer (MODIS) Land Cover product is 250 m × 250 m [10]. This coarse spatial resolution seriously restricts the accuracy of crop maps because the boundaries of crop plots cannot be accurately identified. In recent years, the spatial resolution of images has been increasing, and they have become more accessible. Sentinel-2 imagery has become an important data source for crop type mapping. For example, Nasrallah et al. [11] extracted winter wheat distributions in the Bekaa Valley of Lebanon and Ashourloo et al. [2] extracted canola distributions in Iran using Sentinel-2 images. Sentinel-2 sensors provide multi-spectral images in 13 spectral bands at different spatial resolutions. Sentinel-2 imagery has a maximum spatial resolution of 10 m × 10 m and a temporal resolution of 5 days [6,12,13,14,15,16]. These advantages help to improve crop mapping accuracy.
Winter crops are generally planted in October. Their seedlings grow through winter and the crops are harvested in late spring and early summer. Winter crops include winter wheat, winter canola and winter garlic. Winter wheat is an important food crop and has an extensive global planting area. Therefore, there have been many studies on remote sensing mapping of winter wheat [9,17,18,19,20]; however, several problems exist, such as the limited spatial resolution of images, the utilisation of full-season images, heavy dependence on training data and a lack of consideration of winter canola and winter garlic crops. Winter canola and winter garlic can interfere with the remote sensing mapping of winter wheat due to their similar growth cycles [13,21,22].
With the continuous improvement in the economic value of canola, its remote sensing mapping has been studied [23,24,25]. During the flowering period, yellow canola flowers cause differences in the spectral reflectance of canola and other vegetation in optical images. Therefore, some canola flower indexes have been built according to the spectral characteristics of canola flowers. For example, Sulik et al. derived the normalised difference yellowness index (NDYI) from the green and blue wavebands to estimate canola yield [25]. Meanwhile, the literature on remote sensing mapping of garlic remains insufficient.
The purposes of this study are to (1) identify different types of winter crops, i.e., winter wheat, winter canola and winter garlic, and (2) evaluate the feasibility of using Sentinel-2 optical images for the early season mapping of different winter crops.
2. Materials and Methods
2.1. Study Area
The study area was located in China, including two regions, as shown in Figure 1.
The main types of winter crops in the study area included winter wheat, winter canola, and winter garlic. Winter canola and winter garlic have the characteristics of concentrated distributions. In the first study region, winter canola and winter wheat are planted. In the second study region, winter garlic and winter wheat are planted. The three types of winter crops are usually sown in October and harvested in late May to early June of the next year. Winter canola generally enters the flowering stage in March.
The first study region was rectangular and bounded by latitudes 29° N to 30° N and longitudes 111.7° E to 112.7° E, being mainly located in the Anxiang, Nan, Jinshi and Huarong counties of the Hunan province, China. The Anxiang county is known as the “hometown of winter canola”. The second study region was rectangular and bounded by latitudes 34.5° N to 35.5° N and longitudes 115.8° E to 116.8° E, being mainly located in the Jinxiang, Jiaxiang, Juye, Shan and Yutai counties of the Shandong province, the Dangshan county of the Anhui province and the Feng county of the Jiangsu province, China. The Jinxiang county is known as the “hometown of winter garlic”.
2.2. Sentinel-2 Data
The Sentinel-2 satellite constellation consists of satellite A and satellite B, which were designed by the European Space Agency (ESA). Satellites A and B were launched in June 2015 and March 2017, respectively. Sentinel-2 sensors provide multi-spectral images in 13 spectral bands at different spatial resolutions. These are three visible wavebands (blue, green and red) and one near-infrared (NIR) waveband at 10 m resolution, four red-edge and two shortwave infrared (SWIR) wavebands at 20 m resolution in addition to three atmospheric correction bands at 60 m resolution [26].
All the Sentinel-2 images used in the study were obtained via the Google Earth Engine (GEE). This is a cloud computing platform for remote sensing applications, which provides a solution for remote sensing big data computing [27,28]. The Sentinel-2 images used in this study are part of the COPERNICUS/S2_SR surface reflectance product in GEE.
2.3. Winter Canola and Winter Wheat Extraction
In the first study area, we extracted winter canola and winter wheat distributions. The main land cover types included winter wheat, winter canola, evergreen vegetation, other vegetation and bare land, which may be difficult to distinguish. Other land cover types, such as water and construction land, are easily identified.
According to our field survey and previous research [24], the flowering stage is the best period for extracting data on winter canola, because it will appear yellow while winter wheat is green during this period. Therefore, we selected one cloud-free Sentinel-2 image acquired on 18 March 2020 at the peak of the winter canola flowering period (Figure 1c). The yellow objects are winter canola plots. For comparison, we also selected a Sentinel-2 image from 17 February 2020.
The normalised difference yellowness index (NDYI) and normalised difference vegetation index (NDVI) were used in the study. Their equations are as follows:
where βgreen, βblue, βred and βnir are the spectral reflectance in the green, blue, red and near-infrared (NIR) wavebands, respectively.
In addition, the spectral reflectance in the blue, green, red, NIR, four red-edge and two SWIR wavebands of different ground objects were analysed according to 3000-pixel samples. Then, we built a decision tree model to extract winter canola and winter wheat distributions based on the spectral reflectance analysis.
2.4. Winter Garlic and Winter Wheat Extraction
In the second study area, we extracted winter garlic and winter wheat data. In contrast to the first study area, there was no evergreen vegetation. Therefore, the main land cover types were winter wheat, winter garlic, other vegetation, and bare land. According to our field survey, winter garlic is sown in early to mid-October, and winter wheat is sown from late October to early November. In order to reduce freezing damage, winter garlic plots are covered with white plastic film, but winter wheat plots are not, which creates a significant difference in their appearance in October. Therefore, Sentinel-2 imagery from 21 October 2020 was used for analysis.
To accurately describe the phenological stage of crops, we used the international Biologische Bundesanstalt, Bundessortenamt und Chemische Industrie (BBCH) scale [29]. During the BBCH2 stage, winter garlic stems and leaves have a slower growth rate than wheat. In addition, the density of winter garlic plants is much lower. Thus, the stems and leaves of winter wheat cover more than 80% of the ground in January, while those of winter garlic cover less than 30%. Therefore, we selected Sentinel-2 images from 9 January 2021 for the extraction of winter garlic and winter wheat data. The extraction approach was the same as that in Section 2.3.
2.5. Accuracy Validation
3. Results
3.1. Spectral Signature
For the first study area, the spectral profiles of Sentinel-2 images acquired on 18 March and 17 February 2020 and their NDVI and NDYI profiles are plotted in Figure 2. We can see that NDYI has the potential to distinguish winter canola from other land cover types during the canola flowering stage. The NDYI values of canola are greater than 0.28, while those of other land cover types are much lower than 0.28, as shown in Figure 2b. As shown in Figure 2a, the NDYI cannot identify winter canola during its non-flowering stage. During winter canola flowering, the NDVI cannot clearly distinguish winter wheat from evergreen vegetation, but it can distinguish these two from other land cover types. The NDVI values of winter wheat and evergreen vegetation are similar, being much greater than 0.5, while those of other vegetation and bare land are lower than 0.5. The NIR band can distinguish winter wheat from evergreen vegetation as the NIR reflectance values of winter wheat are much greater than 0.28, while those of evergreen vegetation are much lower than 0.28.
For the second study region, the spectral and NDVI and NDYI profiles of Sentinel-2 images from 21 October 2020 and 9 January 2021 are plotted in the spectral profiles; winter wheat and winter garlic have two obvious differences. At both times, the NDYI values of all land cover types are much lower than 0.28.
As shown in the spectral profiles, winter wheat and winter garlic have two obvious differences; the NDVI values of deciduous vegetation on 21 October 2020, shown in Figure 3a, are much greater than 0.23, while those of other ground objects are lower than 0.23. In the spectral profiles, winter wheat and winter garlic have two obvious differences: (1) in the blue and green wavebands, winter wheat has much lower values, and (2) from the fourth red-edge waveband to the first SWIR waveband, the values of winter wheat increase while those of winter garlic decrease. As the spatial resolution of the red-edge and SWIR wavebands is coarser than the others at 20 m × 20 m, we did not use this data to identify winter garlic and winter wheat. As shown in Figure 3b, in the NIR waveband the reflectance of winter wheat is greater than that of winter garlic, while in the red waveband, the reflectance of winter wheat is lower. As a result, the NDVI values of winter wheat are much greater than 0.5, while those of winter garlic are 0.23–0.5. The NDVI values of bare land are much lower than 0.23.
3.2. Decision Tree for Winter Crop Type Classification
A decision tree model for different types of winter crops as shown in Figure 4.
First, for the Sentinel-2 image from 18 March 2020, if the NDYI value of a pixel was more than 0.28 and the reflectance value in the green waveband was more than 0.09, the pixel was classified as winter canola. Otherwise, the pixel was subject to the next judgment rule. If its NDVI value was more than 0.5 and its reflectance in the NIR waveband was more than 0.28, it was classified as winter wheat; otherwise, it was classified as “other”. Thus, a map of winter canola and winter wheat was obtained by traversing all pixel positions in turn.
Second, if a pixel satisfied the first judgment rule, i.e., its NDVI value on 9 January 2021 was more than 0.23 and less than or equal to 0.5 and its reflectance in the NIR waveband was more than 0.24, then it was subjected to the second judgment rule. That is, if its NDVI value on 21 October 2020 was less than 0.23 and its reflectance value in the green waveband was more than 0.15, it was classified as winter garlic; otherwise, it was classified as “other”. If the pixel did not pass the first rule, it was subjected to a third judgment rule, i.e., if its NDVI value on 9 January 2021 was more than 0.5 and its reflectance value in the NIR waveband was more than 0.28, it was classified as winter wheat; otherwise, it was classified as “other”. Thus, a map of winter garlic and winter wheat was obtained by traversing all pixel positions in turn.
3.3. Map of Winter Crops
The classification results of winter canola, winter garlic and winter wheat based on the decision tree model are shown in Figure 5.
The first study region contained winter canola and winter wheat but no winter garlic. The winter canola and winter wheat plots were staggered. The distribution of winter wheat was relatively concentrated in the northern part of the study region. In the second study region, winter garlic was densely planted with winter wheat surrounding these areas.
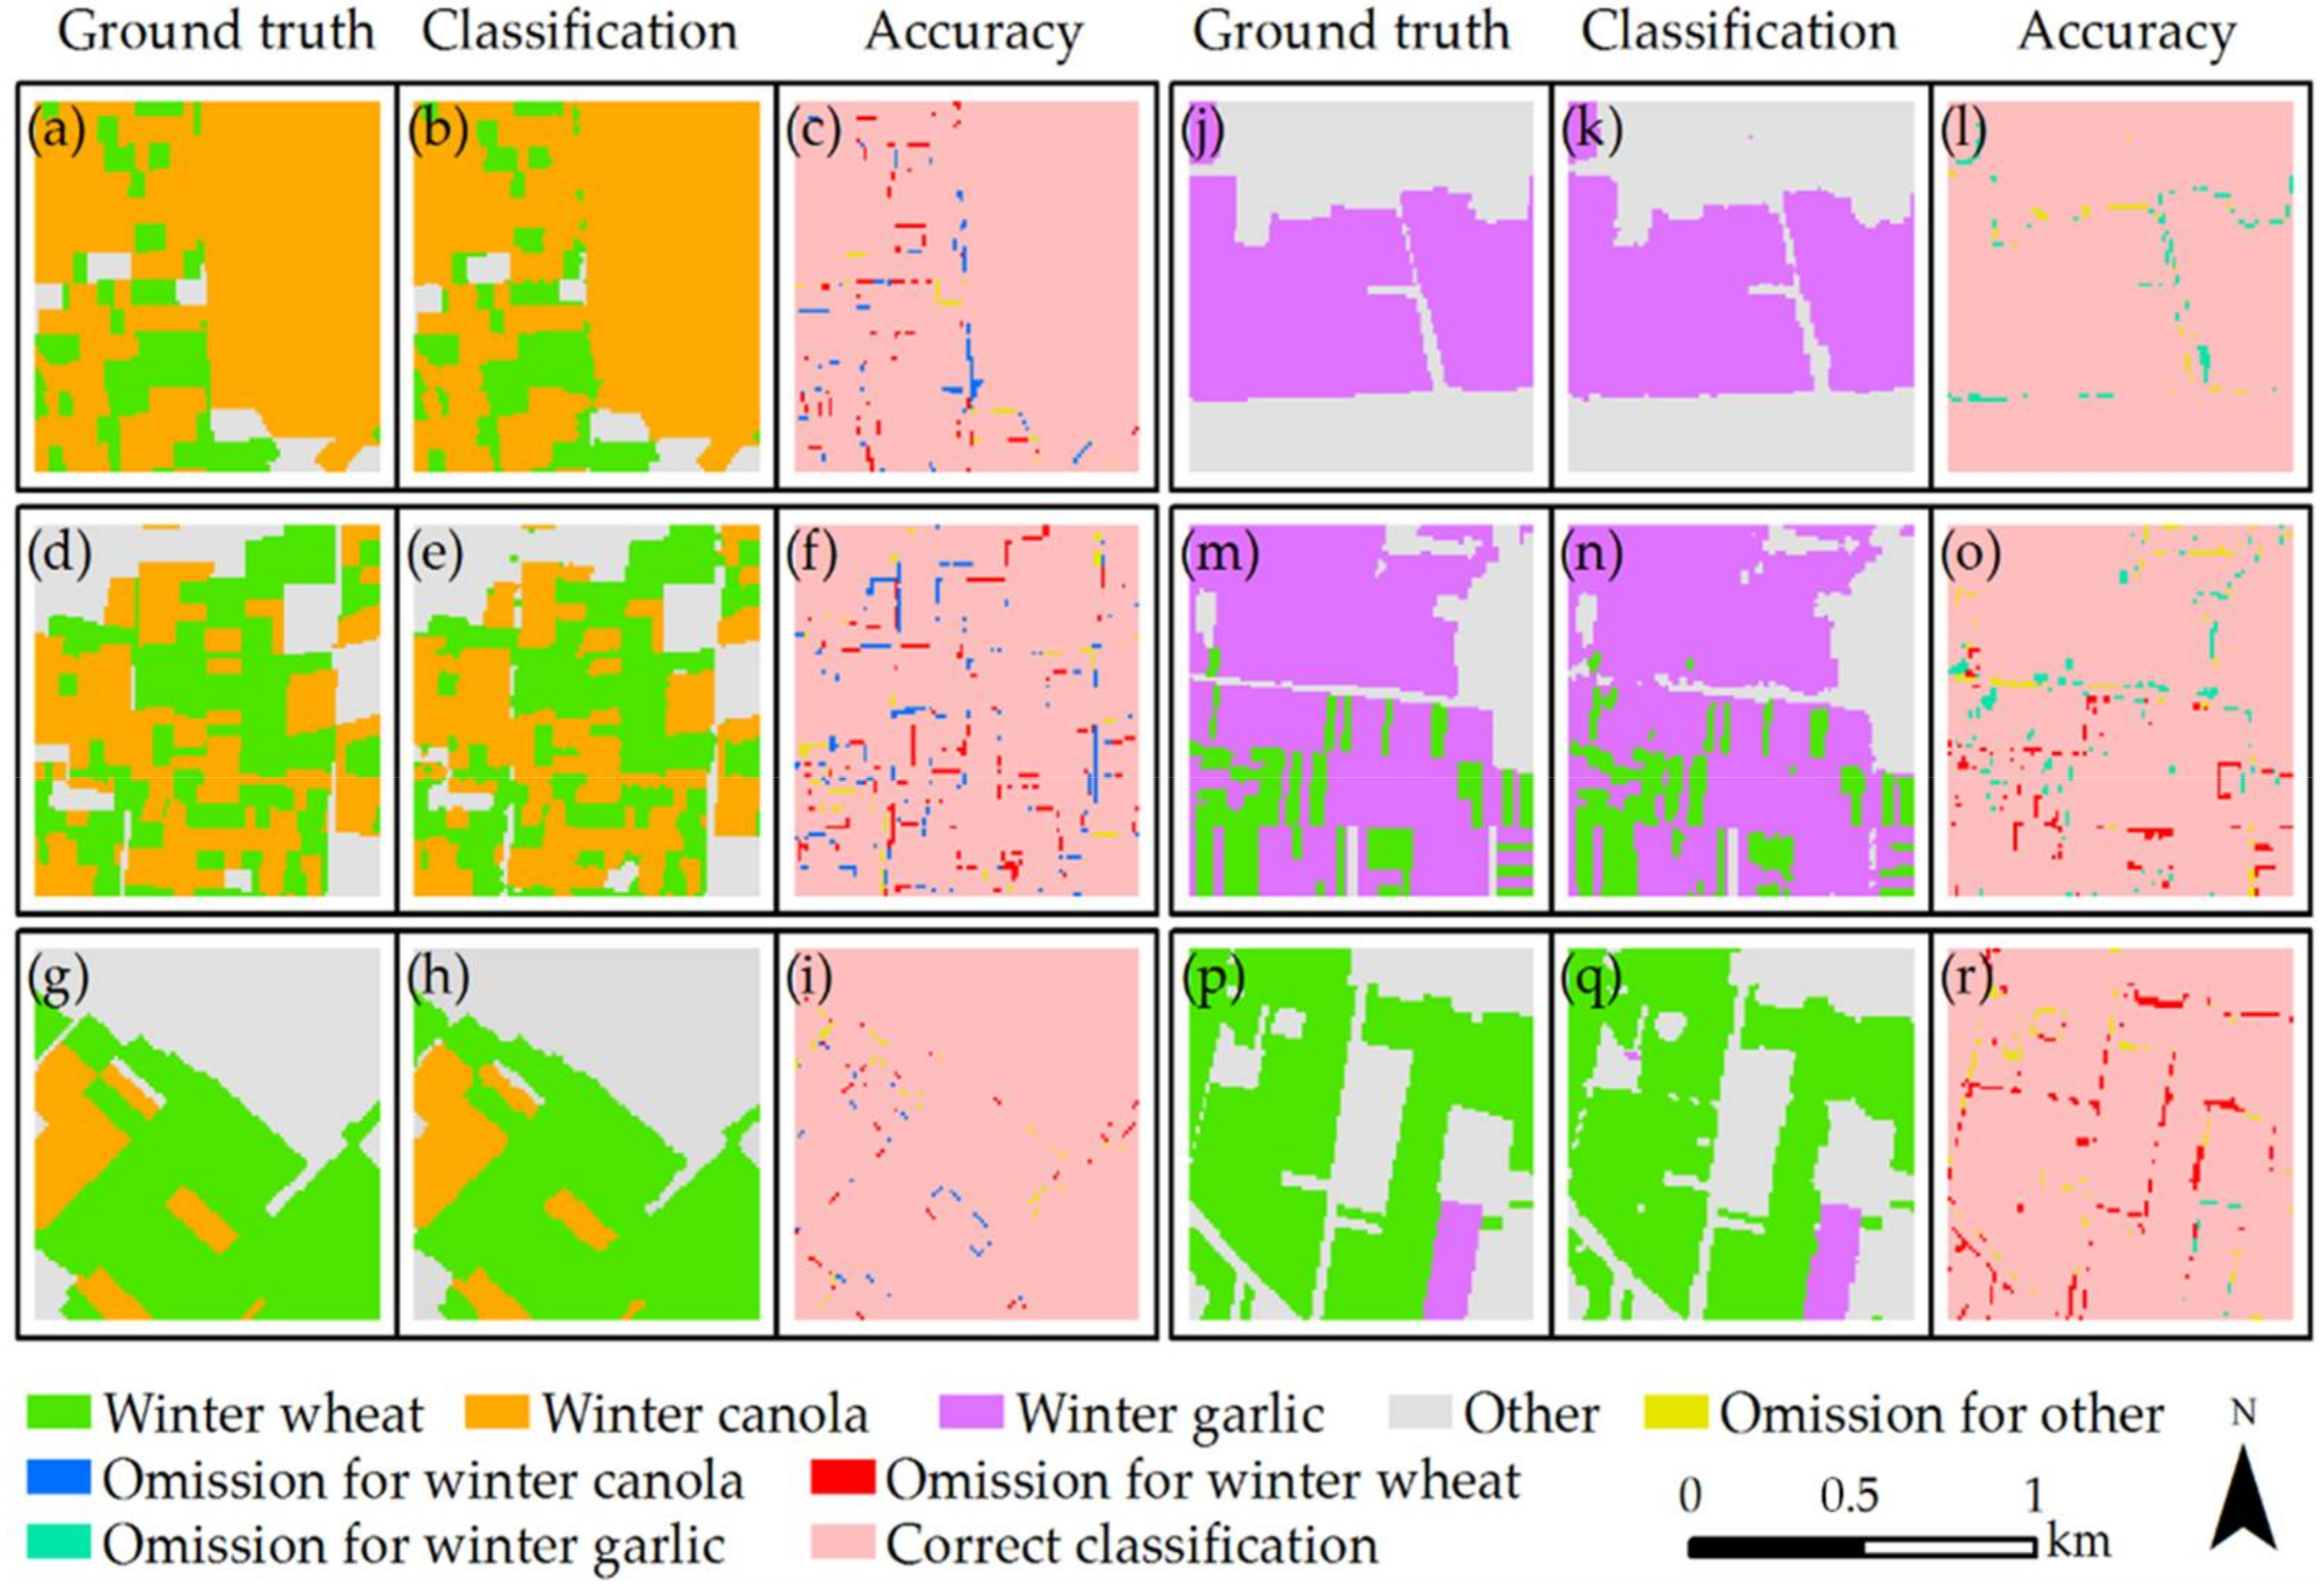
The overall classification accuracy of these three winter crops is 96.62% with a kappa coefficient of 0.95 based on 17 validation quadrats with areas of 1 km × 1 km. More detailed accuracy results are shown in Table 1. In order to improve the visualisation of accuracy verification, we randomly selected six validation quadrats to show the results of accuracy validation in detail, as shown in Figure 6. The misclassification is mainly distributed at the boundary of ground objects.
4. Discussion
Sentinel-2 images have been widely used in remote sensing applications all over the world [6,14]. There are more than 1600 studies on Sentinel-2 images according to a search of titles containing the keyword “Sentinel-2” on the Web of Science Core Collection. However, there is almost no literature on identifying winter garlic by remote sensing, while winter wheat has attracted extensive attention in this regard. If winter canola and winter garlic are not distinguished accurately, the identification accuracy of winter wheat may be greatly restricted. Therefore, it is necessary to study the identification of different types of winter crops by using remote sensing.
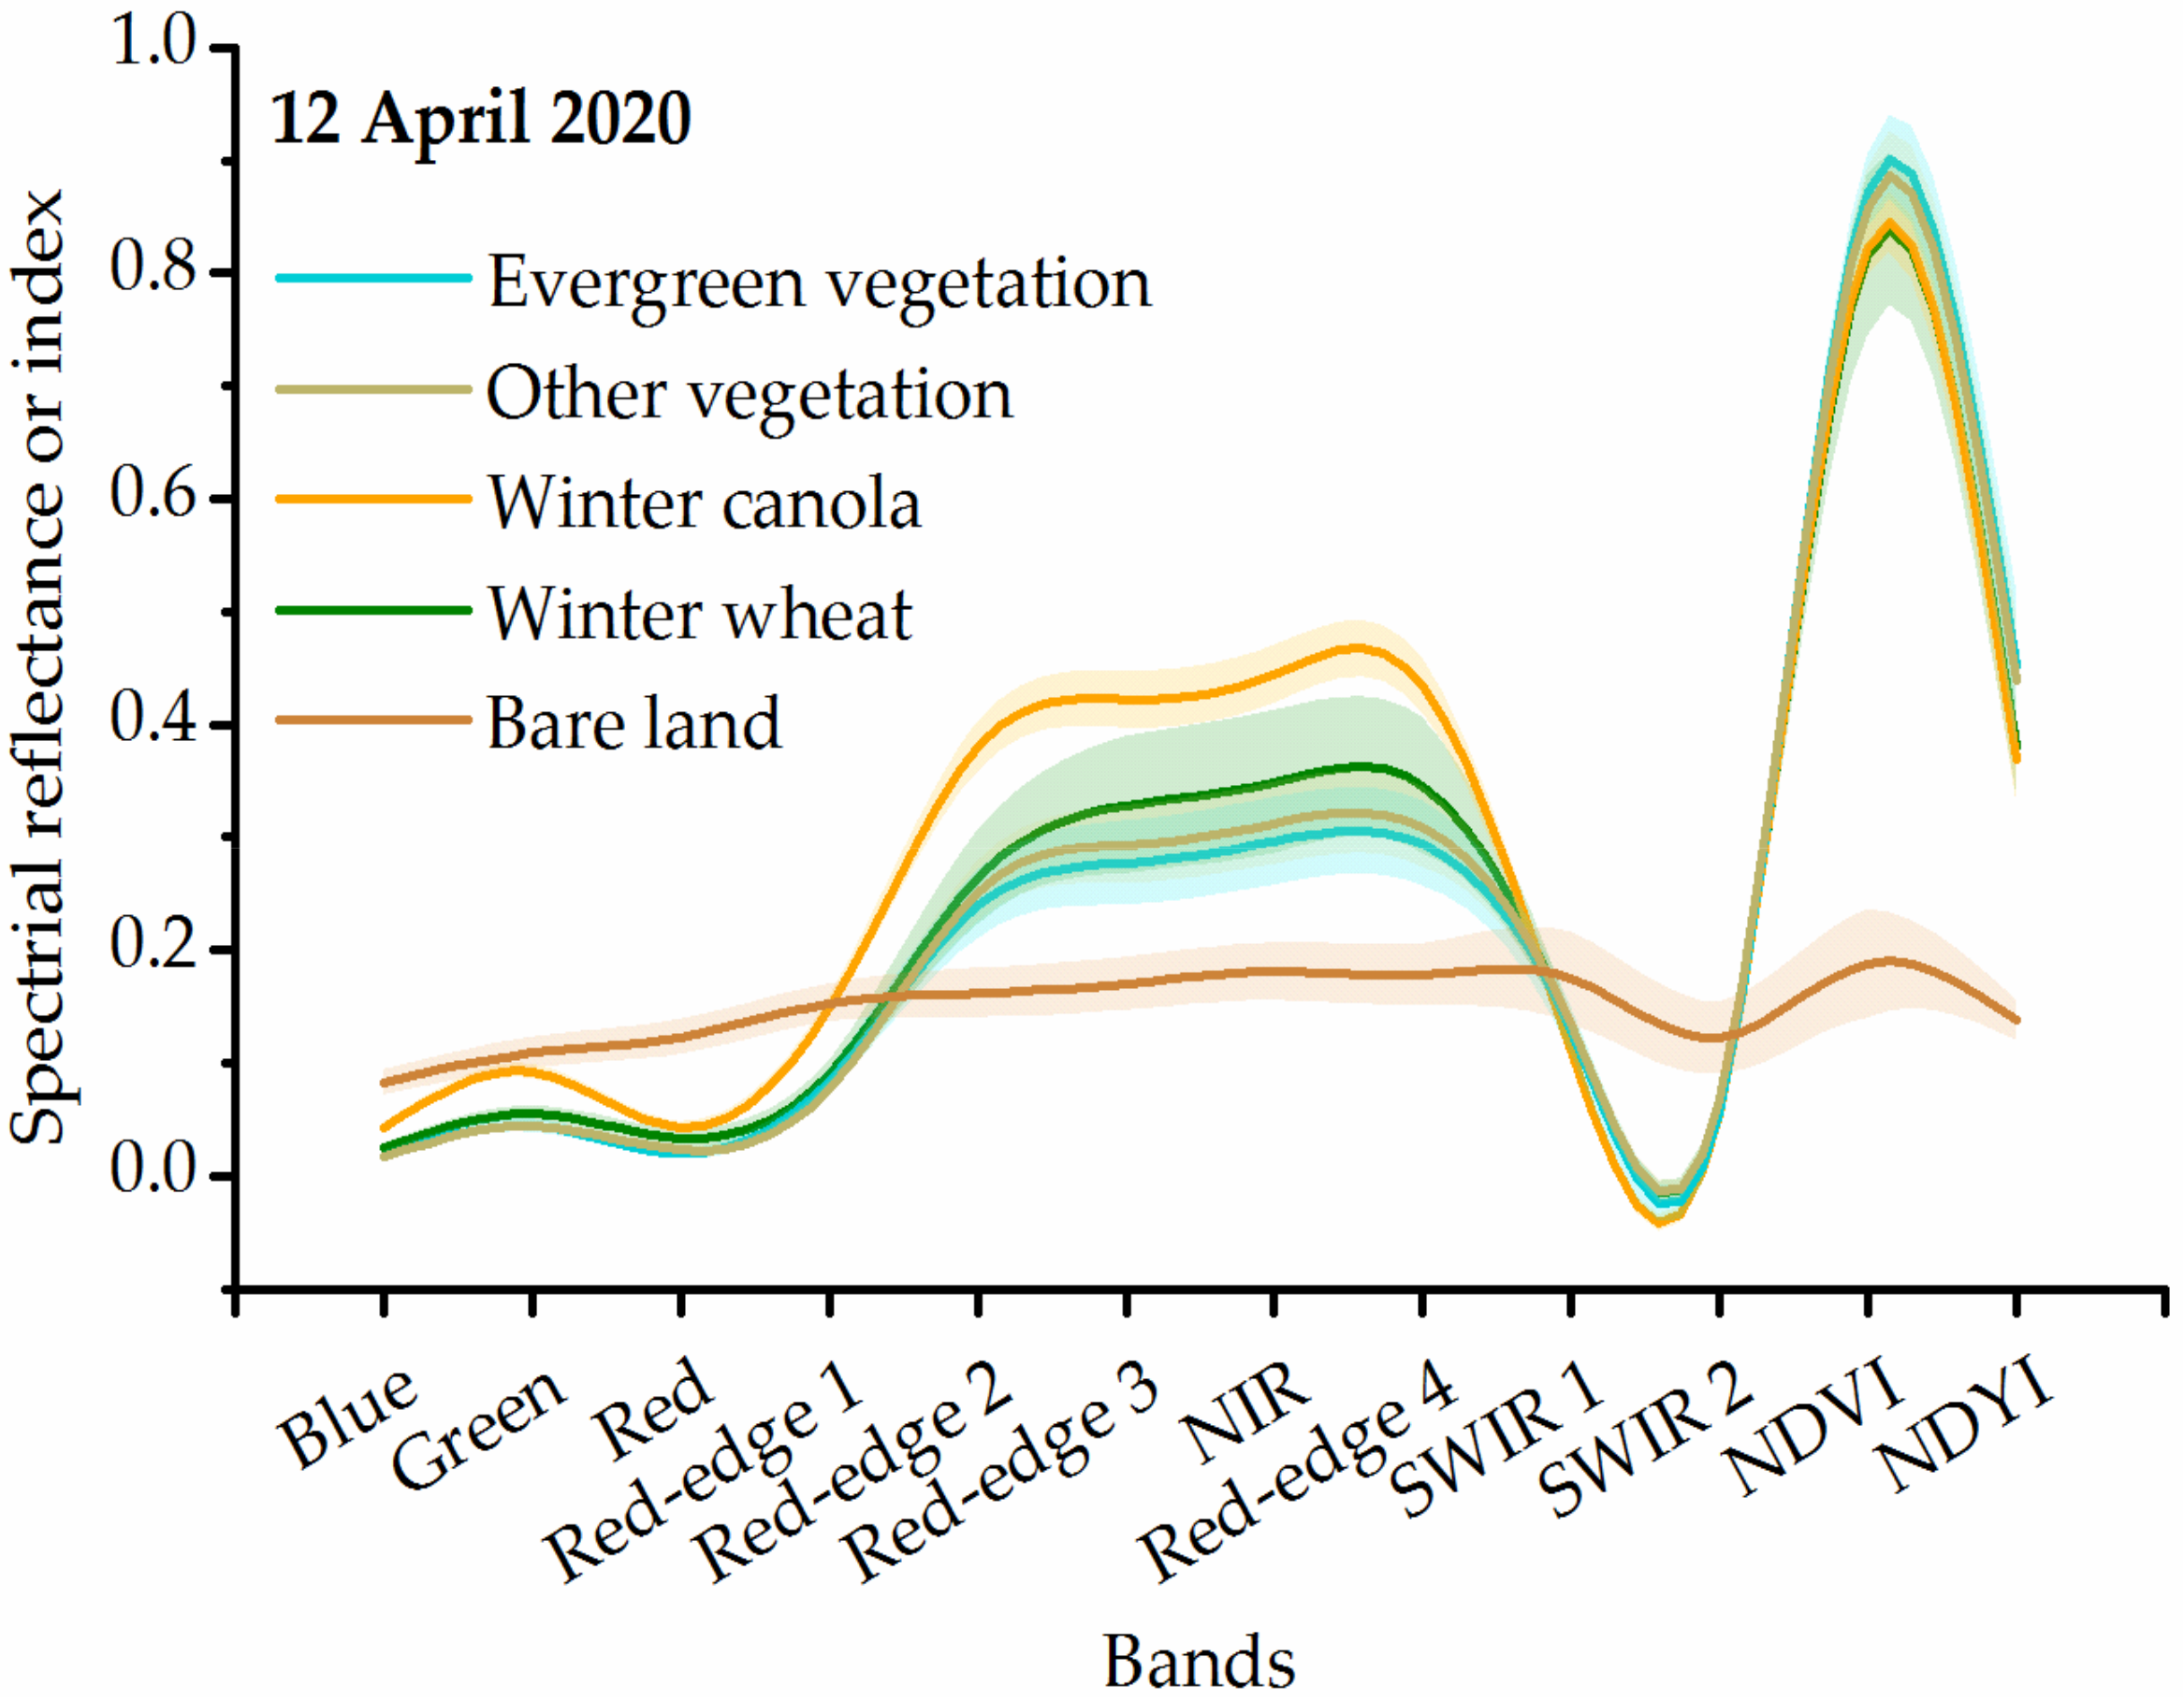
The growth characteristics of winter canola during flowering (BBCH6) provide an opportunity for mapping canola by remote sensing. Canola petals are yellow because they contain carotenoids that absorb blue light and reflect a mixture of green and red light [25]. As shown in Figure 2b, the reflectance values of canola were much greater in the green waveband than in the blue waveband. Other vegetation does not have this feature, which is the theoretical basis of the NDYI. Nevertheless, NDYI values are not always reliable. For example, as shown in Figure 7, the NDYI values derived from the Sentinel-2 image on 12 April 2020 for winter wheat, evergreen vegetation and other vegetation were more than 0.28, which should not have been the case.
If a reflectance value in the blue waveband is close to 0, the corresponding NDYI may be relatively high, even if the reflectance in the green waveband is only a little higher. Satellite imaging is affected by the complex atmospheric environment. After atmospheric correction, reflectance values in the blue waveband may be close to 0, which is an error that causes uncertainty in the NDYI. Therefore, we cannot use NDYI data alone to extract canola data, and additional constraints are required. For example, in the decision tree classification model, we consider a range of reflectance values in the blue waveband for canola.
On the other hand, flowering is the key period for winter canola data extraction using remote sensing [2,31], which lasts about one month. If the data from the flowering stage are missing, it will be very challenging to distinguish winter canola in optical images. The revisit time of the Sentinel-2 sensor is 5 days, which provides sufficient data to capture flowering, even in cloudy and rainy areas.
China is the world’s main winter-garlic-producing region, and more than 8 × 10⁵ ha of this crop existed in 2020 according to media reports. Garlic is a daily food of Chinese people and its price fluctuates between years. However, garlic planting areas are not counted in research by the Chinese government. Therefore, research on garlic remote sensing recognition is of great significance.
Inherent changes in leaf composition and canopy structure lead to immense variations in spectral–temporal profiles [14,21]. Therefore, we used two-date Sentinel-2 data in the decision tree classification model. In January, the spectral difference between winter garlic and winter wheat was significant in the Sentinel-2 image, as shown in Figure 3b. Winter garlic and deciduous vegetation have similar spectral profiles, especially based on visible light and the NDVI. In October, the spectral difference between winter garlic and deciduous vegetation was significant. Therefore, multi-temporal data is helpful in improving crop type classification accuracy.
The Chinese government usually publishes data on crop planting areas a few months after harvest; hence, its timeliness is relatively poor. Moreover, this data cannot be used to manage current crops. The earlier we obtain data on crop planting areas, the greater its usefulness. For example, if data on the area and distribution of winter garlic is obtained early in the season, we can predict its output and price and formulate effective management measures for different regions.
In China, farmland is highly fragmented, especially crop parcels. For example, in Figure 5, some crop parcels are only one pixel wide in the Sentinel-2 image, i.e., 10 m wide. Such crop parcels may be missed using lower-resolution images, such as those of Landsat.
Decision tree classification may not be the optimal method for categorising land cover types. Other classification methods, such as random forest [32] or deep learning [33], may achieve higher accuracy. This study demonstrates that Sentinel-2 images can be used for early season identification of winter crops due to their high temporal and spatial resolution. As shown in Figure 2 and Figure 3, the high spectral resolution makes little contribution to improving the classification accuracy of winter crops. In addition, the spatial resolution of the red-edge waveband is lower than that of the NIR waveband.
5. Conclusions
This study analysed the spectral characteristics of winter canola, winter garlic and winter wheat as represented in Sentinel-2 images. We evaluated the potential of using Sentinel-2 imagery for the early season mapping of different types of winter crops. The following conclusions were obtained:
- Sentinel-2 images have the ability to distinguish between different types of winter crops; in this case, winter canola, winter garlic and winter wheat. The red-edge wavebands make little contribution to classification accuracy.
- Sentinel-2 images have great potential for application to the early season mapping of different types of winter crops. Winter garlic and winter canola can be distinguished in January, which is about four months before harvest. Winter canola can be identified in March, which is about two months before harvest.
- Sentinel-2 imagery will become an important data source in the field of agricultural remote sensing because it has great advantages over other data sources in terms of temporal and spatial resolution in addition to being freely available.
6. Patents
Two Chinese invention patents resulted from the work reported in this manuscript. One is an automatic canola identification method based on optical satellite imagery (grant number ZL202010021111.6) and the other is a garlic identification method based on active and passive remote sensing images as well as a cloud platform (grant number ZL202010995102.7).
Author Contributions
Conceptualisation, H.T. and Y.Q.; methodology, H.T. and L.Z.; software, Y.W. and T.C.; validation, H.T.; formal analysis, H.T.; investigation, H.T.; resources, H.T. and Y.Q.; data curation, H.T.; writing—original draft preparation, H.T.; writing—review and editing, H.T. and L.Z.; visualisation, H.T.; supervision, H.T.; project administration, H.T.; funding acquisition, H.T. and Y.Q. All authors have read and agreed to the published version of the manuscript.
Funding
This research was funded by the China Postdoctoral Science Foundation, grant number 2019M662478; the Natural Science Foundation of Henan, grant number 202300410075; the major project of the Collaborative Innovation Center on Yellow River Civilization, jointly built by the Henan province and the Ministry of Education, grant number 2020M19; and the National Demonstration Center for Experimental Environment and Planning Education (Henan University) Funding Project, grant number 2020HGSYJX009.
Institutional Review Board Statement
Not applicable.
Informed Consent Statement
Not applicable.
Data Availability Statement
Not applicable.
Acknowledgments
We thank the Dabieshan National Observation and Research Field Station of Forest Ecosystem at Henan for its technical assistance.
Conflicts of Interest
The authors declare no conflict of interest.
References
- Inglada, J.; Arias, M.; Tardy, B.; Hagolle, O.; Valero, S.; Morin, D.; Dedieu, G.; Sepulcre, G.; Bontemps, S.; Defourny, P.; et al. Assessment of an Operational System for Crop Type Map Production Using High Temporal and Spatial Resolution Satellite Optical Imagery. Remote Sens. 2015, 7, 12356–12379. [Google Scholar] [CrossRef] [Green Version]
- Ashourloo, D.; Shahrabi, H.S.; Azadbakht, M.; Aghighi, H.; Nematollahi, H.; Alimohammadi, A.; Matkan, A.A. Automatic canola mapping using time series of sentinel 2 images. ISPRS J. Photogramm. Remote Sens. 2019, 156, 63–76. [Google Scholar] [CrossRef]
- Chong, L.; Liu, H.J.; Lu, L.P.; Liu, Z.R.; Kong, F.C.; Zhang, X.L. Monthly composites from Sentinel-1 and Sentinel-2 images for regional major crop mapping with Google Earth Engine. J. Integr. Agric. 2021, 20, 1944–1957. [Google Scholar] [CrossRef]
- Meng, S.Y.; Wang, X.Y.; Hu, X.; Luo, C.; Zhong, Y.F. Deep learning-based crop mapping in the cloudy season using one-shot hyperspectral satellite imagery. Comput. Electron. Agric. 2021, 186, 106188. [Google Scholar] [CrossRef]
- Tao, W.C.; Xie, Z.X.; Zhang, Y.; Li, J.Y.; Xuan, F.; Huang, J.X.; Li, X.C.; Su, W.; Yin, D.Q. Corn Residue Covered Area Mapping with a Deep Learning Method Using Chinese GF-1 B/D High Resolution Remote Sensing Images. Remote Sens. 2021, 13, 2903. [Google Scholar] [CrossRef]
- Belgiu, M.; Csillik, O. Sentinel-2 cropland mapping using pixel-based and object-based time-weighted dynamic time warping analysis. Remote Sens. Environ. 2018, 204, 509–523. [Google Scholar] [CrossRef]
- Wang, C.Z.; Fan, Q.; Li, Q.T.; SooHoo, W.M.; Lu, L.L. Energy crop mapping with enhanced TM/MODIS time series in the BCAP agricultural lands. ISPRS J. Photogramm. Remote Sens. 2017, 124, 133–143. [Google Scholar] [CrossRef] [Green Version]
- Skakun, S.; Franch, B.; Vermote, E.; Roger, J.C.; Becker-Reshef, I.; Justice, C.; Kussul, N. Early season large-area winter crop mapping using MODIS NDVI data, growing degree days information and a Gaussian mixture model. Remote Sens. Environ. 2017, 195, 244–258. [Google Scholar] [CrossRef]
- Zhang, H.Y.; Du, H.Y.; Zhang, C.K.; Zhang, L.P. An automated early-season method to map winter wheat using time-series Sentinel-2 data: A case study of Shandong, China. Comput. Electron. Agric. 2021, 182, 105962. [Google Scholar] [CrossRef]
- Friedl, M.A.; Sulla-Menashe, D.; Tan, B.; Schneider, A.; Ramankutty, N.; Sibley, A.; Huang, X.M. MODIS Collection 5 global land cover: Algorithm refinements and characterization of new datasets. Remote Sens. Environ. 2010, 114, 168–182. [Google Scholar] [CrossRef]
- Nasrallah, A.; Baghdadi, N.; Mhawej, M.; Faour, G.; Darwish, T.; Belhouchette, H.; Darwich, S. A Novel Approach for Mapping Wheat Areas Using High Resolution Sentinel-2 Images. Sensors 2018, 18, 2089. [Google Scholar] [CrossRef] [Green Version]
- Griffiths, P.; Nendel, C.; Hostert, P. Intra-annual reflectance composites from Sentinel-2 and Landsat for national-scale crop and land cover mapping. Remote Sens. Environ. 2019, 220, 135–151. [Google Scholar] [CrossRef]
- Veloso, A.; Mermoz, S.; Bouvet, A.; Toan, T.L.; Planells, M.; Dejoux, J.F.; Ceschia, E. Understanding the temporal behavior of crops using Sentinel-1 and Sentinel-2-like data for agricultural applications. Remote Sens. Environ. 2017, 199, 415–426. [Google Scholar] [CrossRef]
- Vuolo, F.; Neuwirth, M.; Immitzer, M.; Atzberger, C.; Ng, W.T. How much does multi-temporal Sentinel-2 data improve crop type classification? Int. J. Appl. Earth Obs. Geoinf. 2018, 72, 122–130. [Google Scholar] [CrossRef]
- Xiong, J.; Thenkabail, P.S.; Tilton, J.C.; Gumma, M.K.; Teluguntla, P.; Oliphant, A.; Congalton, R.G.; Yadav, K.; Gorelick, N. Nominal 30-m Cropland Extent Map of Continental Africa by Integrating Pixel-Based and Object-Based Algorithms Using Sentinel-2 and Landsat-8 Data on Google Earth Engine. Remote Sens. 2017, 9, 1065. [Google Scholar] [CrossRef] [Green Version]
- Dong, J.; Fu, Y.Y.; Wang, J.J.; Tian, H.F.; Fu, S.; Niu, Z.; Han, W.; Zheng, Y.; Huang, J.X.; Yuan, W.P. Early-season mapping of winter wheat in China based on Landsat and Sentinel images. Earth Syst. Sci. Data 2020, 12, 3081–3095. [Google Scholar] [CrossRef]
- Li, F.J.; Ren, J.Q.; Wu, S.R.; Zhao, H.W.; Zhang, N.D. Comparison of Regional Winter Wheat Mapping Results from Different Similarity Measurement Indicators of NDVI Time Series and Their Optimized Thresholds. Remote Sens. 2021, 13, 1162. [Google Scholar] [CrossRef]
- Kogan, F.; Kussul, N.; Adamenko, T.; Skakun, S.; Kravchenko, O.; Kryvobok, O.; Shelestov, A.; Kolotii, A.; Kussul, O.; Lavrenyuk, A. Winter wheat yield forecasting in Ukraine based on Earth observation, meteorological data and biophysical models. Int. J. Appl. Earth Obs. Geoinf. 2013, 23, 192–203. [Google Scholar] [CrossRef]
- Qiu, B.W.; Luo, Y.H.; Tang, Z.H.; Chen, C.C.; Lu, D.F.; Huang, H.Y.; Chen, Y.Z.; Chen, N.; Xu, W.M. Winter wheat mapping combining variations before and after estimated heading dates. ISPRS J. Photogramm. Remote Sens. 2017, 123, 35–46. [Google Scholar] [CrossRef]
- Tao, J.B.; Wu, W.B.; Zhou, Y.; Wang, Y.; Jiang, Y. Mapping winter wheat using phenological feature of peak before winter on the North China Plain based on time-series MODIS data. J. Integr. Agric. 2017, 16, 348–359. [Google Scholar] [CrossRef] [Green Version]
- Tian, H.F.; Huang, N.; Niu, Z.; Qin, Y.C.; Pei, J.; Wang, J. Mapping Winter Crops in China with Multi-Source Satellite Imagery and Phenology-Based Algorithm. Remote Sens. 2019, 11, 820. [Google Scholar] [CrossRef] [Green Version]
- Zhou, T.; Pan, J.J.; Zhang, P.Y.; Wei, S.B.; Han, T. Mapping Winter Wheat with Multi-Temporal SAR and Optical Images in an Urban Agricultural Region. Sensors 2017, 17, 1210. [Google Scholar] [CrossRef]
- Tian, H.F.; Meng, M.; Wu, M.Q.; Niu, Z. Mapping spring canola and spring wheat using Radarsat-2 and Landsat-8 images with Google Earth Engine. Curr. Sci. 2019, 116, 291–298. [Google Scholar] [CrossRef]
- Sulik, J.J.; Long, D.S. Spectral considerations for modeling yield of canola. Remote Sens. Environ. 2016, 184, 161–174. [Google Scholar] [CrossRef] [Green Version]
- Sulik, J.J.; Long, D.S. Spectral indices for yellow canola flowers. Int. J. Remote Sens. 2015, 36, 2751–2765. [Google Scholar] [CrossRef]
- Forkuor, G.; Dimobe, K.; Serme, I.; Tondoh, J.E. Landsat-8 vs. Sentinel-2: Examining the added value of sentinel-2’s red-edge bands to land-use and land-cover mapping in Burkina Faso. Gisci. Remote Sens. 2018, 55, 331–354. [Google Scholar] [CrossRef]
- Gorelick, N.; Hancher, M.; Dixon, M.; Ilyushchenko, S.; Thau, D.; Moore, R. Google Earth Engine: Planetary-scale geospatial analysis for everyone. Remote Sens. Environ. 2017, 202, 18–27. [Google Scholar] [CrossRef]
- Tian, H.; Pei, J.; Huang, J.; Li, X.; Wang, J.; Zhou, B.; Qin, Y.; Wang, L. Garlic and Winter Wheat Identification Based on Active and Passive Satellite Imagery and the Google Earth Engine in Northern China. Remote Sens. 2020, 12, 3539. [Google Scholar] [CrossRef]
- Lancashire, P.D.; Bleiholder, H.; Boom, T.; Langel Dd Eke, P.; Stauss, R.; Weber, E.; Witzenberger, A. A uniform decimal code for growth stages of crops and weeds. Ann. Appl. Biol. 1991, 119, 561–601. [Google Scholar] [CrossRef]
- Card, D.H. Using known map category marginal frequencies to improve estimates of thematic map accuracy. Photogramm. Eng. Remote Sens. 1982, 48, 431–439. [Google Scholar]
- d’Andrimont, R.; Taymans, M.; Lemoine, G.; Ceglar, A.; Yordanov, M.; van der Velde, M. Detecting flowering phenology in oil seed rape parcels with Sentinel-1 and-2 time series. Remote Sens. Environ. 2020, 239, 111660. [Google Scholar] [CrossRef] [PubMed]
- Belgiu, M.; Dragut, L. Random forest in remote sensing: A review of applications and future directions. ISPRS J. Photogramm. Remote Sens. 2016, 114, 24–31. [Google Scholar] [CrossRef]
- Chen, Y.; Lin, Z.; Zhao, X.; Wang, G.; Gu, Y. Deep Learning-Based Classification of Hyperspectral Data. IEEE J. Sel. Top. Appl. Earth Obs. Remote Sens. 2014, 7, 2094–2107. [Google Scholar] [CrossRef]
Figure 1.
(a) Locations of the study areas in China (red). (b) Sentinel-2 image of part of the second study region on 21 October 2020. White and brown areas are winter garlic and winter wheat plots, respectively. (c) Sentinel-2 image of part of the first study region on 18 March 2020. Yellow and blackish-green areas are winter canola and winter wheat, respectively. These Sentinel-2 images have true RGB colour, i.e., R = red waveband, G = green waveband and B = blue waveband.

Figure 2.
Spectral, NDVI and NDYI profiles derived from Sentinel-2 imagery on (a) 17 February 2020 and (b) 18 March 2020 (canola flowering period) in the first study region. Solid lines represent means and shaded areas represent one standard deviation from the mean.
Figure 2.
Spectral, NDVI and NDYI profiles derived from Sentinel-2 imagery on (a) 17 February 2020 and (b) 18 March 2020 (canola flowering period) in the first study region. Solid lines represent means and shaded areas represent one standard deviation from the mean.

Figure 3.
Spectral, NDVI and NDYI profiles derived from Sentinel-2 imagery from (a) 21 October 2020 and (b) 9 January 2020 in the second study region. Solid lines represent means and shaded areas represent one standard deviation from the mean.
Figure 3.
Spectral, NDVI and NDYI profiles derived from Sentinel-2 imagery from (a) 21 October 2020 and (b) 9 January 2020 in the second study region. Solid lines represent means and shaded areas represent one standard deviation from the mean.

Figure 4.
Decision tree model for classification of different types of winter crops.

Figure 5.
Maps of winter canola, winter garlic and winter wheat in the (a) first and (b) second study regions.
Figure 5.
Maps of winter canola, winter garlic and winter wheat in the (a) first and (b) second study regions.

Figure 6.
Results of accuracy validation based on six validation quadrats with an area of 1 km by 1 km. (a,d,g,j,m,p) are the ground truth quadrats. (b,e,h,k,n,q) are the classification results for each quadrat. (c,f,i,l,o,r) are accuracy validation results.
Figure 6.
Results of accuracy validation based on six validation quadrats with an area of 1 km by 1 km. (a,d,g,j,m,p) are the ground truth quadrats. (b,e,h,k,n,q) are the classification results for each quadrat. (c,f,i,l,o,r) are accuracy validation results.

Figure 7.
Spectral, NDVI and NDYI profiles from Sentinel-2 imagery on 12 April 2020 in the second study region. Solid lines represent means and shaded areas represent one standard deviation from the mean.
Figure 7.
Spectral, NDVI and NDYI profiles from Sentinel-2 imagery on 12 April 2020 in the second study region. Solid lines represent means and shaded areas represent one standard deviation from the mean.


Table 1.
Accuracy of classifying different types of winter crops.
| Category | Producer Accuracy (%) | User Accuracy (%) |
|---|---|---|
| Winter wheat | 95.30 | 96.27 |
| Winter canola | 97.10 | 97.57 |
| Winter garlic | 97.27 | 97.57 |
| Other | 97.02 | 95.49 |
Publisher’s Note: MDPI stays neutral with regard to jurisdictional claims in published maps and institutional affiliations. |
© 2021 by the authors. Licensee MDPI, Basel, Switzerland. This article is an open access article distributed under the terms and conditions of the Creative Commons Attribution (CC BY) license (https://creativecommons.org/licenses/by/4.0/).
Share and Cite
MDPI and ACS Style
Tian, H.; Wang, Y.; Chen, T.; Zhang, L.; Qin, Y. Early-Season Mapping of Winter Crops Using Sentinel-2 Optical Imagery. Remote Sens. 2021, 13, 3822. https://0-doi-org.brum.beds.ac.uk/10.3390/rs13193822
AMA Style
Tian H, Wang Y, Chen T, Zhang L, Qin Y. Early-Season Mapping of Winter Crops Using Sentinel-2 Optical Imagery. Remote Sensing. 2021; 13(19):3822. https://0-doi-org.brum.beds.ac.uk/10.3390/rs13193822
Chicago/Turabian StyleTian, Haifeng, Yongjiu Wang, Ting Chen, Lijun Zhang, and Yaochen Qin. 2021. "Early-Season Mapping of Winter Crops Using Sentinel-2 Optical Imagery" Remote Sensing 13, no. 19: 3822. https://0-doi-org.brum.beds.ac.uk/10.3390/rs13193822
Note that from the first issue of 2016, this journal uses article numbers instead of page numbers. See further details here.