
A Technical Review of Planet Smallsat Data: Practical Considerations for Processing and Using PlanetScope Imagery


Spatial Analysis Research Center (SPARC), Center for Global Discovery and Conservation Science, School of Geographical Sciences and Urban Planning, Arizona State University, Tempe, AZ 85281, USA
*
Author to whom correspondence should be addressed.
Remote Sens. 2021, 13(19), 3930; https://0-doi-org.brum.beds.ac.uk/10.3390/rs13193930
Submission received: 25 August 2021
/
Revised: 23 September 2021
/
Accepted: 27 September 2021
/
Published: 30 September 2021
(This article belongs to the Special Issue Remote Sensing Data Sets)
Abstract
:With the ability to capture daily imagery of Earth at very high spatial resolutions, commercial smallsats are emerging as a key resource for the remote sensing community. Planet (Planet Labs, Inc., San Francisco, CA, USA) operates the largest constellation of Earth imaging smallsats, which have been capturing multispectral imagery for consumer use since 2016. Use of these images is growing in the remote sensing community, but the variation in radiometric and geometric quality compared to traditional platforms (i.e., Landsat, MODIS, etc.) means the images are not always ‘analysis ready’ upon download. Neglecting these variations can impact derived products and analyses. Users also must contend with constantly evolving technology, which improves products but can create discrepancies across sensor generations. This communication provides a technical review of Planet’s PlanetScope smallsat data streams and extant literature to provide practical considerations to the remote sensing community for utilizing these images in remote sensing research. Radiometric and geometric issues for researchers to consider are highlighted alongside a review of processing completed by Planet and innovations being developed by the user community to foster the adoption and use of these images for scientific applications.

1. Introduction
The collection and archiving of Earth observation data has historically been led by government agencies, spurring a range of benefits including continuity in data processing algorithms and more open and public access to the data [1,2]. A drawback to this model has been the extremely long delays, sometimes a decade or more, for developing and launching satellite systems as agencies work to secure funding and advocacy [3]. When issues arise, such as the failed launch of Landsat-6 or the scan line corrector malfunction of Landsat-7, coverage gaps can persist for months or years while another platform is authorized and built, diminishing the opportunity for scientific returns. Commercial satellite programs such as Digital Globe, QuickBird, and RapidEye reduced platform production times, but the build-and-launch process still took several years [3].
Companies such as Planet (Planet Labs, Inc., San Francisco, CA, USA) have been innovating Earth observation by developing miniature satellites, called smallsats or cubesats, that can be produced and launched much faster than traditional satellites. Their small size (approximately the dimensions of a loaf of bread) allows them to be built rapidly, and they do not require a dedicated launch vehicle but instead can be delivered into orbit onboard other deployments as secondary payload [4]. This flexibility means that Earth observation capabilities can be rapidly improved as new technologies progress, and satellite constellations can quickly be updated or bolstered by additional platforms in the event of malfunctions. As a result, commercial smallsats, specifically Planet’s PlanetScope (PS) satellites, are emerging as a key resource for Earth imaging.
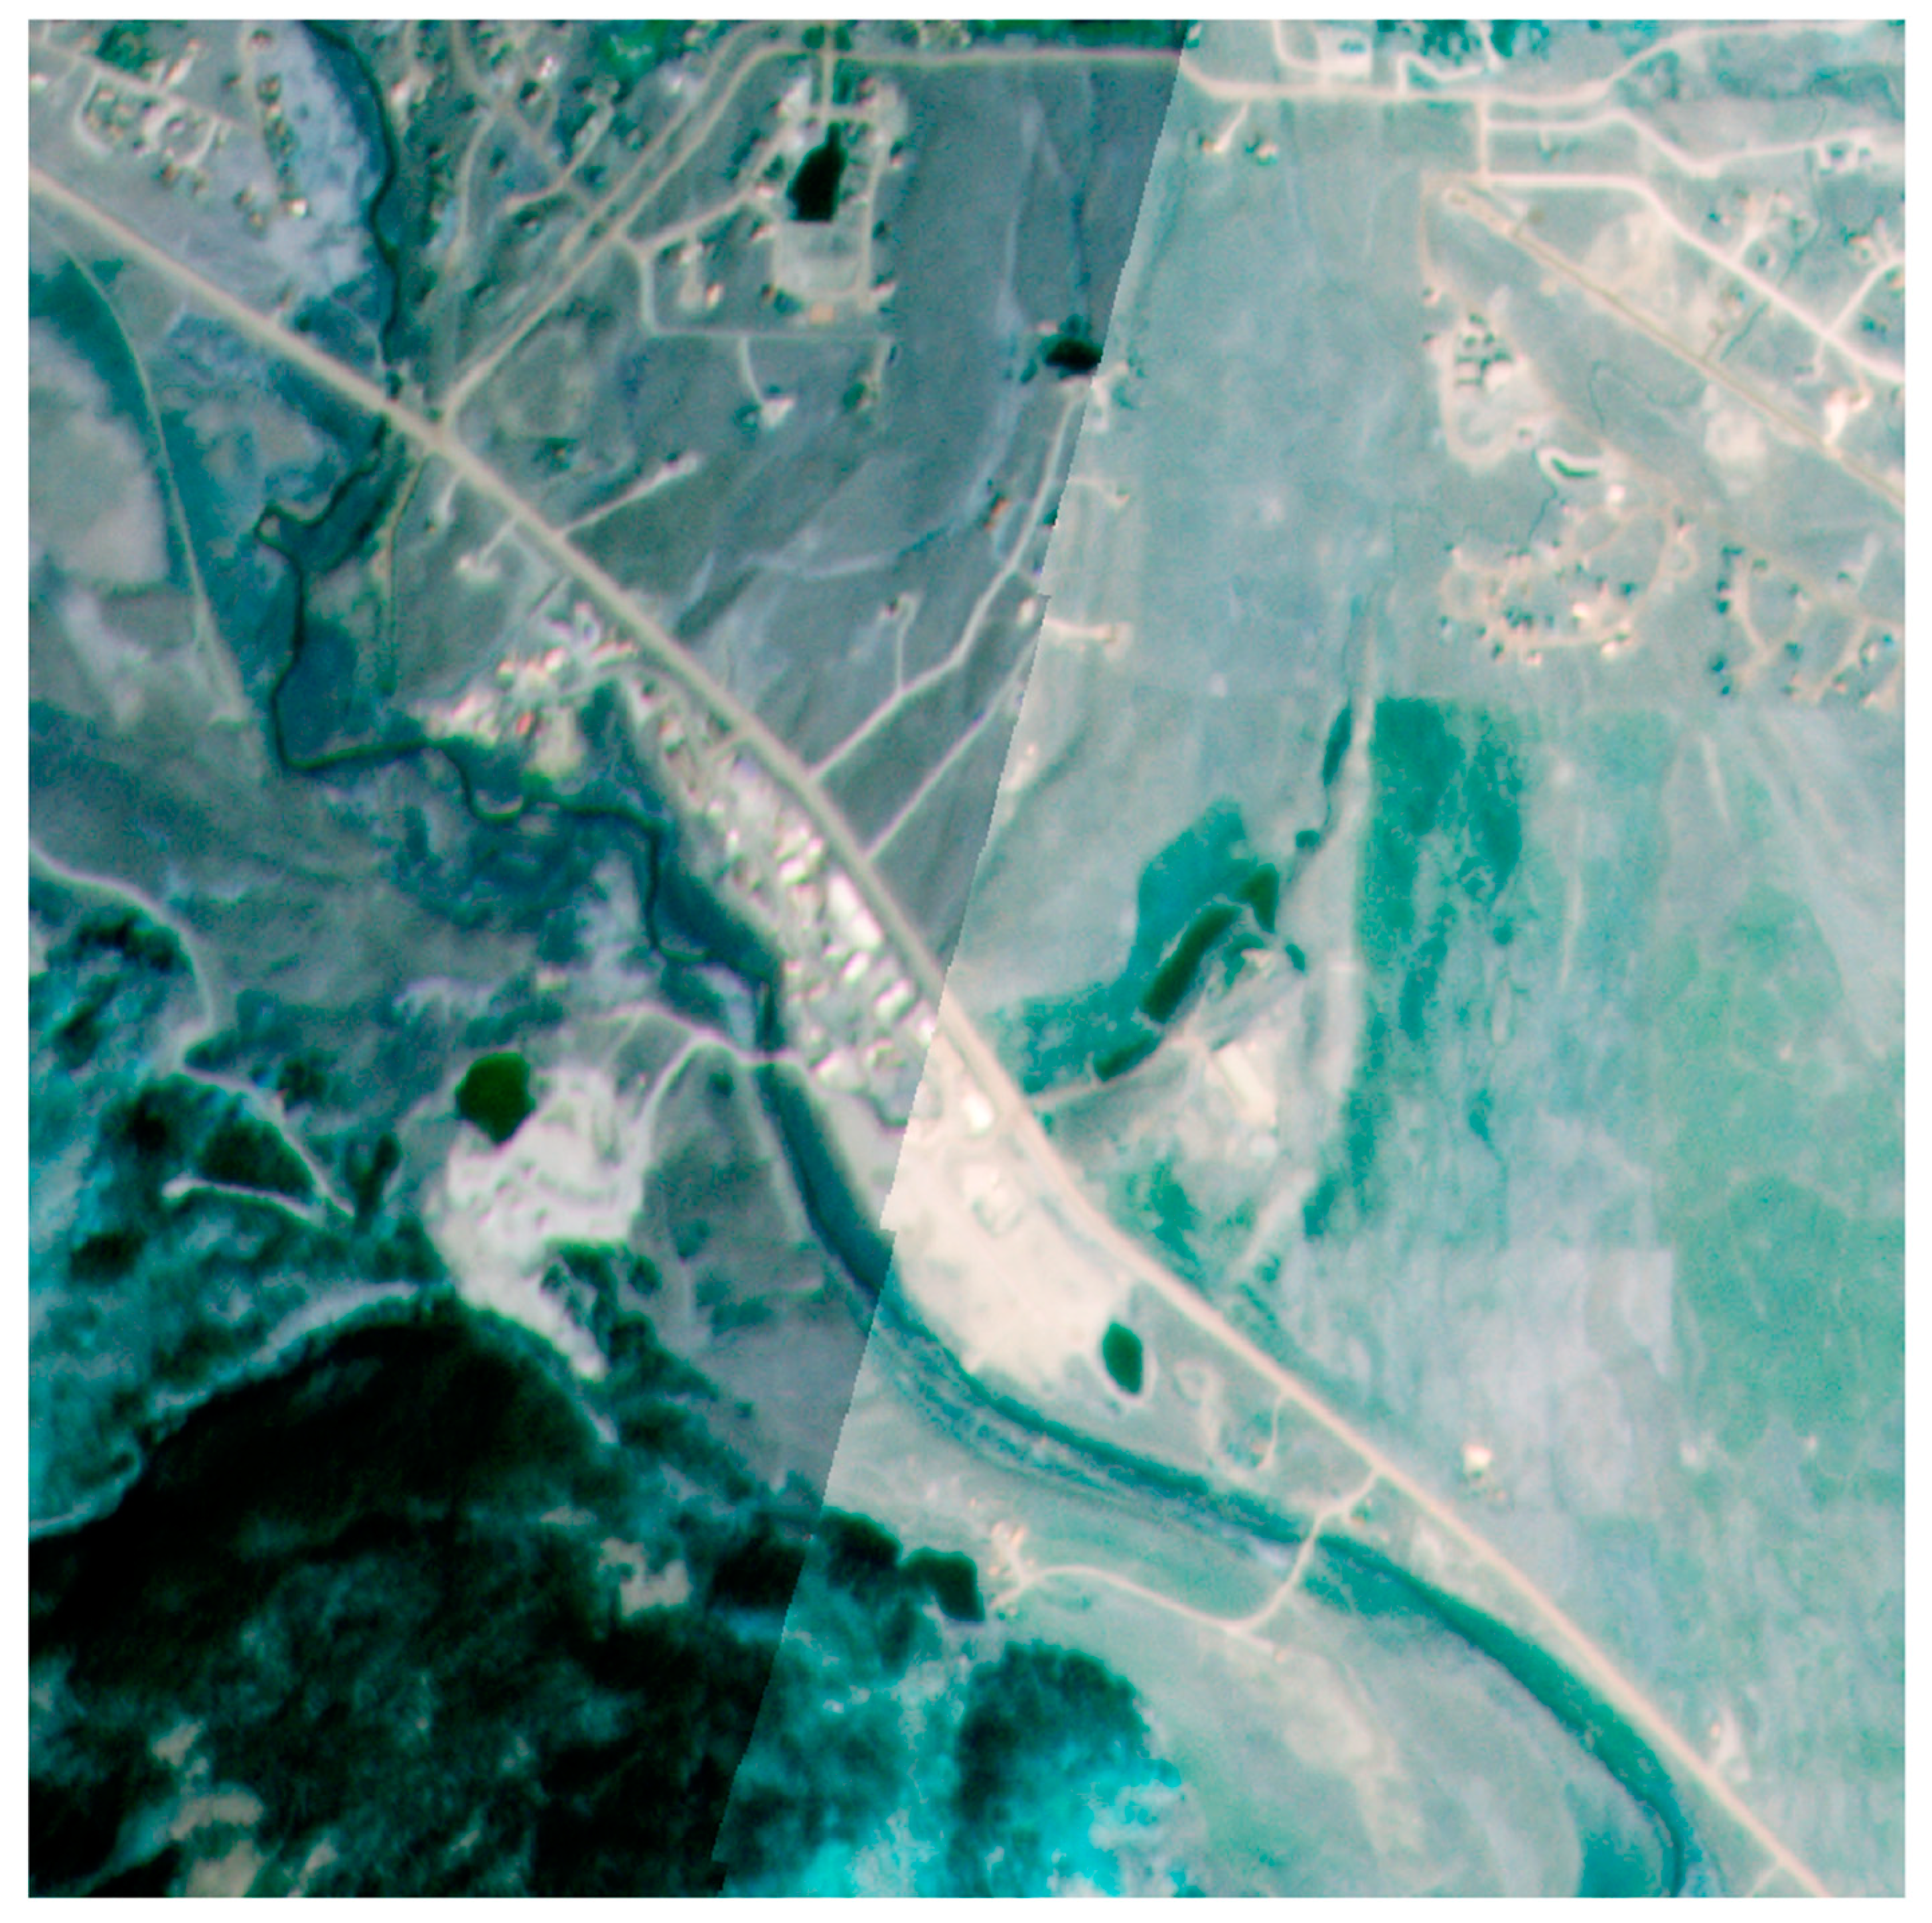
The PS constellation offers a means to augment the suite of Earth observational data acquired by government and commercial agencies [4,5] and fill key spatio-temporal Earth observing needs. However, there are several technical and processing hurdles that need to be overcome before the data can be leveraged to their full potential by the remote sensing community. Since PS imagery is captured via a constellation of many smallsats rather than a single large platform like Landsat, a patchwork of images must be stitched together into wall-to-wall mosaics for analyses in most cases. Adjacent scenes captured by different platforms and sensors, at different times of day, and under different illumination conditions create substantial scene-to-scene variations in reflectance [6] (Figure 1). Since PS scenes cover relatively small areas comparatively, many adjacent scenes are often needed to canvas a study area. The geometric and radiometric accuracy of these products does not always match the quality the remote sensing community has come to expect [7,8]. While Planet continues to improve the radiometric calibration of individual sensors [9], scene-to-scene radiometric and geometric differences often require substantial user preprocessing before the data are ‘analysis ready’ and can be integrated into analytical processing pipelines.
A second issue for the remote sensing community is that different PS sensor generations reflect evolving technology [10]. Planet has upgraded their sensor instrumentation several times, which means images captured from different generations are not always radiometrically or geometrically compatible. At this time, there are 180+ Planet platforms in orbit comprising three generations of PS sensors. Because Planet is constantly innovating its data collection and processing procedures, it can be difficult for researchers to remain current in terms of data quality and standards across the multiple platforms and sensors. These technical hurdles coupled with discrepancies in image access and licensing agreements between institutions ultimately hinder uptake of the technology and slow scientific progress.
The purpose of this short communication is to provide a concise technical review of Planet’s PS smallsat sensors alongside a summary of their capabilities and practical considerations to maximize their utility and impact. The communication is designed to serve as a resource for the remote sensing community to locate important geometric and radiometric details of the various generations while also providing a guide to the state-of-the-art processing algorithms being developed by the user community to pre-process PS imagery. This work first reviews the PS sensors, documentation, and data streams to help clarify differences in sensor specifications and performance. Next, several important radiometric and geometric issues are discussed that should be considered when using the data for scientific objectives. While visual interpretation of PS images is suitable in some studies, we focus explicitly here on processing for analytical workflows. The existing literature employing PS imagery is reviewed and current developments for radiometric and geometric processing of the data are reported.
2. Review of the PlanetScope (PS) Sensors
The PS constellation currently includes three generations of satellites (i.e., doves) relevant to remote sensing: Dove Classic, Dove-R, and SuperDoves (Table 1). Each generation comprises multiple “flocks”, with a flock consisting of a group of satellites launched and placed into similar orbit around the same time. All satellites are in sun-synchronous orbit at 475 km, a 98-degree inclination, and capture data ±81.5°, depending on the season. Equator crossing times are between 9:30 and 11:30 am local time. Images are provided in 12-bit (digital number) and 16-bit (radiance) [11]. The first flocks of Dove Classic satellites were launched in 2016, with a payload that included a 4-band (RGB-NIR) ‘PS2′ sensor with a ground sampling distance (GSD) of about 3.7 m (Table 1). The historical archive of Dove Classic (Dove-C) imagery dates back to 2016; however, during the demonstration phase, PS smallsats were launched primarily from the International Space Station (ISS) into an orbit with a 52-degree inclination at approximately 375 km [12]. The PS data archived from 2016 and early 2017 mainly comprise these ISS platforms before the constellation of near-polar sun-synchronous orbits was built. Therefore, coverage during the demonstration period includes gaps.
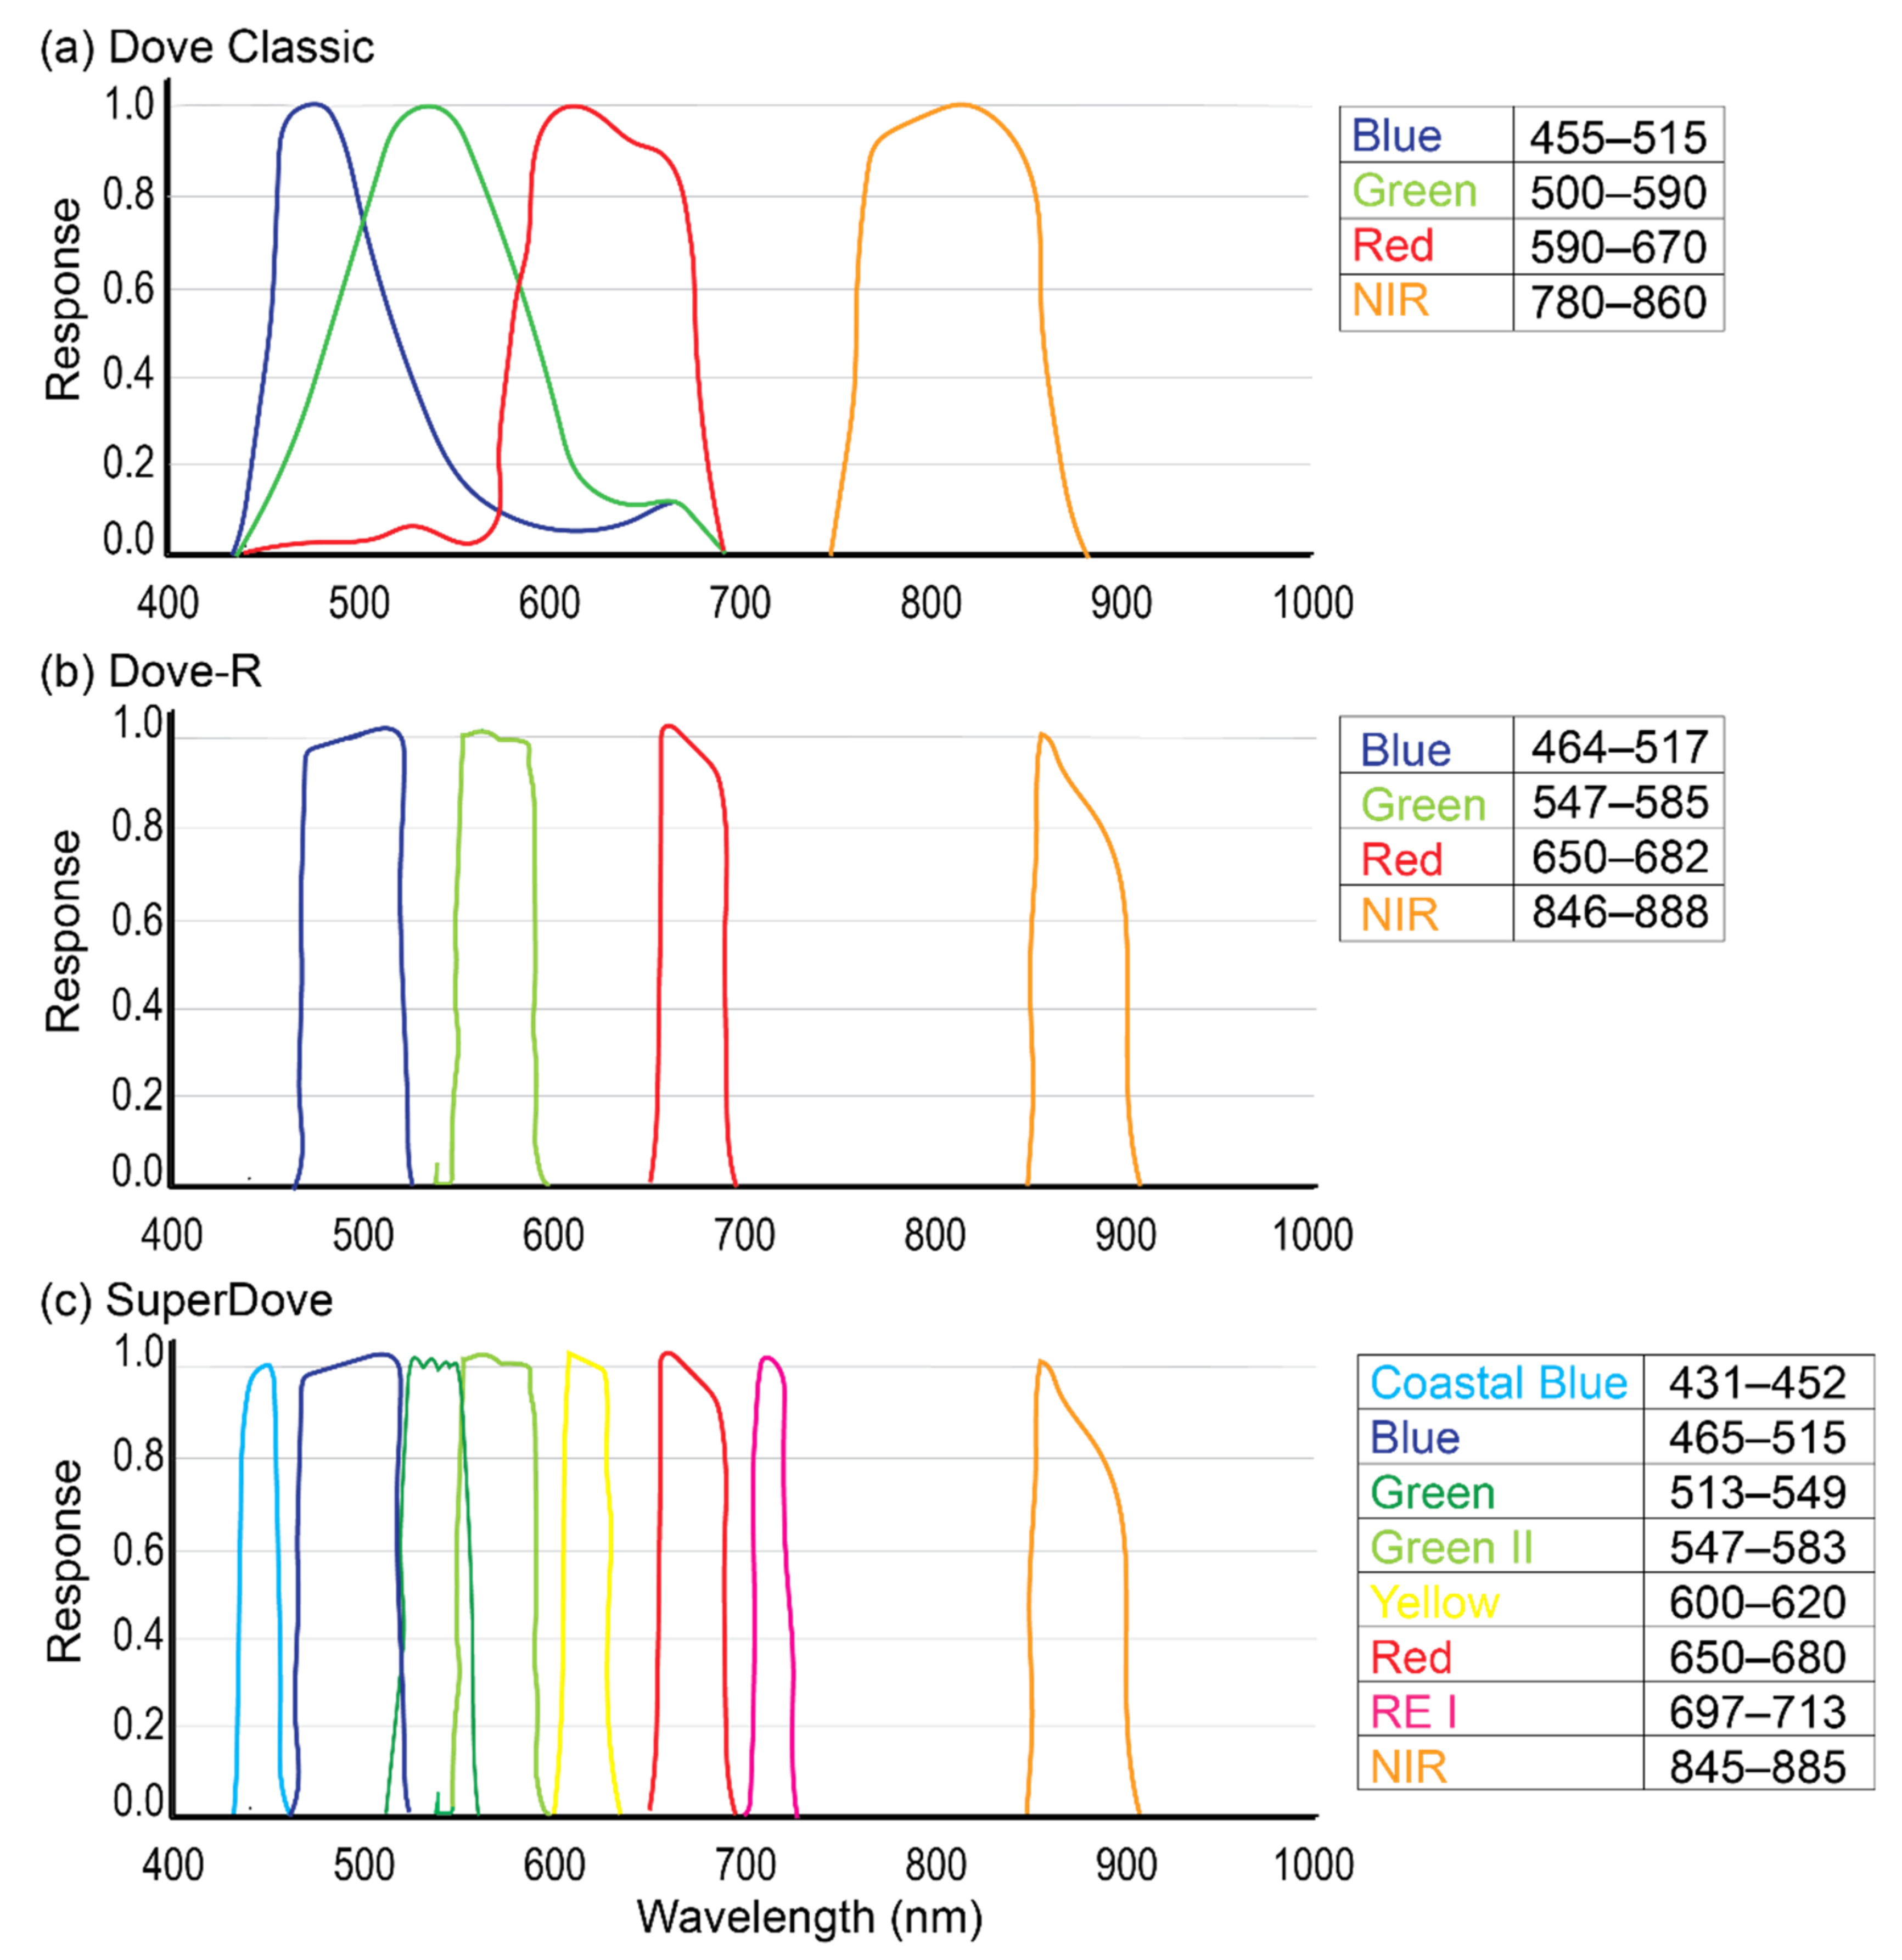
A shortcoming of the Dove Classic sensors for remote sensing research is the lack of separation in the spectral response for the RGB bands (Figure 2a), making it difficult to use imagery from this oldest generation for precise spectral analyses (e.g., reliable time series of NDVI or Green NDVI). Starting in 2018, a second generation of sensors with improved spectral characteristics, known as Dove-R, were added to the constellation [13]. The spectral resolution of these ‘PS2.SD’ sensors carried onboard the Dove-R platforms was also 4-band (RGB-NIR), but band separation and definition was improved (Figure 2b). While the spectral clarity enhancements of this second generation are beneficial for the remote sensing community, the shift in band placement between the PS2 (Dove Classic) and PS2.SD (Dove-R) sensors (Figure 2) makes integration of these two products for spectral analyses difficult [10].
In April 2019, the first flock of the third generation PS sensors, SuperDoves, launched. SuperDoves carry a ‘PSB.SD’ sensor, which can capture eight bands (Figure 2c). Four of these bands (Blue, Green II, Red, and NIR) are generally compatible with the Dove-R PS2.SD bands, although band widths and placements are not exactly the same (Figure 2b,c). The four additional bands are located in the visible portion of the spectrum (Coastal Blue, Green, Yellow, Red-Edge). At this time, only five PSB.SD bands are available for download: Blue, Green II, Red, Red-Edge, NIR. Importantly, these bands are interoperable with Sentinel-2 bands [14]. The full set of eight bands is anticipated soon.
Due to the small PS image swaths (Table 1), mosaicking is often needed and sometimes requires combining multiple sensor generations, especially if a mosaic consisting of images captured on the same day is desired. This task is not straightforward given the differences in band placement and channel width across the generations detailed above (Figure 2). Combining untransformed Dove Classic with Dove-R or SuperDove images for spectral analyses is not advised, which means post-processing of the images is needed. Planet provides an xml file with coefficients to transform the sensor radiance values from the newer generation instruments (PS2.SD and PSB.SD) to match the older PS2 instrument. However, it is important to note that in matching the spectral response of the older instrument, image quality from the newer sensors is downgraded during the transformation. Researchers seeking to leverage the improved spectral response of the newer generation instruments should not expect to include older images (pre 2018) in their mosaics.
Alongside Planet’s coefficients, the remote sensing community has also developed regression-based transformation functions so users can adjust the RGB-NIR surface reflectance from first- and second-generation PS sensors to provide more consistent time series. Comparing thousands of images across 500 locations in Africa, Huang and Roy [10] quantified the spectral differences between PS2 (Dove Classic) and PS2.SD (Dove-R) sensors using reduced major axis regression. They found that spectral variation between the two sensor generations varied as much as 20.1%. The authors transformed RGB-NIR values using Theil-Sen regression to render the two generations compatible. These coefficients are provided by the authors to the user community [10].
3. Radiometric and Geometric Calibration and Corrections
Even within the same general or flock, each PS sensor has a unique relative spectral response and calibration. Atmospheric and environmental conditions also vary at the time of image capture, sometimes contributing radiometric and geometric errors that are difficult to correct across a constellation with no on-board calibration [10]. While the PS images undergo varying levels of processing by Planet before being released (Table 2), additional post processing by the user is often still needed, particularly when images from different sensors are to be combined or mosaicked for analysis. The following sections review the geometric and radiometric characteristics of different PS products and summarize the calibrations and corrections performed by Planet alongside a discussion of the advances being developed and implemented by the user community. Users should be sure to first check their Planet licensing agreements to determine the products/processing levels to which they have access.
3.1. Geometric Corrections
All PS products undergo some level of geometric correction by Planet, which varies by processing level (Table 2). Spatial resolutions for all products are around 3 m (Table 1), but post-correction positional accuracies are officially reported as less than 10 m root mean square error at the 90th percentile [13], which can mean considerable image-to-image pixel shifts between images and in comparison to other spatially referenced data. The analytical orthoscene products (Table 2) undergo the most rigorous geometric corrections. However, it should be noted that post spacing for ground control points and digital elevation models is between 30 and 90 m [13,17], or 10 to 30 times the product pixel size. Independent investigations measuring horizontal offsets noted positional errors as small as 4.8 m and as large as 19 m [7,18,19]. In sum, positional errors in PS imagery can be considerable and often require additional geometric corrections be performed if images are to be related to other spatial data or mosaicked with other images [19,20].
However, the majority of studies we reviewed did not report any additional geometric correction, raising questions about the spatial integrity and uncertainty of data used in those applications. In situations where only a single scene or adjacent (along-track) scenes are being used [19], additional corrections may not be needed as long as no other spatial data are being used that would require co-registration. Other authors determined the up-to-10 m errors to be insignificant in cases where reflectance values were being summarized across large areas such as meadows [21] or crop fields [22]. Similarly, a study comparing large, homogenous snow patches through time disregarded the errors, noting that the 2–3 pixel misalignment from the error would only cause misclassifications along the edges [23].
In cases where accurate geo-registration is needed, the user community has developed several solutions to better geolocate Planet scenes and minimize the propagation of geometric errors into analyses. Image co-registration has proven viable in cases where it is not necessary for each pixel to be assigned a unique x, y coordinate in a planimetric map projection [7,24]. Houborg and McCabe [7] developed an automated scene co-registration technique for Planet images that shifts pixels based on optimizing spatial autocorrelation between temporally adjacent scenes. The authors do not provide a quantitative measure of the success of this adjustment method but do note qualitatively that the features of interest appear “well aligned” across the scenes upon completion. This type of co-registration technique produces better results when applied in areas with discrete or contrasting land cover changes (e.g., agricultural field boundaries). The technique may be less useful in highly heterogeneous environments such as urban areas or where land cover changes are more gradual (e.g., grasslands or ecotones).
When precise planimetric pixel positions are required, images need to be rectified to a standard map projection and evaluated for positional accuracy. The latter step often involves selecting ground control points, which can be an obstacle for high-resolution PS imagery. Leach et al. [24] present a workflow for co-registering Planet images to a geocorrected reference image using a Python implementation of AROSICS (Automatic and Robust Open-Source Image Co-Registration Software for Multi-Sensor Satellite Data [25]). The method relies on a Fourier shift theorem to perform intensity-based registration. The authors do not provide details on how the initial base image was geocorrected but ultimately measured geometric displacement between their first image and subsequent images at less than 6 m. This magnitude of error is still approximately two PS pixels, which may not be sufficient for applications requiring precise geolocation.
The availability of near-coincident, overlapping PS images also permits the application of photogrammetric, stereo-vision techniques to reconstruct three dimensional (3D) features [26]. Aati and Avouac [27] describe a methodology for incorporating DEMs derived from stereo imagery into the georectification process. Using a Rational Function Model, the authors generated DEMs and achieved a standard deviation of ~3.9 m and ~7 m when compared to reference DEMs generated using airborne lidar and GeoEye/WorldView 2 data, respectively. The results demonstrate the ability for PS data to measure topographic changes at a high spatial and temporal resolution.
After reviewing Planet’s geometric processing procedures alongside exemplar studies using these data, it is clear that more research is needed into when and how to best perform additional processing. First, it would be beneficial to know the true distribution of geometric errors across the different constellations so that researchers can better understand how these errors might be impacting their analyses. Second, greater attention is needed into developing and testing ancillary processing techniques to improve the geometric error distribution. These techniques will be particularly useful if they can help align PS data with higher fidelity satellites such as Landsat and Sentinel-2.
3.2. Radiometric Calibration and Corrections
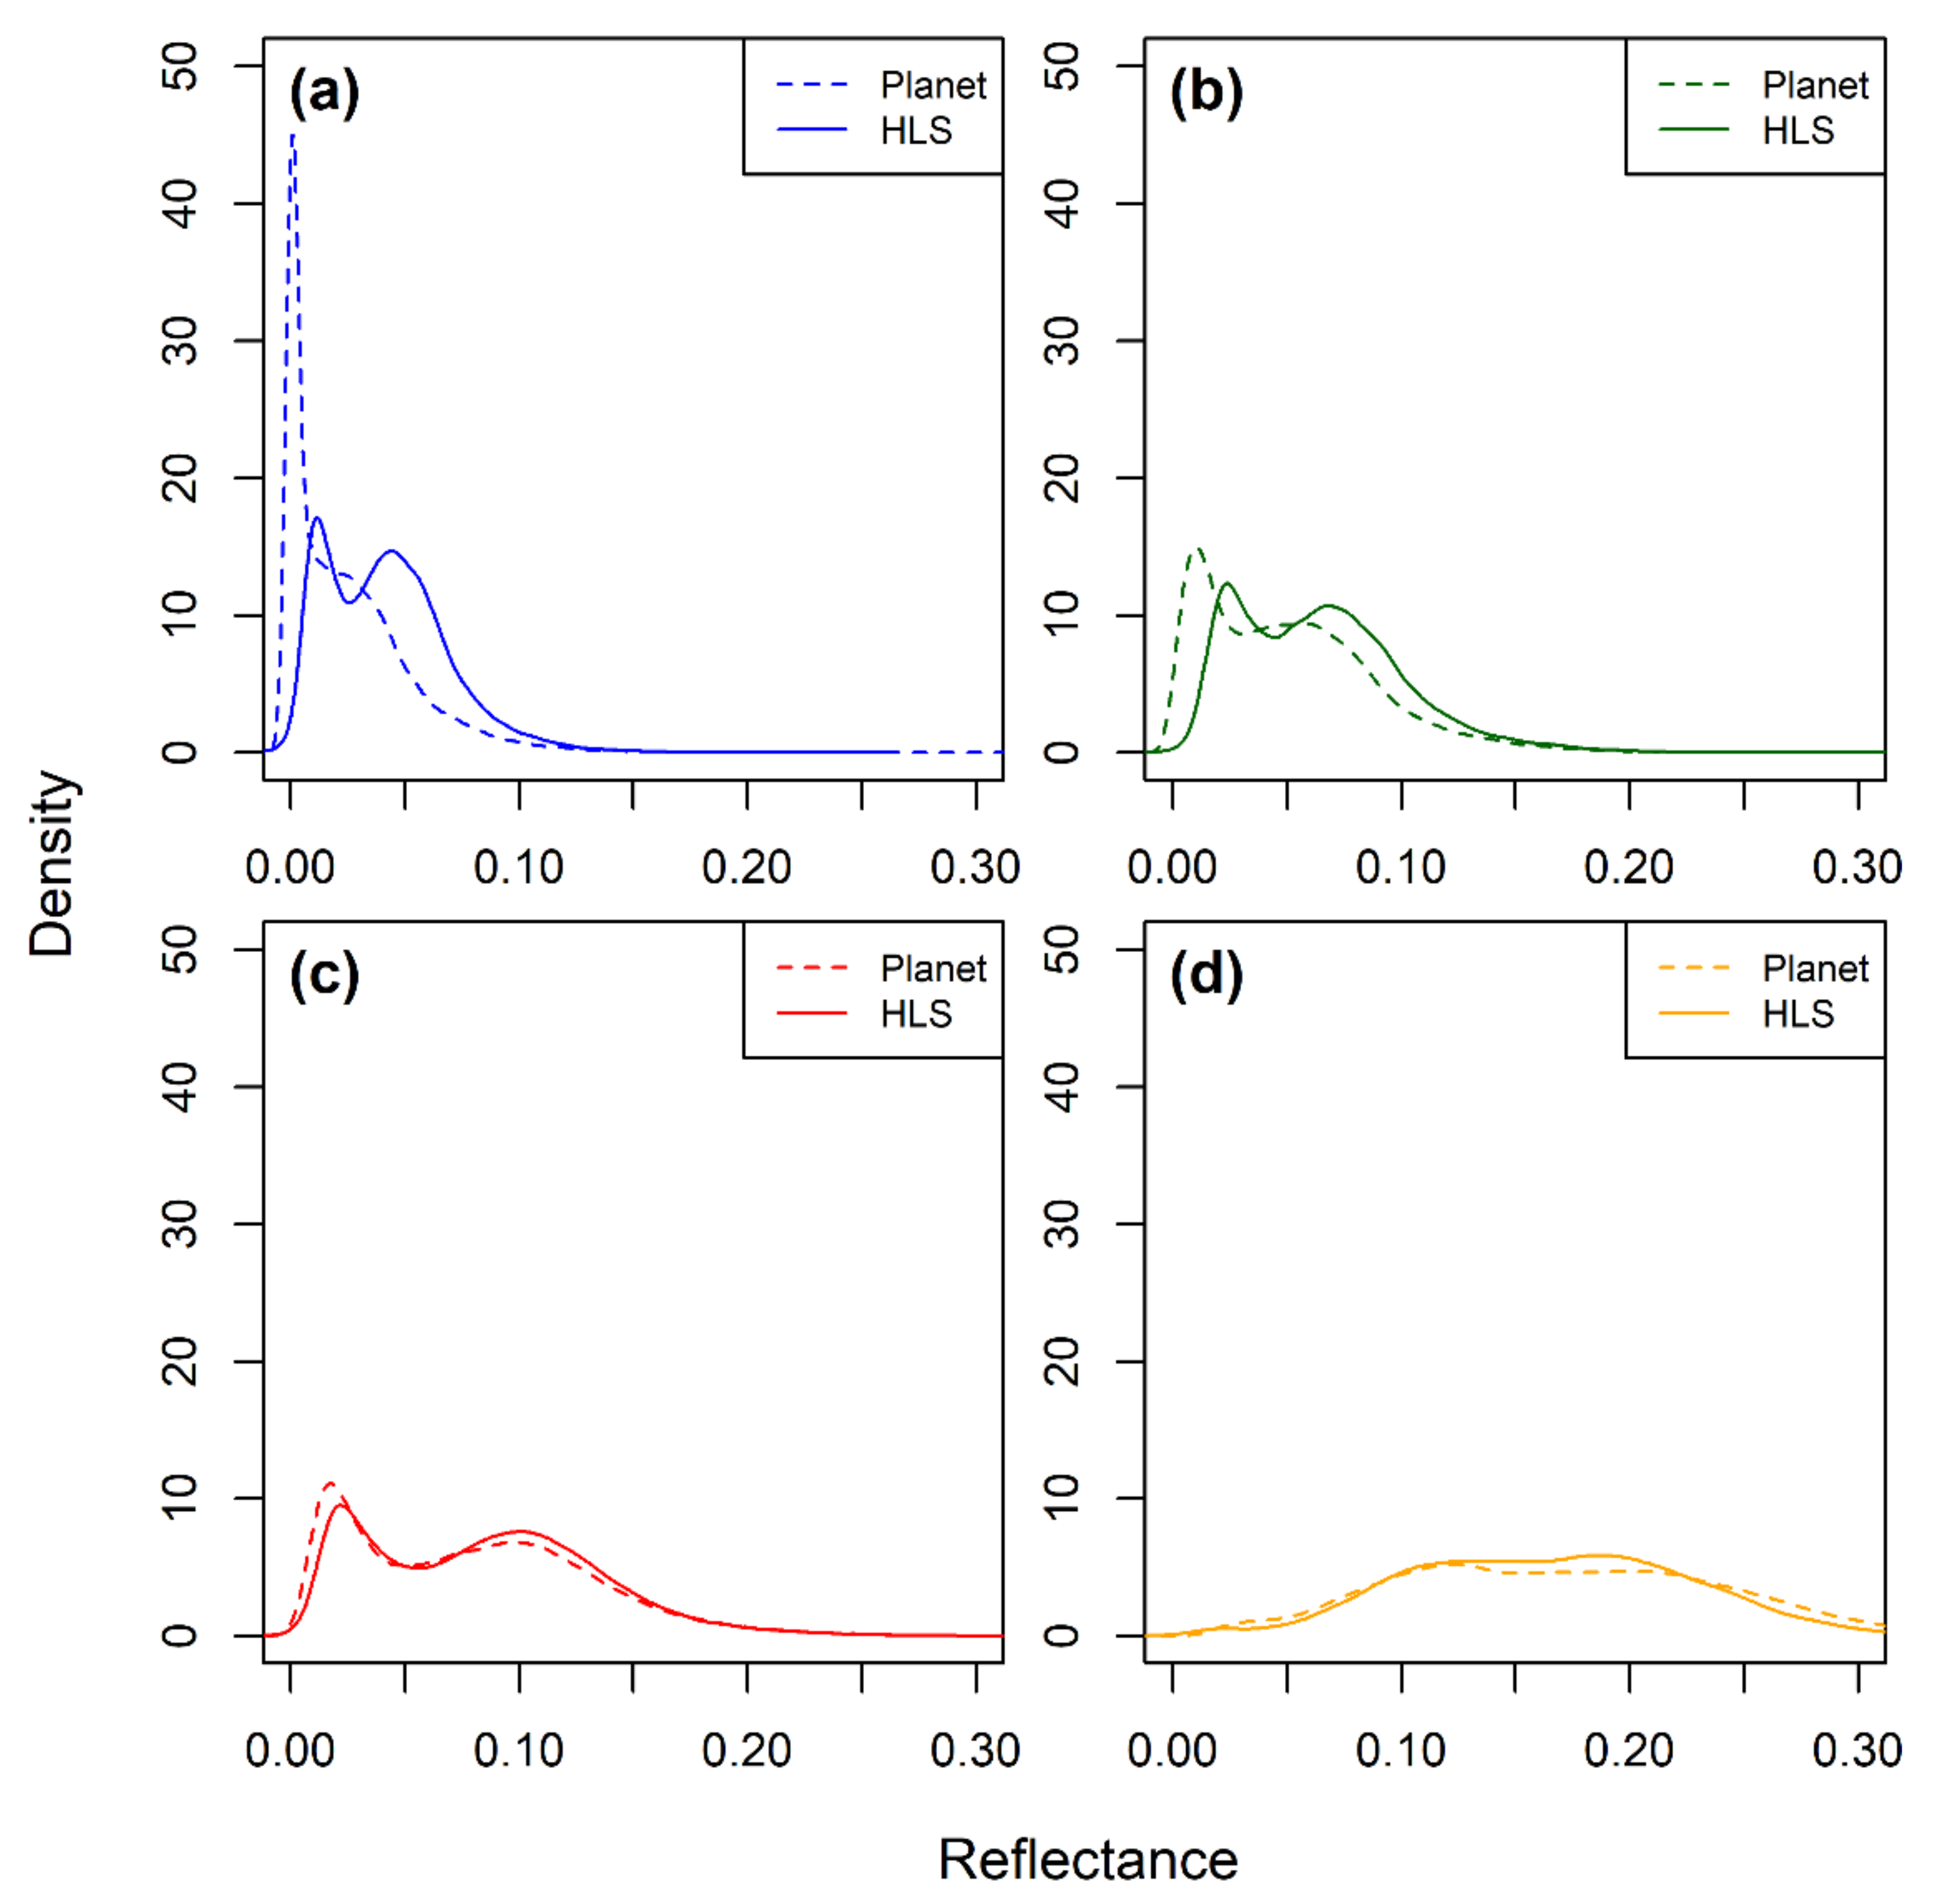
Radiometric effects can arise in PS images internally from platform, sensor, and calibration differences and externally from atmospheric and environmental effects. Planet performs sensor/radiometric and atmospheric corrections, but the procedures vary by product/processing level (Table 2). Since each sensor has a unique relative spectral response and is sensitive to different parts of the spectrum, even well-calibrated sensors will produce different radiance values [9]. Planet’s atmospheric correction algorithm utilizes look up tables generated from a range of atmospheric conditions (i.e., water vapor and temperature profiles, aerosol types, aerosol optical depth), geometry (solar zenith angle, satellite zenith angle, azimuth angle difference, elevation), surface conditions, and spectral conditions, and atmospheric corrections are applied using standard atmospheric models with MODIS water vapor, ozone, and aerosol data. However, there are limitations to note. A single, global aerosol model is used with all scenes assumed to be captured at sea level and exhibiting Lambertian scattering, which fails to account for stray light and adjacency effects [17]. Additionally, the MODIS scenes on which the model is built are sometimes unavailable, and the approach does not correct for haze and thin cirrus clouds. These limitations result in reflectance values that are not always compatible with reference values (e.g., from Landsat 8 or Sentinel-2), even when scenes are captured the same day. Figure 3 compares density plots for PS and harmonized Landsat-Sentinel data (HLS) for four bands (RGB-NIR) for images captured on the same day. From these figures, it is possible to see the considerable differences in the reflectance distributions between the Planet and HLS data, particularly for the blue and green bands. While the red and near infrared bands are more similar, there are still inconsistencies between the acquisitions. These graphs importantly highlight the spectral differences between the PS and Landsat/Sentinel data and demonstrate how direct comparisons of the data are untenable.
While Planet continues to improve radiometric calibration of individual sensors including in-orbit calibration [5,9], additional radiometric adjustments are still vital for many applications, particularly when mosaicking scenes. In situations where only a single PS image is being utilized, established atmospheric correction methods such as dark object subtraction [28] have been used by researchers to compensate for radiometric irregularities [20]. Empirical line calibration [29] could also be used for absolute radiometric correction since the placement of black and white targets in the field is feasible given the small size of PS pixels and the frequent satellite pass-overs. However, in cases where many images are needed to cover the study area, this approach would prove unwieldy.
For situations where multiple PS images are being utilized, studies have employed normalization approaches to improve radiometric consistency by adjusting pixel values based on higher-quality sensors such as Landsat and Sentinel. Most often, a linear scaling function is used to shift PS values to match surface reflectance values from the reference sensor [30,31,32,33,34]. The linear scaling takes the form:
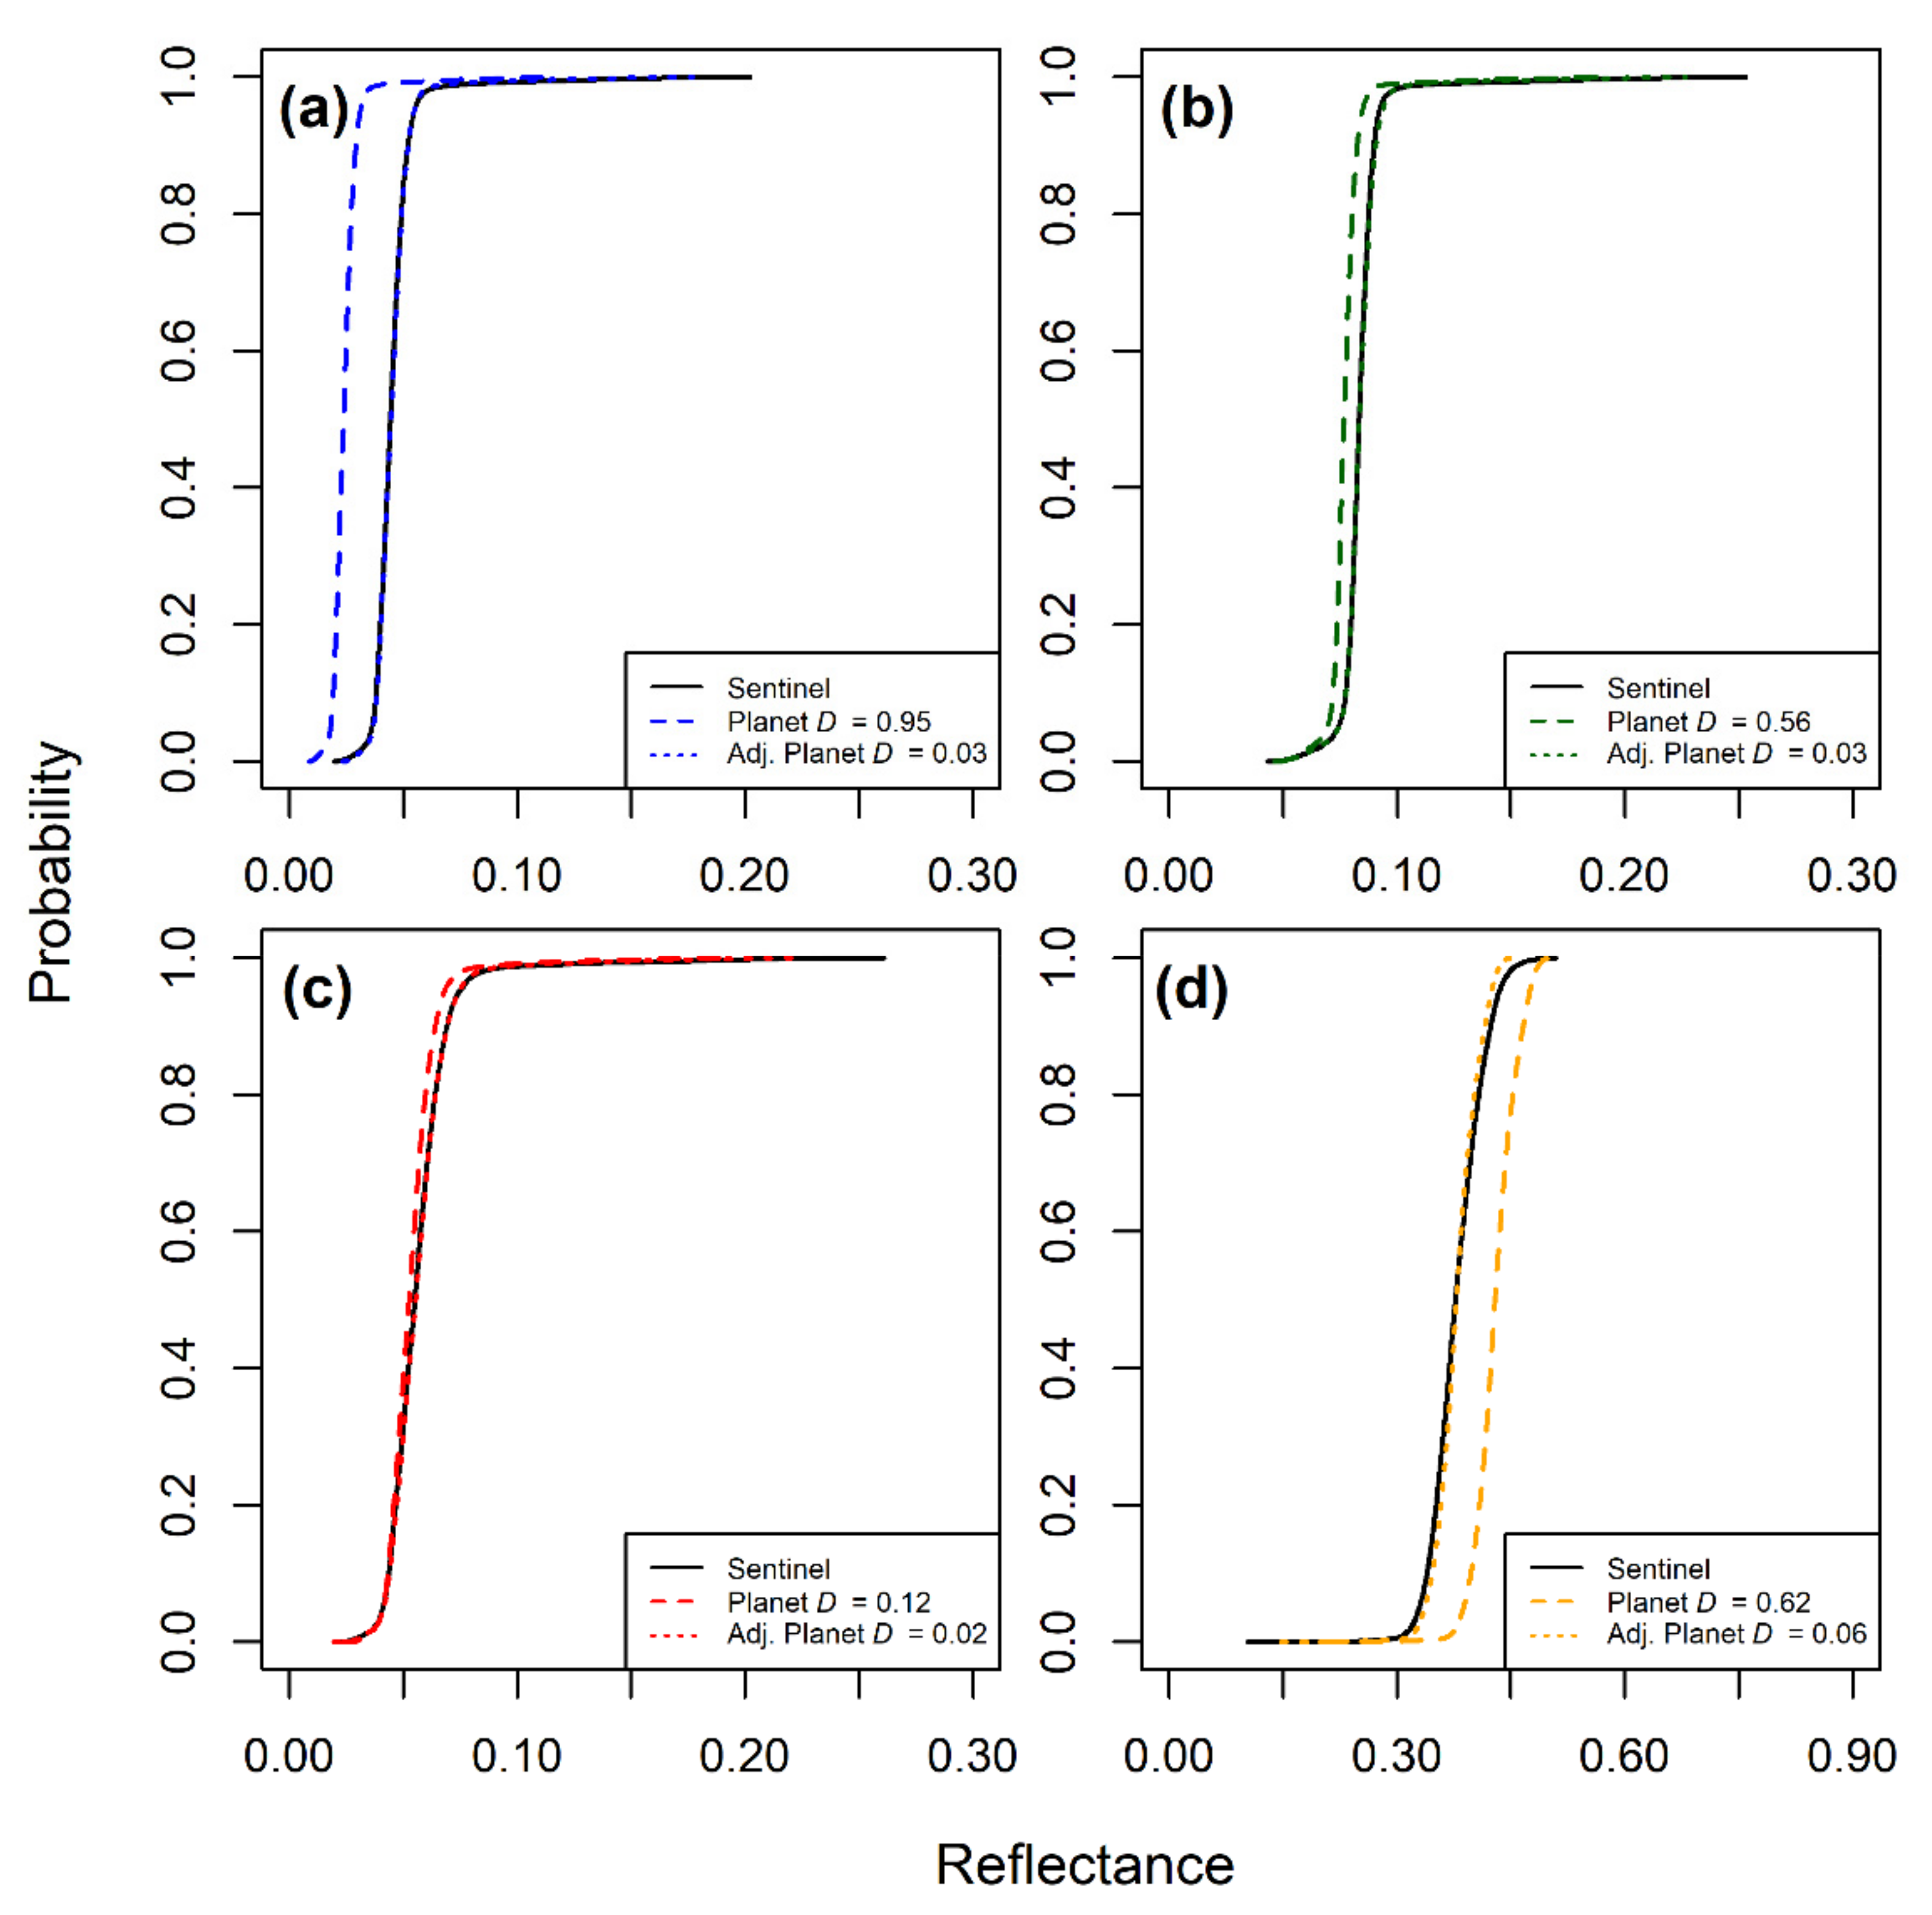
where is the transformed PS reflectance, is the original PS reflectance, and and are multiplicative and additive constants that can be determined through substituting with the reflectance value of a co-located, reference standard pixel (e.g., Sentinel or Landsat). Linear scaling will shift PS reflectances to match a reference standard, such as in Figure 4, which shows cumulative density functions and Kolmogorov–Smirnov D-statistics comparing the distributions. In all four bands, the linear transformation changed the D-value considerably, shifting the distribution of the PS data to align more closely with the Sentinel data (Figure 4). Regardless of the difference between the untransformed values (coarser dash) and the Sentinel distribution (solid line), the adjusted PS distribution (finer dash) is nearly coincident with the Sentinel distribution in all cases, indicating that the linear transformation was successful in matching the distributions. However, it should be noted that these adjustments are relative corrections that normalize the imagery [29], they do not necessarily correct the absolute radiometric quality of the imagery.
Multi-date radiometric normalization of PS images has also been achieved through identifying pseudo-invariant spectral features using multivariate alteration detection (MAD; [35]). With MAD, a regression equation can be developed between images in a time series and used to transform all pixels in the image [24]. More advanced approaches have involved multi-scale machine learning techniques to correct for radiometric inconsistencies between Planet acquisitions. For example, Houborg & McCabe [7] promote a technique called Cubesat Enables Spatio-Temporal Enhancement Method (CESTEM), which utilizes a non-parametric model tree regression approach to construct band-specific relations between Planet and Landsat 8. CESTEM has been applied mainly in agricultural environments [36,37]. Fusion methods have also been tested to leverage the higher fidelity spectral consistency of Sentinel-2 images while taking advantage of the high spatial resolution of the PS data [38,39]. For example, Latte and Lejeune [40] used a state-of-the-art super-resolution residual convolutional neural network simultaneously fuse (sharpen) and radiometrically normalize the PS data.
In addition to general pixel-based radiometric inconsistencies within and between PS images, there can also be corrupt lines, bands, and other data quality issues such as clouds. Planet provides two ‘usable data mask’ assets (udm and udm2) that allow researchers to mask out unusable data or bands. Line-filling methods, such as those used to fill Landsat ETM+ SLC-off gaps (e.g., [41]), may be transferable to PS images. Traganos et al. [42] corrected corrupt bands in PS images using unmixing-based denoising, based on the technique by Cerra et al. [43]. Cai et al. [44] used the MODIS nadir bidirectional reflectance distribution function adjusted reflectance data to correct the PS data and then generate an improved invalid pixel mask by combining Planet’s udm with their own results. Users have also developed cloud and cloud-shadow detection algorithms to assist with masking these radiometric inconsistencies [45,46]. In sum, it is best to first review the udm/udm2 assets to determine known data quality issues before performing any additional corrections or analyses.
4. Summary and Conclusions
Commercial smallsat providers such as Planet are innovating the remote sensing space, which for decades has been controlled by government agencies. The high spatial and temporal resolutions of imagery captured from smallsat constellations like PlanetScope has the potential to fill key remote sensing needs, but uptake of these datasets within the user community can be improved. The differences between PS data streams and traditional satellite images (e.g., Landsat, Sentinel) as well as confusion surrounding the different products and their spectral and spatial compatibility may be hindering use. There are also accessibility barriers when it comes to integrating Planet data into various tools familiar to researchers. This review summarized the three generations of PlanetScope sensors relevant to remote sensing researchers and reviewed the post-processing being completed by Planet and the user community to make these images suitable for analyses. Two key findings emerge:
- (1)
- The geometric and radiometric quality of PS images does not match quality the remote sensing community has come to expect from ‘analysis ready’ datasets that can immediately be integrated into analytical processing pipelines. Knowing the geometric and radiometric quality of each image based on specific sensor and processing level is a first step to determine its fitness for application. Additional corrections are often needed beyond the baseline processing completed by Planet. While Planet offers services for additional processing and can generate products that may better meet user expectations, access to these services depends on the licensing agreement.
- (2)
- The user community has proven resourceful in repurposing existing geometric and radiometric correction techniques as well as developing innovative techniques specifically for PS products. As access to PS datasets increases and the user community grows, it is anticipated that the codes, algorithms, and other software resources needed to implement these techniques and adjustment the imagery will continue to improve and be made openly available.
Author Contributions
A.E.F. and B.L.H. conceived of the study, completed all reviews and analysis of the literature, developed the figures, and wrote and edited the paper. Both authors have read and agreed to the published version of the manuscript.
Funding
This research was funded by the U.S. National Science Foundation, grant number 1934759 and the APC was funded by the same.
Institutional Review Board Statement
Not applicable.
Informed Consent Statement
Not applicable.
Data Availability Statement
No formal analyses were completed in the paper. Data used in the figures is available upon request.
Conflicts of Interest
The authors declare no conflict of interest.
References
- Wulder, M.A.; Masek, J.G.; Cohen, W.B.; Loveland, T.R.; Woodcock, C.E. Opening the archive: How free data has enabled the science and monitoring promise of Landsat. Remote Sens. Environ. 2012, 122, 2–10. [Google Scholar] [CrossRef]
- Zhu, Z.; Wulder, M.A.; Roy, D.P.; Woodcock, C.E.; Hansen, M.C.; Radeloff, V.C.; Healey, S.P.; Schaaf, C.; Hostert, P.; Strobl, P.; et al. Benefits of the free and open Landsat data policy. Remote Sens. Environ. 2019, 224, 382–385. [Google Scholar] [CrossRef]
- Davis, L.A.; Filip, L. How Long Does It Take to Develop and Launch Government Satellite Systems? International Cost Estimating and Analysis Association. AEROSPACE REPORT; AEROSPACE: El Segundo, CA, USA, 2015. [Google Scholar]
- Crusan, J.; Galica, C. NASA’s CubeSat Launch Initiative: Enabling broad access to space. Acta Astronaut. 2019, 157, 51–60. [Google Scholar] [CrossRef]
- Nag, S.; Dabney, P.; Ravindra, V.; Anderson, C. Planning a Reference Constellation for Radiometric Cross-Calibration of Commercial Earth Observing Sensors. arXiv 2020, arXiv:2010.09946. [Google Scholar]
- Csillik, O.; Asner, G.P. Near-real time aboveground carbon emissions in Peru. PLoS ONE 2020, 15, e0241418. [Google Scholar] [CrossRef]
- Houborg, R.; McCabe, M.F. A Cubesat enabled Spatio-Temporal Enhancement Method (CESTEM) utilizing Planet, Landsat and MODIS data. Remote Sens. Environ. 2018, 209, 211–226. [Google Scholar] [CrossRef]
- NASA. Earth Science Division Commercial SmallSat Data Acquisition Program Pilot Evaluation Report; NASA: Washington, DC, USA, 2020.
- Wilson, N.; Greenberg, J.; Jumpasut, A.; Collison, A.; Weichelt, H. Absolute Radiometric Calibration of Planet Dove Satellites, Flocks 2p & 2e; Planet Labs: San Francisco, CA, USA, 2017; 2p. [Google Scholar]
- Huang, H.; Roy, D.P. Characterization of Planetscope-0 Planetscope-1 surface reflectance and normalized difference vegetation index continuity. Egypt. J. Remote Sens. Space Sci. 2021, 3, 100014. [Google Scholar] [CrossRef]
- Planet Planet Imagery Product Specification: PlanetScope and RapidEye; Planet Labs, Inc.: San Francisco, CA, USA, 2016.
- Kääb, A.; Altena, B.; Mascaro, J. River-ice and water velocities using the Planet optical cubesat constellation. Hydrol. Earth Syst. Sci. 2019, 23, 4233–4247. [Google Scholar] [CrossRef] [Green Version]
- Planet Planet Imagery Product Specifications; Planet Labs, Inc.: San Francisco, CA, USA, 2021.
- Planet Understanding PlanetScope Instruments. Available online: https://developers.planet.com/docs/apis/data/sensors/ (accessed on 27 April 2021).
- Pritchett, C.; Smith, N.; Jumpasut, A.; Fernandez-Saldivar, J.; Zuleta, I. The Spectral Response of Planet Doves: Pre-launch Method and Results 2020. Available online: https://digitalcommons.usu.edu/calcon/CALCON2020/all2020content/35/ (accessed on 1 August 2021).
- Planet PlanetScope Product Specifications; Planet Labs, Inc.: San Francisco, CA, USA, 2021.
- Planet Planet Imagery Product Specifications—June 2020; Planet Labs, Inc.: San Francisco, CA, USA, 2020.
- Baddock, M.C.; Bryant, R.G.; Acosta, M.D.; Gill, T.E. Understanding dust sources through remote sensing: Making a case for CubeSats. J. Arid. Environ. 2021, 184, 104335. [Google Scholar] [CrossRef]
- Houborg, R.; McCabe, M.F. High-resolution NDVI from Planet’s constellation of earth observing nano-satellites: A new data source for precision agriculture. Remote Sens. 2016, 8, 768. [Google Scholar] [CrossRef] [Green Version]
- Wicaksono, P.; Lazuardi, W. Assessment of PlanetScope images for benthic habitat and seagrass species mapping in a complex optically shallow water environment. Int. J. Remote Sens. 2018, 39, 5739–5765. [Google Scholar] [CrossRef]
- John, A.; Ong, J.; Theobald, E.J.; Olden, J.D.; Tan, A.; HilleRisLambers, J. Detecting Montane Flowering Phenology with CubeSat Imagery. Remote Sens. 2020, 12, 2894. [Google Scholar] [CrossRef]
- Mudereri, B.T.; Dube, T.; Adel-Rahman, E.M.; Niassy, S.; Kimathi, E.; Khan, Z.; Landmann, T. A comparative analysis of PlanetScope and Sentinel-2 space-borne sensors in mapping Striga weed using Guided Regularised Random Forest classification ensemble. In Proceedings of the The International Archives of the Photogrammetry, Remote Sensing and Spatial Information Sciences, Volume XLII-2/W13, 2019 ISPRS Geospatial Week 2019, Enschede, The Netherlands, 10–14 June 2019; Volume 42. [Google Scholar]
- Cannistra, A.F.; Shean, D.E.; Cristea, N.C. High-resolution CubeSat imagery and machine learning for detailed snow-covered area. Remote Sens. Environ. 2021, 258, 112399. [Google Scholar] [CrossRef]
- Leach, N.; Coops, N.C.; Obrknezev, N. Normalization method for multi-sensor high spatial and temporal resolution satellite imagery with radiometric inconsistencies. Comput. Electron. Agric. 2019, 164, 104893. [Google Scholar] [CrossRef]
- Scheffler, D.; Hollstein, A.; Diedrich, H.; Segl, K.; Hostert, P. AROSICS: An Automated and Robust Open-Source Image Co-Registration Software for Multi-Sensor Satellite Data. Remote Sens. 2017, 9, 676. [Google Scholar] [CrossRef] [Green Version]
- Ghuffar, S. DEM Generation from Multi Satellite PlanetScope Imagery. Remote Sens. 2018, 10, 1462. [Google Scholar] [CrossRef] [Green Version]
- Aati, S.; Avouac, J.-P. Optimization of Optical Image Geometric Modeling, Application to Topography Extraction and Topographic Change Measurements Using PlanetScope and SkySat Imagery. Remote Sens. 2020, 12, 3418. [Google Scholar] [CrossRef]
- Chavez, P.S. An improved dark-object subtraction technique for atmospheric scattering correction of multispectral data. Remote Sens. Environ. 1988, 24, 459–479. [Google Scholar] [CrossRef]
- Jensen, J.R. Introductory Digital Image Processing: A Remote Sensing Perspective; Prentice Hall Inc.: Hoboken, NJ, USA, 2016; Volume 4. [Google Scholar]
- Csillik, O.; Kumar, P.; Mascaro, J.; O’Shea, T.; Asner, G.P. Monitoring tropical forest carbon stocks and emissions using Planet satellite data. Sci. Rep. 2019, 9, 17831. [Google Scholar] [CrossRef] [Green Version]
- Csillik, O.; Kumar, P.; Asner, G.P. Challenges in Estimating Tropical Forest Canopy Height from Planet Dove Imagery. Remote Sens. 2020, 12, 1160. [Google Scholar] [CrossRef] [Green Version]
- Csillik, O.; Asner, G.P. Aboveground carbon emissions from gold mining in the Peruvian Amazon. Environ. Res. Lett. 2020, 15, 014006. [Google Scholar] [CrossRef]
- Kimm, H.; Guan, K.; Jiang, C.; Peng, B.; Gentry, L.F.; Wilkin, S.C.; Wang, S.; Cai, Y.; Bernacchi, C.J.; Peng, J.; et al. Deriving high-spatiotemporal-resolution leaf area index for agroecosystems in the U.S. Corn Belt using Planet Labs CubeSat and STAIR fusion data. Remote Sens. Environ. 2020, 239, 111615. [Google Scholar] [CrossRef]
- Xu, Y.; Vaughn, N.R.; Knapp, D.E.; Martin, R.E.; Balzotti, C.; Li, J.; Foo, S.A.; Asner, G.P. Coral Bleaching Detection in the Hawaiian Islands Using Spatio-Temporal Standardized Bottom Reflectance and Planet Dove Satellites. Remote Sens. 2020, 12, 3219. [Google Scholar] [CrossRef]
- Canty, M.J.; Nielsen, A.A.; Schmidt, M. Automatic radiometric normalization of multitemporal satellite imagery. Remote Sens. Environ. 2004, 91, 441–451. [Google Scholar] [CrossRef] [Green Version]
- Aragon, B.; Houborg, R.; Tu, K.; Fisher, J.B.; McCabe, M. CubeSats Enable High Spatiotemporal Retrievals of Crop-Water Use for Precision Agriculture. Remote Sens. 2018, 10, 1867. [Google Scholar] [CrossRef] [Green Version]
- Houborg, R.; McCabe, M.F. Daily Retrieval of NDVI and LAI at 3 m Resolution via the Fusion of CubeSat, Landsat, and MODIS Data. Remote Sens. 2018, 10, 890. [Google Scholar] [CrossRef] [Green Version]
- Sadeh, Y.; Zhu, X.; Dunkerley, D.; Walker, J.P.; Zhang, Y.; Rozenstein, O.; Manivasagam, V.S.; Chenu, K. Fusion of Sentinel-2 and PlanetScope time-series data into daily 3 m surface reflectance and wheat LAI monitoring. Int. J. Appl. Earth Obs. Geoinf. 2021, 96, 102260. [Google Scholar] [CrossRef]
- Li, W.; Jiang, J.; Guo, T.; Zhou, M.; Tang, Y.; Wang, Y.; Zhang, Y.; Cheng, T.; Zhu, Y.; Cao, W.; et al. Generating Red-Edge Images at 3 M Spatial Resolution by Fusing Sentinel-2 and Planet Satellite Products. Remote Sens. 2019, 11, 1422. [Google Scholar] [CrossRef] [Green Version]
- Latte, N.; Lejeune, P. PlanetScope Radiometric Normalization and Sentinel-2 Super-Resolution (2.5 m): A Straightforward Spectral-Spatial Fusion of Multi-Satellite Multi-Sensor Images Using Residual Convolutional Neural Networks. Remote Sens. 2020, 12, 2366. [Google Scholar] [CrossRef]
- Chen, J.; Zhu, X.; Vogelmann, J.E.; Gao, F.; Jin, S. A simple and effective method for filling gaps in Landsat ETM+ SLC-off images. Remote Sens. Environ. 2011, 115, 1053–1064. [Google Scholar] [CrossRef]
- Traganos, D.; Cerra, D.; Reinartz, P. Cubesat-derived detection of seagrasses using planet imagery following unmixing-based denoising: Is small the next big? Int. Arch. Photogramm. 2017, 42, 23–287. [Google Scholar] [CrossRef] [Green Version]
- Cerra, D.; Müller, R.; Reinartz, P. Noise Reduction in Hyperspectral Images Through Spectral Unmixing. IEEE Geosci. Remote Sens. Lett. 2014, 11, 109–113. [Google Scholar] [CrossRef] [Green Version]
- Cai, Y.; Guan, K.; Nafziger, E.; Chowdhary, G.; Peng, B.; Jin, Z.; Wang, S.; Wang, S. Detecting In-Season Crop Nitrogen Stress of Corn for Field Trials Using UAV- and CubeSat-Based Multispectral Sensing. IEEE J. Sel. Top. Appl. Earth Obs. Remote Sens. 2019, 12, 5153–5166. [Google Scholar] [CrossRef]
- Cheng, Y.; Vrieling, A.; Fava, F.; Meroni, M.; Marshall, M.; Gachoki, S. Phenology of short vegetation cycles in a Kenyan rangeland from PlanetScope and Sentinel-2. Remote Sens. Environ. 2020, 248, 112004. [Google Scholar] [CrossRef]
- Wang, J.; Yang, D.; Chen, S.; Zhu, X.; Wu, S.; Bogonovich, M.; Guo, Z.; Zhu, Z.; Wu, J. Automatic cloud and cloud shadow detection in tropical areas for PlanetScope satellite images. Remote Sens. Environ. 2021, 264, 112604. [Google Scholar] [CrossRef]
Figure 1.
Example of scene-to-scene differences for two PlanetScope images captured on the same day (8 October 2020) by different smallsats in the constellation. Image captured near Crested Butte, CO, USA.
Figure 1.
Example of scene-to-scene differences for two PlanetScope images captured on the same day (8 October 2020) by different smallsats in the constellation. Image captured near Crested Butte, CO, USA.

Figure 2.
Spectral responses for PlanetScope: (a) Dove Classic ‘PS2’, (b) Dove-R ‘PS2.SD’, and (c) SuperDove ‘PSB.SD’ sensors. Adapted from [15,16].

Figure 3.
Density plots of Planet (dashed lines) compared to corresponding Harmonized Landsat Sentinel-2 (HLS) (solid lines) for (a) blue, (b) green, (c) red, and (d) nir bands. Data were derived from a scene captured on 8 October 2020 in western Colorado, USA [38.88N, −107.05W].
Figure 3.
Density plots of Planet (dashed lines) compared to corresponding Harmonized Landsat Sentinel-2 (HLS) (solid lines) for (a) blue, (b) green, (c) red, and (d) nir bands. Data were derived from a scene captured on 8 October 2020 in western Colorado, USA [38.88N, −107.05W].

Figure 4.
Empirical cumulative density functions of untransformed PS (Planet) and adjusted PS (Adj. Planet) through a Sentinel-2 based linear transformation for (a) blue, (b) green, (c) red, and (d) nir bands. Values are compared using the Kolmogorov–Smirnov test’s D statistic, which is nonnegative with values closer to 0 signaling similar distributions and larger numbers signaling dissimilar distributions. The image used was captured near Manhattan, KS, USA.


Table 1.
PlanetScope sensor characteristics.
| Sensor | Instrument | No. of Satellites | Launch Epoch | Swath Size | GSD * (m) | Spatial Res. ** (m) |
|---|---|---|---|---|---|---|
| Dove Classic | PS2 | ~36 | 2016–2017 | 24 × 8 km | 3.7 | 3.9 |
| Dove-R | PS2.SD | ~150 | 2017–2018 | 24 × 16 km | 3.7 | 3.7 |
| SuperDove | PSB.SD | ~36 | 2018- | 32.5 × 19.6 km | 3.7 | 3–12 |
* Ground sampling distance: average at reference altitude of 475 km. ** Orthorectified.
Table 2.
Product levels with descriptions of radiometric, geometric, and atmospheric corrections for three PlanetScope Products. √ = most complete, -- = less complete, X = no corrections.
Table 2.
Product levels with descriptions of radiometric, geometric, and atmospheric corrections for three PlanetScope Products. √ = most complete, -- = less complete, X = no corrections.
| Product/Level | Description | Sensor/Radiometric Correction | Geometric Correction | Atmospheric Corrections |
|---|---|---|---|---|
| Basic Scene (Level 1B) | Scaled TOA (at sensor) radiance; designed for users with advanced image processing and geometric correction capabilities. | √ Conversion to absolute radiometric values based on calibration coefficients. Values scaled by 100. | -- Platform effects corrected with telemetry and best available ephemeris data, refined using GCPs. | X |
| Ortho Scene–Analytic (Level 3B) | Orthorectified scaled TOA (at sensor) radiance or surface reflectance product. | √ Conversion to absolute radiometric values based on calibration coefficients. Values scaled by 100. | √ Sensor-related effects corrected with telemetry and sensor model. Platform effect corrected with attitude telemetry and best available ephemeris data. Orthorectified using GCPs and DEM. Projected to UTM. | √ Conversion to TOA using at-sensor radiance and supplied coefficients. Conversion to SR using 6SV2.1 radiative transfer code and MODIS NRT data. Reflectance scaled by 10,000 to reduce quantization error. |
| Ortho Scene–Visual (Level 3) | Orthorectified and color corrected; suitable for cartographic or visual operations | X | -- Sensor-related effects corrected with telemetry and sensor model. Orthrectified using GCPs and DEM. Positional accuracy: <10 m | X |
Publisher’s Note: MDPI stays neutral with regard to jurisdictional claims in published maps and institutional affiliations. |
© 2021 by the authors. Licensee MDPI, Basel, Switzerland. This article is an open access article distributed under the terms and conditions of the Creative Commons Attribution (CC BY) license (https://creativecommons.org/licenses/by/4.0/).
Share and Cite
MDPI and ACS Style
Frazier, A.E.; Hemingway, B.L. A Technical Review of Planet Smallsat Data: Practical Considerations for Processing and Using PlanetScope Imagery. Remote Sens. 2021, 13, 3930. https://0-doi-org.brum.beds.ac.uk/10.3390/rs13193930
AMA Style
Frazier AE, Hemingway BL. A Technical Review of Planet Smallsat Data: Practical Considerations for Processing and Using PlanetScope Imagery. Remote Sensing. 2021; 13(19):3930. https://0-doi-org.brum.beds.ac.uk/10.3390/rs13193930
Chicago/Turabian StyleFrazier, Amy E., and Benjamin L. Hemingway. 2021. "A Technical Review of Planet Smallsat Data: Practical Considerations for Processing and Using PlanetScope Imagery" Remote Sensing 13, no. 19: 3930. https://0-doi-org.brum.beds.ac.uk/10.3390/rs13193930
Note that from the first issue of 2016, this journal uses article numbers instead of page numbers. See further details here.