Mapping the Lithological Features and Ore-Controlling Structures Related to Ni–Cu Mineralization in the Eastern Tian Shan, NW China from ASTER Data


Abstract
:
1. Introduction
2. Geological Setting
3. Spectral Measurements and Image Processing
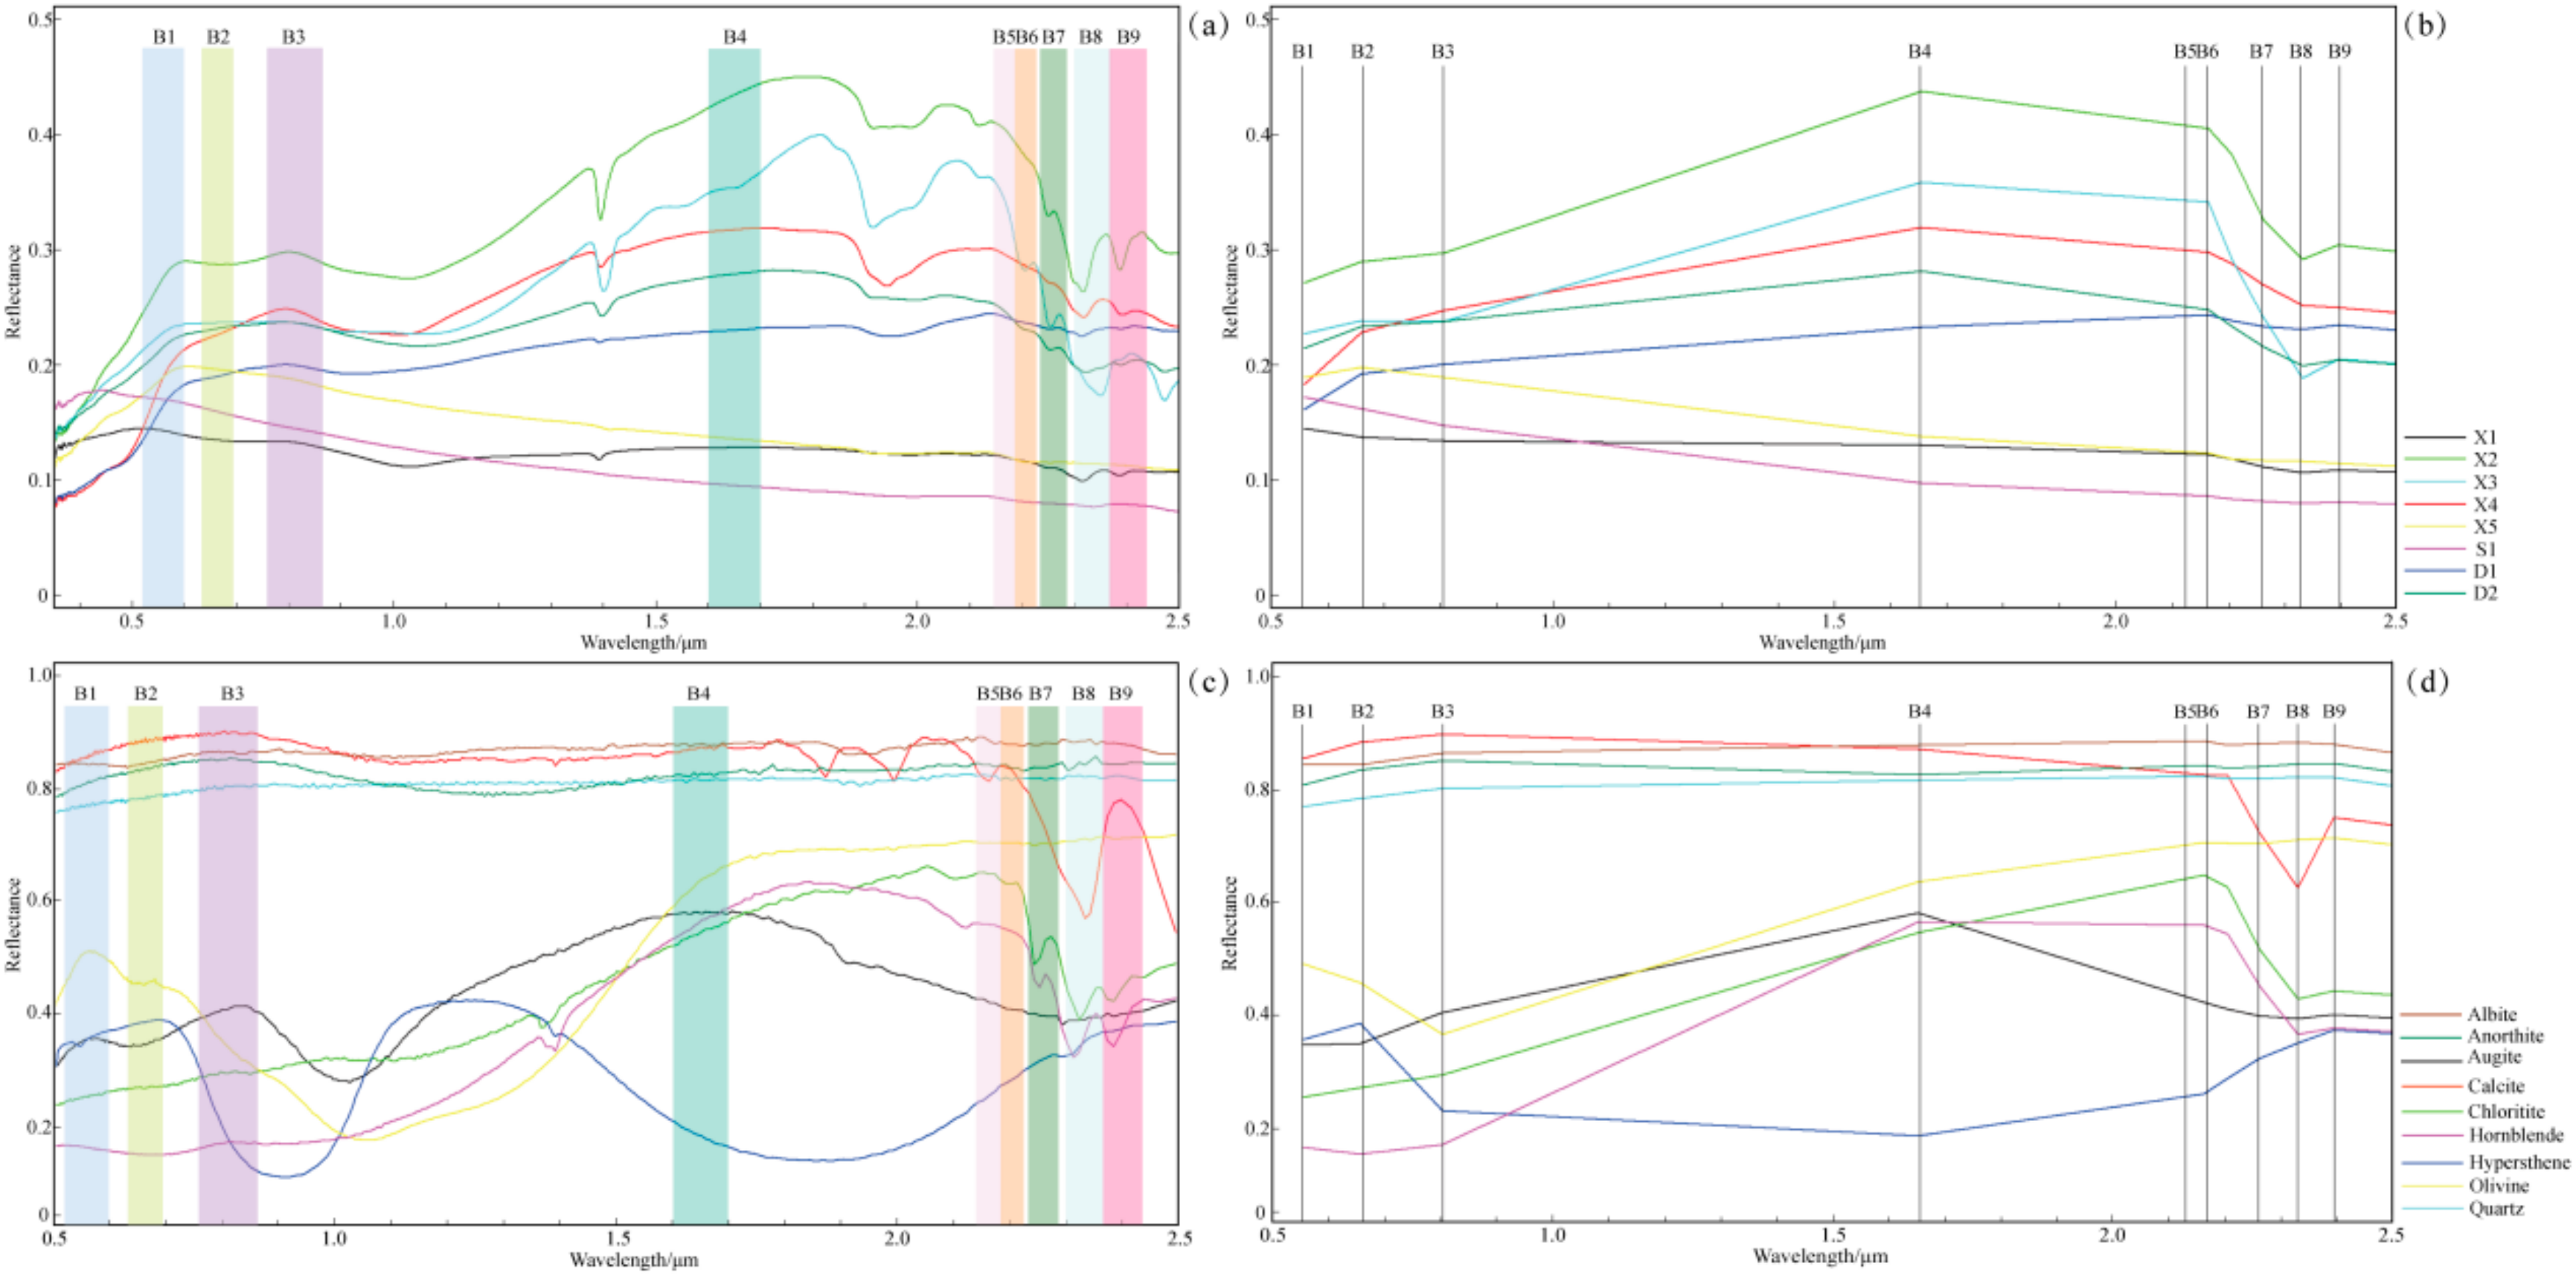
3.1. Spectral Measurements
3.2. Image Processing
4. Results
4.1. Lithological Mapping
4.1.1. VNIR-SWIR
4.1.2. TIR
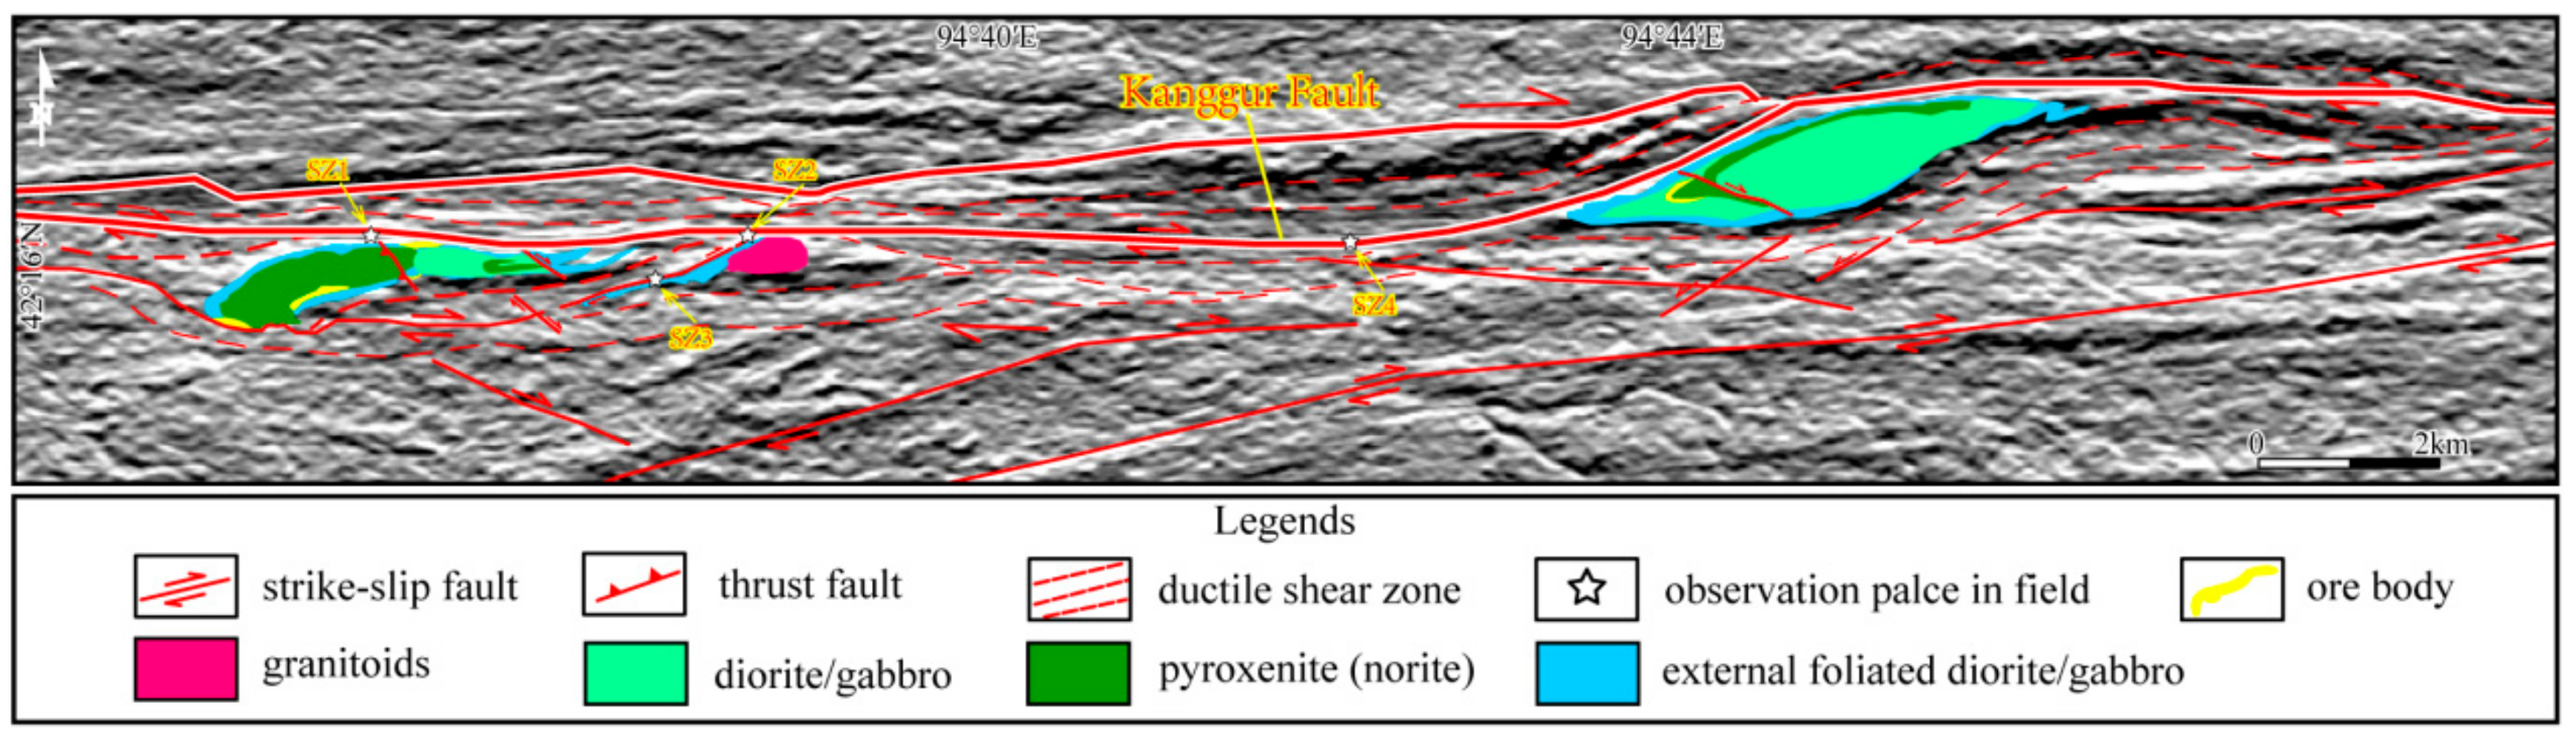
4.2. Ore-Controlling Fault Interpretation
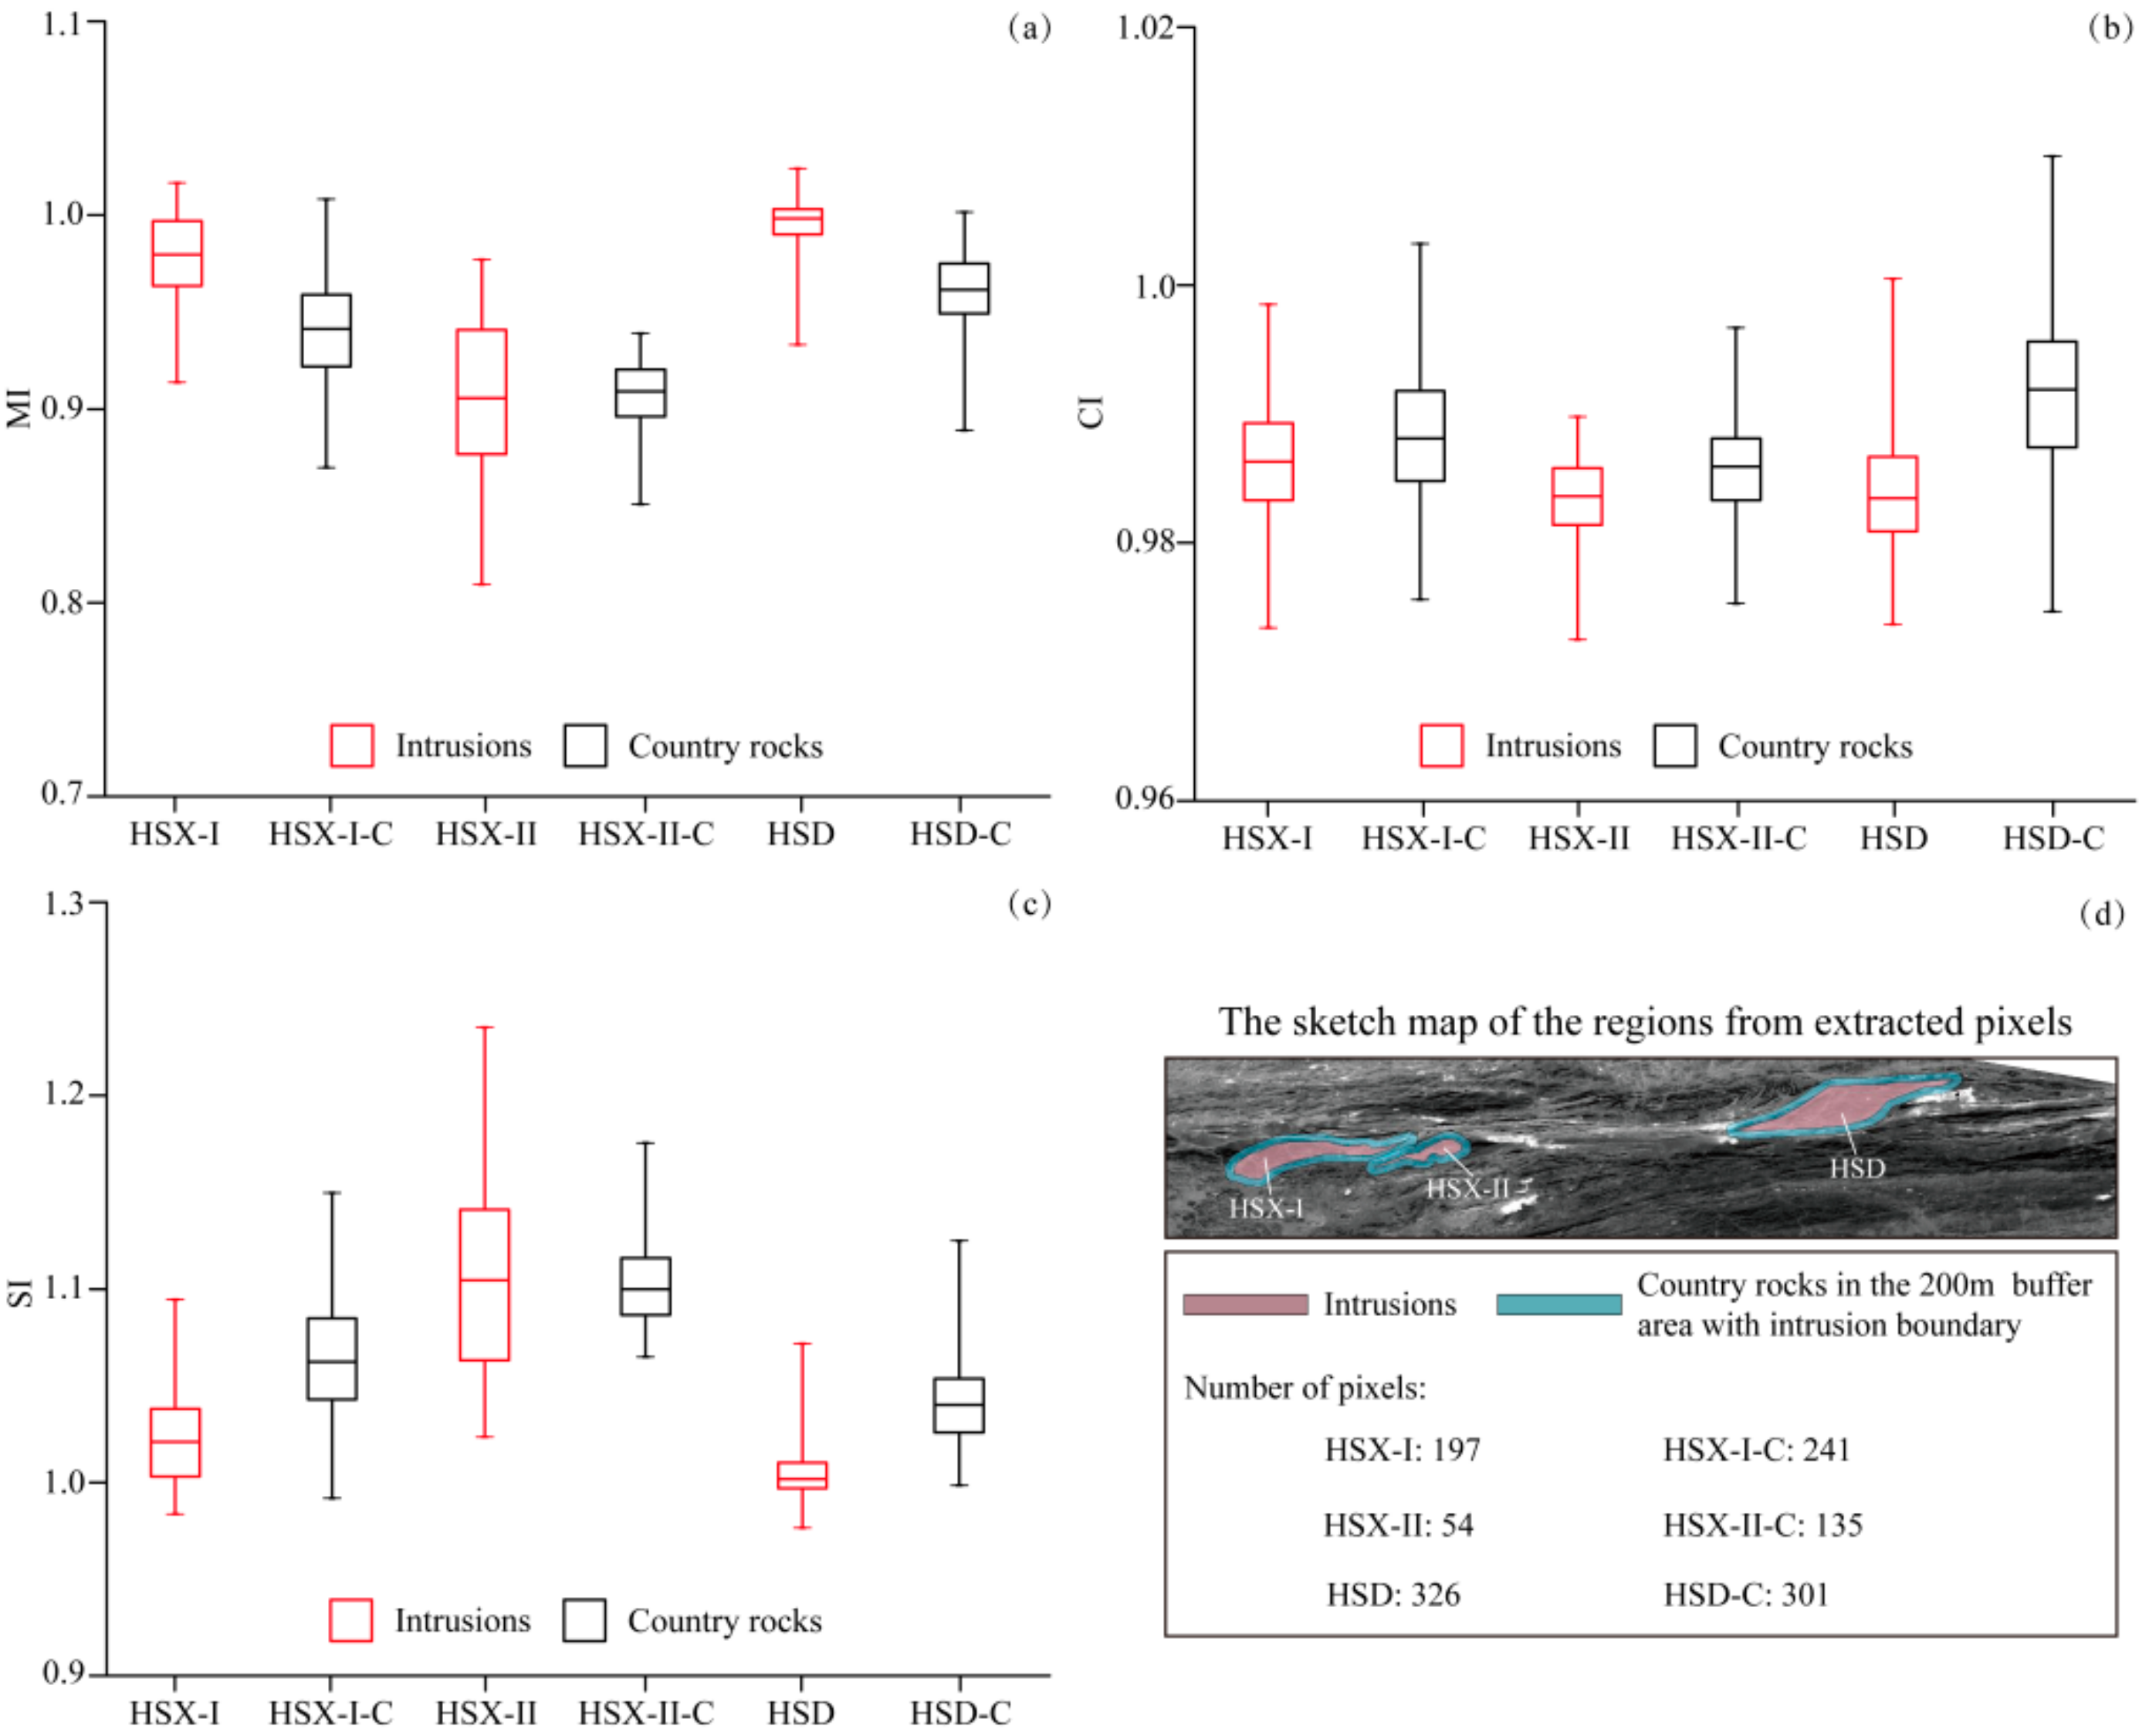
4.3. Analyses of Intrusions Bearing Ni–Cu Ore
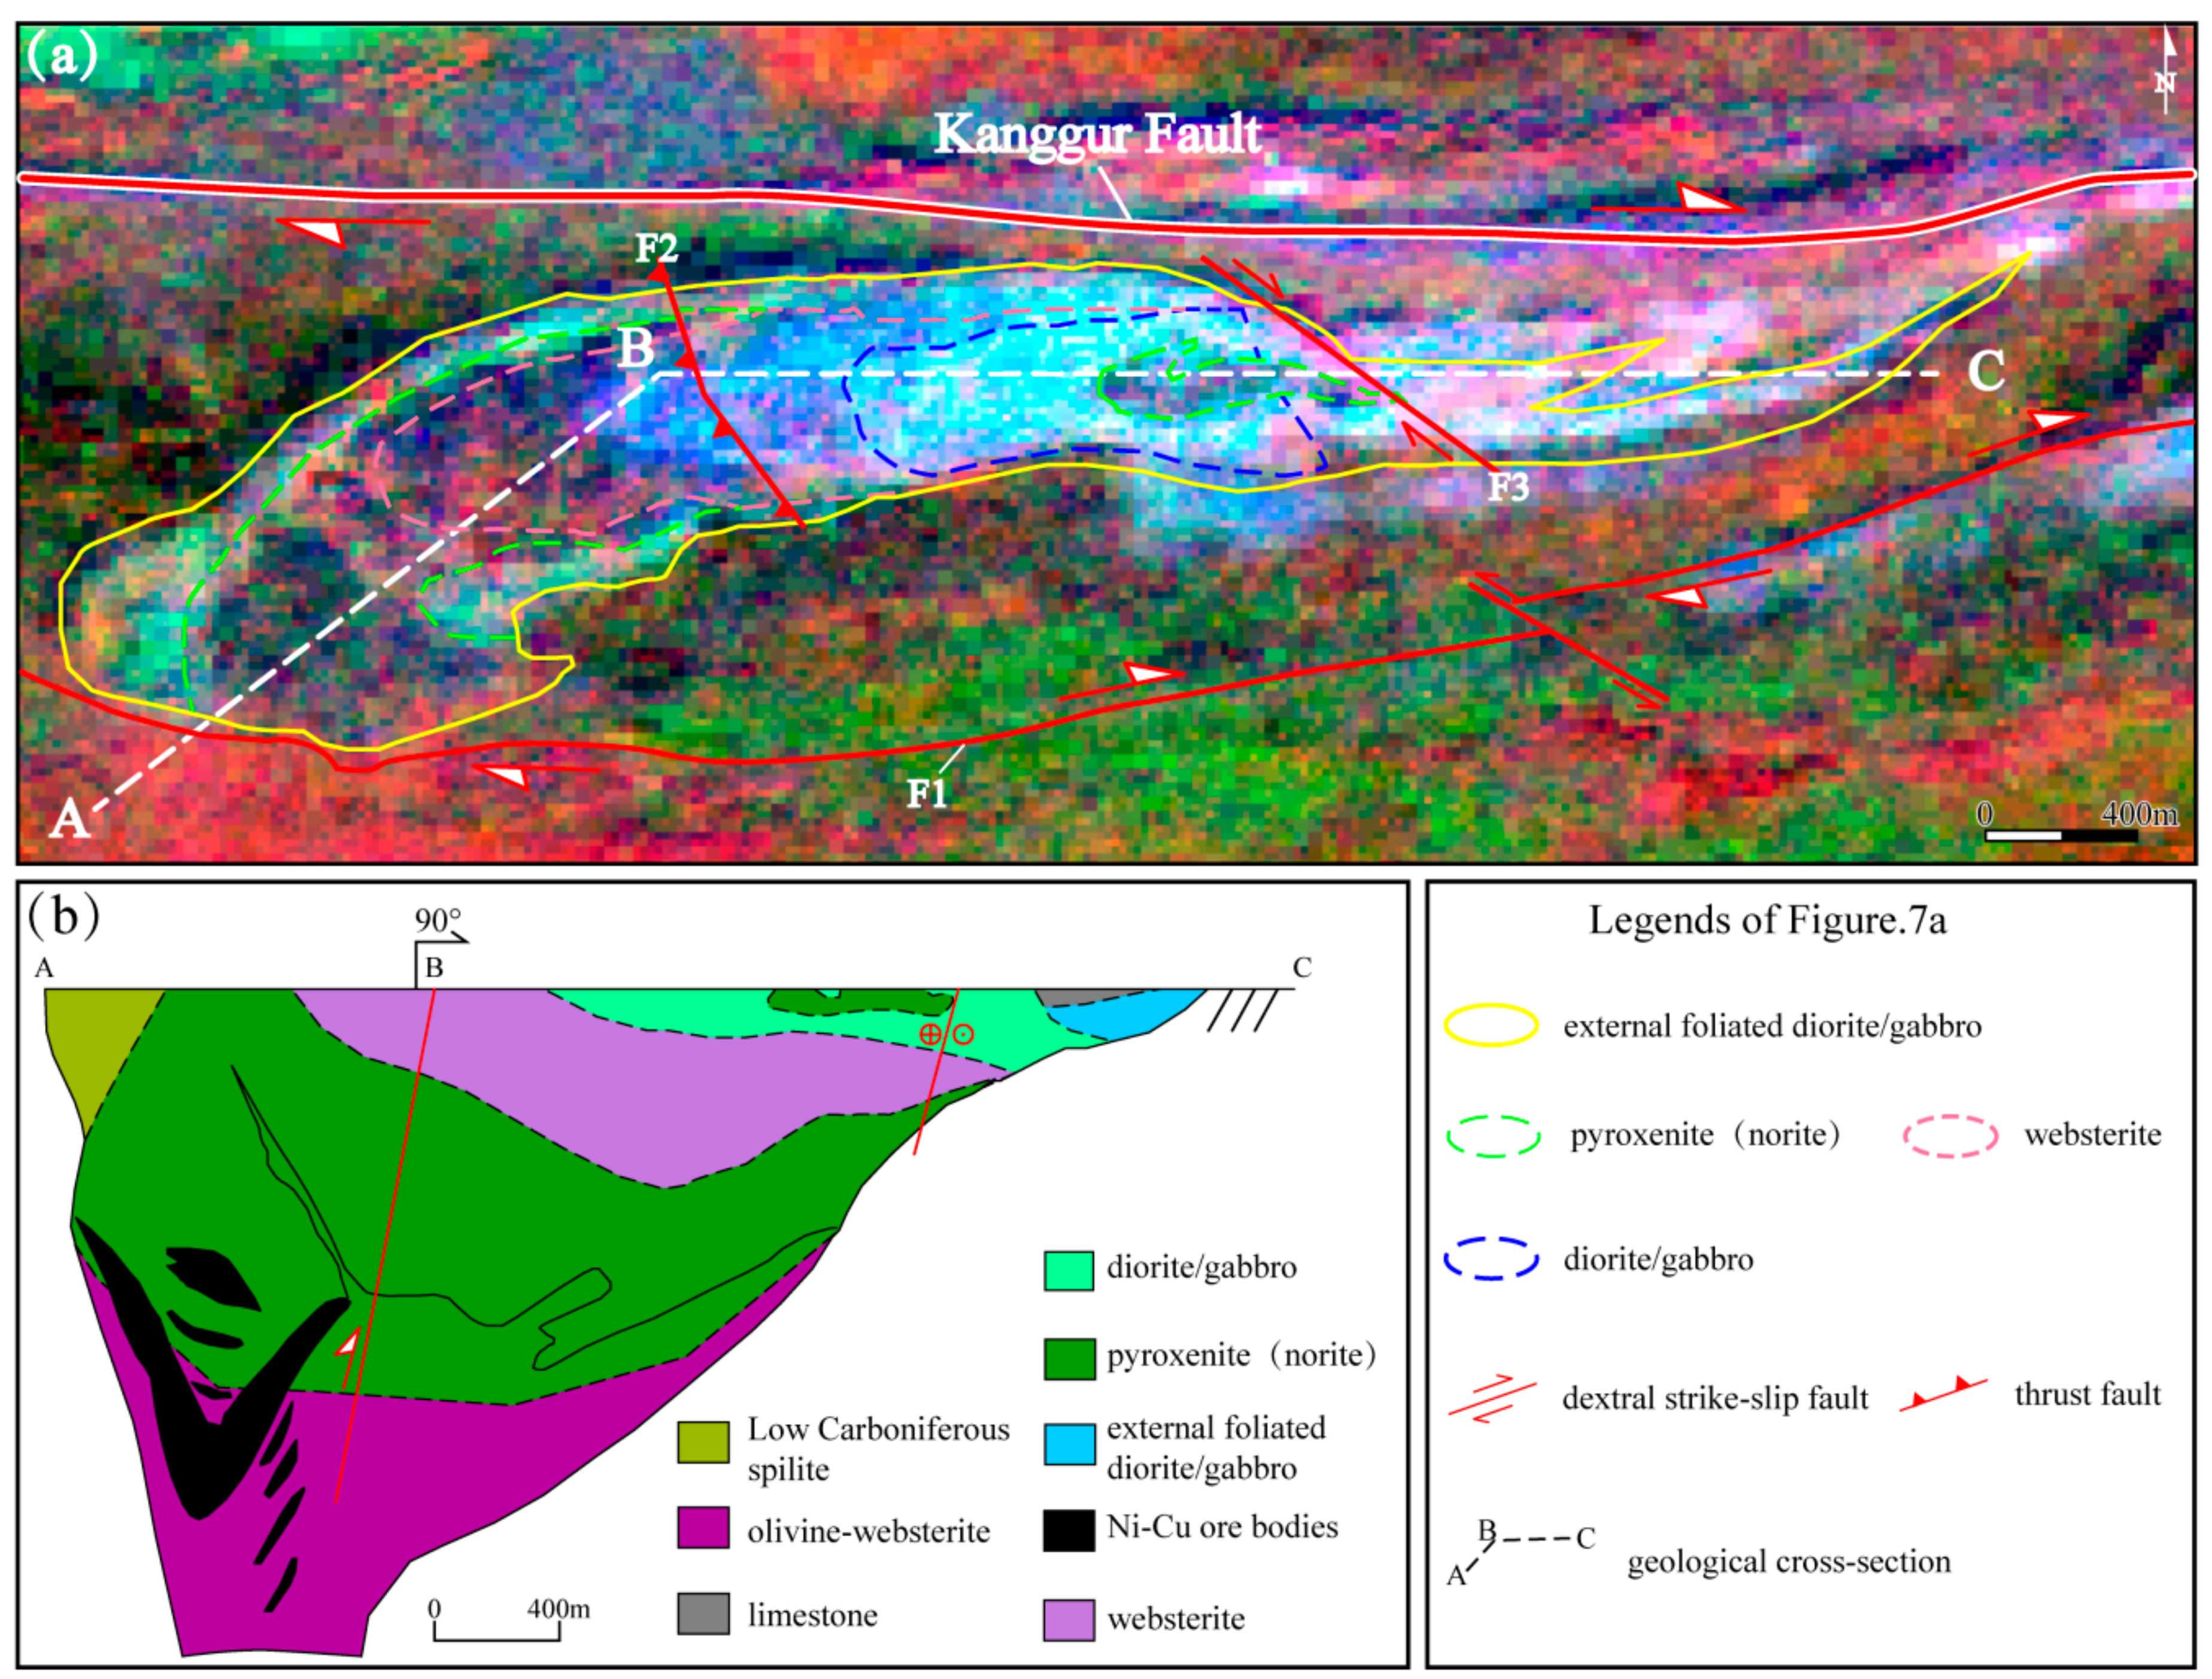
4.3.1. HSX Intrusions
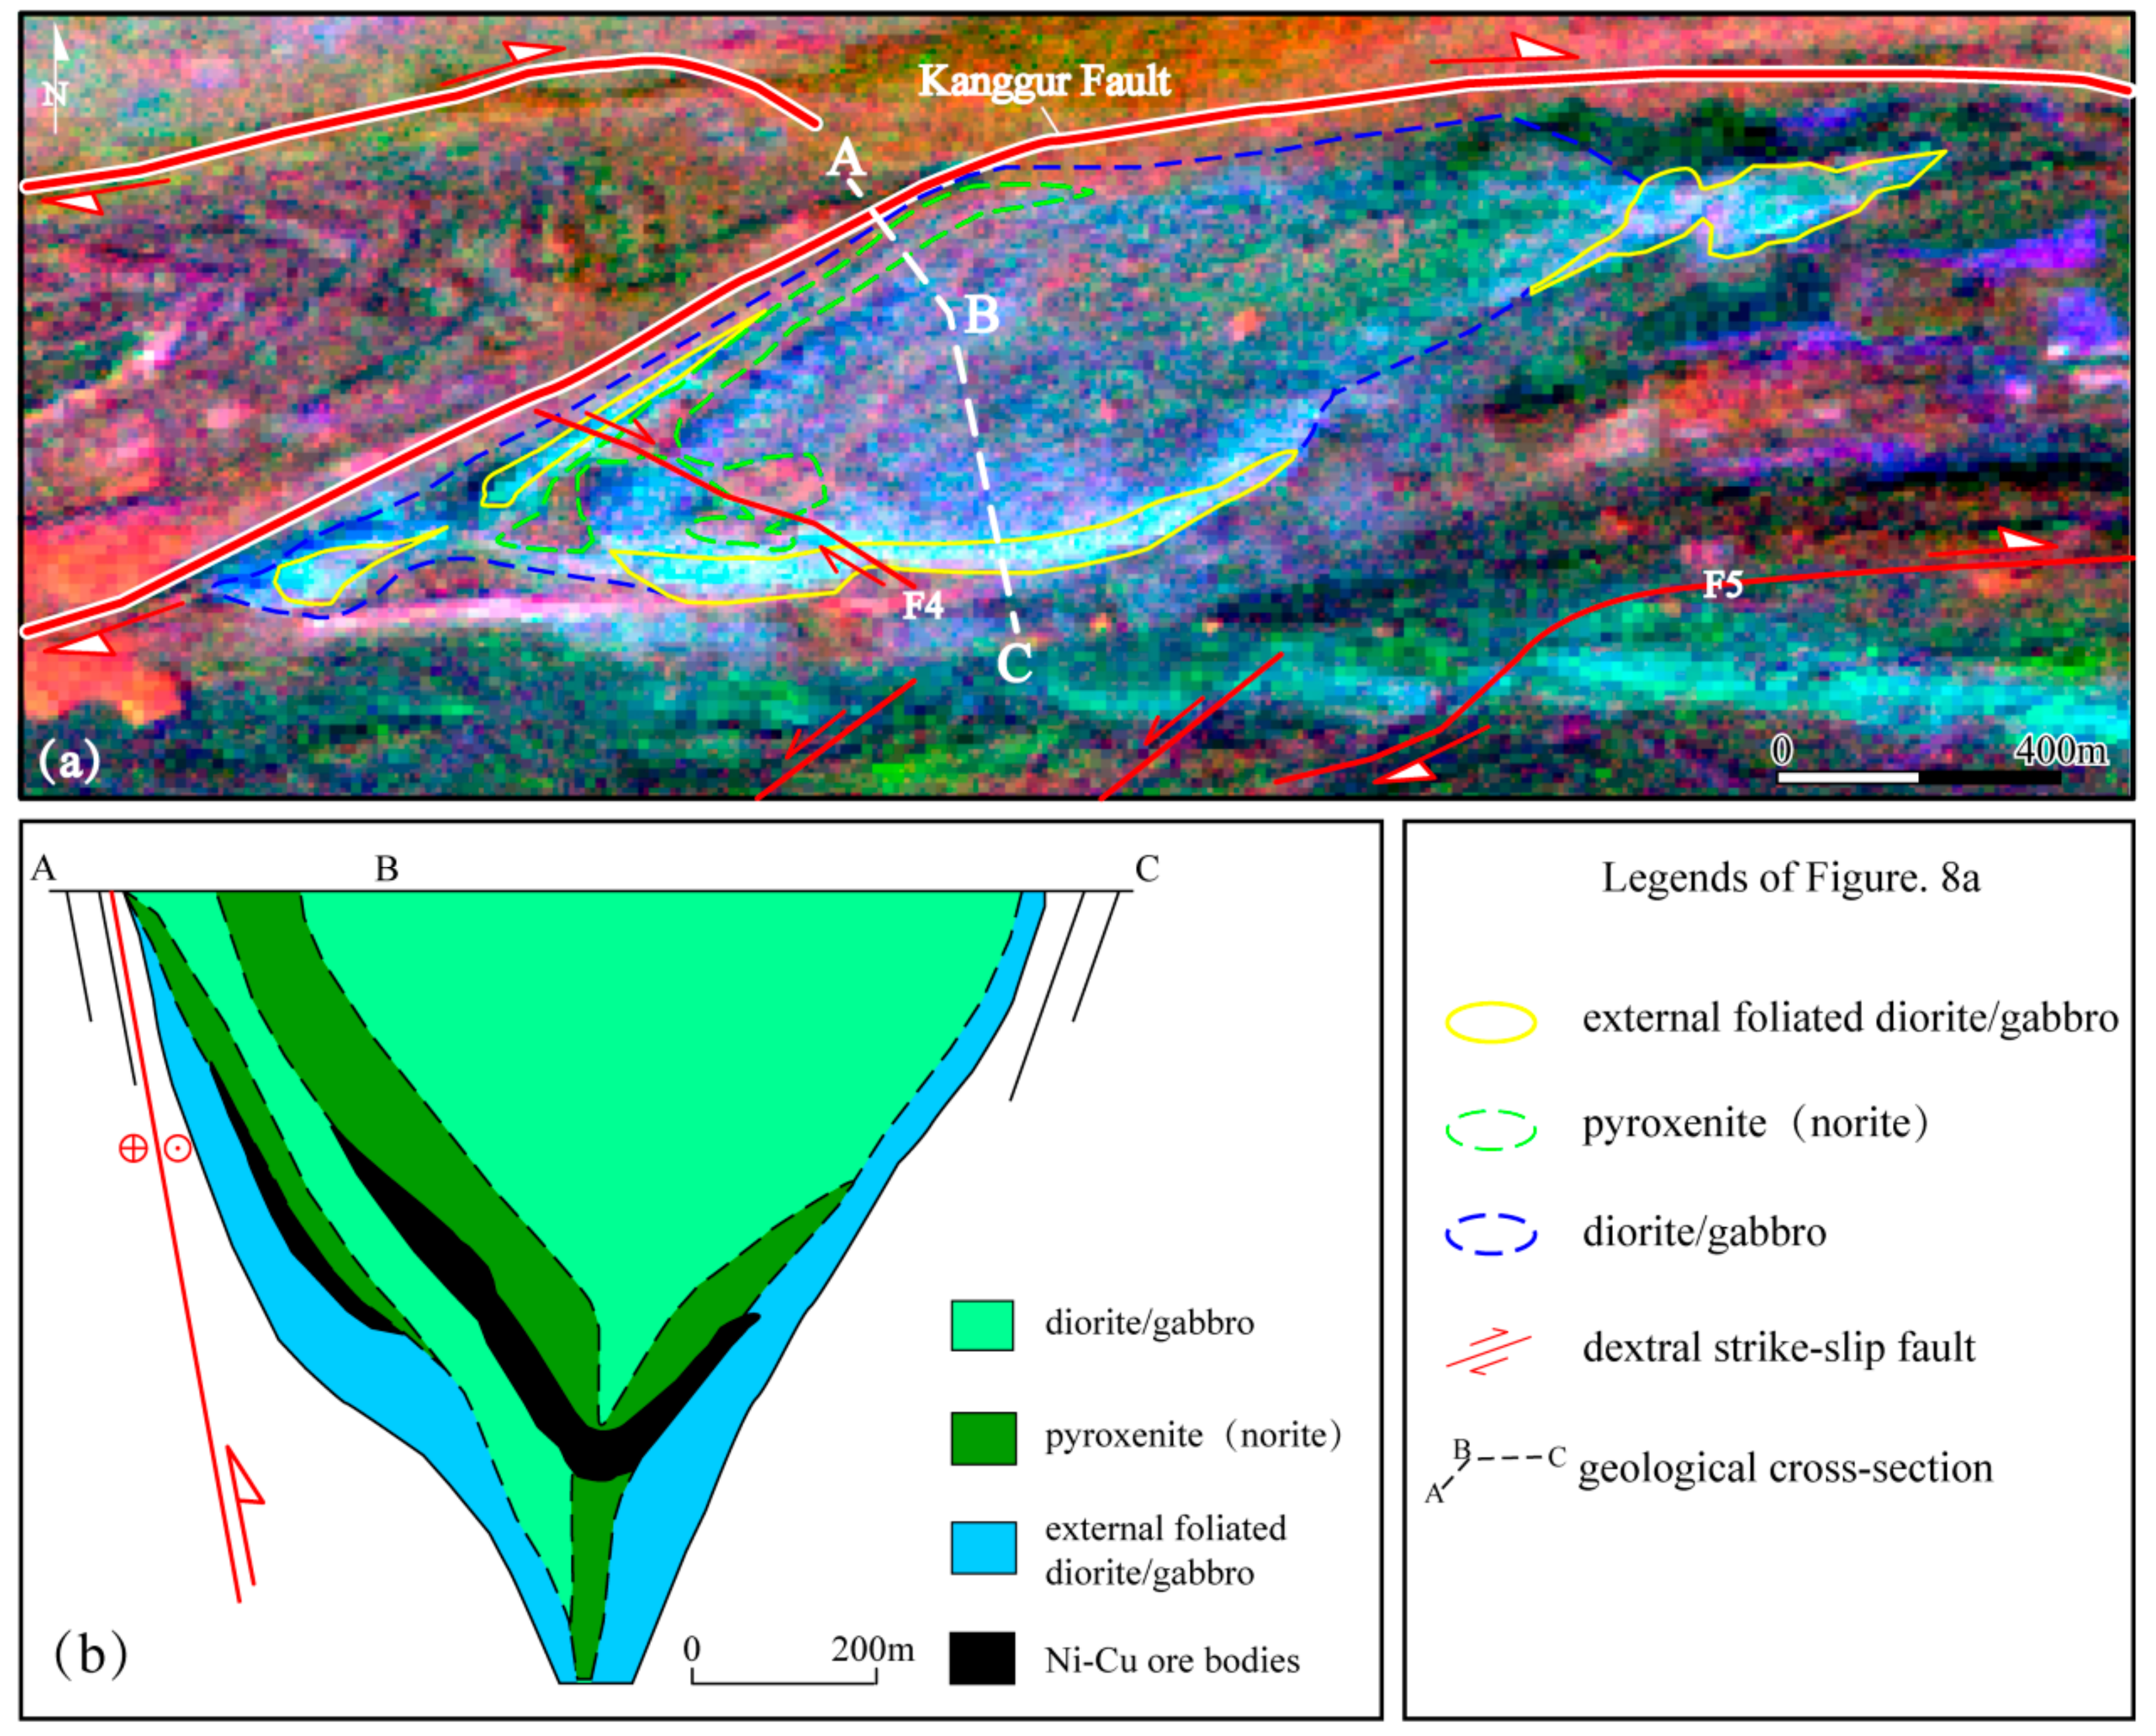
4.3.2. HSD Intrusion
5. Validation and Discussion
5.1. Validation
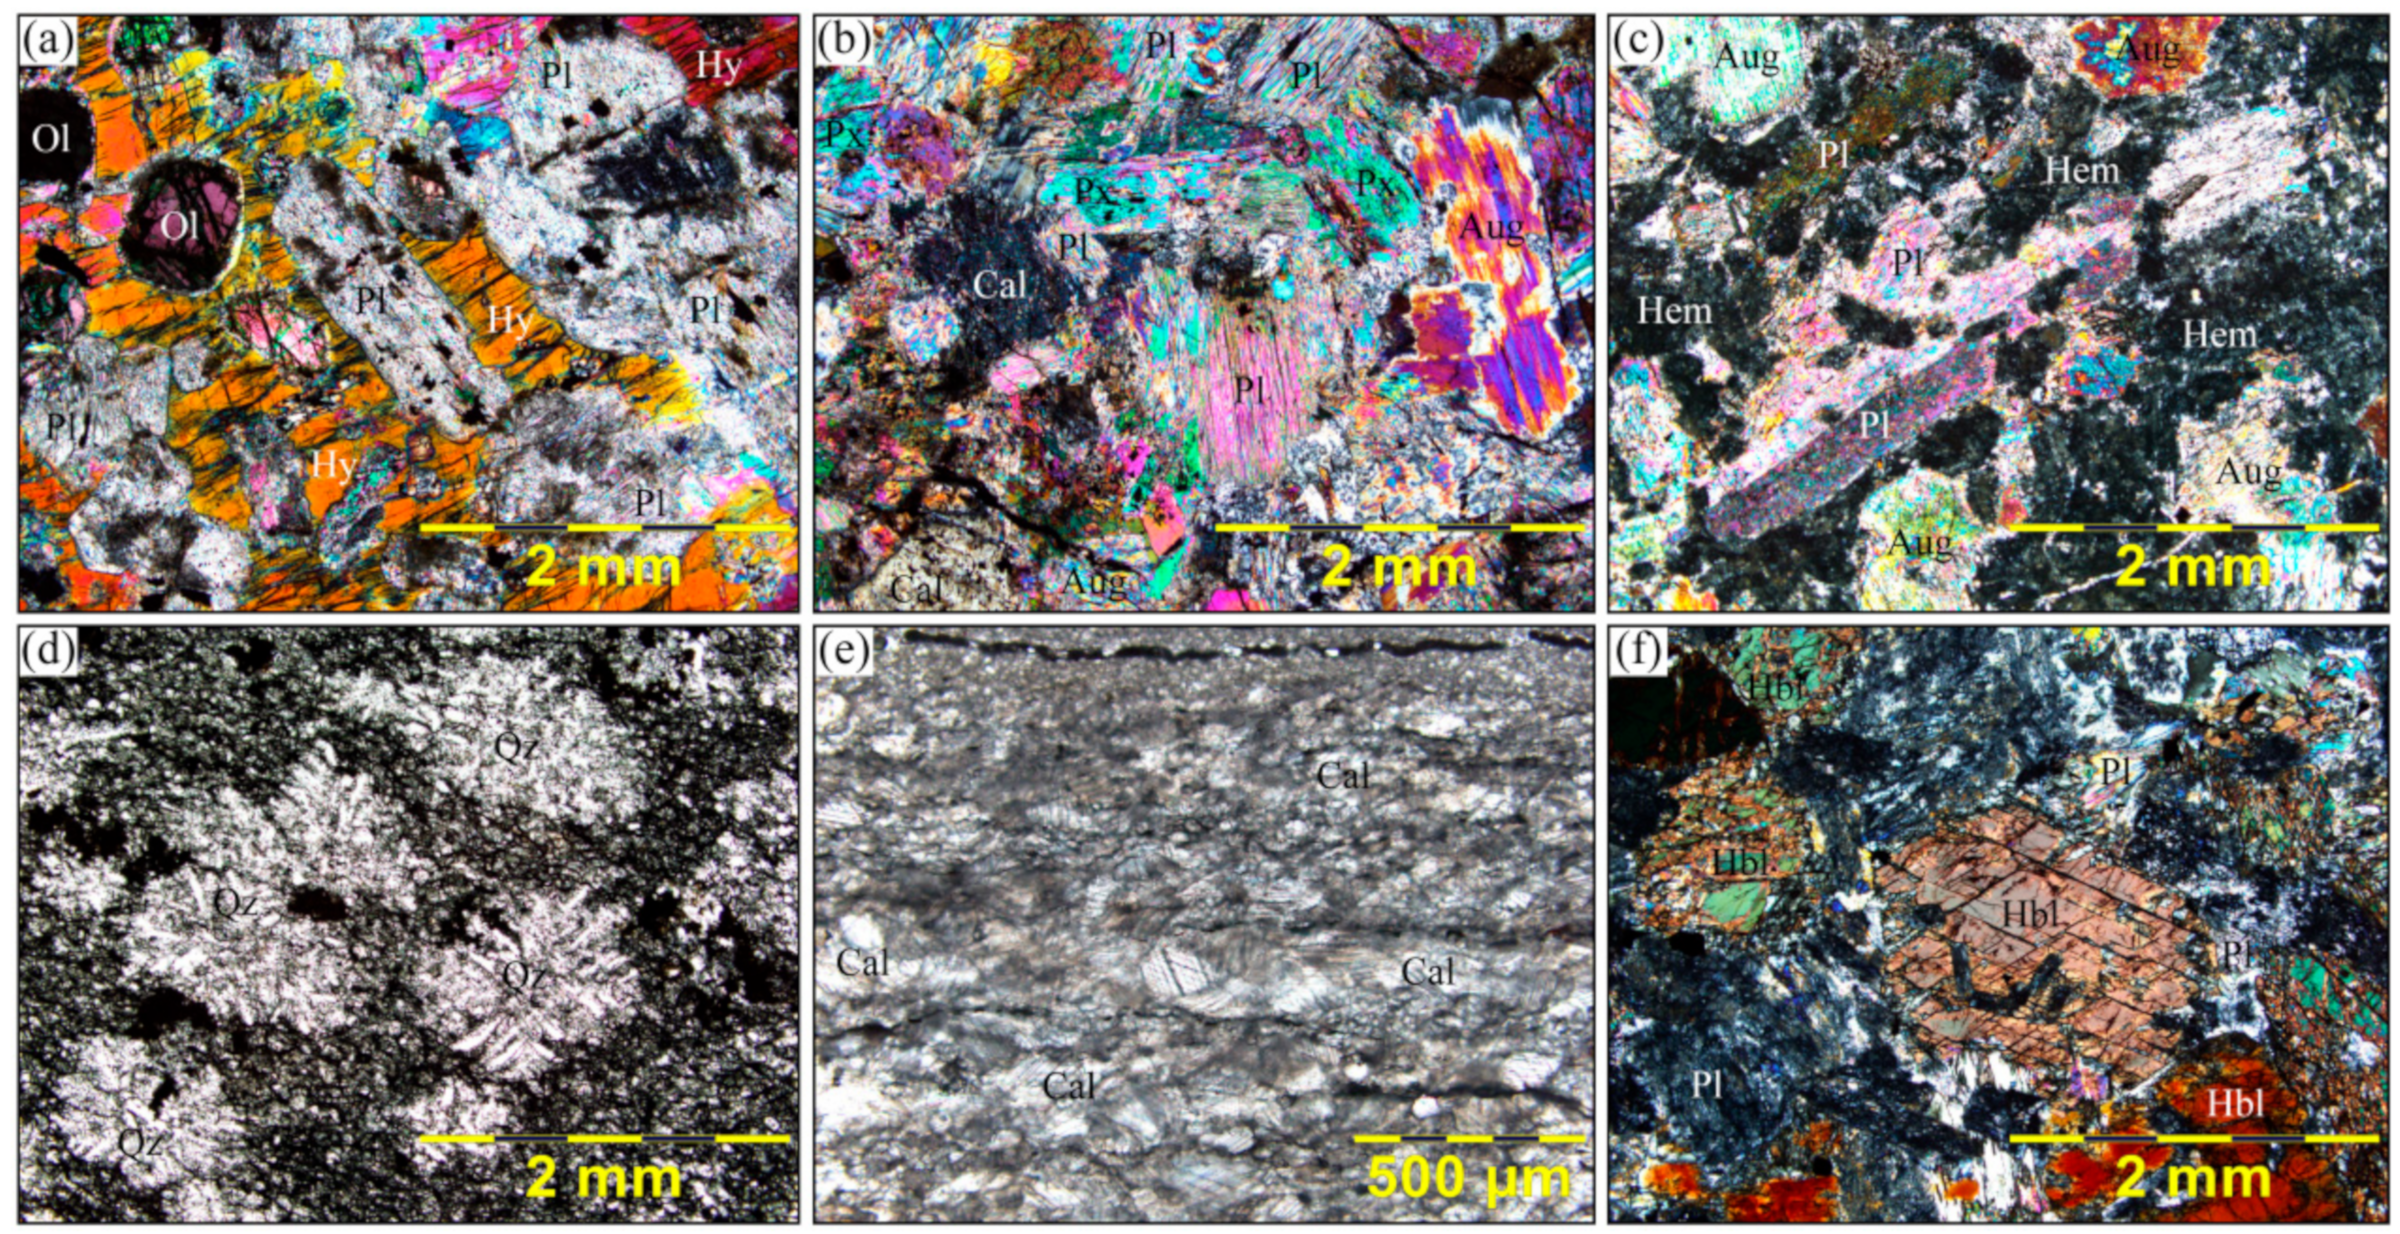
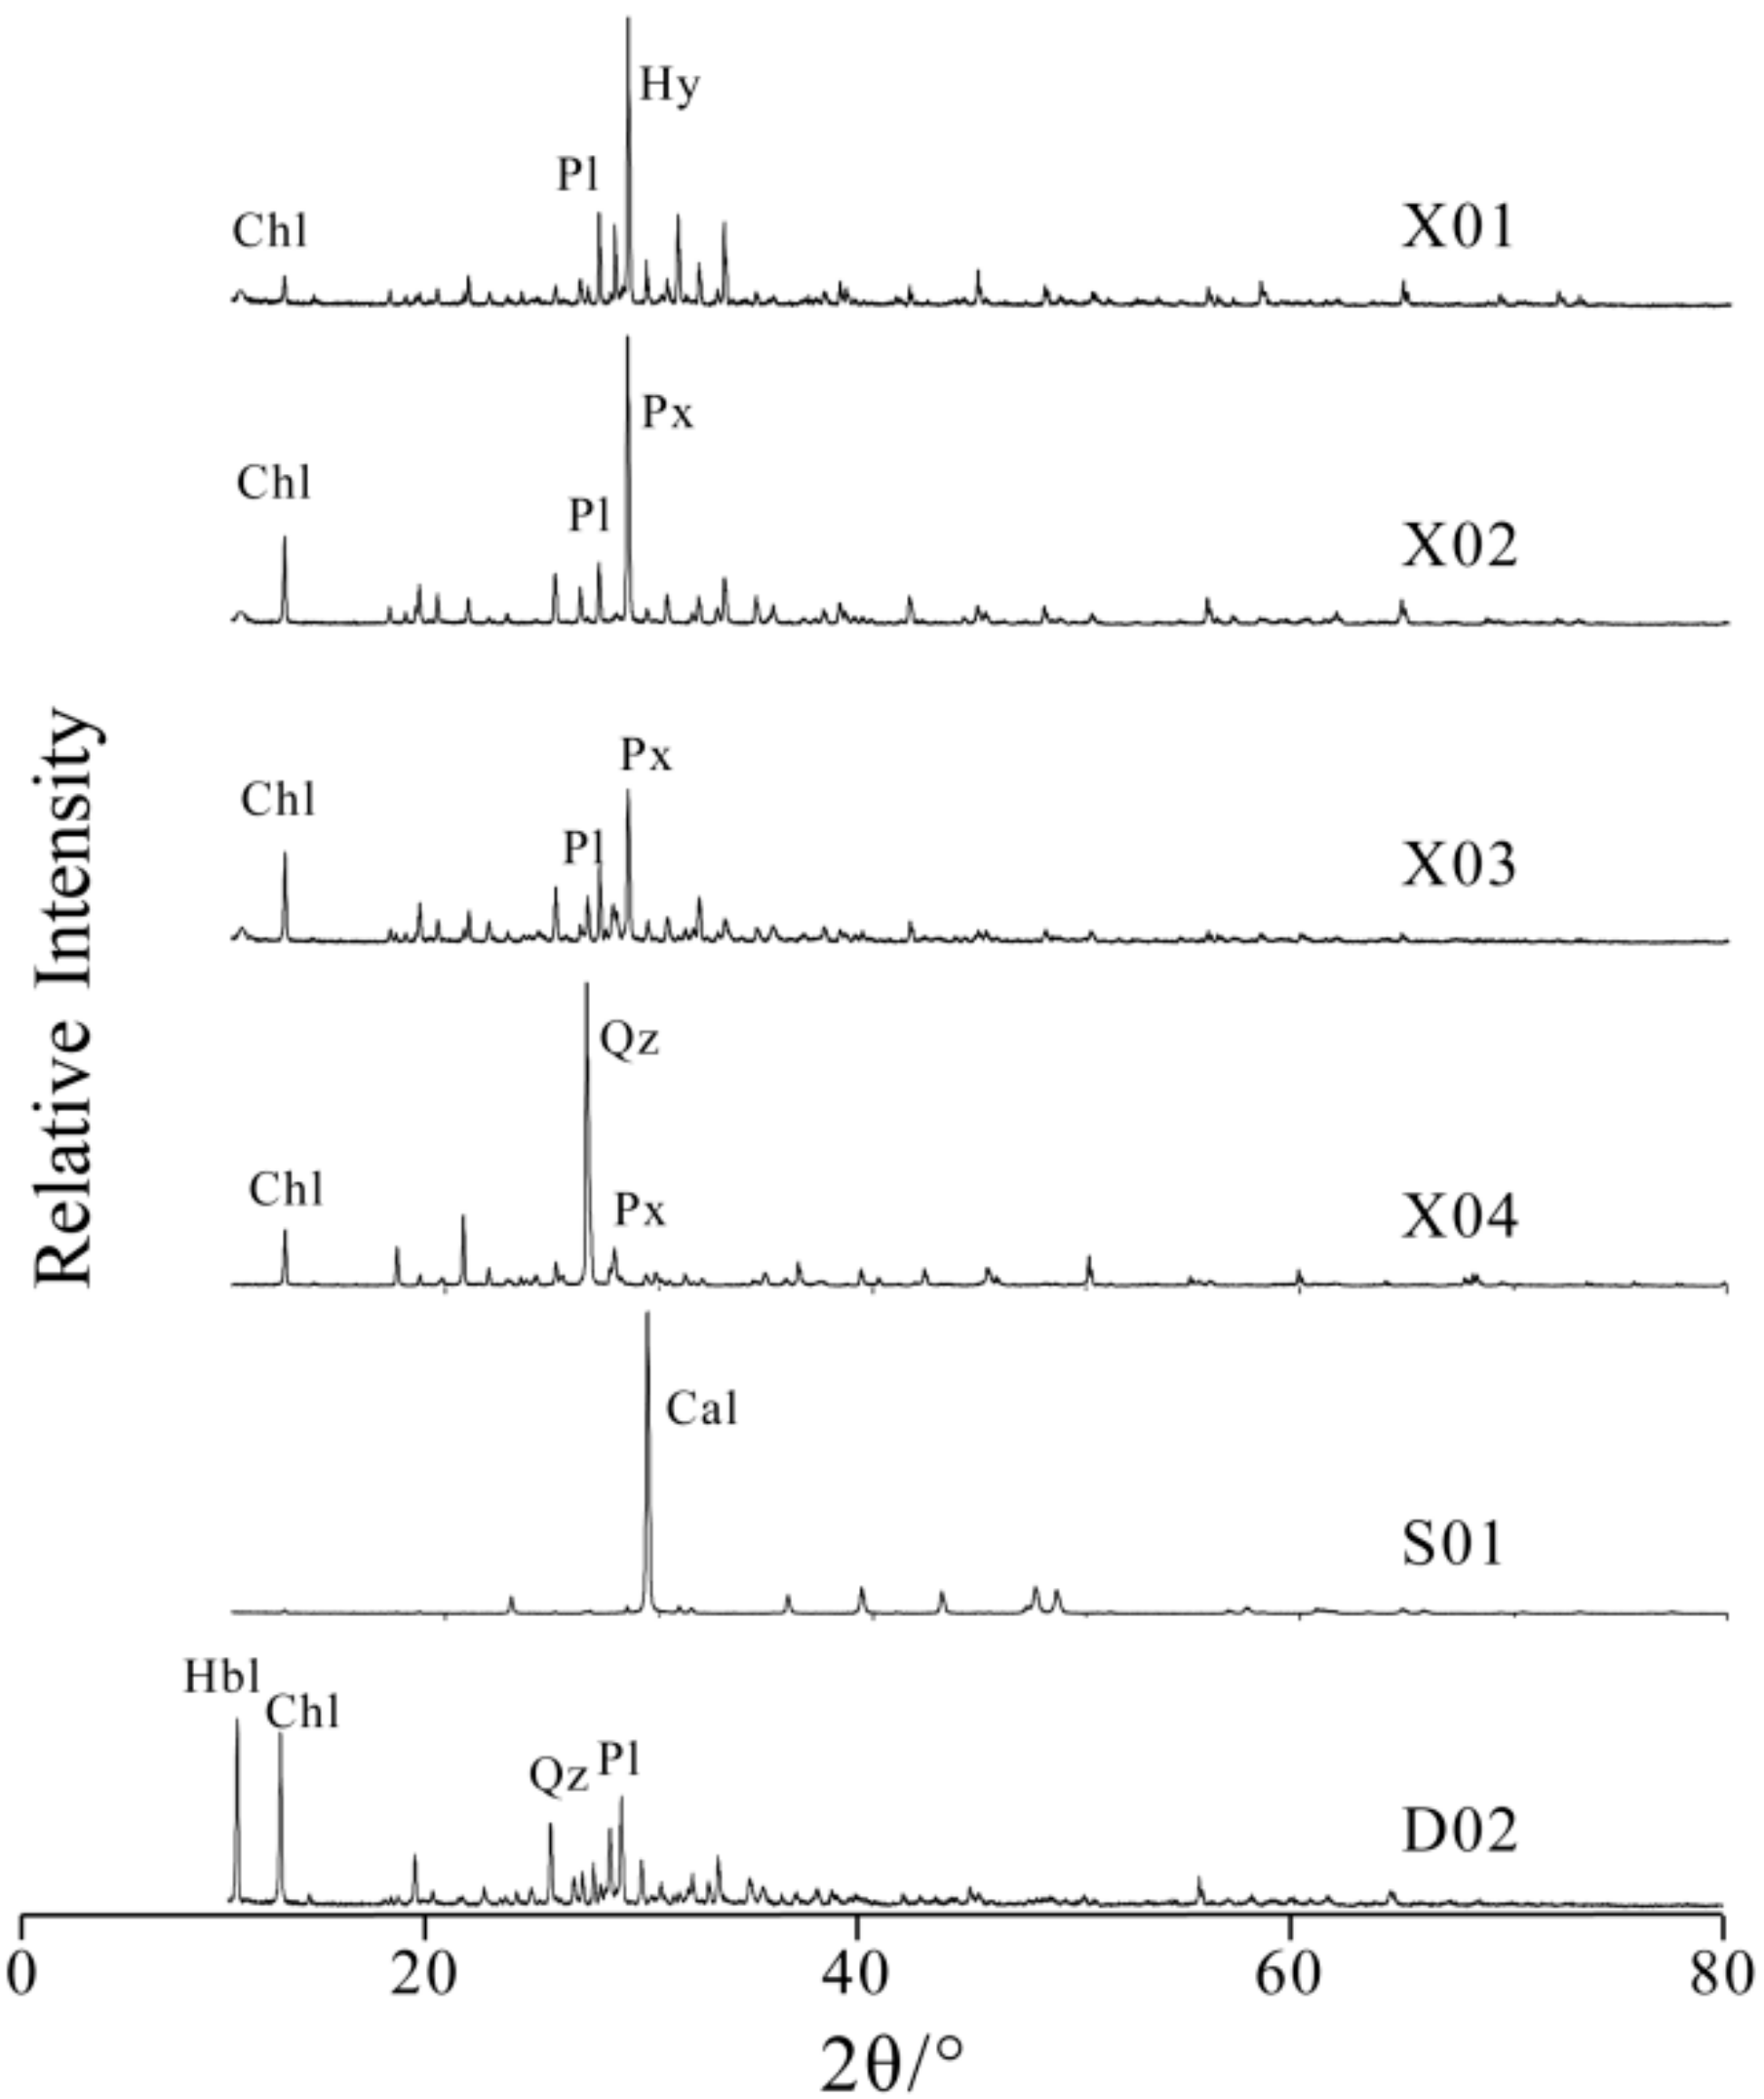
5.1.1. PLM and XRD
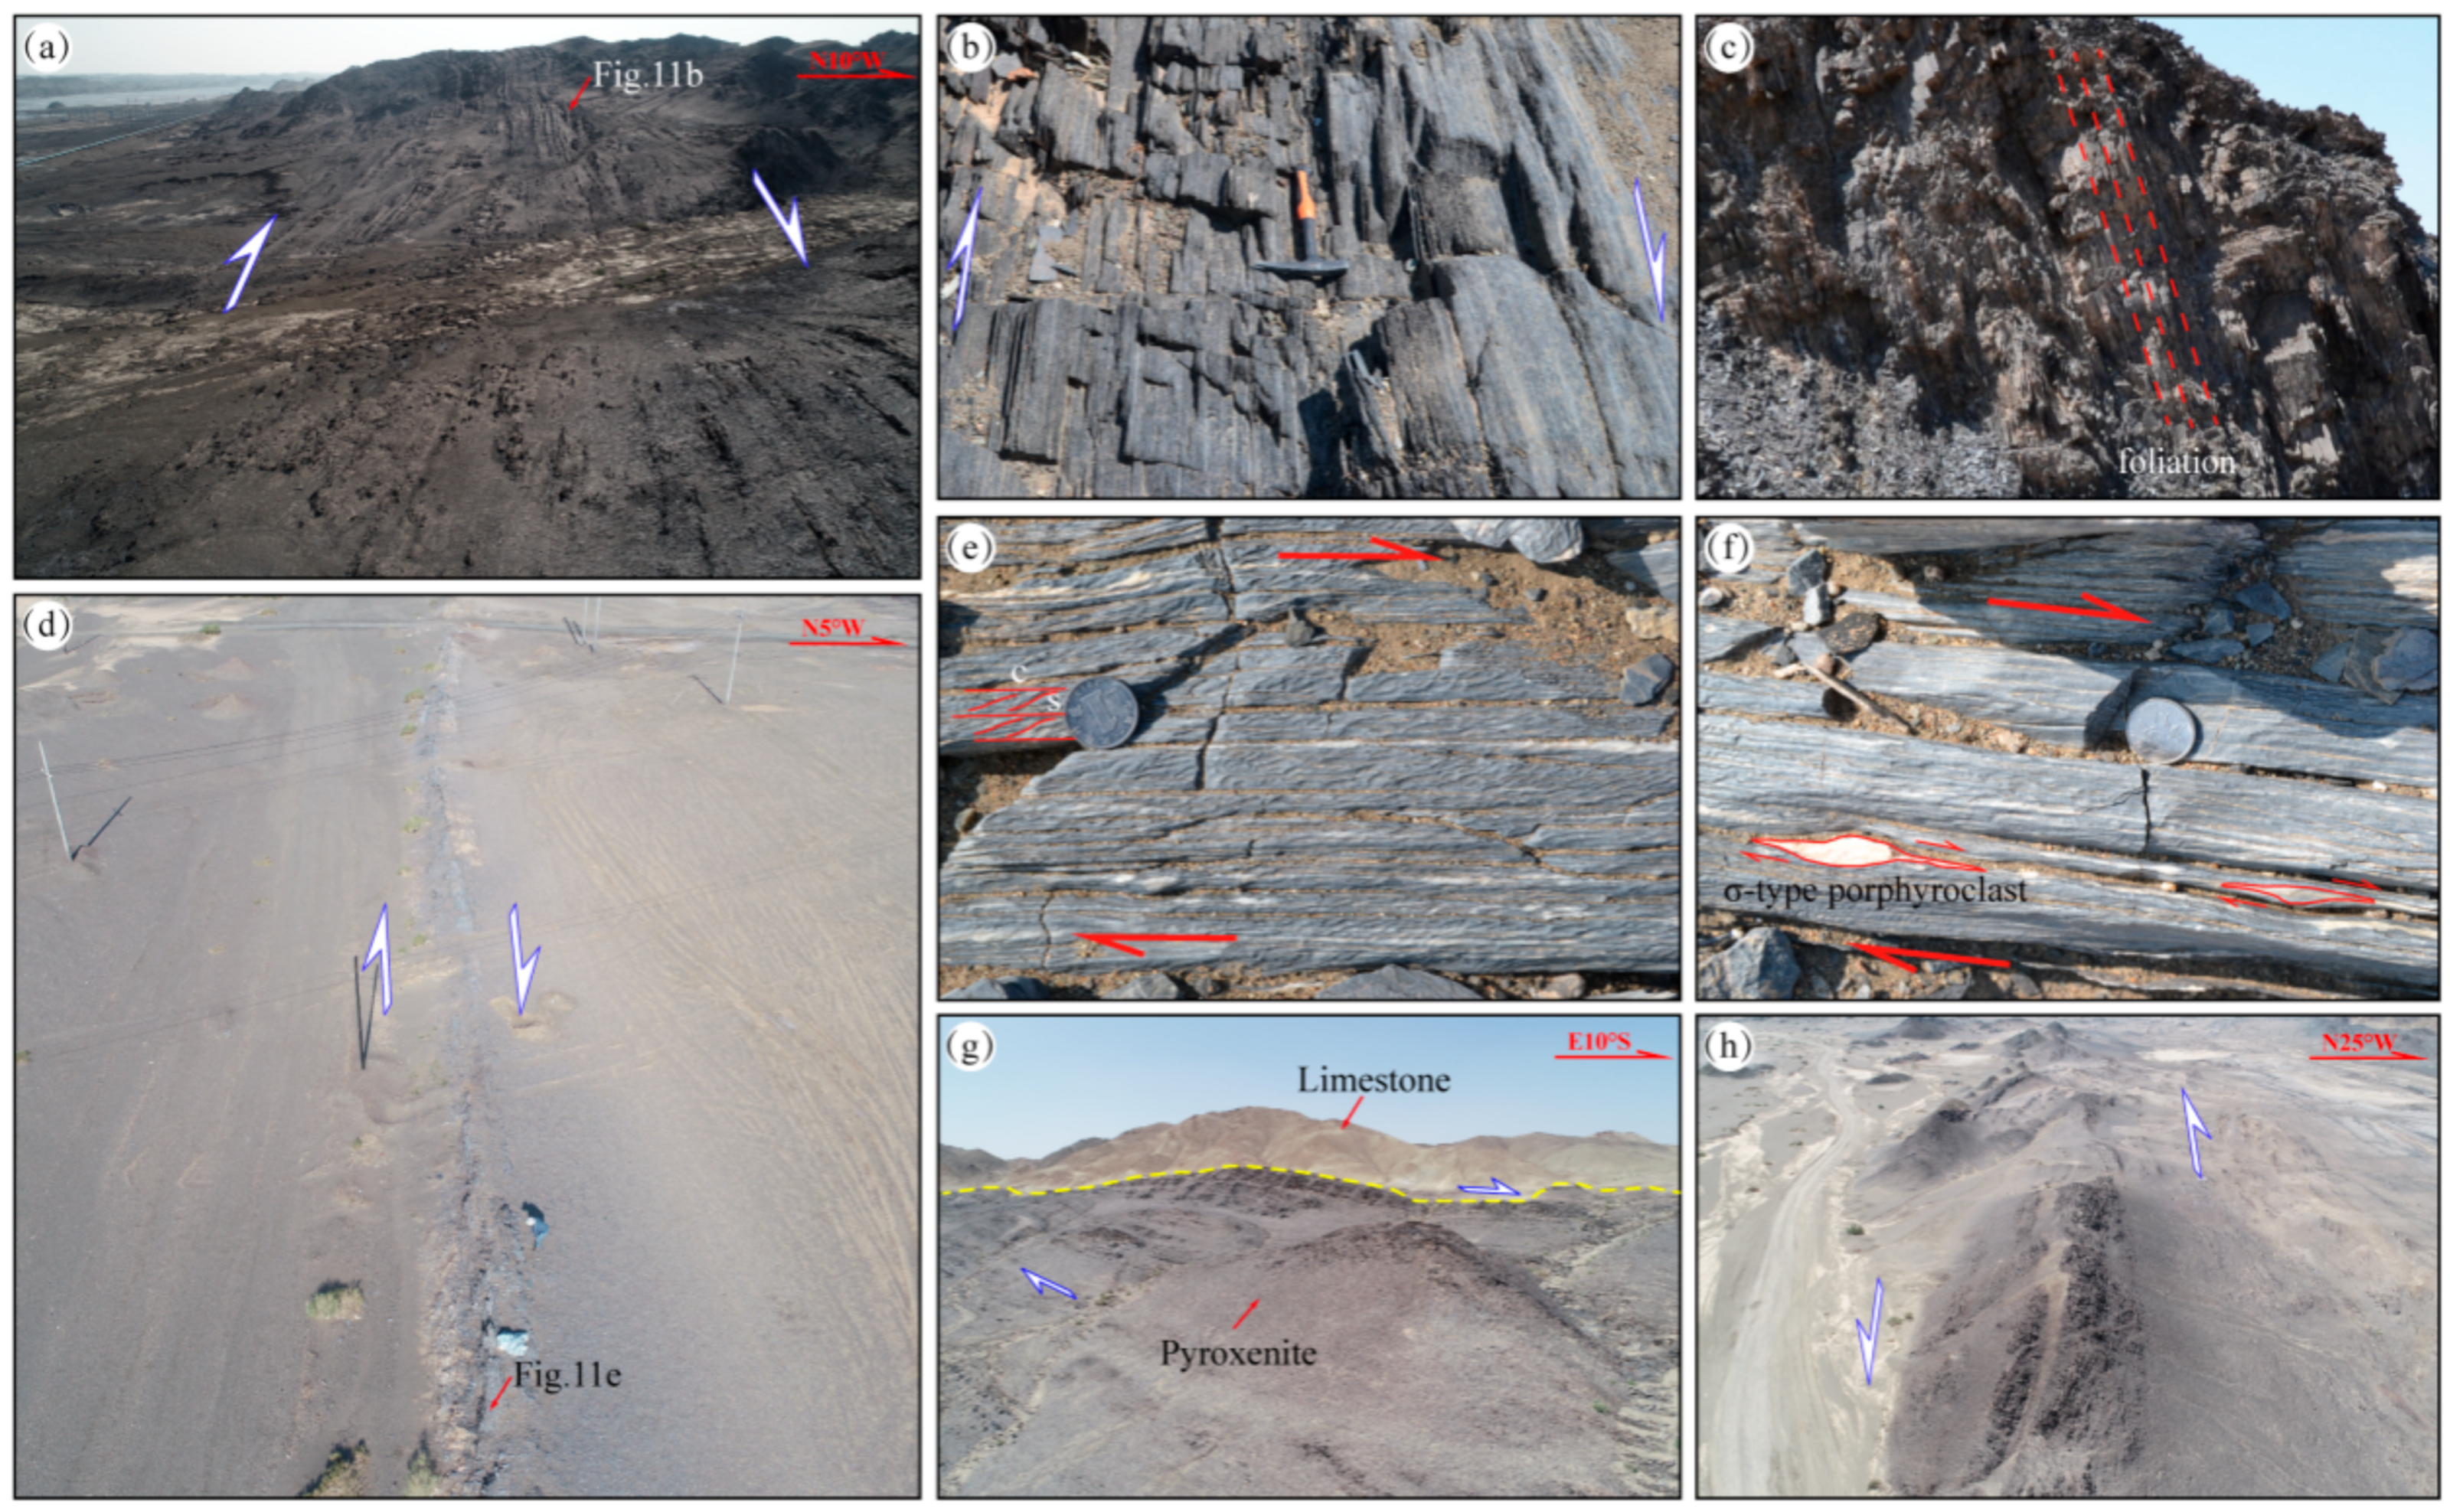
5.1.2. Field Observation of Faults
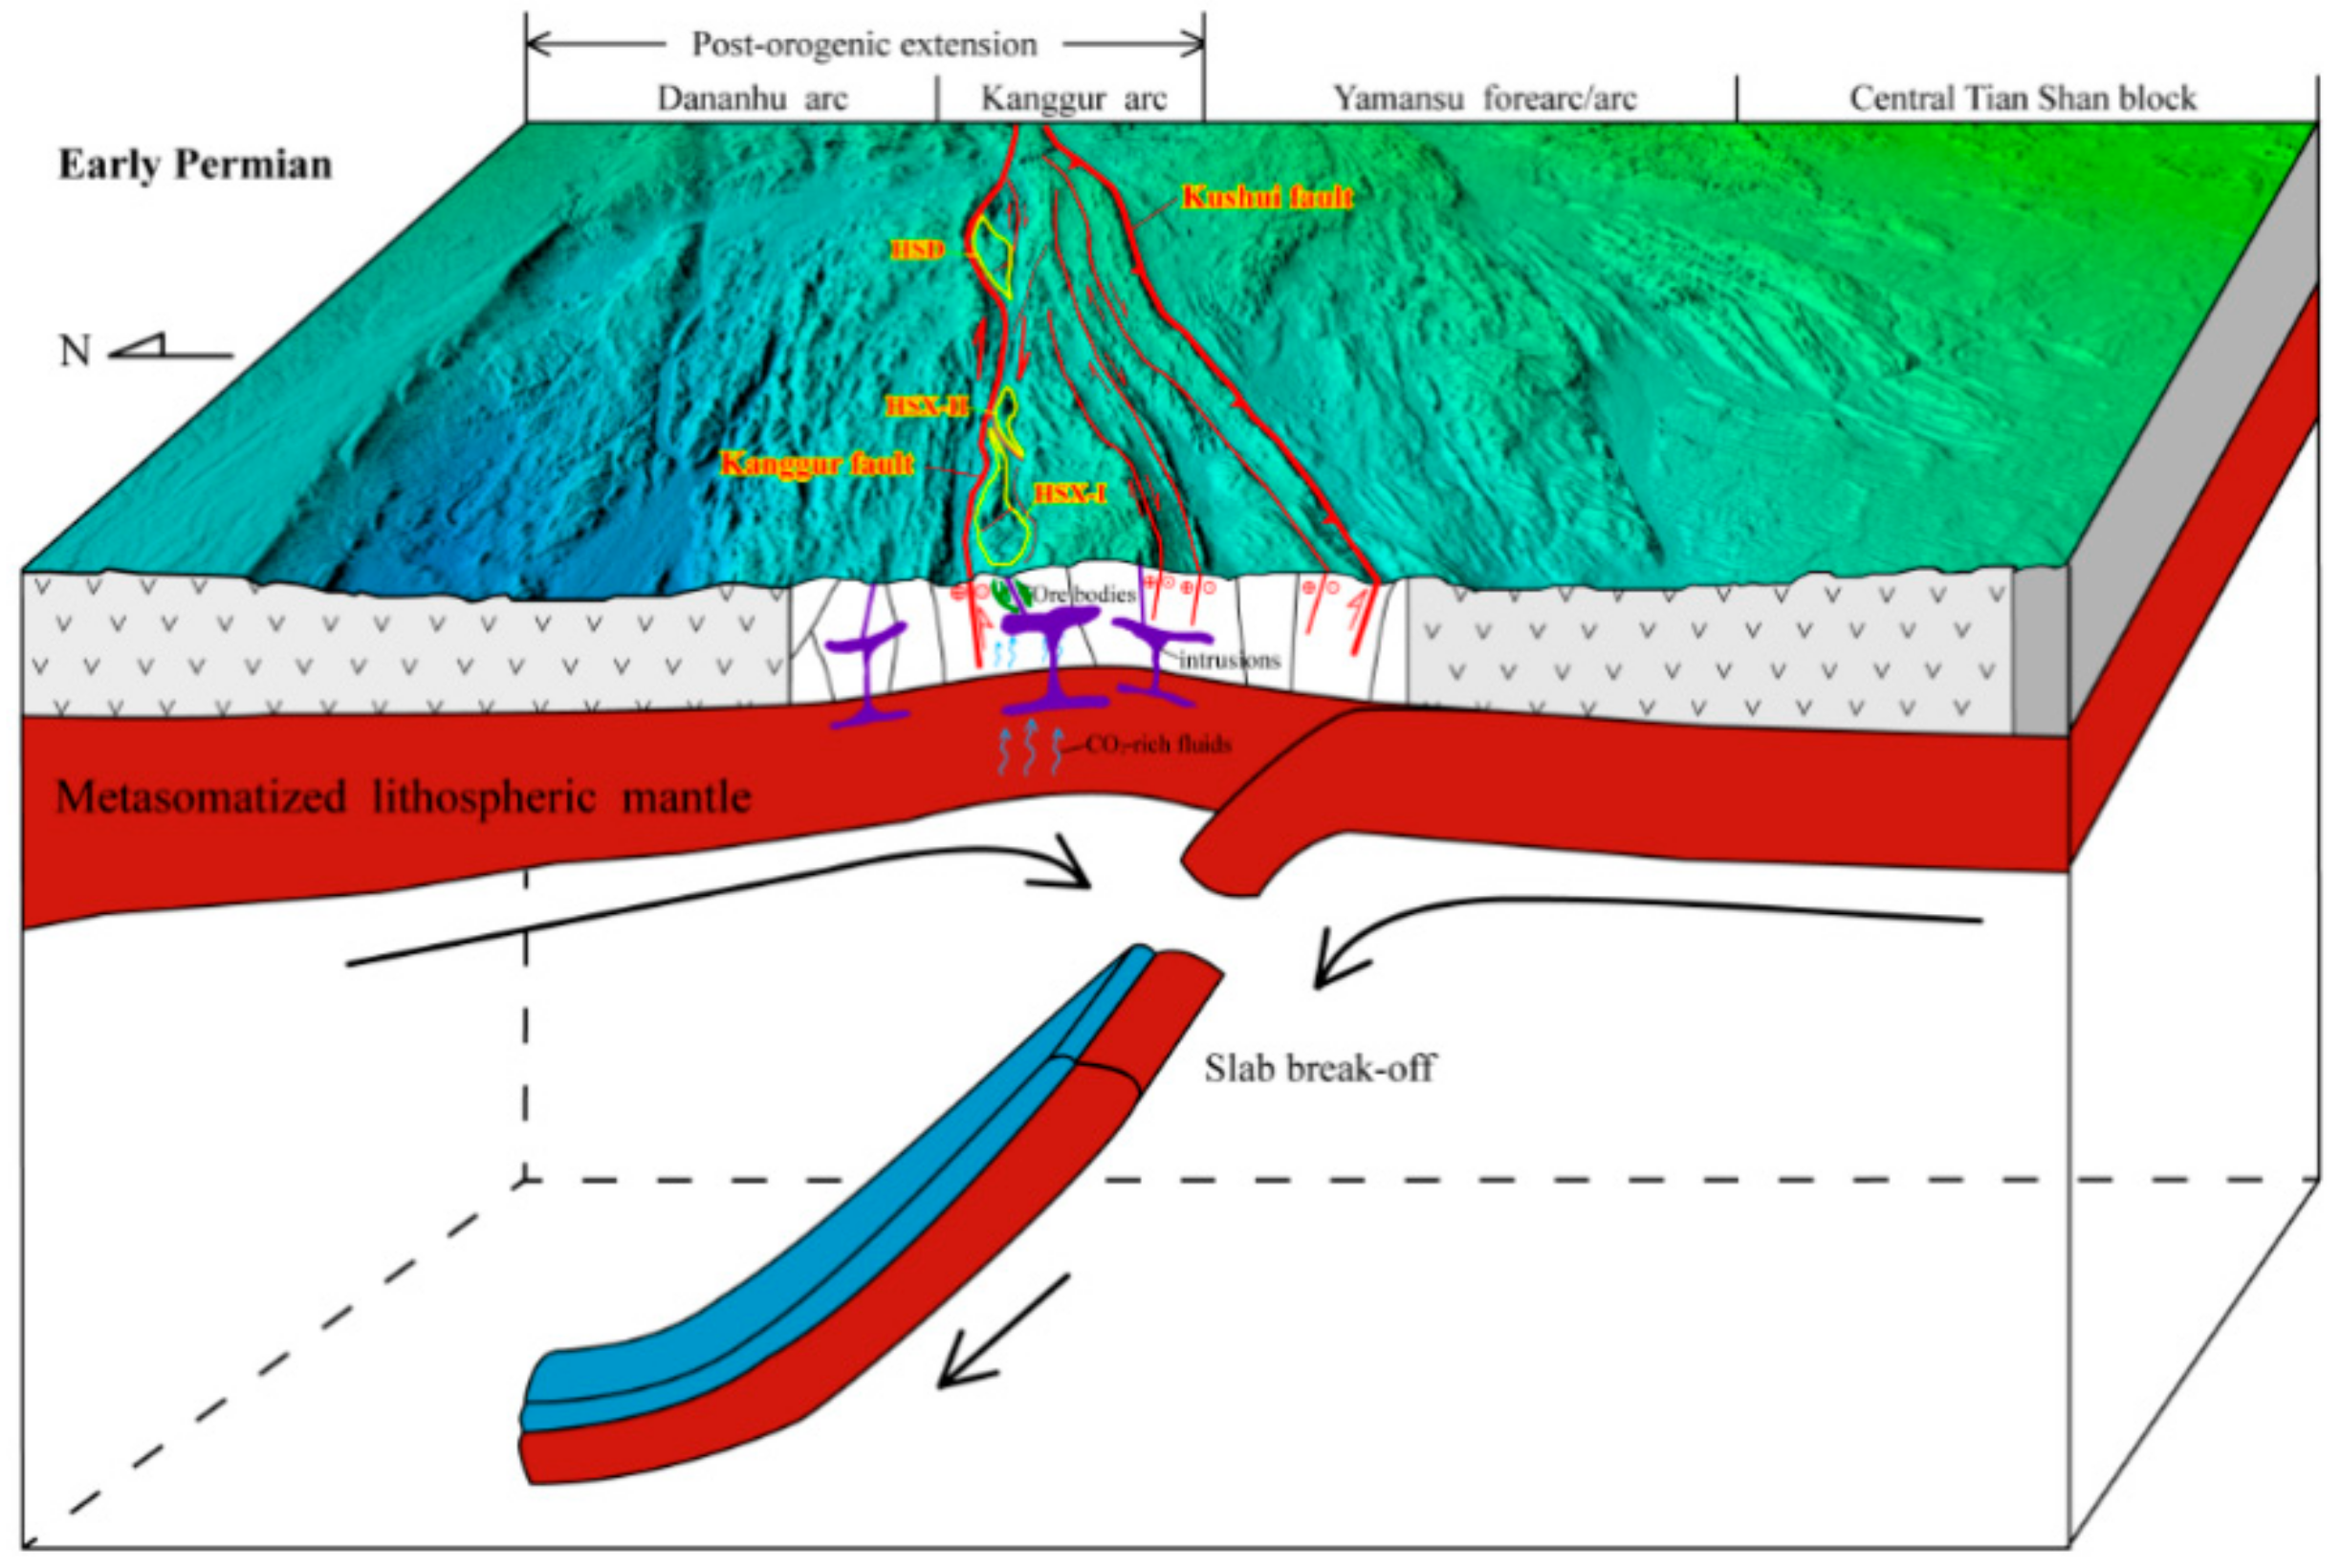
5.2. Discussion
6. Conclusions
Author Contributions
Funding
Informed Consent Statement
Data Availability Statement
Conflicts of Interest
References
- Chen, Y.J.; Pirajno, F.; Wu, G. Epithermal deposits in North Xinjiang, NW China. Int. J. Earth Sci. 2012, 101, 889–917. [Google Scholar] [CrossRef]
- Deng, J.; Wang, Q.F.; Li, G.J. Cenozoic tectono-magmatic and metallogenic processes in the Sanjiang region, southwestern China. Earth-Sci. Rev. 2014, 138, 268–299. [Google Scholar] [CrossRef]
- Qin, K.; Fang, T.; Wang, S.; Zhu, B.; Feng, Y.; Yu, H.; Xiu, Q. Plate tectonics division, evolution and metallogenic settings in eastern Tianshan mountains, NW-China. Xinjiang Geol. 2002, 20, 302–308. (In Chinese) [Google Scholar]
- Qin, K.; Peng, X.; San, J.; Xu, X.; Fang, T.; Wang, S.; Yu, H. Types of major ore deposits, division of metallogenic belts in east-ern Tianshan, and discrimination of potential prospects of Cu, Au, Ni mineralization. Xinjiang Geol. 2003, 21, 143–150. (In Chinese) [Google Scholar]
- Mao, J.; Goldfarb, R.J.; Wang, Y.; Hart, C.J.; Wang, Z.; Yang, J. Late Paleozoic base and precious metal deposits, East Tianshan, Xinjiang, China: Characteristics and geodynamic setting. Episodes 2005, 28, 23–36. [Google Scholar] [CrossRef] [Green Version]
- Qin, K.; Zhang, L.; Xiao, W.; Xu, X.; Yan, Z.; Mao, J. Overview of major Au, Cu, Ni and Fe deposits and metallogenic evolution of theastern Tianshan Mountains, northwestern China. In Tectonic Evolution and Metallogeny of the Chinese Altay and Tianshan; IAGOD Guidebook Series; Natural History Museum of Landon: London, UK, 2003; Volume 10, pp. 227–249. [Google Scholar]
- Xiao, W.; Kroner, A.; Windley, B. Geodynamic evolution of Central Asia in the Paleozoic and Mesozoic. Int. J. Earth Sci. 2009, 98, 1185–1188. [Google Scholar] [CrossRef]
- Xiao, W.; Kusky, T.; Safonova, I.; Seltmann, R.; Sun, M. Tectonics of the Central Asian Orogenic Belt and its Pacific analogues (Editorial). J. Asian Earth Sci. 2015, 113, 1–6. [Google Scholar] [CrossRef]
- Xu, B.; Charvet, J.; Chen, Y.; Zhao, P.; Shi, G. Middle Paleozoic convergent orogenic belts in western Inner Mongolia (China): Framework, kinematics, geochronology and implications for tectonic evolution of the Central Asian Orogenic Belt. Gondwana Res. 2013, 23, 1342–1364. [Google Scholar] [CrossRef] [Green Version]
- Borisenko, A.S.; Sotnikov, V.I.; Izokh, A.E.; Polyakov, G.V.; Obolensky, A.A. Permo-Triassic mineralization in Asia and its relation to plume magmatism. Russ. Geol. Geophys. 2006, 47, 166–182. [Google Scholar]
- Han, C.; Xiao, W.; Zhao, G.; Ao, S.; Zhang, J.; Qu, W.; Du, A. In-situ U-Pb, Hf and Re-Os isotopic analyses of the Xiangshan Ni-Cu-Co deposit in Eastern Tianshan (Xinjiang), Central Asia Orogenic Belt: Constraints on the timing and genesis of the mineralization. Lithos 2010, 120, 547–562. [Google Scholar] [CrossRef]
- Li, D.; Zhang, L.; Chen, H.; Hollings, P.; Cao, M.; Fang, J.; Wang, C.; Lu, W. Geochronology and geochemistry of the high Mg dioritic dikes in Eastern Tianshan, NW China: Geochemical features, petrogenesis and tectonic implications. J. Asian Earth Sci. 2016, 115, 442–454. [Google Scholar] [CrossRef]
- Pirajno, F.; Seltmann, R.; Yang, Y. A review of mineral systems and associated tectonic settings of northern Xinjiang, NW China. Geosci. Front. 2011, 2, 157–185. [Google Scholar] [CrossRef] [Green Version]
- Qin, K.; Su, B.; Sakyi, P.A.; Tang, D.; Li, X.; Sun, H.; Xiao, Q.; Liu, P. SIMS zircon U-Pb geochronology and Sr-Nd isotopes of Ni-Cu-Bearing Mafic-Ultramafic Intrusions in Eastern Tianshan and Beishan in correlation with flood basalts in Tarim Basin (NW China): Constraints on a ca.280 Ma mantle plume. Am. J. Sci. 2011, 311, 237–260. [Google Scholar] [CrossRef]
- Zhang, Z.; Hong, W.; Jiang, Z.; Duan, S.; Li, F.; Shi, F. Geological characteristics and metallogenesis of iron deposits in west-ern Tianshan, China. Ore Geol. Rev. 2014, 57, 425–440. [Google Scholar] [CrossRef]
- Zheng, J.; Mao, J.; Yang, F.; Liu, F.; Zhu, Y. The post-collisional Cihai iron skarn deposit, eastern Tianshan, Xinjiang, China. Ore Geol. Rev. 2015, 67, 244–254. [Google Scholar] [CrossRef]
- Fu, B.; Zheng, G.; Ninomiya, Y.; Wang, C.; Sun, G. Mapping hydrocarbon-induced mineralogical alteration in the northern Tian Shan using ASTER multispectral data. Terra Nova 2007, 19, 225–231. [Google Scholar] [CrossRef]
- Liu, L.; Zhou, J.; Han, L.; Xu, X. Mineral mapping and ore prospecting using Landsat TM and Hyperion data, Wushitala, Xinjiang, northwestern China. Ore Geol. Rev. 2017, 81, 280–295. [Google Scholar] [CrossRef]
- Liu, L.; Zhou, J.; Jiang, D.; Zhuang, D.; Mansaray, L.R.; Hu, Z.; Ji, Z. Mineral resources prospecting by synthetic appli-cation of TM/ETM+, Quickbird and Hyperion data in the Hatu area, West Junggar, Xinjiang, China. Sci. Rep. 2016, 6, 21851. [Google Scholar] [CrossRef] [Green Version]
- Shi, P.; Fu, B.; Ninomiya, Y.; Sun, J.; Li, Y. Multispectral remote sensing mapping for hydrocarbon seepage-induced lithologic anomalies in the Kuqa foreland basin, south Tian Shan. J. Asian Earth Sci. 2012, 46, 70–77. [Google Scholar] [CrossRef]
- Zheng, S.; Fu, B.H. Lithological mapping of granitoids in the western Junggar from ASTER SWIR-TIR multispectral data: Case study in Karamay pluton, Xinjiang. Acta Petrol. Sin. 2013, 29, 2936–2948. (In Chinese) [Google Scholar]
- Abrams, M. The Advanced Space borne Thermal Emission and Reflection Radiometer (ASTER): Data products for the high spatial resolution imager on NASA’s Terra platform. Int. J. Remote Sens. 2000, 21, 847–859. [Google Scholar] [CrossRef]
- Yamaguchi, Y.; Fujisada, H.; Kudoh, M.; Kawakami, T.; Tsu, H.; Kahle, A.B.; Pniel, M. ASTER instrument characterization and operation scenario. Adv. Space Res. 1999, 23, 1415–1424. [Google Scholar] [CrossRef]
- Yamaguchi, Y.; Fujisada, H.; Kahle, A.B.; Tsu, H.; Kato, M.; Watanabe, H.; Sato, I.; Kudoh, M. ASTER instrument perfor-mance, operation status and application to Earth sciences. In Proceedings of the IEEE International Geosciences and Remote Sensing Symposium, Sydney, Australia, 9–13 July 2001; Volume 3, pp. 1215–1216. [Google Scholar]
- Fu, H.; Fu, B.; Ninomiya, Y.; Shi, P. New Insights of Geomorphologic and Lithologic Features on Wudalianchi Volcanoes in the Northeastern China from the ASTER Multispectral Data. Remote Sens. 2019, 11, 2663. [Google Scholar] [CrossRef] [Green Version]
- Ninomiya, Y. Mapping quartz, carbonate minerals, and mafic-ultramafic rocks using remotely sensed multispectral thermal infrared ASTER data. Proc. SPIE 2002, 4710, 191–202. [Google Scholar]
- Ninomiya, Y.; Fu, B.; Cudahy, T.J. Detecting lithology with Advanced Spaceborne Thermal Emission and Reflection Radi-ometer (ASTER) multispectral thermal infrared “radiance-at-sensor” data. Remote Sens. Environ. 2005, 99, 127–139. [Google Scholar] [CrossRef]
- Emam, B.; Zoheir, B.; Johnson, P. ASTER-based mapping of ophiolitic rocks: Examples from the Allaqi-Heiani suture, SE Egypt. Int. Geol. Rev. 2015, 58, 525–539. [Google Scholar] [CrossRef]
- Abrams, M.; Yamaguchi, Y. Twenty Years of ASTER Contributions to Lithologic Mapping and Mineral Exploration. Remote Sens. 2019, 11, 1394. [Google Scholar] [CrossRef] [Green Version]
- Amer, R.; Mezayen, A.E.; Hasanein, M. ASTER spectral analysis for alteration minerals associated with gold mineralization. Ore Geol. Rev. 2016, 75, 239–251. [Google Scholar] [CrossRef]
- Dehnavi, A.G.; Sarikhani, R.; Nagaraju, D. Image processing and analysis of mapping alteration zones in environmental re-search, East of Kurdistan, Iran. World Appl. Sci. J. 2010, 11, 278–283. [Google Scholar]
- Gabr, S.; Ghulam, A.; Kusky, T. Detecting areas of high-potential gold mineralization using ASTER data. Ore Geol. Rev. 2010, 38, 59–69. [Google Scholar] [CrossRef]
- Pour, A.B.; Hashim, M. The application of ASTER remote sensing data to porphyry copper and epithermal gold deposits. Ore Geol. Rev. 2012, 44, 1–9. [Google Scholar] [CrossRef] [Green Version]
- Son, Y.S.; Kang, M.K.; Yoon, W.J. Lithological and mineralogical survey of the Oyu Tolgoi region, Southeastern Gobi, Mongolia using ASTER reflectance and emissivity data. Int. J. Appl. Earth Obs. Geoinf. 2014, 26, 205–216. [Google Scholar] [CrossRef]
- Rowan, L.C.; Mars, J.C.; Simpson, C.J. Lithologic mapping of the Mordor, NT, Australia ultramafic complex by using the Advanced Spaceborne Thermal Emission and Reflection Radiometer (ASTER). Remote Sens. Environ. 2005, 99, 105–126. [Google Scholar] [CrossRef]
- Kumar, P.S. An alternative kinematic interpretation of Thetis Boundary Shear Zone, Venus: Evidence for strike-slip ductile duplexes. J. Geophys. Res. 2005, 110, e07001. [Google Scholar] [CrossRef] [Green Version]
- Corsini, M.; Vauchez, A.; Caby, R. Ductile duplexing at a bend of a continental-scale strike-slip shear zone: Example from NE Brazil. J. Struct. Geol. 1996, 18, 385–394. [Google Scholar] [CrossRef]
- Wan, B.; Xiao, W.; Zhang, L.; Han, C. Iron mineralization associated with a major strike-slip shear zone: Radiometric and oxygen isotope evidence from the Mengku deposit, NW China. Ore Geol. Rev. 2012, 44, 136–147. [Google Scholar] [CrossRef]
- Spacapan, J.B.; Galland, O.; Leanza, H.A.; Planke, S. Control of strike-slip fault on dyke emplacement and morphology. J. Geol. Soc. 2015, 173, 573–576. [Google Scholar] [CrossRef]
- Lopez Moro, F.J.; Romer, R.L.; Rhede, D.; Fernandez, A.; Timon-Sanchez, S.M.; Moro, M.C. Early uranium mobilization in late Variscan strike slip shear zones affecting leucogranites of central western Spain. J. Iber. Geol. 2018, 45, 223–243. [Google Scholar] [CrossRef]
- Sylvester, A.G. Strike-slip faults. Geol. Soc. Am. Bull. 1988, 100, 1666–1703. [Google Scholar] [CrossRef]
- Yannick, B.; Gumiaux, C.; Sizaret, S.; Barbanson, L.; Wang, B.; Cluzel, D.; Li, G.; Delaunay, A. Synkinematic mafic/ultramafic sheeted intrusions: Emplacement mechanism and strain restoration of the Permian Huangshan Ni-Cu ore belt (Eastern Tianshan, NW China). J. Asian Earth Sci. 2012, 56, 240–257. [Google Scholar] [CrossRef] [Green Version]
- Zhang, L.; Qin, K.; Xiao, W. Multiple mineralization events in the eastern Tianshan district, NW China: Isotopic geochronology and geological significance. J. Asian Earth Sci. 2008, 32, 236–246. [Google Scholar] [CrossRef]
- Zhou, M.F.; Michael, L.C.; Yang, Z.; Li, J.; Sun, M. Geochemistry and petrogenesis of 270 Ma Ni-Cu-(PGE) sulfide-bearing mafic intrusions in the Huangshan district, Eastern Xinjiang, Northwest China: Implications for the tectonic evolution of the Central Asian orogenic belt. Chem. Geol. 2004, 209, 233–257. [Google Scholar] [CrossRef]
- Mao, J.; Pirajno, F.; Zhang, Z.; Chai, F.; Wu, H.; Chen, S.; Cheng, L.; Yang, J.; Zhang, C. A review of the Cu-Ni sulphide de-posits in the Chinese Tianshan and Altay orogens (Xinjiang Autonomous Region, NW China): Principal characteristics and ore-forming processes. J. Asian Earth Sci. 2008, 32, 184–203. [Google Scholar] [CrossRef]
- Wang, Y.; Li, J.; Sun, G. Postcollisional Eastward Extrusion and Tectonic Exhumation along the Eastern Tianshan Orogen, Central Asia: Constraints from Dextral Strike-Slip Motion and 40Ar=39Ar Geochronological Evidence. J. Geol. 2008, 116, 599–618. [Google Scholar] [CrossRef]
- Charvet, J.; Shu, L.S.; Laurent, C.S. Palaeozoic structural and geodynamic evolution of eastern Tianshan (NW China): Welding of the Tarim and Junggar plates. Episodes 2007, 30, 162–186. [Google Scholar]
- Wang, B.; Dominique, C.; Jahn, B.; Shu, L.; Chen, Y.; Zhai, Y.; Branquet, Y.; Barbanson, L.; Sizaret, S. Late Paleozoic pre- and syn-kinematic plutons of the Kanggur–Huangshan shear zone; inference on the tectonic evolution of the eastern Chinese north Tianshan. Am. J. Sci. 2014, 314, 1–37. [Google Scholar] [CrossRef]
- Wang, B.; Chen, Y.; Zhan, S.; Shu, L.; Faure, M.; Cluzel, D.; Charvet, J. Primary Carboniferous and Permian paleomagnetic results from the Yili Block (NW China) and their implications on the geodynamic evolution of Chinese Tianshan Belt. Earth Planet. Sci. Lett. 2007, 263, 288–308. [Google Scholar] [CrossRef] [Green Version]
- Hunt, G.R. Spectral signatures of particulate minerals in the visible and near infrared. Geophysics 1977, 42, 501–513. [Google Scholar] [CrossRef] [Green Version]
- Hunt, G.R.; Ashley, R.P. Spectra of altered rocks in the visible and near infrared. Econ. Geol. 1979, 74, 1613–1629. [Google Scholar] [CrossRef]
- Clark, R.N. Spectroscopy of rocks and minerals, and principles of spectroscopy. In Remote Sensing for the Earth Sciences: Manual of Remote Sensing; Rencz, A.N., Ed.; John Wiley & Sons, Inc.: Hoboken, NJ, USA, 1999; Volume 3. [Google Scholar]
- Xinjiang Bureau of Geology and Mineral Resources. Geological Map of Xinjiang Uygur Autonomous Region, Scale 1:2,000,000; Geological Publishing House: Beijing, China, 1992. [Google Scholar]
- Deng, Y.F.; Song, X.Y.; Hollings, P.; Zhou, T.; Yuan, F.; Chen, L.M.; Zhang, D. Role of asthenosphere and lithosphere in the genesis of the Early Permian Huangshan mafic–ultramafic intrusion in the Northern Tianshan, NW China. Lithos 2015, 227, 241–254. [Google Scholar] [CrossRef]
- Groves, D.I.; Bierlein, F.P. Geodynamic settings of mineral deposit systems. J. Geol. Soc. 2007, 164, 19–30. [Google Scholar] [CrossRef]
- Naldrett, A.J. World-class Ni-Cu-PGE deposits: Key factors in their genesis. Miner. Depos. 1999, 34, 227–240. [Google Scholar] [CrossRef]
- Wang, B.; Cluzel, D.; Shu, L.S.; Faure, M.; Charvet, J.; Chen, Y.; Meffre, S.; De Jong, K. Evolution of calc-alkaline to alkaline magmatism through Carboniferous convergence to Permian transcurrent tectonics, western Chinese Tianshan. Int. J. Earth Sci. 2009, 98, 1275–1298. [Google Scholar] [CrossRef]
- Zhang, L.; Xiao, W.; Qin, K.; Sun, S.; Ji, J.; Yang, X. Types, geological features and geodynamic significances of gold-copper deposits in the Kanggurtag metallogenic belt, eastern Tianshan, NW China. Int. J. Earth Sci. 2004, 93, 224–240. [Google Scholar] [CrossRef]
- Han, C.; Xiao, W.; Zhao, G.; Mao, J.; Li, S.; Yan, Z.; Mao, Q. Major types, characteristics and geodynamic mechanism of Up-per Paleozoic copper deposits in northern Xinjiang, northwestern China. Ore Geol. Rev. 2006, 28, 308–328. [Google Scholar] [CrossRef]
- Xiao, W.; Zhang, L.; Qin, K.; Sun, S.; Li, J. Paleozoic accretionary and collisional tectonics of the eastern Tianshan (China): Implications for the continental growth of central Asia. Am. J. Sci. 2004, 304, 370–395. [Google Scholar] [CrossRef] [Green Version]
- Zhu, X.; He, J.; Xiao, J.; Wang, X. Uniform slip rates of the Altyn Tagh and the Kunlun faults likely reflect lateral variation of frictional strength of the faults. Terra Nova 2020, 32, 381–389. [Google Scholar] [CrossRef]
- Trifonov, V.G.; Korzhenkov, A.M.; Omar, K.M. Recent geodynamics of major strike-slip zones. Geod. Geodyn. 2015, 6, 361–383. [Google Scholar] [CrossRef] [Green Version]
- Xu, Z.; Wang, Q.; Cai, Z.; Dong, H.; Li, H.; Chen, X.; Duan, X.; Cao, H.; Li, J.; Burg, J.P. Kinematics of the Tengchong Ter-rane in SE Tibet from the late Eocene to early Miocene: Insights from coeval mid-crustal detachments and strike-slip shear zones. Tectonophysics 2015, 665, 127–148. [Google Scholar] [CrossRef] [Green Version]


Publisher’s Note: MDPI stays neutral with regard to jurisdictional claims in published maps and institutional affiliations. |
© 2021 by the authors. Licensee MDPI, Basel, Switzerland. This article is an open access article distributed under the terms and conditions of the Creative Commons Attribution (CC BY) license (http://creativecommons.org/licenses/by/4.0/).
Share and Cite
Zheng, S.; An, Y.; Shi, P.; Zhao, T. Mapping the Lithological Features and Ore-Controlling Structures Related to Ni–Cu Mineralization in the Eastern Tian Shan, NW China from ASTER Data. Remote Sens. 2021, 13, 206. https://0-doi-org.brum.beds.ac.uk/10.3390/rs13020206
Zheng S, An Y, Shi P, Zhao T. Mapping the Lithological Features and Ore-Controlling Structures Related to Ni–Cu Mineralization in the Eastern Tian Shan, NW China from ASTER Data. Remote Sensing. 2021; 13(2):206. https://0-doi-org.brum.beds.ac.uk/10.3390/rs13020206
Chicago/Turabian StyleZheng, Shuo, Yanfei An, Pilong Shi, and Tian Zhao. 2021. "Mapping the Lithological Features and Ore-Controlling Structures Related to Ni–Cu Mineralization in the Eastern Tian Shan, NW China from ASTER Data" Remote Sensing 13, no. 2: 206. https://0-doi-org.brum.beds.ac.uk/10.3390/rs13020206