
Visual Digital Forest Model Based on a Remote Sensing Data and Forest Inventory Data
by
Marsel Vagizov R.
1,*, 
Eugenie Istomin P.
2,
Valerie Miheev L.
3,
Artem Potapov P.
1 and
Natalya Yagotinceva V.
2 1
Department of Information Systems and Technologies, Institute Forest and Nature Management, St. Petersburg State Forest Technical University, 5 Institutskiy Lane, 194021 St. Petersburg, Russia
2
Department of Applied Computer Science, Institute of Information Systems and Geotechnologies, Russian State Hydrometeorological University, 79 Voronezhskaya Street, 192007 St. Petersburg, Russia
3
Faculty of Maritime and Polar Law, Russian State Hydrometeorological University, 79 Voronezhskaya Street, 192007 St. Petersburg, Russia
*
Author to whom correspondence should be addressed.
Remote Sens. 2021, 13(20), 4092; https://0-doi-org.brum.beds.ac.uk/10.3390/rs13204092
Submission received: 7 September 2021
/
Revised: 7 October 2021
/
Accepted: 8 October 2021
/
Published: 13 October 2021
(This article belongs to the Topic High-Resolution Earth Observation Systems, Technologies, and Applications)
Abstract
:This article discusses the process of creating a digital forest model based on remote sensing data, three-dimensional modeling, and forest inventory data. Remote sensing data of the Earth provide a fundamental tool for integrating subsequent objects into a digital forest model, enabling the creation of an accurate digital model of a selected forest quarter by using forest inventory data in educational and experimental forestry, and providing a valuable and extensive database of forest characteristics. The formalization and compilation of technologies for connecting forest inventory databases and remote sensing data with the construction of three-dimensional tree models for a dynamic display of changes in forests provide an additional source of data for obtaining new knowledge. The quality of forest resource management can be improved by obtaining the most accurate details of the current state of forests. Using machine learning and regression analysis methods as part of a digital model, it is possible to visually assess the course of planting growth, changes in species composition, and other morphological characteristics of forests. The goal of digital, interactive forest modeling is to create virtual simulations of the future status of forests using a combination of predictive forest inventory models and machine learning technology. The research findings provide a basic idea and technique for developing local digital forest models based on remote sensing and data integration technologies.
1. Introduction
Digital geomodeling of forests is the next step in developing displays of spatial–temporal forest data. Forestry requires improvements in forest management quality, as well as in the information about forest resources. Detailing a specific forest object by displaying its certain subject-true properties is one of the elements of improving the quality of information display. Chinese scientists introduced the idea of digital forestry [1], and the concept of the synergistic application of computationally demanding quantitative methodologies and information technology was proposed.
Thematic forest maps, forest management plans, afforestation plans, and inventory descriptions are now the key elements of spatial data visualization of Russia’s forest management system. However, this information, in its technical form, only provides broad forest information and features. The formation of new models for making management decisions has been described in various studies [2,3,4,5]. When a person completes a forest inventory task, the subjective aspect must be considered when evaluating taxation features. The forest inventory stand is the smallest accounting unit in a forest inventory; it is a uniformly composed and shaped item that does not represent a precise number of trees in a stand, impacting the correct evaluation of forests. When analyzing a forest inventory stand, it is difficult to address the following issues:
- How to determine the number of trunks and species diversity of trees within a forest inventory unit with a complex structure—the fundamental goal of forest inventory is to determine the correct number of trunks and various tree species, since this impacts the plantation material and monetary worth.
- How the trees are exactly located in space—this can aid in the division of forests into territorial units (forest stands), as well as the development of forest roads and other linear (power transmission lines, railways, highways) and nonlinear (forest park (recreational) zones. It will also aid in the use of nontimber forest products, which are materially justified in comparison to timber products under Russian conditions.
- How the underlying surface or forest type can be displayed—the categorization of forestry helps us to identify which forest felling technique may be used in a particular forest stand and to indirectly determine the stand’s production and quality (quality and marketability class).
Various forms of forest modeling and their features have now been described in research papers due to modern technological advancements. Creating an accurate digital forest model will help forestry professionals to more carefully approach the process of forest analysis [6,7,8], and models based on remote sensing data will allow forestry specialists to answer higher-level questions. Today, complicated, multi-parameter issues are solved using digital simulation methods. Detailed modeling will help enhance forest resource management quality by allowing professionals to examine, evaluate, and organize data on a specific forest area: a model object [9,10,11,12].
Before software and hardware development and the general improvement in computer performance, the presentation of precise and comprehensive geographic forest information was not possible. Computer processing power was also insufficient to provide three-dimensional displays. At the present stage of the development of computer technology, it is possible and urgently necessary to switch to refined and detailed representations of the characteristics of forests for the digitalization of the economy. In this regard, developing a model based on physical, morphological, and inventory data of forests has become possible. The use of data from local digital forest models, a collection of natural forest characteristics, aims to improve forest management and provide better knowledge of the ecosystem features that flow in forests. Studies [13,14,15] have shown the fundamental ideas of digital modeling, allowing us to apply their knowledge to our research.
The main stages of creating a model are the digital geomodeling of forests, which includes processing of remote sensing data; creating and exporting a specific forest area (forest inventory stand, block); creating a three-dimensional model of a forest area; drawing objects in a selected area; creating site relief on the elevation map; filling it with attributive data. These are essentially the first and most important steps in creating a digital forest model. The maximum number of physical characteristics simulated in the software environment should be reflected in a comprehensive digital forest model. This will allow for the most in-depth analysis of forest dynamics and for the identification of novel patterns of mutually influencing factors [16,17,18,19]. The silvicultural features of the modeling object (forest type, forest inventory characteristics, and specific sizes of tree species) should be displayed in the improved digital forest model. The model may be parameterized and improved by being continually filled with dynamic properties and presenting climatic factors in real-time.
2. Study Area and Data
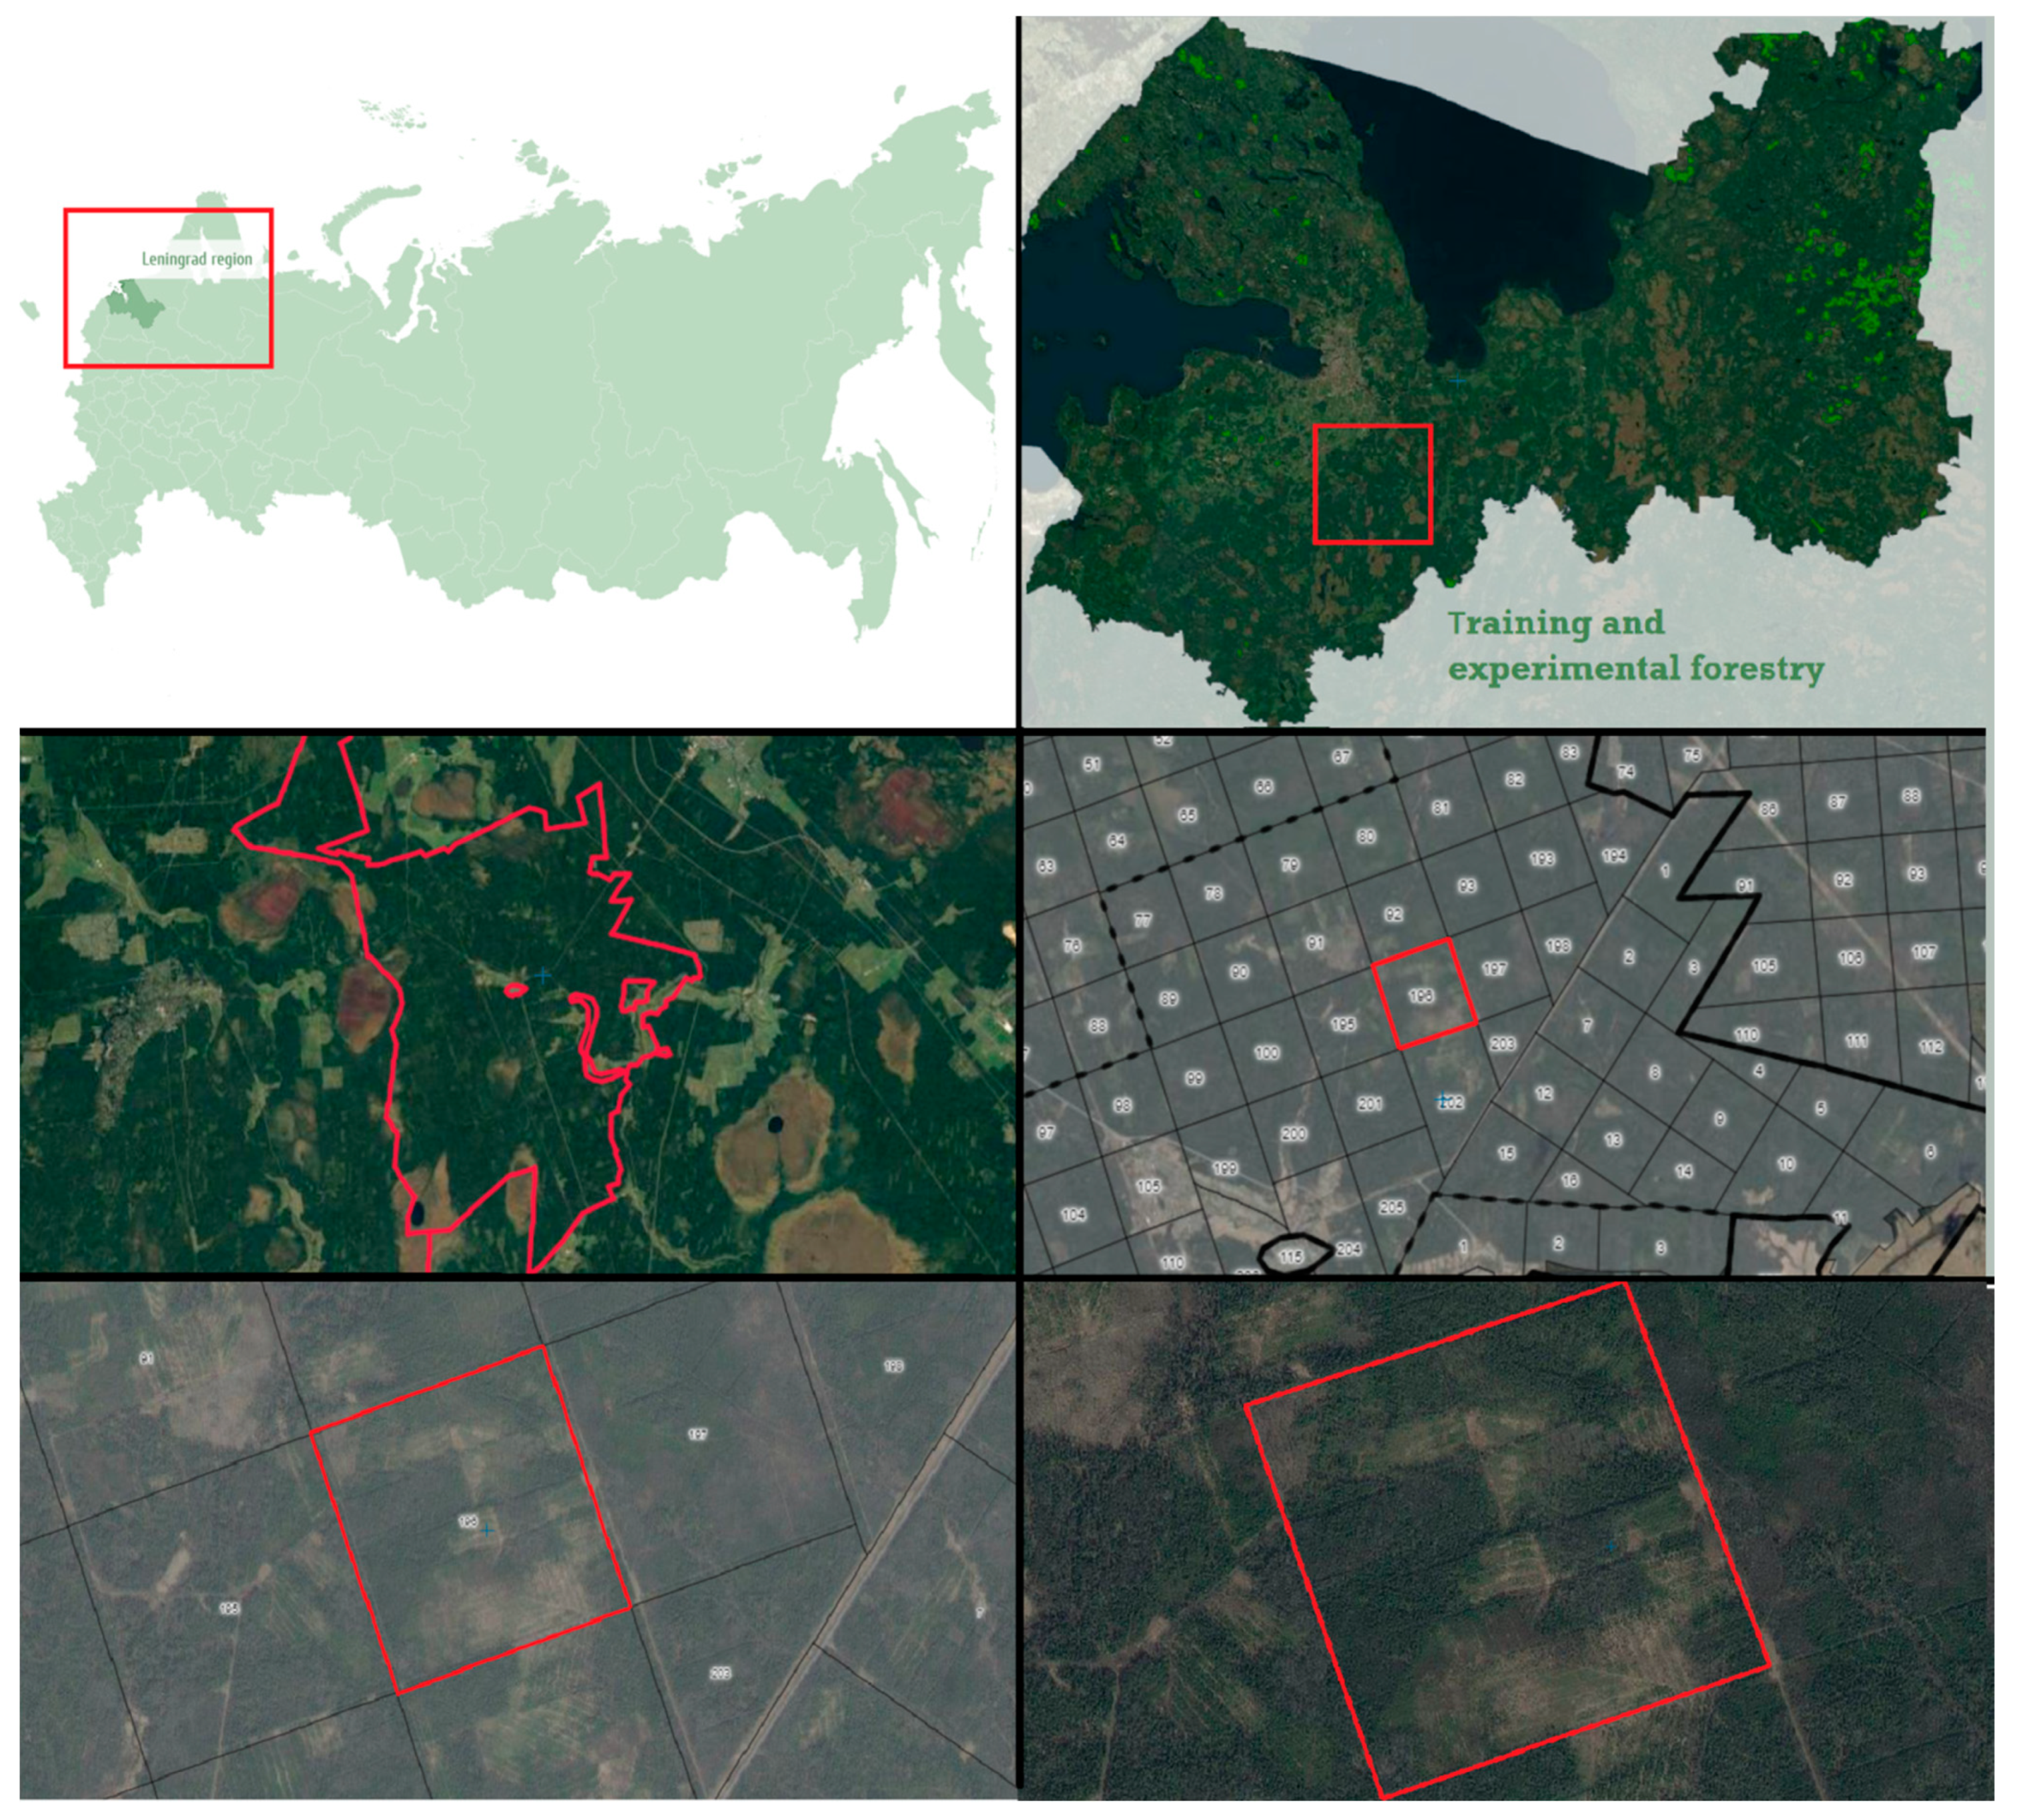
The object of our research is Russia’s oldest training and experimental forest, located in Tosnensky District, Leningrad Oblast, a part of the St. Petersburg State Forestry University named after S. M. Kirov, with an open forest area of 122 ha in quarter 1 (block No. 196) (Figure 1). We selected this site due to being the most diverse in structure and composition, based on visual interpretation of remote sensing data and its complex spatial structure of tree arrangement, making the subsequent modeling process interesting. Notably, forest inventory descriptions of these quarters were completed in 2005, allowing for further use of these data in the development of a digital forest model.
We selected block 196 as the subject of our modeling; this is a diverse area with forested sections and parts where trees have been felled. The materials were collected using an open web-mapping service (the high conservation value forest (HCVF) mapping service supported by the World Wildlife Fund (WWF)). We used images with high spatial resolution. To determine the boundaries of the forest block, data from Google Earth and from the HCVF service provided by Scanex were used. The provider of remote sensing data with an open license is Digital Globe. The pictures were taken in the summer of 2013, the resolution of the satellite is 0.6 m, and the synthesis is natural colors (RGB).
The technology of the modeling process consisted of the implementation of the main stages of study. The main steps are the following:
- Importing data into a graphics environment;
- Identifying the area covered by forest and creating a weight map;
- Fixing the capture points of the location of trees in space;
- Implementing and overlaying primary tree models;
- Combining remote sensing data and three-dimensional objects;
- Developing a detailed forest model based on the first created model.
3. Materials and Methods
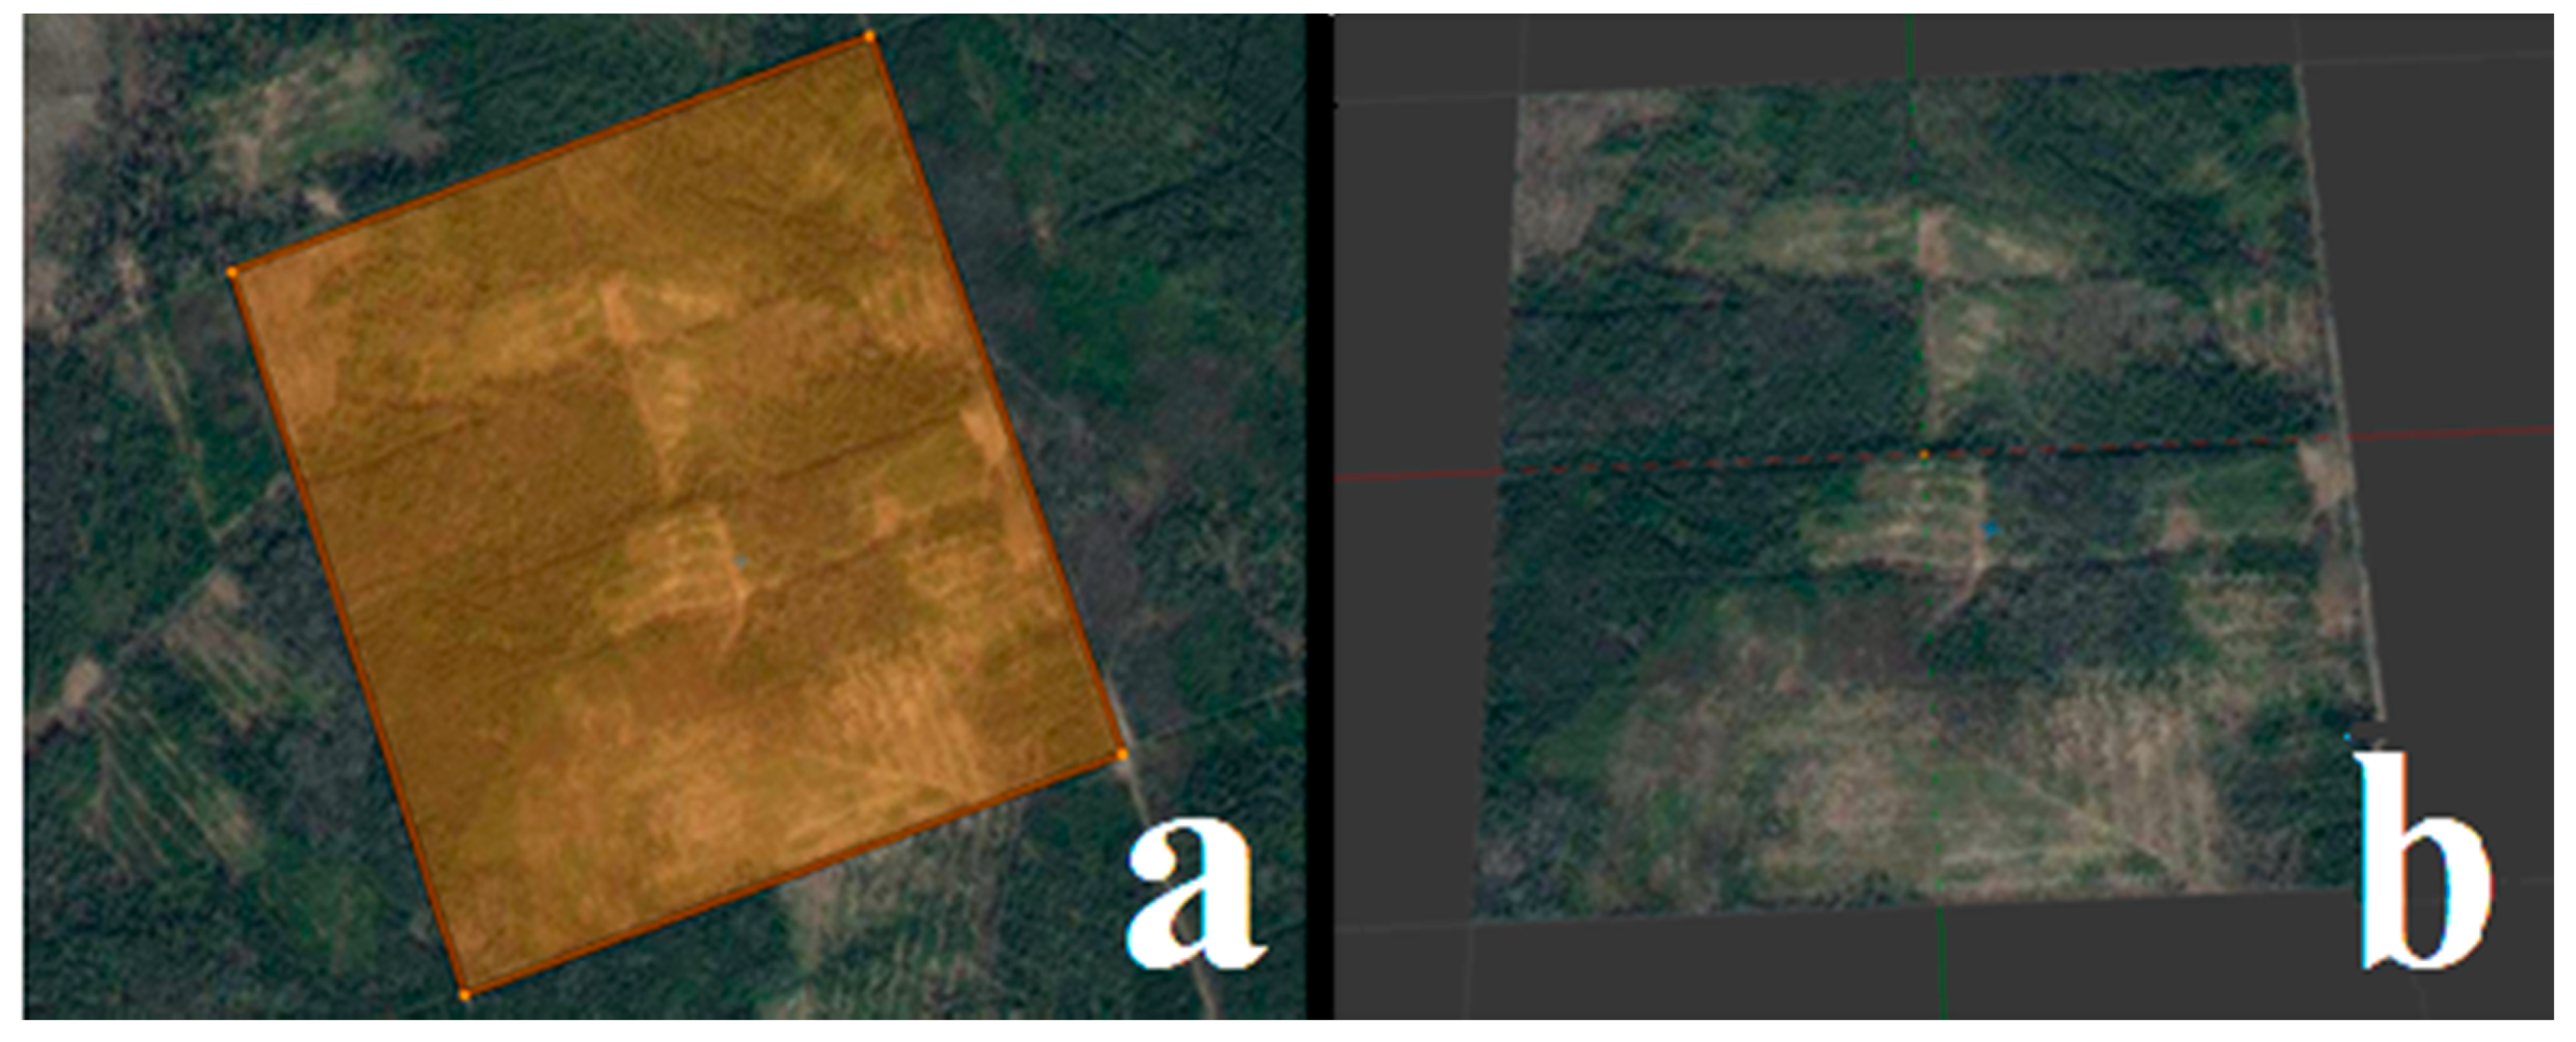
The graphic editor Blender was used as a tool for processing and creating a dynamic map. The data were imported to the 3D editor Blender. The initial design step was to create the UV mapping. The absence of major hydrological objects in the specified area of the site facilitated modeling. In the forest management system, developed woodlands are divided into quarters, with each quarter serving as an administrative-territorial unit. UV mapping can be performed with a clean square. As the digital forest model will be an administrative-territorial unit, the selected region was restricted and fragmented to implement stage 1 (Figure 2).
Blender has a UV transform function; UV transform or unfolding in three-dimensional graphics (UV-map) is the correspondence between the coordinates on the surface of a three-dimensional object (X,Y,Z) and coordinates on a texture (U,V). The U and V values usually range from 0 to 1. We proceeded to create a weight map using UV transform after refining and selecting the forest-covered area.
The simple geomodeling object shape allowed us to subdivide the surface using the Subdivision Surface tool. The number of cuts was 101. When using the Scales to distribute trees, this value is required for the most accurate results. The surface was divided into subdivisions, yielding 42,000 vertices, allowing for the most precise arrangement of tree species in space.
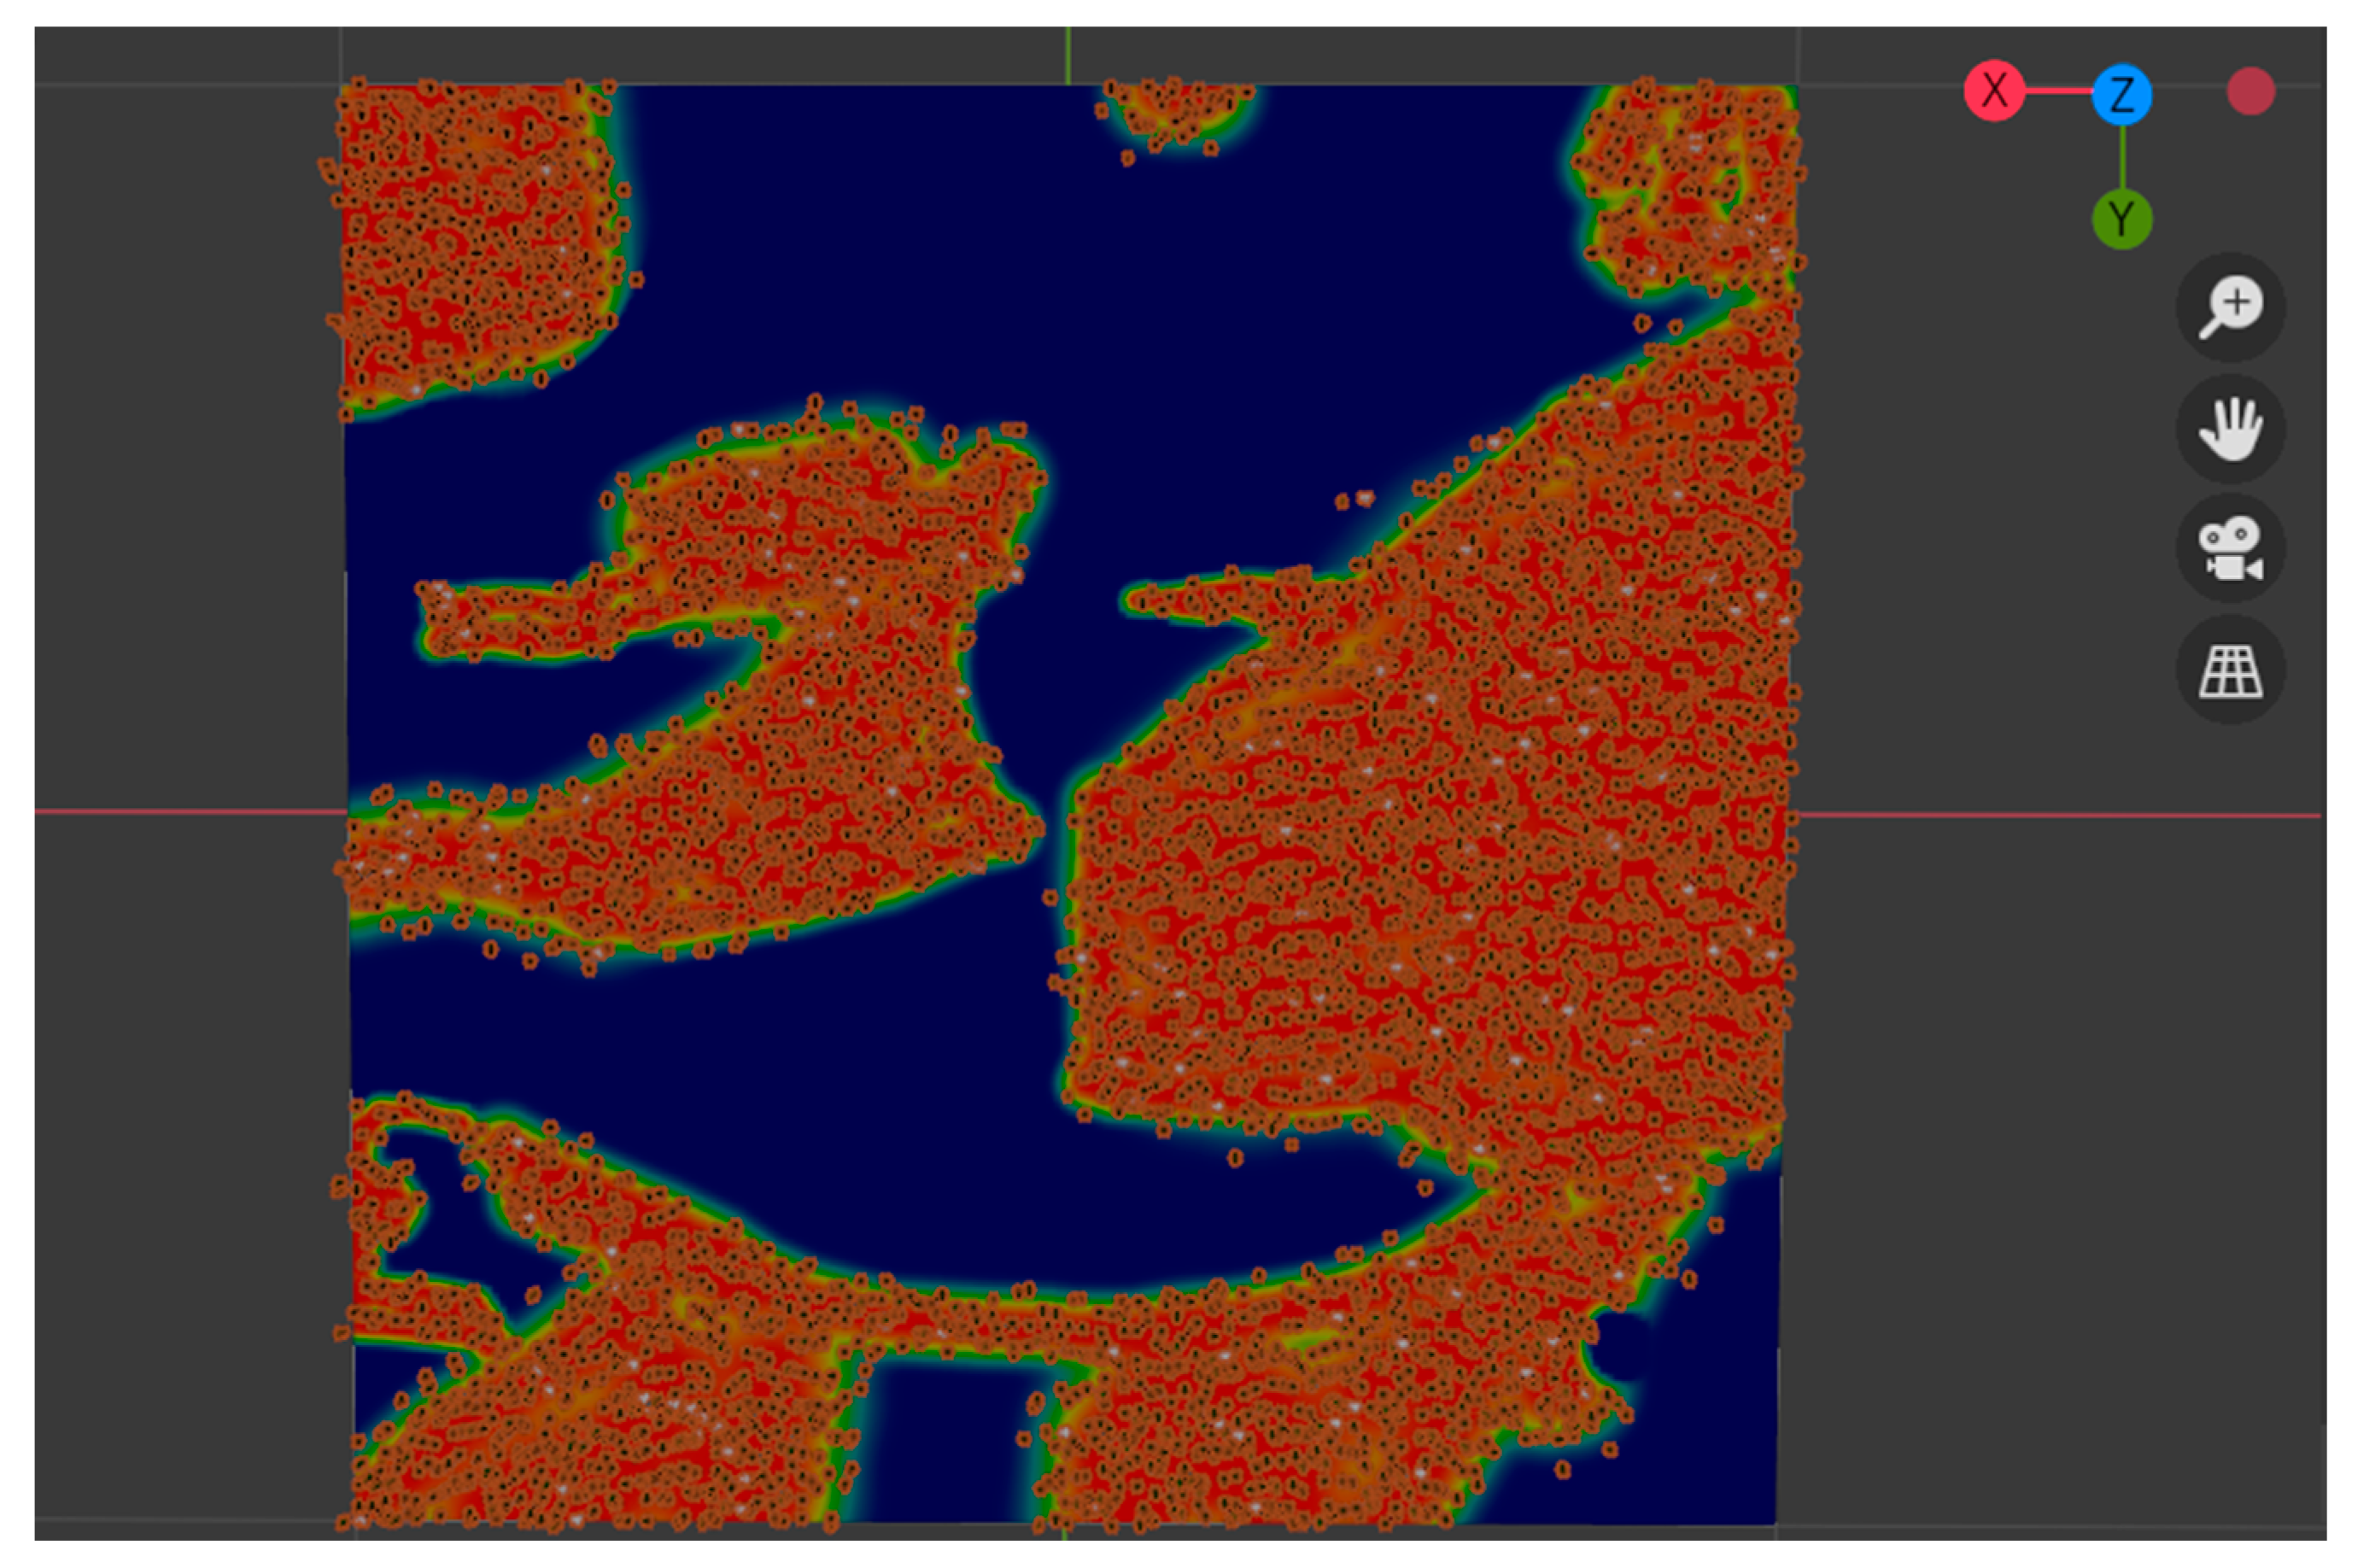
The next step in the study was to use remote sensing data to disperse trees in space as precisely as possible. Therefore, we constructed a heat map in the 3D editor: a map of weights. (Figure 3). The weight map clarified the overlapping regions of individual objects, allowing the element of a false overlay of an object that extended beyond the permitted fragment borders to be excluded. The weight map also helped us to determine the areas where vegetation should be placed. Subsequently, the scale map allowed the formation of three-dimensional trees on the area where the tree species actually grew, with their exact positioning. Previous studies developed technologies for the three-dimensional modeling of plants based on the information obtained by remote methods [20,21,22,23].
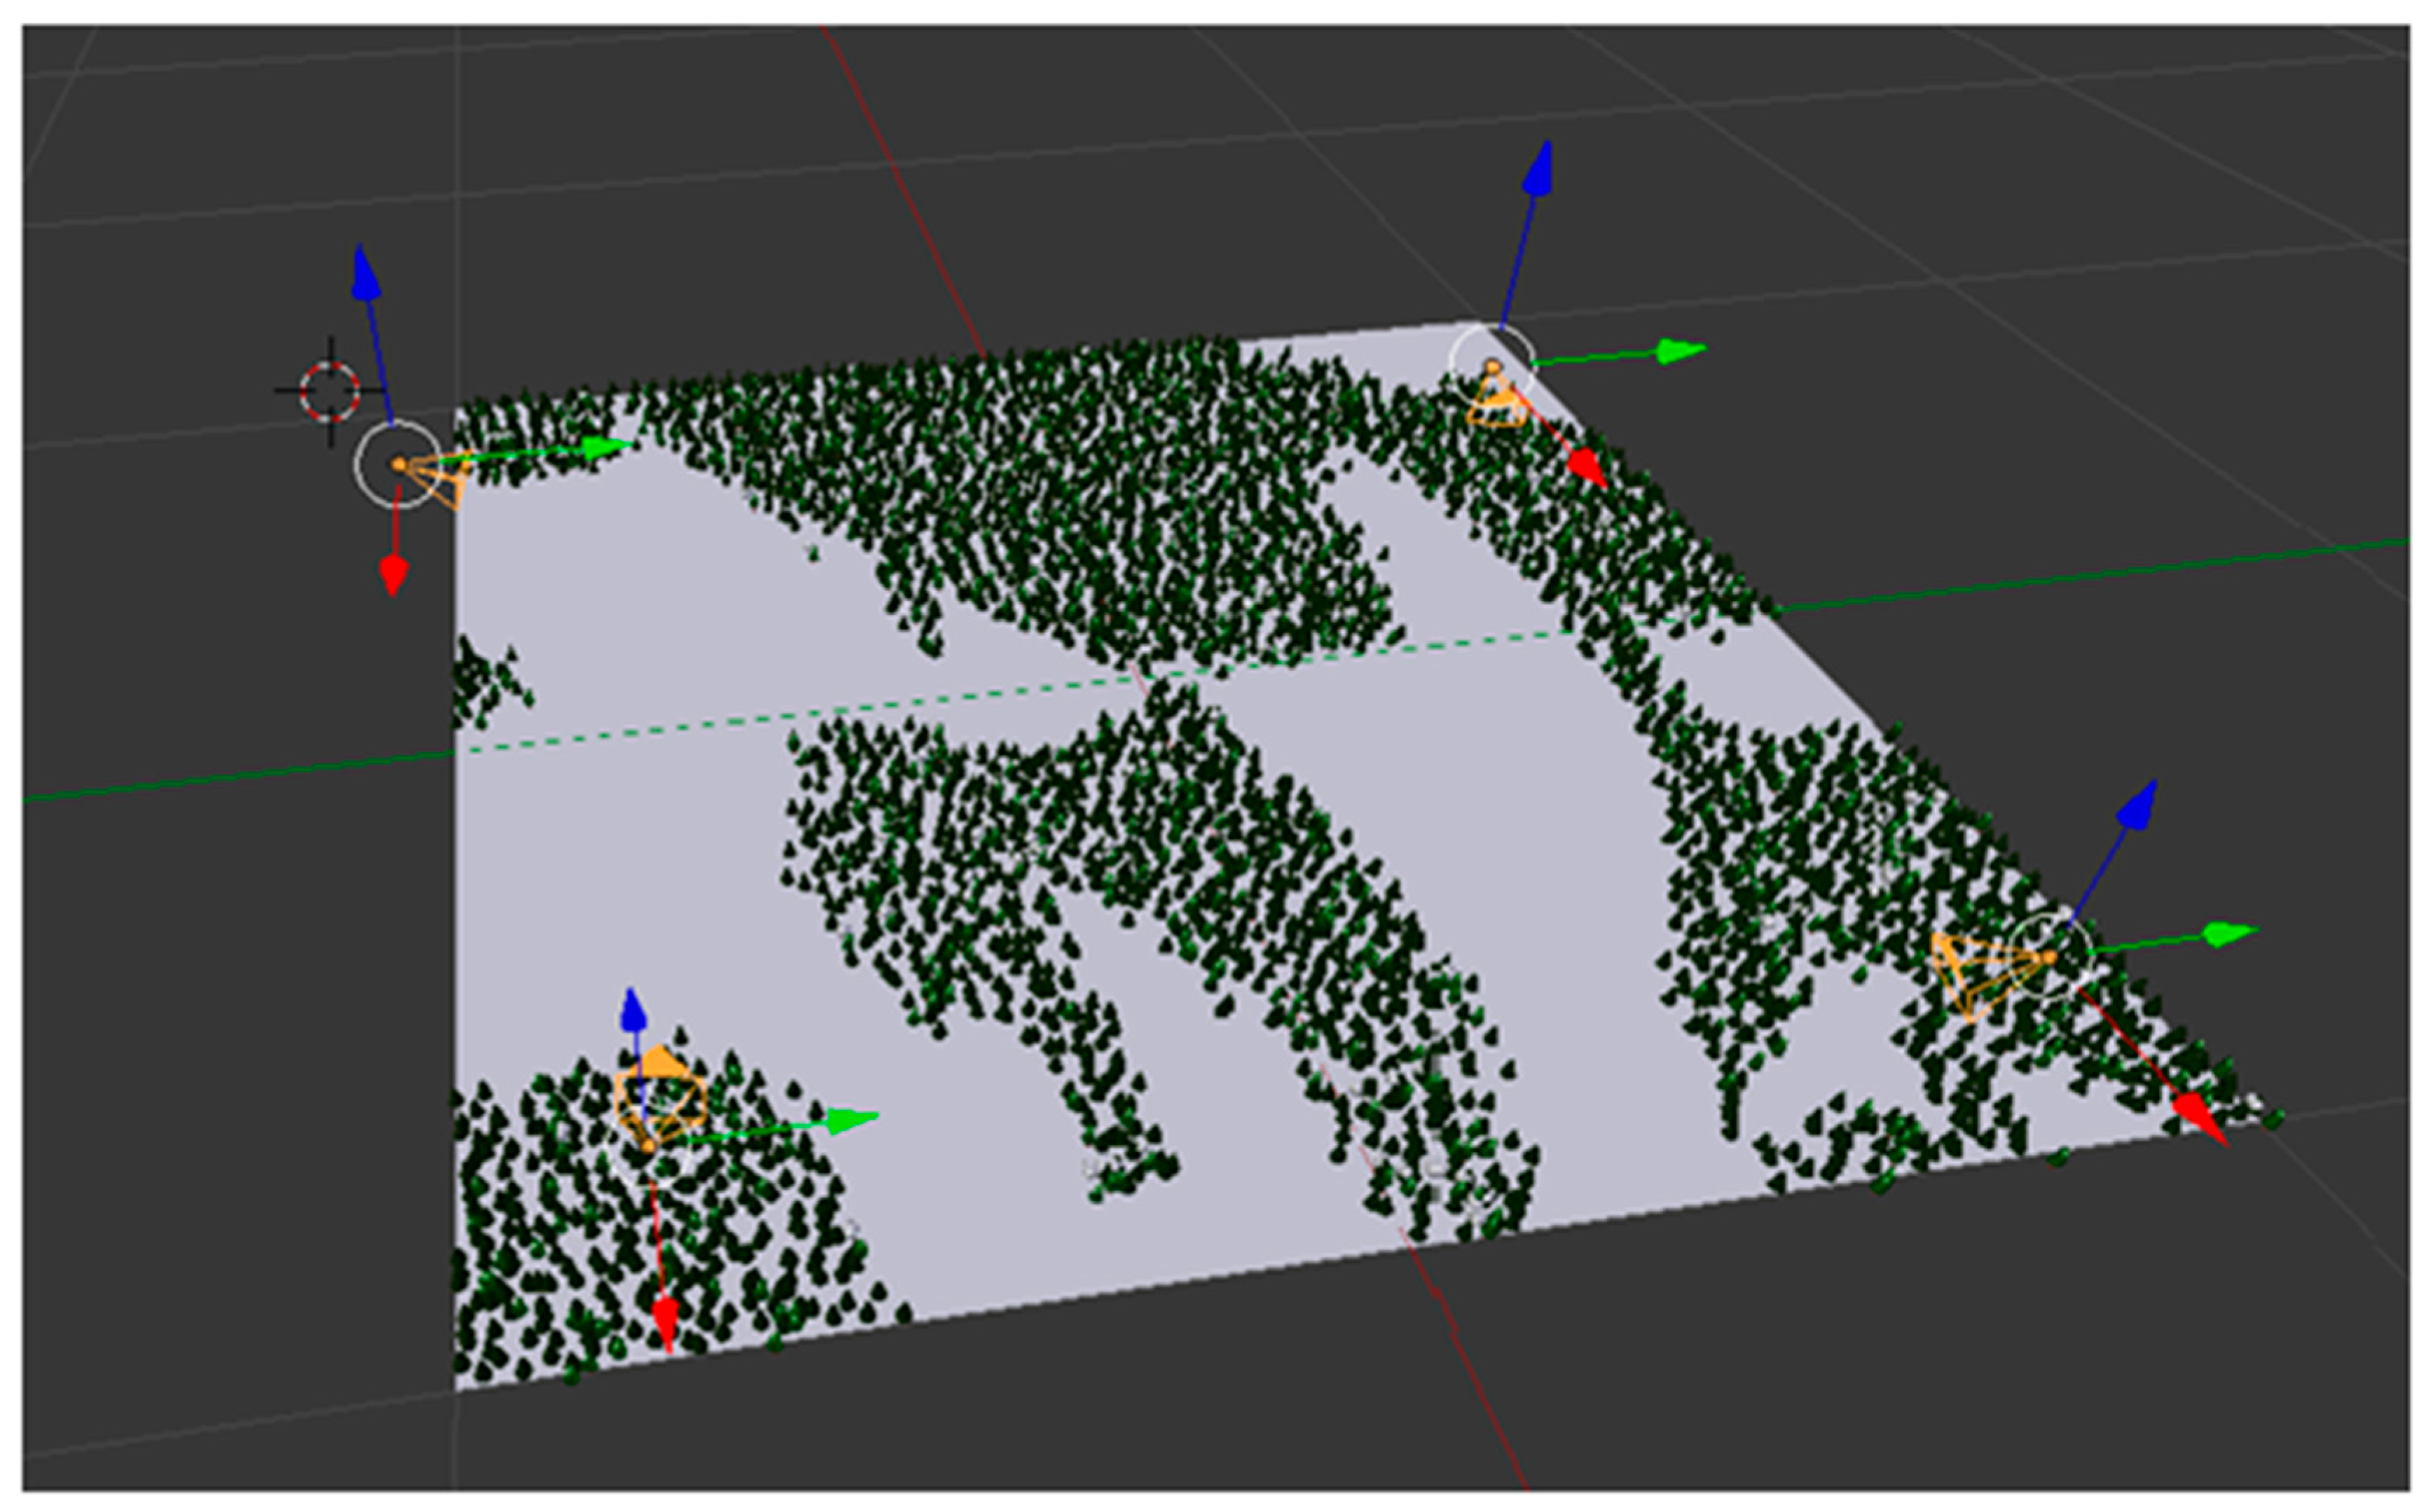
After constructing the weight map, we proceeded to place objects by superimposing tree coordinate point features from map A1 (Figure 3) over point features from modeled region B1 (Figure 4). The technology for capturing trees was previously described [24,25,26] (Figure 5). To locate an individual tree, a point identification method was used, and an ID number was manually assigned to each individual tree by the operator on the model substrate in Blender. Remote sensing data and our experience in decoding stands were used to identify the species. Thus, we knew exactly how the trees should be placed across the area, reflecting the actual tree position. These point features and gridding allowed us to exclude tree placement deviation from their actual location in space. The weight map also allowed an understanding of the uniformly shaped areas of the forest, which could be helpful when creating the boundaries of forest inventory stands. Other authors [27,28,29,30] noted the technological possibilities of applying both machine learning and remote sensing data processing methods to classify vegetation and obtain forest ecological information.
The next step was to add tree species models. Setting a criterion for describing the presentation of objects based on the multiscaling of the model to conserve computational resources is a superior method to improve the model operation. This condition is also necessary since, in the case of the remote work with a model, the detailed features of each tree do not need to be presented. The model can be split into two parts: distant and close models. The model prior to the integration of remotely sensed data shows the exact location of trees (Figure 5). Initially, it was necessary to create several tree species models with no gradation by age class. Then, a refined model with parameterized features was created. Among the main species in block No. 196, we singled out the economically significant species for which there were data from the 2005 forest inventory. The main tree species were pine, spruce, and birch.
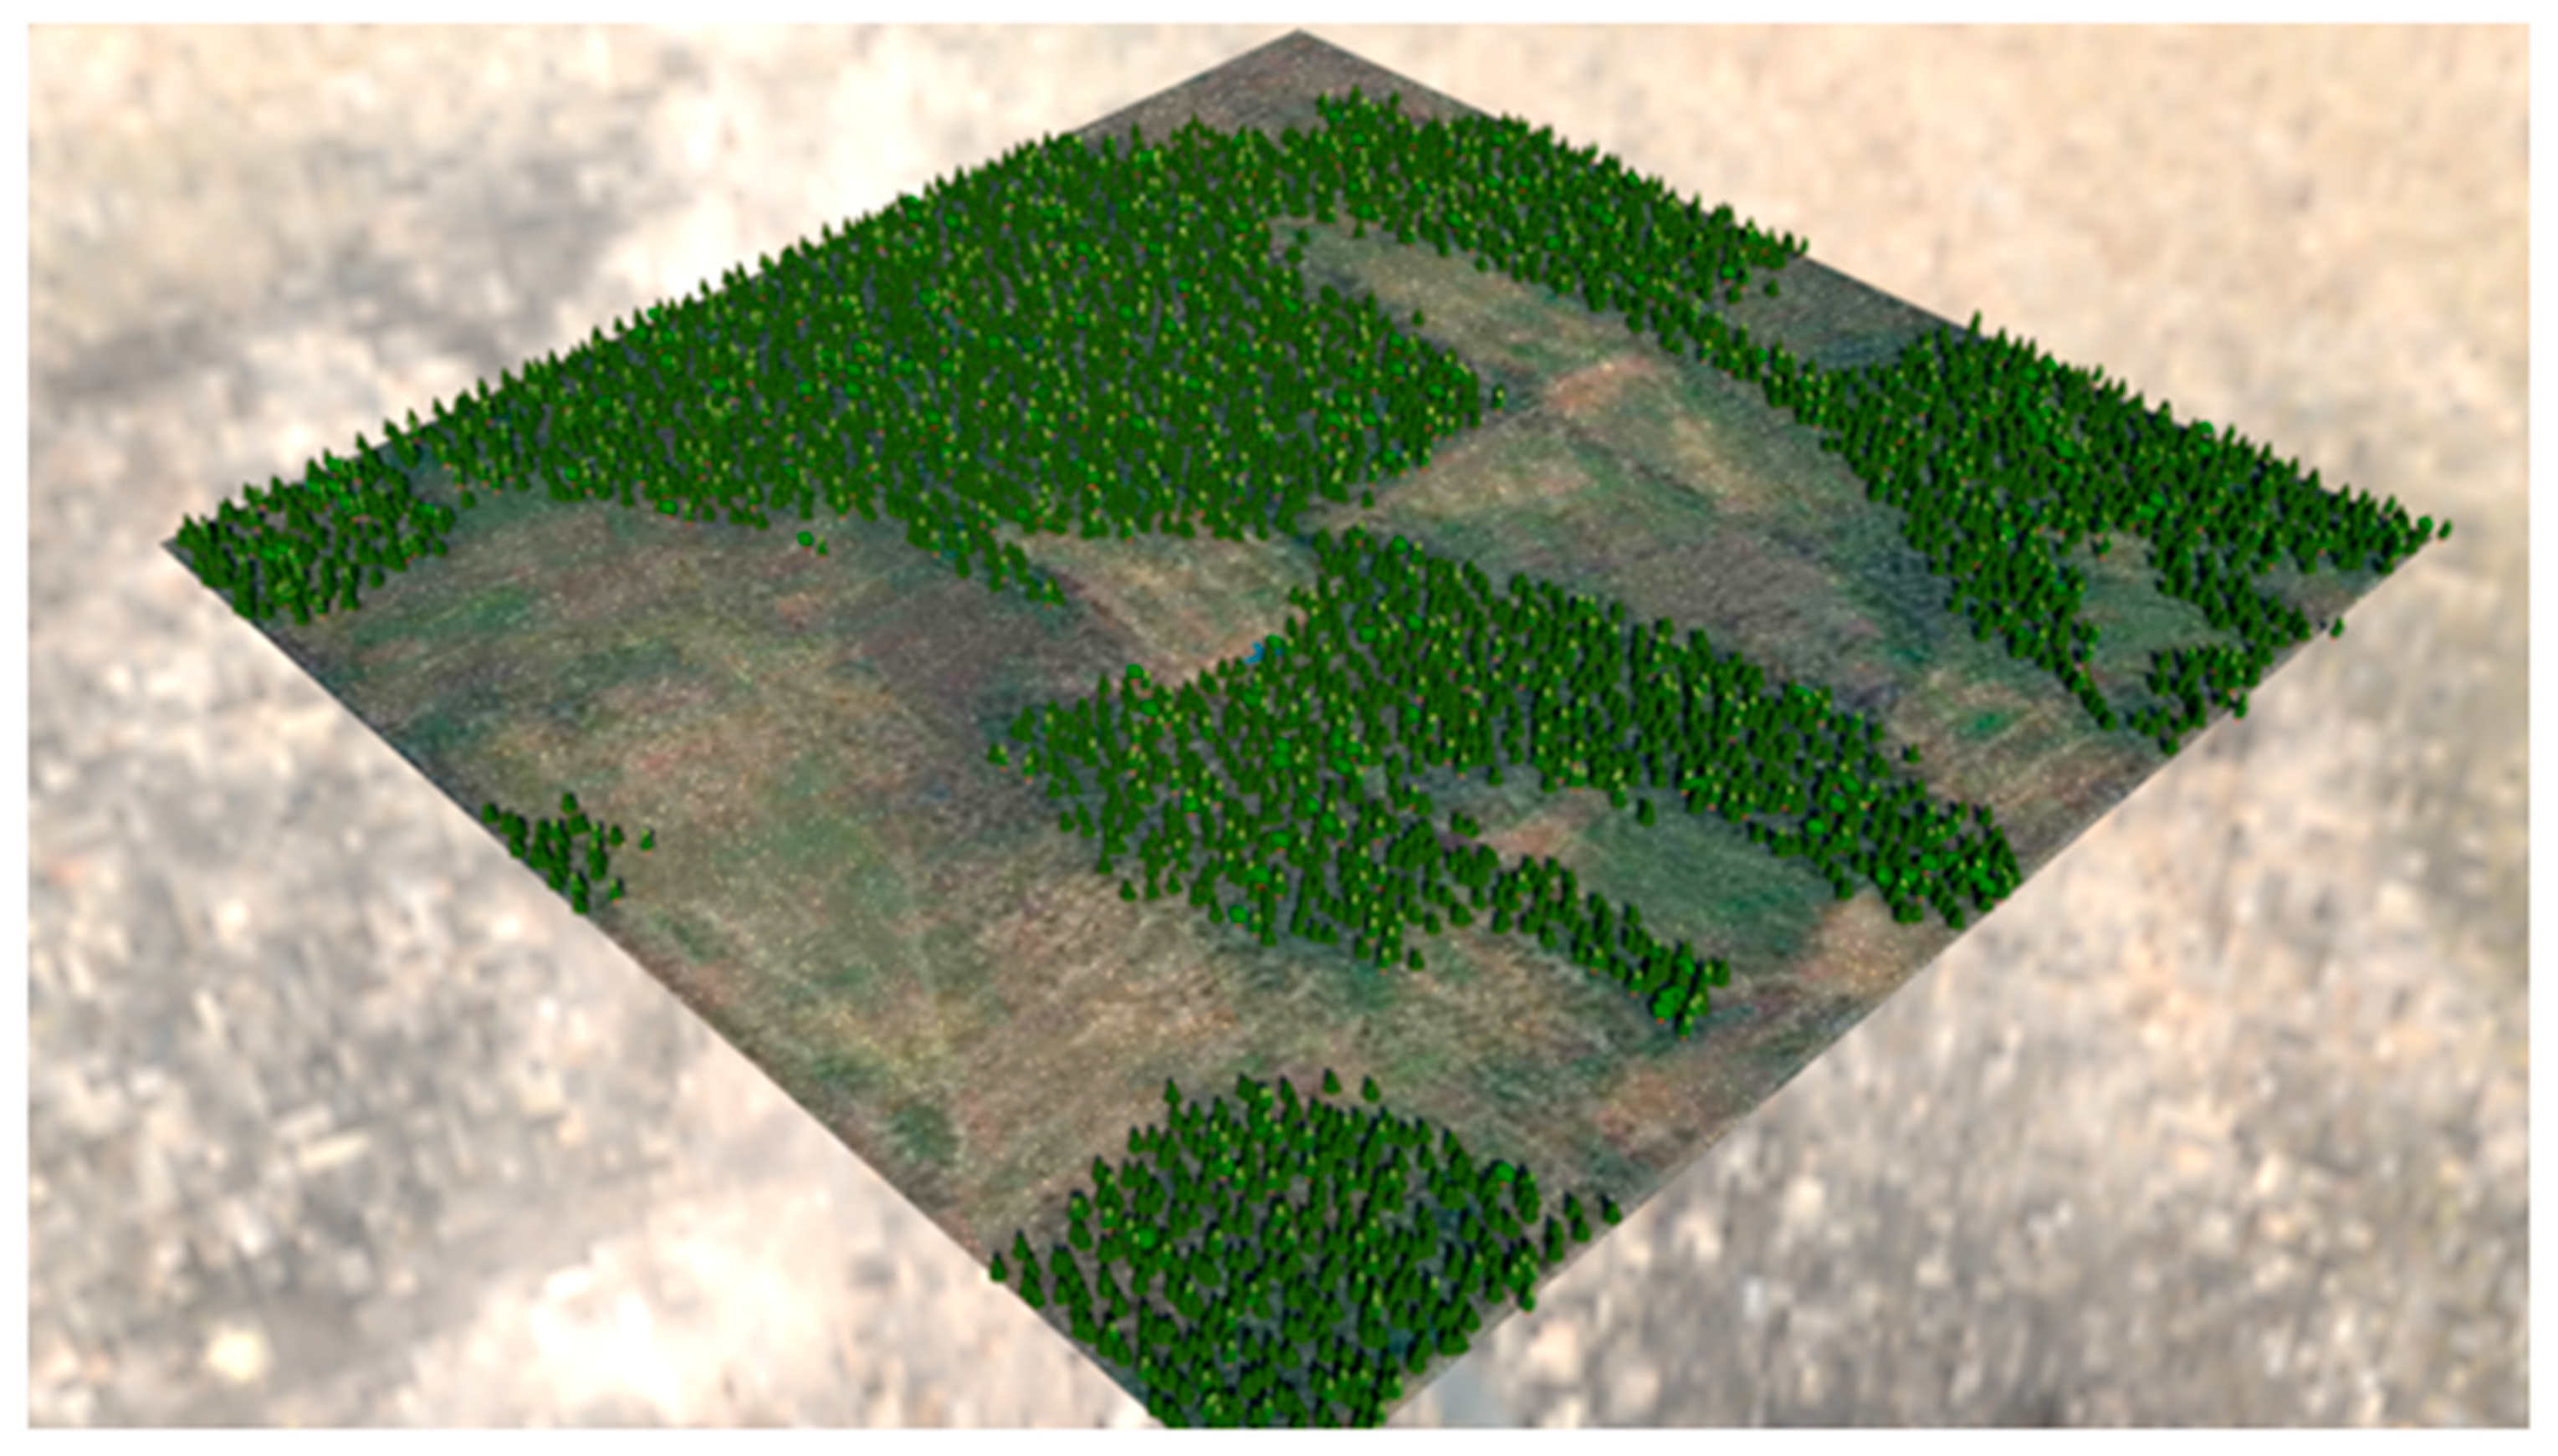
When we incorporated the remote sensing data background, an overlay of two types of data appeared: graphical data and data from remote sensing materials. The final model (Figure 6) showed a more dynamic visual-graphics shape, making it easier to observe and control the forest quarter. Despite the more dynamic display of the results of the two types of integrated data, this model did not yet display the third type of data, the inventory characteristics of the stand, which would make the model more realistic. In terms of their logical content, these types of models are close to digital simulators, which are actively being developed in the field of information technology and science [31,32,33].
The last step was the integration of forest inventory data. The main technological task of this process was to connect three different types of data: the remote sensing data, which serves as a substrate for accurately displaying tree models; the graphic models of individual trees that precisely correspond to the spatial arrangement of objects; the forest data of the Lisinsky training and experimental forest inventory conducted in 2005.
4. Data Integration
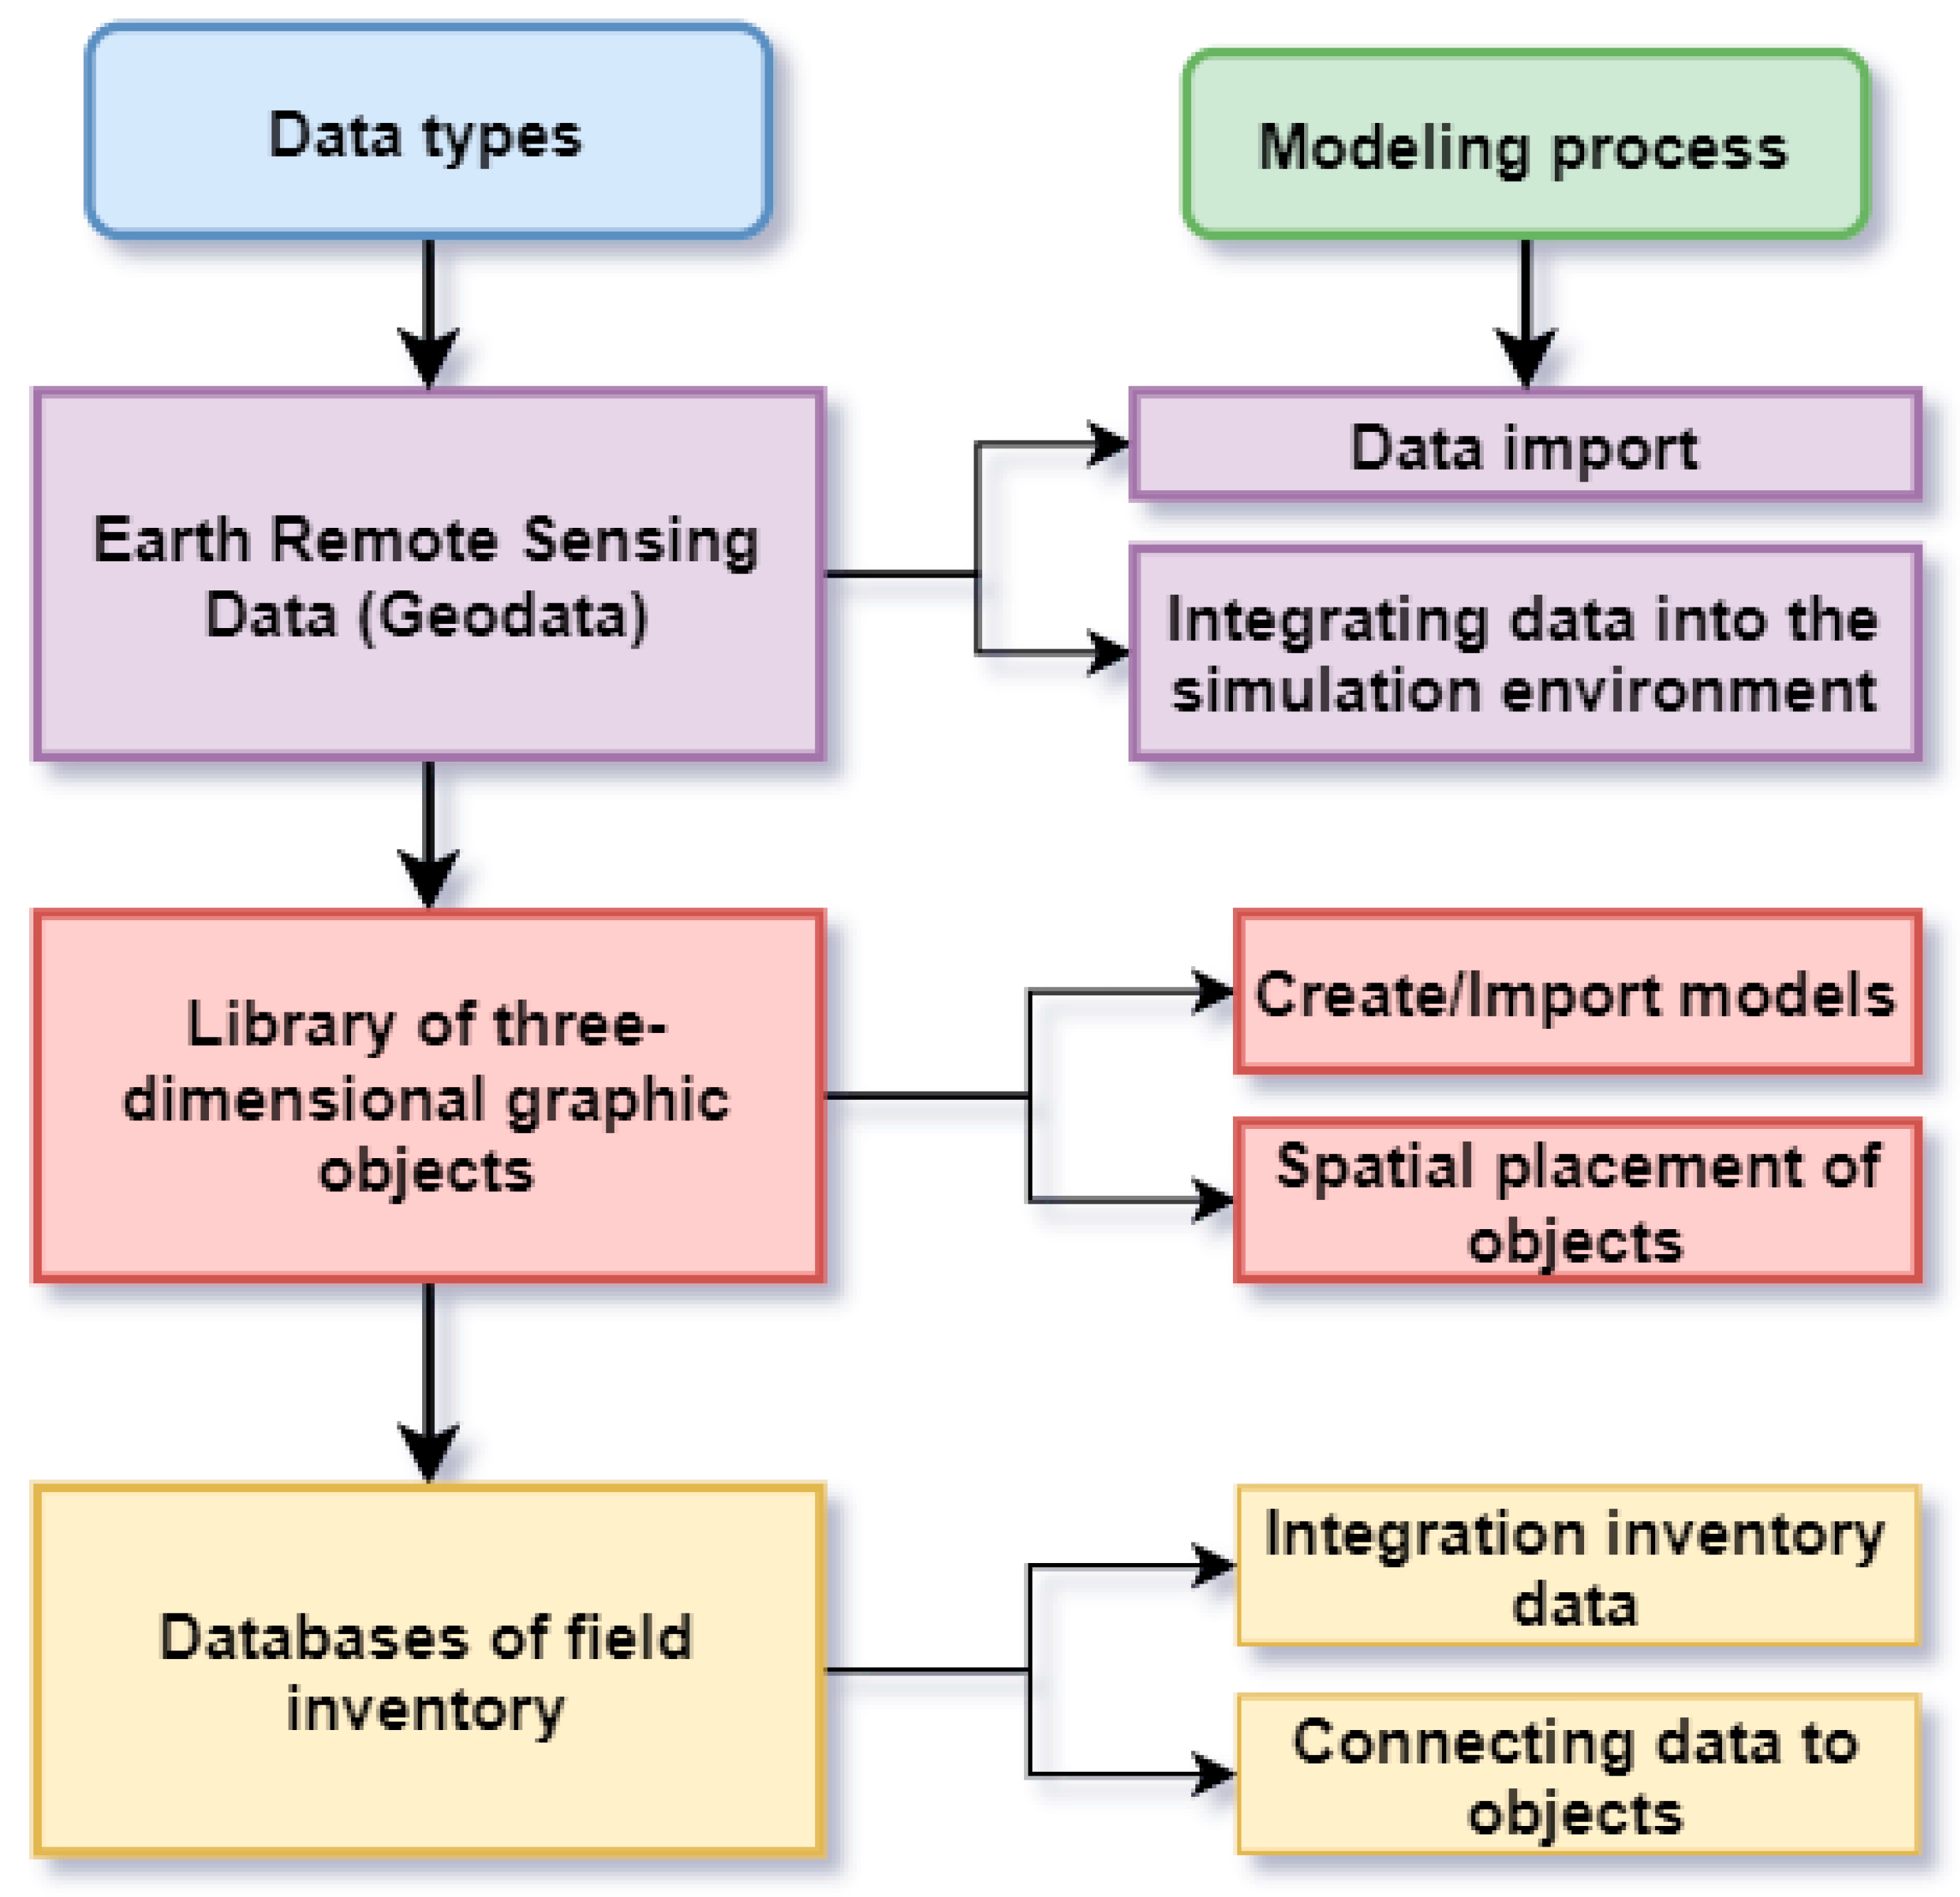
To integrate forest inventory data, a technological chain of actions was established, including creating a forest inventory database, establishing a connection between the graphics objects of forest inventory allotments with a digital forest model, and developing technology for dynamically visualizing forest inventory data in a digital forest model. The main data types and the modeling process are shown in Figure 7.
The remote model was created in the Blender editor, the near model was created in the Unity 3D environment, and the executable files were then imported into another system to work with the model. We integrated the field forest inventory data into our model after completing a full-fledged 3D model with ready-made three-dimensional objects for certain tree species (in our instance, pine, spruce, and birch). This was the last step in creating a remote three-dimensional model that has the following benefits:
- (1)
- The model displays the exact location of individual trees using satellite imaging.
- (2)
- An identification number (ID) and other forest indicators (for example, forest inventory data and growth track data) can be assigned manually to each tree on a satellite image and a 3D model because it was created based on a substrate from a satellite image reflecting the natural geographic features of the spatial distribution of forests using machine learning methods and, in particular, neural networks.
- (3)
- By having the forest inventory data and the coordinates of the location of individual trees, it is possible to display the course of plantation growth and even individual trees over time in a 3D model, which allows creating a three-dimensional model, then using forest growth models to observe how the forest develops, with the corresponding process being displayed using a 3D model of the site.
To display the change in forest inventory characteristics over time, regression models were used to build a dynamic model of plantation growth rates. To accomplish this, we developed numerous models based on data from the entire training and experimental forestry inventory, using spruce as an example of heights and diameters. These data can then be integrated into a digital forest model. A review of the technologies used in forestry [34] showed that innovative forestry solutions are lagging behind in practical implementation and widespread adoption.
For this purpose, it was possible to build several models based on existing species in terms of heights and diameters using taxation data for the whole study area. For more accurate long-term forecasts, machine learning methods can be used, for example, the gradient boosting method [35,36,37].
To assess the reliability of the model, we propose an indicator of the digital forest model reliability, G, calculated using
As for indicators that determine the set of reliability, we define four fundamental parameters that the projected model possesses (K, N, S, and P), where N is the number of modeled species in the model; P is the quality factor of remote sensing data, determined through the scale factor of the materials used in the model (Table 1); S is the size of the forest modeling area; K is the number of trees in the model.
Since all of the elements in the digital model have fixed values, the confidence factor is a deterministic indicator. One of the critical indicators on which the integration of 3D modeling data is dependent is material quality. As a result, determining the correctness of the materials on which the modeling will be performed is crucial; based on the resolution of the materials, a scale of the accuracy of remote sensing materials from 0.9 to 0.5 is proposed.
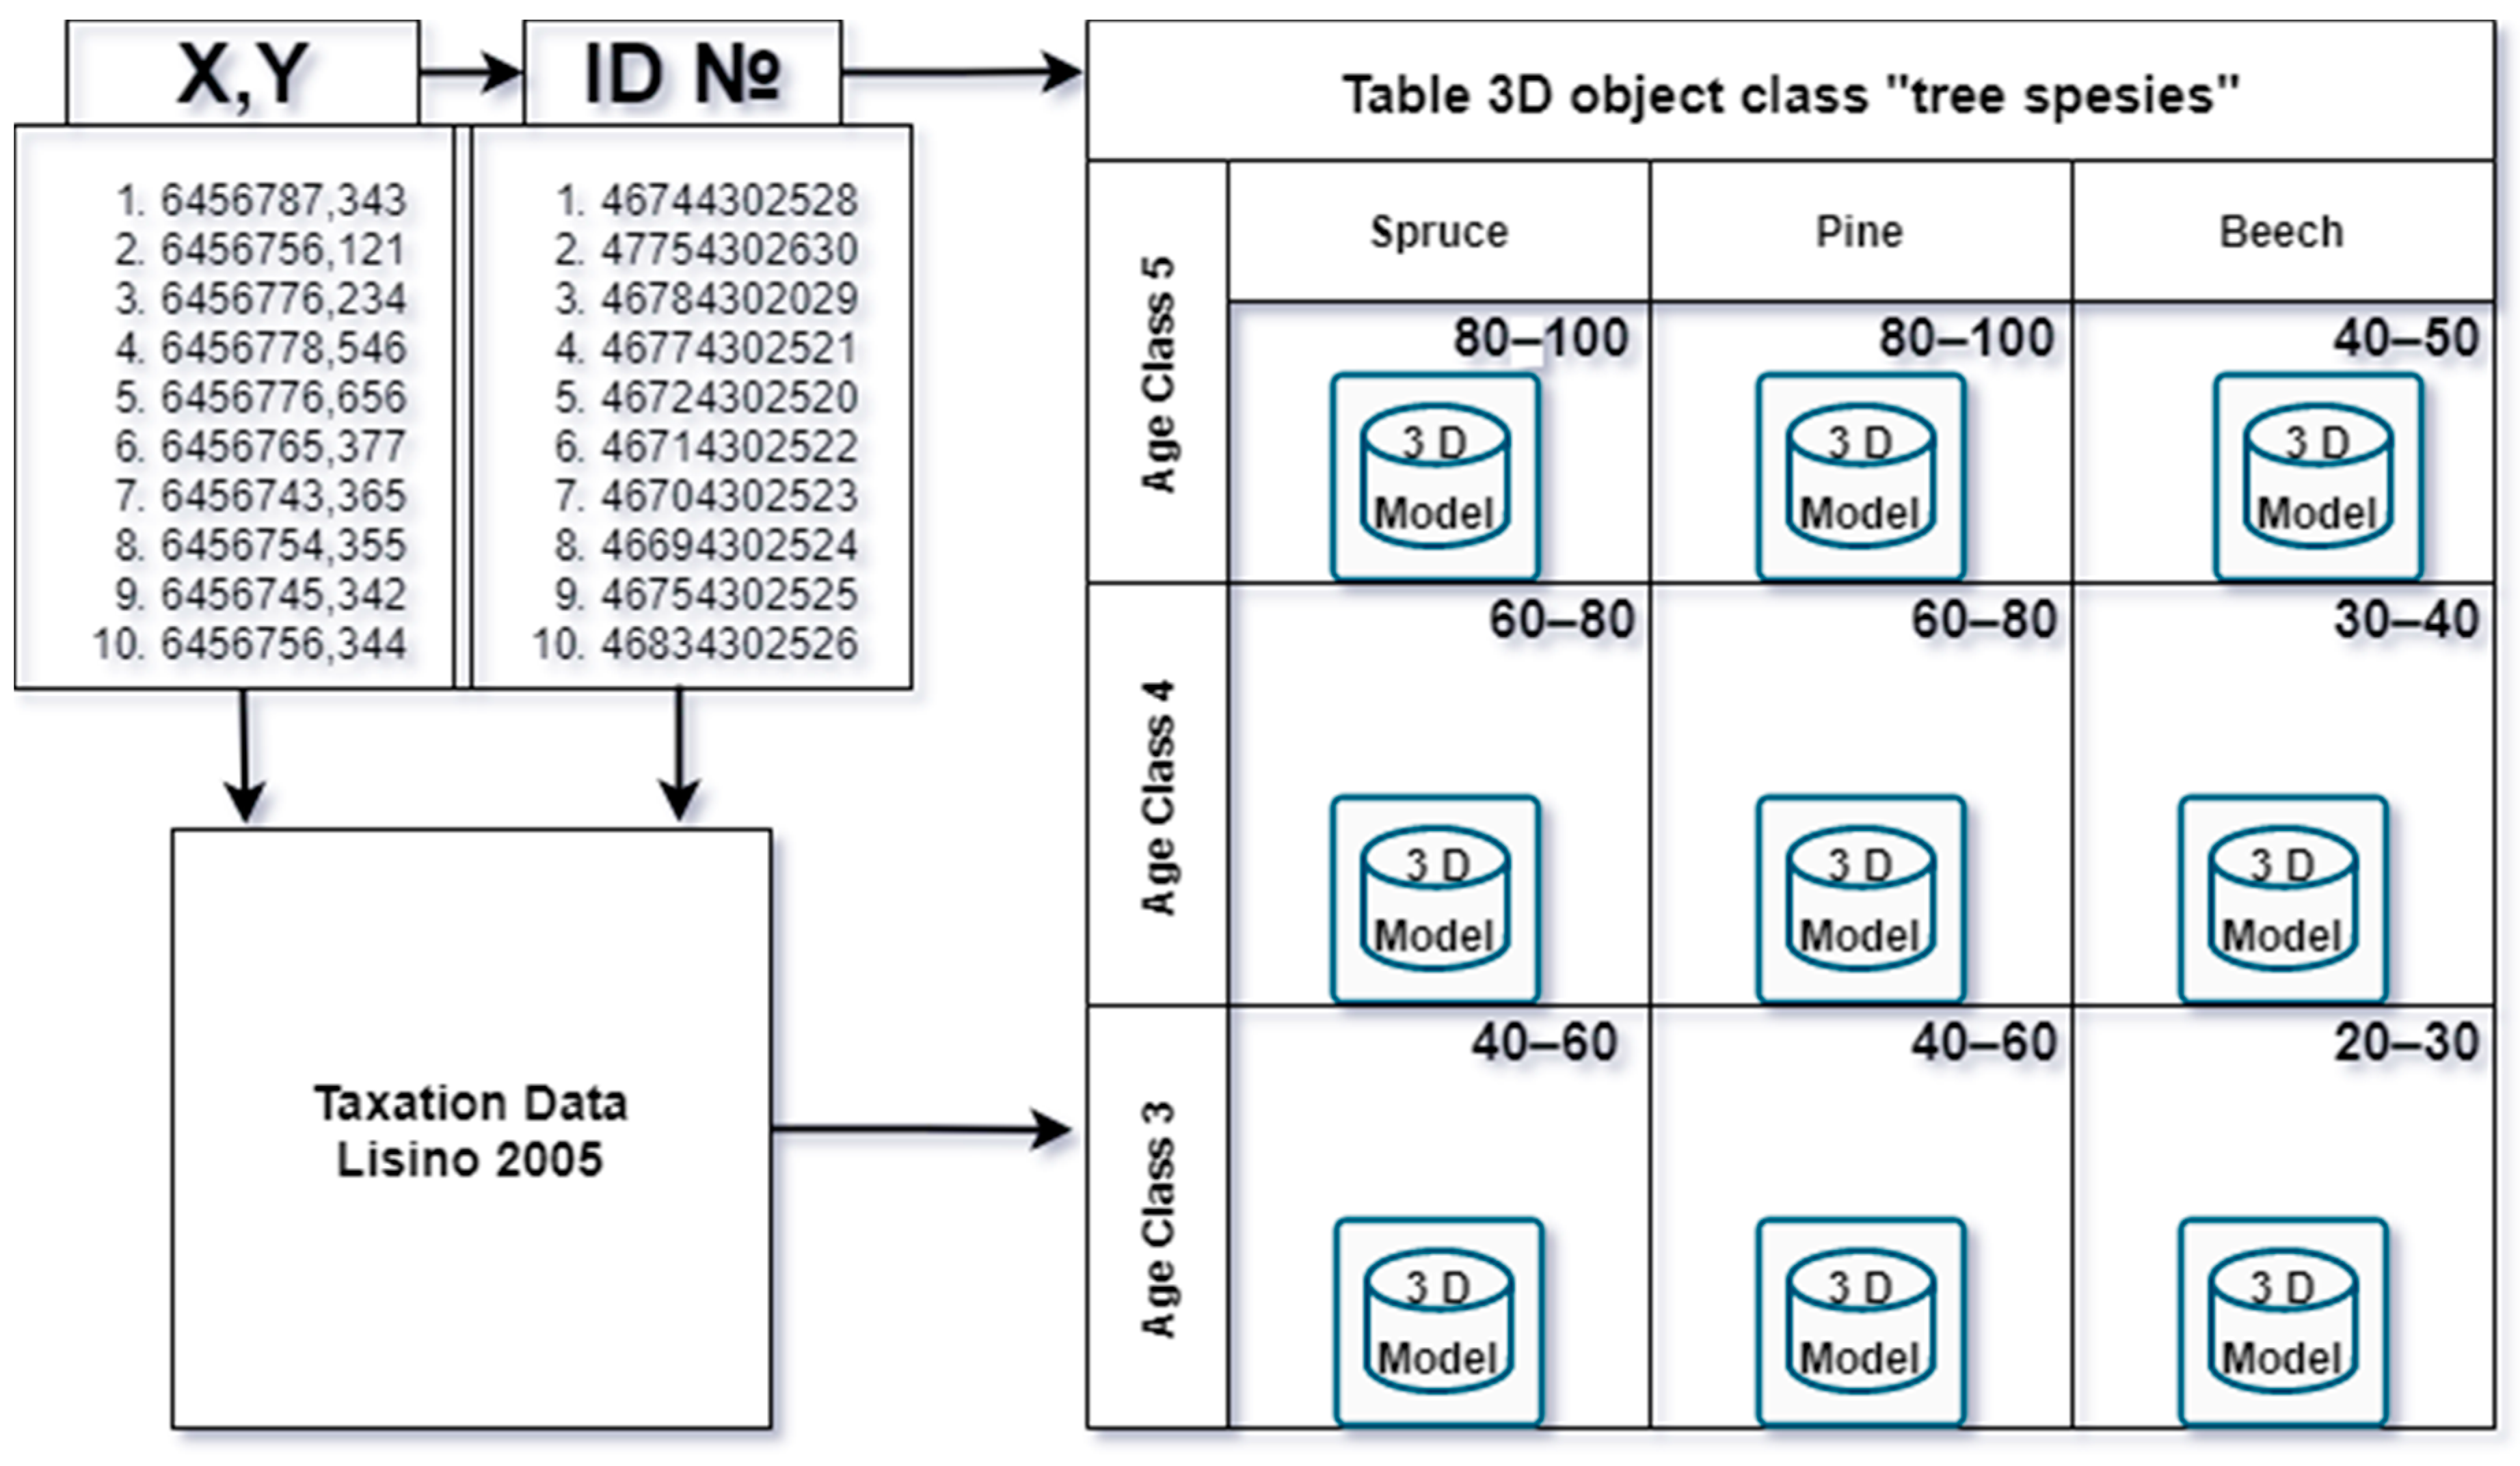
The ID function was used to connect forest inventory data to three-dimensional objects; it implies assigning a unique identification to each tree and the coordinates of the tree location, which are linked in the forest inventory database structure (Figure 8). The range of forest inventory box fields displaying the values of identifiers allows specifying the interval of the values of the forest inventory box for displaying them in the model. The advantage of the distant model is that the model characterizes and reflects the properties of the stand by displaying a set of heterogeneous data when they are multiscaled and distant.
Since the forest inventory database was already connected to the 3D model, it was possible to add further information on how taxation indicators will change over time. This allowed us, for example, to model the body of interest after a certain period and display its intended appearance, maintaining the relevance of the data at sufficiently large time intervals (especially when using machine learning methods) [38,39,40,41]. Compared with LiDAR recording methods, this modeling method has several advantages:
- (1)
- Lower cost of recording—in large countries such as the Russian Federation, it is challenging to continually update forest data using LiDAR recordings. Creating 3D models of forest stands from a substrate using satellite imagery is a faster method to model 3D maps.
- (2)
- The LiDAR is recorded from aircraft, whereas the method proposed in this article assumes only uses satellite images. This provides considerable flexibility when selecting study sites, especially when exploring substantial forest areas, where LiDAR recordings would require an extremely long time.
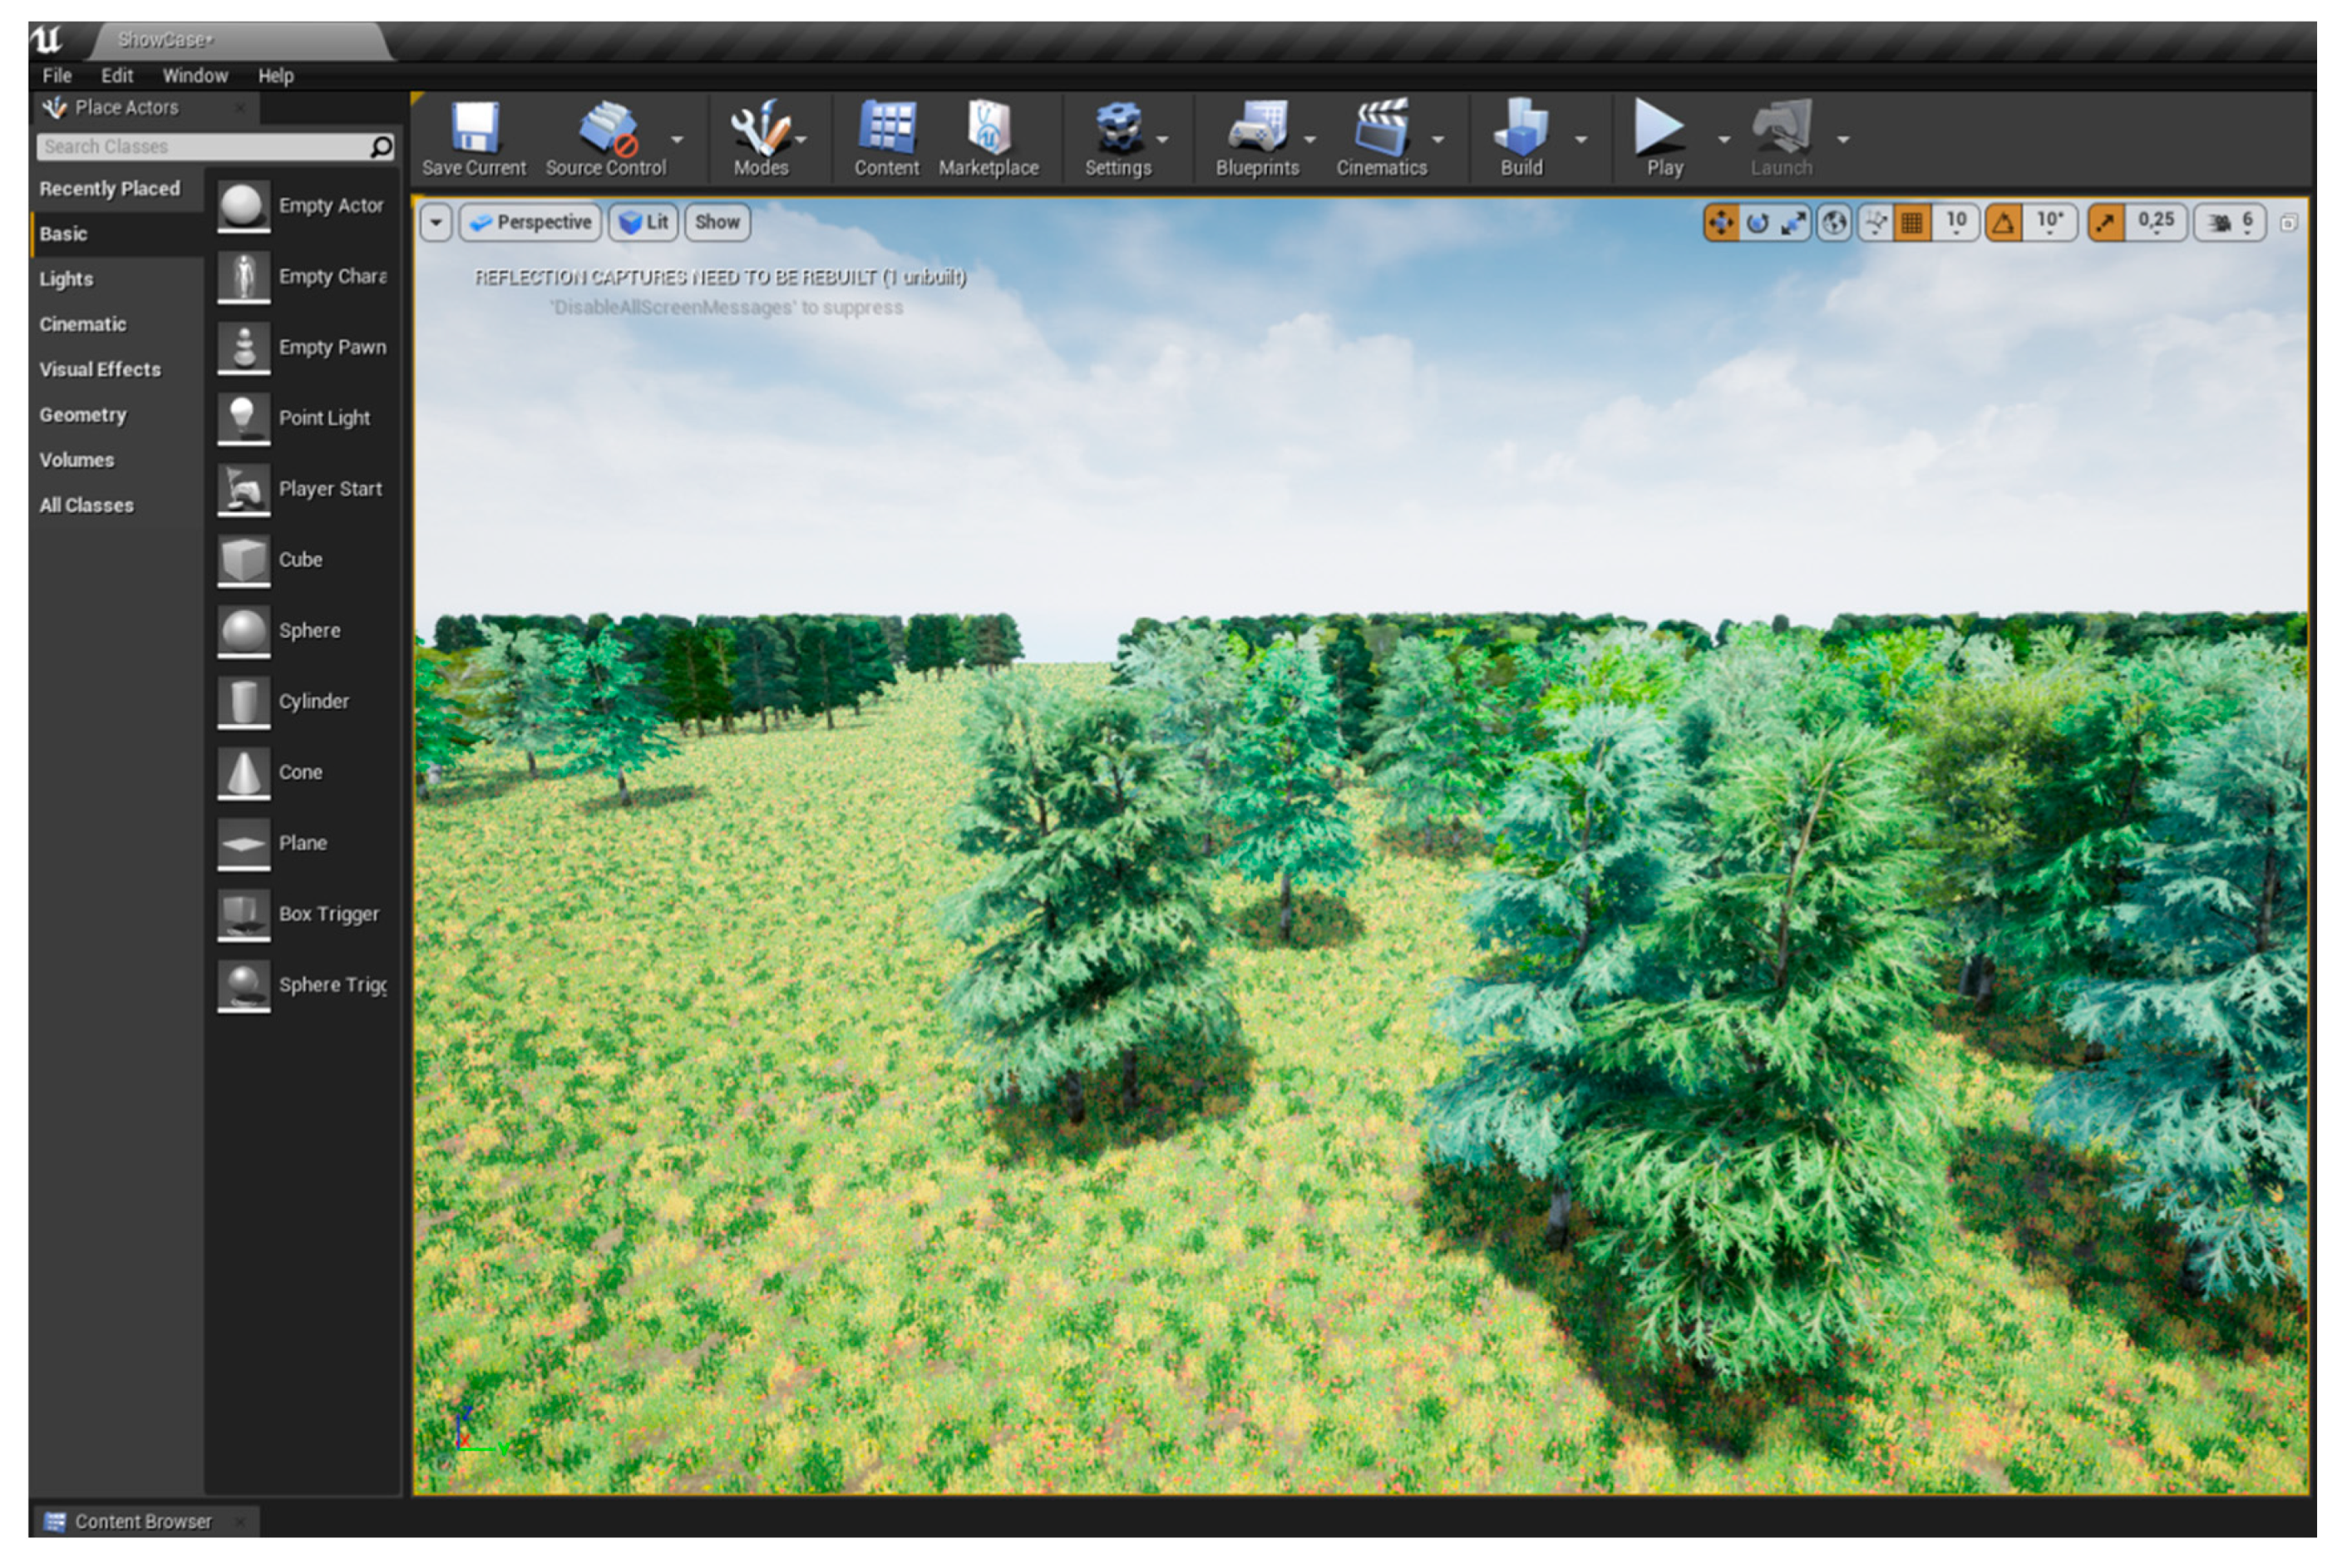
The second stage of the digital forest geomodeling stage was to detail the model; we produced dynamic layers connected with remote sensing data. A dynamic layer is a type of geospatial data (layer) that contains attributes and changes its characteristics according to a provided algorithm. The formation of dynamic layers based on remote sensing data will display important silvicultural parameters such as forest types. With the model, it will be possible to observe how and under what conditions the indicators of the growing stand change over time and with climate change. Retaining such information in the model, it will be possible to observe dynamic changes. In the study, a detailed model of the forest stand was built in the Unity 3D environment, demonstrating the possibility of implementing digital forest models based on the first model built on the basis of remotely sensed data (Figure 9).
An essential task in developing the model was creating an environment for interaction with the model and its functional features; to implement this task, intelligent geoinformation system technologies were used [42,43,44]. Designing a specialized system for working with digital forest models should consider the features and tasks necessary for the decision maker; such a system will be better adapted to the tasks of forestry specialists. To date, some approaches have been developed for the design of this type of geographic information system, a component of which is the processing of spatial–temporal information [45,46,47].
Notably, LiDAR recordings are more accurate for generating 3D models [48,49,50,51]. However, the question arises: is the highest accuracy so crucial given the higher complexity and energy consumption of the LiDAR recording process? To answer this question, specific goals and objectives for various types of research must be implemented. At the same time, a digital forest model based on remote sensing data and obtained inventory data will allow us to determine the resources that need to be carefully managed, realizing the vital ecosystem value of forests [52,53,54,55]. Despite the initial difficulties in building a forest model, the peculiarity of organizing and preserving digital data allows us to improve, update, edit, and fill the model constantly. Modern hardware and software tools can provide the ability to display a valuable resource such as a forest, both on a small and large scale.
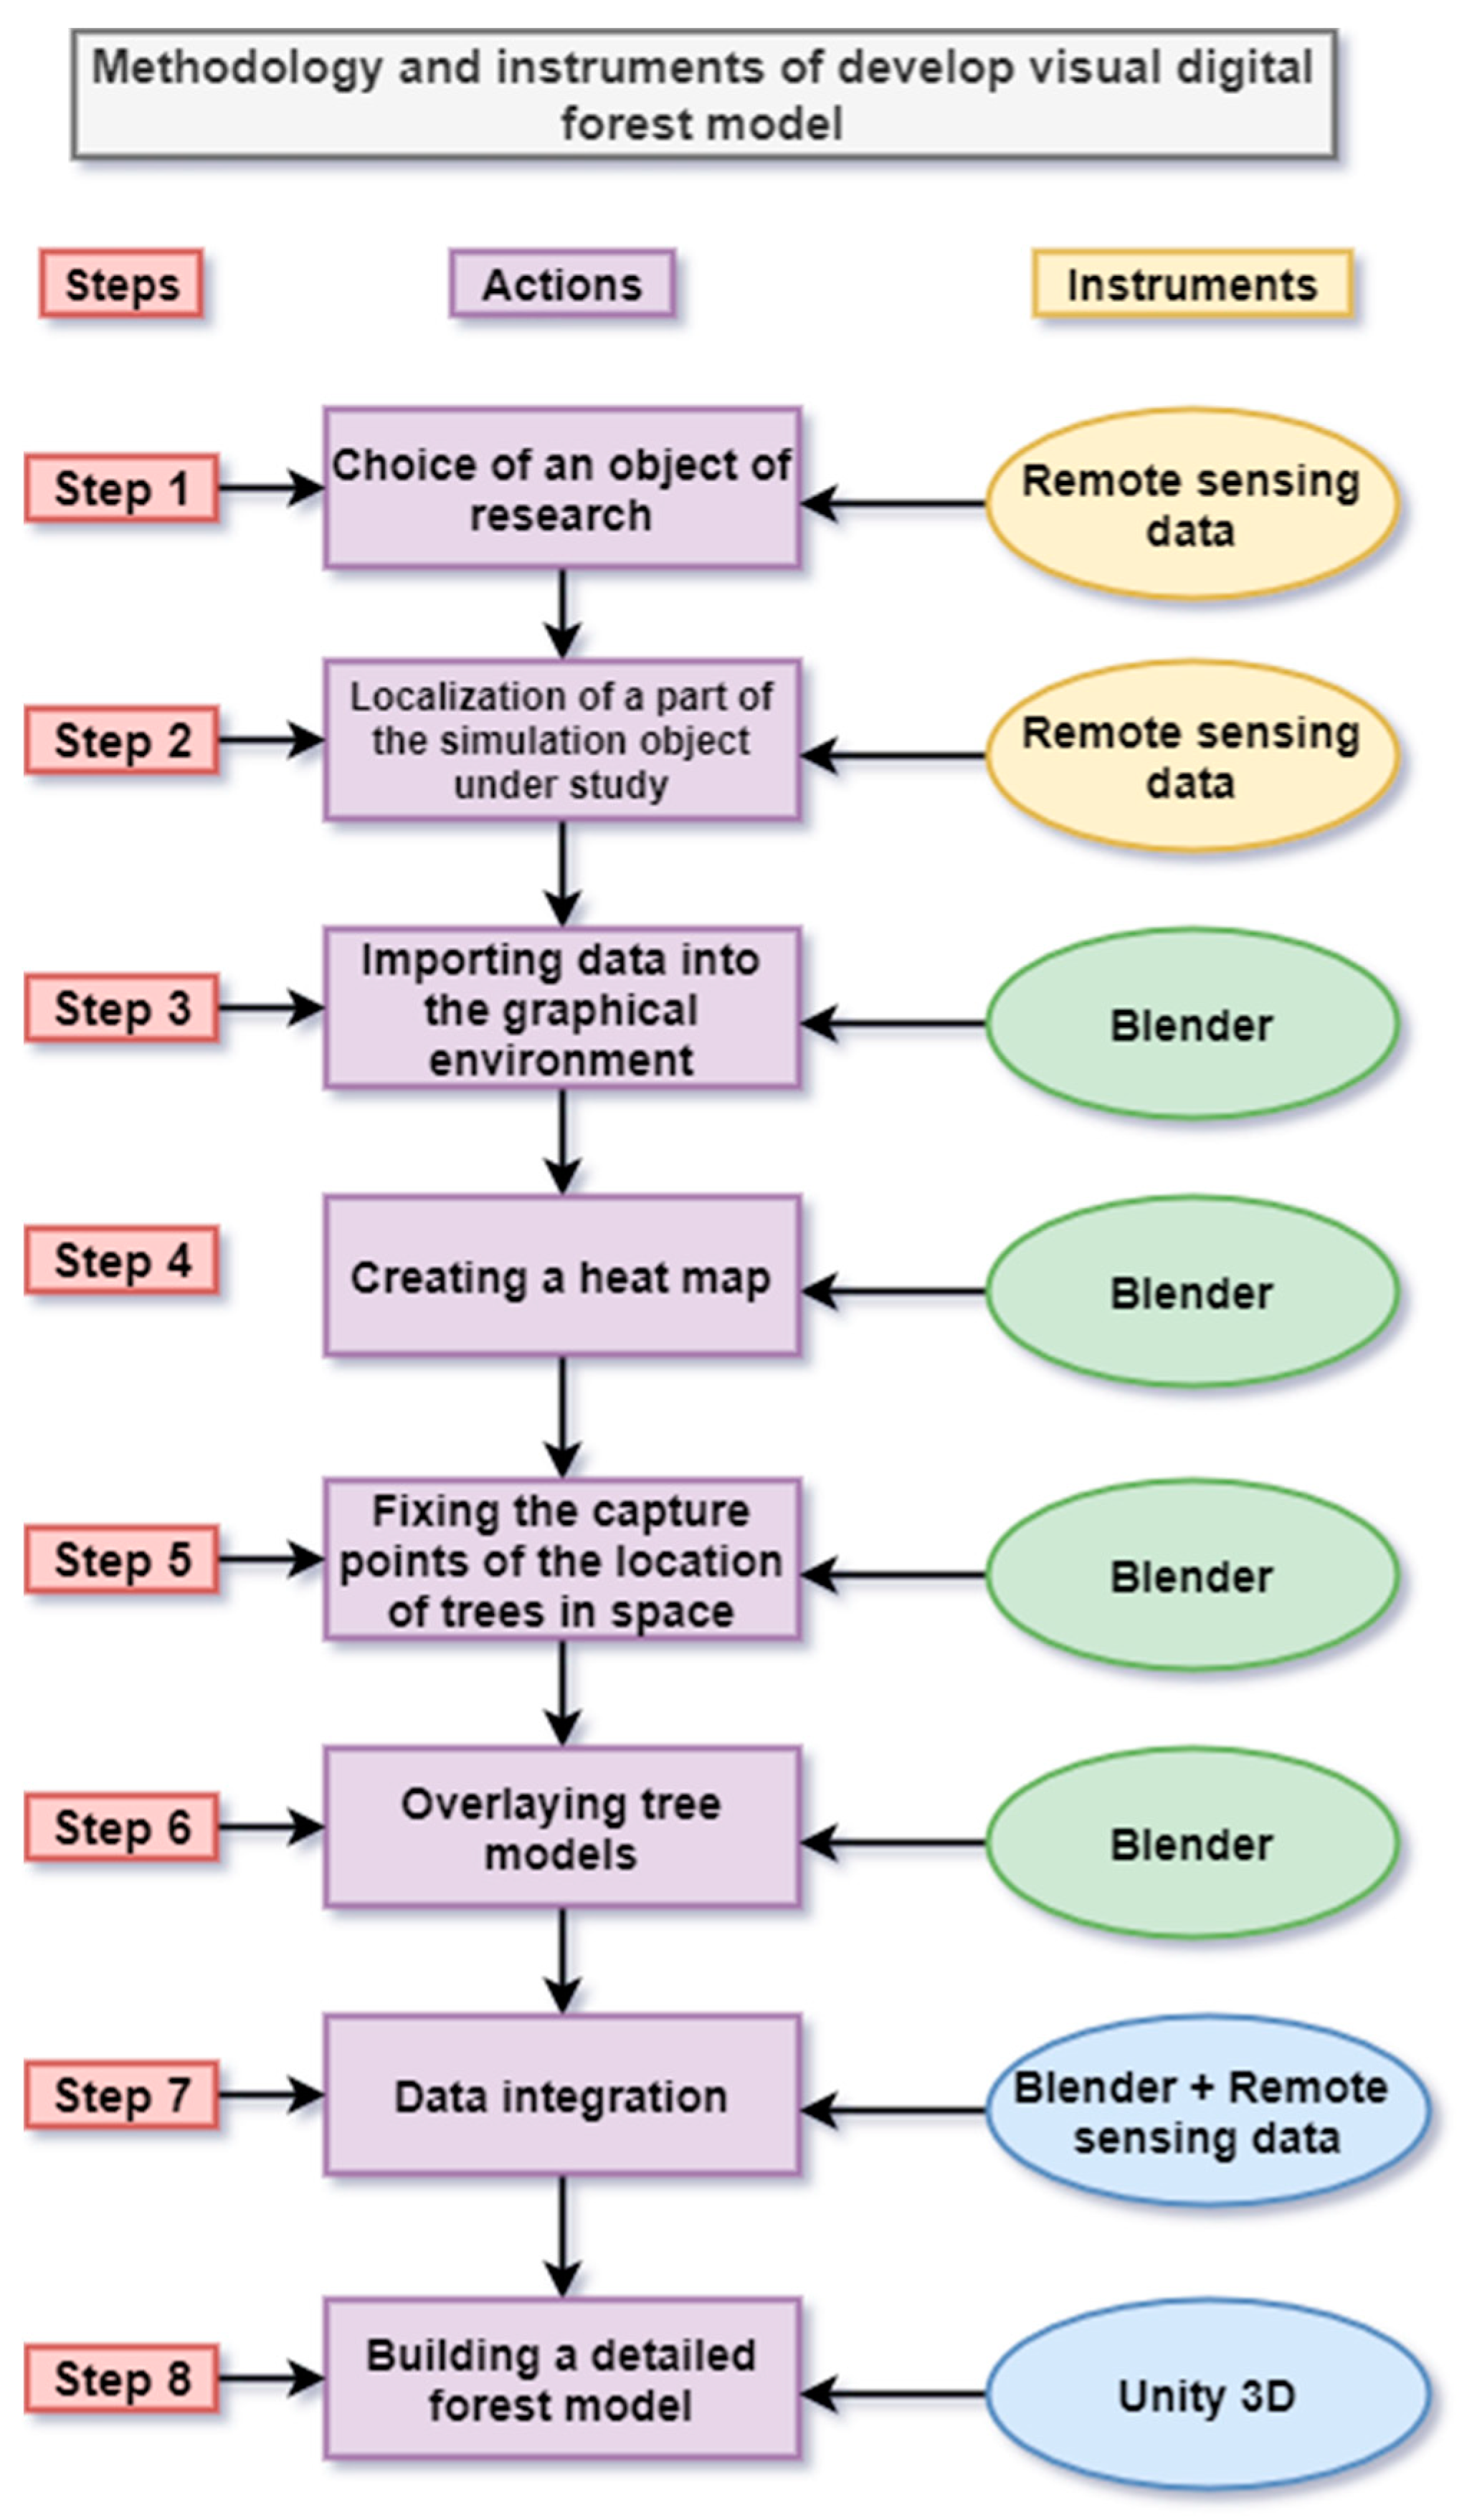
The final methodology for designing a visual digital forest model included eight basic steps for performing sequential actions using data and model development tools (Figure 10).
5. Conclusions
In this study, we constructed a visual digital model of a forest that contains three types of primary data: remote sensing data, forest inventory data, and the data of three-dimensional tree models containing spatial–temporal relationships. The result is that we formed a method for constructing a visual digital model using software tools and remote sensing data, which displays the selected area in detail. Considering the technological developments and the increasing rate of computing power growth, it is possible to use the proposed local digital models of the forest to reflect the characteristics of forest dynamics, providing a convenient tool for managing a certain part of the forest. Using such models, forests can be selectively managed to obtain new knowledge, predict changes in forests, and visualize situational events occurring in forests.
As a subject for further research, the constructed model can be improved using data mining technologies and machine learning procedures for building the model. The use of data mining will allow the analysis of the taxation characteristics simultaneously with the visualization of the selected area. The use of neural network technologies will allow for situational experiments to aid in the development of the stand in the future. It is especially important to use visual digital models as a tool for the demonstration and management of forests, considering the ongoing changes in forests. In further studies, we plan to include the mapping of climatic changes, the use of forest resources, and an increase in the number of natural disasters that negatively impact forest ecosystems in the model.
Author Contributions
Conceptualization, M.V.R. and N.Y.V.; methodology, E.I.P. and V.M.L.; software, A.P.P.; validation, N.Y.V.; formal analysis, M.V.R.; resources, N.Y.V. and M.V.R.; data curation, A.P.P.; writing—original draft preparation, M.V.R.; writing—review and editing, N.Y.V.; visualization, A.P.P.; project administration, V.M.L. and E.I.P. All authors have read and agreed to the published version of the manuscript.
Funding
The study was conducted at the Russian State Hydrometeorological University within the framework of the State Assignment of the Ministry of Science and Higher Education of the Russian Federation, Project No. FSZU-2020-0009.
Institutional Review Board Statement
Not applicable.
Informed Consent Statement
Not applicable.
Data Availability Statement
The remote sensing data images used in this research were obtained from https://hcvf.ru/ru (Accessed 15 June 2021) devoted to high conservation value forests (HCVFs). It is designed to provide all stakeholders with up-to-date information.
Acknowledgments
The authors acknowledge all study participants from the Institute of Forest and Nature Management (SPbFTU) and the Institute of Information Systems and Geotechnologies (RSHU). The authors thank O. Kolbina (RSHU) for scientific and technical advice on the development of databases.
Conflicts of Interest
The authors declare no conflict of interest.
References
- Tang, S.; Tang, L.; Shao, G.; Dai, L. Digital forestry research in China. Sci. ChinaSer. E 2006, 49, 1–8. [Google Scholar] [CrossRef]
- Abramov, V.; Fokicheva, A.; Istomin, E.; Sokolov, A.; Goloskvskaya, E.; Levina, A. Machine learning with digital generators for training sets including proteins modelling in the context of big data and block chain technologies. In Proceedings of the 33 rd International Business Information Management Association Conference, IBIMA 2019: Education Excellence and InnovationManagement through Vision 2020, Granada, Spain, 10–11 April 2019; pp. 8638–8642. [Google Scholar]
- Malinin, V.; Averkiev, A.; Tsarev, V.; Istomin, E.; Petrov, Y. Use of statistical models to predict how different regions of the Arctic and the Northern Hemi sphere will reachanice-freeregime. In Proceedings of the IOP Conference Series: Earth and Environmental Science, Smolensk, Russia, 25 January 2021; p. 042079. [Google Scholar] [CrossRef]
- Istomin, E.; Stepanov, S.; Petrov, Y.; Kolbina, O.; Sidorenko, A. Model of optimum integration of diverse geodata for the benefit of management of forestry. In Proceedings of the IOP Conference Series: Earth and Environmental Science: IV scientific-technical conference “Forests of Russia: Policy, Industry, Science and Education”, Saint Petersburg, Russia, 22–24 May 2019; Institute of Physics Publishing: Bristol, UK, 2019; p. 012013. [Google Scholar] [CrossRef]
- Strimbu, B.M.; Amarioarei, A.; Paun, M. Nonlinear parsimonious forest modelling as summing normal distribution of residuals. Eur. J. For. Res. 2021, 140, 659–674. [Google Scholar] [CrossRef]
- Speiser, J.L.; Miller, M.E.; Tooze, J.; Ip, E. A comparison of random forest variable select ion methods for classification prediction modelling. ExpertSyst. Appl. 2019, 134, 93–101. [Google Scholar] [CrossRef] [PubMed]
- Shifley, S.R.; He, H.S.; Lischke, H.; Wang, W.J.; Jin, W.; Gustafson, E.J.; Thompson, J.R.; Thompson, F.R., III; Dijak, W.D.; Yang, J.; et al. The past and future of modelling forest dynamics: From growth and yield curvest o forest landscape models. Landsc. Ecol. 2017, 32, 1307–1325. [Google Scholar] [CrossRef]
- Gao, Y.; Lu, D.; Li, G.; Wang, G.; Chen, Q.; Liu, L.; Li, D. Comparative analysis of modelling algorithms for forest aboveground biomass estimation in a subtropical region. Remote Sens. 2018, 10, 627. [Google Scholar] [CrossRef] [Green Version]
- Knapp, N.; Fischer, R.; Huth, A. Linking lidar and forest modelling to assess biomass estimation a cross scales and disturbance states. Remote Sens. Environ. 2018, 205, 199–209. [Google Scholar] [CrossRef]
- Huang, J.; Lucash, M.S.; Scheller, R.M.; Klippel, A. Walking through the forest soft hefuture: Usingdata-driven virtual realityto visualize forest sunder climate change. Int. J. Geogr. Inf. Sci. 2021, 35, 1155–1178. [Google Scholar] [CrossRef]
- Zhang, Y.; Wu, H.; Yang, W. Forests growth monitoring based on treecanopy3D reconstruction using UA Vaerialphotogrammetry. Forests 2019, 10, 1052. [Google Scholar] [CrossRef] [Green Version]
- Chen, Y.; Zhang, W.; Hu, R.; Qi, J.; Shao, J.; Li, D.; Wang, P.; Qiao, C.; Shen, A.; Yan, G. Estimation of forest leaf area index using terrestrial laser scanning data and path length distribution model in open-canopy forests. Agric. For. Meteorol. 2018, 263, 323–333. [Google Scholar] [CrossRef]
- Kotlov, I.; Chernenkova, T. Modeling of Forest Communities’ Spatial Structure at the Regional Level through Remote Sensing and Field Sampling: Constraints and Solutions. Forests 2020, 11, 1088. [Google Scholar] [CrossRef]
- Favorskaya, M.N.; Zotin, A.G.; Danilin, I.M.; Smolentcheva, S.S. Realistic 3D-modeling of forest growth with natural effect. In Advances in Intelligent Decision Technologies; Springer: Berlin/Heidelberg, Germany, 2010; pp. 191–199. [Google Scholar]
- Ervin, S.M. Digital landscape modelling and visualization: A research agenda. Landsc. Urban Plan. 2001, 54, 49–62. [Google Scholar] [CrossRef]
- Getzin, S.; Wiegand, T.; Wiegand, K.; He, F. Heterogeneity influences spatial patterns and demographics in forest stands. J. Ecol. 2008, 96, 807–820. [Google Scholar] [CrossRef]
- Aussenac, G. Interactions between forest stand sand microclimate: Ecophysiological aspect sand consequences for silviculture. Ann. For. Sci. 2000, 57, 287–301. [Google Scholar] [CrossRef]
- Assmann, E. The Principles of Foresty Yield Study: Studies in the Organic Production, Structure, Increment and Yield of Forest Stands; Elsevier: Amsterdam, The Netherlands, 2013. [Google Scholar]
- Jactel, H.; Nicoll, B.C.; Branco, M.; Gonzalez-Olabarria, J.R.; Grodzki, W.; Långström, B.; Moreira, F.; Netherer, S.; Orazio, C.; Piou, D.; et al. The influences of forest stand management on biotic and abiotic risks of damage. Ann. For. Sci. 2009, 66, 701. [Google Scholar] [CrossRef]
- Rosell, J.R.; Llorens, J.; Sanz, R.; Arno, J.; Ribes-Dasi, M.; Masip, J.; Escolà, A.; Camp, F.; Solanelles, F.; Gràcia, F.; et al. Obtaining the three-dimensional structure of tree or chards from remote 2D terrestrial LIDAR scanning. Agric. For. Meteorol. 2009, 149, 1505–1515. [Google Scholar] [CrossRef] [Green Version]
- Tkacheva, A.A. Using remote sensing data in three-dimensional modelling of natural landscape scenes. Bull. Sib. State Aerosp. Univ. Named Acad. M.F. Reshetnev 2014, 5, 136–144. [Google Scholar]
- Favorskaya, M.; Zotin, A.; Chunina, A. Procedural modelling of broad–leaved tree sunder weather conditions in 3D virtual reality. Smart Innov. Syst. Technol. 2011, 11, 51–59. [Google Scholar] [CrossRef]
- Adeline, K.R.; Briottet, X.; Lefebvre, S.; Rivière, N.; Gastellu-Etchegorry, J.P.; Vinatier, F. Impact of tree crown transmittance on surface reflectance retrieval in the shade for high spatial resolution imaging spectroscopy: A simulation analysis based on tree modelling scenarios. Remote Sens. 2021, 13, 931. [Google Scholar] [CrossRef]
- Vagizov, M.R.; Ustyugov, V.A.; Kvochkin, D.O. Determination of the forest inventory indicators according to the photograph soft he unmanned aerial vehicles. Ecol. Environ. Conserv. 2017, 23, 582–586. [Google Scholar]
- Vagizov, M.; Potapov, A.; Navalikhin, S.; Bakeyeva, A.; Stepanov, S. Application of ensemble machine learning methods for modelling the heights of individual forest elements based on inventory data processing. In Proceedings of the IOP Conference Series: Earth and Environmental Science, II All-Russian scientific-technical conference “Digital Technologies inForest Sector”, Saint-Petersburg, Russia, 18–19 March 2021; Volume 806, p. 012035. [Google Scholar] [CrossRef]
- Vagizov, M.R.; Dobrovolskyi, A.A.; Istomin, E.P.; Zhernova, A.P.; Yagotintceva, N.V. Technological aspects of the development of the automated method of air-photo interpretation of forest stands. In Proceedings of the IOP Conference Series: Earth and Environmental Science: “Forests of Russia: Policy, Industry, Science and Education”, Saint-Petersburg, Russia, 16–18 June 2020; p. 012023. [Google Scholar] [CrossRef]
- Chauhan, K.; Jani, S.; Thakkar, D.; Dave, R.; Bhatia, J.; Tanwar, S.; Obaidat, M.S. Automated Machine Learning: The New Wave of Machine Learning. In Proceedings of the 2nd International Conference on Innovative Mechanisms for Industry Applications, ICIMIA2020—Conference Proceedings, Bangalore, India, 5–7 March 2020; pp. 205–212. [Google Scholar] [CrossRef]
- Prudius, A.A.; Karpunin, A.A.; Vlasov, A.I. Analysis of machine learning methods to improve efficiency of big data process in gin Industry 4.0. In Proceedings of the Journal of Physics: Conference Series: International Conference “Information Technologies in Business and Industry”—2—Mathematical Simulation and Computer Data Analysis, Novosibirsk, Russia, 13–15 February 2019; Institute of Physics Publishing: Bristol, UK, 2019; p. 032065. [Google Scholar] [CrossRef]
- Marconi, S.; Graves, S.J.; Gong, D.; Nia, M.S.; Le Bras, M.; Dorr, B.J.; Fontana, P.; Gearhart, J.; Greenberg, C.; Harris, D.J.; et al. A data science challenge for converting airborne remote sensing data into ecological information. PeerJ 2019, 6, e5843. [Google Scholar] [CrossRef] [Green Version]
- Kussul, N.; Lavreniuk, M.; Skakun, S.; Shelestov, A. Deep Learning Classification of Land Cover and Crop Types Using Remote Sensing Data. IEEE Geosci. Remote Sens. Lett. 2017, 14, 778–782. [Google Scholar] [CrossRef]
- Ren, W.; Sloderbeck, M.; Steurer, M.; Dinavahi, V.; Noda, T.; Filizadeh, S.; Chevrefils, A.R.; Matar, M.; Iravani, R.; Dufour, C.; et al. Inter facing issues in real-time digital simulators. IEEE Trans. Power Deliv. 2010, 26, 1221–1230. [Google Scholar] [CrossRef]
- Mairaj, A.; Baba, A.I.; Javaid, A.Y. Application specific drone simulators: Recent advance sand challenges. Simul. Model. Pract. Theory 2019, 94, 100–117. [Google Scholar] [CrossRef] [Green Version]
- Sánchez, B.B.; Alcarria, R.; Sánchez-Picot, Á.; Sánchez-de-Rivera, D. A methodology for the design of application-specific cyber-physical social sensing co-simulators. Sensors 2017, 17, 2177. [Google Scholar] [CrossRef] [Green Version]
- Nitoslawski, S.A.; Wong-Stevens, K.; Steenberg, J.W.N.; Witherspoon, K.; Nesbitt, L.; Konijnendijkvanden-Bosch, C.C. The Digital Forest: Mapping a Decade of Knowledge on Technological Applications for Forest Ecosystems. Earth’s Future 2021, 9, e2021EF002123. [Google Scholar] [CrossRef]
- Sheridan, R.P.; Wang, W.M.; Liaw, A.; Ma, J.; Gifford, E.M. Extreme gradient boosting as a method for quantitative structure–activity relationships. J. Chem. Inf. Modeling 2016, 56, 2353–2360. [Google Scholar] [CrossRef] [PubMed]
- Moisen, G.G.; Freeman, E.A.; Blackard, J.A.; Frescino, T.S.; Zimmermann, N.E.; Edwards, T.C., Jr. Predicting tree species presence and basal area in Utah: A comparison of stochastic gradient boosting, generalized additive models, and tree-based methods. Ecol. Model. 2006, 199, 176–187. [Google Scholar] [CrossRef]
- Guelman, L. Gradient boosting trees for auto insurance loss cost modelling and prediction. Expert Syst. Appl. 2012, 39, 3659–3667. [Google Scholar] [CrossRef]
- Sun, S.; Cao, Z.; Zhu, H.; Zhao, J. A survey of optimization methods from a machine learning perspective. IEEE Trans. Cybern. 2019, 50, 3668–3681. [Google Scholar] [CrossRef] [PubMed] [Green Version]
- Liu, H.; Lang, B. Machine learning and deep learning methods for intrusion detection systems: Asurvey. Appl. Sci. 2019, 9, 4396. [Google Scholar] [CrossRef] [Green Version]
- Wei, J.; Chu, X.; Sun, X.Y.; Xu, K.; Deng, H.X.; Chen, J.; Wei, Z.; Lei, M. Machine learning in materials science. InfoMat 2019, 1, 338–358. [Google Scholar] [CrossRef]
- Zhang, Y.; Rajapakse, J.C. Machine Learning in Bioinformatics; John Wiley & Sons: Hoboken, NJ, USA, 2009; Volume 4. [Google Scholar]
- Belyakov, S.L.; Belyakova, L.; Glushkov, A.A. Meta-transformations of image sin these arch for reliable solutions in intelligent geoinformation systems. Inf. Technol. 2016, 22, 836–842. [Google Scholar]
- Medvedev, I.V.; Ptitsyna, L.K. Optimization of planners for intelligent geoinformation systems. In Actual Problems of Infotelecommunications in Science and Education: Collection of Scientific Articles; Bachevsky, S.V., Ed.; Saint Petersburg State University of Telecommunications Named after prof. Bonch-Bruevich, M.A.: Saint Petersburg, Russia, 2017; Volume 4, pp. 333–337. [Google Scholar]
- Belyakov, S.L.; Bozhenyuk, A.V.; Belyakova, M.L.; Zubkov, S.A. Case based reason in gin intelligent geographic information systems for the management of logistics projects. In Proceedings of the Fuzzy Technologies in the Industry—FTI 2018: II International Scientific and Practical Conference, Ulyanovsk, Russia, 23–25 October 2018; Ulyanovsk State Technical University: Ulyanovsk, Russia, 2018; pp. 1–10. [Google Scholar]
- Zhukova, N.A. Design patterns of object-oriented intelligent geoinformation systems. Izv. Spbgetu. Leti. 2014, 6, 20–26. [Google Scholar]
- Hernández, J.; Garcıa, L.; Ayuga, F. Integration methodologies for visual impact assessment of rural buildings by geographic information systems. Biosyst. Eng. 2004, 88, 255–263. [Google Scholar] [CrossRef]
- Langran, G. Time in Geographic Information Systems; CRC Press: Boca Raton, FL, USA, 2020. [Google Scholar]
- Indirabai, I.; Nair, M.H.; Nair, J.R.; Nidamanuri, R.R. Direct estimation of leaf area index of tropical forests using LiDAR point cloud. Remote Sens. Appl. Soc. Environ. 2020, 18, 100295. [Google Scholar] [CrossRef]
- Schneider, F.D.; Kükenbrink, D.; Schaepman, M.E.; Schimel, D.S.; Morsdorf, F. Quantifying 3Dstructure and occlusion in dense tropical and temperate forests using close-range LiDAR. Agric. For. Meteorol. 2019, 268, 249–257. [Google Scholar] [CrossRef]
- Hilker, T.; Wulder, M.A.; Coops, N.C. Update of forest inventory data with lidar and high spatial resolution satellite imagery. Can. J. Remote Sens. 2008, 34, 5–12. [Google Scholar] [CrossRef]
- Almeida, D.R.A.; Broadbent, E.N.; Zambrano, A.M.A.; Wilkinson, B.E.; Ferreira, M.E.; Chazdon, R.; Meli, P.; Gorgens, E.B.; Silva, C.A.; Stark, S.C.; et al. Monitoring the structure off or est restoration plantations with a drone-LiDAR system. Int. J. Appl. Earth Obs. Geoinf. 2019, 79, 192–198. [Google Scholar] [CrossRef]
- Smith, W.H. Air Pollution and Forests: Interactions between Air Contaminants and Forest Ecosystems; Springer Science & Business Media: Berlin/Heidelberg, Germany, 2012. [Google Scholar]
- Janssens, I.A.; Lankreijer, H.; Matteucci, G.; Kowalski, A.S.; Buchmann, N.; Epron, D.; Pilegaard, W.; Kutsch, W.; Longdoz, B.; Grünwald, T.; et al. Productivity overshadows temperature in determining soil and ecosystem respiration across European forests. Glob. Chang. Biol. 2001, 7, 269–278. [Google Scholar] [CrossRef]
- Rooney, T.P. Deer impacts on forest ecosystems: A North American perspective. For. An. Int. J. For. Res. 2001, 74, 201–208. [Google Scholar] [CrossRef] [Green Version]
- Wang, H.-C.; Chang, C.-T. The Dynamic of Vegetation Growth with Regular Climate and Climatic Fluctuations in a Subtropical Mountainous Island, Taiwan. Remote Sens. 2021, 13, 3298. [Google Scholar] [CrossRef]
Figure 1.
Selected study object.

Figure 2.
Result of image import and UV mapping: (a) selected area; (b) localized part.

Figure 3.
Creating a weight map of a forest quarter.

Figure 4.
Displaying trees in space.

Figure 5.
Forest model before the integration of remote sensing data.

Figure 6.
Final integration of data.

Figure 7.
Main components of the digital forest model creation process.

Figure 8.
Functional components of the digital model.

Figure 9.
Detailed forest model. Front view.

Figure 10.
Methodology for developing a visual digital forest model.


Table 1.
Accuracy factor according to material details.
| Meters | Resolution | Scale of Application | Accuracy Coefficient (Conv. Units) |
|---|---|---|---|
| 0.1–0.5 | Extremely high resolution | 1:500–1:5000 | 0.9 |
| 0.5–1.0 | Very high resolution | 1:5000–1:10,000 | 0.8 |
| 1–4 | High resolution | 1:10,000–1: 15,000 | 0.7 |
| 4–12 | Medium resolution | 1:15,000–1:25,000 | 0.6 |
| 12–50 | Moderate resolution | 1:25,000–1:10l,000 | 0.5 |
Publisher’s Note: MDPI stays neutral with regard to jurisdictional claims in published maps and institutional affiliations. |
© 2021 by the authors. Licensee MDPI, Basel, Switzerland. This article is an open access article distributed under the terms and conditions of the Creative Commons Attribution (CC BY) license (https://creativecommons.org/licenses/by/4.0/).
Share and Cite
MDPI and ACS Style
R., M.V.; P., E.I.; L., V.M.; P., A.P.; V., N.Y. Visual Digital Forest Model Based on a Remote Sensing Data and Forest Inventory Data. Remote Sens. 2021, 13, 4092. https://0-doi-org.brum.beds.ac.uk/10.3390/rs13204092
AMA Style
R. MV, P. EI, L. VM, P. AP, V. NY. Visual Digital Forest Model Based on a Remote Sensing Data and Forest Inventory Data. Remote Sensing. 2021; 13(20):4092. https://0-doi-org.brum.beds.ac.uk/10.3390/rs13204092
Chicago/Turabian StyleR., Marsel Vagizov, Eugenie Istomin P., Valerie Miheev L., Artem Potapov P., and Natalya Yagotinceva V. 2021. "Visual Digital Forest Model Based on a Remote Sensing Data and Forest Inventory Data" Remote Sensing 13, no. 20: 4092. https://0-doi-org.brum.beds.ac.uk/10.3390/rs13204092
Note that from the first issue of 2016, this journal uses article numbers instead of page numbers. See further details here.