Article

Quantification of Natural and Anthropogenic Driving Forces of Vegetation Changes in the Three-River Headwater Region during 1982–2015 Based on Geographical Detector Model

1
Shaanxi Key Laboratory of Earth Surface System and Environmental Carrying Capacity, College of Urban and Environmental Sciences, Northwest University, Xi’an 710127, China
2
Department of Physical Geography, College of Urban and Environmental Science, Northwest University, Xi’an 710127, China
3
Yellow River Conservancy Commission, Yellow River Institute of Hydraulic Research, Zhengzhou 450003, China
4
Heihe Water Resources and Ecological Protection Research Center, Lanzhou 730030, China
*
Author to whom correspondence should be addressed.
Remote Sens. 2021, 13(20), 4175; https://0-doi-org.brum.beds.ac.uk/10.3390/rs13204175
Submission received: 3 August 2021 / Revised: 14 October 2021 / Accepted: 15 October 2021 / Published: 19 October 2021
(This article belongs to the Topic Climate Change and Environmental Sustainability)

Abstract

:
The three-river headwater region (TRHR) supplies the Yangtze, Yellow, and Lantsang rivers, and its ecological environment is fragile, hence it is important to study the surface vegetation cover status of the TRHR to facilitate its ecological conservation. The normalized difference vegetation index (NDVI) can reflect the cover status of surface vegetation. The aims of this study are to quantify the spatial heterogeneity of the NDVI, identify the main driving factors influencing the NDVI, and explore the interaction between these factors. To this end, we used the global inventory modeling and mapping studies (GIMMS)-NDVI data from the TRHR from 1982 to 2015 and included eight natural factors (namely slope, aspect, elevation, soil type, vegetation type, landform type, annual mean temperature, and annual precipitation) and three anthropogenic factors (gross domestic product (GDP), population density, and land use type), which we subjected to linear regression analysis, the Mann-Kendall statistical test, and moving t-test to analyze the spatial and temporal variability of the NDVI in the TRHR over 34 years, using a geographical detector model. Our results showed that the NDVI distribution of the TRHR was high in the southeast and low in the northwest. The change pattern exhibited an increasing trend in the west and north and a decreasing trend in the center and south; overall, the mean NDVI value from 1982 to 2015 has increased. Annual precipitation was the most important factor influencing the NDVI changes in the TRHR, and factors, such as annual mean temperature, vegetation type, and elevation, also explained the vegetation coverage status well. The influence of natural factors was generally stronger than that of anthropogenic factors. The NDVI factors had a synergistic effect, exhibiting mutual enhancement and nonlinear enhancement relationships. The results of this study provide insights into the ecological conservation of the TRHR and the ecological security and development of the middle and lower reaches.

Graphical Abstract

1. Introduction

The vegetation cover is an important component of surface ecosystems that connects the atmosphere, hydrosphere, pedosphere, and areas inhabited by humans [1]; thus, the study of regional vegetation cover is essential to regional ecological conservation. The normalized difference vegetation index (NDVI) can accurately reflect the status of surface vegetation cover, which is the best indicator of vegetation coverage and the most effective indicator for monitoring regional vegetation change and the ecological environment [2,3]. Regional vegetation coverage changes and their drivers have been studied at different scales, including globally [4], as well as in Central Asia [5], northern China [6], the Loess Plateau [7], the Qinghai–Tibet Plateau [8], the Yangtze River Basin [9], and the Amur-Heilongjiang River Basin [10], using the NDVI.
The geographical detector model proposed by Wang et al. [11] bridges the gap between the correlation analysis methods used in previous studies, and can quantify the spatial heterogeneity of vegetation and its driving factors, as well as the interaction between factors. This method has been successfully used to quantify the influence of driving factors on vegetation change. Zhao et al. [12] found that precipitation plays a crucial role in the growth of vegetation in northern China and even in other arid regions of the world. Yuan et al. [13] showed that vegetation exhibited significant spatial heterogeneity throughout the Heihe River Basin. Zhu et al. [14] found that land use types and precipitation were the main factors driving vegetation change in the middle reaches of the Heihe River Basin. Ran et al. [15] concluded that natural factors had a greater influence on vegetation than anthropogenic factors in northern Tibet. Zhang et al. [16] found that the influence of anthropogenic factors was greater than that of natural factors in the oasis-desert ecotone. Liu et al. [17] reported that precipitation was the main factor affecting the difference in the spatial distribution of the NDVI in the Qinghai–Tibet Plateau.
The ecological conservation of river sources is of vital importance to the ecological environment and the development of the middle and lower reaches of rivers. Located in the hinterland of Qinghai–Tibet Plateau, the TRHR is a natural ecological barrier in China with special alpine vegetation system and fragile ecological environment. Vegetation coverage plays an important role in its preservation. Studying the spatial and temporal variation characteristics of vegetation in alpine areas and its driving forces can better explain the environmental change process. Previous studies on the characteristics of vegetation change in the TRHR have had short time series and incomplete datasets, therefore the conclusions obtained are inconsistent [18,19]. There remains a gap in studying the temporal and spatial changes of vegetation in long time series, which cannot accurately reflect the distribution characteristics of vegetation in the TRHR at both temporal and spatial scales. Previous studies on the driving factors of vegetation change in the TRHR have mostly been limited to examining the effect of climatic factors, such as temperature and precipitation [20,21,22], and, hence, there remains a lack of research on the influence of other natural and anthropogenic factors on the NDVI. Furthermore, the traditional methods, such as correlation analysis, used in the existing studies are not suitable for studying the interaction between factors and to quantitatively analyze the factors affecting NDVI. Therefore, the aims of the present study are to analyze the spatial and temporal variability of the NDVI in the TRHR over a 34-year period from 1982 to 2015, using linear regression analysis, the Mann-Kendall statistical test, and the moving t-test, and quantitatively investigate the natural and anthropogenic driving factors of NDVI variability and their interactions using a geographical detector that capable of identifying spatial heterogeneity. The results of this study provide a scientific basis for ecological restoration and conservation in the TRHR.

2. Materials and Methods
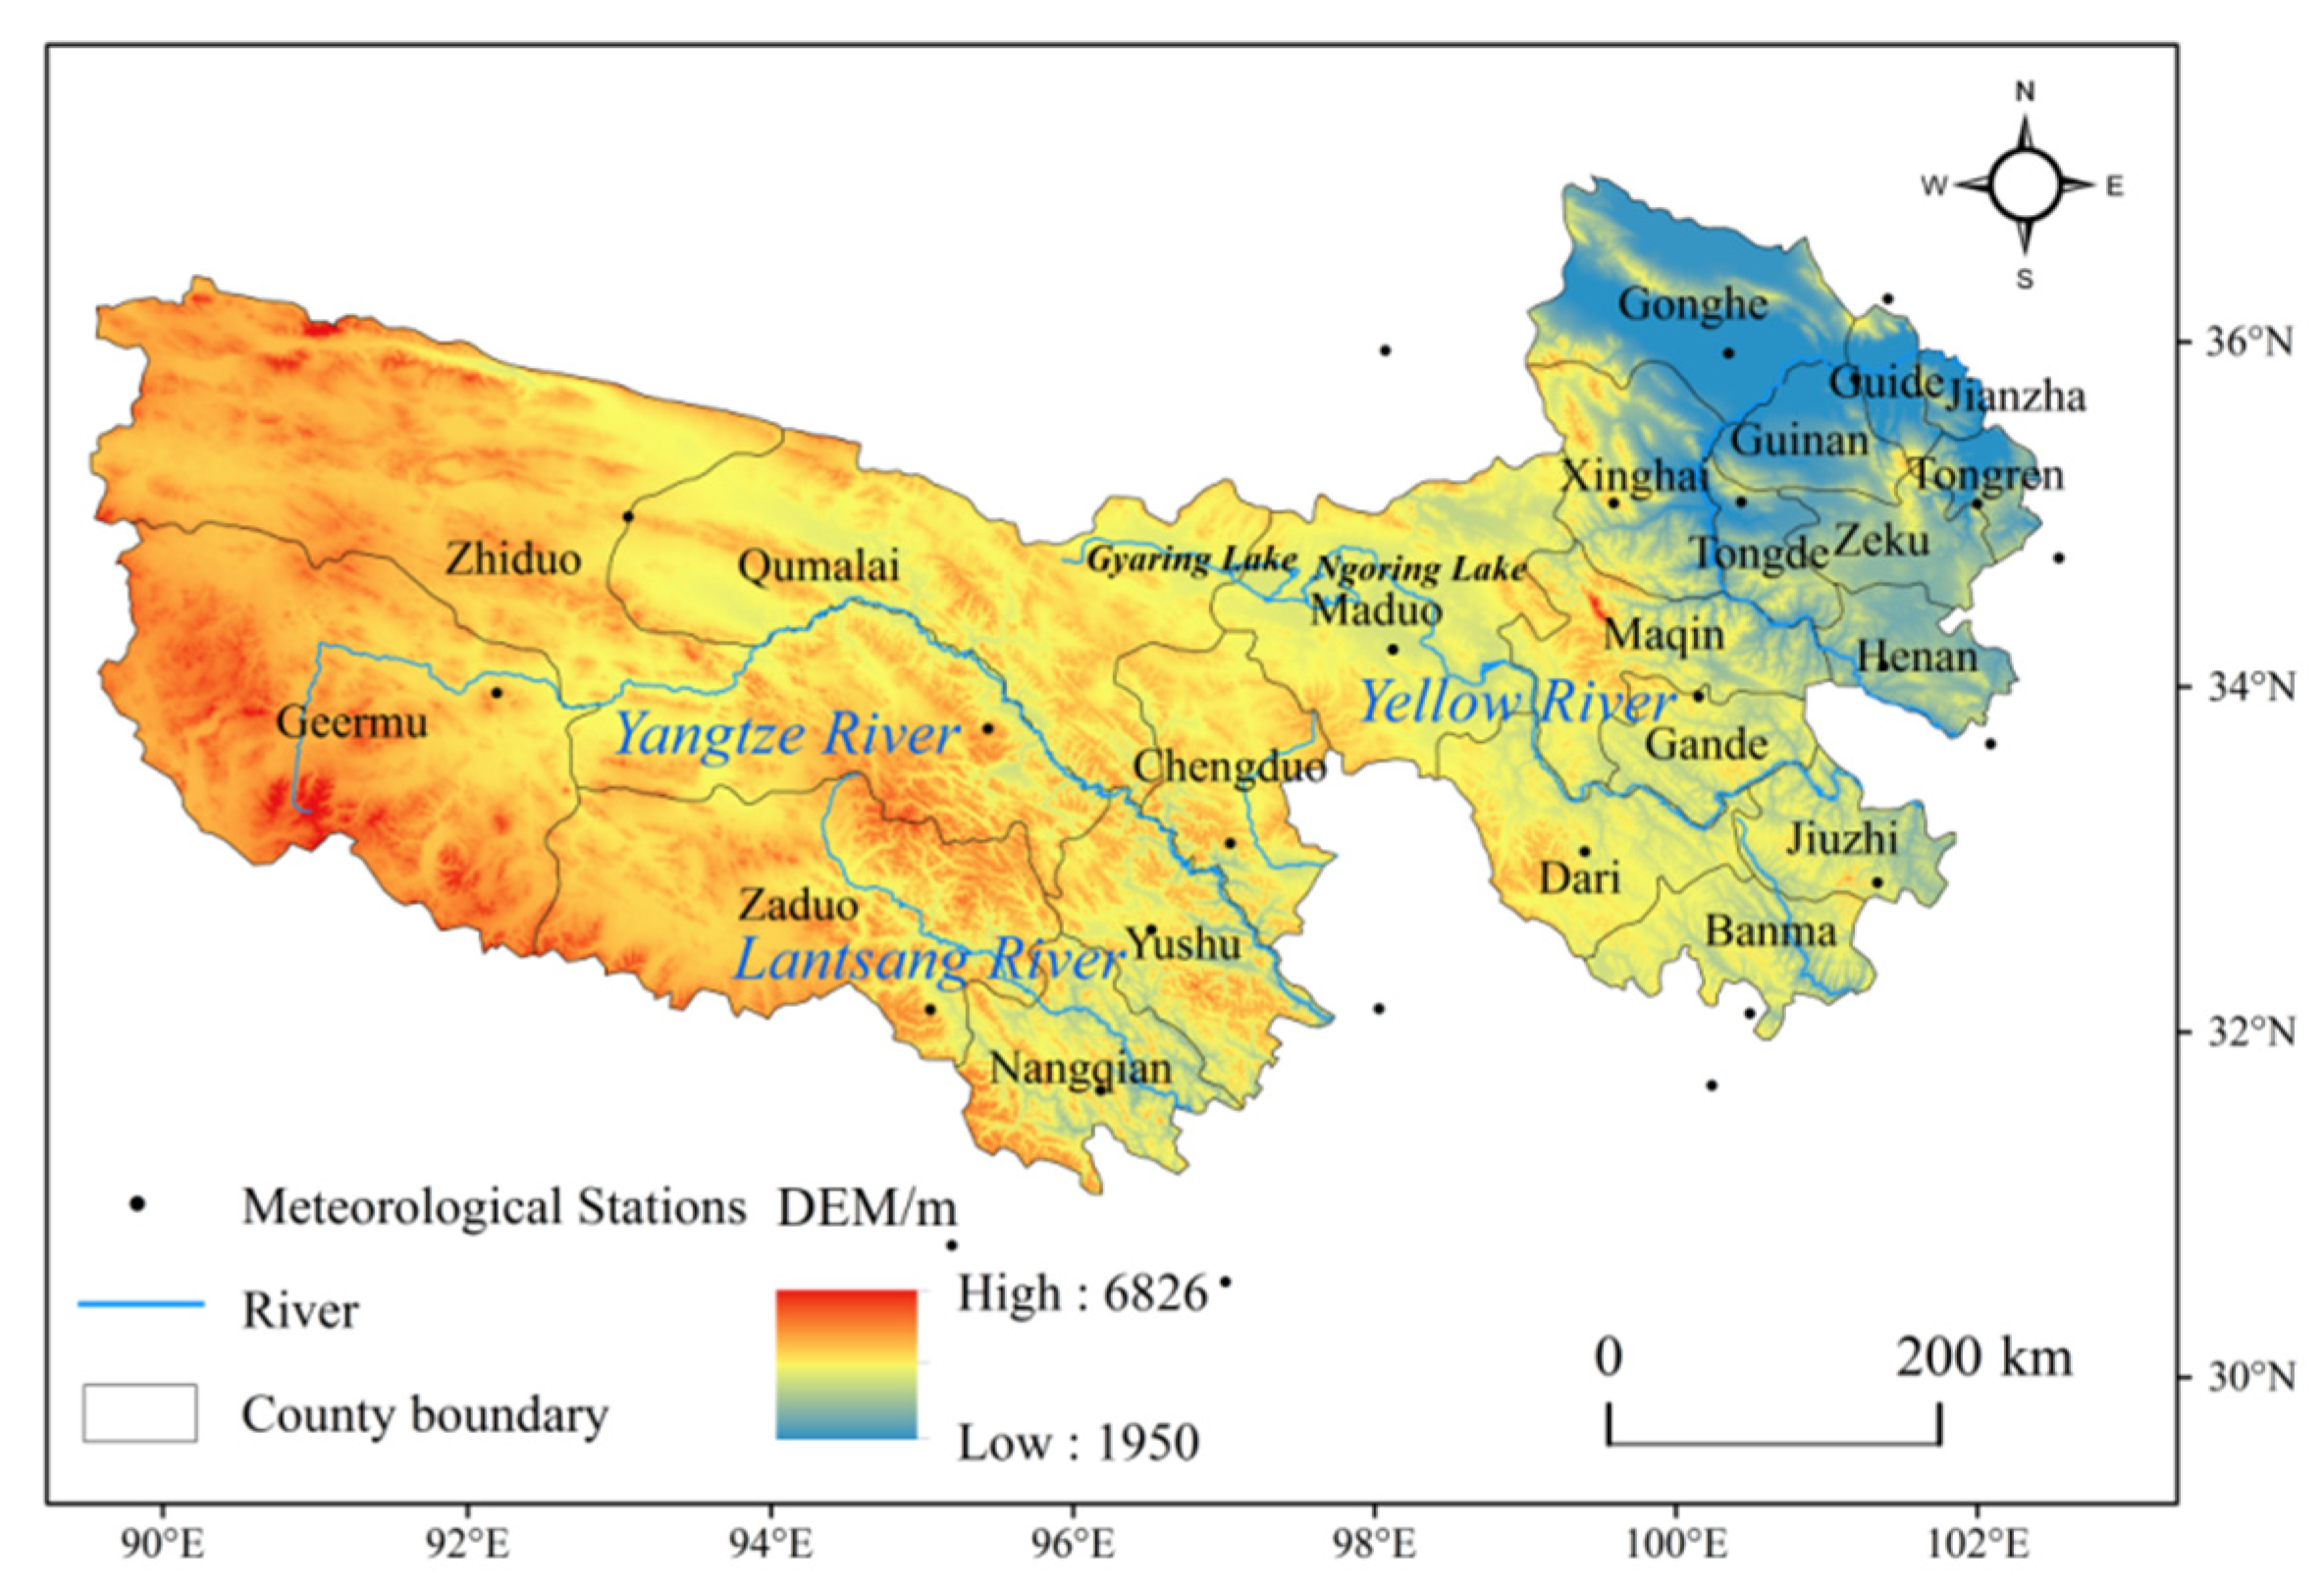
2.1. Study Area

The TRHR (31°39′N–36°16′N, 89°24′E–102°23′E) (Figure 1) is located south of Qinghai Province, and it supplies the Yangtze, Yellow, and Lantsang Rivers. It includes 21 counties and Tanggula Township, covering a total area of 38.1 × 10⁴ km2. The topography is high in the West and low in the East (Figure 2c), with an average altitude of 3500–4800 m. It has a continental plateau climate, with temperature and precipitation decreasing from the southeast to the northwest (Figure 2g,h). The main vegetation types are alpine meadows and alpine grasslands. The Qinghai–Tibet Plateau is a vast semi-natural area with relatively little artificial influence [23]. The TRHR is located in the central part of the Qinghai–Tibet Plateau, with high altitude and sparse population. The TRHR is an important ecological barrier in China with a fragile ecological environment; therefore, its ecological conservation is crucial for the sustainable development of a vast area in China.

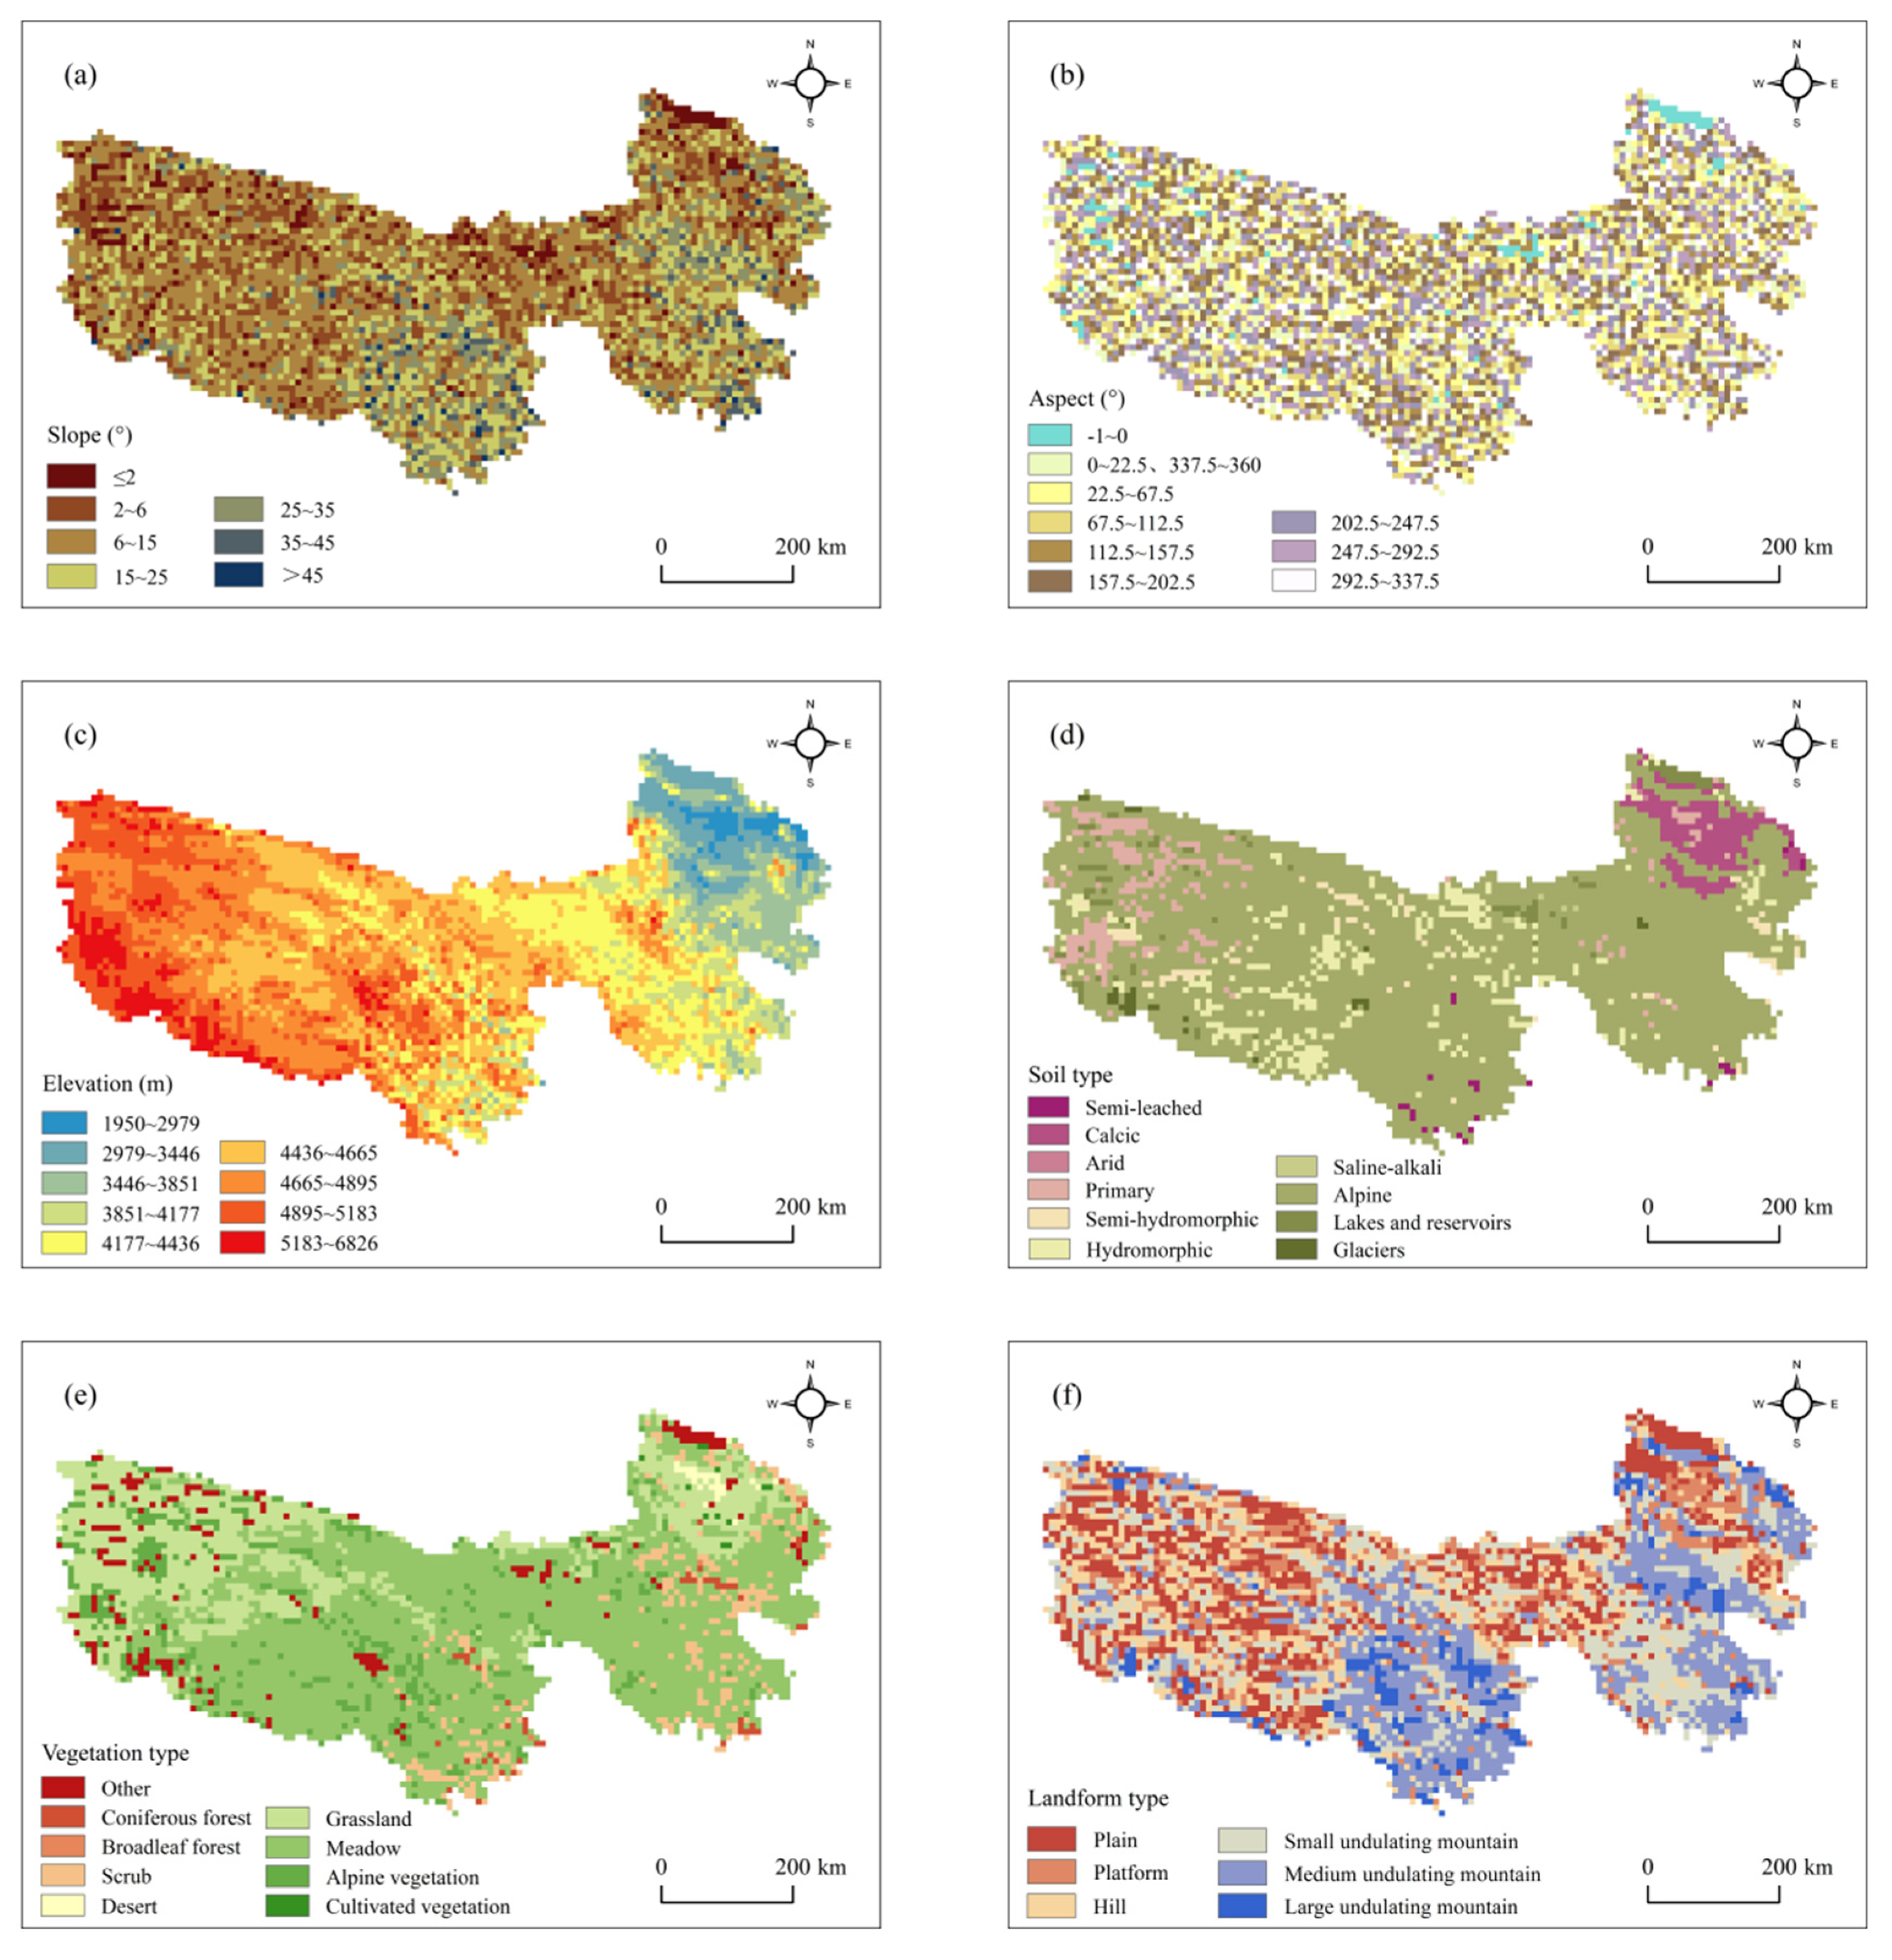
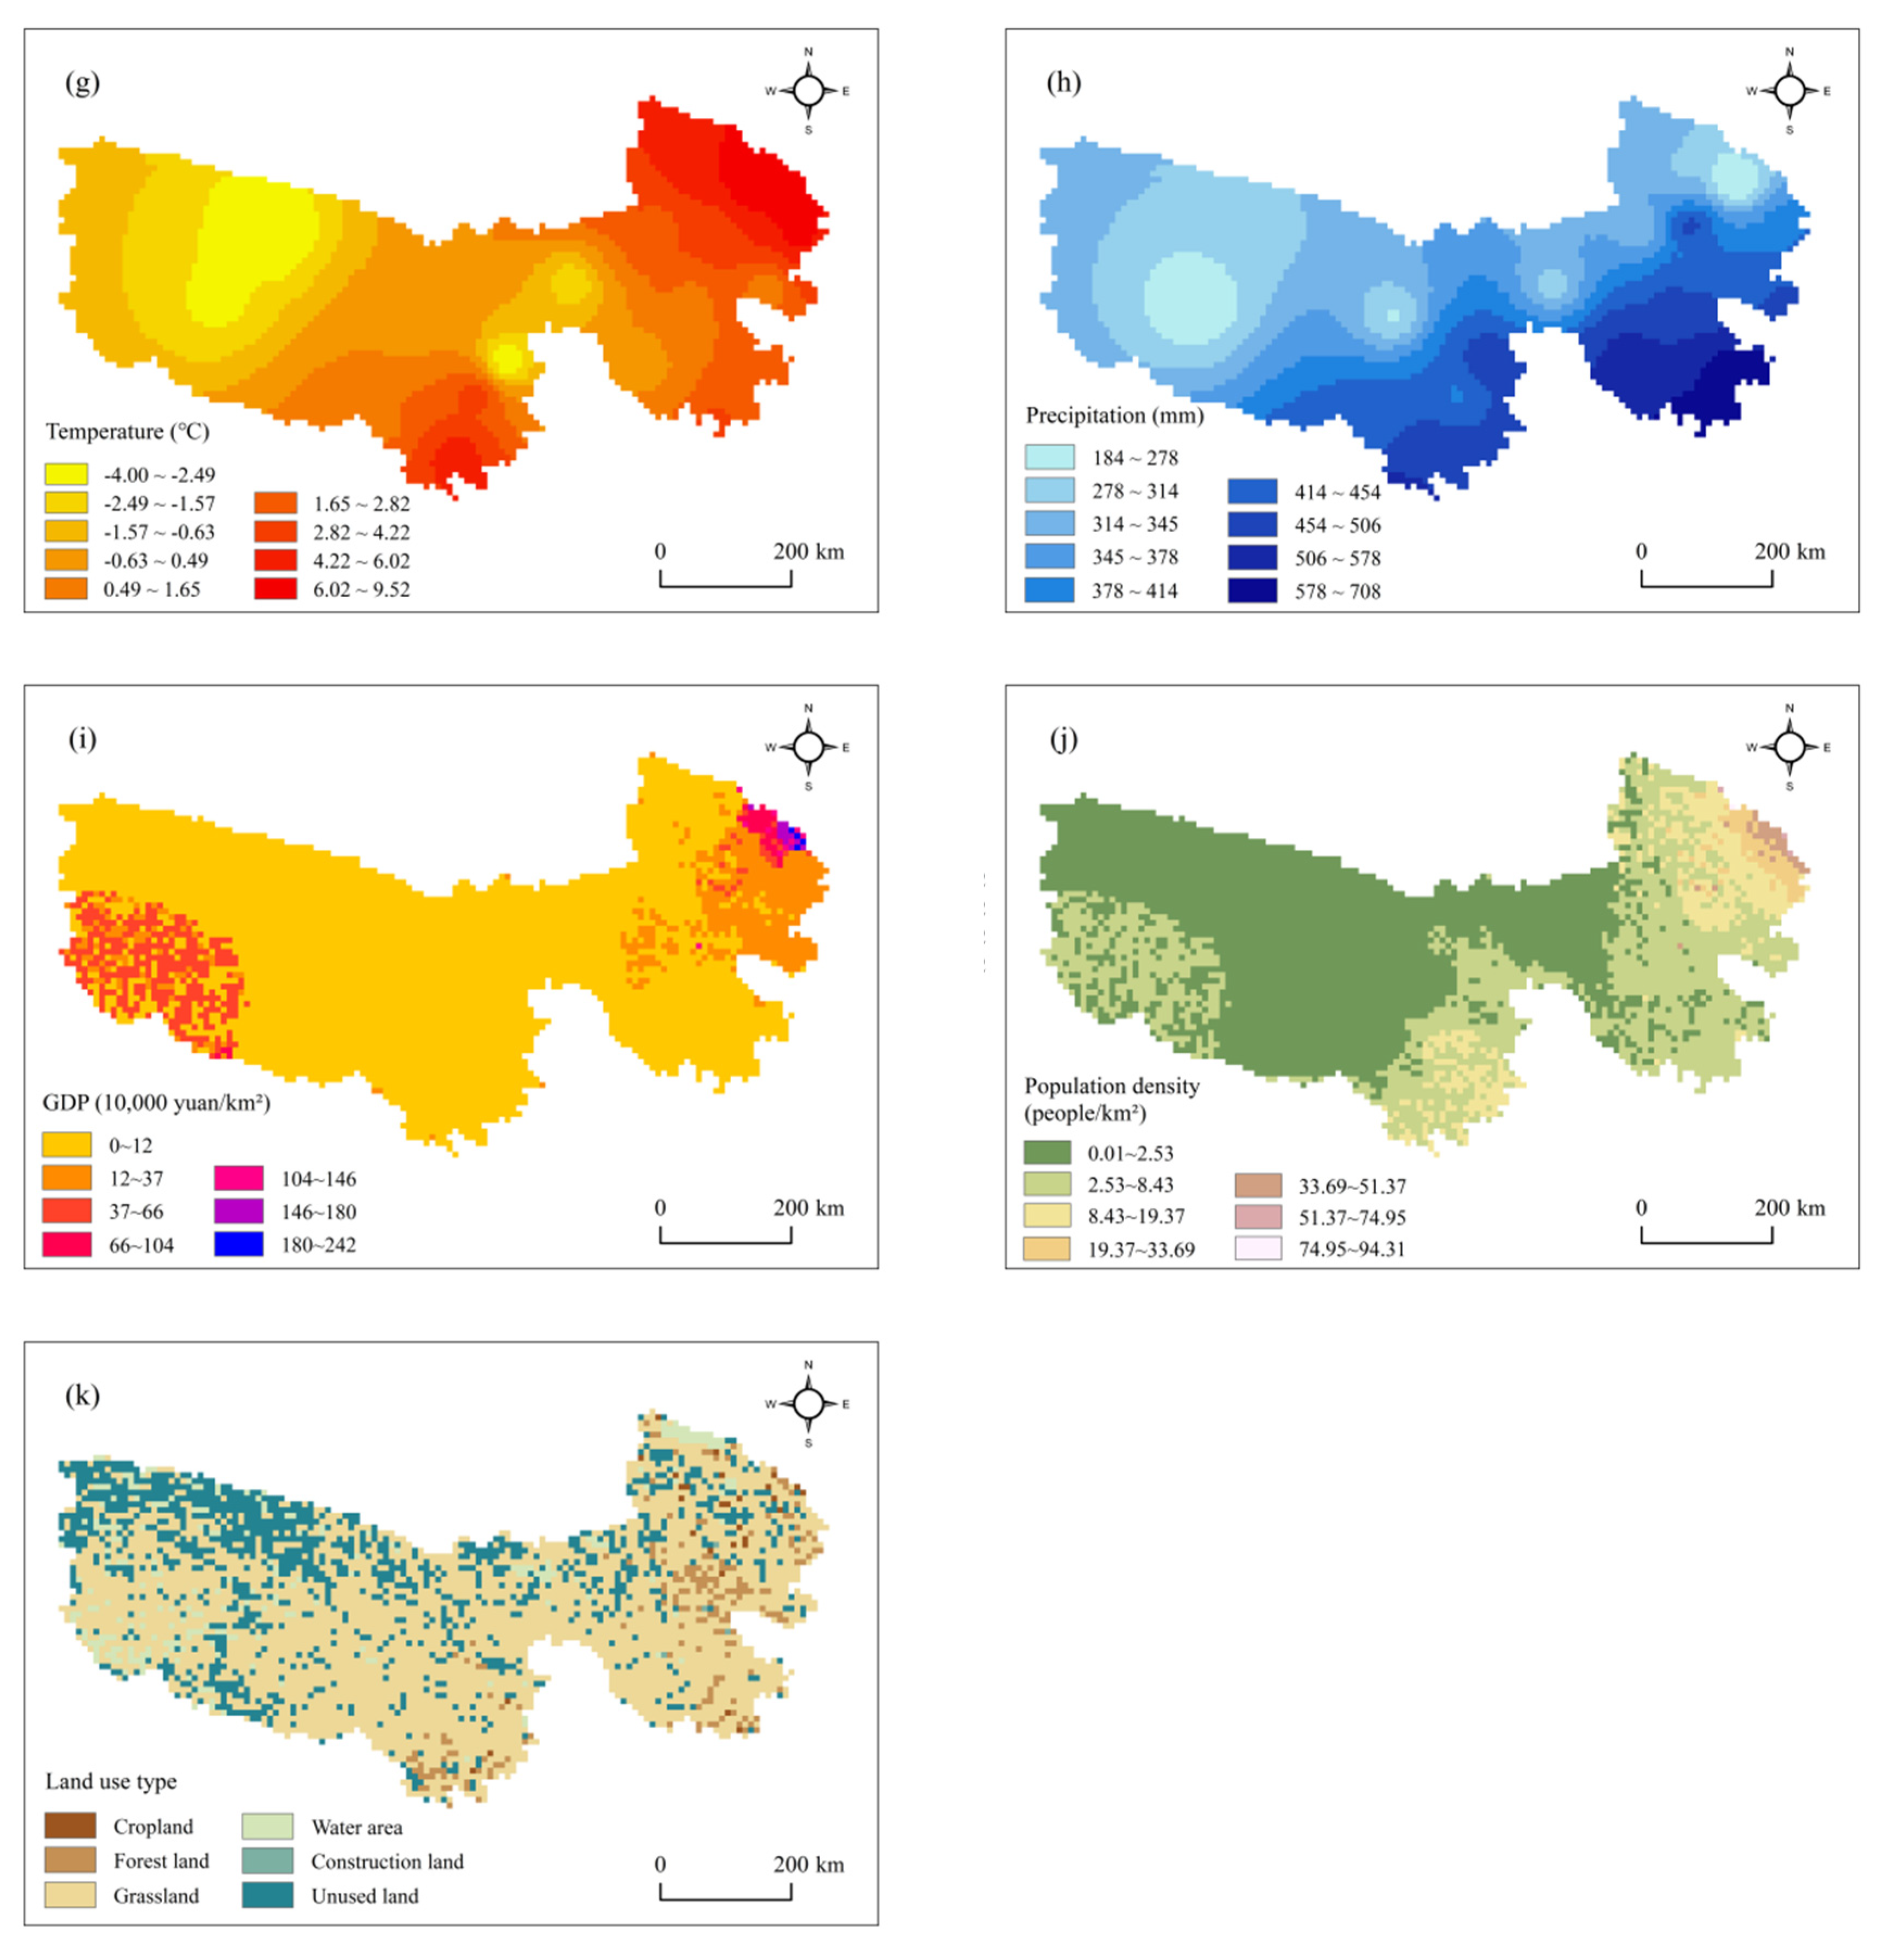
2.2. Data and Processing

The data included in this study included natural factors, such as the NDVI, digital elevation model (DEM), climate data, landform type, soil type, and vegetation type, as well as anthropogenic factors, such as land use type, population density, and GDP in the TRHR. NDVI data were obtained from the Big Earth Data Platform for Three Poles, using GIMMS NDVI3g data with a spatial resolution of 8 km and a temporal resolution of 16 days [24,25], the NDVI images for each year from 1982 to 2015 were obtained by maximum value composite (MVC) [26]. Vegetation coverage was divided into five classes according to NDVI values: low coverage (≤0.2), medium–low coverage (0.2–0.4), medium coverage (0.4–0.6), medium–high coverage (0.6–0.8), and high coverage (>0.8). The annual mean temperature and annual precipitation data were obtained from daily standard meteorological data of 26 meteorological stations in and around the TRHR from 1982 to 2015 using the inverse distance weighting method. DEM data were GDEMV2 30 m resolution digital elevation data from the Geospatial Data Cloud of the Chinese Academy of Sciences (http://www.gscloud.cn/ (accessed on 3 August 2021)), and the elevation, slope, and aspect data were obtained from the DEM data. Other data were obtained from the Resource and Environmental Sciences Data Center of the Chinese Academy of Sciences (http://www.resdc.cn/ (accessed on 3 August 2021)). All the above data were extracted according to the vector boundary of the TRHR [27] and were resampled to make them consistent with the 8-km NDVI data image. Using ArcGIS to create a fishnet, 5853 random sampling points were generated based on 8 × 8 km grids according to the scope of the TRHR, and the spatial attribute values were extracted.
We selected NDVI as the dependent variable and six categories of topography (slope, aspect, elevation), soil (soil type), vegetation (vegetation type), landform (landform type), climate (annual mean temperature, annual precipitation), and human activity (GDP, population density, land use type), a total of 11 representative and easily quantifiable factors, as independent variables. Precipitation and temperature are important factors affecting vegetation changes [21], elevation, slope, aspect, and landform type affect vegetation distribution by changing water and heat conditions [28]. Soil and vegetation types are important environmental elements for vegetation growth [29]; economic development affects ecological environment, land use type, GDP, and population density are indicators that can quantify changes in socioeconomic development [30]. The independent variables in the geographical detector model must use discrete quantities, therefore we have to classify the factors. According to the actual situation of the TRHR, slope was divided into 7 categories according to the Technical Regulations for Land Use Status Survey; aspect was divided into 9 categories according to slope orientation; Soil type was divided into 10 categories according to the traditional “Soil Occurrence Classification” system; vegetation type was divided into 9 categories according to the 1:1,000,000 Chinese Vegetation Atlas; landform type was divided into 6 categories according to the 1:1,000,000 Landform Atlas of the People’s Republic of China; land use type was divided into 6 categories according to the 1:1,000,000 Land Use Map of China; the elevation, annual mean temperature and annual precipitation were divided into 9 categories according to the natural breakpoint method [31], and the GDP and population density were divided into 7 categories according to the natural breakpoint method [31] (Figure 2).

2.3. Methods

2.3.1. Linear Regression Analysis

Linear regression analysis can analyze the trend of each raster in an image [32]. The raster calculator of ArcGIS was used to analyze the NDVI trend of each image element in the TRHR from 1982 to 2015, and categorized the NDVI change trend into seven classes according to the natural breakpoint method [31]: significant degradation, moderate degradation, slight degradation, basically unchanged, slight improvement, moderate improvement, and significant improvement. The slope can be calculated through Equation (1) [32]:
S l o p e = n × i = 1 n ( i × N D V I i ) ( i = 1 n i ) ( i = 1 n N D V I i ) n × i = 1 n i 2 ( i = 1 n i ) 2
In Equation (1): n is the total number of the year series ( n = 34 in this study), i ranges from 1 to n, N D V I i is the NDVI value of the i th year, and S l o p e is the variation trend of the NDVI; if S l o p e > 0, the vegetation coverage shows an increasing trend; if S l o p e < 0, the vegetation coverage shows a decreasing trend; if S l o p e = 0, there is no significant change in the vegetation coverage.

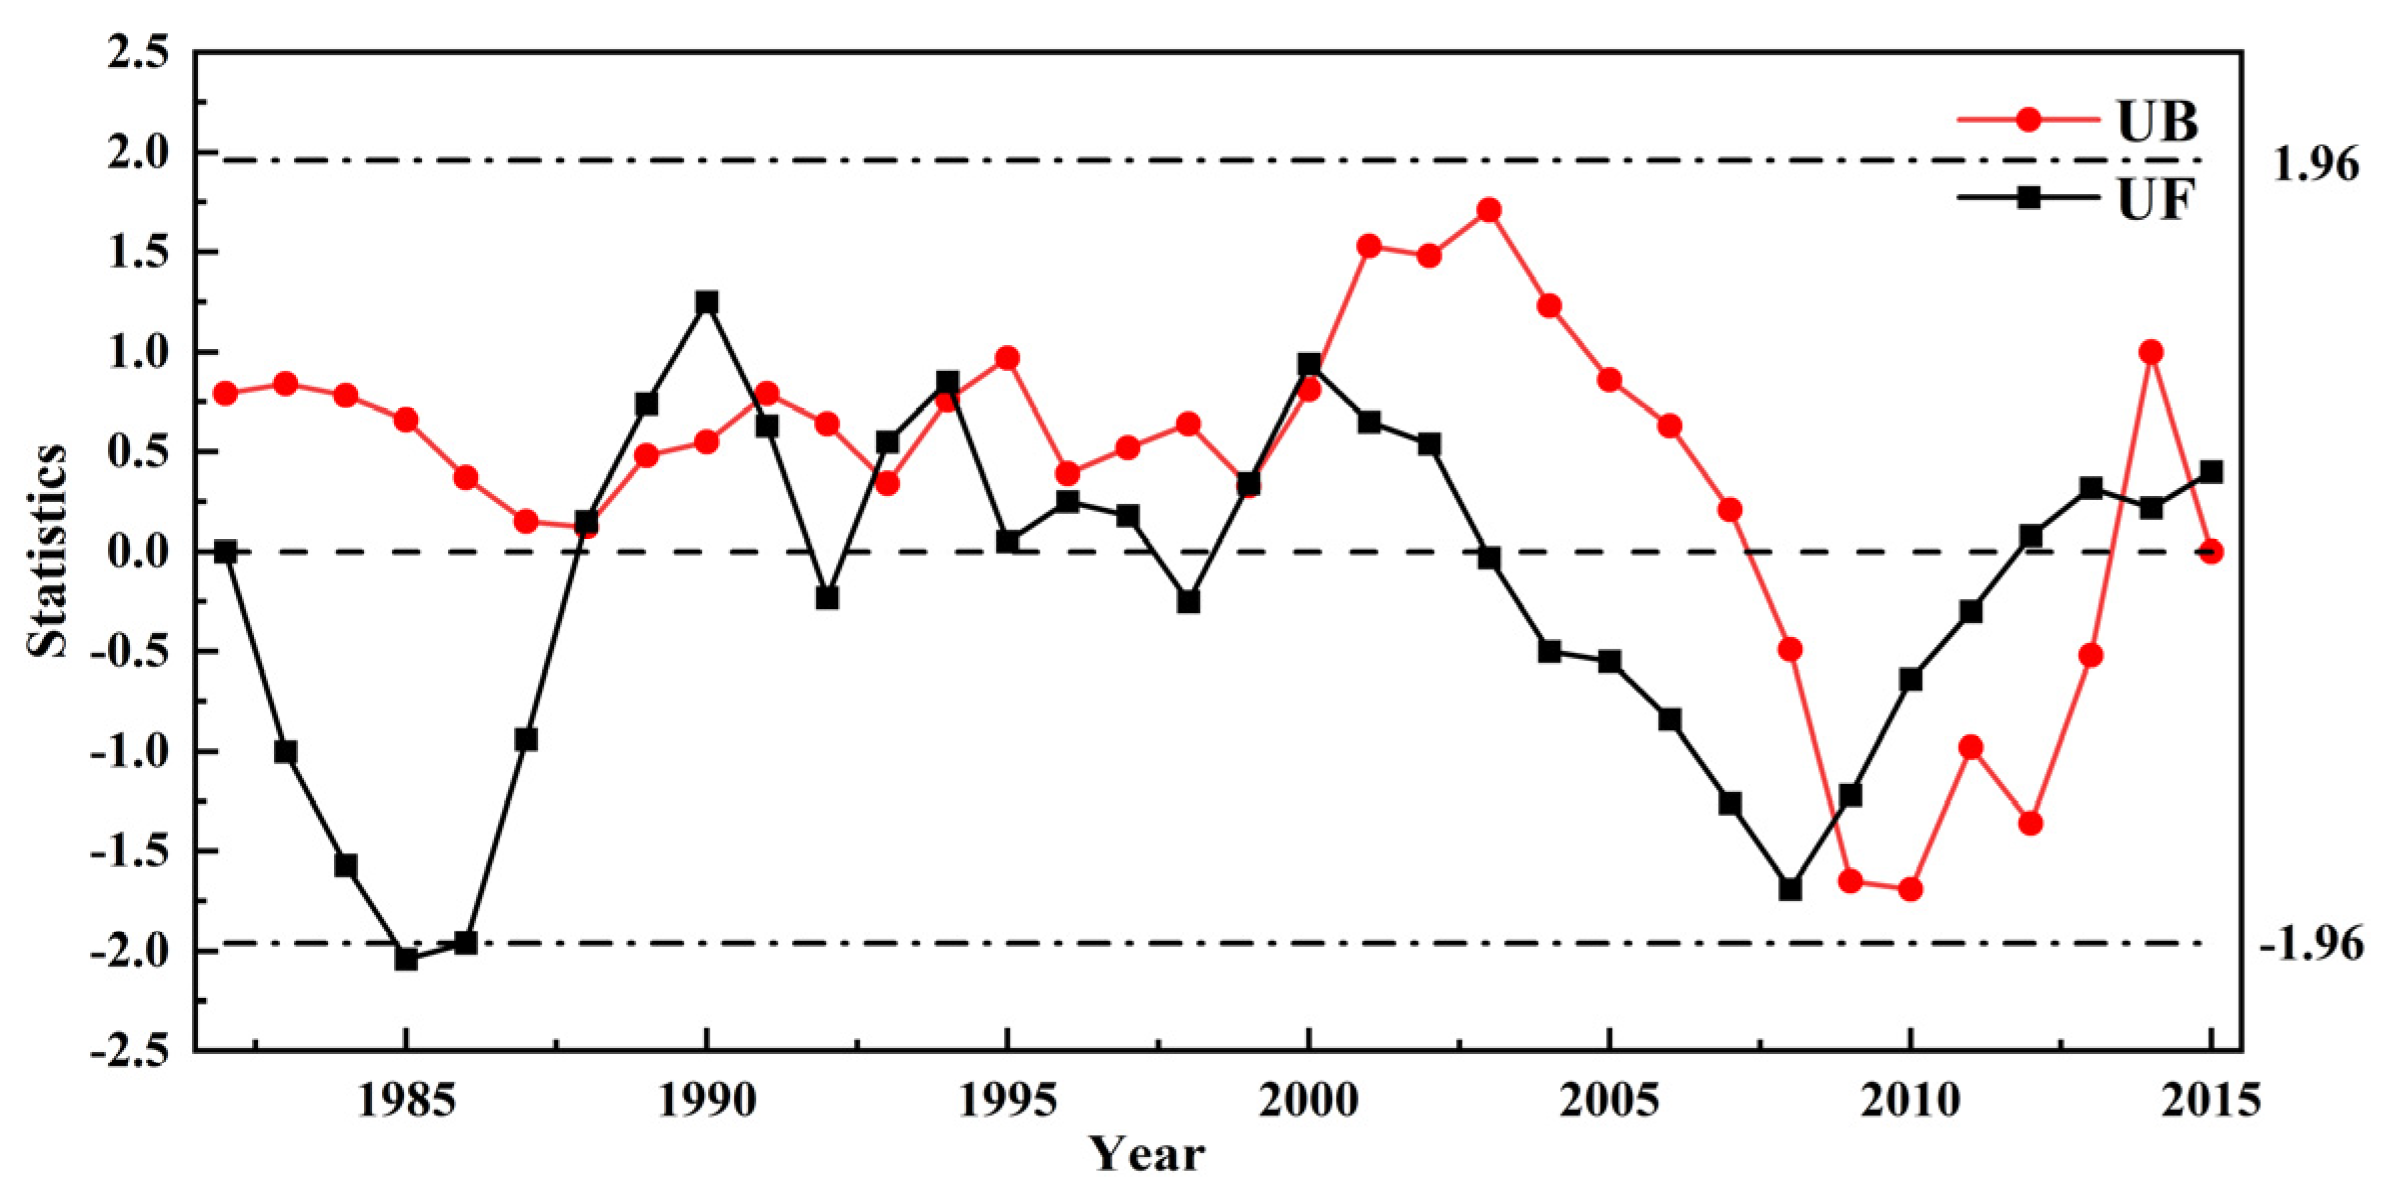
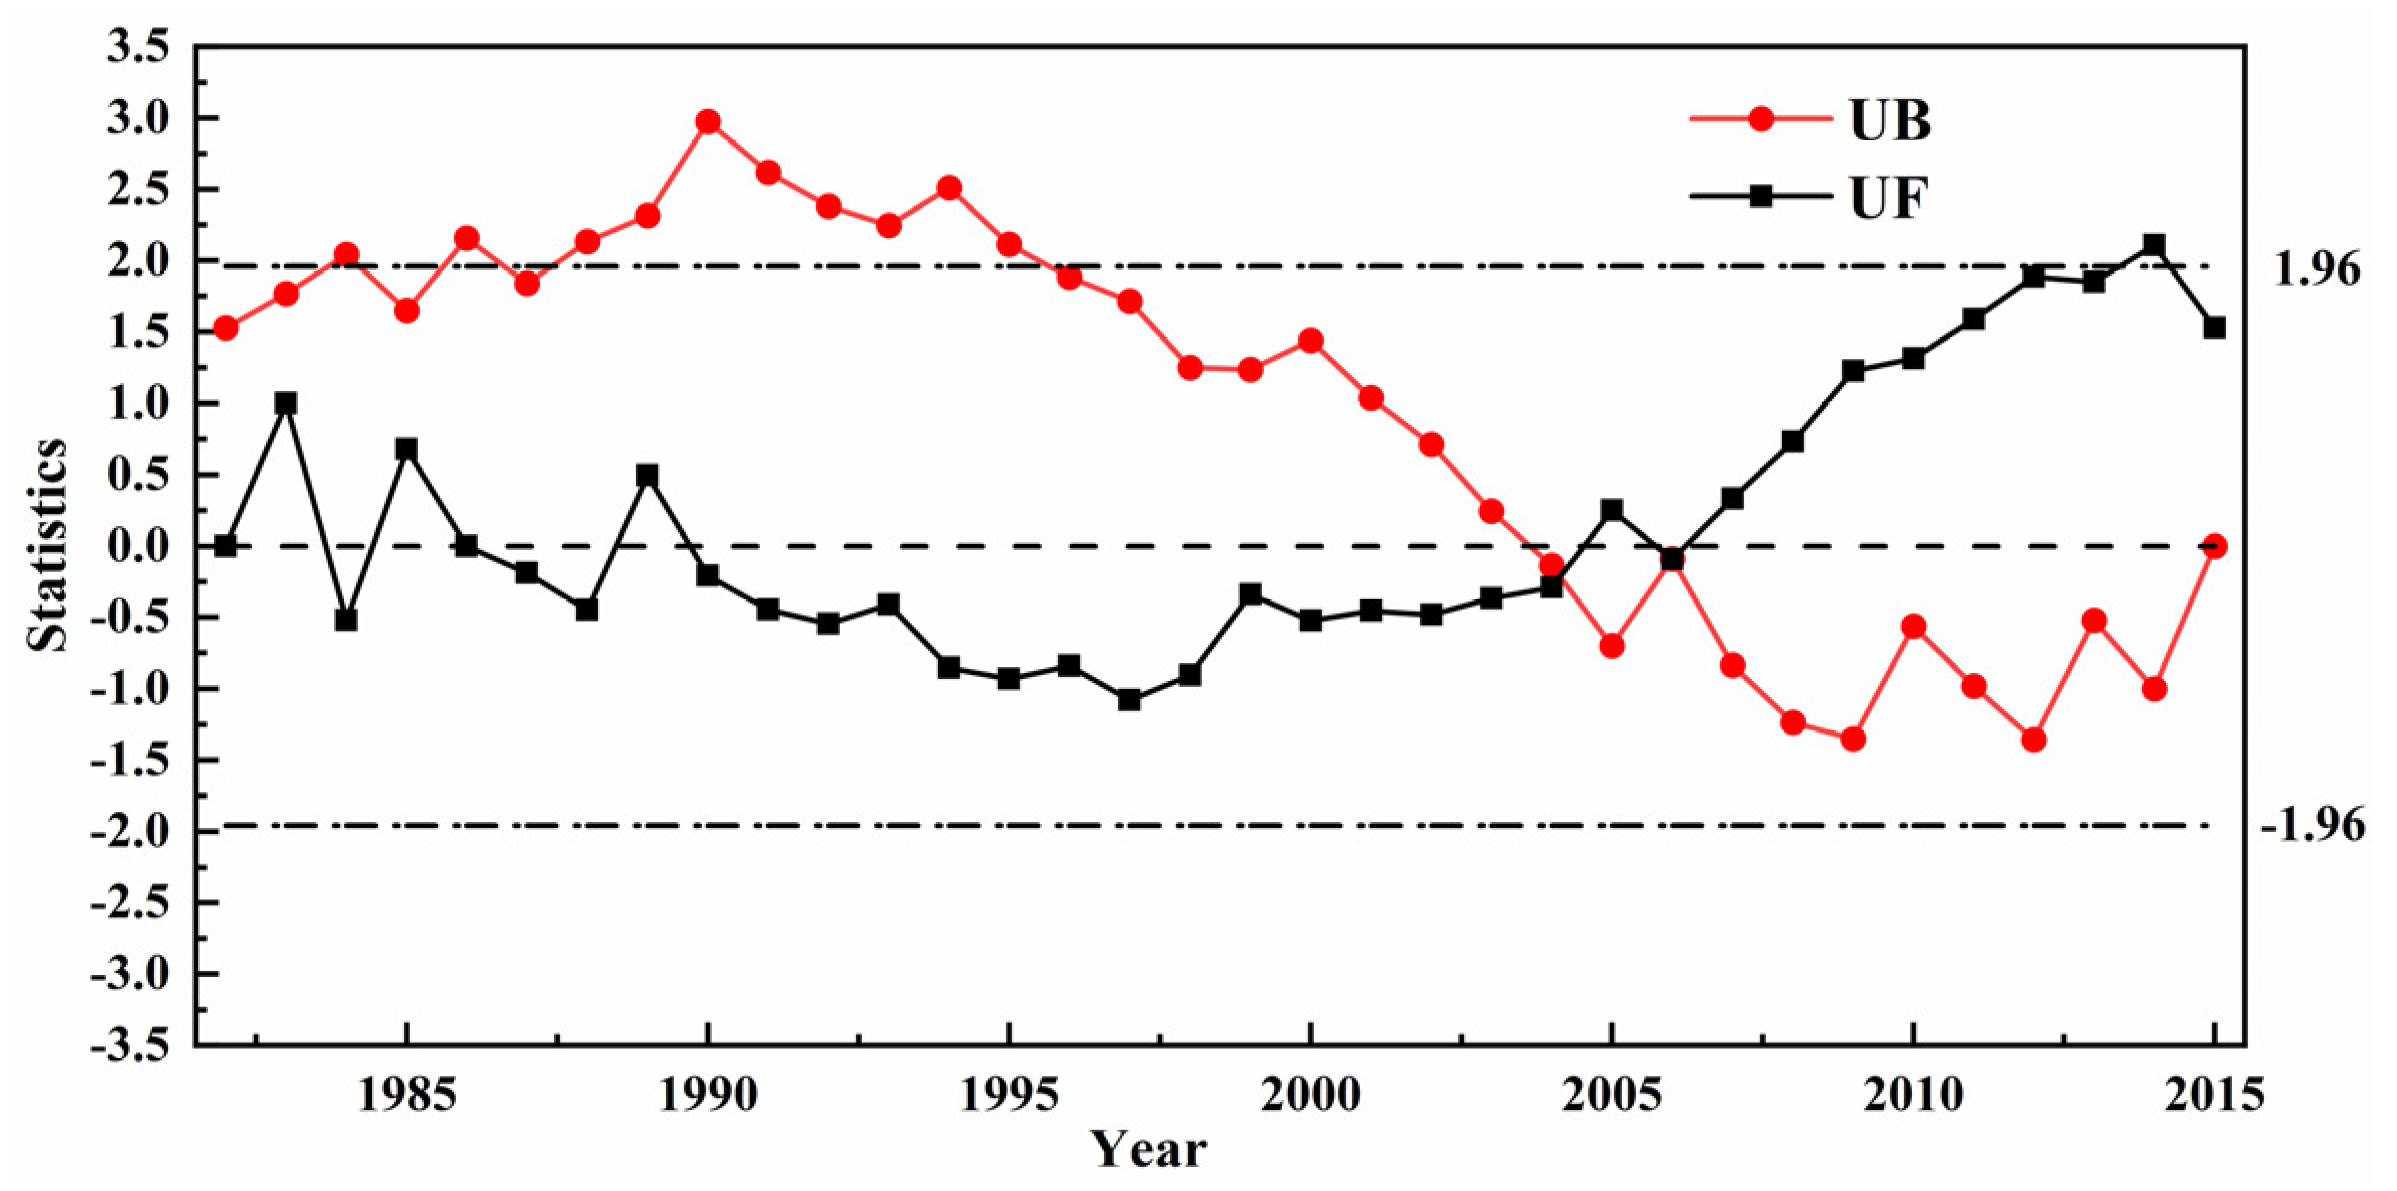
2.3.2. Mann-Kendall Test

The Mann-Kendall method is a nonparametric statistical test used to determine the significance of trends [33]. The change trend was significant when   | Z | > Z0.05. In this study, the Mann-Kendall statistical test was used to test the mutation points of the NDVI. The significance level was set at 0.05. The intersection of UF and UB is the mutation point; if there is more than one intersection, it is not certain whether it is the mutation point, and further testing is needed [34].

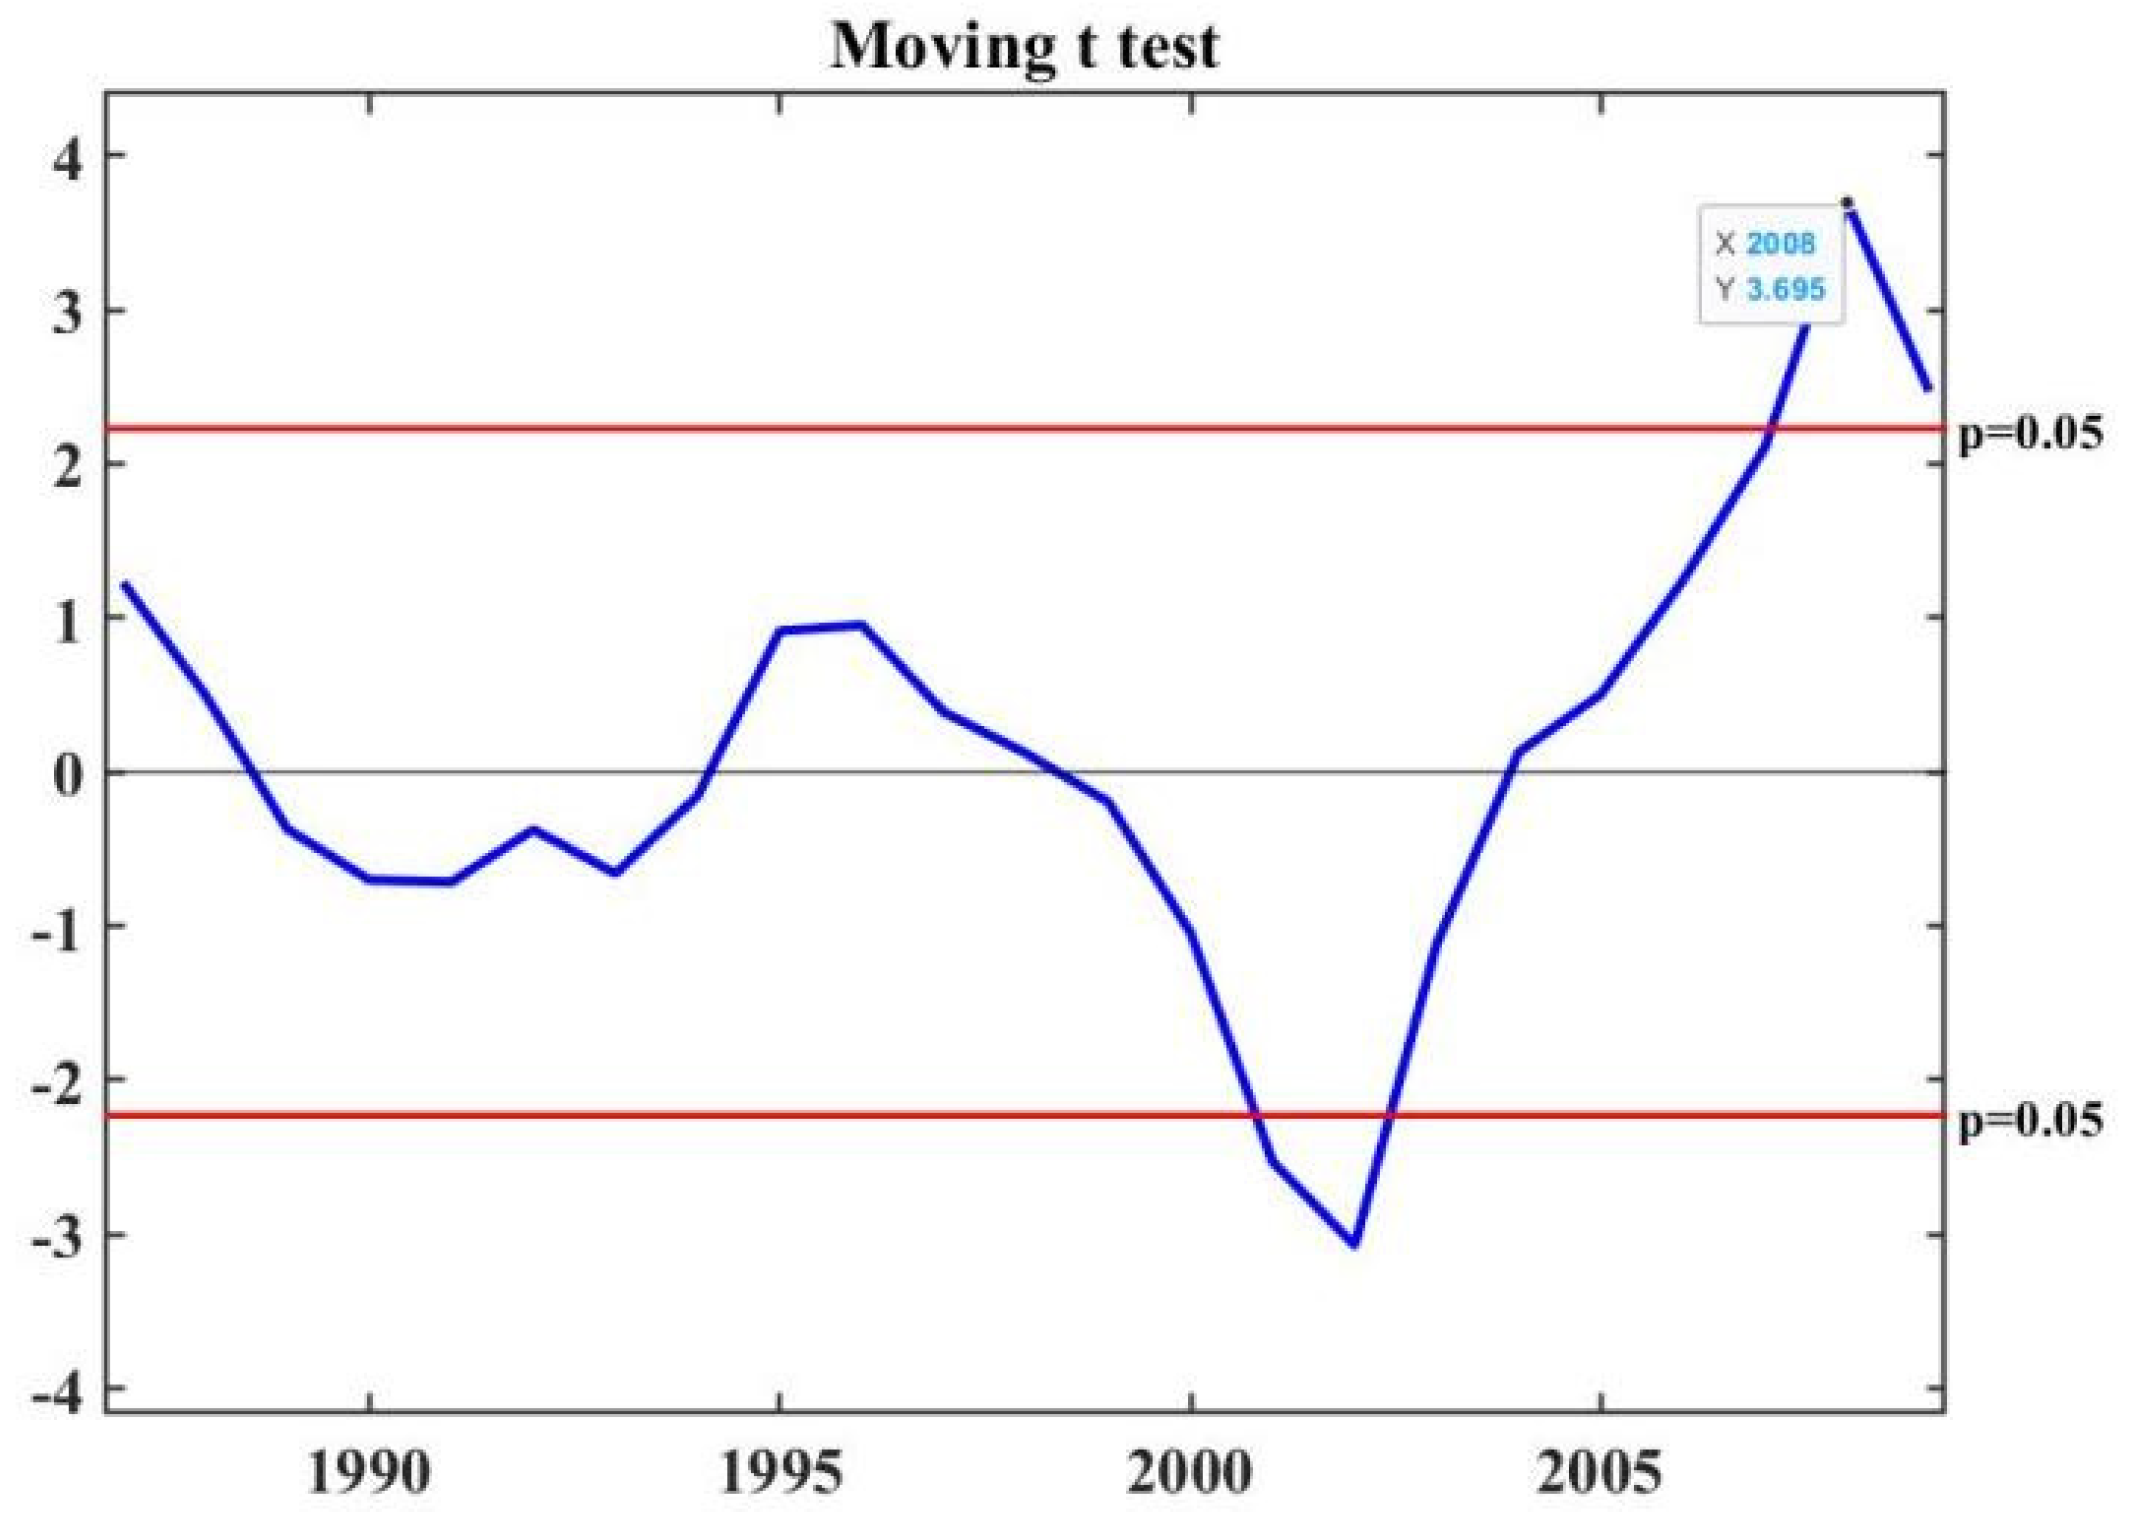
2.3.3. Moving t-Test

The moving t-test was used to test for mutations by examining whether the difference between the means of the two sample groups was significant [35]. If the difference between the mean values of the two subsequences exceeded the significance level of p = 0.05, the mutation was considered to be present; otherwise, no mutation was considered to be present.

2.3.4. Geographical Detector

The geographical detector is a statistical method used to detect spatial heterogeneity and its driving factors [11]. We used a geographical detector to compare the spatial distribution of NDVI vegetation with the spatial distribution characteristics of the detection factors; if a factor drives the NDVI variation, then the spatial distribution of the NDVI will be similar to the spatial distribution of that factor. This method has been successfully used to study the drivers of NDVI change [12,13,14,15,16,17].
(1) Factor detector. The factor detector q-statistic measures the degree of spatial stratified heterogeneity of a variable Y; and the determinant power of an explanatory variable X of Y. A factor detector is used to detect the spatial heterogeneity of the NDVI and the explanatory power of the independent variable X on the dependent variable Y, expressed by the q value [11]:
q = 1 1 N σ 2 h = 1 L N h σ h 2 = 1 SSW SST
SSW = h = 1 L N h σ h 2 ,   SST = N σ 2
In Equations (2) and (3): q is the explanatory power of the independent variable X on the dependent variable Y, with a value range of [0, 1]; the larger the q value, the more obvious the spatial heterogeneity and the stronger the explanatory power of X on Y. The study area is divided into h = 1, 2…, L regions; N h and N are the number of units in layer h and the whole region, respectively; σ h 2 and σ 2   are the variances of the Y values of layer   h and region, respectively; SSW and SST are the sum of variance within layer and total variance of region, respectively.
In this study, the independent variable X represents the detection factor Xs (s = 1, 2, 3, 4, 5, 6, 7, 8, 9, 10, and 11), as is shown in Table 1, and the dependent variable Y is the NDVI.
(2) Interaction detector. The interaction detector reveals whether the factors X1 and X2 (and more X) have an interactive influence on a response variable Y. Because the factors in nature do not exist independently, there are interactions between the factors, and the interactions between the factors need to be analyzed in the study. An interaction detector was used to detect the interaction between NDVI detection factors. It can detect any relationship between factors as long as they exist. The assessment methods used are presented in Table 2.
(3) Risk detector. A risk detector was used to compare whether there was a significant difference between the mean values of the dependent variables in the two regions. This study was used to detect the appropriate range or types of the driving NDVI factors. The t-statistic used was the following [11]:
t   y -   h = 1   y -   h = 2 =   Y -   h = 1   Y -   h = 2 [ Var (   Y -   h = 1 ) n h = 1 + Var (   Y -   h = 2 ) n h = 2 ] 1 / 2
In Equation (4):   Y -   h denotes the attribute mean within subregion   h , n h is the number of samples within subregion   h , and Var denotes the variance. According to the null hypothesis H 0 :   Y -   h = 1 =   Y -   h = 2 , if H 0 is rejected at confidence level α, it is considered that there is a significant difference in the attributed means between the two subregions.
(4) Ecological detector. An ecological detector was used to detect whether there was a significant difference in the influence of different factors on NDVI changes, as measured by the F-statistic [11]:
F = N X 1 ( N X 2 1 ) SSW X 1 N X 2 ( N X 1 1 ) SSW X 2
SSW X 1 = h = 1 L 1 N h σ h 2 ,   SSW X 2 = h = 1 L 2 N h σ h 2
In Equations (5) and (6): N X 1 and N X 2 denote the sample sizes of the two factors X1 and X2, respectively, SSW X 1 and SSW X 2 denote the sum of within-layer variances of the strata formed by X1 and X2, respectively, and L 1 and L 2 denote the number of strata of the variables X1 and X2, respectively. According to the null hypothesis H 0 : SSW X 1 = SSW X 2 , if H 0 is rejected at the significance level of α, this indicates that there is a significant difference in the effect of the two factors X1 and X2 on the spatial distribution of attribute Y.

3. Results

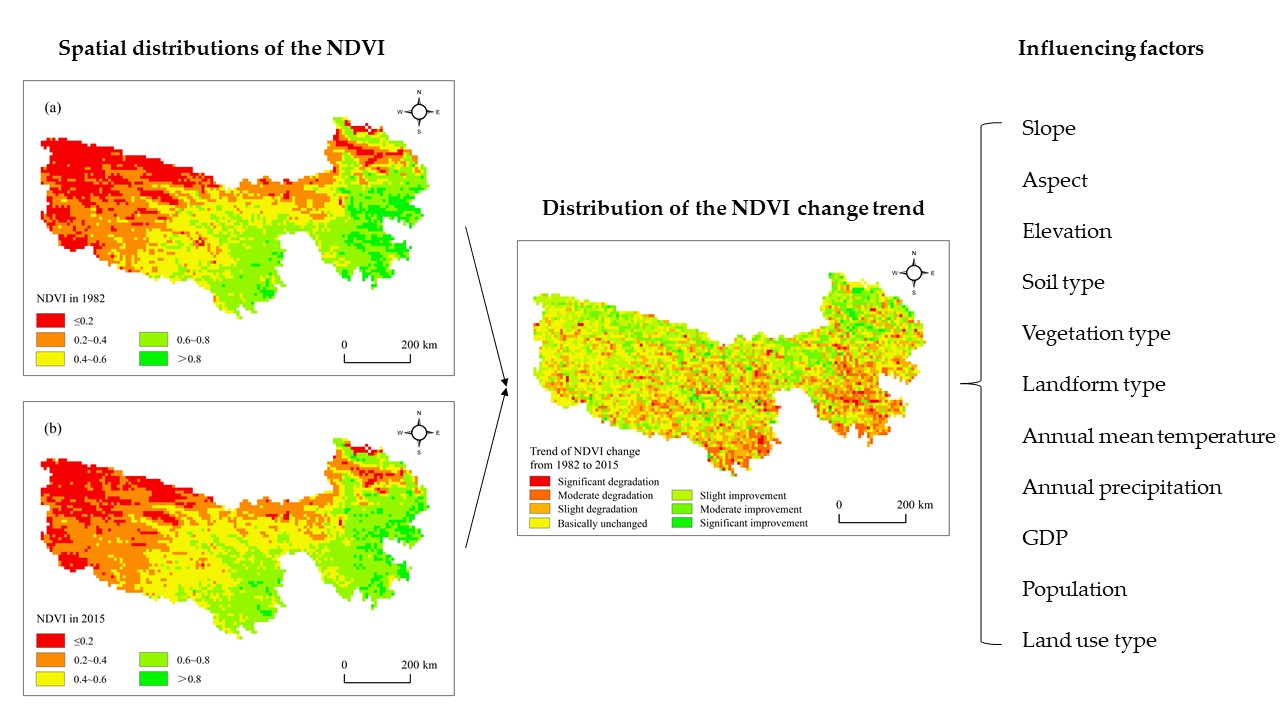
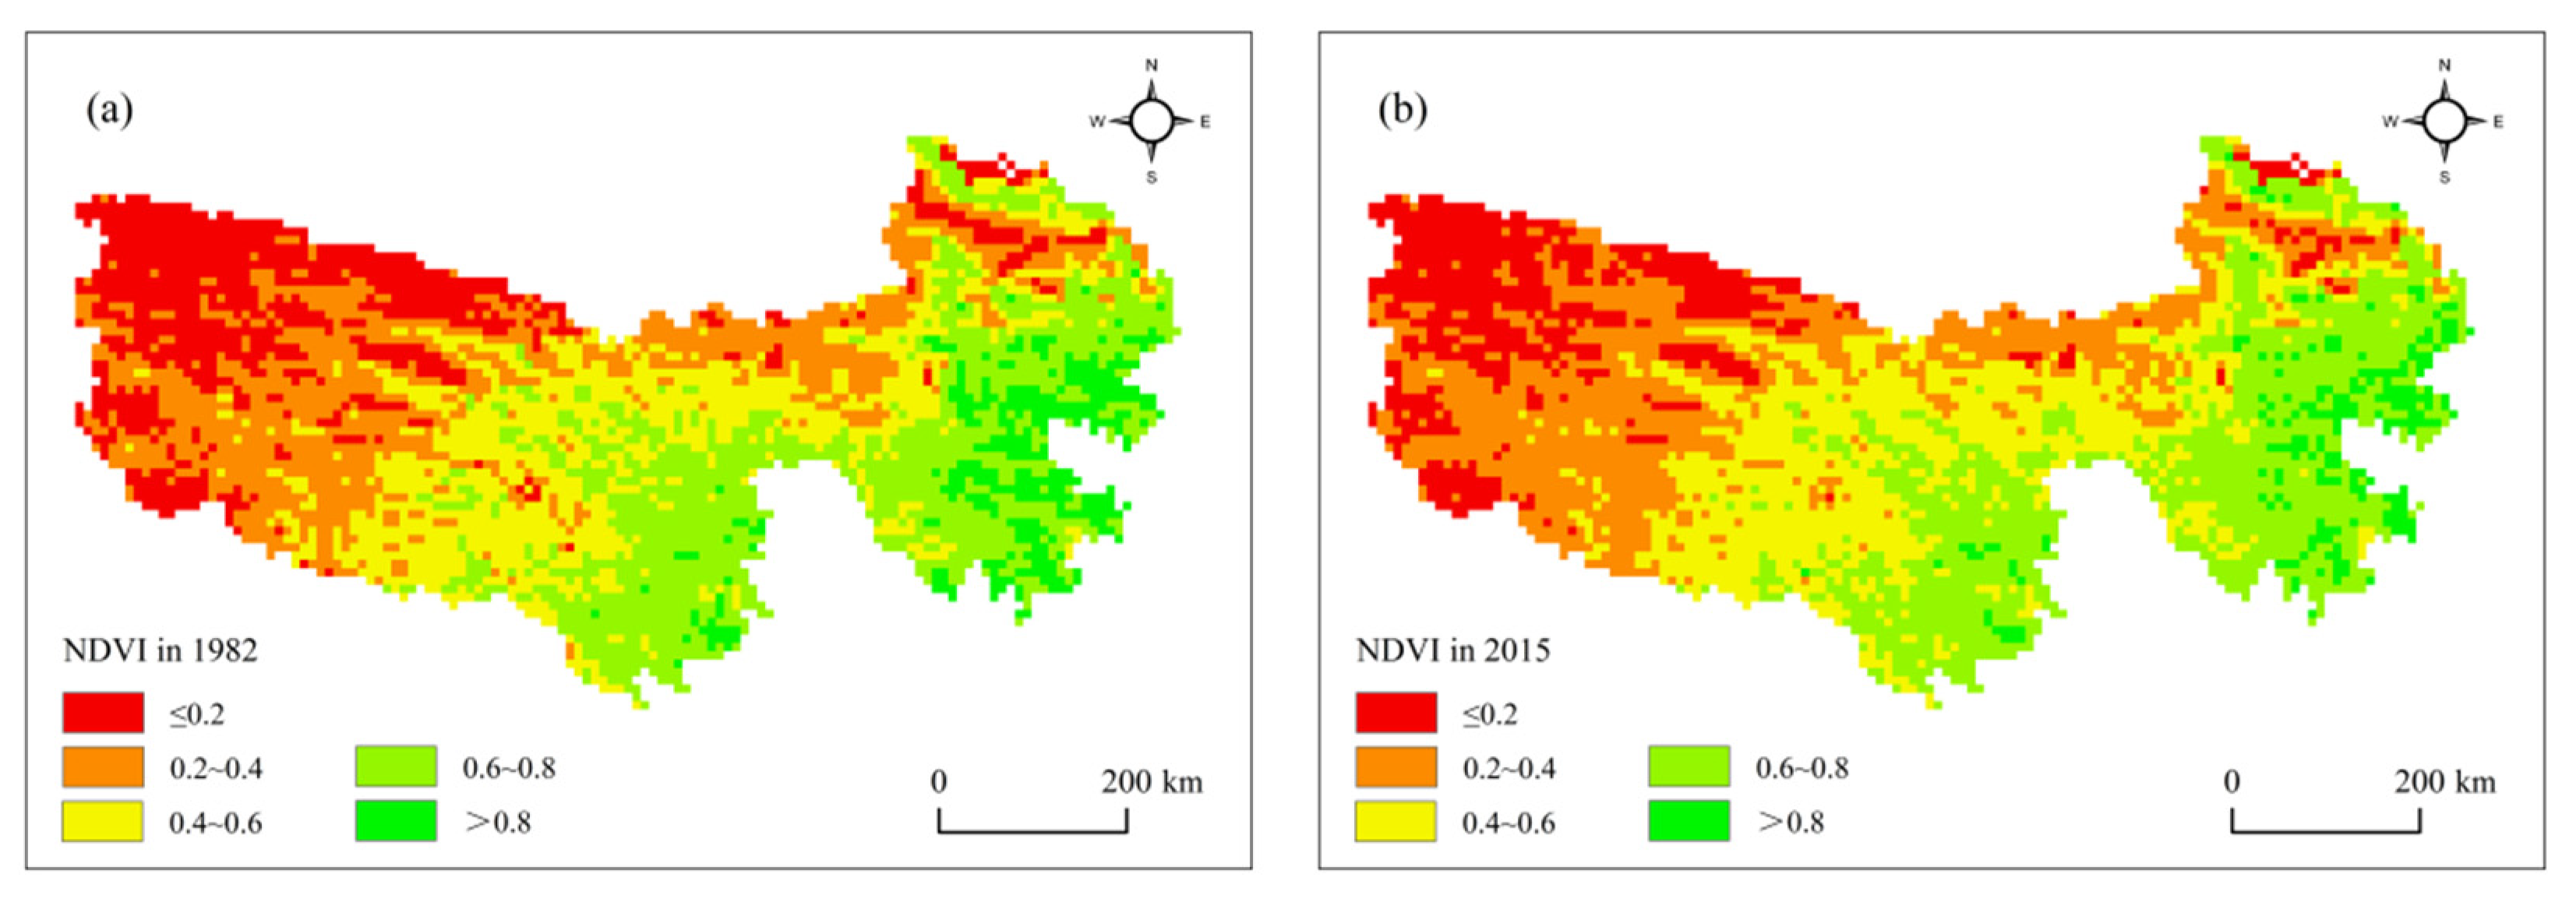
3.1. Spatial and Temporal Variation Characteristics of the NDVI in the TRHR

The NDVI values in the TRHR were high in the southeast and low in the northwest (Figure 3). Regions with low vegetation coverage were mainly distributed in the northwest, with most being low coverage grassland; regions with high vegetation coverage were mainly in the southeast, where the hydrothermal conditions were better, the elevation was relatively low, and the vegetation was mainly high coverage grassland and forest.
In this study, the annual mean NDVI values from 1982 to 2015 were selected to represent the annual vegetation coverage status in the TRHR. The change observed exhibited an increasing trend, which is consistent with the findings of Zhai et al. [36]. With an increase rate of 0.002/10 a, the mean NDVI value increased from 0.454 in 1982 to 0.458 in 2015, and the maximum (0.493) and minimum (0.430) NDVI values occurred in 2010 and 1995, respectively (Figure 4). These results indicate that the vegetation coverage of the TRHR has been improving, but with small changes from 1982 to 2015. Due to overgrazing, the ecological degradation of the TRHR as serious and the vegetation coverage was low. After 2005, the vegetation coverage gradually increased due to the increase in artificial precipitation and the implementation of ecological projects, such as the return of grazing to grass.

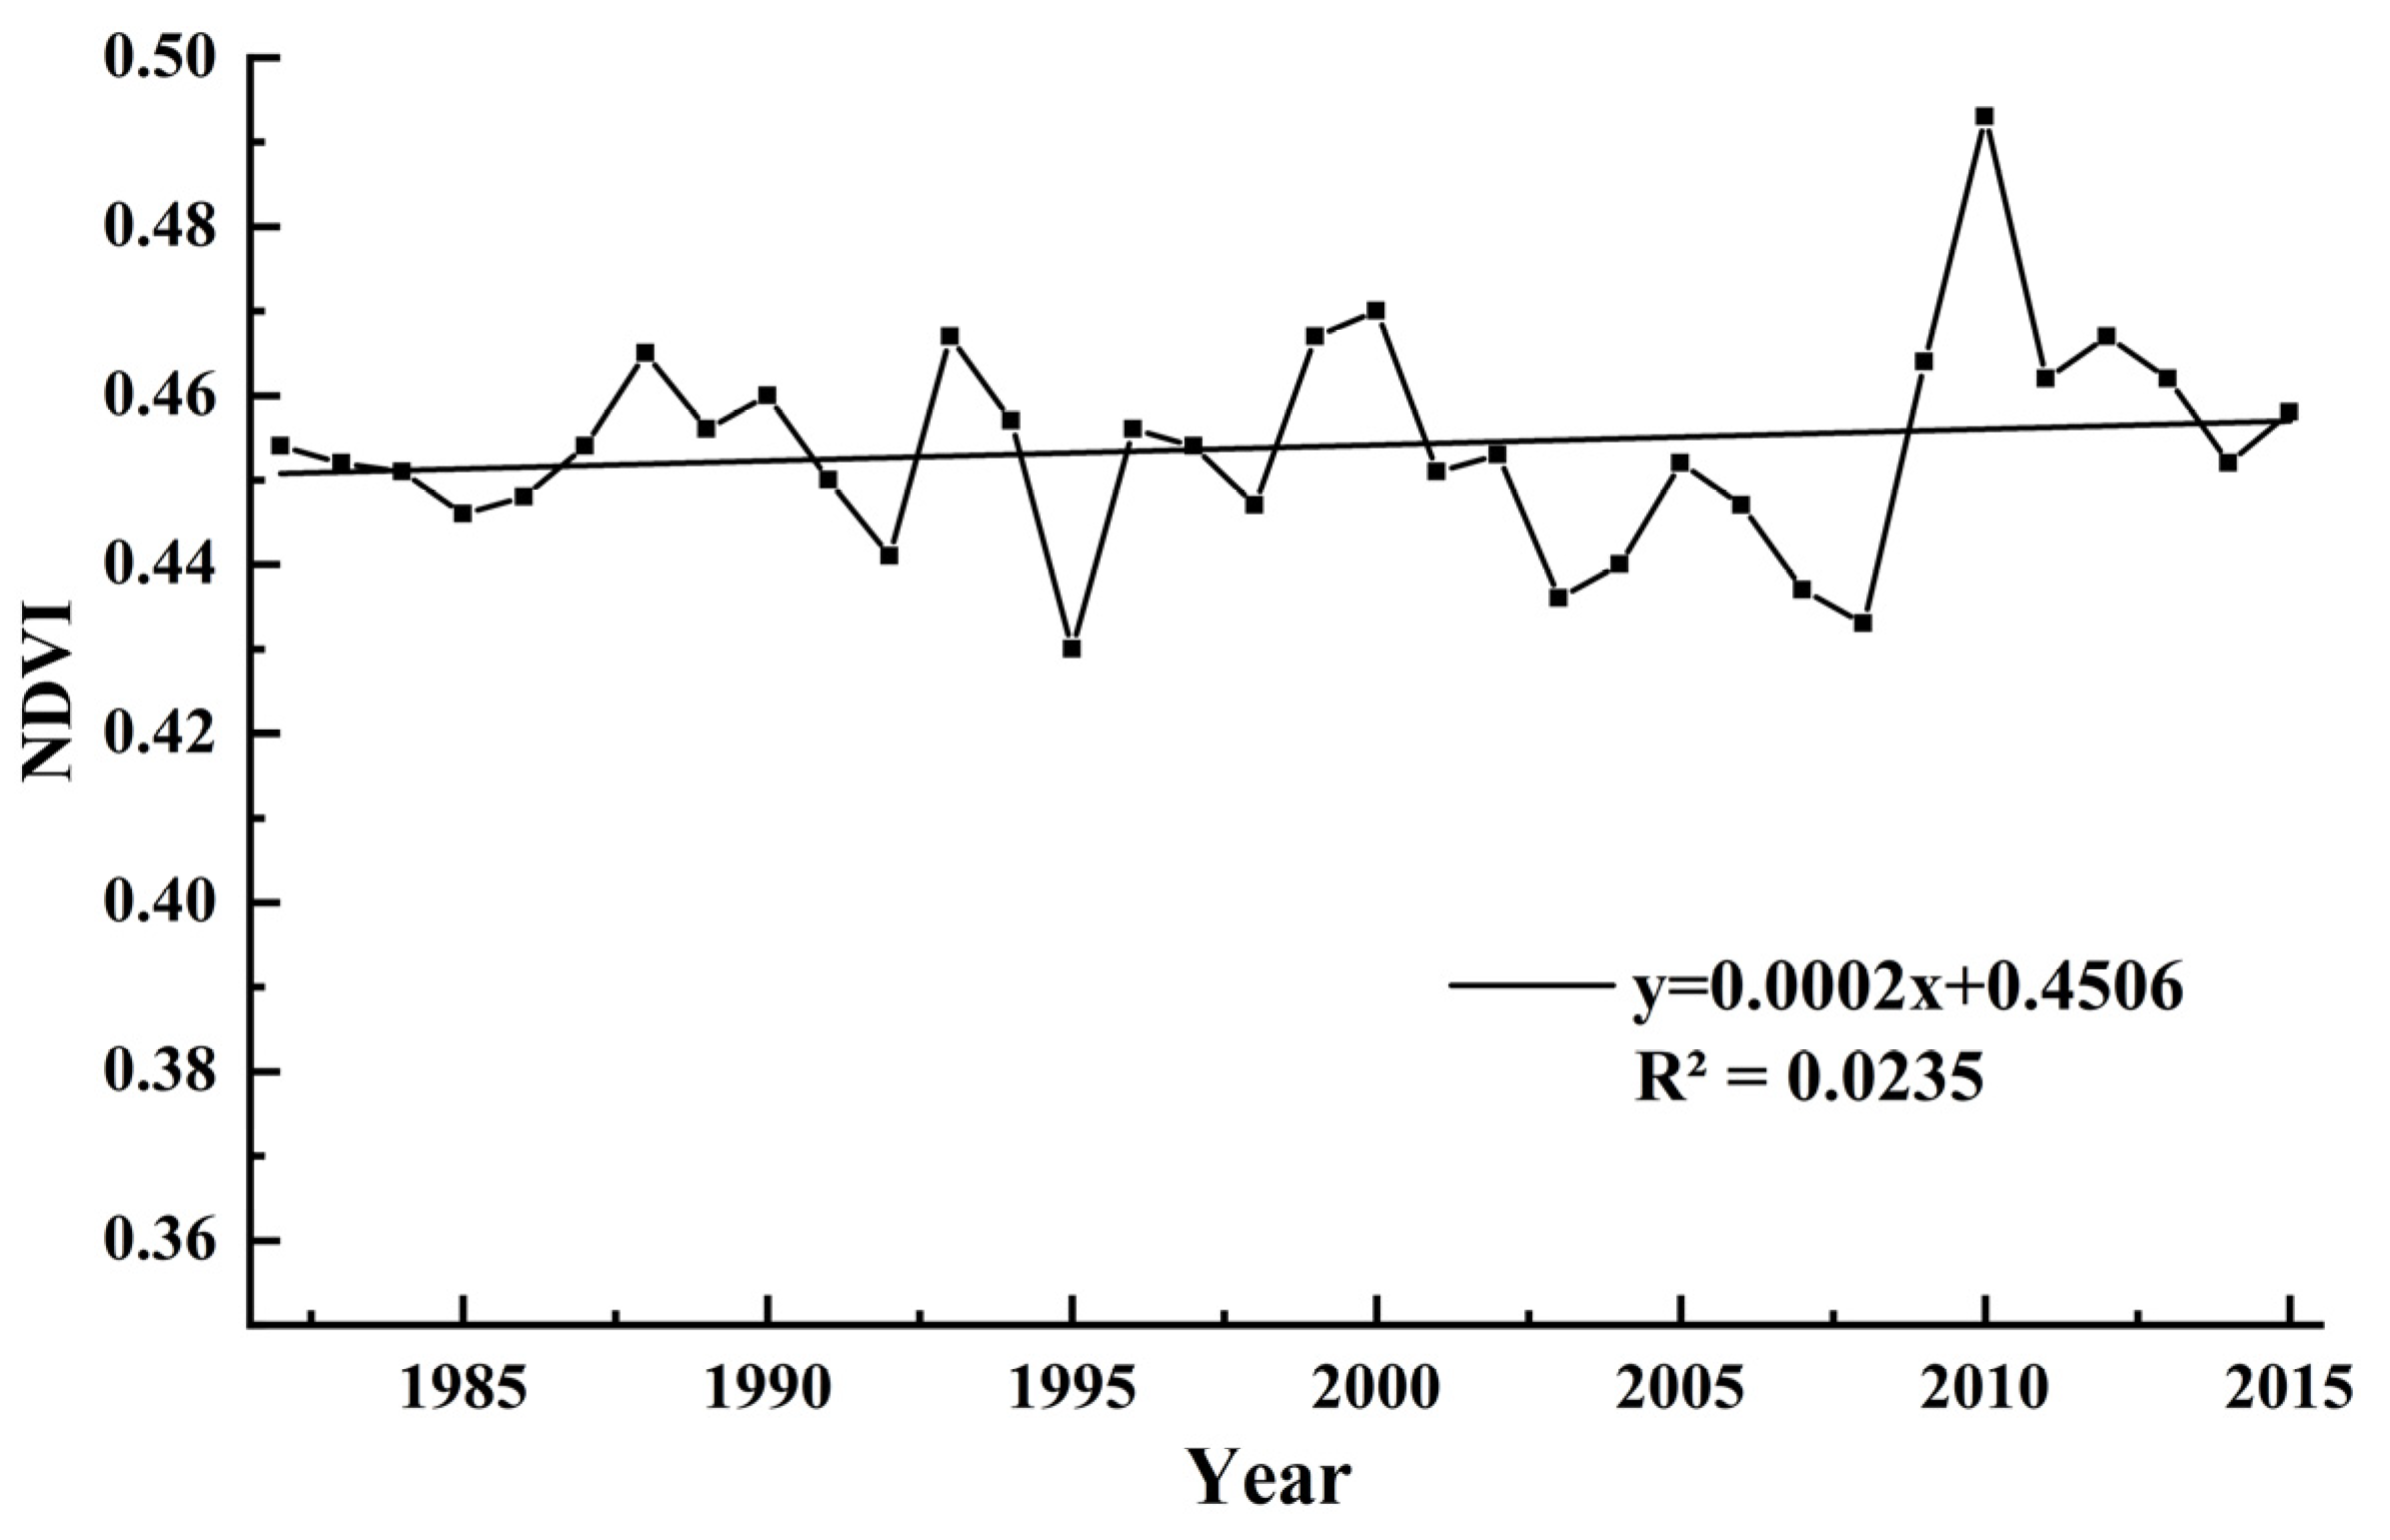
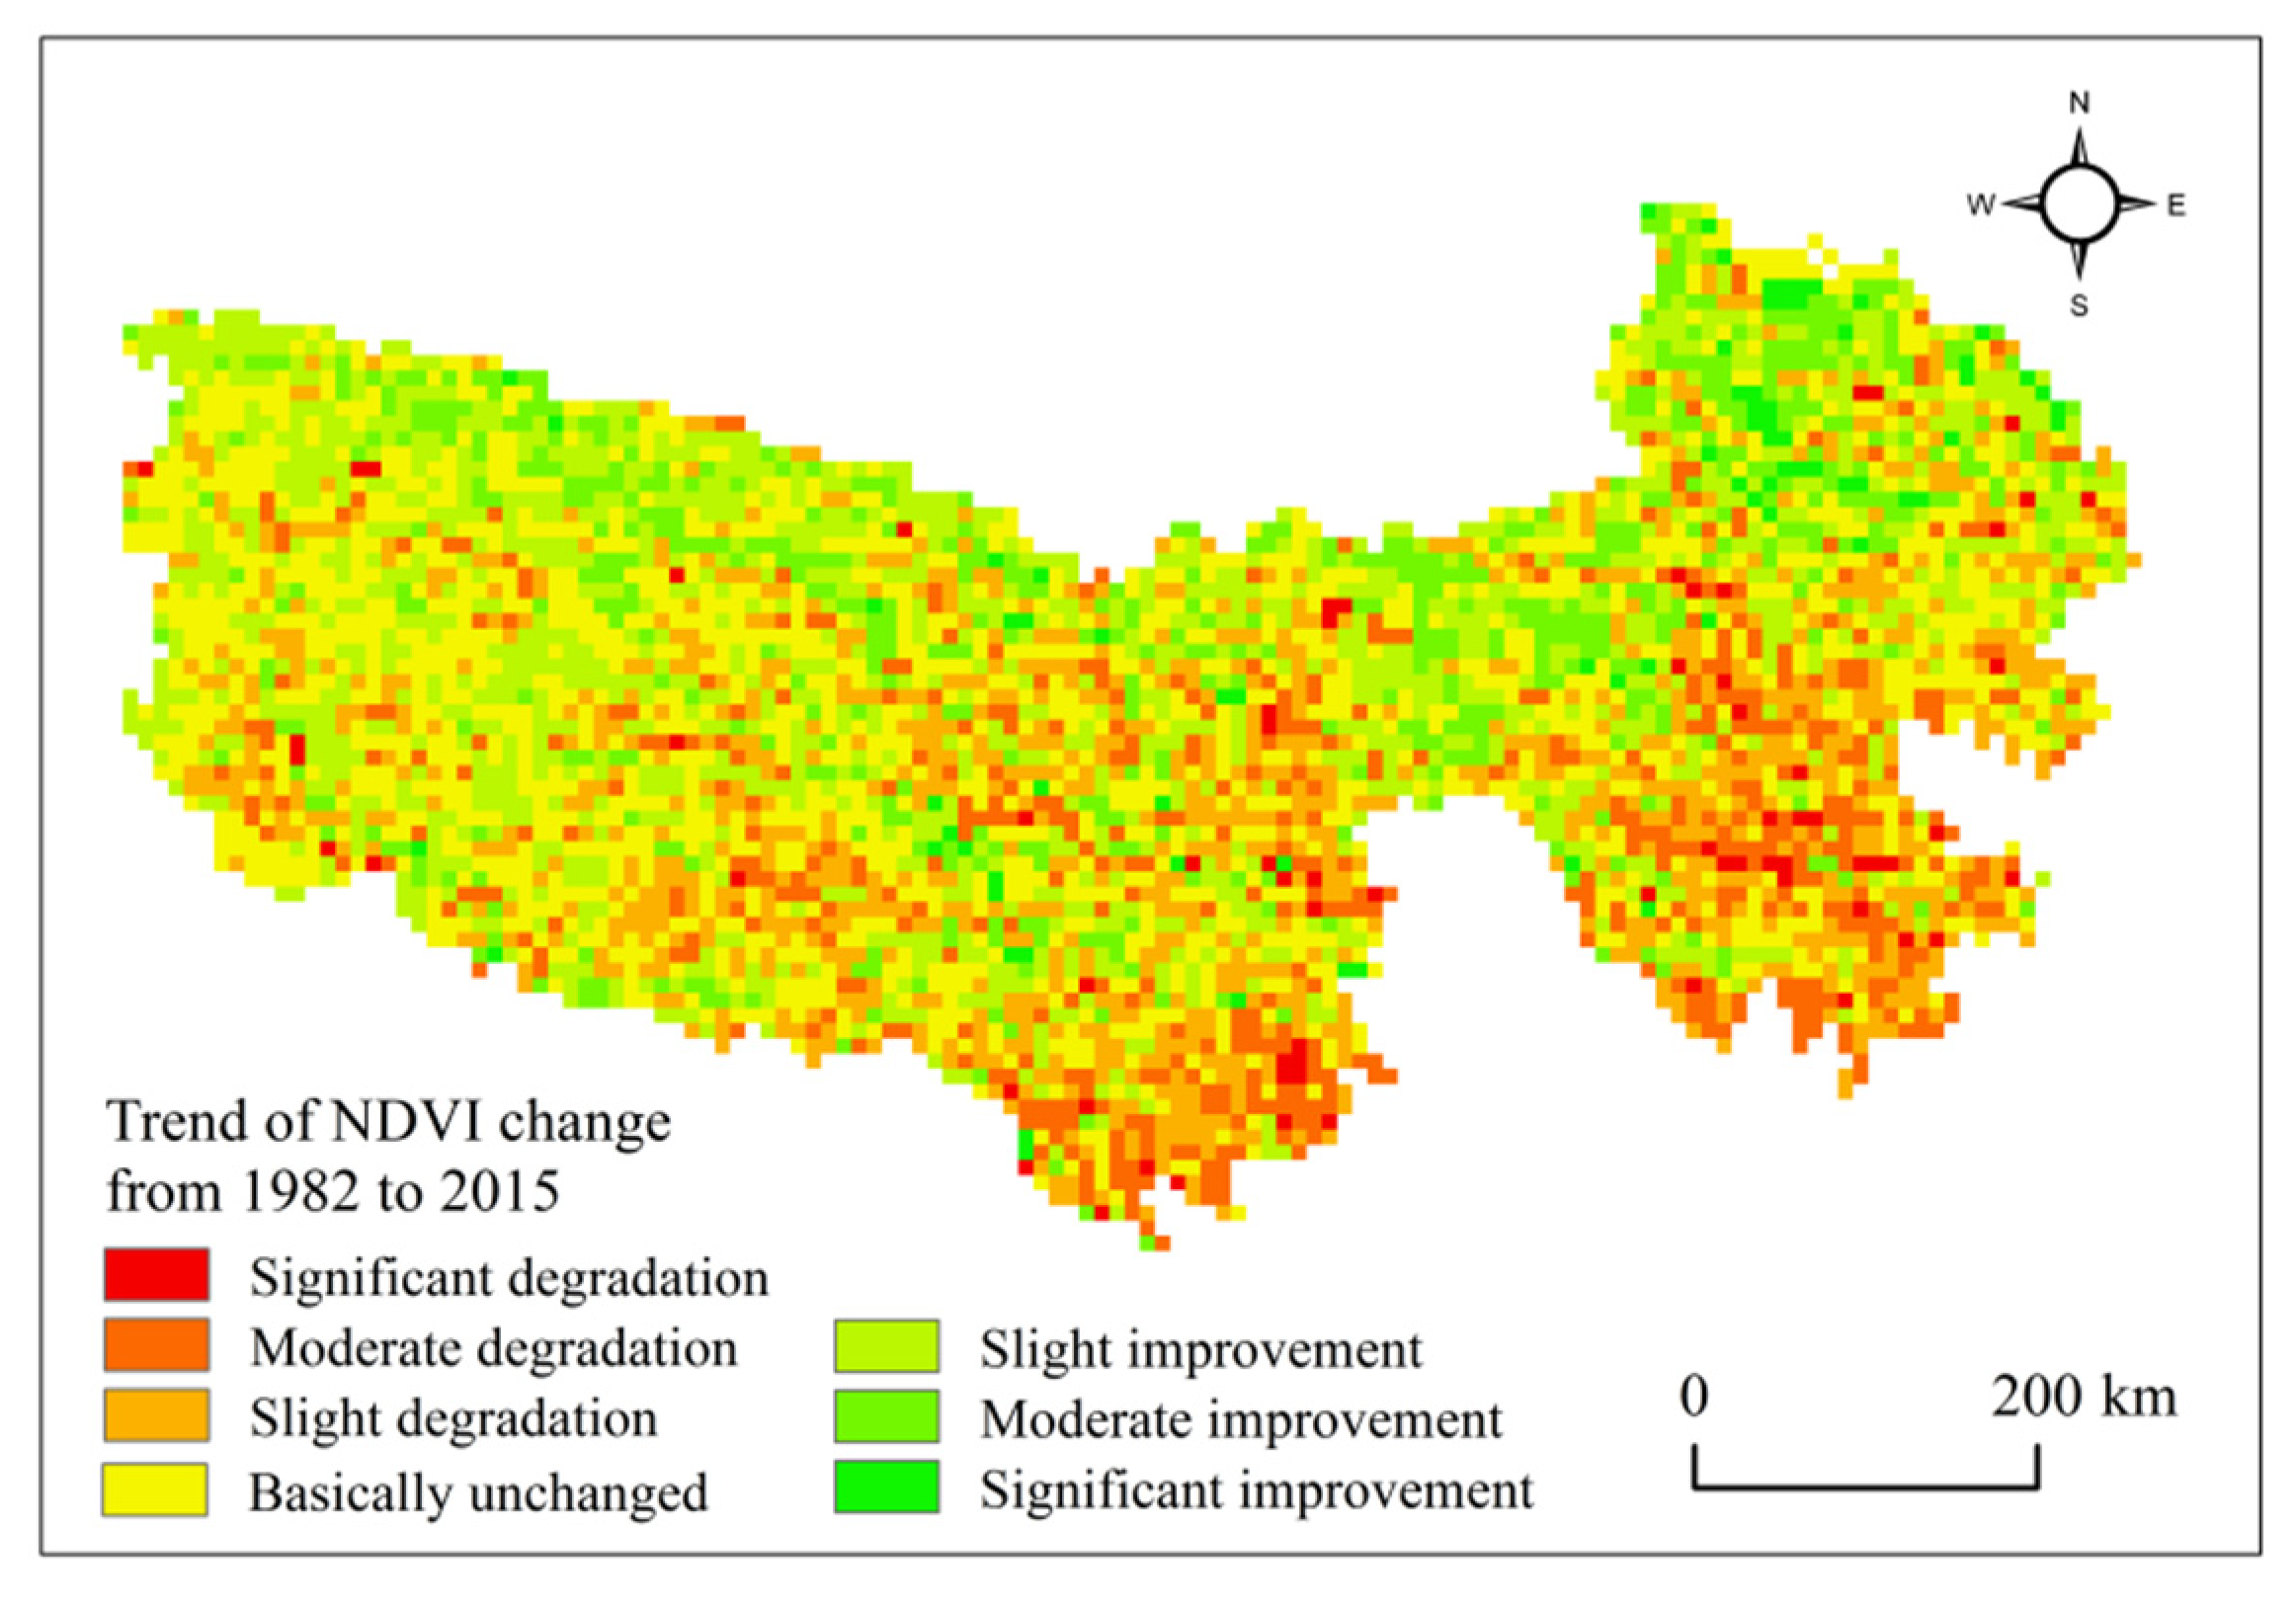
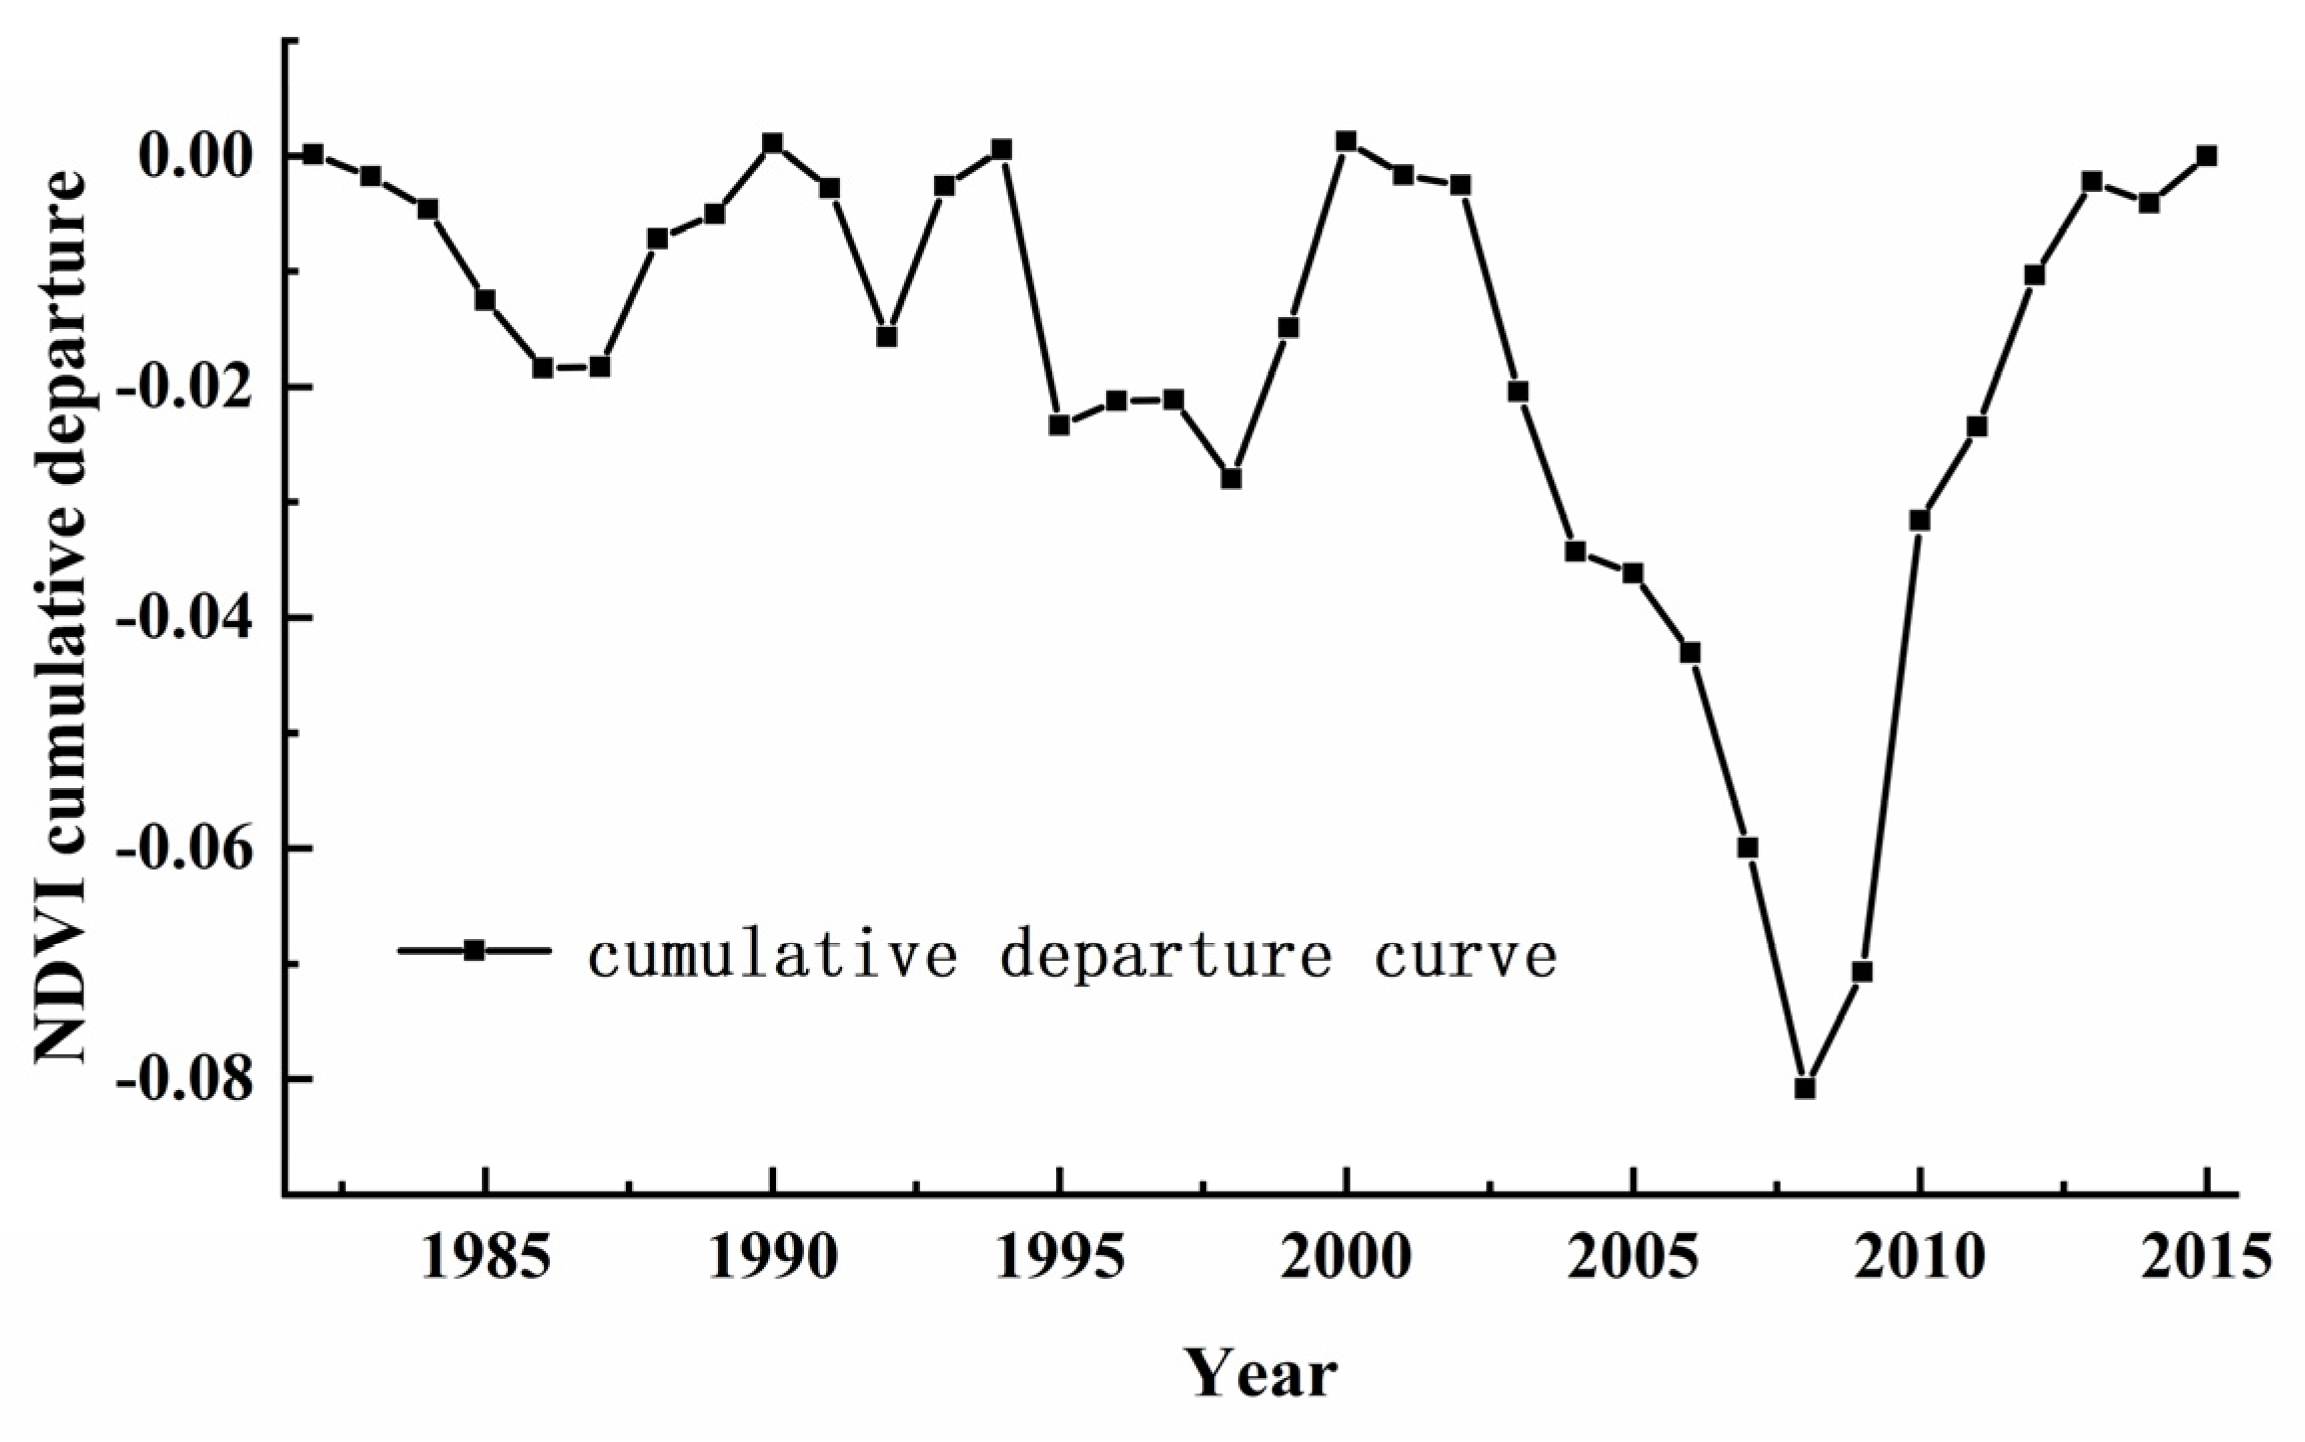
3.2. Trend Analysis of NDVI Changes in the TRHR

In 1982 and 2015, high and medium-high vegetation coverage areas accounted for more than 33% and 31%, respectively, of the TRHR area, while low and medium–low areas accounted for approximately 42% and 41%, respectively, of the total TRHR area. From 1982 to 2015 the low and high vegetation coverage areas decreased, with the former type decreasing the most (by 3.08%). During the same period, the medium vegetation coverage area increased the most (by 2.78%; Table 3).
The NDVI transfer matrix of the TRHR showed that there was a transformation in the NDVI at all levels from 1982 to 2015 (Table 3). The shifted-out areas were mainly medium–high vegetation coverage, which shifted mainly to medium vegetation coverage, and the shifted-in areas were mainly medium–low, medium, and medium–high vegetation coverage, with a significant increase in medium vegetation coverage and a substantial decrease in high vegetation coverage.
Although the trend of the NDVI value of the TRHR was increasing, it was still dominated by low, medium, and medium–high vegetation coverage, which all accounted for more than 25% of the area, while the high vegetation coverage area accounted for the smallest proportion and decreased significantly. Previously, the ecological environment was severely damaged, and the restoration was difficult and slow. Land use is still dominated by low-coverage grassland, thus, the status of the vegetation coverage of the TRHR was still not optimistic.
From the linear regression analysis, it was concluded that the vegetation coverage of the TRHR showed an increasing trend from 1982 to 2015 (Figure 5), thereby indicating that the vegetation coverage of the TRHR gradually recovered. The area with the largest increase in vegetation coverage was mainly distributed in the west and north, covering a total of 14.5 × 10⁴ km2 and accounting for 37.86% of the total area; this area was mainly dominated by grassland, meadow, and alpine vegetation. The area with the largest decrease in vegetation coverage was mainly concentrated in the center and the south, covering a total of 12.6 × 10⁴ km2 and accounting for 32.87% of the total area. Areas with unchanged vegetation were distributed throughout the region (Table 4). The NDVI change trend in the TRHR increased in the north and west and decreased in the south and center. The desert in the northeast of the TRHR has gradually transformed into grassland and meadow vegetation types [37]. The unused land in the Sanjiangyuan Ecological Protection Project area has been transformed into low-coverage grassland, and the area of high-coverage grassland has increased significantly (Table A1), therefore the implementation of ecological projects has significantly improved the vegetation coverage of Zhiduo, Qumalai and Mado counties in the north and northwest of the TRHR. The decrease in vegetation coverage in Yushu, Jiuzhi, and Banma counties in the south may be due to the decrease in precipitation.
The M-K test showed that none of the intersection points of the UF and UB exceeded the critical value. Significance test indicated that | Z | = 0.048 < Z0.05 = 0.236, thereby indicating that the trend of the NDVI change in the TRHR was not significant, but had multiple intersection points (Figure 6). Therefore, the mutation points needed to be further examined using the moving t-test.
The moving t-test showed that 2008 was the mutation point of the NDVI (Figure 7), which experienced a decreasing trend before 2008 and a significantly increasing trend in 2008 according to the cumulative departure method (Figure 8). Therefore, the combination of the M-K test, moving t-test, and cumulative departure method led to the conclusion that the NDVI of the TRHR was mutated in 2008.

3.3. Factor Detection

According to the q values of each factor obtained from the factor detector (Table 5), the magnitude of the influence of each factor on the NDVI of the TRHR was as follows: annual precipitation (0.550) > annual mean temperature (0.463) > vegetation type (0.409) > elevation (0.350) > land use type (0.244) > landform type (0.216) > population density (0.204) > soil type (0.147) > slope (0.141) > GDP (0.088) > aspect (0.055).
The q value of annual precipitation was the largest, with an explanatory power of 55%, which was much more influential than other factors; therefore, annual precipitation was the main driving factor of vegetation change in the TRHR, followed by annual mean temperature, vegetation type, and elevation, with an explanatory power of more than 30%; land use type, landform type, population density, soil type, and slope had an explanatory power of more than 10%; GDP and aspect had little explanatory power.

3.4. Ecological Detection

Ecological detection reflects whether there is a significant difference in the influence of each detection factor on the NDVI in the TRHR. The results showed that there were significant differences in the effects of all factors on NDVI, except for the effects of soil and slope, population, and landform on NDVI (Table 6). The effects of annual precipitation on the NDVI in the TRHR were significantly different from those of the other factors. The factor detection showed that annual precipitation was the dominant driver of NDVI changes in the TRHR, and the results of ecological detection further proved that the effects of annual precipitation were stronger than those of other factors. The non-significant differences between the effects of soil and slope, population density, and landform on the NDVI indicated that both had little influence on vegetation.

3.5. Interaction Detection

A single variable could not explain the spatial variation in the NDVI, and the synergistic effects of multiple natural and anthropogenic factors needed to be considered. The geographical detector can reveal the interactions among the factors and their effect on NDVI changes. The results showed that all factor interactions enhanced the influence of a single factor on the NDVI, showing a bivariate and non-linear enhancement effects. Among them, the interactions of aspect with elevation, annual mean temperature, GDP, and population density, the interactions of soil type with GDP and population density, and the interactions of GDP with population density and land use type showed a non-linear enhancement effect, and the interactions of other factors showed a bivariate enhancement effect. Among them, the q value of the interaction between annual precipitation and other factors was high, with the explanatory power reaching more than 58%. This was higher than the explanatory power of the single factor of annual precipitation on vegetation, whose q value of interacting with elevation, annual mean temperature, and vegetation type was the largest, reaching approximately 68% (Table 7). The annual precipitation was the dominant factor influencing the NDVI changes in the TRHR, and the interaction between the annual precipitation and other factors could further increase its influence on the NDVI in the TRHR. Among other factors, the q value of the interaction among vegetation type, elevation, and annual precipitation was larger, reaching approximately 60%; although the influence of GDP and aspect on the NDVI was small, their interaction with other factors greatly increased their explanatory power of the NDVI.

3.6. Risk Detection

We used the risk detector to determine the range or types of factors suitable for vegetation growth (Table 8); the suitable range or types of factors is very important for vegetation growth, the larger the NDVI value, the better the vegetation growth. The results of the risk area detection can be applied to the ecological protection project of the TRHR. The suitable range or types of different factors can be combined with the spatial distribution of temperature, precipitation, and population density to increase the vegetation coverage.

3.6.1. Annual Precipitation

The spatial distribution of vegetation coverage in the TRHR was consistent with the spatial distribution pattern of annual precipitation. The annual precipitation was divided into nine subzones. The mean NDVI value generally increased with the increase in annual precipitation and peaked in the 578 to 708 mm range, thereby indicating that this range promoted vegetation growth. The results showed that the annual precipitation subzone 9 was significantly different from the other subzones, so that the vegetation coverage was best in the 578 to 708 mm annual precipitation range in the TRHR (Table 9). The interaction detector showed that interaction with other factors can further enhance the influence of annual precipitation on the NDVI.

3.6.2. Annual Mean Temperature

The factor detector showed that the annual mean temperature also had an important influence on the NDVI in the TRHR. The annual mean temperature was divided into nine subzones. The mean NDVI value increased and then decreased with the increase in the annual mean temperature, and peaked in the 1.65 °C to 3.82 °C range. There were significant differences between the mean NDVI values in subzone 6 and other subzones (Table 10). The interaction of annual mean temperature with other factors enhanced the effect of the former on the NDVI. Temperature changes can cause changes in other factors in the region, and within the temperature range suitable for vegetation growth, the higher the temperature, the better the vegetation coverage, beyond which vegetation growth will be inhibited.

3.6.3. Vegetation Type

The vegetation type had an important influence on the NDVI of the TRHR, and the interaction with other factors further enhanced its influence on the NDVI. Vegetation types were divided into nine subzones. The mean NDVI values peaked in the coniferous forest vegetation type. There was no significant difference among the mean NDVI values in vegetation type subzones 2, 3, and 4. There were significant differences between the coniferous forest vegetation type and other vegetation type subzones; the coniferous forest, broadleaf forest, and scrub vegetation covers were better (Table 11).

3.6.4. Elevation

Elevation affects the spatial distribution of natural elements and human activity. The elevation was divided into nine subzones. The mean NDVI value increased and then decreased with the elevation of the TRHR, and it was better in the 3446 to 3851 m range. There were significant differences between this elevation range and other elevation subzones (Table 12). At elevations higher than 3851 m, the NDVI decreased as the elevation increased.

3.6.5. Land Use Type

The land use types were divided into six subzones. The NDVI value peaked in construction land, with no significant difference from the value obtained in forest land, and with significant differences from other land use types; therefore, construction land and forest land had the best vegetation coverage. The main land use type in the TRHR was grassland, accounting for 68%, of which low-coverage grassland accounts for 38%, followed by unused land, water area and forest land, which accounted for 23%, 5%, and 4%, respectively, of the total area. The cropland, forest land, middle-coverage grassland, and low-coverage grassland areas in the TRHR decreased from 1980 to 2015, while the high-coverage grassland, water area, construction land, and unused land areas increased, with the low-coverage grassland area decreasing the most and the high-coverage grassland and unused land area increasing the most (Table A1). Both the forest and construction lands were small, but both were distributed in the middle–high and high vegetation coverage areas east and south of the study area, with better hydrothermal conditions; the construction land was affected by human activities and had more green vegetation, thus the NDVI values were higher there.

3.6.6. Synergistic Effects of Other Factors

The factor detector demonstrated that the single factors of landform type, soil type, slope, aspect, GDP, and population density had small effects on NDVI changes in the TRHR, but the interactions of these factors with others could enhance the effects on NDVI changes.
The landform types of the TRHR were diverse and affected the distribution of vegetation. The landform types were divided into six subzones. The mean NDVI values peaked in the medium-undulating mountains; there were significant differences between this and other landform types, thereby indicating that the vegetation coverage in the medium-undulating mountains was the best. The soil types were divided into 10 subzones. The mean NDVI value peaked in semi-leached soil; there were significant differences between the mean NDVI value in this soil type and other soil types. Therefore, semi-leached soil had the best vegetation coverage. Different slopes and aspects led to differences in climatic elements, and suitable slopes and aspects were conducive to vegetation growth. The slope was divided into seven subzones. The mean NDVI value increased and then decreased with slope increases, and peaked in the 35° to 45° range. The vegetation of this slope consisted mainly of scrubs and alpine meadows. There were no significant differences between the mean NDVI value of this slope and those of slope subzones 6, 5, and 7, while there were significant differences with other subzones. Therefore, the vegetation growth conditions were better in the slope range of >25°. As shown by the q value (Table 5), aspect had a minimal effect on the NDVI. The aspect was divided into nine subzones. The mean NDVI value fluctuated little with aspect changes. The NDVI value of the eastern slope was the largest, with no significant NDVI differences between this and aspect subzones 2, 3, 8, and 9, and significant differences with the other aspect subzones. Therefore, the vegetation coverage of the northern, northeastern, eastern, western, and northwestern aspects was the best.
Among the anthropogenic factors, both GDP and population density had little influence. The GDP was divided into seven subzones. The NDVI value peaked at a GDP of 12 × 104–37 × 104 yuan/km2 and was not significantly different from that of the area with a GDP of 1.04 × 10⁴–2.42 × 10⁴ yuan/km2; therefore, the vegetation growth was good in both of these areas. The population density was divided into seven subzones. The largest NDVI value was observed in the area with a population density of 74.95–94.31 people/km2, with no significant differences with the area with a population density of 8.43–19.37 people/km2; therefore, the vegetation coverage was optimal in both areas. The area with a population density in the 74.95–94.31 people/km2 range was very small, accounting for only 0.02% of the total area, which may have led to inaccurate results. If this area is not considered in the analysis, the NDVI will increase and then decrease with increasing population density, with larger values in the range of 8.43 to 19.37 people/km2, this result would be more accurate.

4. Discussion

Global warming over the last few decades has led to changes in the regional environment. Under the influence of climate change and human activities, vegetation green has generally increased in China [38]; the NDVI has shown an increasing trend in northern China over the past 40 years [39]; the Qinghai–Tibet Plateau tends to become warm and wet, and the vegetation status has gradually improved [40]. This study showed that the NDVI of vegetation in the TRHR also showed an increasing trend from 1982 to 2015, which is consistent with the trend of the NDVI change in China and Qinghai–Tibet Plateau during this period.
In this study, four geographical detectors were used to quantify the main drivers of the NDVI in the TRHR and the interaction of the factors. In the following sections, we will discuss the effects of natural and anthropogenic factors separately.

4.1. Effects of Natural Factors

The Qinghai–Tibet Plateau is a sensitive area for climate change in China [41]. This study indicated that climate factors were the main drivers of the NDVI changes in the TRHR, which is consistent with the findings of Chen [42]. The factor detector showed that the q value of annual precipitation was the largest and was the dominant factor influencing NDVI changes in the TRHR, which is consistent with the findings of Zheng [43] and Xiong [44]. In contrast, Xu [45] and Zhu [46] considered temperature as the dominant factor influencing NDVI variation in the TRHR; the differences in the results may be attributed to the different time scales of the study or the different spatial resolutions of the NDVI used. The warming trend in the TRHR was greater than the Chinese, as well as global average during 1982–2015, and precipitation was lower compared to the global [20]. Extreme temperature increases, and extreme precipitation is relatively stable. The rapid increase in temperature and slow increase in precipitation in the TRHR has led to regional warming and drought [47], while studies have shown that precipitation is the main factor affecting changes in vegetation NDVI in arid and semi-arid alpine meadow and alpine grassland regions [48]. The M-K test showed that the annual precipitation in the TRHR changed abruptly in 2004 and 2006 (Figure A1), and extreme drought events occurred frequently. In 2006, the TRHR suffered an extreme drought, and the growth of forage grasses was disrupted and the grassland ecosystem was damaged [49], resulting in a decrease in NDVI. Precipitation increased abruptly around 2007 [50], since the NDVI has a lag effect on precipitation [51], the NDVI increased abruptly from 2008 onwards. The influence of extreme precipitation events on NDVI in the Qinghai–Tibet Plateau region is more pronounced than that of extreme temperature events, indicating that vegetation is more sensitive to changes in precipitation. Extreme wetness would offset the negative effects caused by extreme drought, and extreme high temperature events occurring in May would stimulate vegetation growth, while extreme low temperatures would inhibit vegetation growth [52]. The effects of extreme climatic events on the vegetation of the TRHR need further study. The influence of temperature on the NDVI gradually decreased, while precipitation occupied a more dominant position [42]. The annual precipitation and annual mean temperature of the TRHR decreased from southeast to northwest. The increasing trend of temperature in the TRHR was significantly greater than that of precipitation, can lead to the warming and drying of the TRHR, which will inhibit vegetation growth [53]. Seasonally, precipitation in the TRHR increases in spring and winter, and in summer when the temperature rises, precipitation also increases [54]. The growing season of vegetation in the TRHR is from May to September, and the climate is conducive for vegetation growth. Water resources are closely related to vegetation, and vegetation changes interact with hydrological processes [55]. Changes in temperature and precipitation lead to changes in vegetation patterns, which can alter surface hydrological characteristics, which, in turn, can affect changes in vegetation coverage [56]. The artificial rainfall implemented by the ecological project of the TRHR has restored the vegetation coverage and the increase in precipitation is beneficial to the growth of vegetation, but the excessive precipitation may cause soil erosion [57], which will instead damage vegetation, therefore the artificial rainfall project should be implemented scientifically and consistently to promote the growth of vegetation in the TRHR.
The vegetation types of the TRHR were mainly alpine meadows and alpine grasslands. During 1982–2015, part of the desert vegetation was converted to grassland and meadow vegetation types, increasing the vegetation coverage. Coniferous forests were mainly distributed in the elevation range of 3446 to 3851 m, and natural environmental conditions were more suitable for vegetation growth. The medium-undulating mountains were mainly dominated by meadow and scrub vegetation types, which were distributed in the southern part of the TRHR, with sufficient hydrothermal conditions and relatively suitable elevation, which are favorable for vegetation growth. The soil is the basis for vegetation growth. The fertilizer retention capacity of semi-leached soil is high, and the semi-leached soil of the TRHR is mainly distributed in mountainous areas, which are favorable for vegetation growth. In this study, the influence of soil type on vegetation change was small, but the interaction with other factors could enhance this influence; for example, the interaction of soil type with temperature and precipitation had a higher influence on the NDVI than did soil by itself. Soil temperature has an important effect on vegetation growth [58].
Topography affects vegetation distribution by changing water and heat conditions [28]. According to Chen [59], the 3500 to 3800 m elevation range is relatively low and precipitation and temperature conditions are good, thus the NDVI value is the largest in this elevation range. In elevations higher than 3800 m, the natural conditions become worse as the elevation increases, thus the NDVI value decreases as well. Slope affects vegetation growth by changing surface runoff, and vegetation coverage generally decreases with increasing slope. However, in this study, the gentle slope was more influenced by human activities; the vegetation coverage was low, while, with increasing slope, human influence decreased and vegetation coverage was relatively high. Aspect affects light intensity, which, in turn, changes the hydrothermal conditions for vegetation growth. The sunny slope has strong light, less soil water content, less nutrient accumulation, and lower vegetation coverage, while the shady, semi-shady, and semi-sunny slopes have sufficient soil water and high nutrient content [60], which are suitable for vegetation growth.

4.2. Effects of Anthropogenic Factors

According to the results of factor detection, anthropogenic factors had little influence on the NDVI. However, the combination of anthropogenic with natural factors can increase the impact. The population density in the TRHR was relatively small, and economic development was slow. Land use type had the greatest influence on the NDVI among anthropogenic factors. Low-coverage grassland is mainly located in the northwest, where water resources are scarce and the altitude is high, while high-coverage grassland is mainly located in the southeast where water and heat conditions are better. From 1980 to 2015, the conversion area between unused land and grasslands is large, and most unused land is converted into low-cover grasslands, but overall the increase in the area of unused land is greater than the decrease. Due to increase in population, land for construction has expanded. Ecological protection projects have increased the area of waters and lakes and improved the condition of wetlands. Before 2000, overgrazing led to the degradation of grassland; therefore, although the grassland area was large in the TRHR, the NDVI value was low. The implementation of the Sanjiangyuan Ecological Project in 2005 resulted in the slight recovery of the grassland, but the effects were short-term [61]. The areas with the highest NDVI values under the influence of GDP and population density were all located in the northeastern part of the TRHR, which is relatively densely populated, vegetation is affected by human activities, and the population is usually distributed in areas with better vegetation coverage [62] which have good survival conditions. Such natural conditions are also suitable for the growth of vegetation, but the increase in population will also cause some damage to vegetation, and the NDVI of vegetation will decrease beyond a certain range of population numbers.
The main conclusion of this study is that, compared with natural factors, anthropogenic factors had less influence on the NDVI of the TRHR. Natural factors, especially climatic factors, dominated the changes in the NDVI in the vegetation of the TRHR. In the context of global climate change, climatic factors have a strong association with vegetation change [56]. This is also verified by this study. The TRHR is at a high altitude, the population is sparse and the area of cultivated land is small. The impact of human farming activities is small, and although there is a certain degree of grazing, the impact is minimal relative to the climate, so the study area in this paper is basically equivalent to an undisturbed area. Therefore, the impact of human activities on the vegetation of the TRHR is very limited. As the impact of anthropogenic factors is short-lived, ecological engineering needs to be implemented continuously. Effective interventions for the restoration of vegetation in the TRHR can be based on the appropriate range or types of factors or a combination of factors. Separating natural factors from anthropogenic factors and quantitatively studying the influence of factors on vegetation is important for the ecological protection and sustainable development of the TRHR, as well as the middle and lower reaches of the region.

4.3. Effectiveness, Limitations, and Future Directions

To the best of our knowledge, this study is the first to use a geographical detector to quantify the effects of natural and anthropogenic factors on vegetation activity and effectively distinguish between the effects of natural and anthropogenic factors on the NDVI in the TRHR. The natural environment of the TRHR is complex, diverse, and spatially heterogeneous. Previous studies on vegetation drivers have used correlation analysis, which assumes a linear relationship between the NDVI and drivers, whereas correlation studies have shown a nonlinear relationship [63]; in contrast to traditional methods, the geographical detector can quantify the non-linear effects of factors and their interactions on vegetation change, making it well suited for this study. We also made the selection of factors with reference to existing studies, and the factors selected in this paper have been shown to be effective many times [13,14,29,64,65], so that the factors selected can be non-independent and the geographical detector method selected for this study allows the analysis of interactions between factors that have been neglected by traditional methods. However, the independent variable input to the geographical detector consists of type quantities, thus the numerical quantities must be classified. This study was based on the natural break method of classifying independent variables, which has been applied before and proven to be effective [29]; different methods of classification can affect the results. To ensure the length and completeness of the time series, NDVI data with a spatial resolution of 8 km were used in this study, which may have had some influence on the results owing to the low data resolution. Although NDVI is currently considered to be the most effective indicator for detecting vegetation change, it has shortcomings, such as the NDVI can reach saturation in dense vegetation canopies, which may lead to inaccurate trends in areas of dense biomass, and the effect on soil background in low vegetation coverage areas is not addressed [66], which were did not consider in this paper. Additionally, the different time ranges of the selected data may lead to some differences in the results, for example, if the growing season data are selected for analysis, the spatial and temporal distribution pattern of the NDVI in the growing season is basically the same as that of the whole year, the influence results are opposite to the annual data, and the influence of temperature (0.458) is slightly greater than the influence of precipitation (0.448). Although there are some differences in the results, the influence of climate factor is still the largest and is the dominant factor of vegetation coverage change in the TRHR, and this main result is unchanged. Therefore, for further research, data resolution should be further improved, while classification methods also need further improvement. To obtain a more accurate result, future studies could use the improved enhanced vegetation index (EVI) for comparison. The effect of growing season climate change on vegetation NDVI also needs further study.

5. Conclusions

In this study, which was based on GIMMS- NDVI data from 1982 to 2015 and 11 detection factors from the same period, we analyzed the spatial and temporal variation characteristics of the NDVI in the TRHR using linear regression analysis, the Mann-Kendall test, and the moving t-test. We also analyzed its spatial heterogeneity and driving factors using a geographical detector, and determined the appropriate range or types of factors suitable for vegetation growth. The main conclusions of the study are as follows:
(1) The NDVI distribution of the TRHR was high in the southeast and low in the northwest; the change had an increasing trend in the west and north and a decreasing trend in the center and south. The annual mean value of the NDVI from 1982 to 2015 generally followed a slow increasing trend with a growth rate of 0.002/10 a; regions with low and high vegetation coverage decreased, while other regions increased. The NDVI increased abruptly in 2008. Overall condition of the TRHR has been improving, but vegetation coverage remains poor.
(2) The magnitude of the influence of each factor on the NDVI was as follows: annual precipitation > annual mean temperature > vegetation type > elevation > land use type > landform type > population density > soil type > GDP > aspect. Among them, annual precipitation had an explanatory power of more than 50% and was the dominant factor influencing NDVI changes in the TRHR. The annual mean temperature, vegetation type, and elevation had an explanatory power of more than 30% and also explained NDVI changes well. Land use type, landform type, and population density had an explanatory power of more than 20%, while other factors had less explanatory power. Compared with the natural factors, the influence of anthropogenic factors on the NDVI of vegetation in the TRHR was smaller. Climatic factors were the main drivers of NDVI changes in the TRHR.
(3) Interactions of bivariate and non-linear enhancements among the NDVI factors were observed, and there were no factors with weakening and independent effects. The interactions of annual precipitation, elevation, mean annual temperature, and vegetation type enhanced the influence of the factors to the greatest extent. Although factors such as the GDP and aspect had small influence on the NDVI, their interaction with other factors greatly increased their explanatory power on the NDVI.
(4) We analyzed the NDVI changes in the TRHR from 1982 to 2015, revealed the natural and anthropogenic factors driving NDVI changes, and determined the appropriate range or types of factors, which is important for ecological conservation and the sustainable development of the TRHR.

Author Contributions

Conceptualization, S.G.; Methodology, S.G.; software, S.G.; validation, T.N.; formal analysis, T.N.; investigation, S.G.; resources, G.D.; data curation, S.G.; writing—original draft preparation, S.G.; writing—review and editing, G.D., H.Y., X.G.; visualization, G.D.; supervision, G.D.; project administration, G.D., X.J.; funding acquisition, G.D., X.J. All authors have read and agreed to the published version of the manuscript.

Funding

This research was supported by the National Natural Science Fund (51779099, 51779209, 51909099), and the National key research and development plan (2016YFC0402400).

Data Availability Statement

The data presented in this study are available on request from the corresponding author. The data are not publicly available due to privacy.

Acknowledgments

We sincerely thank the editor and anonymous reviewers for their valuable comments and suggestions to improve the quality of this paper.

Conflicts of Interest

The authors declare no conflict of interest.

Appendix A

Table A1. Land use transfer matrix (km2).
Area/km²CroplandForest LandHigh-Coverage GrasslandMiddle-Coverage GrasslandLow-Coverage GrasslandWater AreaConstruction LandUnused Land2015 Total
Cropland2010.750.000.00232.852.410.000.000.002246.01
Forest land0.0014,805.100.0020.4430.610.000.000.0014,856.15
High-coverage grassland78.420.0020,236.10254.87156.840.000.0080.8320,807.07
Middle-coverage grassland0.0071.3478.4293,372.201250.000.280.00160.9694,933.20
Low-coverage grassland78.4280.8319.61663.11141,923.00225.490.00182.09143,172.54
Water area313.680.000.0050.228.7816,702.200.00289.6117,364.50
Construction land78.420.000.00156.840.000.0078.420.00313.68
Unused land0.000.0030.61346.55738.81414.770.0085,102.6086,633.34
1980 Total2559.7014,957.2720,364.7495,097.07144,110.4617,342.7478.4285,816.09
Area change−313.69−101.12442.33−163.87−937.9221.76235.26817.25
Figure A1. M-K test for annual precipitation.
Remotesensing 13 04175 g0a1

References

  1. Zhao, L.; Dai, A.G.; Dong, B. Changes in global vegetation activity and its driving factors during 1982–2013. Agric. For. Meteorol. 2018, 249, 198–209. [Google Scholar] [CrossRef]
  2. Pettorelli, N.; Vik, J.O.; Mysterud, A.; Gaillard, J.M.; Tucker, C.J.; Stenseth, N.C. Using the satellite-derived NDVI to assess ecological responses to environmental change. Trends Ecol. Evol. 2005, 20, 503. [Google Scholar] [CrossRef] [PubMed]
  3. Fensholt, R.; Langanke, T.; Rasmussen, K.; Reenberg, A.; Prince, S.D.; Tucker, C.; Scholes, R.J.; Le, Q.B.; Bondeau, A.; Eastman, R.; et al. Greenness in semi-arid areas across the globe 1981–2007—An Earth Observing Satellite based analysis of trends and drivers. Remote Sens. Environ. 2012, 121, 144–158. [Google Scholar] [CrossRef]
  4. Liu, Y.; Li, Y.; Li, S.H.; Motesharrei, S. Spatial and Temporal Patterns of Global NDVI Trends: Correlations with Climate and Human Factors. Remote Sens. 2015, 7, 13233–13250. [Google Scholar] [CrossRef] [Green Version]
  5. Jiang, L.L.; Jiapaer, G.; Bao, A.M.; Guo, H.; Ndayisaba, F. Vegetation dynamics and responses to climate change and human activities in Central Asia. Sci. Total Environ. 2017, 599–600. [Google Scholar] [CrossRef]
  6. Gong, Z.N.; Zhao, S.Y.; Gu, J.Z. Correlation analysis between vegetation coverage and climate drought conditions in North China during 2001–2013. J. Geogr. Sci. 2017, 27, 143–160. [Google Scholar] [CrossRef]
  7. Hu, Y.F.; Dao, R.N.; Hu, Y. Vegetation Change and Driving Factors: Contribution Analysis in the Loess Plateau of China during 2000–2015. Sustainability 2019, 11, 1320. [Google Scholar] [CrossRef] [Green Version]
  8. Huang, K.; Zhang, Y.J.; Zhu, J.T.; Liu, Y.J.; Zu, J.X.; Zhang, J. The Influences of Climate Change and Human Activities on Vegetation Dynamics in the Qinghai-Tibet Plateau. Remote Sens. 2016, 8, 876. [Google Scholar] [CrossRef] [Green Version]
  9. Qu, S.; Wang, L.C.; Lin, A.W.; Zhu, H.J.; Yuan, M.X. What drives the vegetation restoration in Yangtze River basin, China: Climate change or anthropogenic factors. Scientidicators 2018, 90, 438–450. [Google Scholar] [CrossRef]
  10. Chu, H.S.; Venevsky, S.; Wu, C.; Wang, M.H. NDVI-based vegetation dynamics and its response to climate changes at Amur-Heilongjiang River Basin from 1982 to 2015. Sci. Total Environ. 2018, 650 Pt 2, 2051–2062. [Google Scholar] [CrossRef]
  11. Wang, J.F.; Xu, C.D. Geodetector: Principle and prospective. Acta Geogr. Sin. 2017, 72, 116–134. (In Chinese) [Google Scholar]
  12. Zhao, W.; Hu, Z.M.; Guo, Q.; Wu, G.N.; Chen, R.R.; Li, S.G. Contributions of Climatic Factors to Interannual Variability of the Vegetation Index in Northern China Grasslands. J. Clim. 2020, 33, 175–183. [Google Scholar] [CrossRef]
  13. Yuan, L.H.; Chen, X.Q.; Wang, X.Y.; Xiong, Z.; Song, C.Q. Spatial associations between NDVI and environmental factors in the Heihe River Basin. J. Geogr. Sci. 2019, 29, 1548–1564. [Google Scholar] [CrossRef] [Green Version]
  14. Zhu, L.J.; Meng, J.J.; Zhu, L.K. Applying Geodetector to disentangle the contributions of natural and anthropogenic factors to NDVI variations in the middle reaches of the Heihe River Basin. Ecol. Indic. 2020, 117, 106545. [Google Scholar] [CrossRef]
  15. Ran, Q.W.; Hao, Y.B.; Xia, A.Q.; Liu, W.J.; Hu, R.H.; Cui, X.Y.; Xue, K.; Song, X.N.; Xu, C.; Ding, B.Y.; et al. Quantitative Assessment of the Impact of Physical and Anthropogenic Factors on Vegetation Spatial-Temporal Variation in Northern Tibet. Remote Sens. 2019, 11, 1183. [Google Scholar] [CrossRef] [Green Version]
  16. Zhang, Y.; Zhang, K.C.; An, Z.S.; Yu, Y.P. Quantification of driving factors on NDVI in oasis-desert ecotone using geographical detector method. J. Mt. Sci. 2019, 16, 2615–2624. [Google Scholar] [CrossRef]
  17. Liu, Y.X.; Liu, S.L.; Sun, Y.X.; Li, M.Q.; An, Y.; Shi, F.N. Spatial differentiation of the NPP and NDVI and its influencing factors vary with grassland type on the Qinghai-Tibet Plateau. Environ. Monit. Assess. 2021, 193, 48. [Google Scholar] [CrossRef]
  18. Liu, J.Y.; Xu, X.L.; Shao, Q.Q. Grassland degradation in the “Three-River Headwaters” region, Qinghai Province. J. Geogr. Sci. 2008, 18, 259–273. [Google Scholar] [CrossRef]
  19. Wang, R.; Dong, Z.B.; Zhou, Z.C. Changes in the depths of seasonal freezing and thawing and their effects on vegetation in the Three-River Headwater Region of the Tibetan Plateau. J. Mt. Sci. 2019, 16, 2810–2827. [Google Scholar] [CrossRef]
  20. Bai, Y.F.; Guo, C.C.; Degen, A.A.; Ahmad, A.A.; Wang, W.Y.; Zhang, T.; Li, W.Y.; Ma, L.; Huang, M.; Zeng, H.J.; et al. Climate warming benefits alpine vegetation growth in Three-River Headwater Region, China. Sci. Total Environ. 2020, 742, 140574. [Google Scholar] [CrossRef]
  21. Pang, G.J.; Wang, X.J.; Yang, M.X. Using the NDVI to identify variations in, and responses of, vegetation to climate change on the Tibetan Plateau from 1982 to 2012. Quat. Int. 2016, 444 Pt A, 87–96. [Google Scholar] [CrossRef]
  22. Jiang, C.; Zhang, L.B. Climate Change and Its Impact on the Eco-Environment of the Three-Rivers Headwater Region on the Tibetan Plateau, China. Int. J. Environ. Res. Public Health 2015, 12, 12057–12081. [Google Scholar] [CrossRef] [PubMed] [Green Version]
  23. Li, F.X.; Li, X.D.; Zhou, B.R.; Qi, D.L.; Wang, L.; Fu, H. Effects of grazing intensity on biomass and soil physical and chemical characteristics in alpine meadow in the source of three rivers. Pratacultural Sci. 2015, 32, 11–18. (In Chinese) [Google Scholar]
  24. Pinzon, J.E.; Tucker, C.J. A non-stationary 1981–2012 AVHRR NDVI3g time series. Remote Sens. 2014, 6, 6929–6960. [Google Scholar] [CrossRef] [Green Version]
  25. National Oceanic and Atmospheric Administration. GIMMS NDVI3g dataset for Sanjiangyuan (1982–2015). A Big Earth Data Platf. Three Poles 2018. CSTR: 18406.11.Ecolo.tpdc.271224. [CrossRef]
  26. Holben, B.N. Characteristics of maximum-value composite images from temporal AVHRR data. Int. J. Remote Sens. 1986, 7, 1417–1434. [Google Scholar] [CrossRef]
  27. Wei, Y.Q. Establishing Developing and Applying of the Space-Air-Field Integrated Eco-Monitoring and Data Infrastructure of the Three-River-Source National Park. The boundaries of the source regions in Sanjiangyuan region (2018). A Big Earth Data Platf. Three Poles 2018. CSTR: 18406.11.Geogra.tpdc.270009. [Google Scholar] [CrossRef]
  28. Feng, J.M.; Dong, B.Q.; Qin, T.L.; Liu, S.S.; Zhang, J.W.; Gong, X.F. Temporal and Spatial Variation Characteristics of NDVI and Its Relationship with Environmental Factors in Huangshui River Basin from 2000 to 2018. Pol. J. Environ. Stud. 2021, 30, 3043–3063. [Google Scholar] [CrossRef]
  29. Peng, W.F.; Kuang, T.T.; Tao, S. Quantifying influences of natural factors on vegetation NDVI changes based on geographical detector in Sichuan, western China. J. Clean. Prod. 2019, 233, 353–367. [Google Scholar] [CrossRef]
  30. Nie, T.; Dong, G.T.; Jiang, X.H.; Lei, Y.X. Spatio-Temporal Changes and Driving Forces of Vegetation Coverage on the Loess Plateau of Northern Shaanxi. Remote Sens. 2021, 13, 613. [Google Scholar] [CrossRef]
  31. Liu, Y.S.; Li, J.T. Geographic detection and optimizing decision of the differentiation mechanism of rural poverty in China. Acta Geogr. Sin. 2017, 72, 161–173. (In Chinese) [Google Scholar]
  32. Jiao, K.W.; Gao, J.B.; Wu, S.H. Climatic determinants impacting the distribution of greenness in China: Regional differentiation and spatial variability. Int. J. Biometeorol. 2019, 63, 523–533. [Google Scholar] [CrossRef]
  33. Feng, X.Q.; Zhang, G.X.; Yin, X.R. Hydrological Responses to Climate Change in Nenjiang River Basin, Northeastern China. Water Resour. Manag. 2011, 25, 677–689. [Google Scholar] [CrossRef]
  34. Liu, H.Y.; Jiao, F.S.; Yin, J.Q.; Li, T.Y.; Gong, H.B.; Wang, Z.Y.; Lin, Z.S. Nonlinear relationship of vegetation greening with nature and human factors and its forecast—A case study of Southwest China. Ecol. Indic. 2020, 111, 106009. [Google Scholar] [CrossRef]
  35. Du, R.S.; Shang, F.H.; Ma, N. Automatic mutation feature identification from well logging curves based on sliding t test algorithm. Clust. Comput. 2019, 22, 14193–14200. [Google Scholar] [CrossRef]
  36. Zhai, X.H.; Liang, X.L.; Yan, C.Z.; Xing, X.G.; Jia, H.W.; Wei, X.X.; Feng, K. Vegetation Dynamic Changes and Their Response to Ecological Engineering in the Sanjiangyuan Region of China. Remote Sens. 2020, 12, 4035. [Google Scholar] [CrossRef]
  37. Rao, P.Z.; Wang, Y.C.; Wang, F. Analysis on the NDVI Change and Influence Factors of Vegetation Cover in the Three-River Headwaters Region. Acta Agrestia Sin. 2021, 29, 572–582. (In Chinese) [Google Scholar]
  38. Wang, H.; Yan, S.J.; Liang, Z.; Jiao, K.W.; Li, D.L.; Wei, F.L.; Li, S.C. Strength of association between vegetation greenness and its drivers across China between 1982 and 2015: Regional differences and temporal variations. Ecol. Indic. 2021, 128, 107831. [Google Scholar] [CrossRef]
  39. Lin, X.N.; Niu, J.Z.; Berndtsson, R.; Yu, X.X.; Zhang, L.; Chen, X.W. NDVI Dynamics and Its Response to Climate Change and Reforestation in Northern China. Remote Sens. 2020, 12, 4138. [Google Scholar] [CrossRef]
  40. Piao, S.L.; Cui, M.D.; Chen, A.P.; Wang, X.H.; Ciais, P.; Liu, J.; Tang, Y.H. Altitude and temperature dependence of change in the spring vegetation green-up date from 1982 to 2006 in the Qinghai-Xizang Plateau. Agric. For. Meteorol. 2011, 151, 1599–1608. [Google Scholar] [CrossRef]
  41. Li, W.H. An Overview of Ecological Research Conducted on the Qinghai-Tibetan Plateau. J. Resour. Ecol. 2017, 8, 1–4. [Google Scholar]
  42. Chen, C.; Li, T.J.; Sivakumar, B.; Li, J.Y.; Wang, G.Q. Attribution of growing season vegetation activity to climate change and human activities in the Three-River Headwaters Region, China. J. Hydroinform. 2020, 22, 186–204. [Google Scholar] [CrossRef]
  43. Zheng, Y.T.; Han, J.C.; Huang, Y.F.; Fassnacht, S.R.; Xie, S.; Lv, E.Z.; Chen, M. Vegetation response to climate conditions based on NDVI simulations using stepwise cluster analysis for the Three-River Headwaters region of China. Ecol. Indic. 2018, 92, 18–29. [Google Scholar] [CrossRef]
  44. Xiong, Q.L.; Xiao, Y.; Halmy, M.W.; Dakhil, M.A.; Liang, P.H.; Liu, C.G.; Zhang, L.; Pandey, B.; Pan, K.W.; Kafraway, S.B.; et al. Monitoring the impact of climate change and human activities on grassland vegetation dynamics in the northeastern Qinghai-Tibet Plateau of China during 2000–2015. J. Arid Land 2019, 11, 637–651. [Google Scholar] [CrossRef] [Green Version]
  45. Xu, W.X.; Gu, S.; Zhao, X.Q.; Xiao, J.S.; Tang, Y.H.; Fang, J.Y.; Zhang, J.; Jiang, S. High positive correlation between soil temperature and NDVI from 1982 to 2006 in alpine meadow of the Three-River Source Region on the Qinghai-Tibetan Plateau. Int. J. Appl. Earth Obs. Geoinf. 2011, 13, 528–535. [Google Scholar] [CrossRef]
  46. Zhu, W.H.; Mao, F.; Xu, Y.; Zheng, J.; Song, L.X. Analysis on response of vegetation index to climate change and its prediction in the Three-Rivers-Source region. Plateau Meteorol. 2019, 38, 693–704. (In Chinese) [Google Scholar]
  47. Bai, X.L.; Wei, J.H.; Xie, H.W. Characteristics of wetness/dryness variation and their influences in the Three-River Headwaters region. Acta Ecol. Sin. 2017, 37, 8397–8410. (In Chinese) [Google Scholar]
  48. Sun, J.; Cheng, G.W.; Li, W.P.; Sha, Y.K.; Yang, Y.C. On the Variation of NDVI with the Principal Climatic Elements in the Tibetan Plateau. Remote Sens. 2013, 5, 1894–1911. [Google Scholar] [CrossRef] [Green Version]
  49. Meng, X.H.; Chen, H.; Li, Z.G.; Zhao, L.R.; Lu, S.H.; Deng, M.S.; Liu, Y.M.; Li, G.W. Review of Climate Change and Its Environmental Influence on the Three-River Regions. Plateau Meteorol. 2020, 39, 1133–1143. (In Chinese) [Google Scholar]
  50. Cao, L.; Pan, S. Changes in precipitation extremes over the “Three-River headwaters” region, hinterland of the Tibetan plateau, during 1960–2012. Quat. Int. 2014, 321, 105–115. [Google Scholar] [CrossRef]
  51. Zhong, L.; Ma, Y.M.; Salama, M.S.; Su, Z.B. Assessment of vegetation dynamics and their response to variations in precipitation and temperature in the Tibetan Plateau. Clim. Chang. 2010, 103, 519–535. [Google Scholar] [CrossRef]
  52. Liu, D.; Wang, T.; Yang, T.; Yan, Z.J.; Liu, Y.W.; Zhao, Y.T.; Piao, S.L. Deciphering impacts of climate extremes on Tibetan grasslands in the last fifteen years. Sci. Bull. 2019, 64, 446–454. [Google Scholar] [CrossRef] [Green Version]
  53. Liu, X.F.; Zhang, J.S.; Zhu, X.F. Spatiotemporal changes in vegetation coverage and its driving factors in the Three-River Headwaters Region during 2000–2011. J. Geogr. Sci. 2014, 24, 288–302. [Google Scholar] [CrossRef]
  54. Yi, X.S.; Li, G.S.; Yin, Y.Y. Spatio-temporal variation of precipitation in the Three-River Headwater Region from 1961 to 2010. J. Geogr. Sci. 2013, 23, 447–464. [Google Scholar] [CrossRef]
  55. Wang, H.N.; Lv, X.Z.; Zhang, M.Y. Sensitivity and attribution analysis of vegetation changes on evapotranspiration with the Budyko framework in the Baiyangdian catchment, China. Ecol. Indic. 2021, 120, 106963. [Google Scholar] [CrossRef]
  56. Kumari, N.; Srivastava, A.; Dumka, U.C. A Long-Term Spatiotemporal Analysis of Vegetation Greenness over the Himalayan Region Using Google Earth Engine. Climate 2021, 9, 109. [Google Scholar] [CrossRef]
  57. Shao, Q.Q.; Cao, W.; Fan, J.W.; Huang, L.; Xu, X.L. Effects of an ecological conservation and restoration project in the Three-River Source Region, China. J. Geogr. Sci. 2017, 27, 183–204. [Google Scholar] [CrossRef]
  58. Jiang, C.; Zhang, L.B. Ecosystem change assessment in the Three-river Headwater Region, China: Patterns, causes, and implications. Ecol. Eng. 2016, 93, 24–36. [Google Scholar] [CrossRef]
  59. Chen, Q.; Zhou, Q.; Zhang, H.F.; Liu, F.G. Spatial disparity of NDVI response in vegetation growing season to climate change in the Three-River Headwaters region. Ecol. Environ. Sci. 2010, 19, 1284–1289. (In Chinese) [Google Scholar]
  60. Liu, M.X.; Wang, G. Responses of plant community diversity and soil factors to slope aspect in alpine meadow. Chin. J. Ecol. 2013, 32, 259–265. (In Chinese) [Google Scholar]
  61. Shen, X.J.; An, R.; Feng, L.; Ye, N.; Zhu, L.J.; Li, M.H. Vegetation changes in the Three-River Headwaters Region of the Tibetan Plateau of China. Ecol. Indic. 2018, 93, 804–812. [Google Scholar] [CrossRef]
  62. Wang, S.H.; Jia, S.F.; Lv, A.F. The relationship be- tween NDVI and residential sites across Three-River-Source area. Resour. Sci. 2012, 34, 2045–2050. (In Chinese) [Google Scholar]
  63. Hein, L.; de Ridder, N.; Hiernaux, P.; Leemans, R.; de Witd, A.; Schaepman, M. Desertification in the Sahel: Towards better accounting for ecosystem dynamics in the interpretation of remote sensing images. J. Arid Environ. 2011, 75, 1164–1172. [Google Scholar] [CrossRef]
  64. Meng, X.Y.; Gao, X.; Li, S.Y.; Lei, J.Q. Spatial and Temporal Characteristics of Vegetation NDVI Changes and the Driving Forces in Mongolia during 1982–2015. Remote Sens. 2020, 12, 603. [Google Scholar] [CrossRef] [Green Version]
  65. Yu, G.; Zhang, X.Y.; Wang, Q.B.; Chen, H.K.; Du, X.Y.; Ma, Y.P. Temporal changes in vegetation around a shale gas development area in a subtropical karst region in southwestern China. Sci. Total Environ. 2020, 701, 134769. [Google Scholar]
  66. Huete, A.; Didan, K.; Miura, K.; Rodriguez, E.P.; Gao, X.; Ferreira, L.G. Overview of the radiometric and biophysical performance of the MODIS vegetation indices. Remote Sens. Environ. 2002, 83, 195–213. [Google Scholar] [CrossRef]
Figure 1. Sketch map of the three-river headwater region.
Remotesensing 13 04175 g001
Figure 2. Classification of factors: (a) Slope; (b) Aspect; (c) Elevation; (d) Soil type; (e) Vegetation type; (f) Landform type; (g) Temperature; (h) Precipitation; (i) GDP; (j) Population density; (k) Land-use type.
Remotesensing 13 04175 g002aRemotesensing 13 04175 g002b
Figure 3. Spatial distributions of the NDVI: (a) NDVI in 1982; (b) NDVI in 2015.
Remotesensing 13 04175 g003
Figure 4. Change trend of the NDVI during 1982–2015 (The statistical significance level is 0.05).
Remotesensing 13 04175 g004
Figure 5. Distribution of the NDVI change trend during 1982–2015.
Remotesensing 13 04175 g005
Figure 6. The results of the M-K test.
Remotesensing 13 04175 g006
Figure 7. The results of the moving t-test.
Remotesensing 13 04175 g007
Figure 8. NDVI cumulative departure.
Remotesensing 13 04175 g008
Table 1. Detection factors.
TypeDetection FactorsIndexUnitTypeDetection FactorsIndexUnit
TopographyX1Slope °ClimateX7Annual mean temperature°C
X2Aspect° X8Annual precipitationmm
X3ElevationmHuman activityX9GDP10,000 yuan/km2
SoilX4Soil type- X10Population densitypeople/km2
VegetationX5Vegetation type- X11Land use type-
LandformX6Landform type-
Table 2. Types of interaction.
FoundationInteraction
q (X1∩X2) < Min [q (X1), q (X2)]Nonlinear weakening
Min [q (X1), q (X2) < q (X1∩X2) < Max (q (X1), q (X2)]Univariate weakening
q (X1∩X2) > Max [q (X1), q (X2)]Bivariate enhancement
q (X1∩X2) = q (X1) + q (X2)Independent
q (X1∩X2) > q (X1) + q (X2)Nonlinear enhancement
Table 3. The transfer matrix of NDVI changes during 1982–2015 (km2).
NDVI Grade.≤0.20.2–0.40.4–0.60.6–0.8>0.8Total in 2015Shifted-In
≤0.252,380.303574.5228.6240.130.0056,023.573643.27
0.2–0.415,250.2079,604.607079.0467.180.00102,001.0222,396.42
0.4–0.6136.9511,649.3075,441.7015,042.1021.3910,2291.4426,849.74
0.6–0.80.00234.229102.2681,869.6014,528.30105,734.3823,864.78
>0.80.000.0040.504214.9110,510.8014,766.214255.41
Total in 198267,767.4595,062.6491,692.13101,233.9225,060.49380,816.63
Shifted-out15,387.1515,458.0416,250.4319,364.3214,549.69
Variation−11,743.886938.3810,599.314500.46−10,294.28
Percentage (%)−3.081.822.781.18−2.70
Table 4. Change trend of the NDVI during 1982–2015.
Change TrendGradientArea/km2Percentage (%)
Significant degradation−0.0107–−0.00245511.501.44
Moderate degradation−0.0024–−0.001040,788.8010.65
Slight degradation−0.0010–−0.000279,577.9020.78
Basically unchanged−0.0002–0.0005112,079.0029.27
Slight improvement0.0005–0.001394,305.4024.63
Moderate improvement0.0013–0.002644,664.9011.66
Significant improvement0.0026–0.01796025.251.57
Table 5. q values of factors.
FactorsX1X2X3X4X5X6X7X8X9X10X11
q value0.1410.0550.3500.1470.4090.2160.4630.5500.0880.2040.244
p value0.0000.0000.0000.0000.0000.0000.0000.0000.0000.0000.000
Table 6. Ecological detection of factors.
FactorsX1X2X3X4X5X6X7X8X9X10X11
X1
X2Y
X3YY
X4NYY
X5YYYY
X6YYYYY
X7YYYYYY
X8YYYYYYY
X9YYYYYYYY
X10YYYYYNYYY
X11YYYYYYYYYY
Note: Y indicates a significant difference in the influence of two factors on vegetation NDVI, while N indicates no significant difference (confidence level is 95%).
Table 7. Interaction detection of factors.
X1X2X3X4X5X6X7X8X9X10X11
X10.141
X20.176 0.055
X30.473 0.415 0.350
X40.258 0.164 0.461 0.147
X50.468 0.431 0.599 0.468 0.409
X60.265 0.255 0.548 0.356 0.507 0.216
X70.522 0.532 0.611 0.597 0.660 0.535 0.463
X80.583 0.585 0.680 0.610 0.677 0.605 0.679 0.550
X90.227 0.149 0.376 0.247 0.487 0.301 0.487 0.586 0.088
X100.304 0.266 0.485 0.371 0.558 0.352 0.527 0.607 0.352 0.204
X110.324 0.263 0.501 0.324 0.492 0.369 0.573 0.628 0.334 0.360 0.244
Table 8. Suitable range or types of natural factors.
FactorsSuitable Range or Types NDVI
Slope (°)>250.610
AspectNorth, Northeast, East, West, Northwest0.484
Elevation (m)3446–38510.743
Soil typeSemi-leached0.689
Vegetation typeConiferous forest, broadleaf forest, scrub0.712
Landform typeMedium undulating mountains0.601
Annual mean temperature (°C)1.65–3.820.681
Annual precipitation (mm)578–7080.770
GDP (10,000 yuan/km2)12–37, 104–2420.609
Population density (people/km2)74.95–94.310.699
Land use typeForest land, construction land0.743
Table 9. Mean value of the NDVI and significant differences in annual precipitation between two regions.
Zones123456789
1
2Y
3YY
4YYY
5YYYY
6YYYYY
7YYYYYY
8YYYYYYN
9YYYYYYYY
NDVI 0.3100.2820.3290.4620.5720.6640.6960.6910.771
Note: Y indicates a significant difference in the influence of two regions on vegetation NDVI, while N indicates no significant difference (confidence level is 95%); numbers 1–9 indicate (unit: mm) 184–278, 278–314, 314–345, 345–378, 378–414, 414–454, 454–506, 506–578, and 578–708, respectively.
Table 10. Mean NDVI value and significant differences in the annual average temperature between two regions.
Zones123456789
1
2N
3YY
4YYY
5YYYY
6YYYYY
7YYYYYY
8YYYNYYY
9YYYYYYYY
NDVI 0.2600.2750.2940.4820.5980.6820.6590.4970.553
Note: Y and N same as Table 9; numbers 1–9 indicate (unit: °C) −4.00–−2.49, −2.49–−1.57, −1.57–−0.63, −0.63–0.49, 0.49–1.65, 1.65–2.82, 2.82–4.22, 4.22–6.02, and 6.02–9.52 respectively.
Table 11. Mean NDVI value and significant differences in terms of vegetation types between two regions.
Zones123456789
1
2Y
3YN
4YNN
5YYYY
6YYYYY
7YYNYYY
8YYNYYYY
9YYNYYYNN
NDVI0.1590.7140.5830.7020.2290.2700.5440.3680.466
Note: Y and N same as Table 9; numbers 1–9 indicate other, coniferous forest, broadleaf forest, scrub, desert, grassland, meadow, alpine vegetation, and cultivated vegetation, respectively.
Table 12. Mean NDVI values and significant differences between two regions in terms of elevation.
Zones123456789
1
2Y
3YY
4YYY
5YYYY
6YYYYY
7YNYYYY
8NYYYYYY
9YYYYYYYY
NDVI0.2970.4180.7440.7040.5500.4570.3960.3030.253
Note: Y and N same as Table 9; numbers 1–9 indicate (unit: m) 1950–2979, 2979–3446, 3446–3851, 3851–4177, 4177–4436, 4436–4665, 4665–4895, 4895–5183, and 5183–6826, respectively.
Publisher’s Note: MDPI stays neutral with regard to jurisdictional claims in published maps and institutional affiliations.

