
Risk Assessment of Urban Floods Based on a SWMM-MIKE21-Coupled Model Using GF-2 Data


1
State Key Laboratory of Hydraulic Engineering Simulation and Safety, Tianjin University, Tianjin 300072, China
2
College of Land Resources and Surveying & Mapping Engineering, Shandong Agriculture and Engineering University, Jinan 250100, China
3
International College, National Institute of Development Administration, Bangkok 10240, Thailand
*
Author to whom correspondence should be addressed.
Remote Sens. 2021, 13(21), 4381; https://0-doi-org.brum.beds.ac.uk/10.3390/rs13214381
Submission received: 15 September 2021
/
Revised: 22 October 2021
/
Accepted: 28 October 2021
/
Published: 30 October 2021
(This article belongs to the Special Issue Remote Sensing in Natural Resource and Water Environment)
Abstract
:Global climate change and rapid urbanization have caused increases in urban floods. Urban flood risk assessment is a vital method for preventing and controlling such disasters. This paper takes the central region of Cangzhou city in Hebei Province as an example. Detailed topographical information, such as the buildings and roads in the study area, was extracted from GF-2 data. By coupling the two models, the SWMM and MIKE21, the spatial distribution of the inundation region, and the water depth in the study area under different return periods, were simulated in detail. The results showed that, for the different return periods, the inundation region was generally consistent. However, there was a large increase in the mean inundation depth within a 10-to-30-year return period, and the increase in the maximum inundation depth and inundation area remained steady. The comprehensive runoff coefficient in all of the scenarios exceeded 0.8, indicating that the drainage system in the study area is insufficient and has a higher flood risk. The flood risk of the study area was evaluated based on the damage curve, which was obtained from field investigations. The results demonstrate that the loss per unit area was less than CNY 250/m2 in each return period in the majority of the damaged areas. Additionally, the total loss was mainly influenced by the damaged area, but, in commercial areas, the total loss was highly sensitive to the inundation depth.
1. Introduction
Global climate change [1,2] has led to dramatic changes in the processes and elements of the water cycle [3]. Together with urbanization [4] and land-use change, our living environment has changed dramatically [5,6,7]. Extreme precipitation events have been frequent in recent decades, and urban floods have become increasingly severe. Many cities around the world are deeply troubled by urban floods, such as the floods in New York in 2011, Houston in 2017, and Rio de Janeiro in 2019 [8]. In China, rainstorms and floods are relatively concentrated because of the country’s monsoon climate. Moreover, with the rapid development of urbanization in recent decades, urban floods have become more severe, including the rainstorm in Jinan City [9] in 2007; the rainstorm in Beijing City [10] on 21 July 2012; and the extreme rainstorm in Zhengzhou City on 20 July 2021. These urban floods led to huge economic losses, casualties, and traffic and communication interruptions, which significantly threatened urban public safety. Because of the notable harm caused by urban floods, a growing number of studies have focused on urban-flood mitigation [11]. It is, thus, important to determine the countermeasures for urban-flood disasters. Previous studies [12,13] have shown that risk assessment is an effective way to prevent and control urban floods and reduce the losses caused by such disasters.
In recent studies, the most commonly used urban-flood-disaster risk assessment methods are the historical-disaster method, the index-system method, the remote-sensing-image method, and the scenario-simulation method. The historical-disaster method [14,15] and the index-system method [16] offer higher computational efficiency. Furthermore, neither methods need the support of fine-resolution geographical data. This is also the reason why such methods cannot reflect the spatial differences of urban flood risks. The remote-sensing-image method [17] has great advantages in assessing the inundation region, but it cannot reflect key information, such as water depth and velocity. The scenario-simulation method [18,19] uses mathematical models to simulate the spatial distribution of flood disasters in different scenarios and provides high accuracy, causing this method to capture growing attention.
Numerical modeling is a low-cost and reliable tool for forecasting [20]. Currently, there are many methods for urban flood numerical simulation. For instance, GIS technology [21] can be used based on the DEM background, in which a simulation of the inundation region is performed. This simulation is performed on the basis of the conservation of the total water volume. Although the calculation speed of this process is fast, the surface flow process cannot be simulated. Therefore, the result accuracy of this method is relatively low. In further research, Jamali et al. [18] improved GIS technology and developed a coupled model offering high precision and rapid calculations, but that still could not simulate surface-flow processes. He et al. [22] estimated an urban flood in Mingxi county via the soil conservation service curve number (SCS-CN) model, but this method is based on the curve numbers of different land-use types and cannot characterize the surface flow.
Urban rainfall-runoff models, such as the SWMM [23] and the ILLU-DAS [24], can meet the needs of urban storm-drainage-system simulations. Choo et al. [25] established a SWMM model in Busan, in which an urban flood was mitigated by changing the dam’s height and adding an underground waterway. Barszcz [26] used a SWMM to evaluate the applicability of radar-based rainfall data. Zhang et al. [27] analyzed the hydrological and water-quality effects of rain gardens as nonpoint source-control solutions in Kyoto Japan. On the basis of the SWMM model, He et al. [28] studied the optimization of initial rainwater storage tanks by means of artificial neural networks and particle swarm optimization. These studies demonstrate the excellent simulation capabilities of the SWMM in urban areas. However, this method remains one-dimensional and unsuitable for simulating two-dimensional surface runoff. Some researchers have coupled the SWMM with other two-dimensional models to realize the water exchange between urban drainage systems and surface runoff. Sañudo et al. [29] developed an Iber and SWMM coupled model. Tavakolifar et al. [30] developed a two-dimensional urban flood simulation model based on the SWMM and the cellular automata approach. Bisht et al. [31] used a SWMM to optimize the design of a drainage system and then adopted MIKE21 to study the effects of the detailed design on flood propagation. Yang et al. [32] used a coupled SWMM and MIKE21 model to study the effects of nonstationarity in rainfall on urban flooding. On the basis of the above studies, this work couples the SWMM and MIKE21 models to realize the water exchange between urban drainage systems and surface runoff. Previous studies have shown that MIKE21 offers good two-dimensional simulation capabilities. Ahn et al. [33] established a MIKE21 model in the southeast of France, which predicted the inundation region and river-flow changes. On the basis of MIKE21, Chen et al. [34] simulated the flood processes in flood detention zones. Li et al. [35] used MIKE21 to study the impacts of storm surges on coastal urban areas. Zuo et al. [36] used MIKE21 to study the impacts of grid accuracy on flood simulations.
In urban flood simulations, the characterization of topographic elements, such as buildings and roads, has a significant impact on flood propagation. Additionally, the rapid development of remote sensing technology has facilitated the production of fine-resolution topography. Wang et al. [37] used UAV remote sensing to assess high-accuracy terrain in order to study the risks of people and vehicles in flooding. Furthermore, the application of high-resolution terrain data extracted by LiDAR technology in urban flood simulations has also been widely reported [38,39]. However, these studies are usually carried out at a scale of around 3 km2. However, for larger scales (e.g., whole cities), the application of remote sensing imagery would be more convenient. Because of its high-resolution features, GF-2 data have aroused increasing attention. For instance, Hang et al. [40] studied building extraction using GF-2 data and artificial neural network algorithms. Lyu [41] used GF-2 image data to study the impacts of drainage-pipe-network complexity on urban stormwater modeling, and Zhang et al. [42] performed flood inundation range correction in Pakistan based on GF-2 image data.
Urban flood risk assessment based on scenarios is a vital means of urban flood disaster management, and the research on urban flood risk assessment with fine-resolution terrain, roads, and buildings is not yet sufficiently detailed. In order to deepen the understanding of refined urban flood risk assessment, and provide a scientific basis for improving urban drainage systems and urban flooding problem management, the main goals of this study were (1) To use GF-2 data to establish a coupled model of the SWMM and MIKE21, while considering buildings and roads to realize the exchange of urban drainage systems and surface runoff, and to simulate the propagation processes of urban flooding; (2) To obtain design rainstorms for different return periods from the P-III distribution curve to simulate, quantify, and analyze ponding scenarios under the design rainstorms of different return periods, while also evaluating the performance of the drainage system; and (3) To combine the damage curves obtained through field surveys to analyze the losses of the city using quantitative and qualitative methods, and assess the flood risk of the whole city.
2. Materials and Methods
2.1. Study Area and Data Sets
In this paper, the central region of Cangzhou was selected as the study area. Cangzhou is located in the southeast of Hebei Province, China, covering the coordinates of 38°16′–38°22′N, 116°48′–116°54′E. The research area covers about 64 km2 (Figure 1), and the terrain in this area is roughly flat. Most of the elevation is between 7.2 and 9.5 m, and the general trend of this terrain indicates a tilt from southwest to northeast. The study area is a warm temperate semihumid continental monsoon climate with four distinct seasons, large temperature differences, and large interannual variations in precipitation. The average annual precipitation in recent decades (1971–2020) was 560 mm, the maximum annual precipitation was 1064.8 mm (1977), while the minimum annual precipitation was 192.8 mm (1999). Precipitation was observed to be unevenly distributed during the year, mainly during the flood season, which accounts for about 80% of the annual precipitation.
We collected the basic data for model construction, including historical rainfall data, urban terrain and topography data, and urban drainage network data. Water-depth data were collected from two historical rainfall events (16 August 2009 and 1 August 2012), and five measured sites (ZH, JFL, ZXJY, SXJ, and DH), to calibrate and verify the model. The above data were provided by the Cangzhou Hydrology and Water Resources Management Bureau.
GF-2 data were collected to extract the building information for the study area. The data were obtained from the China Centre for Resources Satellite Data and Application (http://36.112.130.153:7777/DSSPlatform/productSearch.html accessed on 15 September 2021). To date, the GF-2 satellite has the highest resolution among the remote sensing satellites developed by China. The resolution of the panchromatic camera is 0.8 m, and the multispectral camera contains four bands: blue, green, red, and near infrared, with a resolution of 3.2 m. The results of the remote-sensing image processing in the study area are shown in Figure 1.
2.2. Designing Rainfall Events
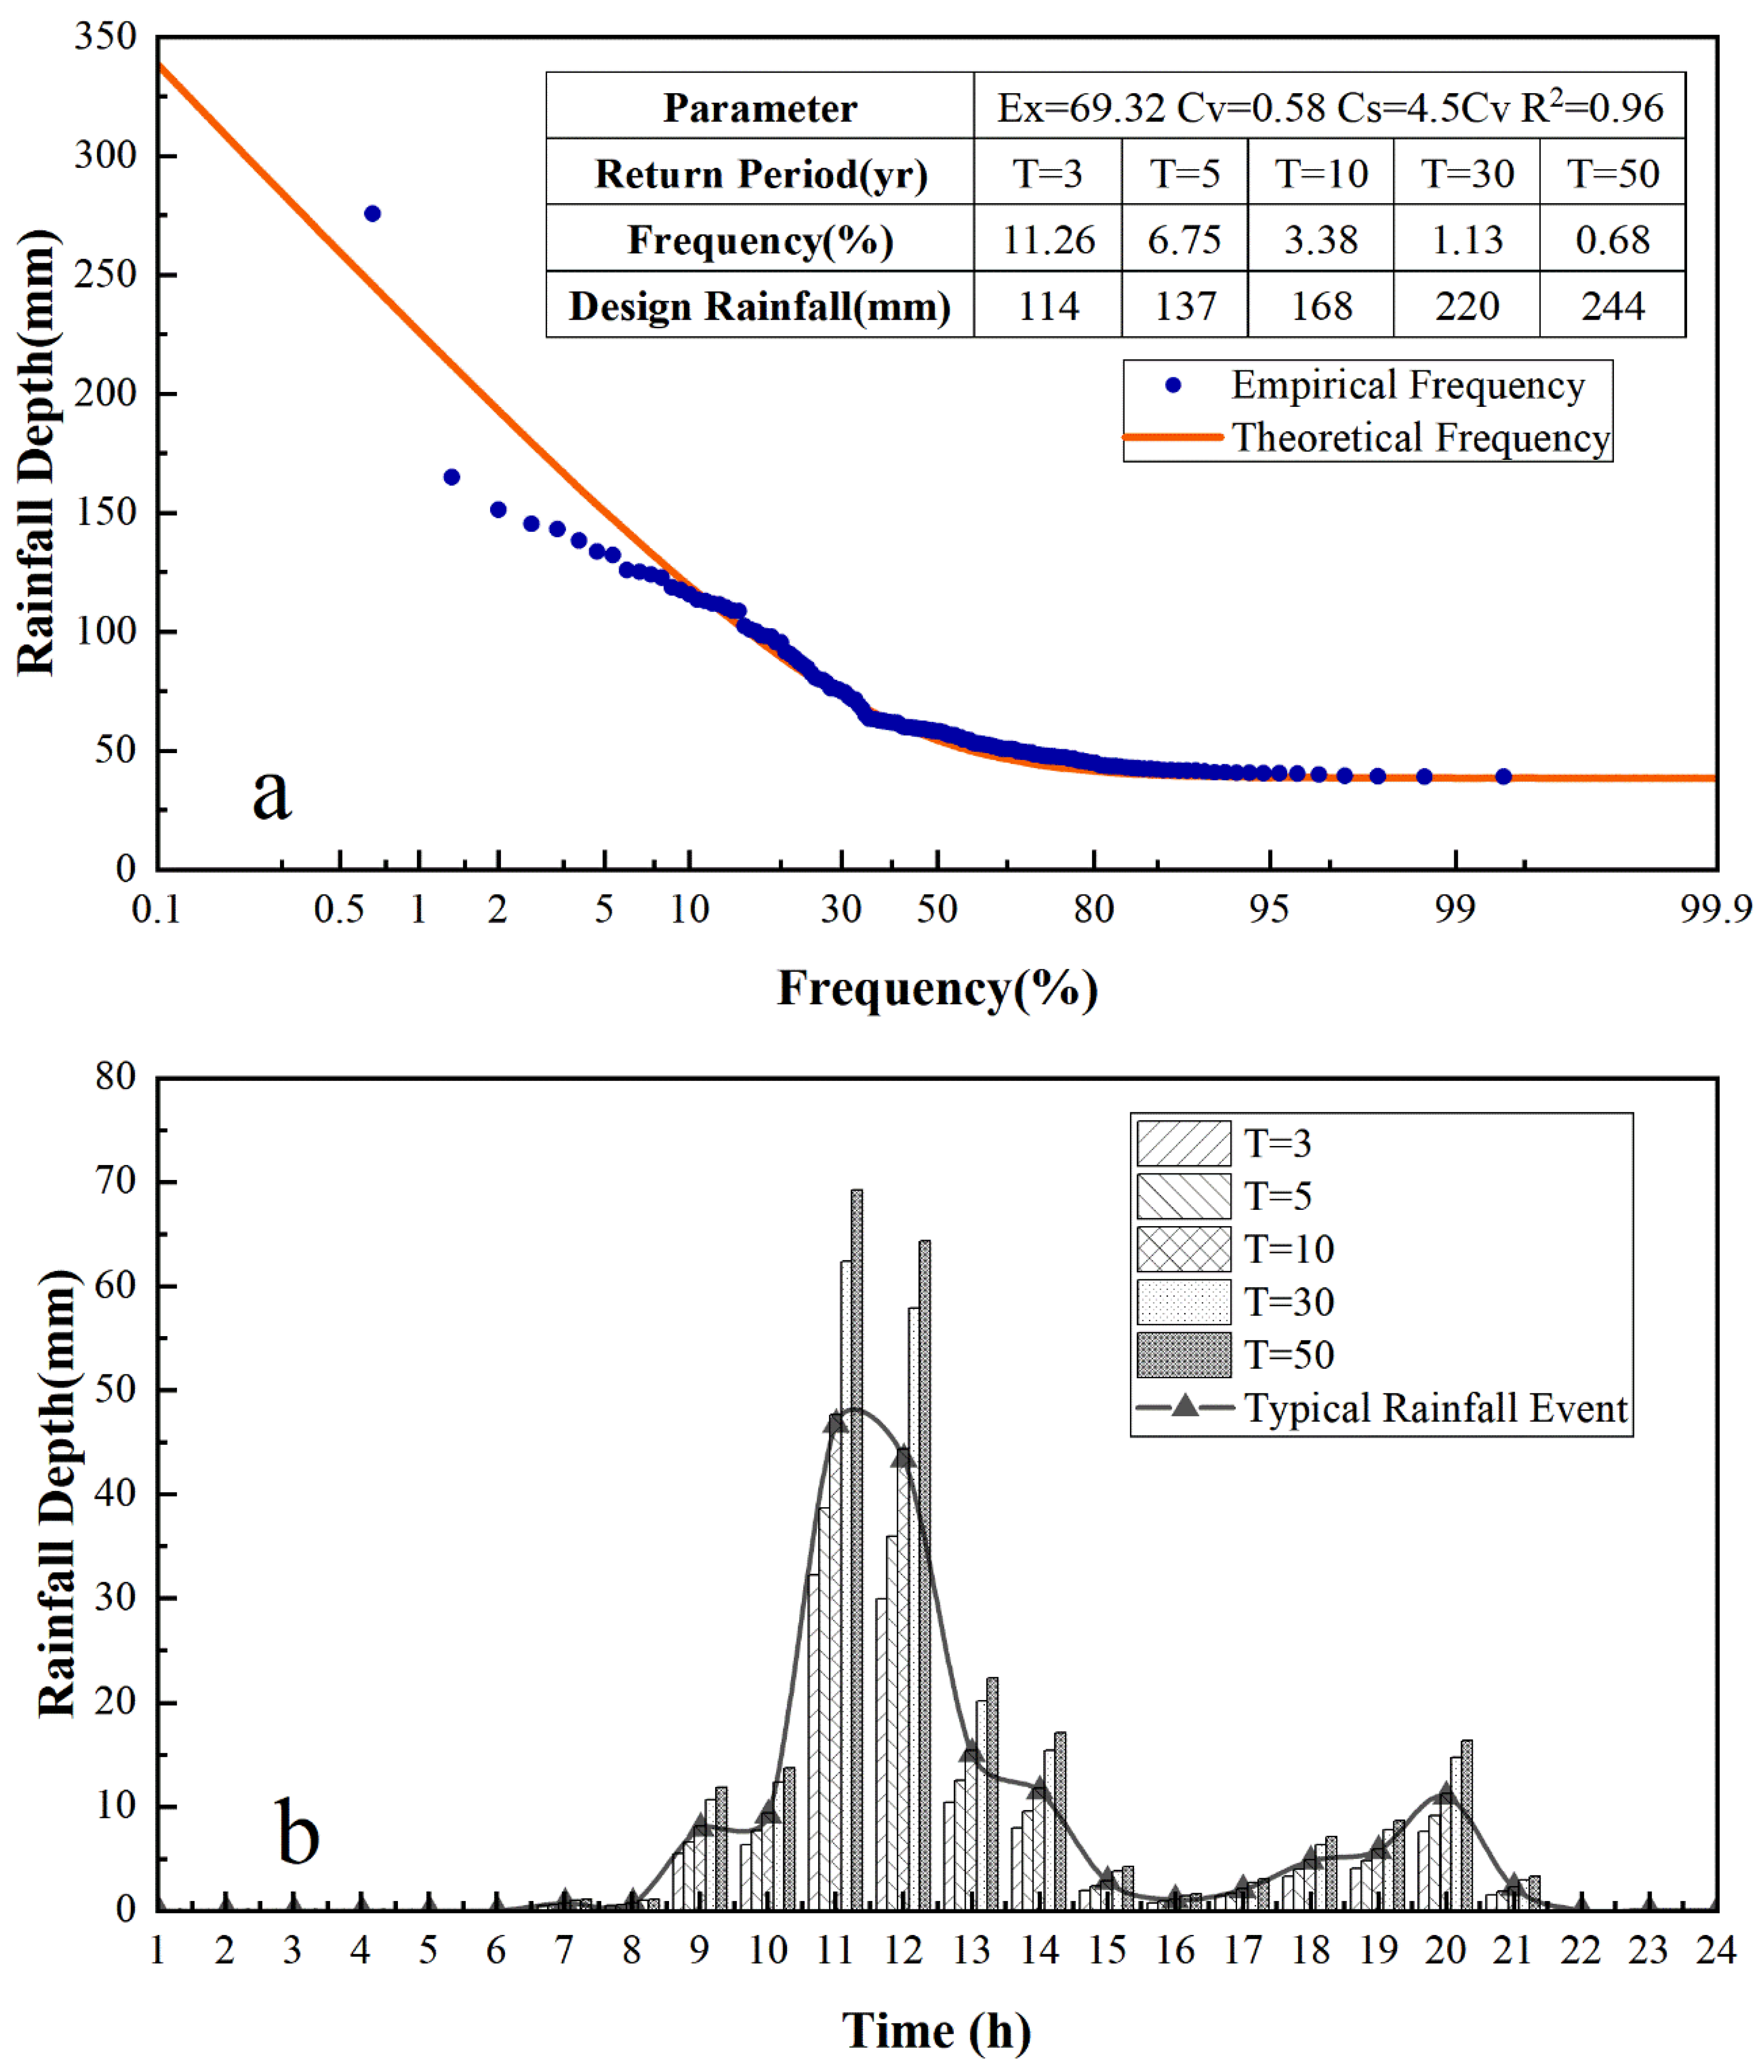
In this study, rainstorm data covering 50 years, from 1971 to 2020, were collected, and the sample size was large enough to fulfill the requirements for designing rainfall. The multisample method was applied to select rainstorm samples, and the design return periods were selected as 3, 5, 10, 30, and 50 years. The P-III distribution curve was used to obtain the 24-h designed rainfall under different return periods. From 10:00 on 23 July 2005, to 10:00 on 24 July 2005, a rainstorm occurred in Cangzhou City, and the peak value appeared in a later period, which was extremely threatening to the drainage system. This rainfall event was selected as a typical rainfall event in this research, and the designed rainfall events were determined by amplifying the typical rainfall event, with 1 h as the unit period. The results of the designed rainfall events are shown in Figure 2.
2.3. The Linkage of the SWMM and MIKE21
The SWMM was developed by the US Environmental Protection Agency (EPA) in 1971 and was updated to version 5.1. This model mainly includes hydrological, hydrodynamic, and water-quality modules, which are often used to simulate single precipitation events or the long-term continuous water quantity and quality in urban areas [23]. MIKE21 is a two-dimensional hydrodynamic model developed by the DHI Company of Denmark. By solving two-dimensional shallow-water equations, along with the ability to simulate the free flow of two-dimensional surfaces, MIKE21 is suitable for simulating the two-dimensional spatial distribution of urban floods [43].
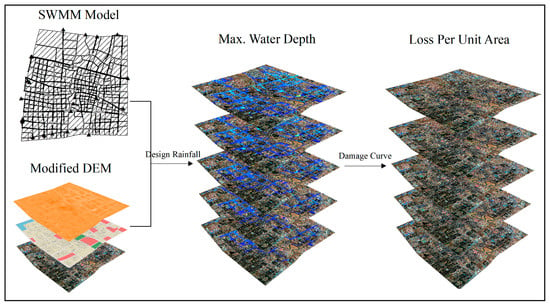
In this paper, the SWMM was used to produce the runoff yields and flow concentrations in urban areas, and to achieve confluence calculations for the pipe network. The junctions in the SWMM were set as sources at the same position in MIKE21 in order to fulfill the water exchange between the pipe network and the ground while maintaining the water balance. The spatial distribution of the ground flood was obtained through the two-dimensional simulation abilities of MIKE21. Data conversion in model coupling was completed by calling the third-party libraries, swmmtoolbox and mikeio, in Python.
To evaluate the accuracy of the model calibration and verification, the R2, the Nash–Sutcliffe efficiency (NSE), and the root mean square error (RMSE) were used to evaluate the coincidence degree between the simulated and observed water depths. The calculation formulas are as follows:
where is the of the observed datum; is the of the simulated datum; and are the means of the observed data and the simulated data, respectively; and n is the length of the observations.
2.4. Damage Assessment
After the spatial distribution of urban floods was obtained by a scenario simulation based on mathematical modelling, it was necessary to establish a damage curve to assess the urban flood risk. Globally, there have been several studies on damage curves [44,45]. Rufidam assessed financial damage costs using the stage-depth damage curve method, in which cost is a function of the inundation depth and area [18]. Velasco et al. [46] established a damage curve in Barcelona, which was verified by investigation data and the loss reports of insurance companies. Scawthorn et al. [47] established a flood-loss-curve library based on the HAZUS-MH flood model, which has been applied productively in the United States. The studies above are significant as references, but the situation for buildings in China is distinctive from that in other countries. For instance, basements account for large proportions of the buildings outside of China, and the overall architectural characteristics of different countries are also distinctive. Therefore, this paper adopts the damage curve established by Yin [48]. This damage curve was established according to the Shanghai rainstorm-inundation-loss database, and the calculation formula is
where and are the inundation loss rates of buildings and indoor property, respectively, and is the depth of water in cm.
In the urban flooding studies, researchers usually represent buildings by adding a constant to the cells with houses [49,50], or by hollowing out the cells of the buildings [33]. Even though the impacts of buildings were considered in such simulations, the inundation of the interiors of the buildings by flooding was ignored, thereby leading to an overestimation of the depth of the ponding and causing actual ponding to appear inside the building when the height of the water exceeds the threshold or steps. In order to solve this issue, in this study, a value for the height difference between the ground floor of a building and the ground surface (step height), rather than the height of the building, was added to the building cells.
In actual constructions, different building types have different step heights. In this study, the step heights for different buildings were considered based on the land-use type. The step-height values for buildings of different land-use types, based on the Detailed Control Plan of the Central District in Cangzhou City [51], and the General Rules for Civil Building Design in China [52], are shown in Table 1. A previous study [53] showed that the reasonable use of data extracted from remote sensing, such as roads, squares, and buildings, could positively affect the catchment division. In this paper, the building layers in the study area were manually interpreted from GF-2 satellite images (see Figure 3a). The modified digital elevation model (DEM), based on the building layers extracted from GF-2 data and considering the step heights of the buildings for different land-use types, is shown in Figure 3b.
The values of the different buildings and their indoor properties are difficult to estimate. In this study, according to the Cangzhou House Demolition Management Regulations and Demolition Compensation Standards [54], as well as regional economic development, we estimated that the replacement price for houses in the study area is CNY 1200/m2, while indoor properties are estimated at CNY 450/m2, based on the relevant literature [55]. By considering the damage curve and the height difference between the indoor and outdoor grounds, the relationship between the disaster loss per unit area of the constructions, and the water depth in Cangzhou City, can be described as follows:
where is the inundation loss per unit area in yuan (CNY), and is the depth of the water in cm.
3. Results
3.1. Model Construction and Verification
The research area was generalized into 348 subcatchments, 260 junctions, 28 outfalls, and 260 conduits, according to the terrain information, pipe-network-system distribution, etc., in the SWMM (Figure 4). The model parameters included the pipe diameter and the length of the pipe network, and low elevations in nodes were extracted from the planning data. To calculate the subcatchment area, the percentage of impervious area, the subcatchment width of the overland flow path, and the average surface slope, we used ArcGIS. The parameters to be determined in the SWMM model, such as the Manning coefficient, depression storage, and the infiltration parameters, were calibrated based on the observed water depth and the water depth simulated by MIKE21. In MIKE21, the main task was to mesh the triangular grid of the study area based on the DEM, terrain interpolation, and the treatment of buildings and roads. In the coupling process, the model maintained the consistency of rainfall events, simulation times, and time steps.
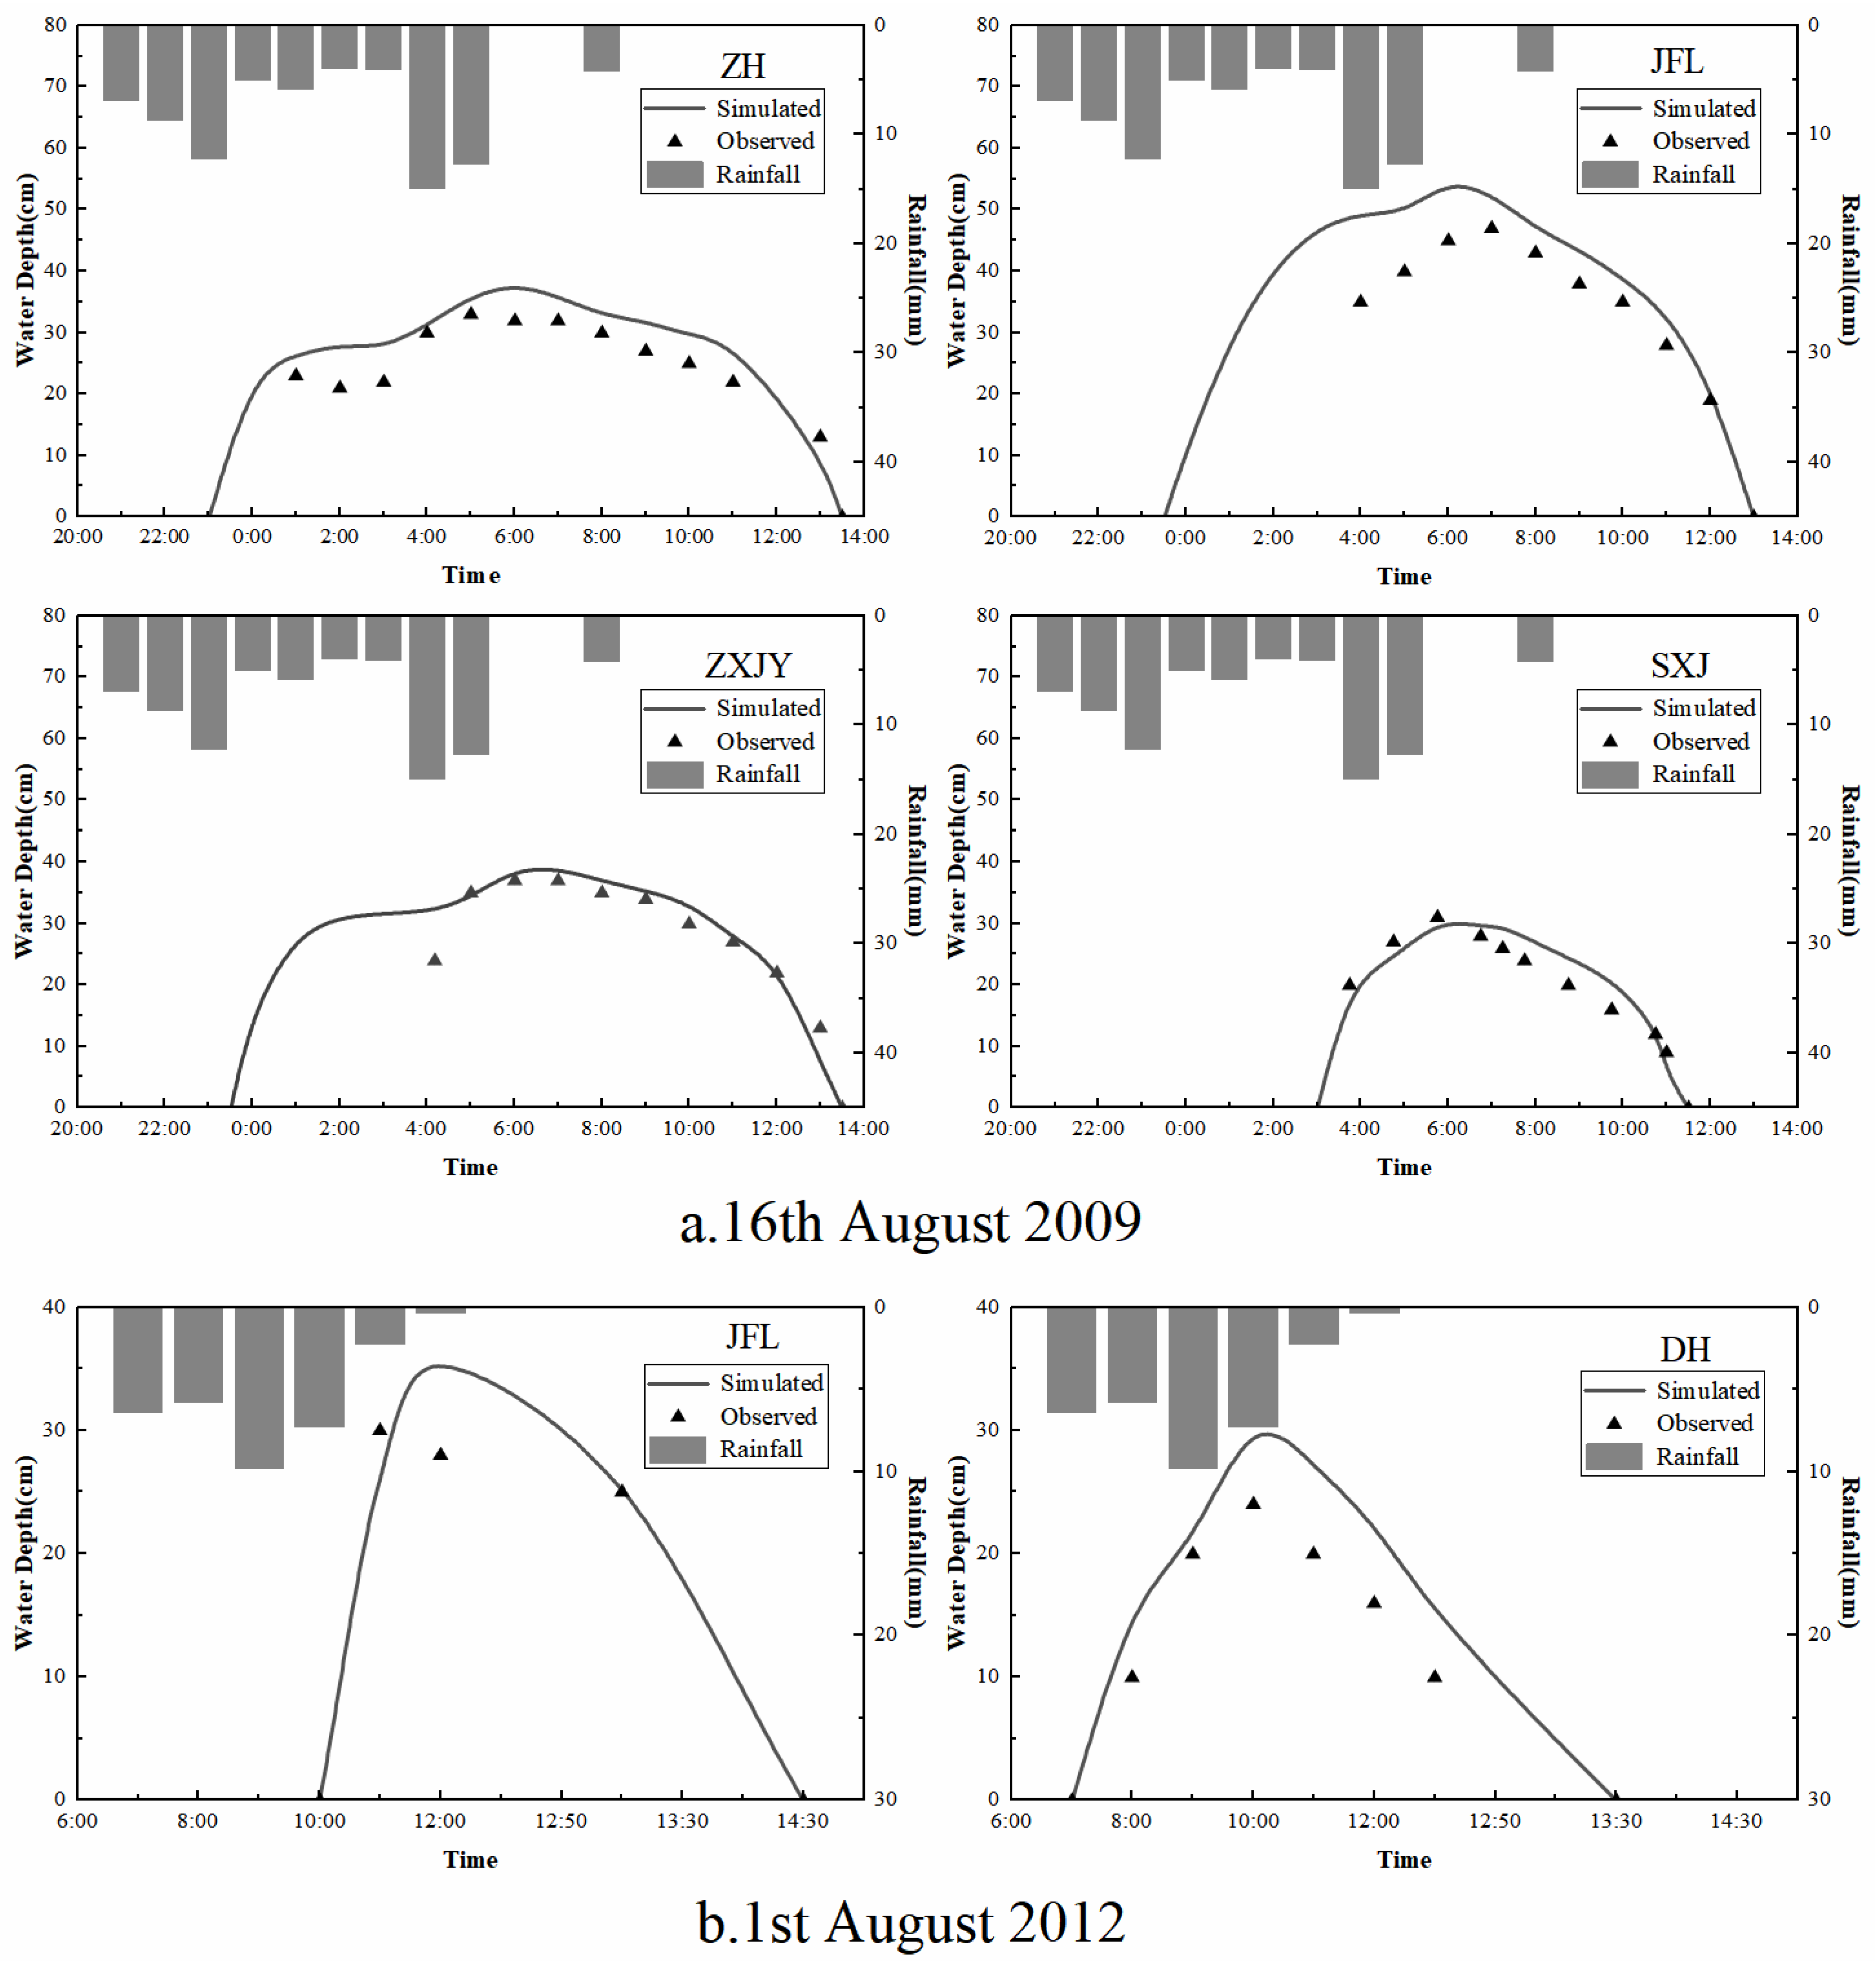
In this paper, the parameters of the model were calibrated based on the observed historical rainfall event on 16 August 2009, and the model was verified using the observed historical rainfall event on 1 August 2012. Table 2 shows the results of the calibrated parameters. The simulated and observed water depths at the measured sites of the two rainfall events can be seen in Figure 5.
As shown in Figure 5, the simulated values of the model were found to be in good agreement with the observed data. Meanwhile, the accuracy of the model was evaluated by the R2, the NSE, and the RMSE, and the results are illustrated in Table 3. The R2 of the model was greater than 0.93 and the NSE was greater than 0.71 in the calibration stage. In the verification stage, the R2 was greater than 0.91 and the NSE was greater than 0.61. The RMSE ranged from 2.84 to 7.3 cm, and most of the values were around 4 cm. Here, the closer the R2 is to 1, the better the correlation between the simulation results and the observed data. Furthermore, the closer the NSE is to 1, the higher the coincidence degree is between the simulation results and the observed data. Similarly, the smaller the RMSE value is, the smaller the error between the simulated and observed data. Generally speaking, the R2, NSE, and RMSE all indicated that the model simulation results were satisfactory [56,57,58] and could be used for subsequent flood risk assessments.
3.2. Urban Flood Simulations for Different Return Periods
Urban flood simulations were carried out in the study area based on the design of rainfall scenarios with different return periods. The spatial distribution of the maximum inundation depths is shown in Figure 6. Generally, the inundation regions in different return periods were found to be roughly the same. Locally, serious ponding can be observed in low-lying areas, especially when the return period reaches 50 years. Figure 6 shows that the inundation depth increases mainly in the central and northeastern regions in the study area.
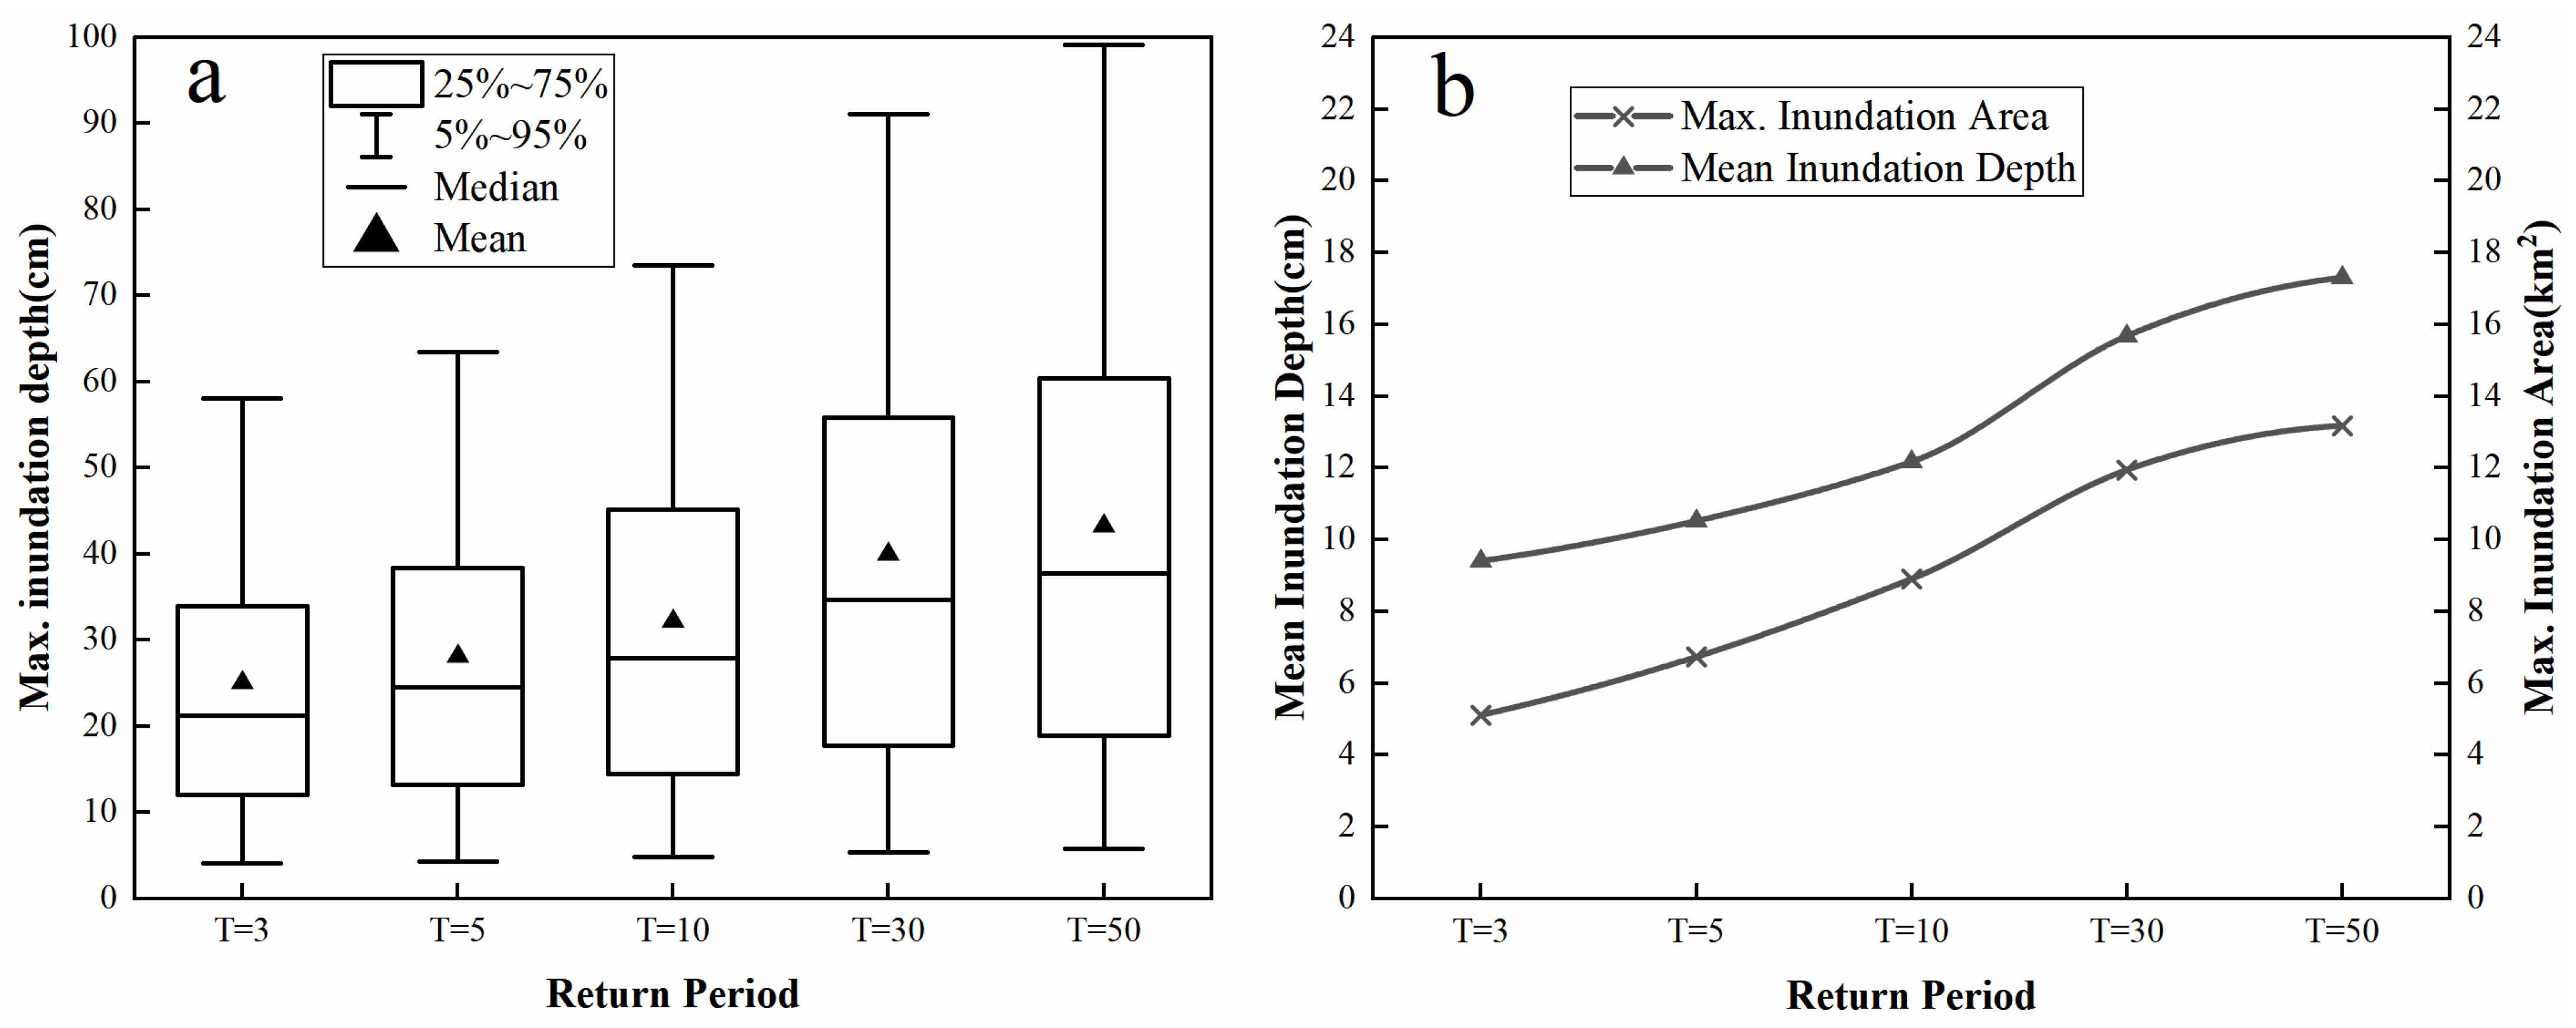
The statistics for the maximum inundation depths under different return periods are shown in Figure 7a. Here, it can be observed that 95% of the maximum inundation depths are below 100 cm. Notably, for the 3- and 5-year return periods, 95% of the maximum inundation depths are 64 cm or less, and 5% of the maximum inundation depths are stable at about 4.9 cm for all the return periods. Furthermore, the medians of the maximum inundation depth under different return periods increased from 21.2 to 37.8 cm, along with significant growth in the 10- to 30-year return periods. In addition, the median is less than the mean under each of the return periods, which indicates that most of the maximum inundation depths were lower than the mean. Figure 7a also shows that, in the interval between 25 and 75%, with an increase in the return period, the range of the maximum inundation depth increases. However, for the range from 5 to 95%, the increase rate of 25 to 75% is relatively stable. This result indicates that, under the different return periods, the maximum inundation depths are quite concentrated, at approximately 12 to 60 cm.
The statistics were determined based on the mean inundation depth and the maximum inundation area in different return periods (Figure 7b), and the comprehensive runoff coefficient in different return periods was calculated according to Formula (7) (Table 4). With an increase in the return period, the comprehensive runoff coefficient increased gradually, ranging from 0.84 to 0.9. Figure 7b indicates that when the return period is 3 to 10 years, the mean inundation depth increases steadily, and rises sharply to 15.7 cm in the 30-year return period. In the 50-year return period, the mean inundation depth is 17.3 cm, which is close to that in the 30-year return period. In terms of the maximum inundation area, with an increase in the return period, the inundation area gradually increases. For the return period from 3 to 50 years, the proportion of the inundation area in the total study area rises from 8% to 21%, and the overall increasing trend remains steady.
where is the comprehensive runoff coefficient; is the area of the subcatchment in ha; is the runoff coefficient of the subcatchment; is the area of the catchment in ha; and is the number of subcatchments.
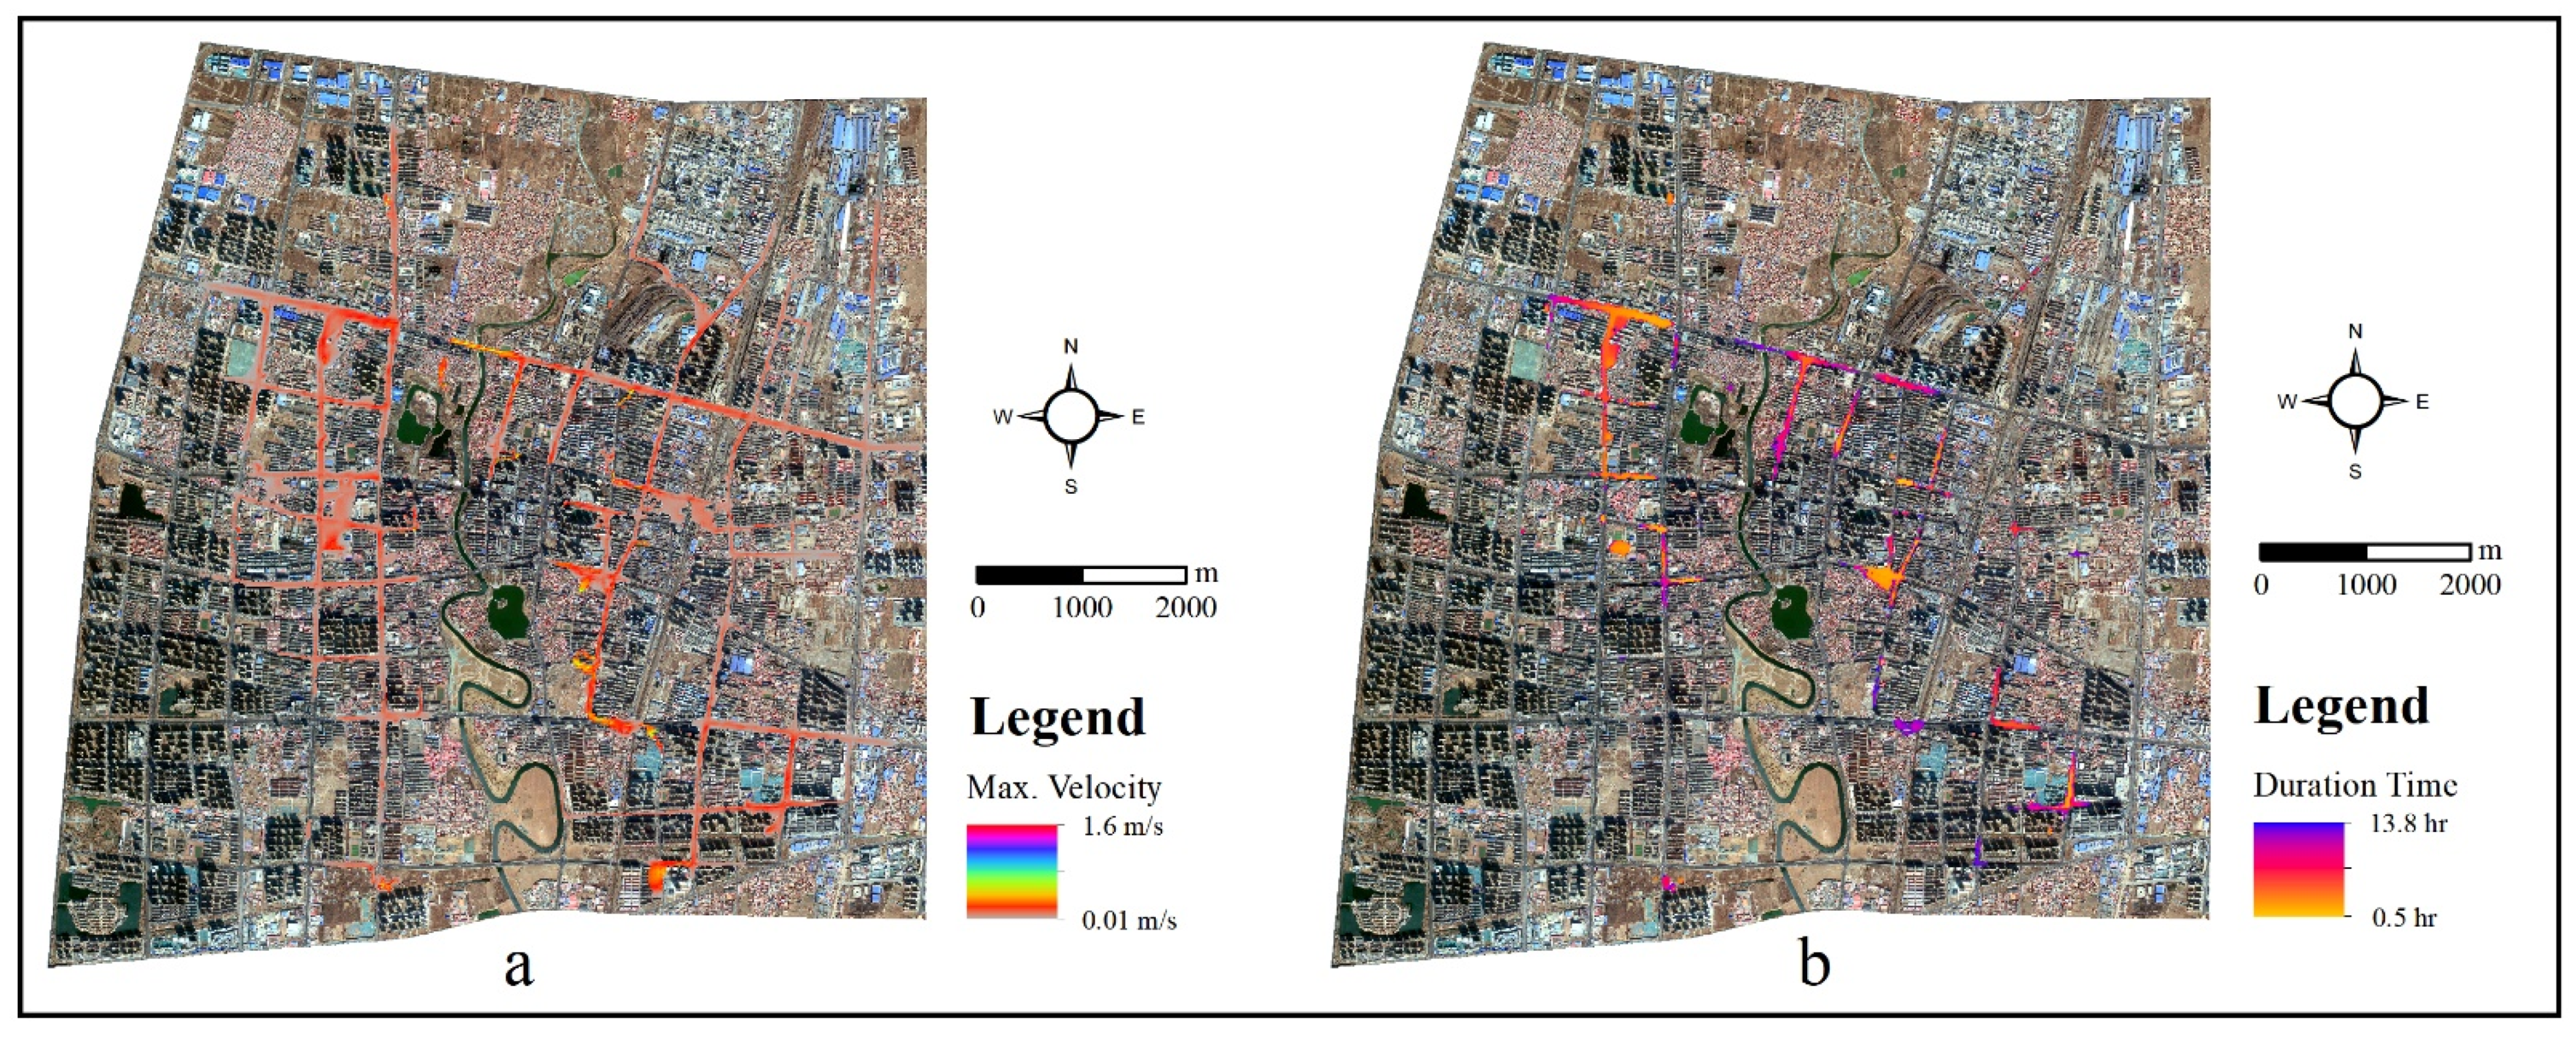
Taking the 3-year return period as an example, the spatial distribution of the maximum velocity and the inundation depth above 40 cm are given in Figure 8. It can be seen from Figure 8a that the flow velocity remains small in most regions because of the flat terrain in the study area. Moreover, the inundation depth reaches above 40 cm in many areas, which accounts for 17% of the area. The statistics for the maximum velocity and duration time of the inundation depth above 40 cm under different return periods are shown in Figure 9. In Figure 9a, the maximum velocity is low under different return periods, with a mean value between 0.09 and 0.1 m/s, and remains stable in both the 25–75% and 5–95% ranges. A previous study [59] showed that when the inundation depth exceeds 40 cm, the flood risk in the area is relatively high. As shown in Figure 9b, the mean value of the inundation duration above 40 cm ranges from 7.4 to 9.3 h. However, the 25–75% interval shows that the inundation duration is concentrated at a higher level when the return period is 30 and 50 years, which indicates that there is prolonged inundation when the return period reaches 30 years. Therefore, it can be inferred that the drainage capacity of the drainage system in the study area is insufficient, yielding a high flood risk.
3.3. Risk Assessment of Urban Flood
Using the construction information and the spatial distribution of the maximum inundation depths, ArcGIS was used for statistical analysis based on the damage curve (Formula (6)). The spatial distribution of the inundation loss per unit area was obtained under different return periods (Figure 10). Figure 10 shows that, for a 3-to-50-year return period, the area of damaged buildings, and the inundation loss per unit area, gradually increases, while the severely damaged area remains generally the same. The inundation loss per unit area for most of the damaged region is relatively low and will be statistically analyzed further.
The ratio of the damaged area to the total damaged area in each group was calculated by grouping the inundation loss per unit area with an interval of CNY 50/m2 (Figure 11a). As demonstrated in Figure 11a, in each return period, the inundation loss per unit area over 85% of the damaged areas was less than CNY 250/m2. Notably, for the 3- and 10-year return periods, this ratio reaches 95%. When the return period is 30 and 50 years, nearly 95% of the damaged areas lose less than CNY 350/m2. The ratio of inundation loss per unit area greater than CNY 500/m2 is less than 2.5%, even in the 50-year return period, which accounts for a very small proportion.
After standardizing the data, multivariate linear regression analysis was performed for the total loss, the loss per unit area, and the damaged area under different return periods, the results of which are provided in Table 5 and Figure 11b. The loss per unit area was calculated from the maximum inundation depth according to Formula (6). Therefore, this regression analysis reflects the influence of the inundation depth and damaged areas on the total loss as a whole. As shown in Figure 11b, in each of the return periods, the influence of the damaged area to loss was slightly greater than that of the inundation depth, but for the 30- and 50-year return periods, this gap was reduced. This result indicates that, with an increase in the return period, the influence of the inundation depth increased.
The total damaged area and total inundation loss are outlined in Table 4. Taking the total inundation loss as an example (Figure 11a), for the 3- and 10-year return periods, the inundation loss increases slowly. When the return period rises to 30 years, the total inundation loss reaches CNY 47 million, with a sharp increase. When the return period is 50 years, the total inundation loss reaches CNY 63 million, with a relatively slow increase. The total damaged area of the buildings illustrates the same growth trend.
4. Discussion
Extreme precipitation events and urbanization are serious threats to urban safety, and numerical simulations are necessary in order to deepen our understanding of urban floods [60]. By coupling the SWMM and MIKE21 simulations, this study provides a more detailed understanding of the surface flows and inundation processes in the study area.
The analysis of runoff coefficients can help us understand the runoff intensities in urban areas [61]. According to the comprehensive runoff coefficient of the return period from 3 to 50 years, the runoff coefficient rises from 0.84 to 0.9. On the basis of the empirical value in the Chinese Drainage Design Manual [62], the runoff coefficient in the urban central region should be lower than 0.8; thus, it can be stated that there is a high flood risk in the study area.
For simulations under different return periods, the maximum velocity is very small in most areas, and the average value is less than 0.1 m/s. According to existing studies [63], the possibility of loss caused by flow velocity is small, so it was reasonable to only take the inundation depth and inundation area as factors for calculating the disaster loss in this paper.
The urban flood risk in the study area was estimated based on the damage curves obtained from field investigations, and the results show that 85% of the damaged areas had a loss per unit area of less than CNY 250/m2 under different return periods. For this loss calculation, we used the maximum inundation depth, so our results are conservative and represent the upper bound of the actual loss. According to the multivariate linear regression analysis, the influence of the damaged area to total loss was slightly greater than that of the inundation depth under different return periods, which indicated that, in general, the total loss had higher sensitivity to the inundation area. However, when the return period reached 30 years and 50 years, the influence of the inundation depth increased, especially in the central part of Cangzhou, which is a region with commercial concentration. This result indicates that the sensitivity of inundation losses to inundation depth is higher in commercial areas, which agrees with previous studies [18,46].
In this study, the longer the rainfall return period, the greater the total economic loss. Notably, when the rainfall return period reached 30 years, the loss suddenly increased. Therefore, it is reasonable to conclude that the design standard for drainage pipeline systems in the study area should include a return period greater than 30 years, which is consistent with the existing standards for urban central regions in Britain, the United States, and Hong Kong [64]. According to the Cangzhou Statistical Yearbook, the GDP of the study area in 2019 was CNY 48.8 billion. According to the total inundation losses of the 50-year return period, the flood disaster loss accounted for 0.13% of the GDP, which is about half the amount of developed countries [13]. Since we only calculated the loss of buildings and their indoor properties, we did not consider the loss of transportation and communication. Therefore, the results of this research are within a reasonable range.
In future research, we will seek to establish damage curves for road traffic, communication, etc. When considering the step heights for different land-use types, the values of different building types and their indoor properties could also be considered, such as commercial buildings, industrial buildings, and administrative buildings. Because of the significant losses caused by urban floods, alongside the uncertainty and complexity of such disasters, it is necessary to establish a scientific and complete urban flood risk assessment system.
5. Conclusions
In this research, we simulated the spatial distribution of floods in different return periods by constructing a coupling model of the SWMM and MIKE21. The flood risk in the study area was further evaluated by introducing a damage curve. The main conclusions are as follows:
(1) The coupling model based on the SWMM and MIKE21 realized the water exchange between the urban drainage system and surface runoff. We verified, on the basis of the observed water depth, that the model was reasonable and that the simulation effect was favorable;
(2) The inundation region of the study area was generally the same under the designed rainfall scenarios with different return periods. With an increase in the return period, the maximum inundation depth also increased. The majority of the maximum inundation depths ranged from 12 to 60 cm, with most of the depths lower than the mean. For the mean inundation depth, there was a conspicuous growth trend for the 10- and 30-year return periods, and the overall trend of the maximum inundation area increased steadily. The comprehensive runoff coefficient and inundation analysis showed that the drainage system in the study area has insufficient drainage capacity and entails a high flood risk;
(3) With an increase in the return period, the damaged area and the inundation loss per unit area gradually increased. Furthermore, the seriously damaged region remained almost the same under different return periods. On the basis of the flood risk assessment of the study area, under the designed rainfall scenarios for each return period, the loss per unit area was less than CNY 250/m2 in most of the damaged areas. The influence of the damaged areas to total loss was slightly greater than that of the inundation depth, but in commercial areas, the inundation depth had high sensitivity. Further analysis showed that the return period for the drainage pipeline system in the urban central region should be designed for more than 30 years.
Author Contributions
Conceptualization, L.Z.; methodology, L.Z.; validation, J.L., T.Z. and P.F.; formal analysis, L.Z. and J.L.; writing—original draft preparation, L.Z. and Z.C.; writing—review and editing, J.L., T.Z. and J.F.; funding acquisition, P.F. All authors have read and agreed to the published version of the manuscript.
Funding
This research was funded by the National Natural Science Foundation of China, grant number 51779165.
Data Availability Statement
Not applicable.
Acknowledgments
Thanks to the Cangzhou Hydrology and Water Resource Management Bureau for providing the research data.
Conflicts of Interest
The authors declare no conflict of interest.
References
- AR6 Climate Change 2021: The Physical Science Basis. Available online: https://www.ipcc.ch/report/ar6/wg1/#FullReport (accessed on 15 August 2021).
- Hoegh-Guldberg, O.; Jacob, D.; Taylor, M.; Guillén Bolaños, T.; Bindi, M.; Brown, S.; Camilloni, I.A.; Diedhiou, A.; Djalante, R.; Ebi, K.; et al. The human imperative of stabilizing global climate change at 1.5 °C. Science 2019, 365, w6974. [Google Scholar] [CrossRef] [PubMed] [Green Version]
- Zhu, Y.; Luo, P.; Zhang, S.; Sun, B. Spatiotemporal Analysis of Hydrological Variations and Their Impacts on Vegetation in Semiarid Areas from Multiple Satellite Data. Remote Sens. 2020, 12, 4177. [Google Scholar] [CrossRef]
- Cohen, J.E. Human Population: The Next Half Century. Science 2003, 302, 1172–1175. [Google Scholar] [CrossRef] [PubMed]
- Luo, P.; Xu, C.; Kang, S.; Huo, A.; Lyu, J.; Zhou, M.; Nover, D. Heavy metals in water and surface sediments of the Fenghe River Basin, China: Assessment and source analysis. Water Sci. Technol. 2021. [Google Scholar] [CrossRef]
- Wei, X.; Wang, N.; Luo, P.; Yang, J.; Zhang, J.; Lin, K. Spatiotemporal Assessment of Land Marketization and Its Driving Forces for Sustainable UrbanRural Development in Shaanxi Province in China. Sustainability 2021, 13, 7755. [Google Scholar] [CrossRef]
- Xie, D.; Duan, L.; Si, G.; Liu, W.; Zhang, T.; Mulder, J. Long–Term 15N Balance After Single–Dose Input of 15N–Labeled NH4+ and NO3– in a Subtropical Forest Under Reducing N Deposition. Global Biogeochem. Cycles 2021, 35, e2021GB006959. [Google Scholar] [CrossRef]
- Wu, Z.; Zhou, Y.; Wang, H.; Jiang, Z. Depth prediction of urban flood under different rainfall return periods based on deep learning and data warehouse. Sci. Total Environ. 2020, 716, 137077. [Google Scholar] [CrossRef]
- Chang, X.; Xu, Z.; Zhao, G.; Li, H. Simulation of urban rainfall-runoff in piedmont cities: Case study of Jinan city, China. J. Hydroelectr. Eng. 2018, 37, 107–116. [Google Scholar] [CrossRef]
- Qiu, J. Urbanization contributed to Beijing storms. Nature 2012. [Google Scholar] [CrossRef]
- Zha, X.; Luo, P.; Zhu, W.; Wang, S.; Lyu, J.; Zhou, M.; Huo, A.; Wang, Z. A bibliometric analysis of the research on Sponge City: Current situation and future development direction. Ecohydrology 2021, 14, e2328. [Google Scholar] [CrossRef]
- Milanesi, L.; Pilotti, M.; Ranzi, R. A conceptual model of people’s vulnerability to floods. Water Resour. Res. 2015, 51, 182–197. [Google Scholar] [CrossRef]
- Feng, P.; Cui, G.; Zhon, Y. On the evaluation and prediction of urban flood economic loss. J. Hydraul. Eng. 2001, 8, 64–68. [Google Scholar] [CrossRef]
- Benito, G.; Lang, M.; Barriendos, M.; Llasat, M.C.; Francés, F.; Ouarda, T.; Thorndycraft, V.; Enzel, Y.; Bardossy, A.; Coeur, D.; et al. Use of Systematic, Palaeoflood and Historical Data for the Improvement of Flood Risk Estimation. Review of Scientific Methods. Nat. Hazards 2004, 31, 623–643. [Google Scholar] [CrossRef]
- Zhang, Y.; Huang, C.C.; Tan, Z.; Chen, Y.; Qiu, H.; Huang, C.; Li, Y.; Zhang, Y.; Li, X.; Shulmeister, J.; et al. Prehistoric and historic overbank floods in the Luoyang Basin along the Luohe River, middle Yellow River basin, China. Quatern. Int. 2019, 521, 118–128. [Google Scholar] [CrossRef]
- Kandilioti, G.; Makropoulos, C. Preliminary flood risk assessment: The case of Athens. Nat. Hazards 2012, 61, 441–468. [Google Scholar] [CrossRef]
- Xu, Z.; Chen, T.; Hong, S.; Wang, L. Review on applications of remote sensing in urban flood modeling. Chin. Sci. Bull. 2018, 63, 2156–2166. [Google Scholar] [CrossRef]
- Jamali, B.; Löwe, R.; Bach, P.M.; Urich, C.; Arnbjerg-Nielsen, K.; Deletic, A. A rapid urban flood inundation and damage assessment model. J. Hydrol. 2018, 564, 1085–1098. [Google Scholar] [CrossRef]
- Mu, D.; Luo, P.; Lyu, J.; Zhou, M.; Huo, A.; Duan, W.; Nover, D.; He, B.; Zhao, X. Impact of temporal rainfall patterns on flash floods in Hue City, Vietnam. J. Flood Risk Manag. 2021, 14, e12668. [Google Scholar] [CrossRef]
- Zhang, Y.; Luo, P.; Zhao, S.; Kang, S.; Wang, P.; Zhou, M.; Lyu, J. Control and remediation methods for eutrophic lakes in the past 30 years. Water Sci. Technol. 2020, 81, 1099–1113. [Google Scholar] [CrossRef]
- Huang, G.; Huang, J.; Yu, H.; Yang, S. Secondary Development of Storm Water Management Model SWMM Based GIS. Water Resour. Power 2011, 29, 43–45. [Google Scholar] [CrossRef]
- He, X.; Chen, C.; Liu, Y.; Chu, Y. Inundation Analysis Method for Urban Mountainous Areas Based on Soil Conservation Service Curve Number (SCS-CN) Model Using Remote Sensing Data. Sens. Mater 2020, 32, 3813–3822. [Google Scholar] [CrossRef]
- Storm Water Management Model User’s Manual Version 5.1. Available online: https://www.epa.gov/sites/production/files/2019-02/documents/epaswmm5_1_manual_master_8-2-15.pdf (accessed on 15 August 2021).
- Tsihrintzis, V.A.; Sidan, C.B. ILLUDAS and PSRM-QUAL predictive ability in small urban areas and comparison with other models. Hydrol. Process 2008, 22, 3321–3336. [Google Scholar] [CrossRef]
- Choo, Y.M.; Sim, S.B.; Choe, Y.W. A Study on Urban Inundation Using SWMM in Busan, Korea, Using Existing Dams and Artificial Underground Waterways. Water 2021, 13, 1708. [Google Scholar] [CrossRef]
- Barszcz, M. Radar Data Analyses for a Single Rainfall Event and Their Application for Flow Simulation in an Urban Catchment Using the SWMM Model. Water 2018, 10, 1007. [Google Scholar] [CrossRef] [Green Version]
- Zhang, L.; Ye, Z.; Shibata, S. Assessment of Rain Garden Effects for the Management of Urban Storm Runoff in Japan. Sustainability 2020, 12, 9982. [Google Scholar] [CrossRef]
- He, S.; Chen, W.; Liu, Y.; Mu, X. Study on design method of the initial rainwater storage tank based on ANN and PSO. J. Hydraul. Eng. 2020, 51, 1558–1566. [Google Scholar] [CrossRef]
- Sañudo, E.; Cea, L.; Puertas, J. Modelling Pluvial Flooding in Urban Areas Coupling the Models Iber and SWMM. Water 2020, 12, 2647. [Google Scholar] [CrossRef]
- Tavakolifar, H.; Abbasizadeh, H.; Nazif, S.; Shahghasemi, E. Development of 1D–2D Urban Flood Simulation Model Based on Modified Cellular Automata Approach. J. Hydrol. Eng. 2021, 26, 04020065. [Google Scholar] [CrossRef]
- Bisht, D.S.; Chatterjee, C.; Kalakoti, S.; Upadhyay, P.; Sahoo, M.; Panda, A. Modeling urban floods and drainage using SWMM and MIKE URBAN: A case study. Nat. Hazards 2016, 84, 749–776. [Google Scholar] [CrossRef]
- Yang, L.; Li, J.; Kang, A.; Li, S.; Feng, P. The Effect of Nonstationarity in Rainfall on Urban Flooding Based on Coupling SWMM and MIKE21. Water Resour. Manag. 2020, 34, 1535–1551. [Google Scholar] [CrossRef]
- Ahn, J.; Na, Y.; Park, S.W. Development of Two-Dimensional Inundation Modelling Process using MIKE 21 Model. Ksce. J. Civ. Eng. 2019, 23, 3968–3977. [Google Scholar] [CrossRef]
- Chen, P.; Fu, C.; Yu, J.; Ji, X. Research on the Numerical Simulation of Flood Routing for the Flood Detention Basin Based on Mike 21. China Rural. Water Hydropower 2017, 113–116. [Google Scholar] [CrossRef]
- Li, M.; Wu, W.; Wang, J.; Che, Z.; Xie, Y. Simulating and mapping the risk of surge floods in multiple typhoon scenarios: A case study of Yuhuan County, Zhejiang Province, China. Stoch. Env. Res. Risk A 2017, 31, 645–659. [Google Scholar] [CrossRef]
- Zuo, J.; Zhang, H.X.; Deng, S.; Gu, P.; Lian, L.L. Analysis of influence of mesh partition on Mike 21 calculation in flood impact assessment. IOP Conf. Ser. Earth Environ. Sci. 2020, 612, 012060. [Google Scholar] [CrossRef]
- Wang, N.; Hou, J.; Du, Y.; Jing, H.; Wang, T.; Xia, J.; Gong, J.; Huang, M. A dynamic, convenient and accurate method for assessing the flood risk of people and vehicle. Sci. Total Environ. 2021, 797, 149036. [Google Scholar] [CrossRef]
- Muhadi, N.A.; Abdullah, A.F.; Bejo, S.K.; Mahadi, M.R.; Mijic, A. The Use of LiDAR-Derived DEM in Flood Applications: A Review. Remote Sens. 2020, 12, 2308. [Google Scholar] [CrossRef]
- Li, B.; Hou, J.; Li, D.; Yang, D.; Han, H.; Bi, X.; Wang, X.; Hinkelmann, R.; Xia, J. Application of LiDAR UAV for High-Resolution Flood Modelling. Water Resour. Manag. 2021, 35, 1433–1447. [Google Scholar] [CrossRef]
- Hang, L.; Cai, G.Y. Cnn Based Detection of Building Roofs from High Resolution Satellite Images. Int. Arch. Photogramm. Remote. Sens. Spat. Inf. Sci. 2020, 42, 187–192. [Google Scholar] [CrossRef] [Green Version]
- Lyu, H. Impacts of Urban Complex Conditions on Detailed Hydrological Processes. Ph.D. Thesis, Tsinghua University, Beijing, China, May 2018. [Google Scholar]
- Zhang, M.; Chen, F.; Liang, D.; Tian, B.; Yang, A. Use of Sentinel-1 GRD SAR Images to Delineate Flood Extent in Pakistan. Sustainability 2020, 12, 5784. [Google Scholar] [CrossRef]
- Choi, G.W.; Lee, H.S.; Lee, S.Y. Urban Inundation Analysis using the Integrated Model of MOUSE and MIKE 21. J. Korean Soc. Hazard Mitig. 2007, 7, 75–83. [Google Scholar]
- Flood Damage Assessment-Literature Review and Recommended Procedure. Available online: https://watersensitivecities.org.au/content/flood-damage-assessment-literature-review-recommended-procedure/ (accessed on 15 August 2021).
- Hammond, M.J.; Chen, A.S.; Djordjević, S.; Butler, D.; Mark, O. Urban flood impact assessment: A state-of-the-art review. Urban Water J. 2015, 12, 14–29. [Google Scholar] [CrossRef] [Green Version]
- Velasco, M.; Cabello, À.; Russo, B. Flood damage assessment in urban areas. Application to the Raval district of Barcelona using synthetic depth damage curves. Urban Water J. 2016, 13, 426–440. [Google Scholar] [CrossRef]
- Scawthorn, C.; Flores, P.; Blais, N.; Blais, H.; Tate, E.; Chang, S.; Mifflin, E.; Thomas, W.; Murphy, J.; Jones, C.; et al. HAZUS-MH Flood Loss Estimation Methodology. II. Damage and Loss Assessment. Nat. Hazards Rev. 2016, 7, 72–81. [Google Scholar] [CrossRef]
- Yin, Z.; Xu, S. Study on Risk Assessment of Urban Natural Hazards, 1st ed.; Science press: Beijing, China, 2012; pp. 100–102. [Google Scholar]
- Wang, L.; Qin, Q.; Li, J.; Li, Z.; Jin, C.; Li, J. Study on the Disaster Analysis Model of Waterlogging in City Based on Gis. Sci. Surv. Mapp. 2004, 29, 48–52. [Google Scholar] [CrossRef]
- Zhao, S.; Chen, Z.; Xiong, L. Establishment of Simplified Urban Waterlogging Model Using Spatial Analysis. J. Nat. Disasters 2004, 13, 8–14. [Google Scholar] [CrossRef]
- Detailed Control Plan of the Central District in Cangzhou City. Available online: https://www.hebghy.com/news/1895.cshtml (accessed on 15 August 2021).
- General Rules for Civil Building Design. Available online: https://wenku.baidu.com/view/1701002ae2bd960590c677f1.html (accessed on 15 August 2021).
- Analyzing the Contribution of High Resolution Water Range in Dividing Catchment Based on D8 Algorithm. Available online: https://www.researchgate.net/publication/328985516_Analyzing_the_Contribution_of_High_Resolution_Water_Range_in_Dividing_Catchment_Based_on_D8_Algorithm (accessed on 15 August 2021).
- Cangzhou House Demolition Management Regulations and Demolition Compensation Standards. Available online: http://www.cangzhou.gov.cn/zwbz/zwdt/cxwj/632632.shtml (accessed on 15 August 2021).
- Yao, S. Risk Assessment of Urban Rainstorm Disaster–A Case Study of Beijing-Tianjin-Hebei Region. Master’s Thesis, Tsinghua University, Beijing, China, May 2016. [Google Scholar]
- Moriasi, D.N.; Arnold, J.G.; Van Liew, M.W.; Bingner, R.L.; Harmel, R.D.; Veith, T.L. Model Evaluation Guidelines for Systematic Quantification of Accuracy in Watershed Simulations. Trans. ASABE 2007, 50, 885–900. [Google Scholar] [CrossRef]
- Nash, J.E.; Sutcliffe, J.V. River Flow Forecasting Through Conceptual Models Part I–A Discussion of Principles. J. Hydrol. 1970, 10, 282–290. [Google Scholar] [CrossRef]
- Muthusamy, M.; Casado, M.R.; Butler, D.; Leinster, P. Understanding the effects of Digital Elevation Model resolution in urban fluvial flood modelling. J. Hydrol. 2021, 596, 126088. [Google Scholar] [CrossRef]
- Chen, T. Study on the Simulation of Flood/Waterlogging and the Effect of Reduction Measures in the Sponge city Demonstration Area of Jinan City. Ph.D. Thesis, Beijing Normal University, Beijing, China, May 2019. [Google Scholar]
- Wu, M. Research on Waterlogging Simulation and Risk Assessment Base on Coupled Waterlogging Model in Jinan City. Master’s Thesis, Shandong University, Jinan, China, June 2020. [Google Scholar]
- Goldshleger, N.; Karnibad, L.; Shoshany, M.; Asaf, L. Generalising urban runoff and street network density relationship: A hydrological and remote-sensing case study in Israel. Urban Water J. 2012, 9, 189–197. [Google Scholar] [CrossRef]
- Zhang, Z.; Chang, J. Drainage Design Manual, 1st ed.; China Architecture & Building Press: Beijing, China, 1990; p. 161. [Google Scholar]
- Wang, R. Urban Waterlogging Risk Level Assessment Methods and Case Study. Master’s Thesis, Xi’an University of Architecture and Technology, Xi’an, China, June 2016. [Google Scholar]
- Huang, G. Discrimination of relationship between urban storm waterlogging prevention and sponge city construction. China Flood Drought Manag. 2018, 28, 8–14. [Google Scholar] [CrossRef]
Figure 1.
The locations of the measured sites in the study area.

Figure 2.
(a) The frequency curve of the designed rainfall; (b) typical rainfall process and designed rainfall process under different return periods.
Figure 2.
(a) The frequency curve of the designed rainfall; (b) typical rainfall process and designed rainfall process under different return periods.

Figure 3.
(a) Buildings extracted from GF-2 data and land-use type in the study area; (b) modified DEM based on buildings.
Figure 3.
(a) Buildings extracted from GF-2 data and land-use type in the study area; (b) modified DEM based on buildings.

Figure 4.
Generalization results of the SWMM model and the topological relationship of the pipeline.
Figure 4.
Generalization results of the SWMM model and the topological relationship of the pipeline.

Figure 5.
Observed and simulated water depths of the two historical rainfall events: (a) 16 August 2009; (b) 1 August 2012.
Figure 5.
Observed and simulated water depths of the two historical rainfall events: (a) 16 August 2009; (b) 1 August 2012.

Figure 6.
Spatial distribution of the maximum inundation depth under different return periods.

Figure 7.
(a) Boxplots of the maximum inundation depth distribution under different return periods; (b) mean inundation depth and maximum inundation area under different return periods.
Figure 7.
(a) Boxplots of the maximum inundation depth distribution under different return periods; (b) mean inundation depth and maximum inundation area under different return periods.

Figure 8.
(a) Spatial distribution of the maximum velocity under a 3-year return period; (b) spatial distribution of the inundation depth above 40 cm under a 3-year return period.
Figure 8.
(a) Spatial distribution of the maximum velocity under a 3-year return period; (b) spatial distribution of the inundation depth above 40 cm under a 3-year return period.

Figure 9.
(a) Boxplots of the maximum velocities under different return periods; (b) boxplots of the duration time distribution of the inundation depths above 40 cm under different return periods.
Figure 9.
(a) Boxplots of the maximum velocities under different return periods; (b) boxplots of the duration time distribution of the inundation depths above 40 cm under different return periods.

Figure 10.
Spatial distribution of the inundation loss per unit area under different return periods.
Figure 10.
Spatial distribution of the inundation loss per unit area under different return periods.

Figure 11.
(a) Distribution of the ratios of the damaged areas to the total damaged areas in the groups, and the total inundation loss under different return periods; (b) standardized regression coefficients under different return periods.
Figure 11.
(a) Distribution of the ratios of the damaged areas to the total damaged areas in the groups, and the total inundation loss under different return periods; (b) standardized regression coefficients under different return periods.


Table 1.
Classification of building step heights.
| Land-Use Type | Building Type | Step Height (cm) |
|---|---|---|
| Public land | Administration, commerce, education, etc. | 35 |
| Industrial Land | Industrial buildings | 20 |
| Residential land | Residential buildings | 15 |
| Other land | Other buildings | 15 |
Table 2.
The parameters of the coupled model.
| Type | Parameter | Value |
|---|---|---|
| Subcatchments | Area (ha) | 2.3~299.7 |
| Slope (%) | 0.01~0.6 | |
| Width (m) | 40.6~1333.2 | |
| Depression storage * (mm) | 1.27~6 | |
| Manning’s roughness * | Impervious area | 0.014 |
| Pervious area | 0.2 | |
| Pipelines | 0.013 | |
| Horton infiltration parameters * | Maximum rate (mm/h) | 36 |
| Minimum rate (mm/h) | 2.5 | |
| Decay constant | 3 | |
| Drying time (d) | 5 |
* indicates this parameter was confirmed by calibration.
Table 3.
Summary of the coupled model performance.
| Stage | Flooding Data | Measured Site | R2 | NSE | RMSE (cm) |
|---|---|---|---|---|---|
| Calibration | 16 August 2009 | ZH | 0.95 | 0.75 | 4.33 |
| JFL | 0.96 | 0.71 | 7.3 | ||
| ZXJY | 0.94 | 0.91 | 3.22 | ||
| SXJ | 0.93 | 0.89 | 2.84 | ||
| Verification | 1 August 2012 | JFL | 0.91 | 0.88 | 4.06 |
| DH | 0.95 | 0.61 | 5.29 |
Table 4.
The mean inundation depth, maximum inundation area, runoff coefficient, total damage area, and total inundation loss in different return periods.
Table 4.
The mean inundation depth, maximum inundation area, runoff coefficient, total damage area, and total inundation loss in different return periods.
| Return Period (yr) | T = 3 | T = 5 | T = 10 | T = 30 | T = 50 |
|---|---|---|---|---|---|
| Mean Inundation Depth (cm) | 9.41 | 10.53 | 12.18 | 15.68 | 17.31 |
| Maximum inundation Area (km2) | 5.12 | 6.74 | 8.91 | 11.95 | 13.18 |
| Runoff Coefficient | 0.84 | 0.85 | 0.87 | 0.89 | 0.9 |
| Total Damage Area (ha) | 8.07 | 12.53 | 20.29 | 39.47 | 48.73 |
| Total Inundation Loss (million yuan) | 6.29 | 10.84 | 19.46 | 46.55 | 62.67 |
Table 5.
The standardization regression analysis results of total loss, loss per unit area, and damaged area under different return periods.
Table 5.
The standardization regression analysis results of total loss, loss per unit area, and damaged area under different return periods.
| Return Period (yr) | Dependent Variables | Independent Variables | Standardized Regression Coefficient |
|---|---|---|---|
| T = 3 | Total Loss | Loss Per Unit Area | 0.545 |
| Damaged Area | 0.594 | ||
| T = 5 | Total Loss | Loss Per Unit Area | 0.536 |
| Damaged Area | 0.604 | ||
| T = 10 | Total Loss | Loss Per Unit Area | 0.543 |
| Damaged Area | 0.601 | ||
| T = 30 | Total Loss | Loss Per Unit Area | 0.560 |
| Damaged Area | 0.574 | ||
| T = 50 | Total Loss | Loss Per Unit Area | 0.561 |
| Damaged Area | 0.576 |
Publisher’s Note: MDPI stays neutral with regard to jurisdictional claims in published maps and institutional affiliations. |
© 2021 by the authors. Licensee MDPI, Basel, Switzerland. This article is an open access article distributed under the terms and conditions of the Creative Commons Attribution (CC BY) license (https://creativecommons.org/licenses/by/4.0/).
Share and Cite
MDPI and ACS Style
Zhao, L.; Zhang, T.; Fu, J.; Li, J.; Cao, Z.; Feng, P. Risk Assessment of Urban Floods Based on a SWMM-MIKE21-Coupled Model Using GF-2 Data. Remote Sens. 2021, 13, 4381. https://0-doi-org.brum.beds.ac.uk/10.3390/rs13214381
AMA Style
Zhao L, Zhang T, Fu J, Li J, Cao Z, Feng P. Risk Assessment of Urban Floods Based on a SWMM-MIKE21-Coupled Model Using GF-2 Data. Remote Sensing. 2021; 13(21):4381. https://0-doi-org.brum.beds.ac.uk/10.3390/rs13214381
Chicago/Turabian StyleZhao, Lidong, Ting Zhang, Jun Fu, Jianzhu Li, Zhengxiong Cao, and Ping Feng. 2021. "Risk Assessment of Urban Floods Based on a SWMM-MIKE21-Coupled Model Using GF-2 Data" Remote Sensing 13, no. 21: 4381. https://0-doi-org.brum.beds.ac.uk/10.3390/rs13214381
Note that from the first issue of 2016, this journal uses article numbers instead of page numbers. See further details here.