Article

MRA-SNet: Siamese Networks of Multiscale Residual and Attention for Change Detection in High-Resolution Remote Sensing Images

1
School of Computer and Information Engineering, Jiangxi Normal University, Nanchang 330022, China
2
School of Information Science and Technology, North China University of Technology, Beijing 100144, China
*
Author to whom correspondence should be addressed.
Remote Sens. 2021, 13(22), 4528; https://0-doi-org.brum.beds.ac.uk/10.3390/rs13224528
Submission received: 15 September 2021 / Revised: 5 November 2021 / Accepted: 8 November 2021 / Published: 11 November 2021
(This article belongs to the Special Issue Applications of Remote Sensing Imagery for Urban Areas)

Abstract

:
Remote sensing image change detection (CD) is an important task in remote sensing image analysis and is essential for an accurate understanding of changes in the Earth’s surface. The technology of deep learning (DL) is becoming increasingly popular in solving CD tasks for remote sensing images. Most existing CD methods based on DL tend to use ordinary convolutional blocks to extract and compare remote sensing image features, which cannot fully extract the rich features of high-resolution (HR) remote sensing images. In addition, most of the existing methods lack robustness to pseudochange information processing. To overcome the above problems, in this article, we propose a new method, namely MRA-SNet, for CD in remote sensing images. Utilizing the UNet network as the basic network, the method uses the Siamese network to extract the features of bitemporal images in the encoder separately and perform the difference connection to better generate difference maps. Meanwhile, we replace the ordinary convolution blocks with Multi-Res blocks to extract spatial and spectral features of different scales in remote sensing images. Residual connections are used to extract additional detailed features. To better highlight the change region features and suppress the irrelevant region features, we introduced the Attention Gates module before the skip connection between the encoder and the decoder. Experimental results on a public dataset of remote sensing image CD show that our proposed method outperforms other state-of-the-art (SOTA) CD methods in terms of evaluation metrics and performance.

Graphical Abstract

1. Introduction

The Earth is changing all the time due to human activities and natural forces. To better record and study the changes occurring on the Earth’s surface, remote sensing imaging technology monitors the Earth’s surface in real time and collects a large amount of remote sensing image data. Remote sensing images have important research significance for human beings to understand the impact of their own activities on the Earth’s surface changes in time [1,2].
Remote sensing image CD is a technique for obtaining changes in ground object information by analyzing the differences between images of the same area at different times [3]. It has been widely applied in numerous fields, such as land use and land cover analysis, forest and vegetation change monitoring, agricultural surveys, urban expansion, natural resource management, and disaster assessment [4,5,6,7,8,9,10,11]. Nowadays, satellite remote sensing technology is advancing rapidly, enabling remote sensing images to present high temporal resolution, high spatial resolution, and high spectral resolution. HR remote sensing images have more detailed geometric, spatial, and spectral information, which provide suitable conditions for humans to monitor Earth changes dynamically. Therefore, HR remote sensing images have become an important data source for CD. Effectively extracting the rich feature information of HR remote sensing images, better focusing on the change region, ignoring the interference of seasonal changes, and reducing the interference of pseudochange are some key issues in the research of remote sensing image CD.
In recent decades, a number of CD methods have been proposed. Traditional CD methods can be divided into two categories according to the research object: pixel-based change detection (PBCD) methods and object-based change detection (OBCD) methods [12]. PBCD methods mainly generate a difference map by directly comparing spectral and texture information of the pixels, and they obtain the change map (CM) through threshold segmentation or cluster analysis. Many PBCD methods have been proposed, such as change vector analysis (CVA) of the image algebra-based method [13], principal component analysis (PCA) of the image transformation-based method [14,15], multivariate alteration detection (MAD) and its iterative version iteratively reweighted MAD (IRMAD) [16,17], image classification-based methods [18], and machine learning-based methods [19,20,21]. Although PBCD methods are simpler to implement, they cannot take spatial context information into account, which leads to a large amount of salt-and-pepper noise during processing. Several methods have been proposed to solve the problem, such as introducing conditional random field (CRF) [22] and Markov random field (MRF) [23] for capturing spatial contextual information for CD [24,25,26,27]. With the development of high-resolution optical remote sensing satellites (WorldView-3, QuickBird, and Gaofen-2), more and more HR remote sensing images are being used for CD. However, PBCD methods are often only suitable for medium-resolution and low-resolution remote sensing images, and they face difficulty in performing better in HR remote sensing images. OBCD methods are commonly used for HR remote sensing image CD. Their main principle is to divide the remote sensing images into disjoint objects and then use the rich spectral and texture information to compare and analyze the objects’ differences in the bitemporal images. In [28], the effect of semantic strategies, scales, and feature spaces on unsupervised methods in urban areas of OBCD is investigated. In [29], an OBCD method is proposed to perform unsupervised CD in HR images by incorporating multiscale uncertainty analysis. In [30], a method based on the law of cosines with a box–whisker plot is proposed, which outperforms the conventional CD methods. Although the OBCD methods can utilize the spatial feature information of HR remote sensing images, the traditional manual feature extraction is more complicated and less robust in CD performance.
In recent years, DL has been widely used in speech recognition [31,32], image classification [33,34], and video classification [35] due to its excellent feature learning capability. DL has also been used for remote sensing image CD [36]. The classical and powerful convolutional neural network (CNN) [37] can learn the deep feature information of images well and is suitable for processing HR remote sensing images. In [38], three fully convolutional neural network architectures were proposed for remote sensing image CD, namely FC-EF, FC-Siam-conc, and FC-Siam-diff. FC-EF is based on the UNet network [39], and FC-Siam-conc and FC-Siam-diff are Siamese extensions of the FC-EF network, which achieve suitable performance in CD. In [40], a UNet++_MSOF method was proposed that improves on the UNet++ network [41]. It combines change maps (CMs) from levels with different semantics to generate the final CM by introducing residual connections and using a fusion strategy with multiple side outputs. In [42], Zhang et al. proposed a deeply supervised image fusion network IFN. This network feeds bitemporal images into two streams of the same convolutional structure for extracting their respective depth features and then feeds the extracted deep features into a deeply supervised difference discrimination network (DDN) for CD. In [43], Fang et al. proposed a SNUNet-CD (the combination of Siamese network and Nested UNet) network, which improves the performance of the network by using dense connections and the ensemble channel attention module (ECAM).
The attention mechanism is a simulation of the attention pattern of the human brain, which aims to select the information that is more important for the current task from a large amount of information. Tasks such as image captioning [44], machine translation [45], and image classification [46,47] have obtained better performance with the introduction of attention mechanisms. According to the differentiability of attention, attention models can be divided into two categories: hard attention models and soft attention models. Hard attention [48] is nondifferentiable attention, and the training process is often completed by reinforcement learning. Anderson et al. [49] came up with a top-down visual attention mechanism based on hard attention for image captioning and visual question answering tasks. Soft attention is differentiable, and it learns to obtain the weights of attention by forward and backward propagation of the neural network. Xu et al. [50] proposed a soft attention model, which was applied to image annotation generation. Lee et al. [51] proposed recursive recurrent neural networks with attention modeling (R2AM) for lexicon-free optical character recognition in natural scene images. In this article, a soft attention module is introduced to the remote sensing image CD task.
The above-mentioned deep learning methods have achieved some success in practice. However, when processing the complex ground object information in HR remote sensing images, the ordinary convolution kernels often cannot fully extract the rich spatial and spectral features. In addition, the above methods are inadequate in robustness in handling small samples and pseudochange.
In this article, we introduced the Multi-Res block [52] inspired by the Inception v1 network [53]. The ordinary convolution blocks are replaced by the Multi-Res block to extract spatial and spectral features at different scales in remote sensing images. Meanwhile, we introduced the Attention Gates module [54] before the encoder and decoder skip connection. Our whole network is based on UNet and Siamese network and uses the Multi-Res block and the Attention Gates module, so we named the proposed network architecture MRA-SNet.
The main contributions of this article are as follows:
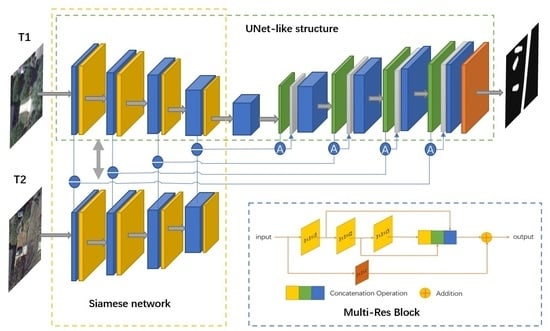
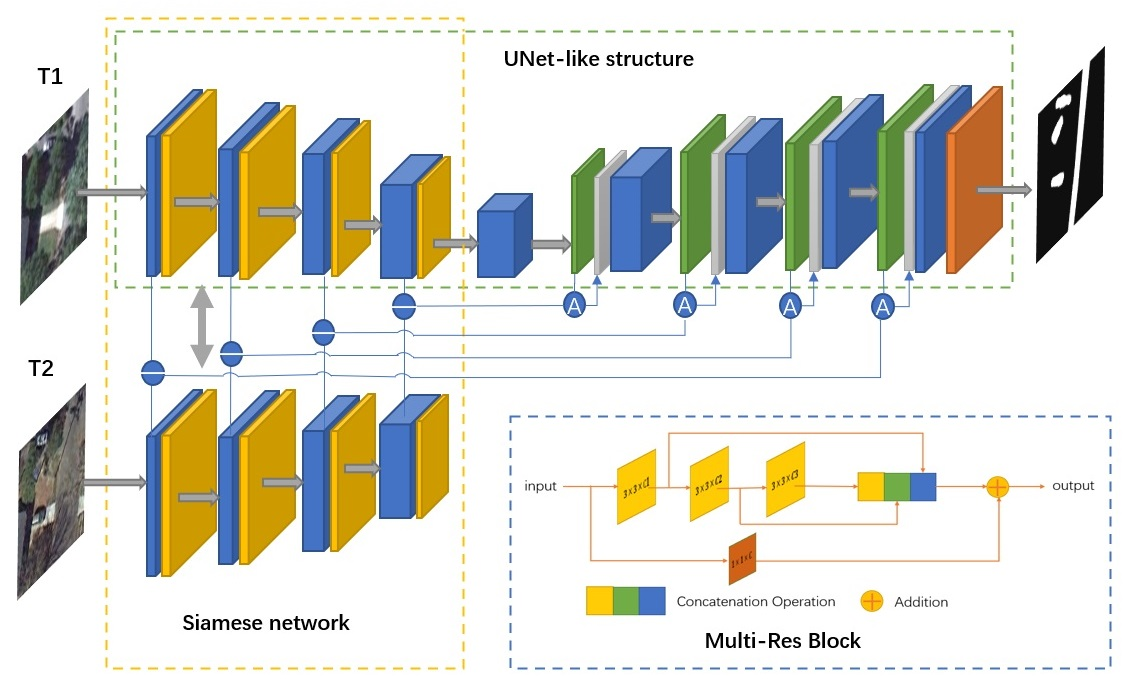
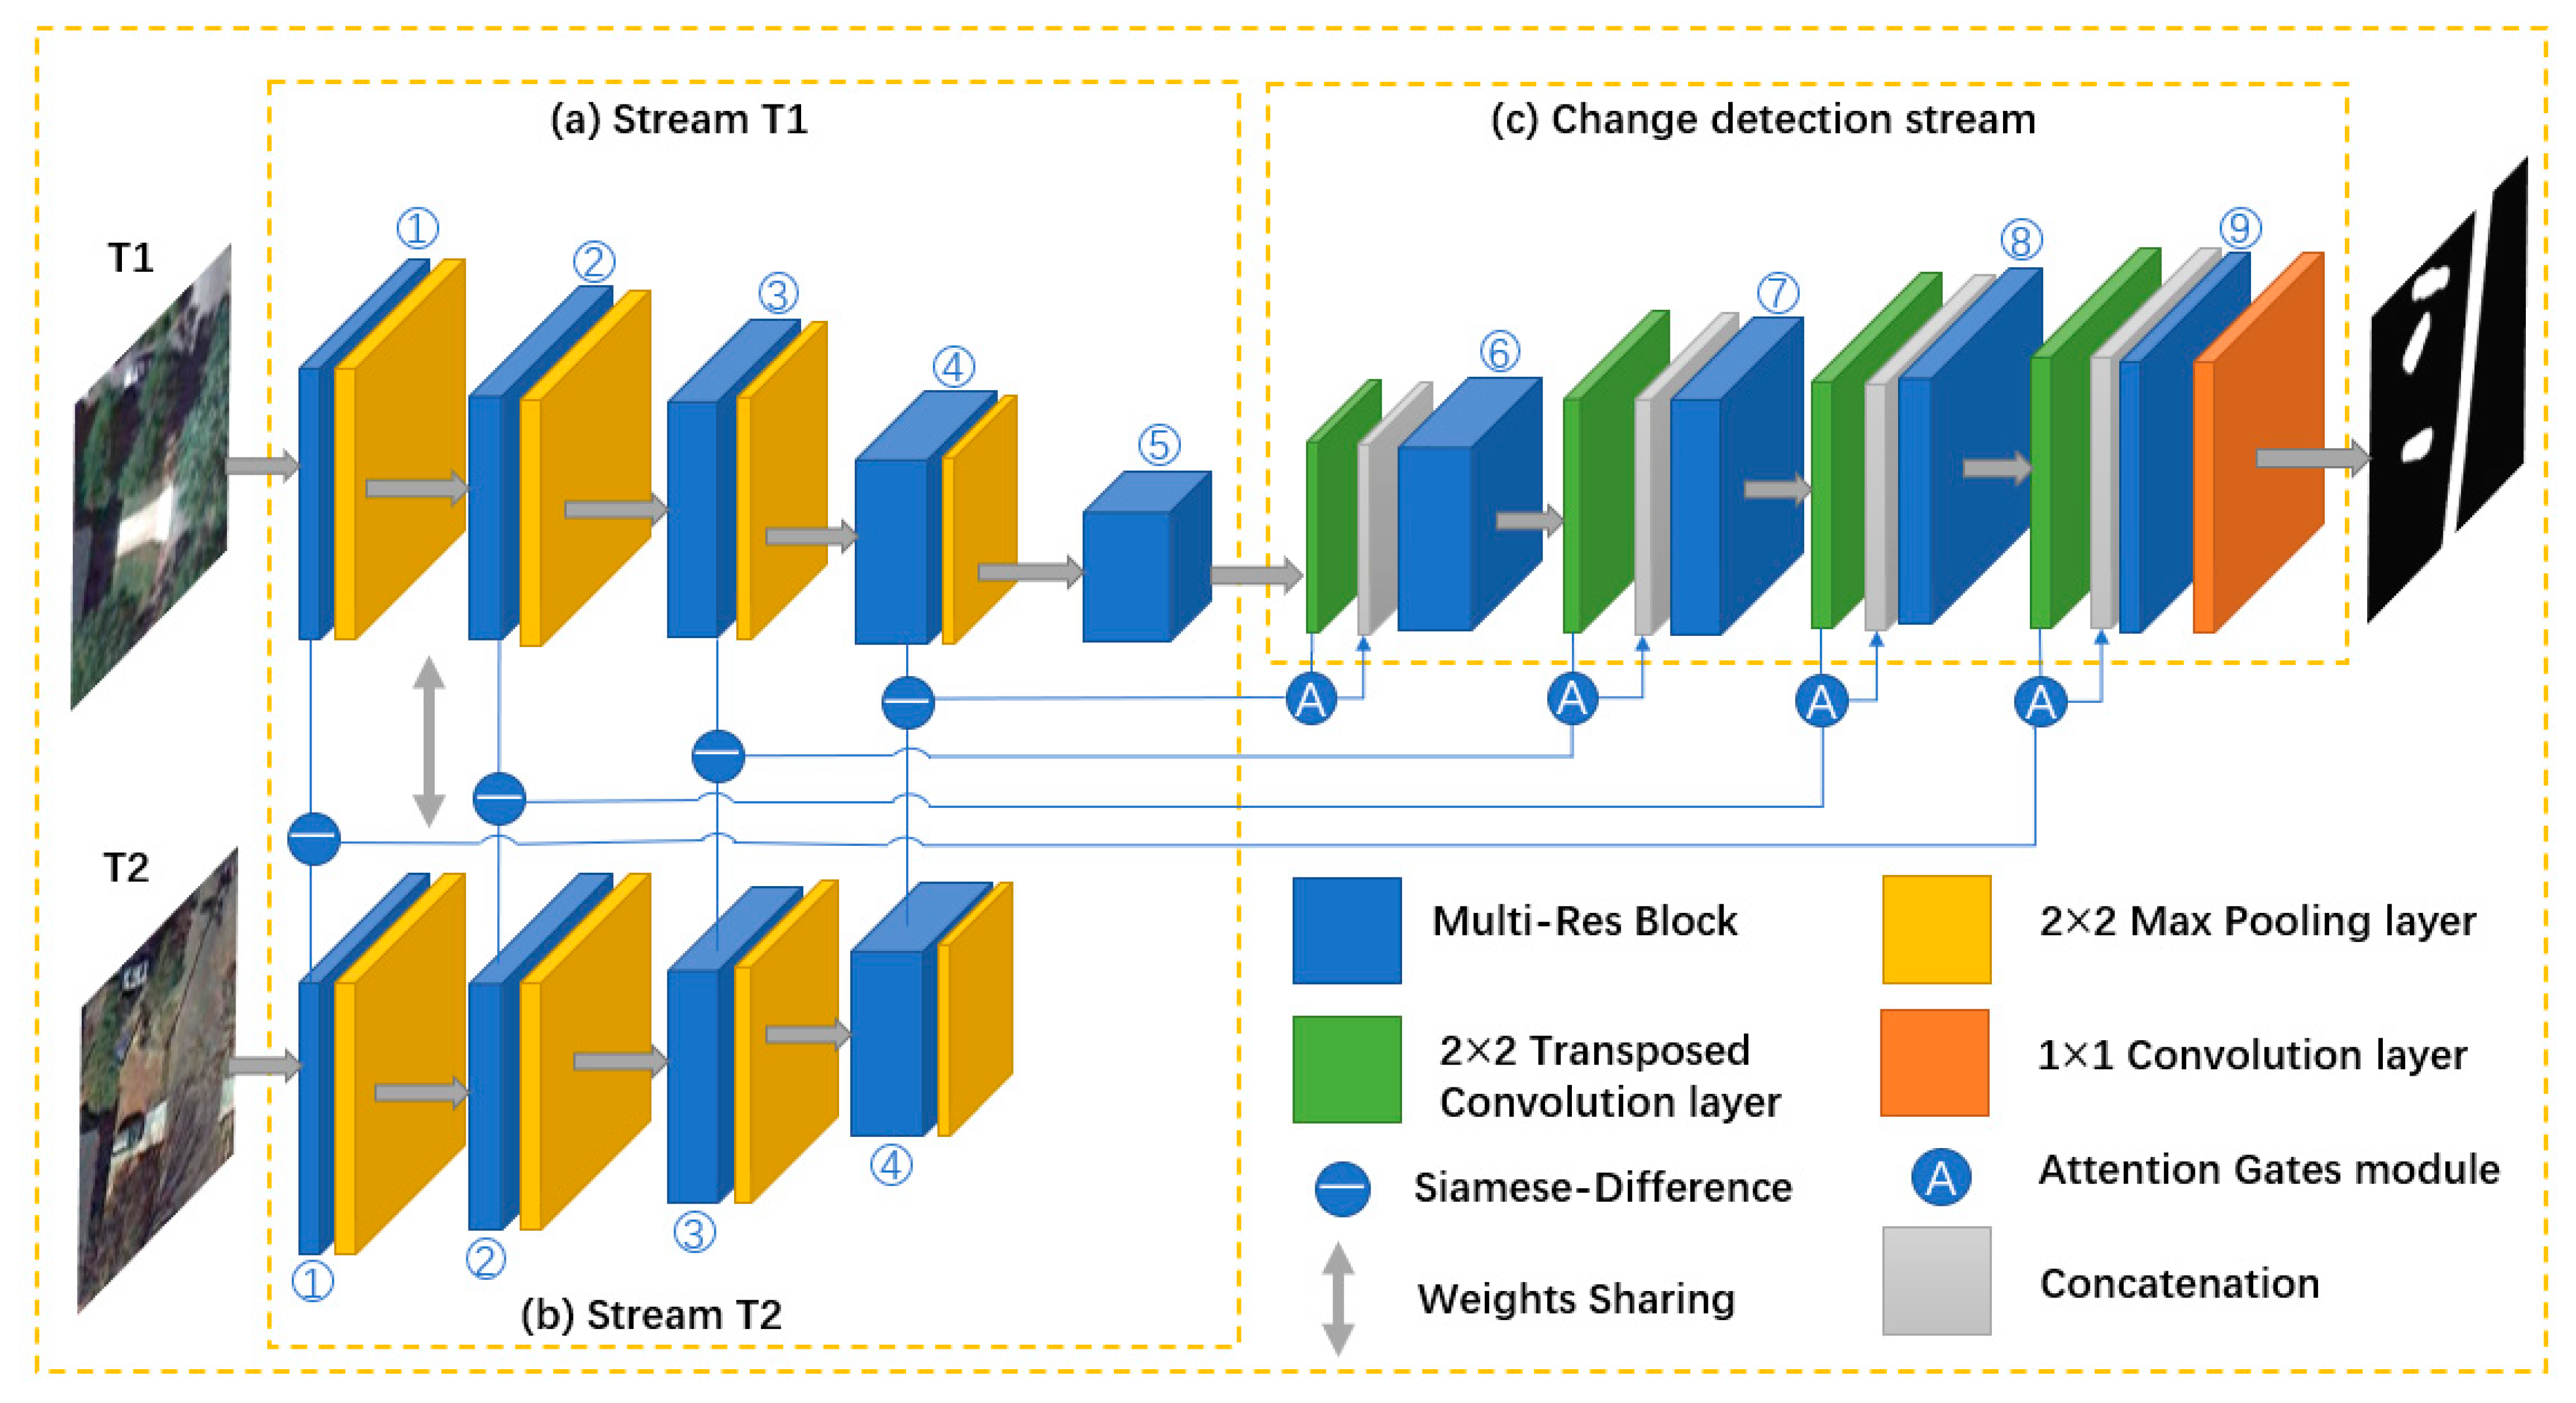
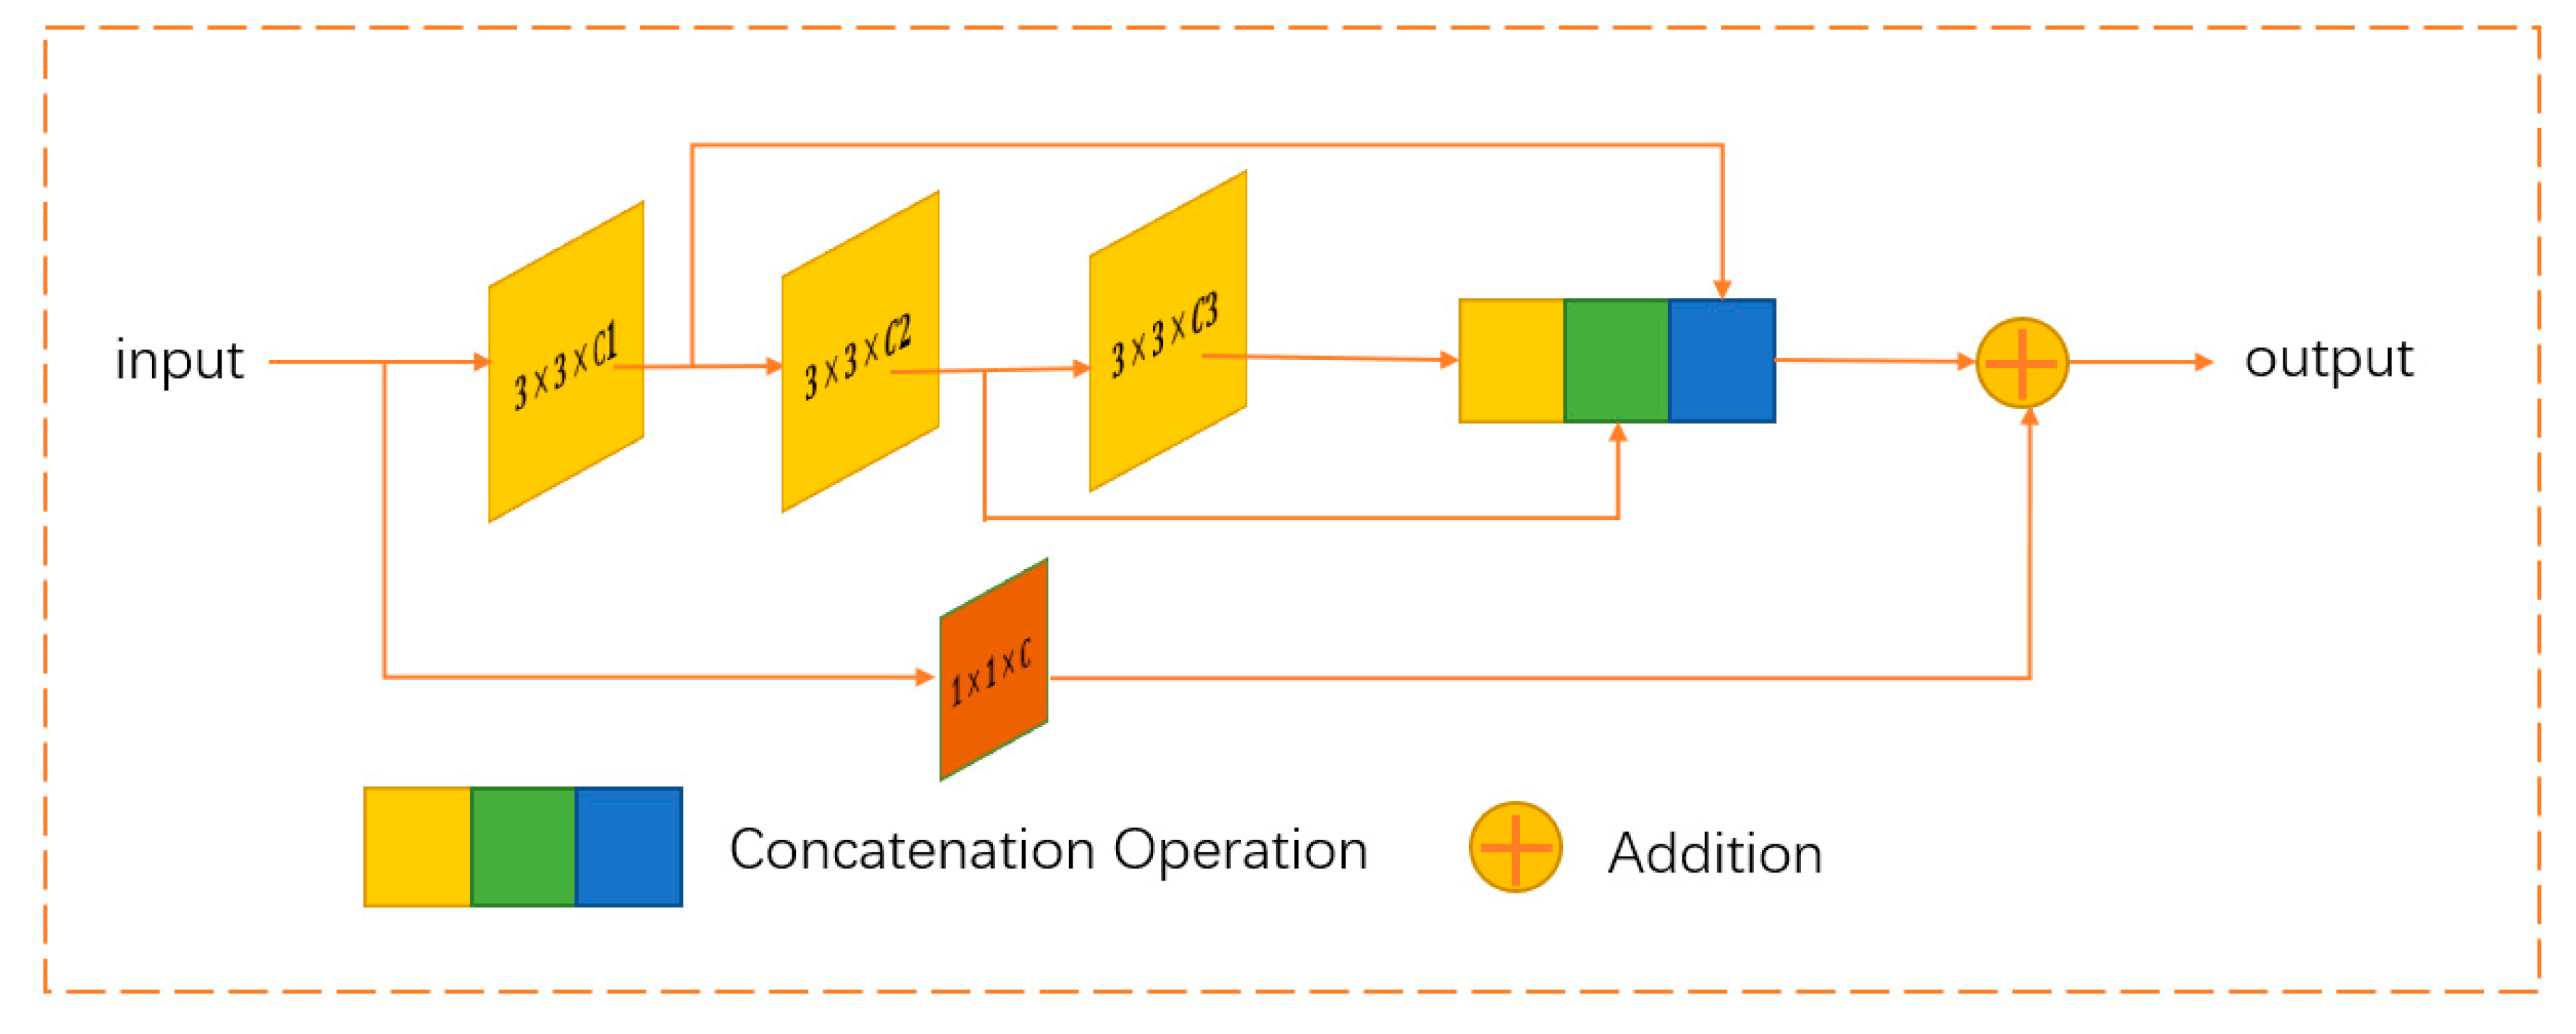
  • We propose a new end-to-end CNN network architecture, MRA-SNet, for remote sensing image CD, which uses Multi-Res blocks to extract feature information at different scales of images and improve the accuracy of CD.
  • We use the difference absolute value feature of the Siamese network in the encoder to better extract the change features between the bitemporal images. Additionally, we introduce Attention Gates to better focus on the change information before the skip connection of the encoder and decoder.
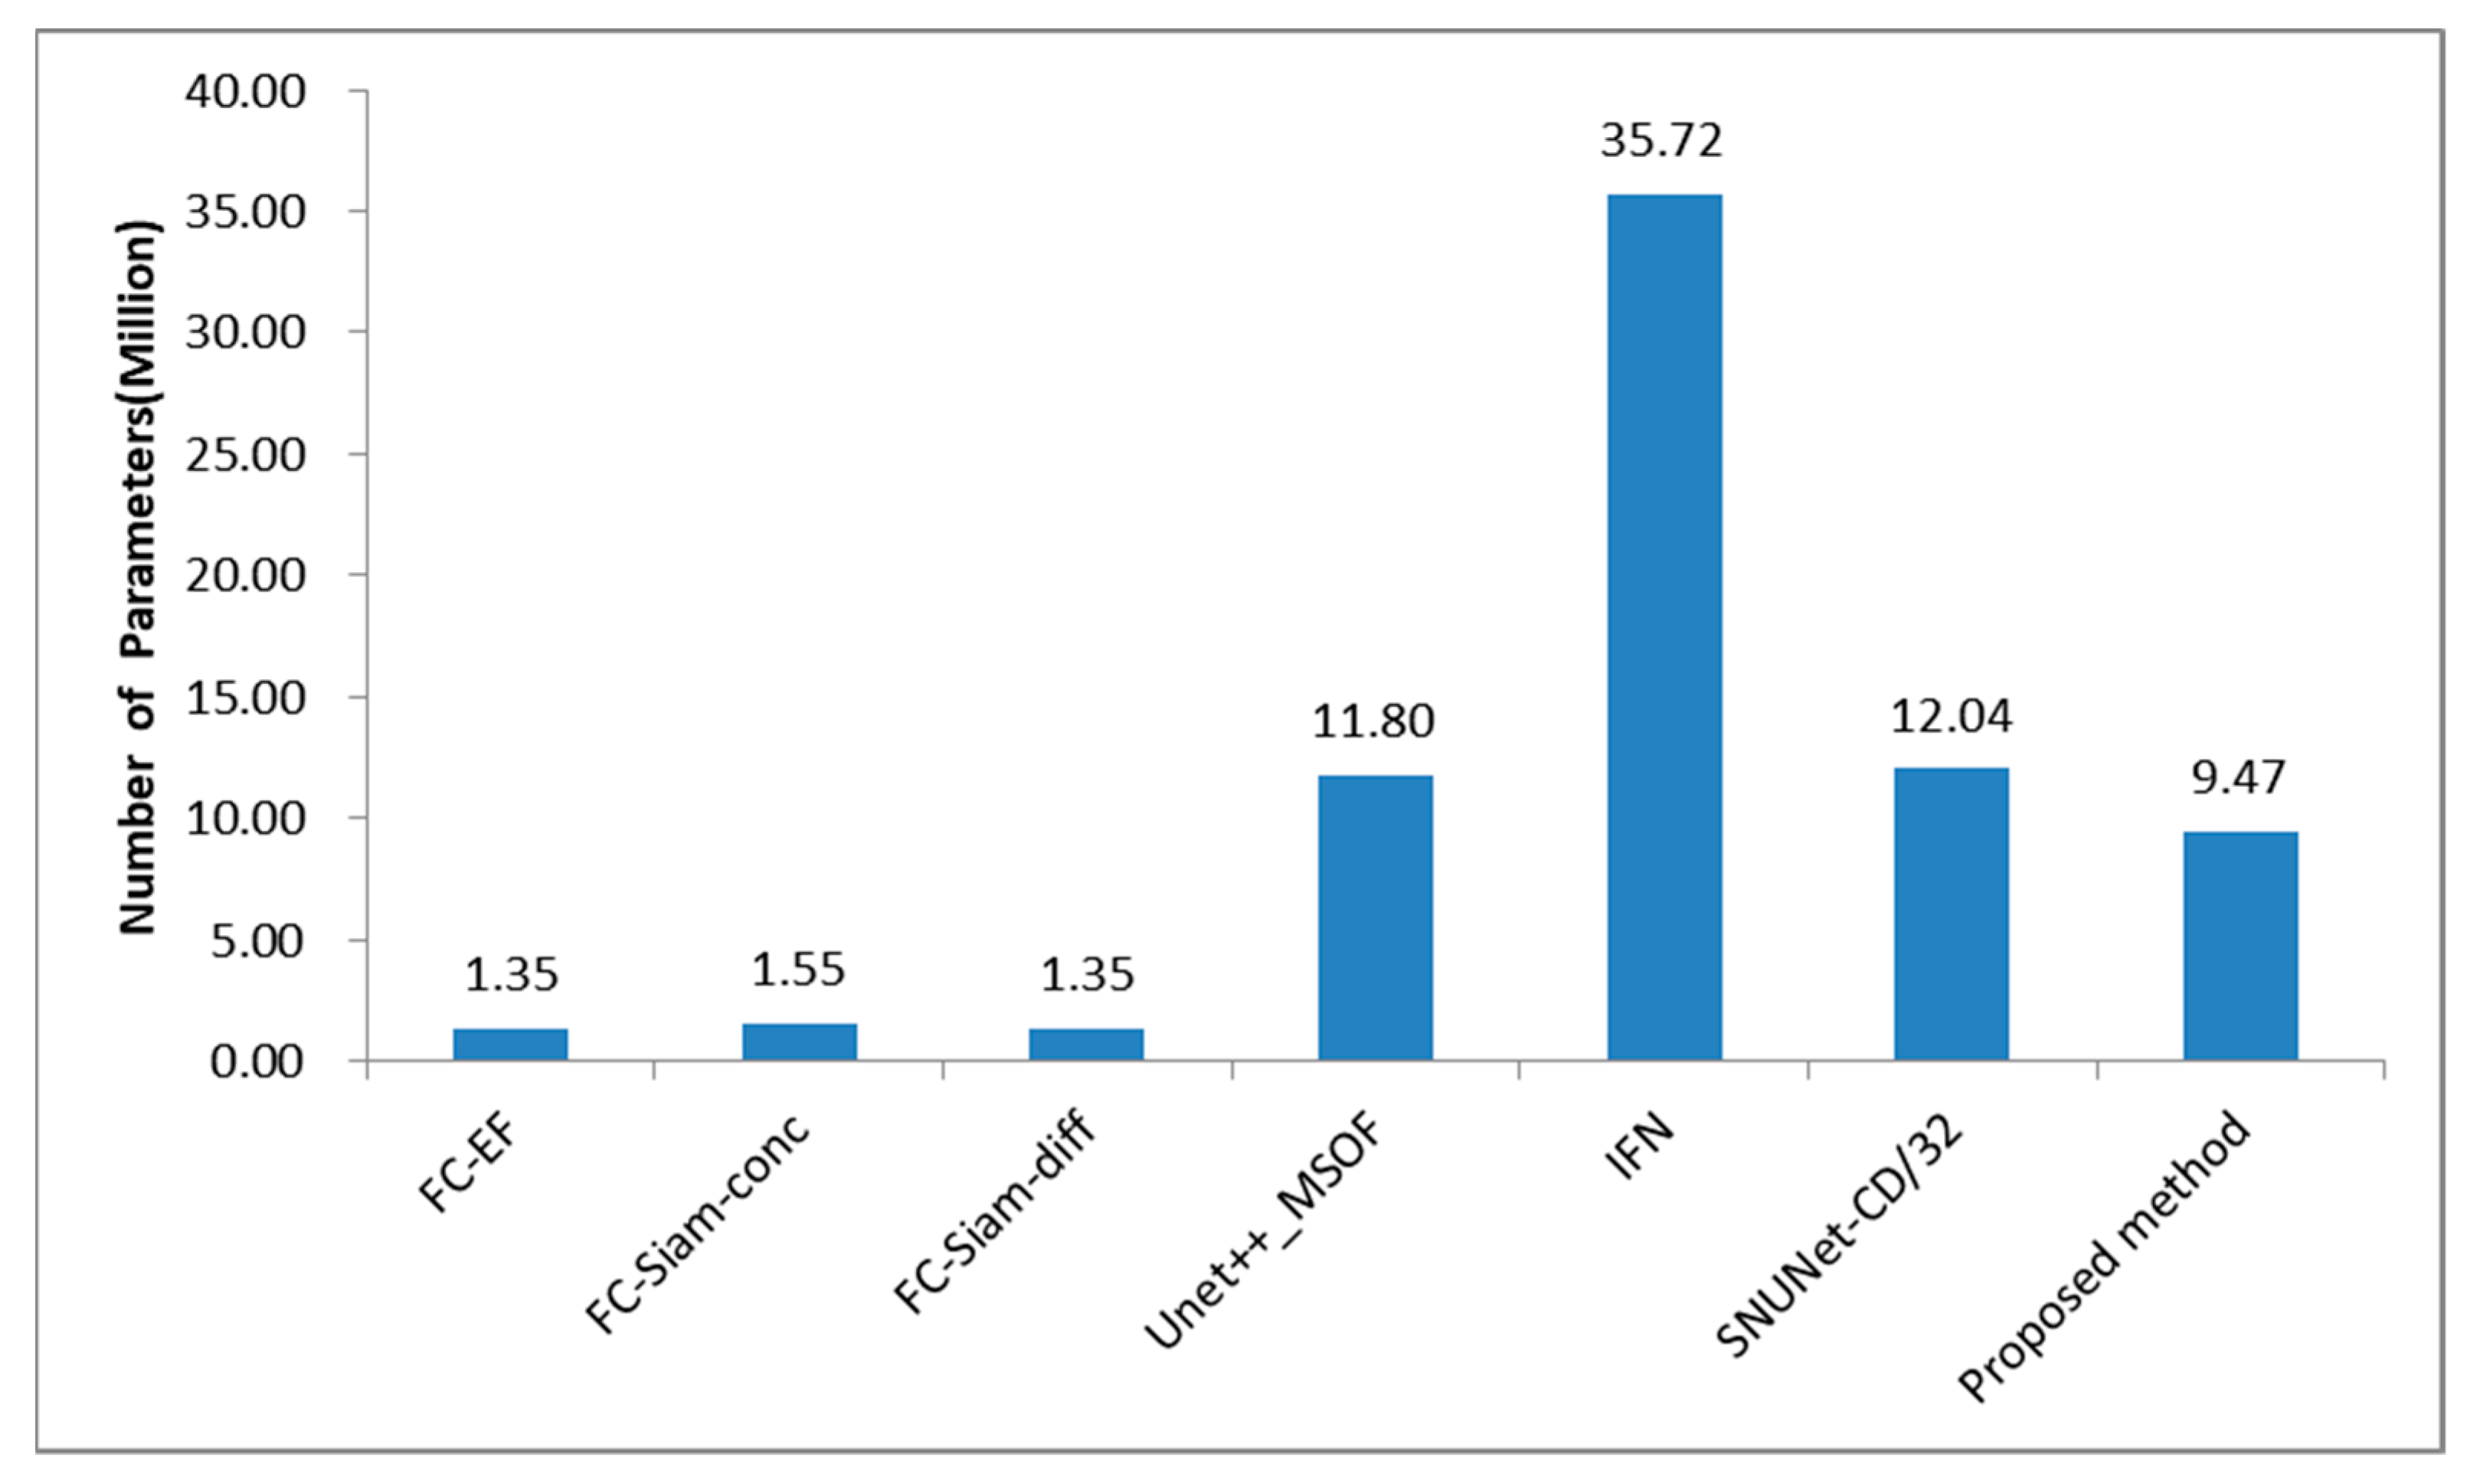
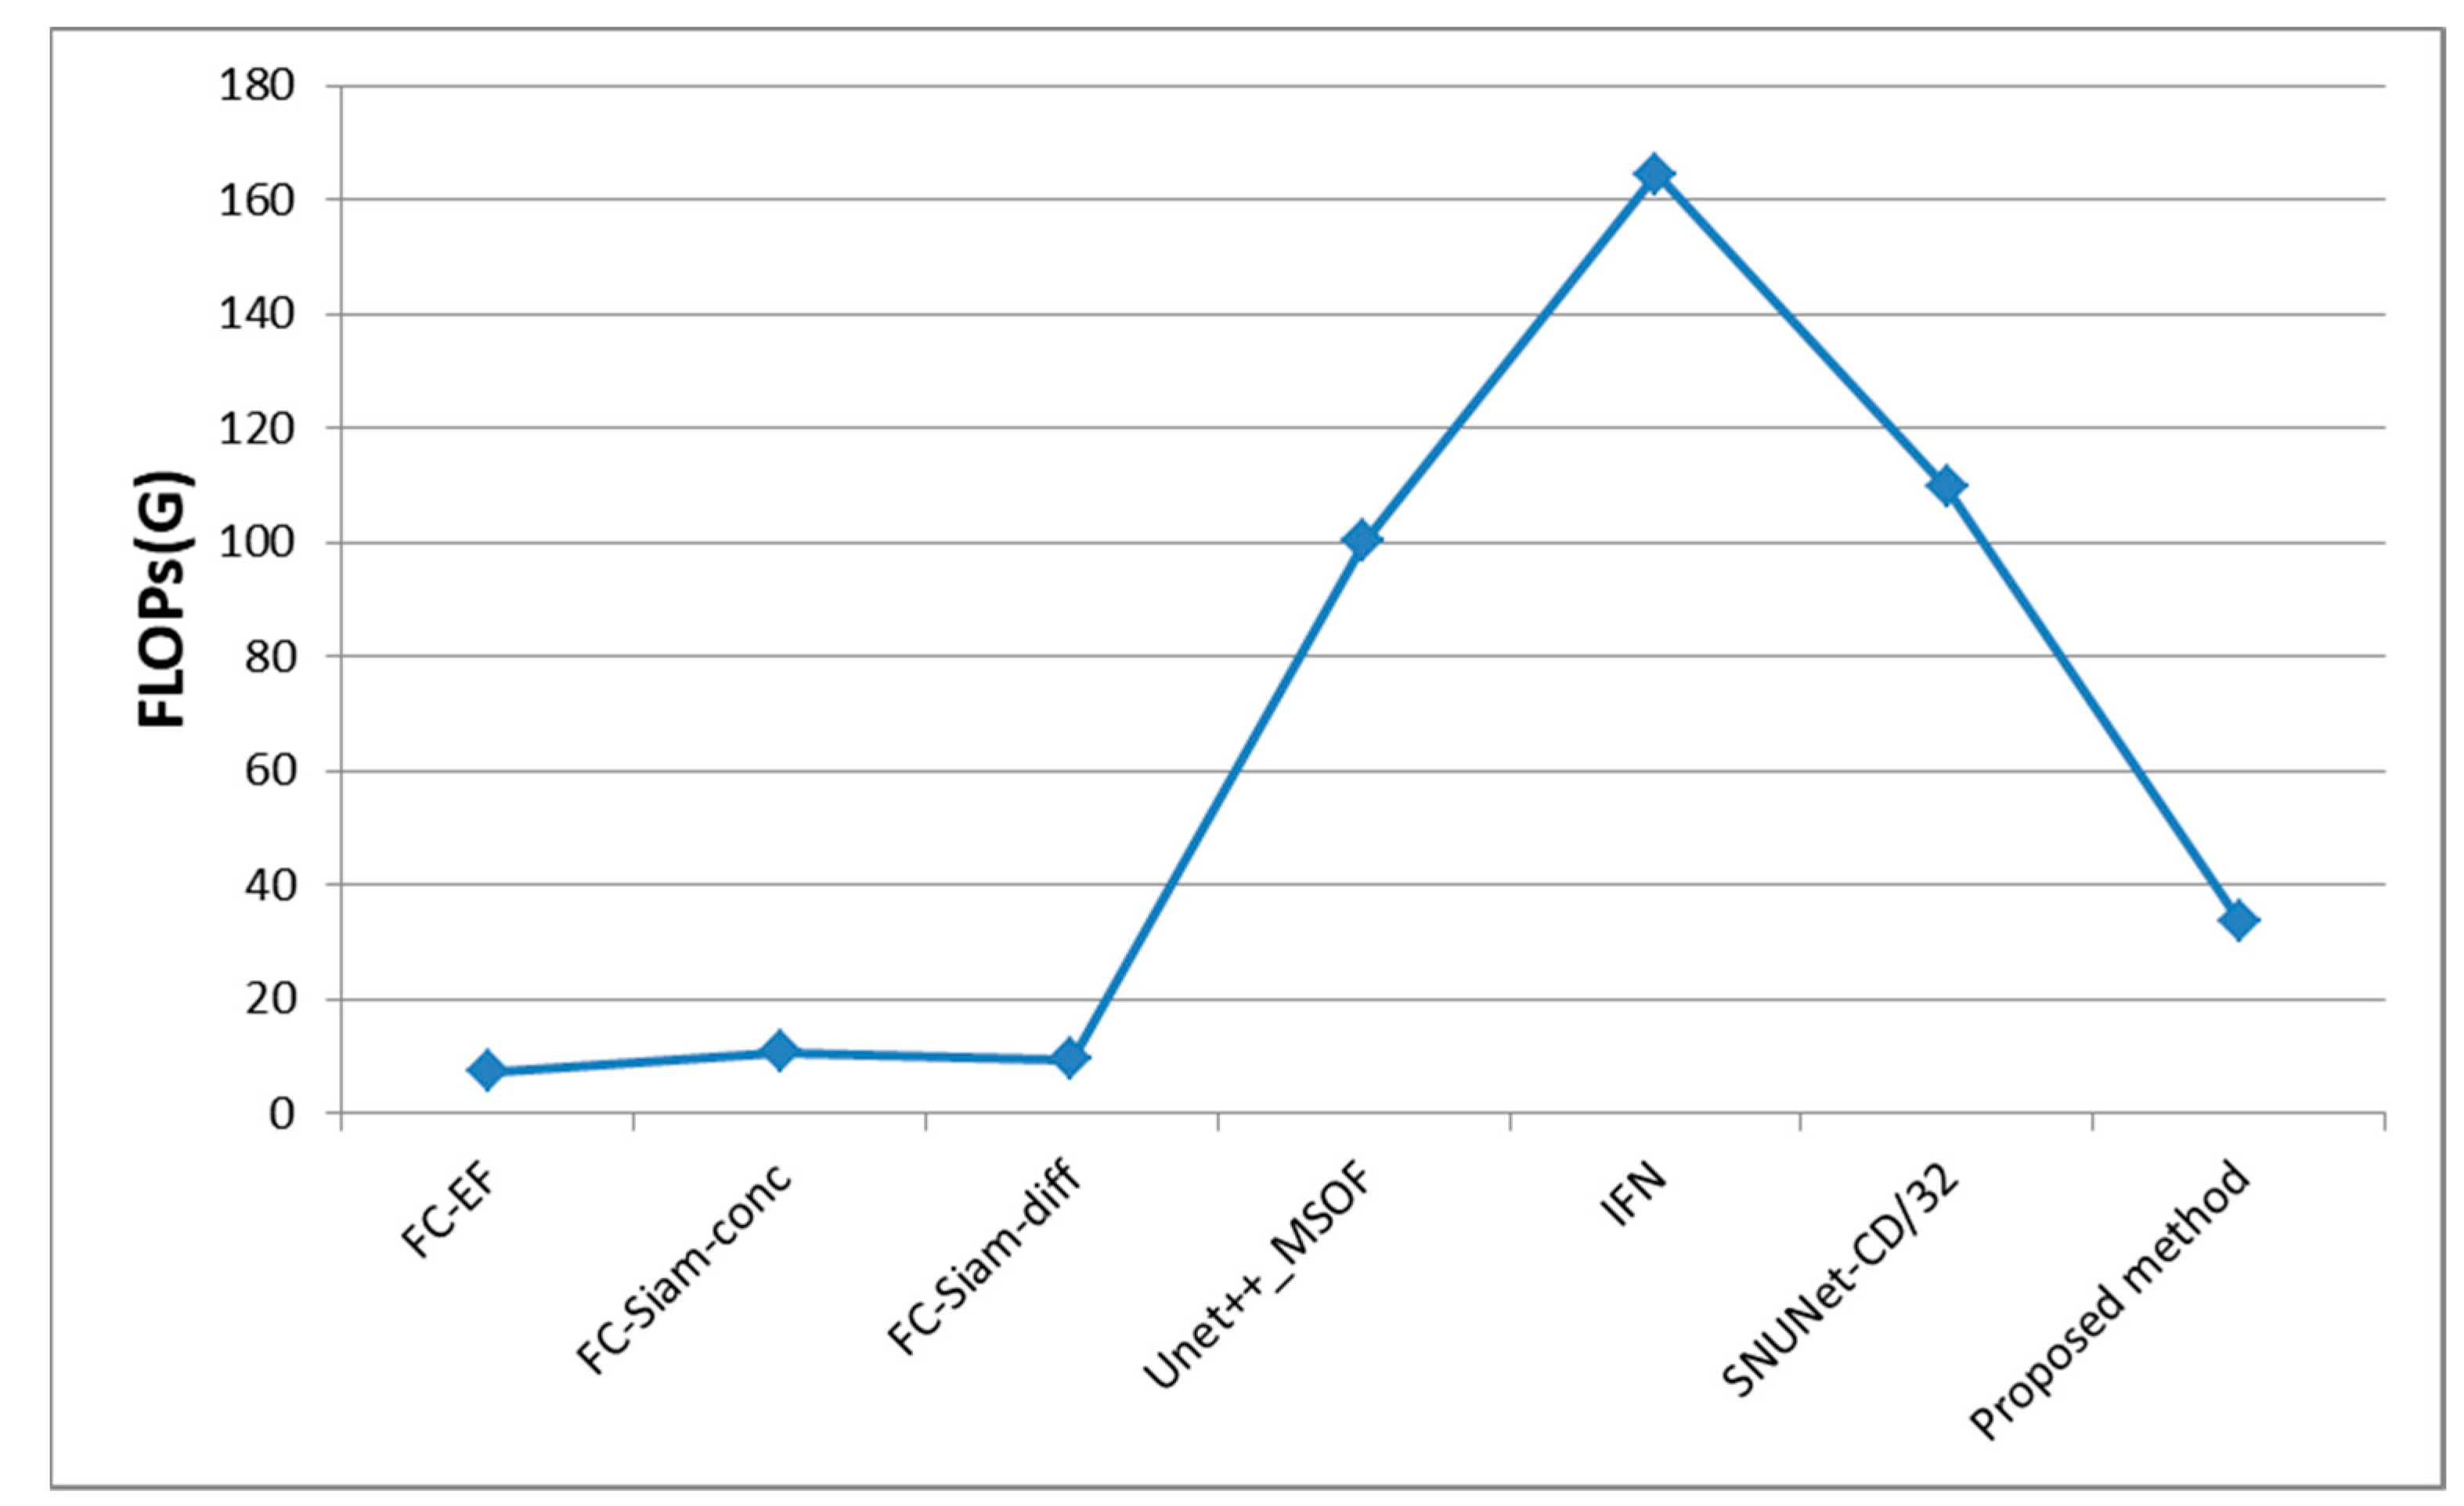
  • A series of experimental comparisons show that our method performs better than the other SOTA methods in terms of metrics such as F1 score and OA on the remote sensing image change detection dataset (CDD) [55]. Meanwhile, our method achieves a suitable balance between network performance and number of parameters.
The remainder of this article is organized as follows: Section 2 describes the proposed method in detail. In Section 3, corresponding experiments are designed to verify the effectiveness of the method in this article, and the experimental results are analyzed and discussed. In Section 4, the experimental results derived from this article and future research work are discussed. Section 5 draws some conclusions about our method.

2. Materials and Methods

In this section, we first introduce the workflow of the MRA-SNet network. Then, the detailed structure of the Multi-Res block and the Attention Gates module is introduced. Finally, the hybrid loss function used in this article is described.

2.1. The Proposed MRA-SNet Network

Compared with common natural images, remote sensing images have rich texture feature information and higher feature extraction requirements. The CD task can be regarded as an image binary classification problem. In this article, a semantic segmentation framework is introduced to deal with the CD task. Inspired by the classical semantic segmentation framework UNet network, this article improves the UNet network and designs an end-to-end CD network architecture, as shown in Figure 1. The overall network architecture is divided into three parts: the encoder, the decoder, and the skip connection between them. In the encoder, the ordinary convolution block in the UNet is replaced by the Multi-Res block, which is used to extract image features of different scales. We divide a pair of bitemporal images (T1 is the image before the change, T2 is the image after the change) into two parallel streams and input them into the encoder separately. The encoder of this network has two structured flows with shared weights and parameters. The two structure streams (streams T1 and T2, Figure 1a,b) enable the original features of both images to be preserved as much as possible. The CD task is to detect the difference between two images, so this article connects the absolute values of the differences between the two separate structural streams in the encoder. The feature information extracted from these two structural streams is aggregated into the change detection stream (Figure 1c), which is the decoder. In the decoder, the Multi-Res block is also used to extract the feature information, and then the 1 × 1 convolutional layer is used to output the final CM. To reduce the semantic gap between the low-level features and the deep feature information, UNet introduces a skip connection between the encoder and the decoder. Based on the UNet network skip connection, the Attention Gates module is introduced before the skip connection. The Attention Gates module is used to input the feature maps after downsampling from the encoder and the feature maps after upsampling from the decoder to highlight the changing areas and suppress the irrelevant areas in the image.

2.2. Multi-Res Block

Using a single 3 × 3 convolution kernel has certain drawbacks in feature extraction of HR remote sensing images. The single 3 × 3 convolution kernel can often only extract features of a single scale, but in the remote sensing image CD, the changed objects are often irregular and of different scales. Therefore, a single-scale convolution unit cannot handle the complex multiscale feature information in HR remote sensing images.
To address this problem, the Inception [53] module proposes parallel processing using convolutional kernels of different sizes, which are used to extract features at different scales. Replacing the ordinary 3 × 3 convolutional layer with an Inception-like module is beneficial for the network to learn image features at different scales. However, the additional introduction of convolutional layers will significantly increase memory requirements. Therefore, the Multi-Res block [52] is proposed to obtain multiscale feature information without additional memory requirements. The Multi-Res block was first proposed for medical image analysis, and its detailed structure is shown in Figure 2. In this article, we replace all the ordinary convolution blocks with the Multi-Res blocks.
In the Multi-Res block, instead of 5 × 5 and 7 × 7 convolution operations, a series of smaller, lightweight 3 × 3 convolution kernels are used for concatenation. The Multi-Res block includes one 3 × 3 convolution kernel, two 3 × 3 convolution kernels in series (equivalent to a 5 × 5 convolution kernel), and three 3 × 3 convolution kernels in series (equivalent to a 7 × 7 convolution kernel). The output features of these three convolutional layers are concatenated and used to extract features at different scales. The Multi-Res block adopts a gradually increasing mode in setting the number of filters because if the convolutional layer is used twice in a deep network and the number of filters is the same, it will have a secondary impact on the increasing memory. In addition, the block adds an extra residual connection with the 1 × 1 convolutional layer for obtaining some additional spatial information of remote sensing images. In Figure 2, C1, C2, and C3 represent the number of channels in the first, second, and third 3 × 3 convolution kernel, and C is the number of channels of the 1 × 1 convolution kernel. Referring to [52], we set a parameter W = {53,107,213,427,854} to control the number of filters of the convolutional layers inside the Multi-Res block. C1, C2, and C3 are assigned to [W/6], [W/3], and [W/2], respectively. C is the sum of C1, C2, and C3.

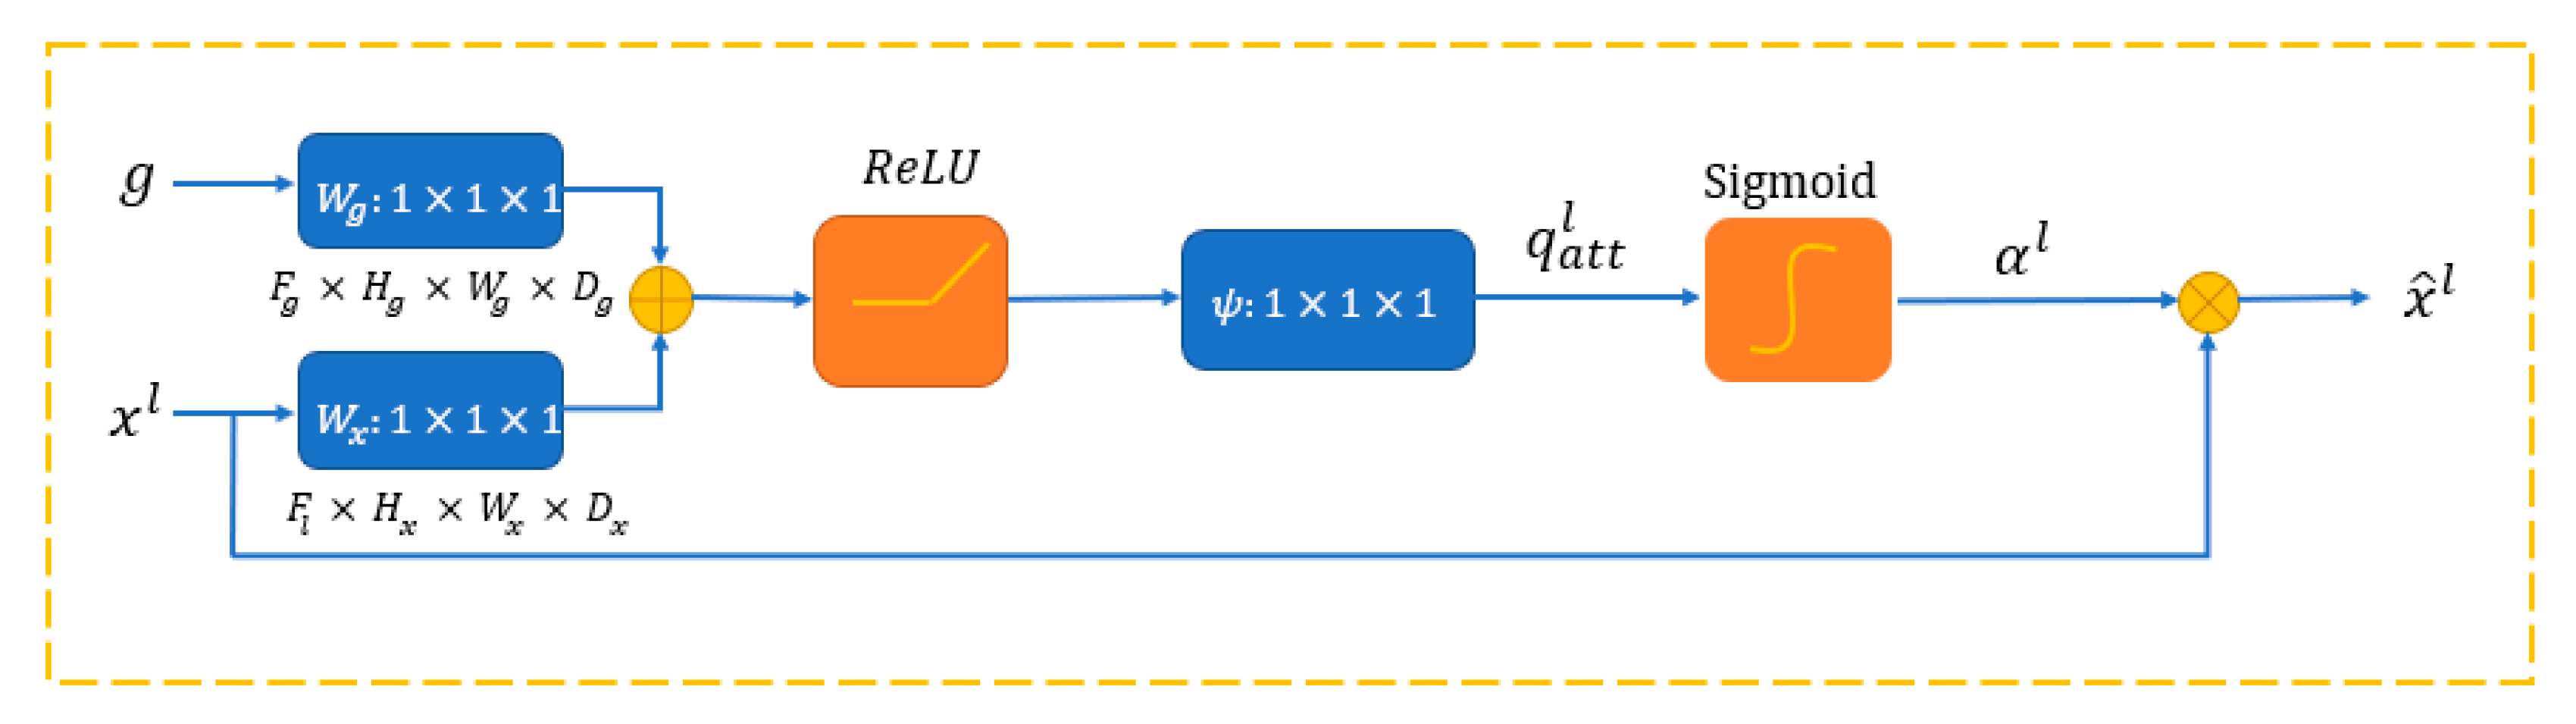
2.3. Attention Gates Module

In the CD task, we need to consider how to better highlight the information of change features. To solve this problem, the Attention Gates module [54] is introduced in this article. The Attention Gates module learns to suppress irrelevant areas and focus on useful features during training, which is effective for some specific tasks, such as natural image analysis, knowledge graphs, image description, machine translation, and classification tasks. The Attention Gates module can be integrated into CNN models relatively easily and does not introduce as much computational overhead or require as many parameters as other model frameworks. Therefore, the Attention Gates module is introduced to highlight the features of changing areas and suppress the features of irrelevant changing areas in the bitemporal images without adding a large number of additional computations and parameters.
The detailed structure of the Attention Gates module is shown in Figure 3. Let x l = { x i l } i = 1 n , x l is the feature vector corresponding to layer l of the encoder, where each x i l represents the i th pixelwise feature vector of length F l (the number of channels), and g denotes the upsampling feature map of the decoder corresponding to layer l of the encoder. For each x i l , the Attention Gates computes coefficients α l = { α i l } i = 1 n , where α i l [ 0 , 1 ] . The output Attention Gates can be formulated as follows:
x ^ l = { α i l x i l } i = 1 n
The attention coefficients α i l are computed as follows: First, the decoder upsampling feature map g i performs a 1 × 1 × 1 convolution operation to obtain W g T g i , and the encoder downsampling feature map x i l performs a 1 × 1 × 1 convolution operation to obtain W x T x i l . The feature maps obtained above are summed and input to the ReLU activation function σ 1 . Then, the features output from σ 1 are passed through a 1 × 1 × 1 convolution operation ψ to obtain q a t t l . Finally, the q a t t l is input to the sigmoid activation function σ 2 . to obtain α i l .
q a t t l = ψ T ( σ 1 ( W x T x i l + W g T g i + b g ) ) + b ψ
α i l = σ 2 ( q a t t l ( x i l , g i ; θ a t t ) )
where a set of parameters θ a t t   contain linear transformations W x F l × F i n t , W g F g × F i n t , and ψ F i n t × 1 and bias terms b ψ and b g F i n t . In this article, we use four Attention Gates modules, and the number of channels of these modules F i n t is set to {32,64,128,256}.

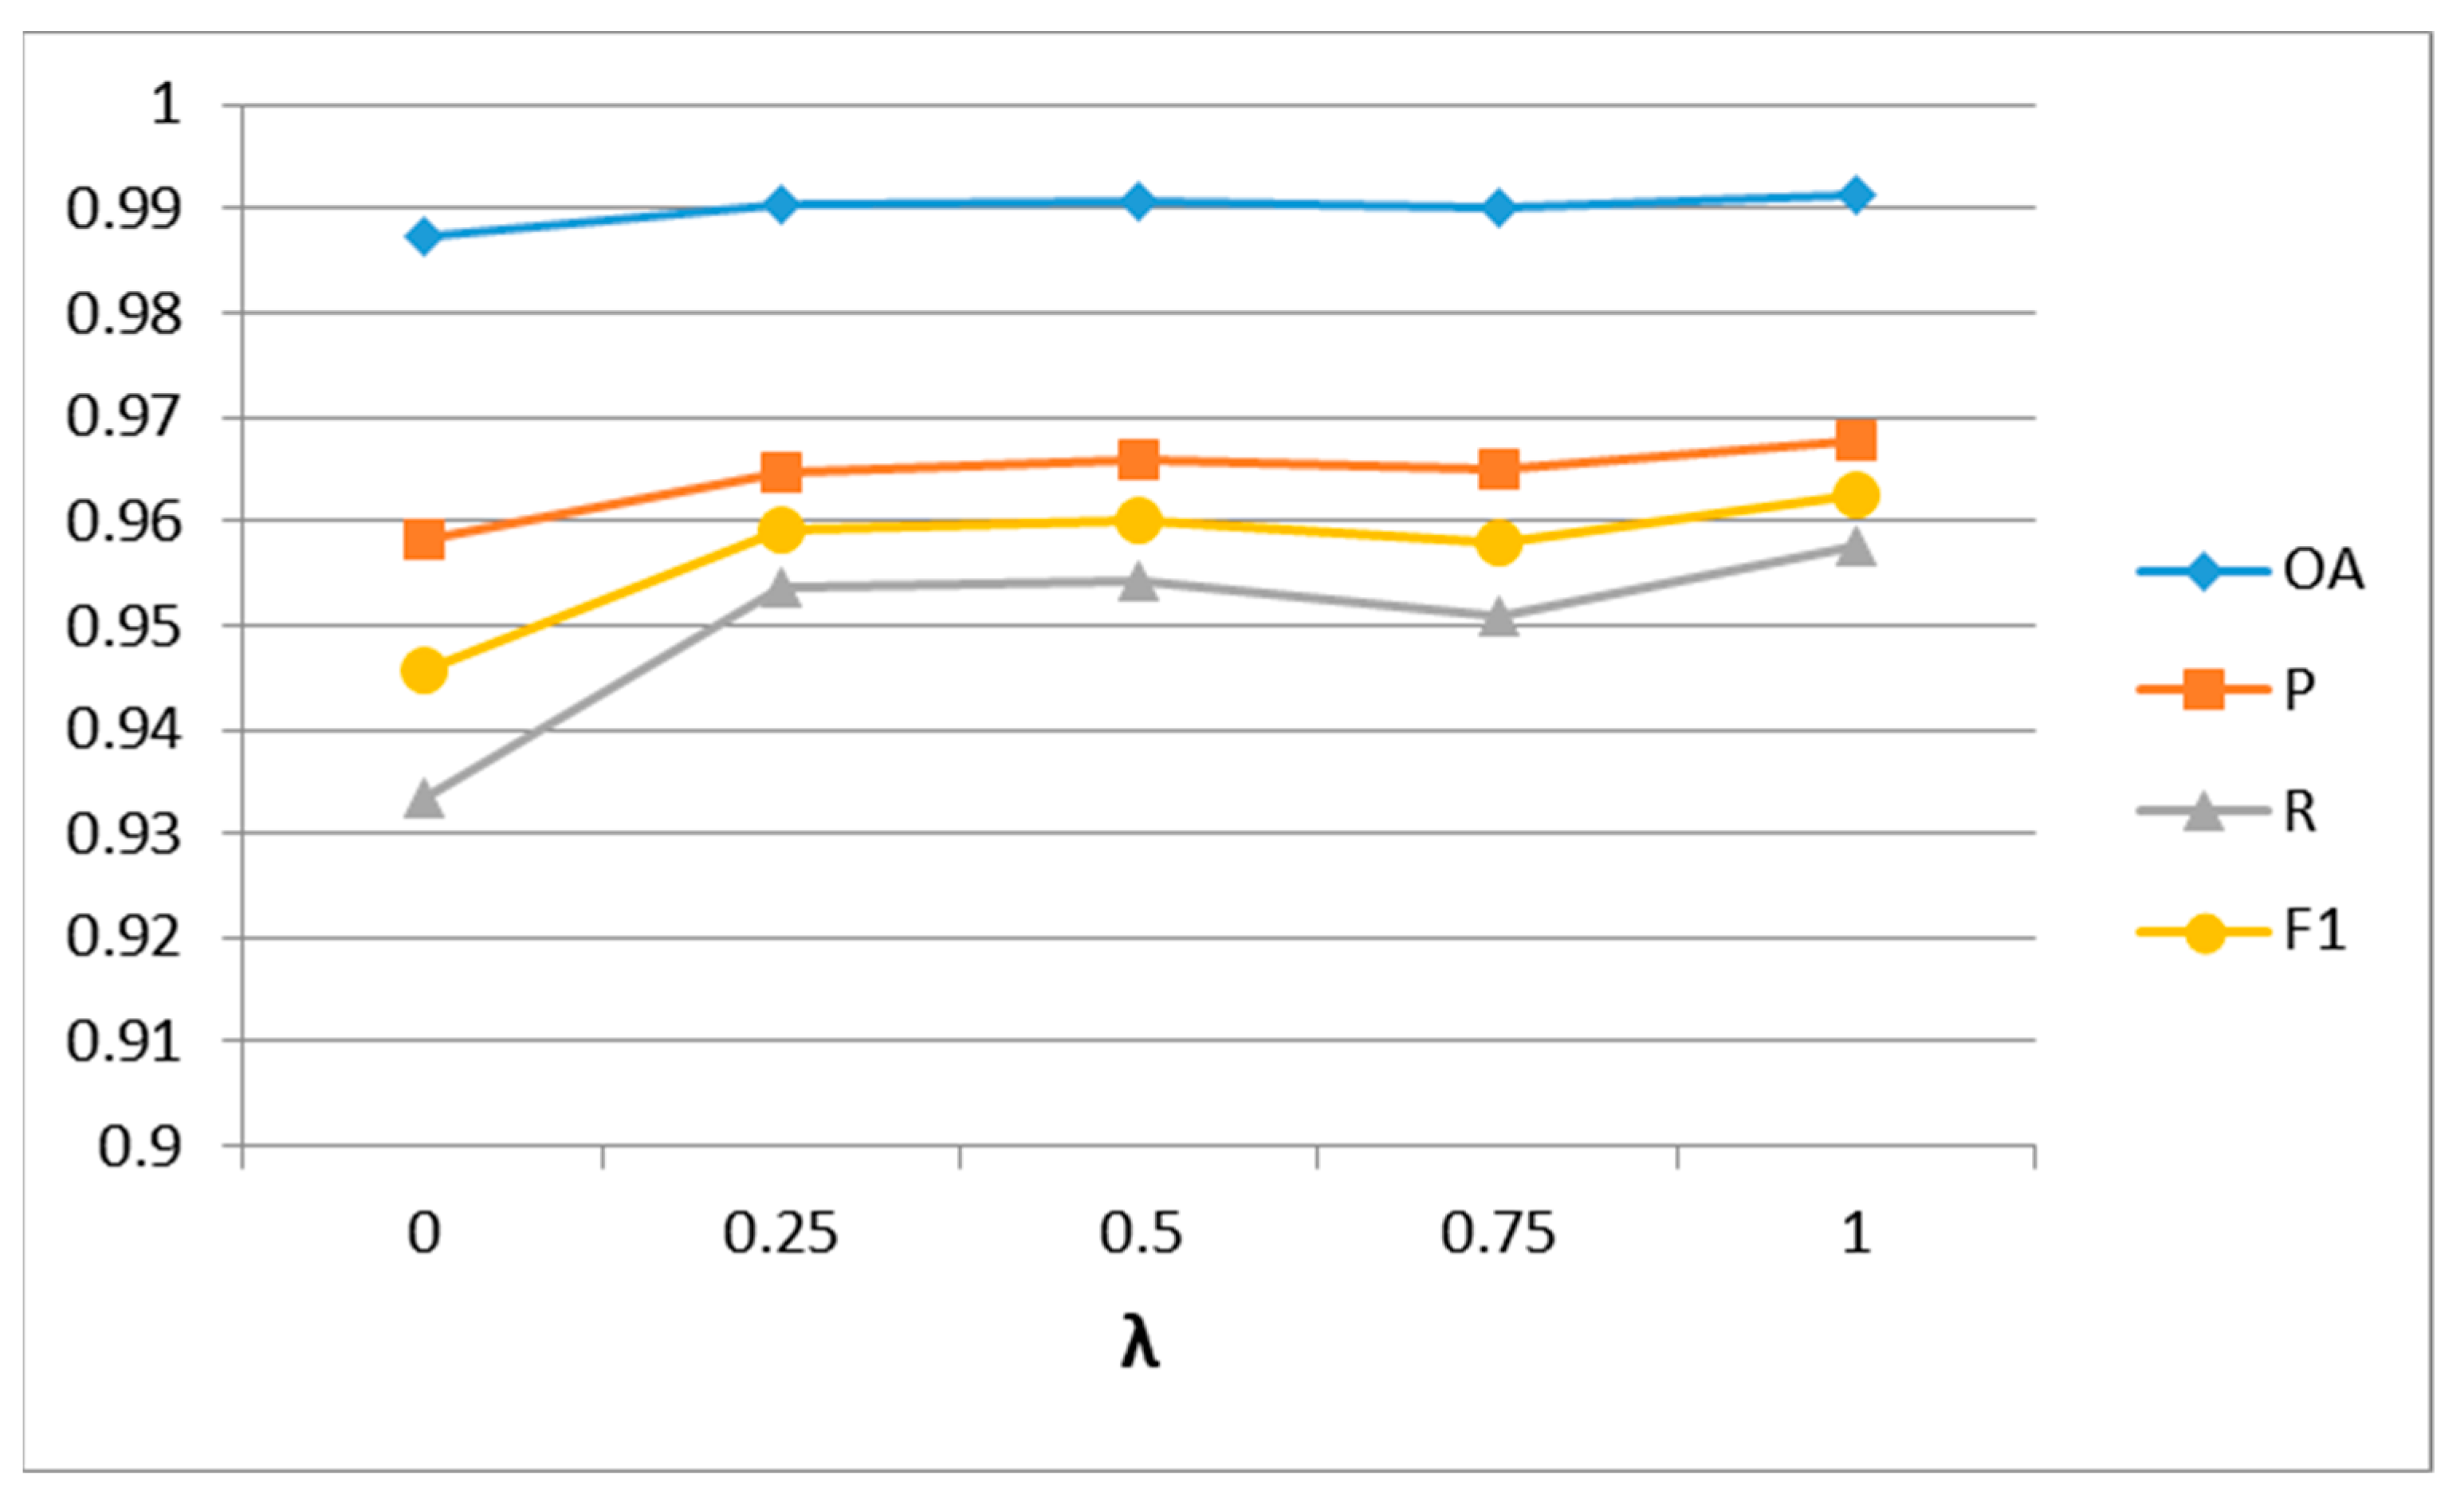
2.4. Loss Function Details

In remote sensing image CD, the number of unchanged samples is far greater than the number of changed samples. We use a hybrid loss function (a combination of binary cross-entropy loss and dice coefficient loss) to reduce the effect of sample imbalance, which is defined as follows:
= b c e + λ d i c e
where b c e denotes the binary cross-entropy loss, d i c e denotes the dice coefficient loss, and λ refers to the weight that balances the two losses.

2.4.1. Binary Cross-Entropy Loss

Cross-entropy is mainly used to measure the difference between a probability distribution and another probability distribution, and the cross-entropy loss function is a common loss function used in classification tasks. The loss function of cross-entropy evaluates the class prediction for each pixel vector individually and then averages over all pixels. In this article, CD contains only two categories, changed and unchanged, so binary cross-entropy loss is used. In our method, the sigmoid layer and binary cross-entropy loss are combined to be more stable in numerical calculations. Binary cross-entropy is defined as follows:
b c e = t n log ( σ ( y n ) ) ( 1 t n ) log ( σ ( 1 y n ) ) .  
where t n represents the ground-truth value of the n th pixel; if t n = 1, the ground-truth pixel belongs to the changed class. Otherwise, t n = 0 means the ground-truth pixel belongs to the unchanged class. y n represents the predicted probability of pixel n belonging to the changed class, 1 y n represents the probability of pixel n belonging to the unchanged class, and σ denotes the sigmoid activation function.

2.4.2. Dice Coefficient Loss

Dice coefficient loss is often applied to semantic segmentation tasks to weaken the impact of class imbalance problems. In this article, we further introduce dice coefficient loss in the loss function to reduce the effect of imbalance between the number of changed and unchanged samples. The dice coefficient loss can be defined as follows:
d i c e = 1 2 γ γ ^ γ + γ ^
where γ represents the predicted probability of all pixels in the changed class in the image and γ ^ represents the ground-truth value of all pixels in the image.

3. Experiments and Results

In this section, we perform ablation and comparative experiments to verify the effectiveness of our proposed method. First, we introduce the CD public dataset used in the experimental and the evaluation metrics used for the quantitative analysis. Second, the current SOTA methods are introduced for comparison with the proposed method. Then, the details of the parameters and experimental settings are described. Finally, we present a comprehensive analysis of the experimental results.

3.1. Datasets and Evaluation Metrics

In CD tasks, public datasets are not only beneficial for in-depth research on CD tasks but also crucial for fair and efficient comparison of different algorithms. Meanwhile, in the training of deep neural networks, a large number of labeled images are needed, so it is difficult for small-scale registered image pairs to meet the training and testing requirements of DL remote sensing image CD. Lebedev [55] proposed a publicly available dataset CDD of satellite image pairs for remote sensing image CD. The dataset consists of bitemporal remote sensing images of the same area acquired from Google Earth. Notably, the dataset includes seven pairs of seasonal change images of size 4725 × 2700 pixels and four pairs of seasonal change images of size 1900 × 1000 pixels, labeled with changes in ground objects such as houses, roads, and cars, but considers seasonal changes in natural objects as unchanged regions, as shown in Figure 4. During the network training, the whole large image cannot be input into the network due to the limitation of GPU memory, so the dataset cropped the whole large image into small images with 256 × 256 pixels. The dataset contains 16,000 small images, with 10,000 images in the training set and 3000 images in each of the validation and test sets.
To verify the effectiveness of the proposed method, we used four evaluation metrics, namely precision (P), recall (R), F1 score (F1), and overall accuracy (OA). In the task of CD, higher precision indicates fewer false detections of predicted results, and higher recall indicates that fewer predictions are missed. F1 and OA are the overall evaluation metrics of the prediction results. The larger their values are, the better the prediction results will be. They are expressed as follows:
P = T P T P + F P
R = T P T P + F N
F 1 = 2 P R P + R
OA = T P + T N T P + T N + F P + F N
where TP, FP, TN, and FN represent the number of true positives, false positives, true negatives, and false negatives, respectively.

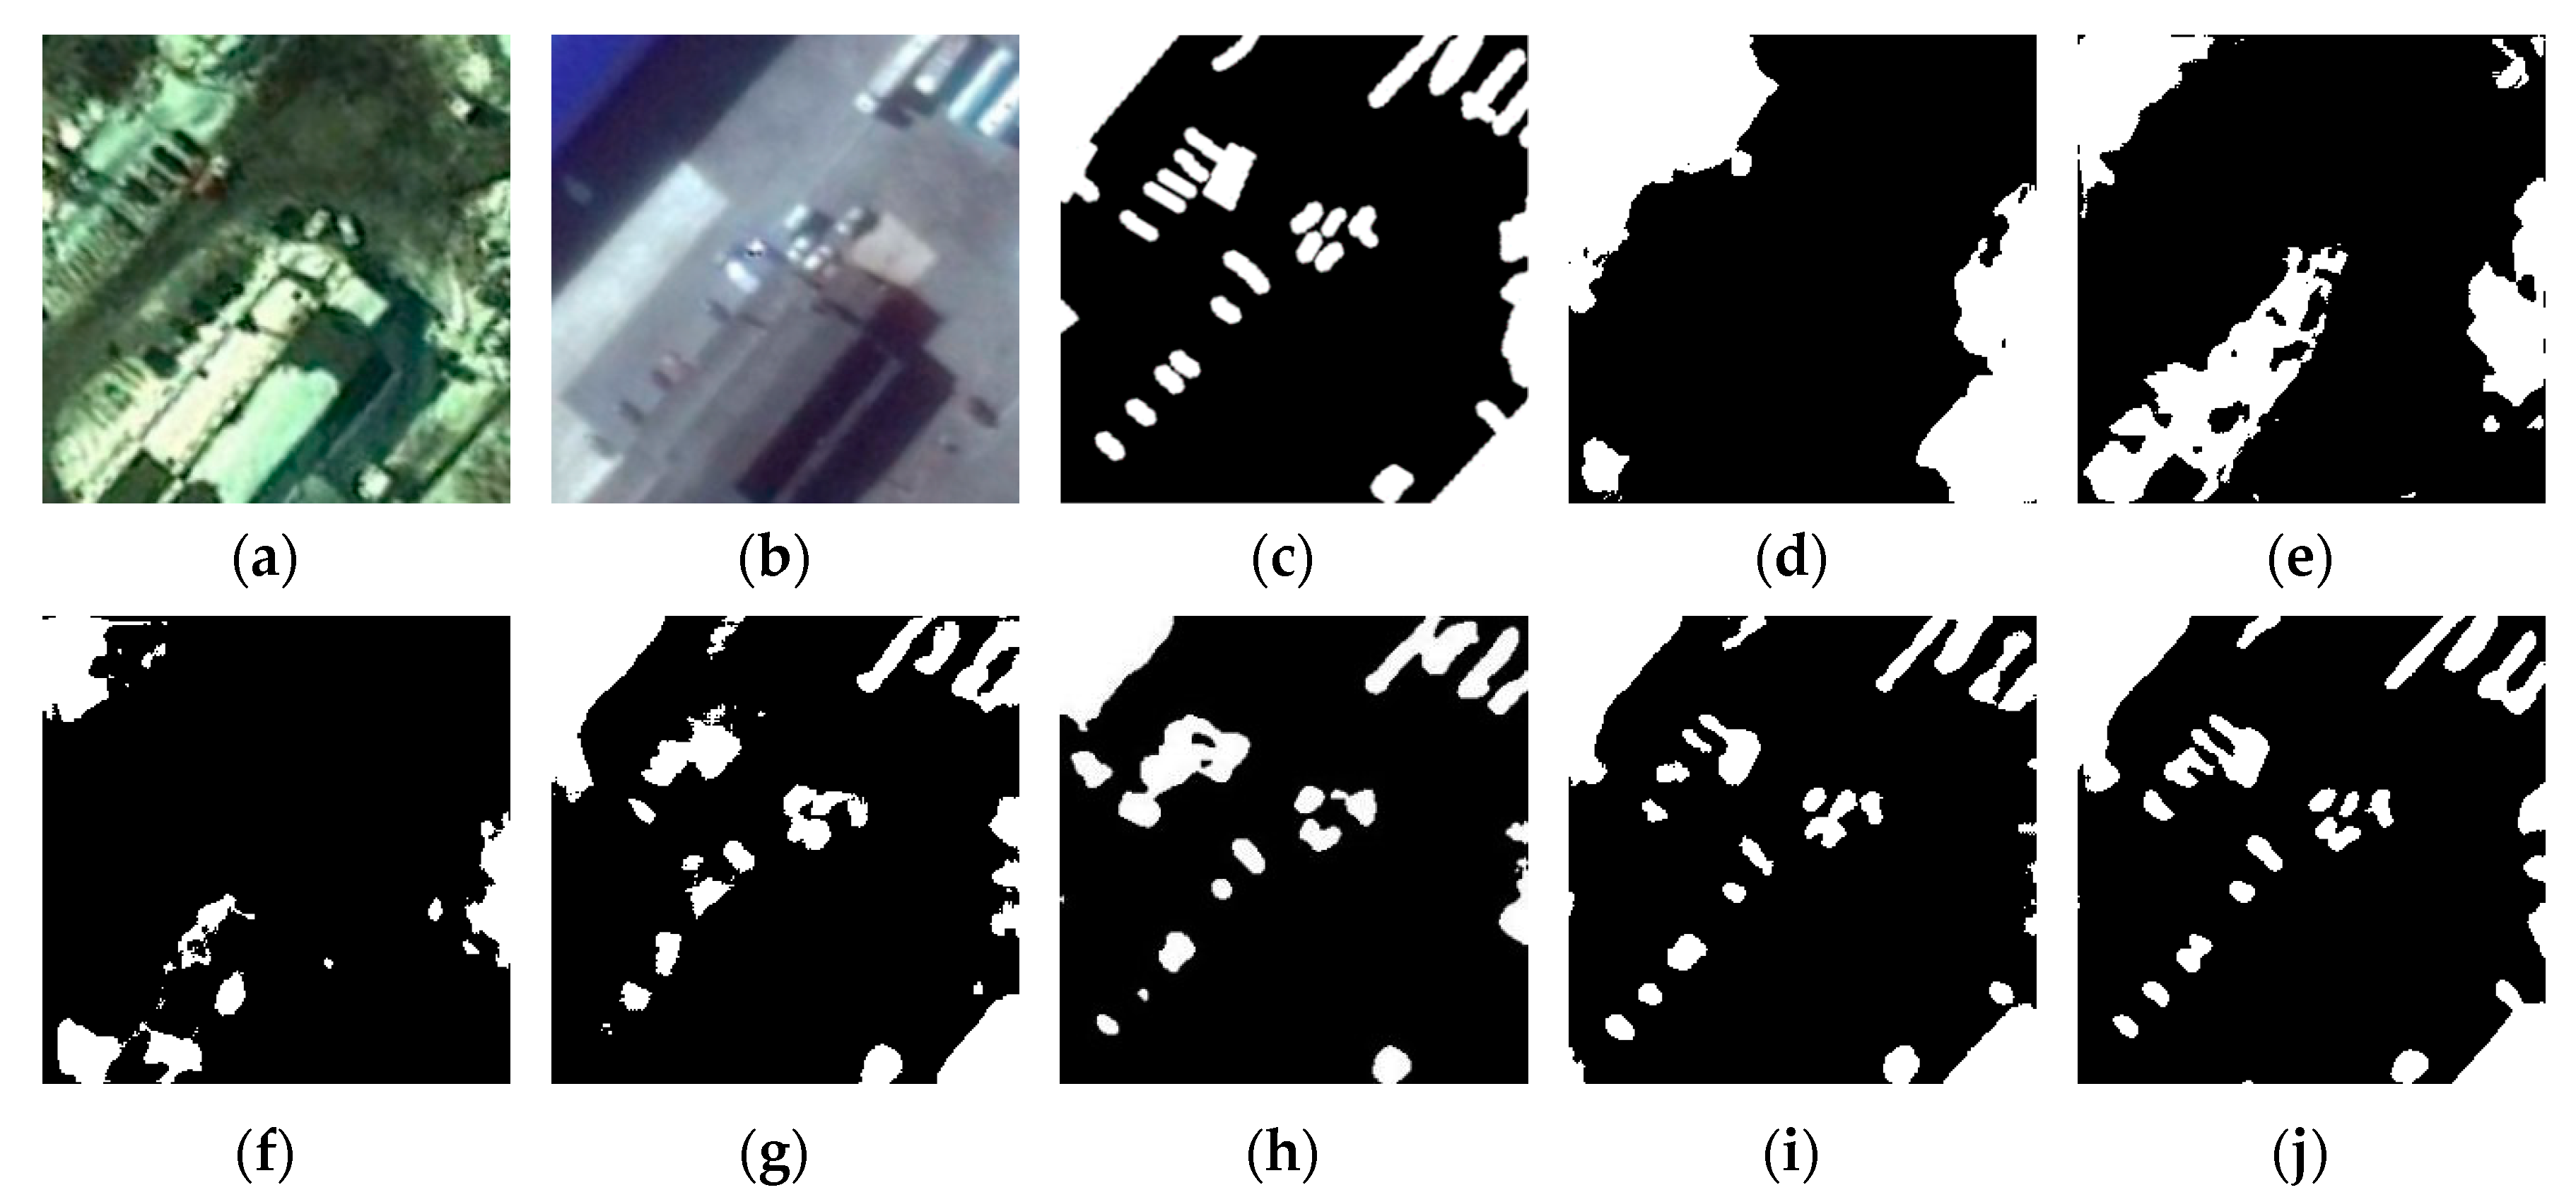
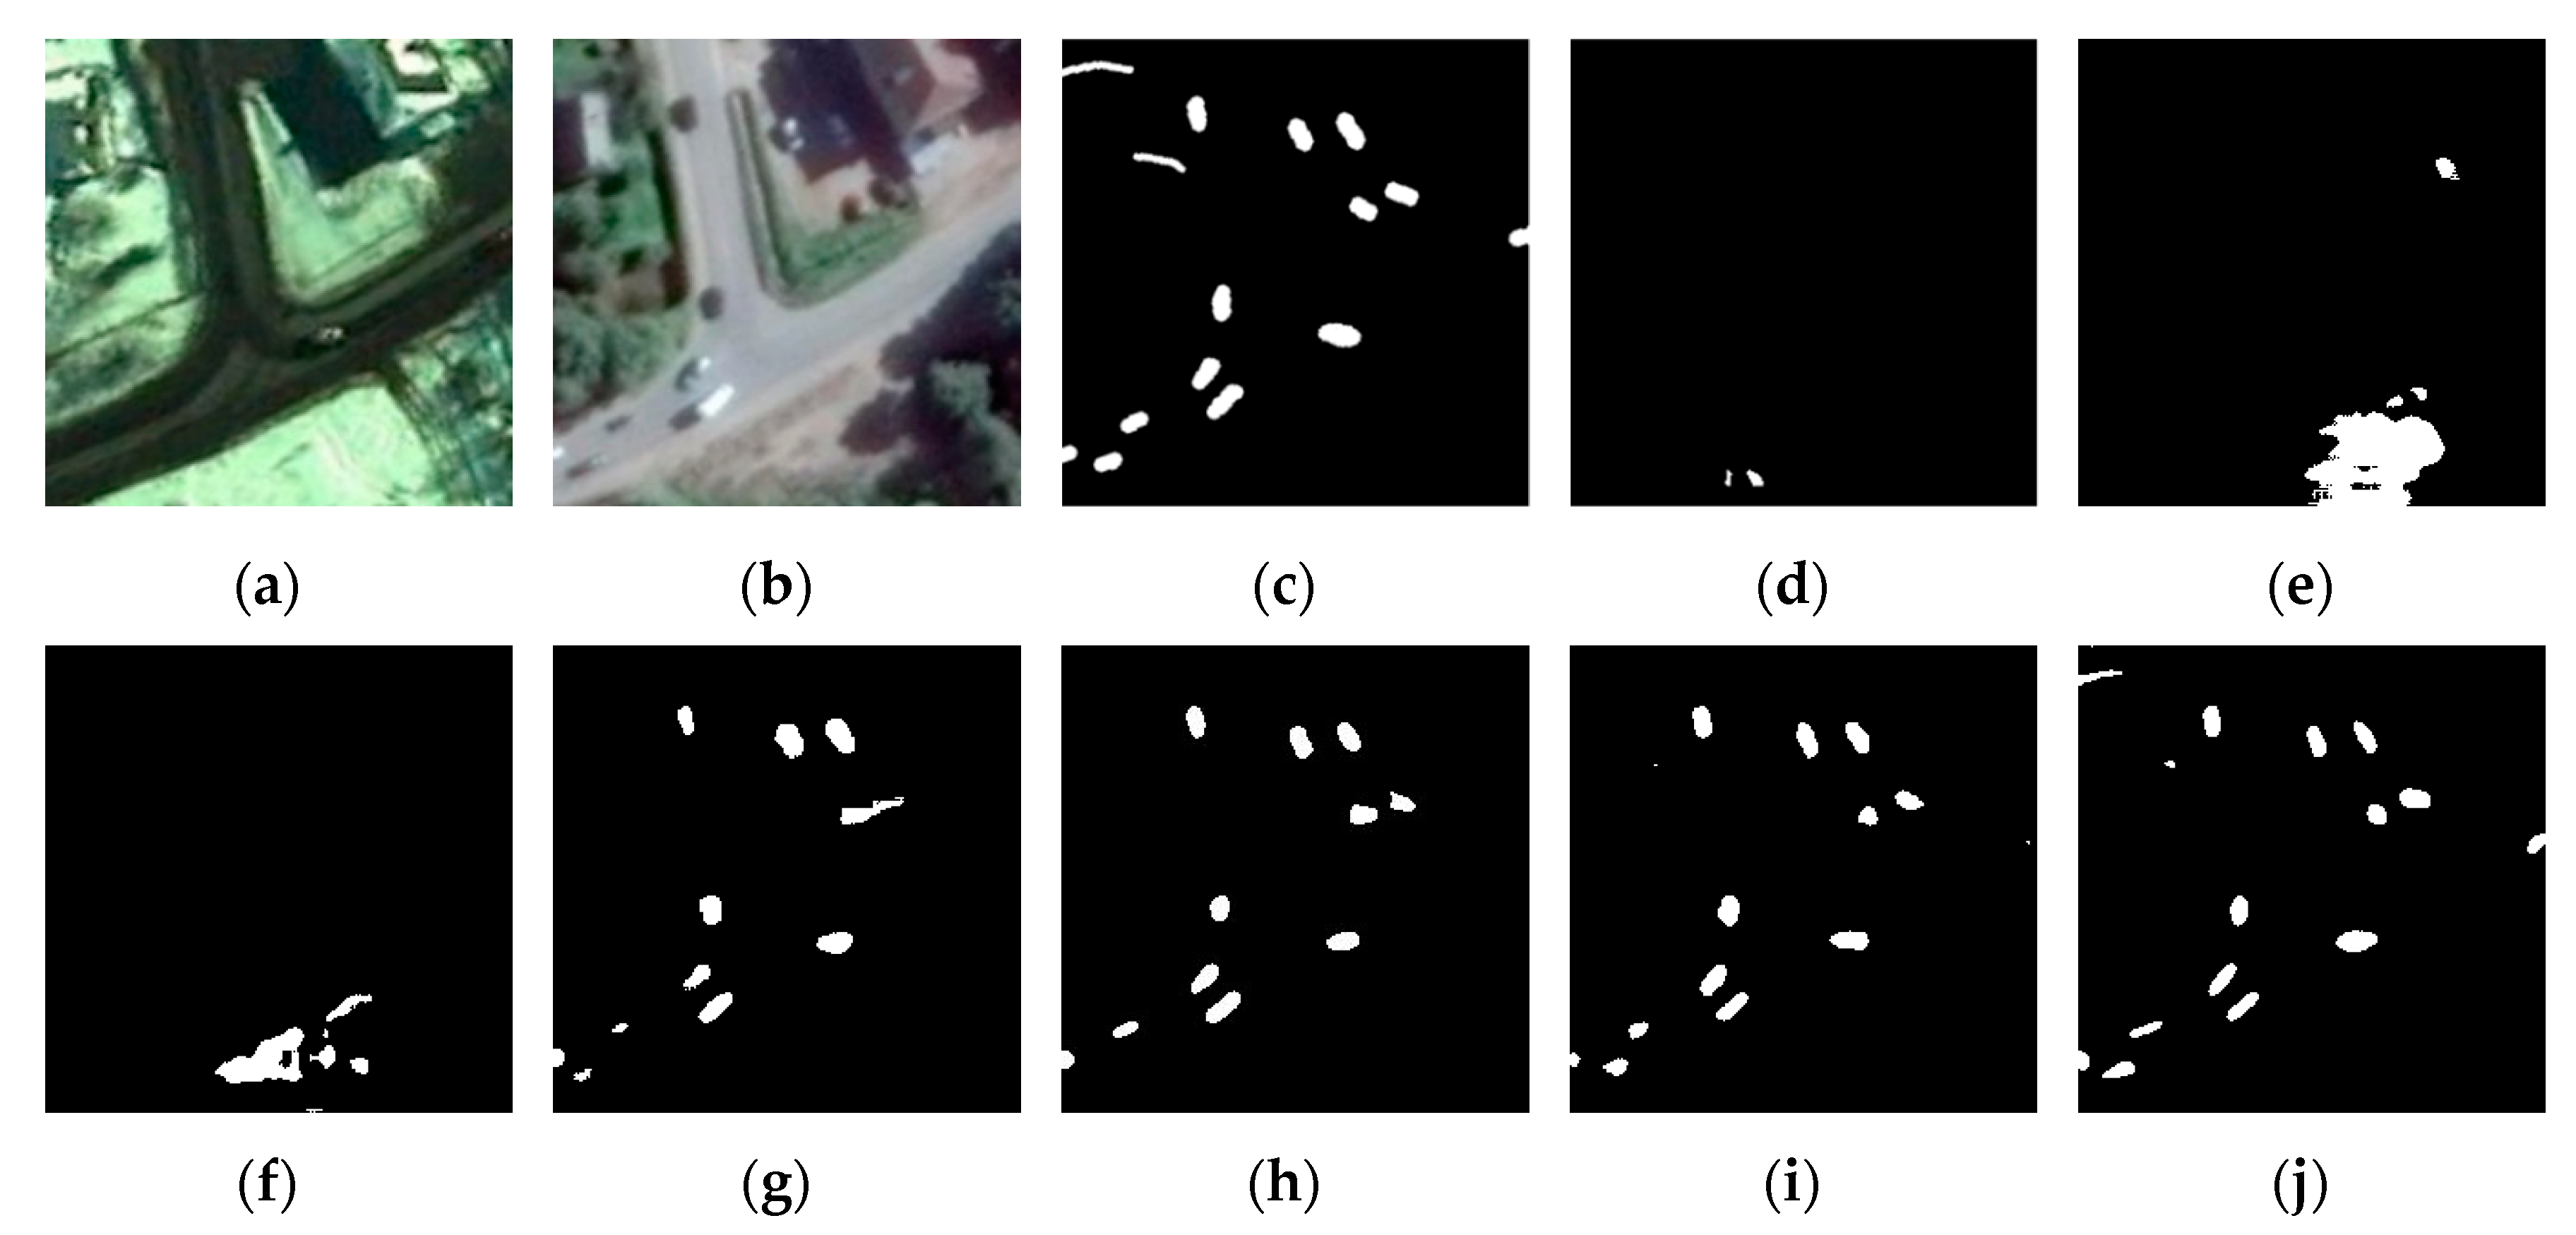
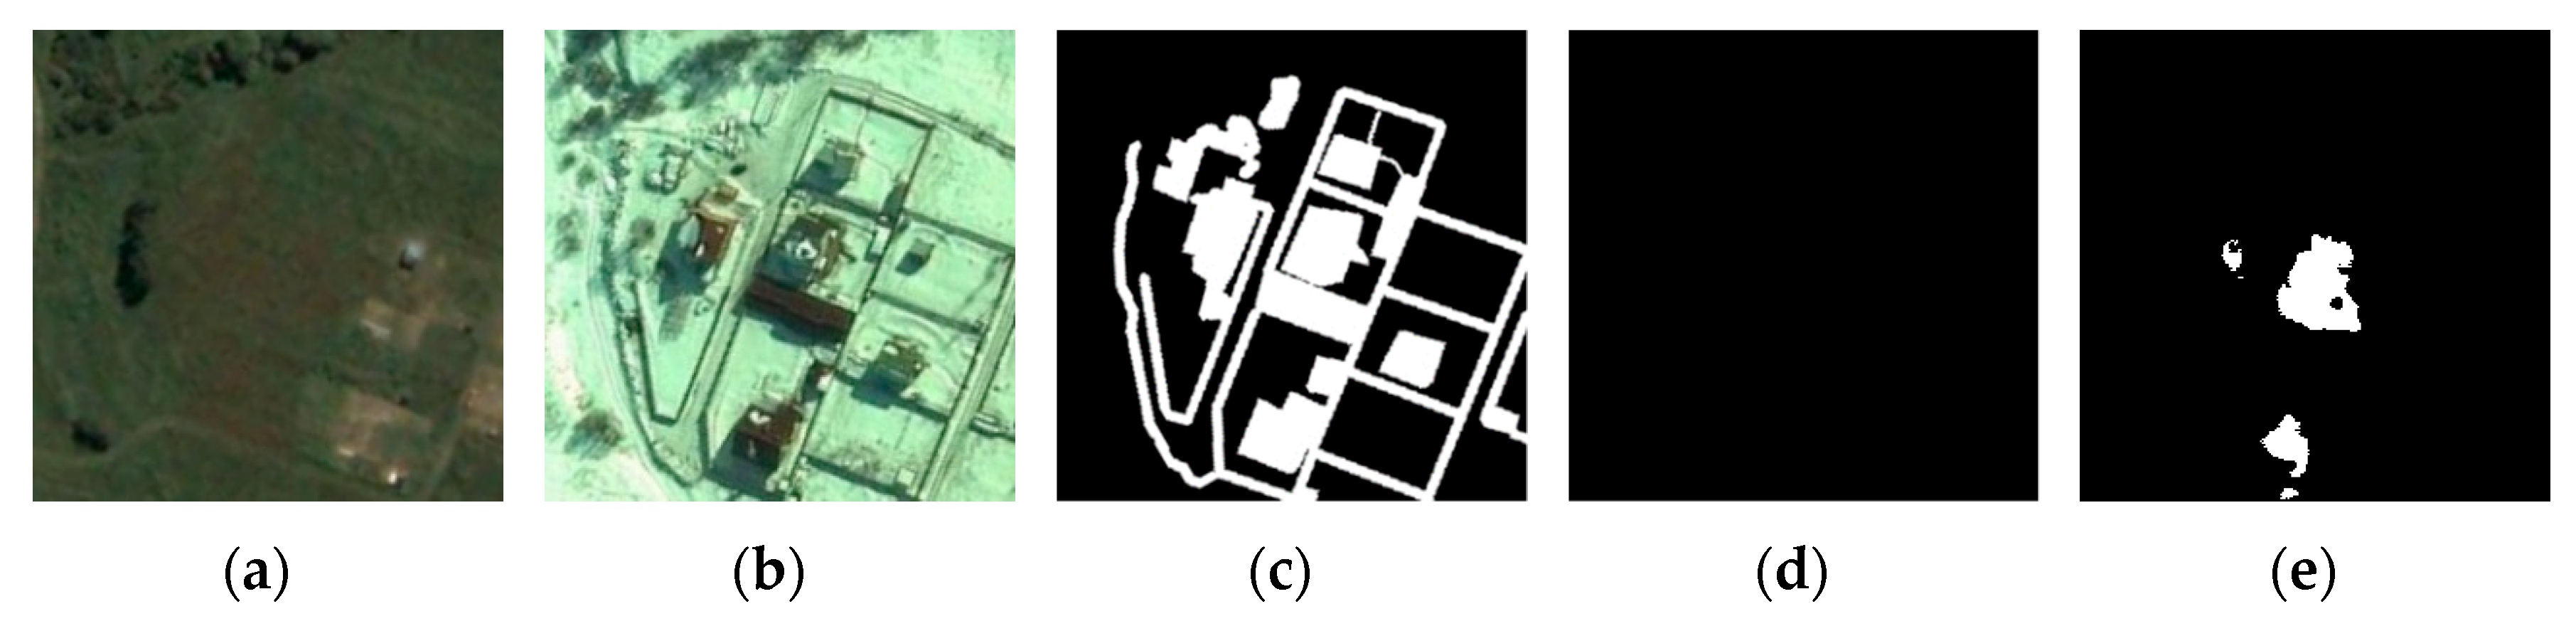
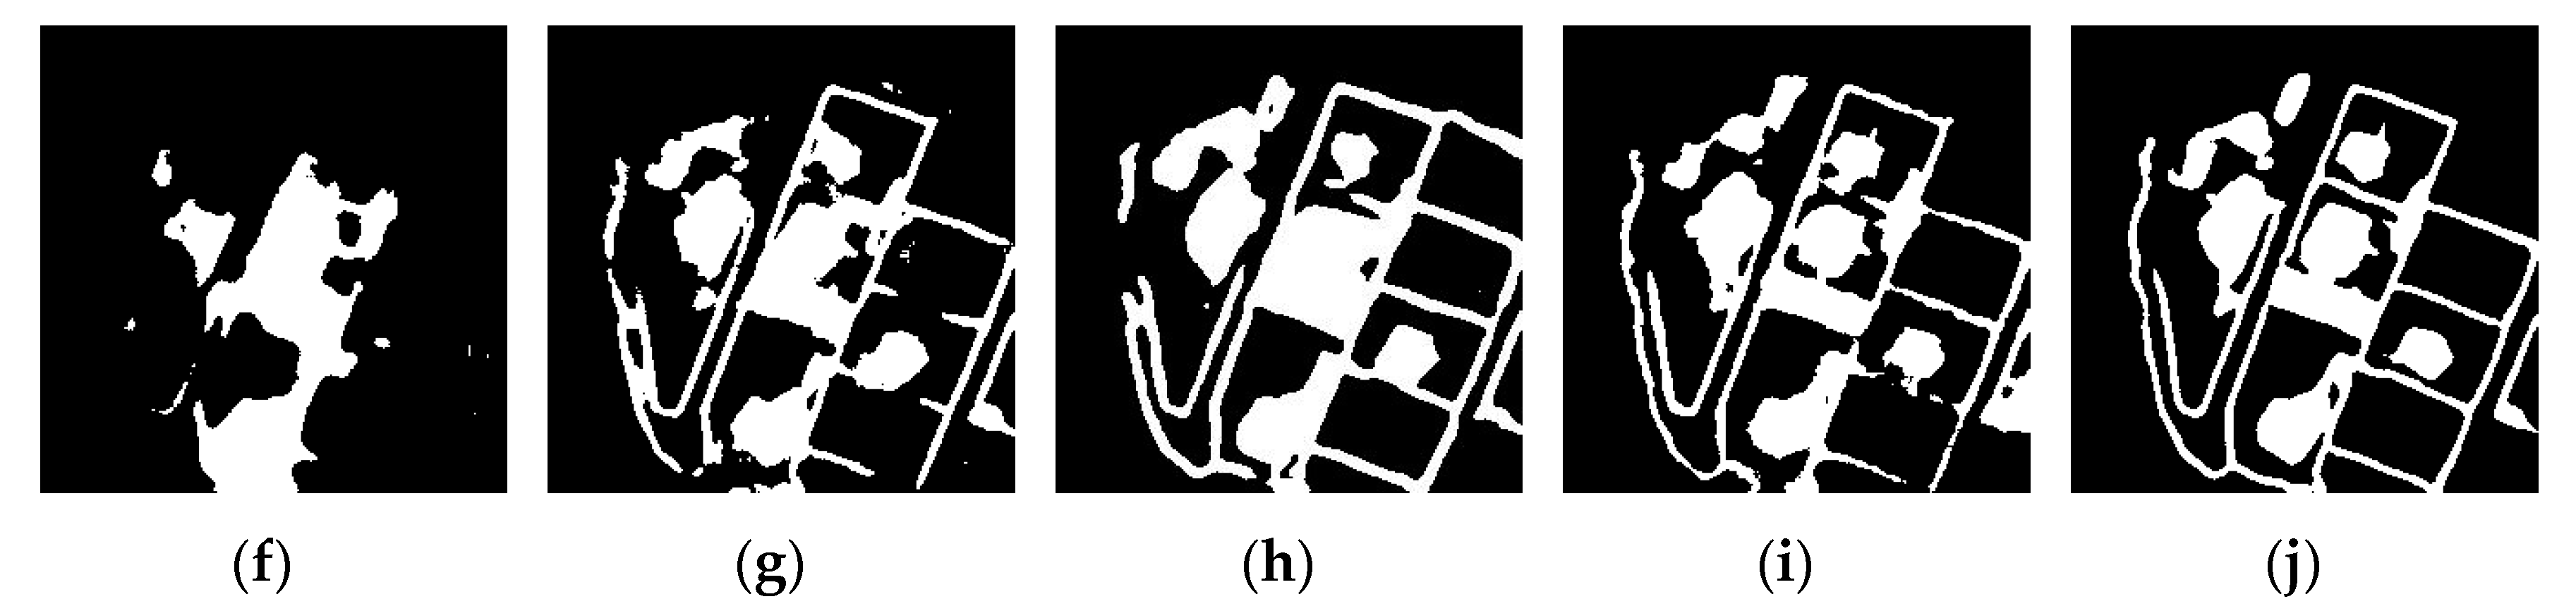
3.2. Comparison Methods

To evaluate the performance of our method, we selected six existing CD methods and compared their performances in the CDD dataset; the selected methods are described as follows:
4.
Fully convolutional early fusion (FC-EF) [38] was proposed for satellite image CD. Dual temporal images were concatenated together as input images. A skip connection is used between the encoder and decoder to supplement the local spatial details after encoding.
5.
Fully convolutional Siamese concatenation (FC-Siam-conc) [38] is a Siamese extension of the FC-EF network. The encoder of the network is divided into two parallel structure streams with shared weights. The bitemporal images are input to the structured stream separately for extracting deep features of the images, and then the extracted features are input to the decoder for CD.
6.
Fully convolutional Siamese difference (FC-Siam-diff) [38] shares a similar network structure with FC-Siam-conc; the only difference is that FC-Siam-diff concatenates the absolute values of the differences between the two parallel structure streams of the encoder, and finally, the decoder outputs CMs.
7.
UNet++_MSOF [40] is proposed for end-to-end VHR satellite image CD based on the UNet++ [41] architecture. The network learns feature maps at different semantic levels through dense connections and residual connections, while an MSOF strategy is employed to combine the multiscale lateral output feature maps.
8.
IFN [42] is a deeply supervised image fusion network that is used for VHR remote sensing image CD. The network feeds bitemporal images into two streams of the same convolutional structure for extracting their respective depth features and then feeds the extracted deep features into a deeply supervised difference discrimination network (DDN) for CD.
9.
SNUNet-CD [43] is a recently proposed densely connected Siamese network that is used for remote sensing image CD. The network can reduce the loss of image information and improve the network image feature extraction capability by dense connection. The network also uses the ECAM module to extract the most representative features in the image, and the experimental results are better. We selected the SNUNet-CD method with a channel size of 32 for comparison.

3.3. Implementation Details

In this study, the network was implemented in the Pytorch framework, and the model was trained and tested on a single NVIDIA GTX 1080 Ti GPU. The specific details of the MRA-SNet architecture are shown in Table 1. The number of layers in a Multi-Res block and the number of channels in a layer were set by referring to [52]. The convolution kernel size was set to 3 × 3 for all the convolution layers except for the residual connection layer in the Multi-Res block, which was 1 × 1, which can effectively improve the computation speed. During training, the weights of each convolutional layer were initialized by Kaiming normalization [56], the batch size was set to 10, Adam [57] was used as the optimizer, the initial learning rate was set to 0.001, and the learning rate decayed by 0.5 every 15 epochs. During the experiment, the model was trained for 150 epochs to achieve convergence.

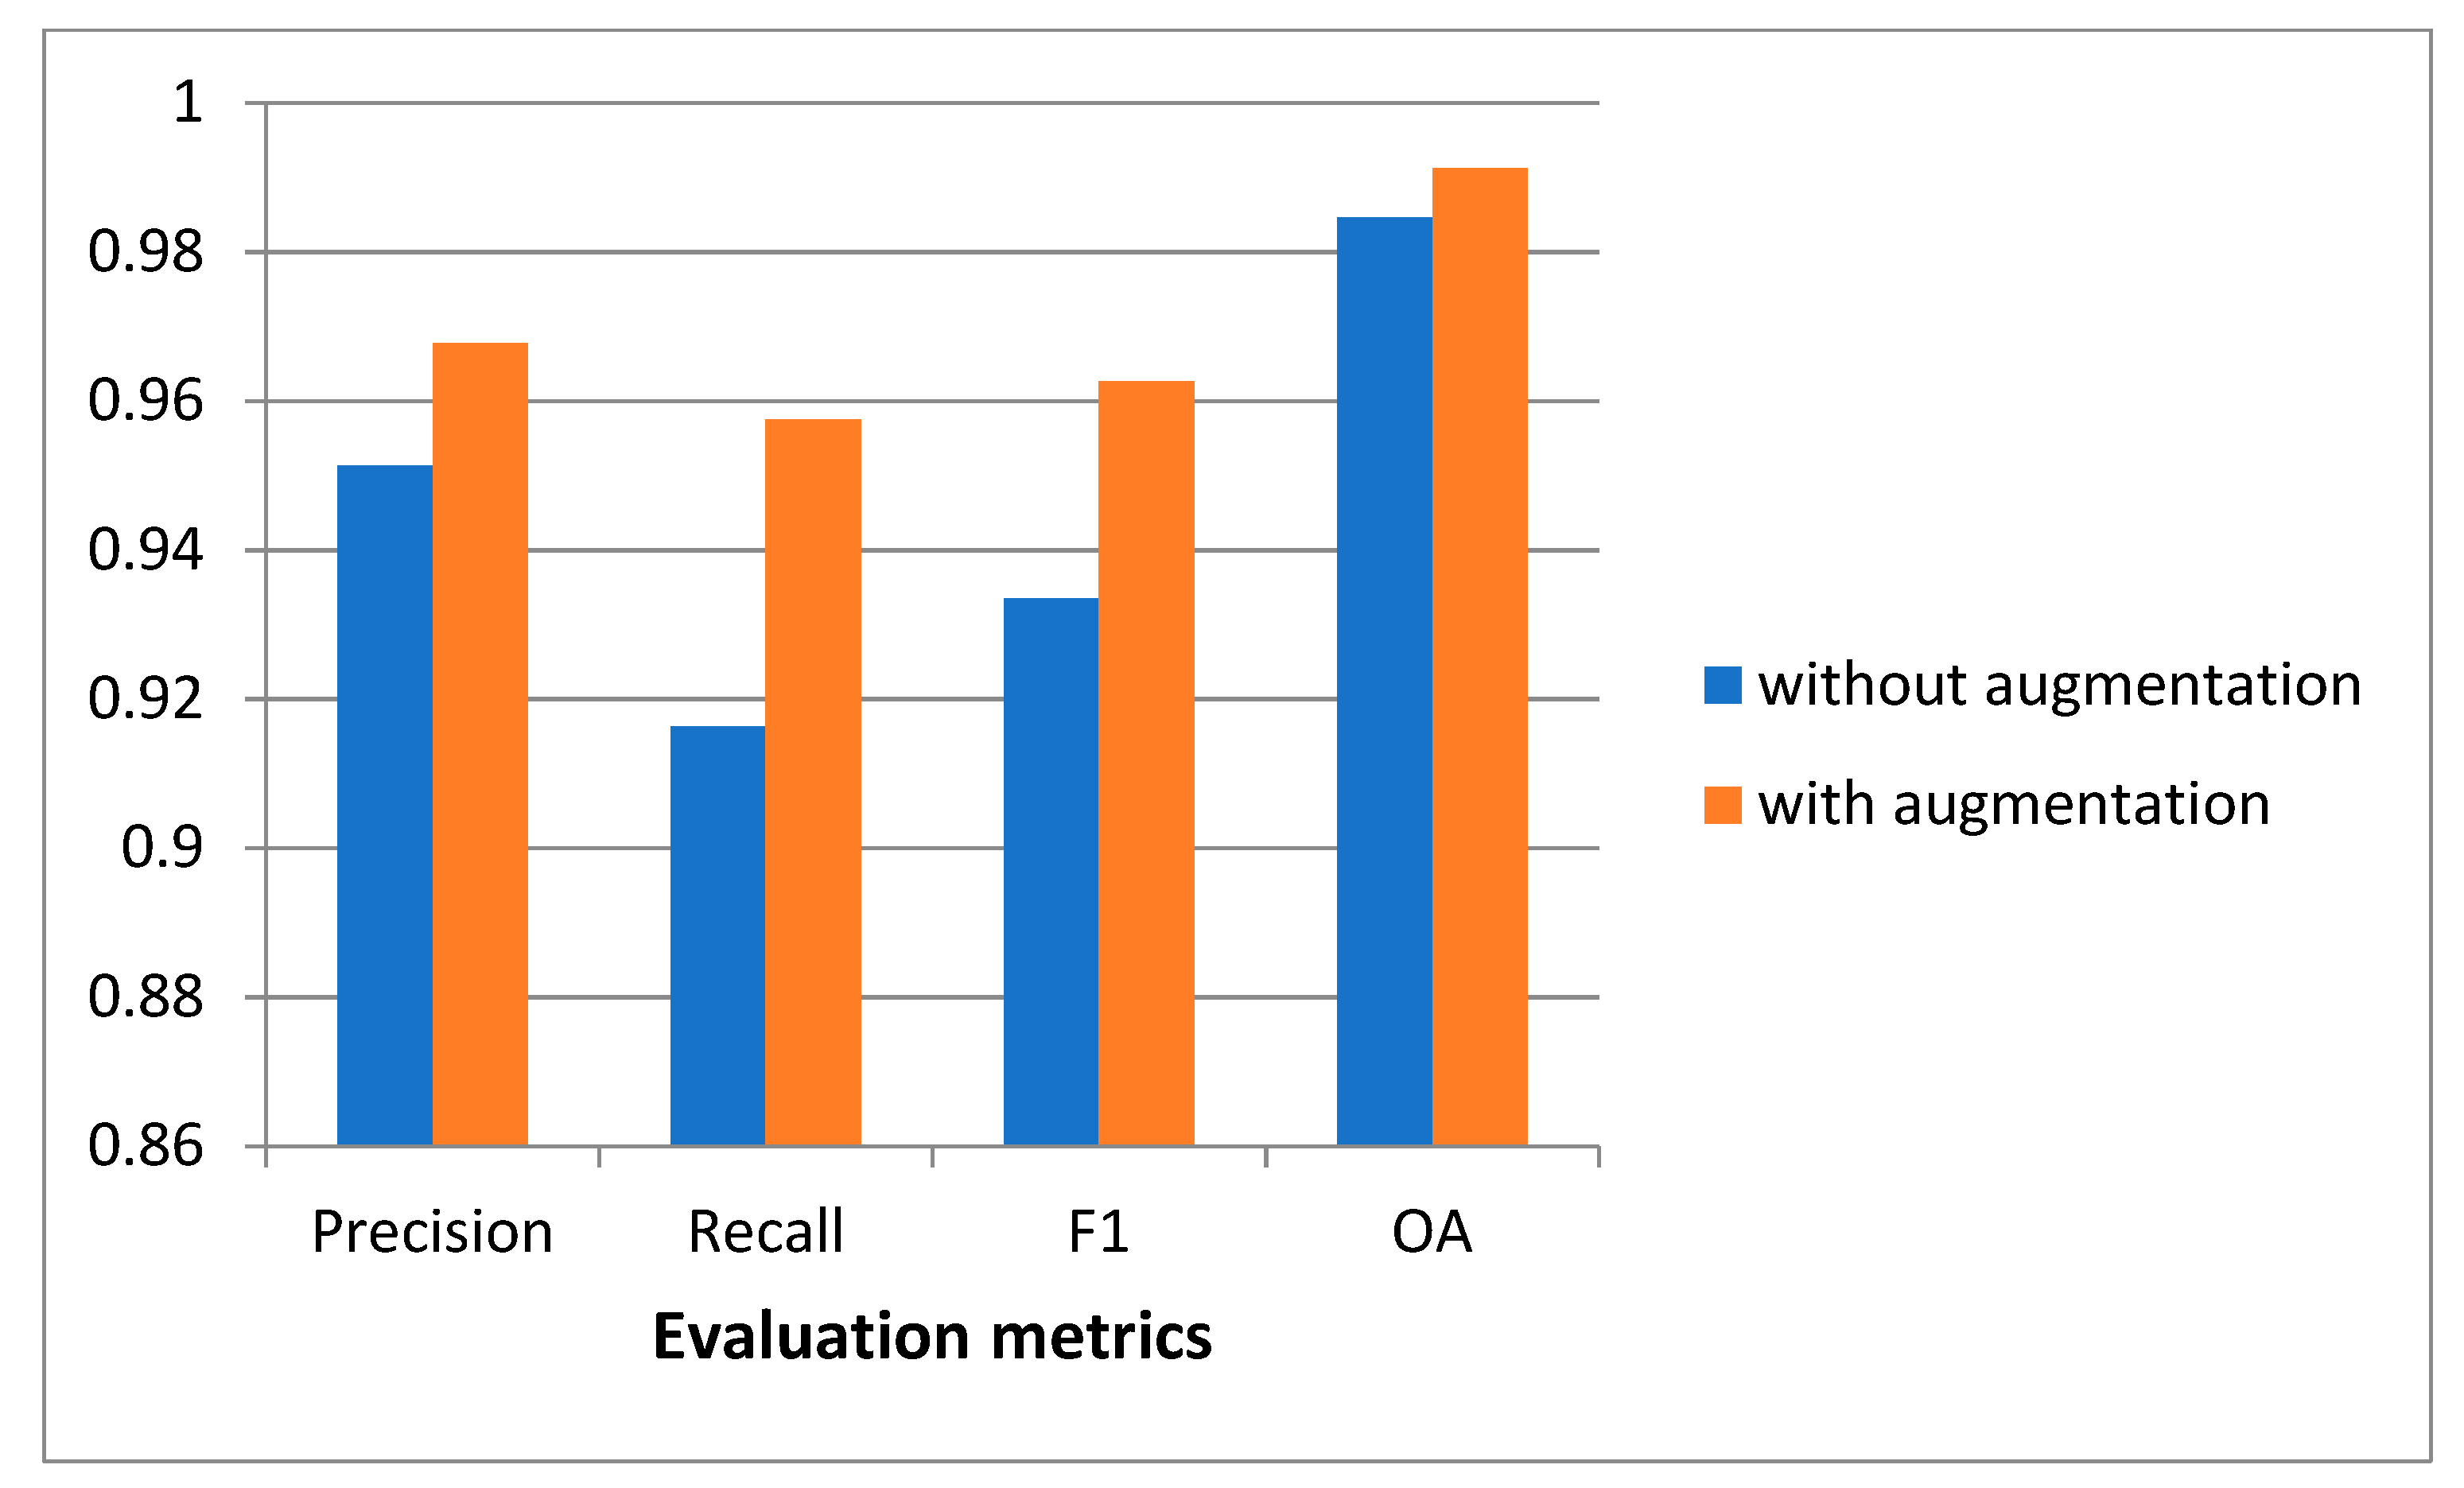
3.4. Ablation Study for the Proposed MRA-SNet

In our method, the Multi-Res block is introduced to extract the rich feature information of images, and the Attention Gates module is introduced to focus on the change region in bitemporal images, which improves the accuracy of CD. We designed corresponding ablation experiments to verify the performance of the Multi-Res block and the Attention Gates module, as shown in Table 2.
According to the analysis in Table 2, the results of the ordinary Siamese UNet network on the CDD dataset for P, R, F1, and OA are 0.9519, 0.9150, 0.9331, and 0.9845, respectively. When we replace the ordinary convolution block with the Multi-Res block, the values of P, R, F1, and OA are 0.9645, 0.9527, 0.9586, and 0.9903, respectively, which are 1.26%, 3.77%, 2.55%, and 0.58% better than the ordinary Siamese UNet network in terms of P, R, F1, and OA metrics, respectively. When we add the Attention Gates module before the skip connection between the encoder and the decoder, we obtain the P, R, F1, and OA of 0.9586, 0.9371, 0.9477, and 0.9878, respectively. The addition of the Attention Gates module to the Siamese UNet improved the P, R, F1, and OA metrics by 0.67%, 2.21%, 1.46%, and 0.33%, respectively, compared to the ordinary Siamese UNet network. When the Multi-Res block and the Attention Gates module are added to the network simultaneously, the overall network performance is further improved, with P, R, F1, and OA values of 0.9677, 0.9575, 0.9626, and 0.9912, respectively. In the MRA-SNet network compared to the ordinary Siamese UNet network, the P, R, F1, and OA metrics are improved by 1.58%, 4.25%, 2.95%, and 0.67%, respectively.
Meanwhile, we made a visual comparison of each module in the ablation experiment in terms of CD performance, as shown in Figure 5. Figure 5 selects five representative sets of pictures in the test set. According to our observations, the performance of Siamese UNet is not adequate (Figure 5d). The reason is that the ordinary convolution block in the Siam-UNet network may not extract the rich feature information in the bitemporal remote sensing images well. After adding the Attention Gates module to Siamese UNet, the visual effect is improved to some extent (Figure 5e) because the Attention Gates module can better focus on the information of change features in the bitemporal remote sensing images. After replacing the ordinary convolution block in Siamese UNet with the Multi-Res block, the visual effect is better improved (Figure 5f) because the Multi-Res block can better extract multiscale feature information and some extra detailed feature information. When the Multi-Res block and the Attention Gates module are added to the Siamese UNet network at the same time, the visual effect is the best (Figure 5g), which can better detect the object changes in the bitemporal remote sensing images and is closer to the ground truth.

3.5. Comparison Experiments

To verify the performance of our proposed method for remote sensing image CD, in Figure 6, Figure 7, Figure 8, Figure 9 and Figure 10, we show five typical test areas, including changes in houses, roads, vehicles, small target objects, and complex ground objects. A subjective visual comparison with the other selected CD methods shows that our proposed method works best (Figure 6j, Figure 7j, Figure 8j, Figure 9j and Figure 10j) and is in general agreement with the reference ground truth (Figure 6c, Figure 7c, Figure 8c, Figure 9c and Figure 10c). At the same time, the CM obtained by our proposed method is superior to other comparison methods in terms of boundary accuracy, missed detection, and false detection. It can be seen from Figure 6 that our proposed method can accurately detect the boundary and internal structure of the house and has appropriate performance in large-size object detection. In Figure 7, we can see that some other methods suffer from undetectable changes, missed detection, and incomplete detection on curved and slender roads, while our proposed method can accurately detect the contour and location of the road, which is essentially consistent with the reference ground truth. Meanwhile, our method also has better detection performance and advantages for CD of small-scale targets, such as the change in the car in Figure 8 and Figure 9; our method can more accurately detect the boundary and location of the car compared with other methods. In addition, our method outperforms other comparison methods in the detection of complex ground object features. As shown in Figure 10, our method can accurately detect the overall structure of houses and the outline of roads in complex feature information such as houses and roads. Figure 6a,b, Figure 7a,b, Figure 8a,b, Figure 9a,b and Figure 10a,b correspond to the bitemporal images of different seasons. The experimental results show that our proposed method can better overcome the influence of seasonal changes.
At the same time, we made a quantitative comparison between the proposed method and the comparison methods and calculated four metrics for the quantitative analysis, namely P, R, F1, and OA, as shown in Table 3. The analysis of the values of metrics in Table 3 shows that the FC-EF method obtained the lowest F1 and OA values among the seven methods: 0.6514 and 0.9315, respectively. One possible reason is that the FC-EF network uses a small depth of convolutional kernel, which cannot adequately capture the rich feature information of the image. The FC-Siam-conc method and the FC-Siam-diff method use the Siamese structure and are Siamese extensions of the FC-EF network. Compared with the FC-EF method, the CD results obtained by the FC-Siam-conc and FC-Siam-diff methods increased by 4.09% and 5.59% in F1 values and 0.43% and 1.03% in OA values, respectively. The reason why the metrics are improved is that they both use the Siamese network structure in the encoder and share the weight, which enables better capture of feature information of the images. At the same time, the Siamese network FC-Siam-diff based on differential connections is better than the FC-Siam-diff network. Compared with the FC-Siam-diff method, the F1 and OA of the UNet++_MSOF method are improved by 16.83% and 2.55%, respectively. The reason for such a large improvement is that the UNet++ network uses dense skip connections to be able to learn multiscale features of images, and it uses residual connections to better capture detailed information. Compared with the UNet++_MSOF method, the F1 and OA of the IFN method increased by 2.74% and 0.98%, respectively. The reasons lie in the fact that the IFN method uses a difference discrimination network in the decoder for generating CMs and uses deep supervision and attention modules to improve the accuracy of CD. The SNUNet-CD/32 method improves F1 by 4.89% and OA by 1.16% compared to the IFN method, which introduces the Siamese network structure and ensemble channel attention module based on UNet++ for improving the accuracy of CD.
It is worth noting that the CD method proposed in this article achieved the best results among all the compared methods, and its P, R, F1, and OA values were 0.9677, 0.9575, 0.9626, and 0.9912, respectively. Compared with the SNUNet-CD/32 method, which has the best performance in the comparison methods, our proposed method improves the F1 and OA values by 1.07% and 0.25%, respectively. The reasons for achieving the best performance are as follows: First, this network replaces the ordinary convolution block of the UNet network with the Multi-Res block, which can learn features and semantic information from different scales. At the same time, the residual connection can enable the network to train deeper and capture more detailed information. Second, this method uses the Siamese network structure in the encoder and performs differential connections, which can better generate the CM of CD. Third, this method adds the Attention Gates module before the skip connection between the encoder and decoder, which can better focus on the changing features and suppress the irrelevant areas.
Figure 11 shows the number of parameters for different CD comparison methods. We can conclude that FC-EF has the smallest number of parameters, but also the lowest performance. IFN has the largest number of parameters at 35.72 M, but the performance is still lower than that of the SNUNet-CD/32 method. It is worth noting that our proposed method is the strongest in terms of performance with its number of parameters at only 9.47 M, which achieves a better balance between network performance and the number of parameters.
Figure 12 shows the FLOPs of our proposed method and the comparison methods. FLOPs can be used to measure the complexity and computational complexity of a network model. By comparison, we can conclude that the three networks FC-EF, FC-Siam-conc, and FC-Siam-diff have low FLOPs and poor performance with the smallest number of parameters. Compared with the first three networks, the value of FLOPs of the UNet++_MSOF network was improved, reaching 100 G, and the performance was also improved. The IFN network has the largest value of FLOPs at 164.5 G. The SNUNet-CD/32 network has a FLOPs value of 109 G and performs better in terms of performance. The FLOPs value of our proposed method is only 33.6 G, but it has the best performance. This indicates that the method in this article can achieve a balance between network performance and calculated amount.

4. Discussion

The traditional CD method generally uses threshold segmentation and cluster analysis to generate the final CM. However, as the resolution of remote sensing images increases, the traditional CD method is not suitable for processing HR remote sensing images. Inspired by the application of DL technology to CD tasks, we propose a novel end-to-end remote sensing image CD network structure named MRA-SNet for remote sensing image CD tasks. MRA-SNet uses UNet as the basic network and replaces the ordinary convolution block in the UNet network with the Multi-Res block. In addition, the Attention Gates module is added before the skip connection. The network can not only extract multiscale feature information, but also make the change features more prominent, while reducing the number of network parameters.
The validity of the proposed CD method is verified on the remote sensing image dataset CDD, and the advantage of our method is confirmed by quantitative and qualitative analysis with other SOTA methods. The crucial reason why the proposed method achieves better performance in CD is the introduction of the Multi-Res block and the Attention Gates module. It is known from the analysis that ordinary convolution blocks can often extract only a single image feature. However, HR remote sensing images have rich spectral information and texture information, and it is difficult to extract remote sensing images well by using ordinary convolution blocks. Inspired by the Inception network and residual network, we introduced the Multi-Res block to replace ordinary convolutional blocks. Using Multi-Res block can better extract rich remote sensing image features and is robust to changes in objects of different scales and sizes and seasonal changes. It can detect changes in objects ranging from small cars to large buildings and can learn the seasonal changes. In addition, compared with the UNet network, the Multi-Res block reduces the number of parameters by reducing the size of convolutional kernels, which makes the whole network lighter and more efficient to train. More importantly, the Multi-Res block does not sacrifice its performance. In the CD task, we need to determine how to better highlight the various features and suppress the irrelevant features. In this article, through the Siamese network, we extract the bitemporal image features separately and take the absolute values of their differences to feed into the decoder. Before the skip connection in the encoder and decoder, the Attention Gates module is added to highlight the change features and better generate the CM. It is worth noting that the CD method we proposed has a relatively low computational cost, and it only takes 0.03 s on average to predict a 256 × 256 pixel image.
We discuss the loss function parameter λ to verify the effect of the value of λ on the CD results. We set the parameter λ to the five values of 0, 0.25, 0.5, 0.75, and 1 and calculated their corresponding evaluation metrics, as shown in Figure 13. When the parameter λ is 0, the values of evaluation indicators P, R, F1, and OA are relatively low. With the increase in the value of parameter λ , the four evaluation metrics increase accordingly, which illustrates that the combination of the binary cross-entropy loss and dice coefficient loss has an improving effect on the results of CD. The best results for P, R, F1, and OA are obtained when the value of λ is 1. Therefore, in the experiments presented in this article, the parameters λ of the balanced binary cross-entropy loss function and dice coefficient loss function were set to 1.
Regarding the impact of data augmentation strategies on the results of CD experiments, during the experiments presented in this article, we used a data augmentation strategy to perform random horizontal flips, random vertical flips, and random fixed rotations on the dataset. The analysis in Figure 14 shows that using the data augmentation strategy is better than not using the data augmentation strategy in terms of evaluation metrics when all other conditions are kept consistent. Therefore, data augmentation is one of the factors that enhances the performance metrics of the method proposed in this article.
However, the proposed method also has some limitations. The method in this article requires a large amount of data as training samples, and due to the different sizes and locations of different object changes, it is necessary to obtain enough labeled accurate CMs, which takes a lot of time. In the future, we should consider using transfer learning, unsupervised learning, and semi-supervised learning for remote sensing image CD tasks because these methods can solve the problem of limited training samples.

5. Conclusions

In this article, a Siamese networks of multiscale residual and attention, MRA-SNet, is proposed for HR remote sensing image CD. We used the UNet network as the basic network and replaced the ordinary convolution block with the Multi-Res block, which can learn features of different scales and semantic information. At the same time, the residual connection can enable the network to train deeper and capture more detailed information. In the encoder, we used the Siamese network structure and performed the difference connection, which better generated the difference maps of the bitemporal remote sensing images. We added the Attention Gates module before the skip connection between the encoder and decoder, and the Attention Gates module can better focus on the changing features and suppress the irrelevant features in the bitemporal images. To reduce the imbalance effect of the sample data, we effectively combined the binary cross-entropy loss and the dice coefficient loss to form a hybrid loss function. Compared with other compared methods, our proposed method performs best on the CDD dataset, achieving optimal results in both visual comparisons and quantitative metric evaluations. The proposed method requires a large number of references of ground truth as a prerequisite, which has some limitations on the wide application of CD. In the future, we will further investigate unsupervised and self-supervised learning to improve the flexibility and robustness of CD.

Author Contributions

Conceptualization, X.Y. and L.H.; methodology, X.Y. and L.H.; validation, X.Y., Y.Z. and Y.L.; formal analysis, X.Y.; investigation, X.Y. and L.H.; data curation, Y.Z. and Y.L.; writing—original draft preparation, X.Y.; writing—review and editing, X.Y., L.H. and Y.Z.; visualization, X.Y.; funding acquisition, L.H. All authors have read and agreed to the published version of the manuscript.

Funding

This research was funded by the National Natural Science Foundation of China, grant number 61662033 and 61371143.

Data Availability Statement

The data used in this study are open datasets. The dataset can be downloaded from https://drive.google.com/file/d/1GX656JqqOyBi_Ef0w65kDGVto-nHrNs9/edit (accessed on 15 April 2021).

Acknowledgments

The authors thank the anonymous reviewers for their constructive and valuable suggestions on the earlier drafts of this manuscript.

Conflicts of Interest

The authors declare no conflict of interest.

Abbreviations

The following abbreviations are used in this manuscript:
CDchange detection
HRhigh-resolution
SOTAstate-of-the-art
PBCDpixel-based change detection
OBCDobject-based change detection
CVAchange vector analysis
PCAprincipal component analysis
MADmultivariate alteration detection
CRFconditional random field
MRFMarkov random field
DLdeep learning
CNNconvolutional neural network
FC-EFfully convolutional early fusion
FC-Siam-concfully convolutional Siamese concatenation
FC-Siam-difffully convolutional Siamese difference
IFNimage fusion network
ECAMensemble channel attention module
CMchange map
CMschange maps
CDDchange detection dataset
DDNdifference discrimination network

References

  1. Ball, J.; Anderson, D.; Chan, C.S., Sr. A Comprehensive survey of deep learning in remote sensing: Theories, tools, and challenges for the community. J. Appl. Remote Sens. 2017, 11, 042609. [Google Scholar] [CrossRef] [Green Version]
  2. Ma, L.; Liu, Y.; Zhang, X.; Ye, Y.; Yin, G.; Johnson, B.A. Deep learning in remote sensing applications: A meta-analysis and review. ISPRS-J. Photogramm. Remote Sens. 2019, 152, 166–177. [Google Scholar] [CrossRef]
  3. Singh, A. Review Article Digital change detection techniques using remotely-sensed data. Int. J. Remote Sens. 1989, 10, 989–1003. [Google Scholar] [CrossRef] [Green Version]
  4. Xian, G.; Homer, C.; Fry, J. Updating the 2001 National Land Cover Database land cover classification to 2006 by using Landsat imagery change detection methods. Remote Sens. Environ. 2009, 113, 1133–1147. [Google Scholar] [CrossRef] [Green Version]
  5. Lv, Z.Y.; Shi, W.; Zhang, X.; Benediktsson, J.A. Landslide inventory mapping from bitemporal high-resolution remote sensing images using change detection and multiscale segmentation. IEEE J. Sel. Top. Appl. Earth Observ. Remote Sens. 2018, 11, 1520–1532. [Google Scholar] [CrossRef]
  6. Sofina, N.; Ehlers, M. Building change detection using high resolution remotely sensed data and GIS. IEEE J. Sel. Top. Appl. Earth Observ. Remote Sens. 2016, 9, 3430–3438. [Google Scholar] [CrossRef]
  7. Coppin, P.; Jonckheere, I.; Nackaerts, K.; Muys, B.; Lambin, E. Review ArticleDigital change detection methods in ecosystem monitoring: A review. Int. J. Remote Sens. 2004, 25, 1565–1596. [Google Scholar] [CrossRef]
  8. Fichera, C.R.; Modica, G.; Pollino, M. Land Cover classification and change-detection analysis using multi-temporal remote sensed imagery and landscape metrics. Eur. J. Remote Sens. 2012, 45, 1–18. [Google Scholar] [CrossRef]
  9. Luo, H.; Liu, C.; Wu, C.; Guo, X. Urban change detection based on Dempster–Shafer theory for multitemporal very high-resolution imagery. Remote Sens. 2018, 10, 980. [Google Scholar] [CrossRef] [Green Version]
  10. Lu, D.; Mausel, P.; Brondizio, E.; Moran, E. Change detection techniques. Int. J. Remote Sens. 2004, 25, 2365–2401. [Google Scholar] [CrossRef]
  11. Brunner, D.; Lemoine, G.; Bruzzone, L. Earthquake damage assessment of buildings using VHR optical and SAR imagery. IEEE Trans. Geosci. Remote Sensing 2010, 48, 2403–2420. [Google Scholar] [CrossRef] [Green Version]
  12. Hussain, M.; Chen, D.; Cheng, A.; Wei, H.; Stanley, D. Change detection from remotely sensed images: From pixel-based to object-based approaches. ISPRS-J. Photogramm. Remote Sens. 2013, 80, 91–106. [Google Scholar] [CrossRef]
  13. Bruzzone, L.; Prieto, D.F. Automatic analysis of the difference image for unsupervised change detection. IEEE Trans. Geosci. Remote Sens. 2000, 38, 1171–1182. [Google Scholar] [CrossRef] [Green Version]
  14. Celik, T. Unsupervised change detection in satellite images using principal component analysis and k-means clustering. IEEE Geosci. Remote Sens. Lett. 2009, 6, 772–776. [Google Scholar] [CrossRef]
  15. Deng, J.S.; Wang, K.; Deng, Y.H.; Qi, G.J. PCA-based land-use change detection and analysis using multitemporal and multisensor satellite data. Int. J. Remote Sens. 2008, 29, 4823–4838. [Google Scholar] [CrossRef]
  16. Nielsen, A.A.; Conradsen, K.; Simpson, J.J. Multivariate alteration detection (MAD) and MAF postprocessing in multispectral, bitemporal image data: New approaches to change detection studies. Remote Sens. Environ. 1998, 64, 1–19. [Google Scholar] [CrossRef] [Green Version]
  17. Nielsen, A.A. The regularized iteratively reweighted MAD method for change detection in multi-and hyperspectral data. IEEE Trans. Image Process. 2007, 16, 463–478. [Google Scholar] [CrossRef] [PubMed] [Green Version]
  18. Wu, C.; Du, B.; Cui, X.; Zhang, L. A post-classification change detection method based on iterative slow feature analysis and Bayesian soft fusion. Remote Sens. Environ. 2017, 199, 241–255. [Google Scholar] [CrossRef]
  19. Huang, C.; Song, K.; Kim, S.; Townshend, J.R.; Davis, P.; Masek, J.G.; Goward, S.N. Use of a dark object concept and support vector machines to automate forest cover change analysis. Remote Sens. Environ. 2008, 112, 970–985. [Google Scholar] [CrossRef]
  20. Volpi, M.; Tuia, D.; Bovolo, F.; Kanevski, M.; Bruzzone, L. Supervised change detection in VHR images using contextual information and support vector machines. Int. J. Appl. Earth Obs. Geoinf. 2013, 20, 77–85. [Google Scholar] [CrossRef]
  21. Cao, G.; Li, Y.; Liu, Y.; Shang, Y. Automatic change detection in high-resolution remote-sensing images by means of level set evolution and support vector machine classification. Int. J. Remote Sens. 2014, 35, 6255–6270. [Google Scholar] [CrossRef]
  22. Lafferty, J.; McCallum, A.; Pereira, F.C. Conditional random fields: Probabilistic models for segmenting and labeling sequence data. In Proceedings of the 18th International Conference on Machine Learning (ICML), Williamstown, MA, USA, 28 June–1 July 2001; pp. 282–289. [Google Scholar]
  23. Li, S.Z. Markov random field models in computer vision. In Proceedings of the European Conference on Computer Vision (ECCV), Stockholm, Sweden, 2–6 May 1994; pp. 361–370. [Google Scholar]
  24. Benedek, C.; Szirányi, T. Change detection in optical aerial images by a multilayer conditional mixed Markov model. IEEE Trans. Geosci. Remote Sens. 2009, 47, 3416–3430. [Google Scholar] [CrossRef] [Green Version]
  25. Moser, G.; Angiati, E.; Serpico, S.B. Multiscale unsupervised change detection on optical images by Markov random fields and wavelets. IEEE Geosci. Remote Sens. Lett. 2011, 8, 725–729. [Google Scholar] [CrossRef]
  26. Hoberg, T.; Rottensteiner, F.; Feitosa, R.Q.; Heipke, C. Conditional random fields for multitemporal and multiscale classification of optical satellite imagery. IEEE Trans. Geosci. Remote Sens. 2014, 53, 659–673. [Google Scholar] [CrossRef]
  27. Zhou, L.; Cao, G.; Li, Y.; Shang, Y. Change detection based on conditional random field with region connection constraints in high-resolution remote sensing images. IEEE J. Sel. Top. Appl. Earth Observ. Remote Sens. 2016, 9, 3478–3488. [Google Scholar] [CrossRef]
  28. Ma, L.; Li, M.; Blaschke, T.; Ma, X.; Tiede, D.; Cheng, L.; Chen, D. Object-based change detection in urban areas: The effects of segmentation strategy, scale, and feature space on unsupervised methods. Remote Sens. 2016, 8, 761. [Google Scholar] [CrossRef] [Green Version]
  29. Zhang, Y.; Peng, D.; Huang, X. Object-based change detection for VHR images based on multiscale uncertainty analysis. IEEE Geosci. Remote Sens. Lett. 2017, 15, 13–17. [Google Scholar] [CrossRef]
  30. Zhang, C.; Li, G.; Cui, W. High-resolution remote sensing image change detection by statistical-object-based method. IEEE J. Sel. Top. Appl. Earth Observ. Remote Sens. 2018, 11, 2440–2447. [Google Scholar] [CrossRef]
  31. Hinton, G.; Deng, L.; Yu, D.; Dahl, G.E.; Mohamed, A.-R.; Jaitly, N.; Senior, A.; Vanhoucke, V.; Nguyen, P.; Sainath, T.N.; et al. Deep neural networks for acoustic modeling in speech recognition: The shared views of four research groups. IEEE Signal Process. Mag. 2012, 29, 82–97. [Google Scholar] [CrossRef]
  32. Noda, K.; Yamaguchi, Y.; Nakadai, K.; Okuno, H.G.; Ogata, T. Audio-visual speech recognition using deep learning. Appl. Intell. 2015, 42, 722–737. [Google Scholar] [CrossRef] [Green Version]
  33. Krizhevsky, A.; Sutskever, I.; Hinton, G.E. ImageNet classification with deep convolutional neural networks. Commun. ACM 2017, 60, 84–90. [Google Scholar] [CrossRef]
  34. Zeiler, M.D.; Fergus, R. Visualizing and understanding convolutional networks. In Proceedings of the European Conference on Computer Vision (ECCV), Zurich, Switzerland, 6–12 September 2014; pp. 818–833. [Google Scholar]
  35. Karpathy, A.; Toderici, G.; Shetty, S.; Leung, T.; Sukthankar, R.; Fei-Fei, L. Large-scale video classification with convolutional neural networks. In Proceedings of the IEEE Conference on Computer Vision and Pattern Recognition (CVPR), Columbus, OH, USA, 24–27 June 2014; pp. 1725–1732. [Google Scholar]
  36. Li, X.; Du, Z.; Huang, Y.; Tan, Z. A deep translation (GAN) based change detection network for optical and SAR remote sensing images. ISPRS-J. Photogramm. Remote Sens. 2021, 179, 14–34. [Google Scholar] [CrossRef]
  37. LeCun, Y.; Bottou, L.; Bengio, Y.; Haffner, P. Gradient-based learning applied to document recognition. Proc. IEEE 1998, 86, 2278–2324. [Google Scholar] [CrossRef] [Green Version]
  38. Daudt, R.C.; Le Saux, B.; Boulch, A. Fully convolutional siamese networks for change detection. In Proceedings of the IEEE International Conference on Image Processing (ICIP), Athens, Greece, 7–10 October 2018; pp. 4063–4067. [Google Scholar]
  39. Ronneberger, O.; Fischer, P.; Brox, T. U-Net: Convolutional Networks for Biomedical Image Segmentation. In Proceedings of the International Conference on Medical Image Computing and Computer Assisted Intervention (MICCAI), Munich, Germany, 5–9 October 2015; pp. 234–241. [Google Scholar]
  40. Peng, D.; Zhang, Y.; Guan, H. End-to-end change detection for high resolution satellite images using improved UNet++. Remote Sens. 2019, 11, 1382. [Google Scholar] [CrossRef] [Green Version]
  41. Zhou, Z.; Siddiquee, M.M.R.; Tajbakhsh, N.; Liang, J. Unet++: Redesigning skip connections to exploit multiscale features in image segmentation. IEEE Trans. Med. Imaging 2019, 39, 1856–1867. [Google Scholar] [CrossRef] [PubMed] [Green Version]
  42. Zhang, C.; Yue, P.; Tapete, D.; Jiang, L.; Shangguan, B.; Huang, L.; Liu, G. A deeply supervised image fusion network for change detection in high resolution bi-temporal remote sensing images. ISPRS-J. Photogramm. Remote Sens. 2020, 166, 183–200. [Google Scholar] [CrossRef]
  43. Fang, S.; Li, K.; Shao, J.; Li, Z. SNUNet-CD: A Densely Connected Siamese Network for Change Detection of VHR Images. Available online: https://0-doi-org.brum.beds.ac.uk/10.1109/LGRS.2021.3056416 (accessed on 17 February 2021).
  44. Chen, L.; Zhang, H.; Xiao, J.; Nie, L.; Shao, J.; Liu, W.; Chua, T.S. Sca-cnn: Spatial and channel-wise attention in convolutional networks for image captioning. In Proceedings of the IEEE Conference on Computer Vision and Pattern Recognition (CVPR), Honolulu, HI, USA, 21–26 July 2017; pp. 5659–5667. [Google Scholar]
  45. Vaswani, A.; Shazeer, N.; Parmar, N. Attention is all you need. In Proceedings of the Thirty-fifth Conference on Neural Information Processing Systems (NIPS), Long Beach, CA, USA, 4–9 December 2017; pp. 5998–6008. [Google Scholar]
  46. Hu, J.; Shen, L.; Sun, G. Squeeze-and-excitation network. In Proceedings of the IEEE Conference on Computer Vision and Pattern Recognition (CVPR), Salt Lake City, UT, USA, 18–22 June 2018; pp. 7132–7141. [Google Scholar]
  47. Wang, X.; Girshick, R.; Gupta, A.; He, K. Non-local neural networks. In Proceedings of the IEEE Conference on Computer Vision and Pattern Recognition (CVPR), Salt Lake City, UT, USA, 18–22 June 2018; pp. 7794–7803. [Google Scholar]
  48. Mnih, V.; Heess, N.; Graves, A. Recurrent models of visual attention. In Proceedings of the Twenty-eighth Conference on Neural Information Processing Systems (NIPS), Montreal, QC, Canada, 8–13 December 2014; pp. 2204–2212. [Google Scholar]
  49. Anderson, P.; He, X.; Buehler, C.; Teney, D.; Johnson, M.; Gould, S.; Zhang, L. Bottom-up and top-down attention for image captioning and visual question answering. In Proceedings of the IEEE Conference on Computer Vision and Pattern Recognition (CVPR), Salt Lake City, UT, USA, 18–22 June 2018; pp. 6077–6086. [Google Scholar]
  50. Xu, K.; Ba, J.; Kiros, R. Show, attend and tell: Neural image caption generation with visual attention. In Proceedings of the International Conference on Machine Learning (PMLR), Lille, France, 6–11 July 2015; pp. 2048–2057. [Google Scholar]
  51. Lee, C.Y.; Osindero, S. Recursive recurrent nets with attention modeling for ocr in the wild. In Proceedings of the IEEE Conference on Computer Vision and Pattern Recognition (CVPR), Las Vegas, NV, USA, 26 June–1 July 2016; pp. 2231–2239. [Google Scholar]
  52. Ibtehaz, N.; Rahman, M.S. MultiResUNet: Rethinking the U-Net architecture for multimodal biomedical image segmentation. Neural Netw. 2020, 121, 74–87. [Google Scholar] [CrossRef] [PubMed]
  53. Szegedy, C.; Liu, W.; Jia, Y. Going deeper with convolutions. In Proceedings of the IEEE Conference on Computer Vision and Pattern Recognition (CVPR), Boston, MA, USA, 8–10 June 2015; pp. 1–9. [Google Scholar]
  54. Schlemper, J.; Oktay, O.; Schaap, M.; Heinrich, M.; Kainz, B.; Glocker, B.; Rueckert, D. Attention gated networks: Learning to leverage salient regions in medical images. Med. Image Anal. 2019, 53, 197–207. [Google Scholar] [CrossRef] [PubMed]
  55. Lebedev, M.; Vizilter, Y.V.; Vygolov, O.; Knyaz, V.; Rubis, A.Y. Change detection in remote sensing images using conditional adversarial networks. Int. Arch. Photogramm. Remote Sens. Spat. Inf. Sci. 2018, 42, 565–571. [Google Scholar] [CrossRef] [Green Version]
  56. He, K.; Zhang, X.; Ren, S.; Sun, J. Delving deep into rectifiers: Surpassing human-level performance on imagenet classification. In Proceedings of the IEEE Conference on Computer Vision and Pattern Recognition (CVPR), Boston, MA, USA, 8–10 June 2015; pp. 1026–1034. [Google Scholar]
  57. Kingma, D.P.; Ba, J. Adam: A method for stochastic optimization. arXiv 2014, arXiv:1412.6980. [Google Scholar]
Figure 1. Architecture of the proposed MRA-SNet network. (a) Stream T1, (b) Stream T2, (c) Change detection stream.
Remotesensing 13 04528 g001
Figure 2. Multi-Res block.
Remotesensing 13 04528 g002
Figure 3. Attention Gates module.
Remotesensing 13 04528 g003
Figure 4. CDD dataset with different object changes.
Remotesensing 13 04528 g004
Figure 5. Visual comparison results of ablation experiments: (a) T1 image, (b) T2 image, (c) ground truth, (d) Siamese UNet, (e) MRA-SNet without the Multi-Res block, (f) MRA-SNet without the Attention Gates module, (g) MRA-SNet. The changed areas are marked by white, and the unchanged areas are marked by black.
Remotesensing 13 04528 g005
Figure 6. Visual comparison of change detection results in area 1: (a) T1 image, (b) T2 image, (c) ground truth, (d) FC-EF, (e) FC-Siam-conc, (f) FC-Siam-diff, (g) UNet++_MSOF, (h) IFN, (i) SNUNet-CD/32, (j) proposed method. The changed areas are marked by white, and the unchanged areas are marked by black.
Remotesensing 13 04528 g006
Figure 7. Visual comparison of change detection results in area 2: (a) T1 image, (b) T2 image, (c) ground truth, (d) FC-EF, (e) FC-Siam-conc, (f) FC-Siam-diff, (g) UNet++_MSOF, (h) IFN, (i) SNUNet-CD/32, (j) proposed method. The changed areas are marked by white, and the unchanged areas are marked by black.
Remotesensing 13 04528 g007
Figure 8. Visual comparison of change detection results in area 3: (a) T1 image, (b) T2 image, (c) ground truth, (d) FC-EF, (e) FC-Siam-conc, (f) FC-Siam-diff, (g) UNet++_MSOF, (h) IFN, (i) SNUNet-CD/32, (j) proposed method. The changed areas are marked by white, and the unchanged areas are marked by black.
Remotesensing 13 04528 g008
Figure 9. Visual comparison of change detection results in area 4: (a) T1 image, (b) T2 image, (c) ground truth, (d) FC-EF, (e) FC-Siam-conc, (f) FC-Siam-diff, (g) UNet++_MSOF, (h) IFN, (i) SNUNet-CD/32, (j) proposed method. The changed areas are marked by white, and the unchanged areas are marked by black.
Remotesensing 13 04528 g009
Figure 10. Visual comparison of change detection results in area 5: (a) T1 image, (b) T2 image, (c) ground truth, (d) FC-EF, (e) FC-Siam-conc, (f) FC-Siam-diff, (g) UNet++_MSOF, (h) IFN, (i) SNUNet-CD/32, (j) proposed method. The changed areas are marked by white, and the unchanged areas are marked by black.
Remotesensing 13 04528 g010aRemotesensing 13 04528 g010b
Figure 11. Comparison of network parameters of different methods.
Remotesensing 13 04528 g011
Figure 12. Comparison of the number of FLOPs for different methods.
Remotesensing 13 04528 g012
Figure 13. Effect of parameter λ of loss function on CD results.
Remotesensing 13 04528 g013
Figure 14. Effect of data augmentation on CD evaluation metrics.
Remotesensing 13 04528 g014
Table 1. The details of MRA-SNet architecture. The symbols ① to ⑨ indicate the corresponding Multi-Res block number in Figure 1.
LayerOutput SizeParameter SettingLayerOutput SizeParameter Setting
Multi-Res
Block ①
256 × 256 [ 3 × 3 ,           8 3 × 3 ,       17 3 × 3 ,       26 1 × 1 ,       51 ] Multi-Res
Block ⑥
32 × 32 [ 3 × 3 ,               71 3 × 3 ,           142 3 × 3 ,           213 1 × 1 ,           426 ]
Max Pooling128 × 1282 × 2, stride = 2Transposed
Convolution
64 × 642 × 2, 212, stride = 2
Multi-Res
Block ②
128 × 128 [ 3 × 3 ,           17 3 × 3 ,           35 3 × 3 ,           53 1 × 1 ,       105 ] Multi-Res
Block ⑦
64 × 64 [ 3 × 3 ,               35 3 × 3 ,               71 3 × 3 ,           106 1 × 1 ,           212 ]
Max Pooling64 × 642 × 2, stride = 2Transposed
Convolution
128 × 1282 × 2, 105, stride = 2
Multi-Res
Block ③
64 ×64 [ 3 × 3 ,             35 3 × 3 ,             71 3 × 3 ,         106 1 × 1 ,         212 ] Multi-Res
Block ⑧
128 × 128 [ 3 × 3 ,           17 3 × 3 ,           35 3 × 3 ,           53 1 × 1 ,       105 ]
Max Pooling32 × 322 × 2, stride = 2Transposed
Convolution
256 × 2562 × 2, 51, stride = 2
Multi-Res
Block ④
32 × 32 [ 3 × 3 ,               71 3 × 3 ,           142 3 × 3 ,           213 1 × 1 ,         426 ] Multi-Res
Block ⑨
256 × 6 [ 3 × 3 ,             8 3 × 3 ,         17 3 × 3 ,         26 1 × 1 ,         51 ]
Max Pooling16 × 162 × 2, stride = 2Output Layer256 × 2561 × 1, 2, stride = 1
Multi-Res
Block ⑤
16 × 16 [ 3 × 3 ,           142 3 × 3 ,           284 3 × 3 ,           427 1 × 1 ,           853 ]
Transposed
Convolution
32 × 322 × 2, 426, stride = 2
Table 2. Results of ablation experiments with the Multi-Res block and the Attention Gates module on the CDD dataset.
MethodsMulti-Res BlockAttention GatesPrecisionRecallF1 ScoreOA
Siamese UNet××0.95190.91500.93310.9845
MRA-SNet ×0.96450.95270.95860.9903
MRA-SNet× 0.95860.93710.94770.9878
MRA-SNet 0.96770.95750.96260.9912
Table 3. Quantitative evaluation results of different methods.
MethodsPrecisionRecallF1 ScoreOA
FC-EF0.81530.54240.65140.9315
FC-Siam-conc0.79720.61180.69230.9358
FC-Siam-diff0.86970.59600.70730.9418
UNet++_MSOF0.89540.87110.87560.9673
IFN0.94960.86080.90300.9771
SNUNet-CD/320.95550.94830.95190.9887
Proposed method0.96770.95750.96260.9912
Publisher’s Note: MDPI stays neutral with regard to jurisdictional claims in published maps and institutional affiliations.

