Article

Correlation Analysis between Land-Use/Cover Change and Coastal Subsidence in the Yellow River Delta, China: Reviewing the Past and Prospecting the Future

1
College of Ocean Science and Engineering, Shandong University of Science and Technology, Qingdao 266590, China
2
College of Earth Science and Engineering, Shandong University of Science and Technology, Qingdao 266590, China
3
Key Laboratory of Marine Geology and Environment, Institute of Oceanology, Chinese Academy of Sciences, Qingdao 266071, China
4
College of Earth and Planetary Sciences, University of Chinese Academy of Sciences, Beijing 100049, China
5
School of Information Science and Technology, North China University of Technology, Beijing 100144, China
*
Author to whom correspondence should be addressed.
Remote Sens. 2021, 13(22), 4563; https://0-doi-org.brum.beds.ac.uk/10.3390/rs13224563
Submission received: 8 October 2021 / Revised: 3 November 2021 / Accepted: 7 November 2021 / Published: 13 November 2021
(This article belongs to the Topic Climate Change and Environmental Sustainability)

Abstract

:
In recent years, noticeable subsidence depressions have occurred along the coastal zone of the Yellow River Delta. Consistent with these changes, dramatic human modifications within the coastal zone stand out, and the coastline is altered from an undisturbed natural area to an artificial coastline. However, very few studies have attempted to quantitatively analyze the relationship between subsidence depression and human activities. Here, the subsidence characteristics of the different land-use types in the Yellow River Delta are examined, and their spatiotemporal trends are quantified using a long-term satellite-observed time series of 30 years (1984–2017) regarding the land use map in combination with the InSAR-derived vertical ground deformations during three typical periods (P1: 1992–2000, P2: 2007–2010, and P3: 2016–2017). Noticeably, the highest subsidence rates were observed in areas where substantial human activities were observed, such as the subsidence in the salt fields ranging from 13 mm/year to 32 mm/year to 453 mm/year, respectively. Moreover, through the land-use prediction of Land Change Modeler (LCM), it is found that the salt field area will be further expanded in the future. The ecological vulnerability of the Yellow River Delta coastal zone should receive more attention in the future in terms of planning environmental protection strategies.

1. Introduction

There is no doubt that the amount of human interference in Earth systems has strongly increased during the last century and has now reached a new high level, with even greater effects than those of many natural processes on Earth [1]. In recent decades, most of the deltas in the world have undergone artificial transformations. In East Asia, the Yellow River Delta is highlighted as a hotspot due to its dramatic coastal land-use changes [2,3]. The delta’s natural coastline has become dominated by artificial shorelines due to the boom of the nearshore salt and aquaculture industries, with natural areas decreasing from 70% in 1974 to 11% in 2015 [4].
On the other hand, deltaic sediments are naturally prone to sinking due to their high compressibility and low bearing capacity. It is clear that human activity has accelerated this natural process, primarily through the exploitation of groundwater and hydrocarbons [5,6,7]. In the Yellow River Delta, an increasing number of case studies have shown that groundwater (including underground brine water) pumping and hydrocarbon extraction are responsible for the large amount of sinking in coastal regions [8,9,10,11,12,13,14].
However, the relationship between land-use changes and subsidence has not been well analyzed, and it is still not clear whether there is a causal relationship between them [15,16]. This study demonstrates the evolution of the coastal land-use of the Yellow River Delta, which is represented by shrimp farms, oil fields, and salt pans, and these aspects have been subjected to tremendous alterations due to human activities over the past 30 years. Specifically, the study aims to evaluate the relationship between land-use evolution and land subsidence risk in this delta. Moreover, we attempt to predict the future trend of land use based on the land-use history and relevant terrain factors (see Section 3.1.3 for details), such as slope, aspect, and a digital elevation model (DEM). It is expected that this prediction can provide a scientific basis for land-use planning and the exploitation of groundwater.

2. Study Area

The Yellow River Delta is one of the most active areas of land use/cover change (LUCC) in China, and one of the fastest land-making deltas in the world (Figure 1). The delta is formed by the accumulation of delta sediments since the Yellow River diverted in 1855, so the thickness of sediments gradually thickens from land to sea, from 4 m to 16 m. The spatial distribution of sediment thickness is shown in the previous article [17].
The Yellow River Delta is located between the Jiyang fault depression and the Chengning uplift, with rich reserves of oil, gas, brine, and water resources [11]. The groundwater in the Yellow River Delta is mainly composed of loose-rock pore water and mainly occurs in alluvial and marine sediments in the upper part of the Quaternary system [18]. Since the late Pleistocene, there have been three major transgression–regression events in the delta [17]. Consequently, a large amount of underground brine has been found in the Pleistocene aquifer. It has been shown that there is a large underground brine resource belt along the coast of Bohai Bay. According to its burial depth, the belt is generally divided into three categories: shallow brine (100 m to the surface), medium brine (100 to 400 m), and deep brine (400 m and deeper). Previous studies [18] have shown that the development of underground brine resources is limited to shallow underground brines. The salt pan area of the whole province is approximately 400 km2, with approximately 5600 brine wells and an annual output of 6.53 million tons of raw salt.

3. Materials and Methods

3.1. Land-Use Maps

3.1.1. Remote Sensing Datasets

We built a novel constant time series of land-use maps by employing optical satellite remote sensing Landsat mission images. Landsat-series images were chosen due to the long period of available images, the appropriate ground resolution (30 m × 30 m), the broad range of spectral bands, and the free access to the images (Accessed date: 10 February 2019 http://earthexplorer.usgs.gov/). The Landsat tile (path 121, row 34) covering the entire delta was selected and outlined as the study area (Figure 1). To analyze the land-use evolution with the maximum access to the land-use history, quantify the synchronous subsidence rates obtained from InSAR-derived subsidence rates (see 3.3 for details), and reduce the classification errors caused by seasonal variation (especially vegetation cover), six Landsat satellite images (1984, 1992, 2000, 2007, 2010, and 2017) with low cloud coverage during autumn (August–October) were screened (Table 1). We use all satellite images passing through during the day, so it is in a descending mode.
For our research, we defined the three most representative manmade land-use classes to include shrimp ponds, salt pans, and oil wells in the deltaic coastal zone. To encompass the major human-induced zones, we produced a buffer polygon (~2500 km2, with a 10 km radius) around the 2017 coastline (~350 km) as the study area in our analyses (Figure 1, yellow polygon).
Furthermore, the topographic map constructed in 1998 was employed to depict the locations of oil wells that are too small to be identified from the Landsat images.

3.1.2. Image Classification

The Landsat images were classified with a supervised method according to the following two primary steps: (1) the choice of training samples and (2) the use of an appropriate classification algorithm. We employed a “maximum likelihood classification” (MLC) algorithm to assign the land-use types to the patches in the Landsat images [19]. We define
X = { x i } i = 1 N ,
as an original image pixel and
Y = { y i } i = 1 N ,
as the classification result. The MLC algorithm can be described as follows:
Y ^ = a { y i } i = 1 N ,
where N is the number of pixels in the original dataset and Y ^ is the solution of the optimization problem. We should note that this algorithm is conducted under the presumption that each pixel to be classified is normally distributed in each class [20].
According to the results of the image classification, the transformation matrix can be realized to quantitatively examine the land-use changes. First, two different land-use maps with identical class names were dissolved by merging the matching records into a single map to improve the following processing. Then, these two dissolved maps were intersected based on the overlay analysis. The above two steps were accomplished in ArcGIS 10.2. Subsequently, these two maps were used to produce a transformation matrix in Excel.

3.1.3. Land-Use Prediction

The land change modeler (LCM) model is an integrated module in the IDRISI software. It has been developed by the Clark Laboratory and Conservation International for many years [21]. It is becoming one of the commonly used models to measure land-use changes [22]. The LCM model consists of a multilayer perceptron–artificial neural network (MLP-ANN), a Markov chain, cellular automata, and soft and hard prediction models. The model can predict the future land-use status through simulation of the existing land-use status and provides a good reference for decision-makers who plan and protect. Here, we randomly selected two-thirds of the samples as training samples, and the remaining one-third of the samples to verify the accuracy of the model. Moreover, the model can predict and analyze land-use changes in the environment provided by IDRISI and runs by following a set of rules in an orderly manner.

3.2. Land Subsidence Measurement

3.2.1. Rerunning Geodetic Leveling

The land subsidence in the study area in recent decades was monitored through repeated geodetic leveling by employing the benchmark network produced by the Yellow River Conservancy Commission from 1964 to 2007. The leveling dataset used for this study is available from Liu and Huang (2013) between 2000 and 2007 (Figure 1, red triangle) and from the Shandong Provincial Lubei Geo-engineering Exploration Institute from 2016 to 2017 (Figure 1, green triangle), with random errors of 3–5 mm/km and 1 mm/km, respectively. The original leveling measurements were digitized and interpolated to derive a homogeneous set of contour maps of the land subsidence rates (Figure 2b).

3.2.2. InSAR Observations

In comparison with the traditional investigation method of geodetic leveling, the InSAR technique has great advantages due to its broad coverage and high spatial–temporal resolution under all weather conditions. More recently, radar acquisitions by various satellites (ERS-1/2, ENVISAT-ASAR, and Sentinel-1A/B) were processed through synthetic aperture radar (SAR) interferometry over the delta [8,9,10,11,12,13,14]. In the ArcGIS software environment, the conversion from InSAR vector feature point data to grid data was realized, and then the land subsidence maps were generated by Kriging interpolation method. The land subsidence map was shown in Figure 2a (1992–2000) and 2c (2007–2010), with estimated errors caused by spatiotemporal variability in the surface scattering properties of 6.1 and 7.2 mm/year, respectively [11,13]. Except forSsentinel-1A, which was in ascending orbit mode, all satellites were in descending orbit mode.
As shown in Figure 2d, we further measured recent subsidence rates in P3, by analysis of interferometric synthetic aperture radar (InSAR) imagery, using 15 C-band ascending track Sentinel-1A images acquired over the period from Jan 2016 to Apr 2017. InSAR-derived subsidence rates are consistent with the leveling-based rates (mentioned in Section 3.2.1, Figure 1, green triangle). The comparative results are shown in Figure 3. The mean and standard deviation of the difference of the deformation rate between the two measurements are 3.52 mm/year and 6.87 mm/year, respectively. This small error indicates that the InSAR observations are in good agreement with the results from repeated geodetic leveling. The settlement extremes in Figure 3 are consistent with other references [8,14].

3.3. Coupling Land-Use and Land-Cover Change with Subsidence

The land-use sequence maps were integrated with the corresponding land subsidence maps to quantify the subsidence rates for each land-use class during each time period. To improve the integration accuracy, the four corresponding Landsat images (1992, 2000, 2007, and 2010) were chosen for combination with the two available groups of InSAR-based subsidence measurements (Figure 2a,c).
First, the massive vector data (millions of InSAR feature points and image patches) were converted into a raster format by employing a conversion tool embedded in ArcGIS to improve the processing efficiency. Then, a relational equal-to operation was performed on two inputs (e.g., 1992 and 2000 classified raster maps) on a cell-by-cell basis using the map algebra functions in GIS. It was set to 1 in cells where the first raster (1992) was equal to the second (2000) and to 0 otherwise. Finally, the statistical values (such as the maximum, minimum, median, and average) of the input rasters (e.g., change or no change between 1992 and 2000) acquired within the zone of another dataset (e.g., land subsidence rates over 1992–2000) were retrieved through zonal statistical analysis with ArcGIS 10.2 software.

3.4. Analysis of Brine Exploitation Potential

The mining potential coefficient method is used to analyze and evaluate the potential of brine resources. The exploitation potential coefficient refers to the ratio between the allowable exploitation amount of regional brine and the current exploitation amount, and the calculation formula is as follows:
P = Qz/Qk
where P is the exploitation potential coefficient, Qz is the exploitable quantity of brine (104 m3/year), and Qk is the current exploitation amount of brine (104 m3/year).
Here, the mining potential coefficient is calculated according to the above formula. According to the zoning standards [23] shown in Table 2, the brine distribution area is divided into the potential area, compensation balance area, and overexploitation area.

4. Results

4.1. Land-Use and Land-Cover Change

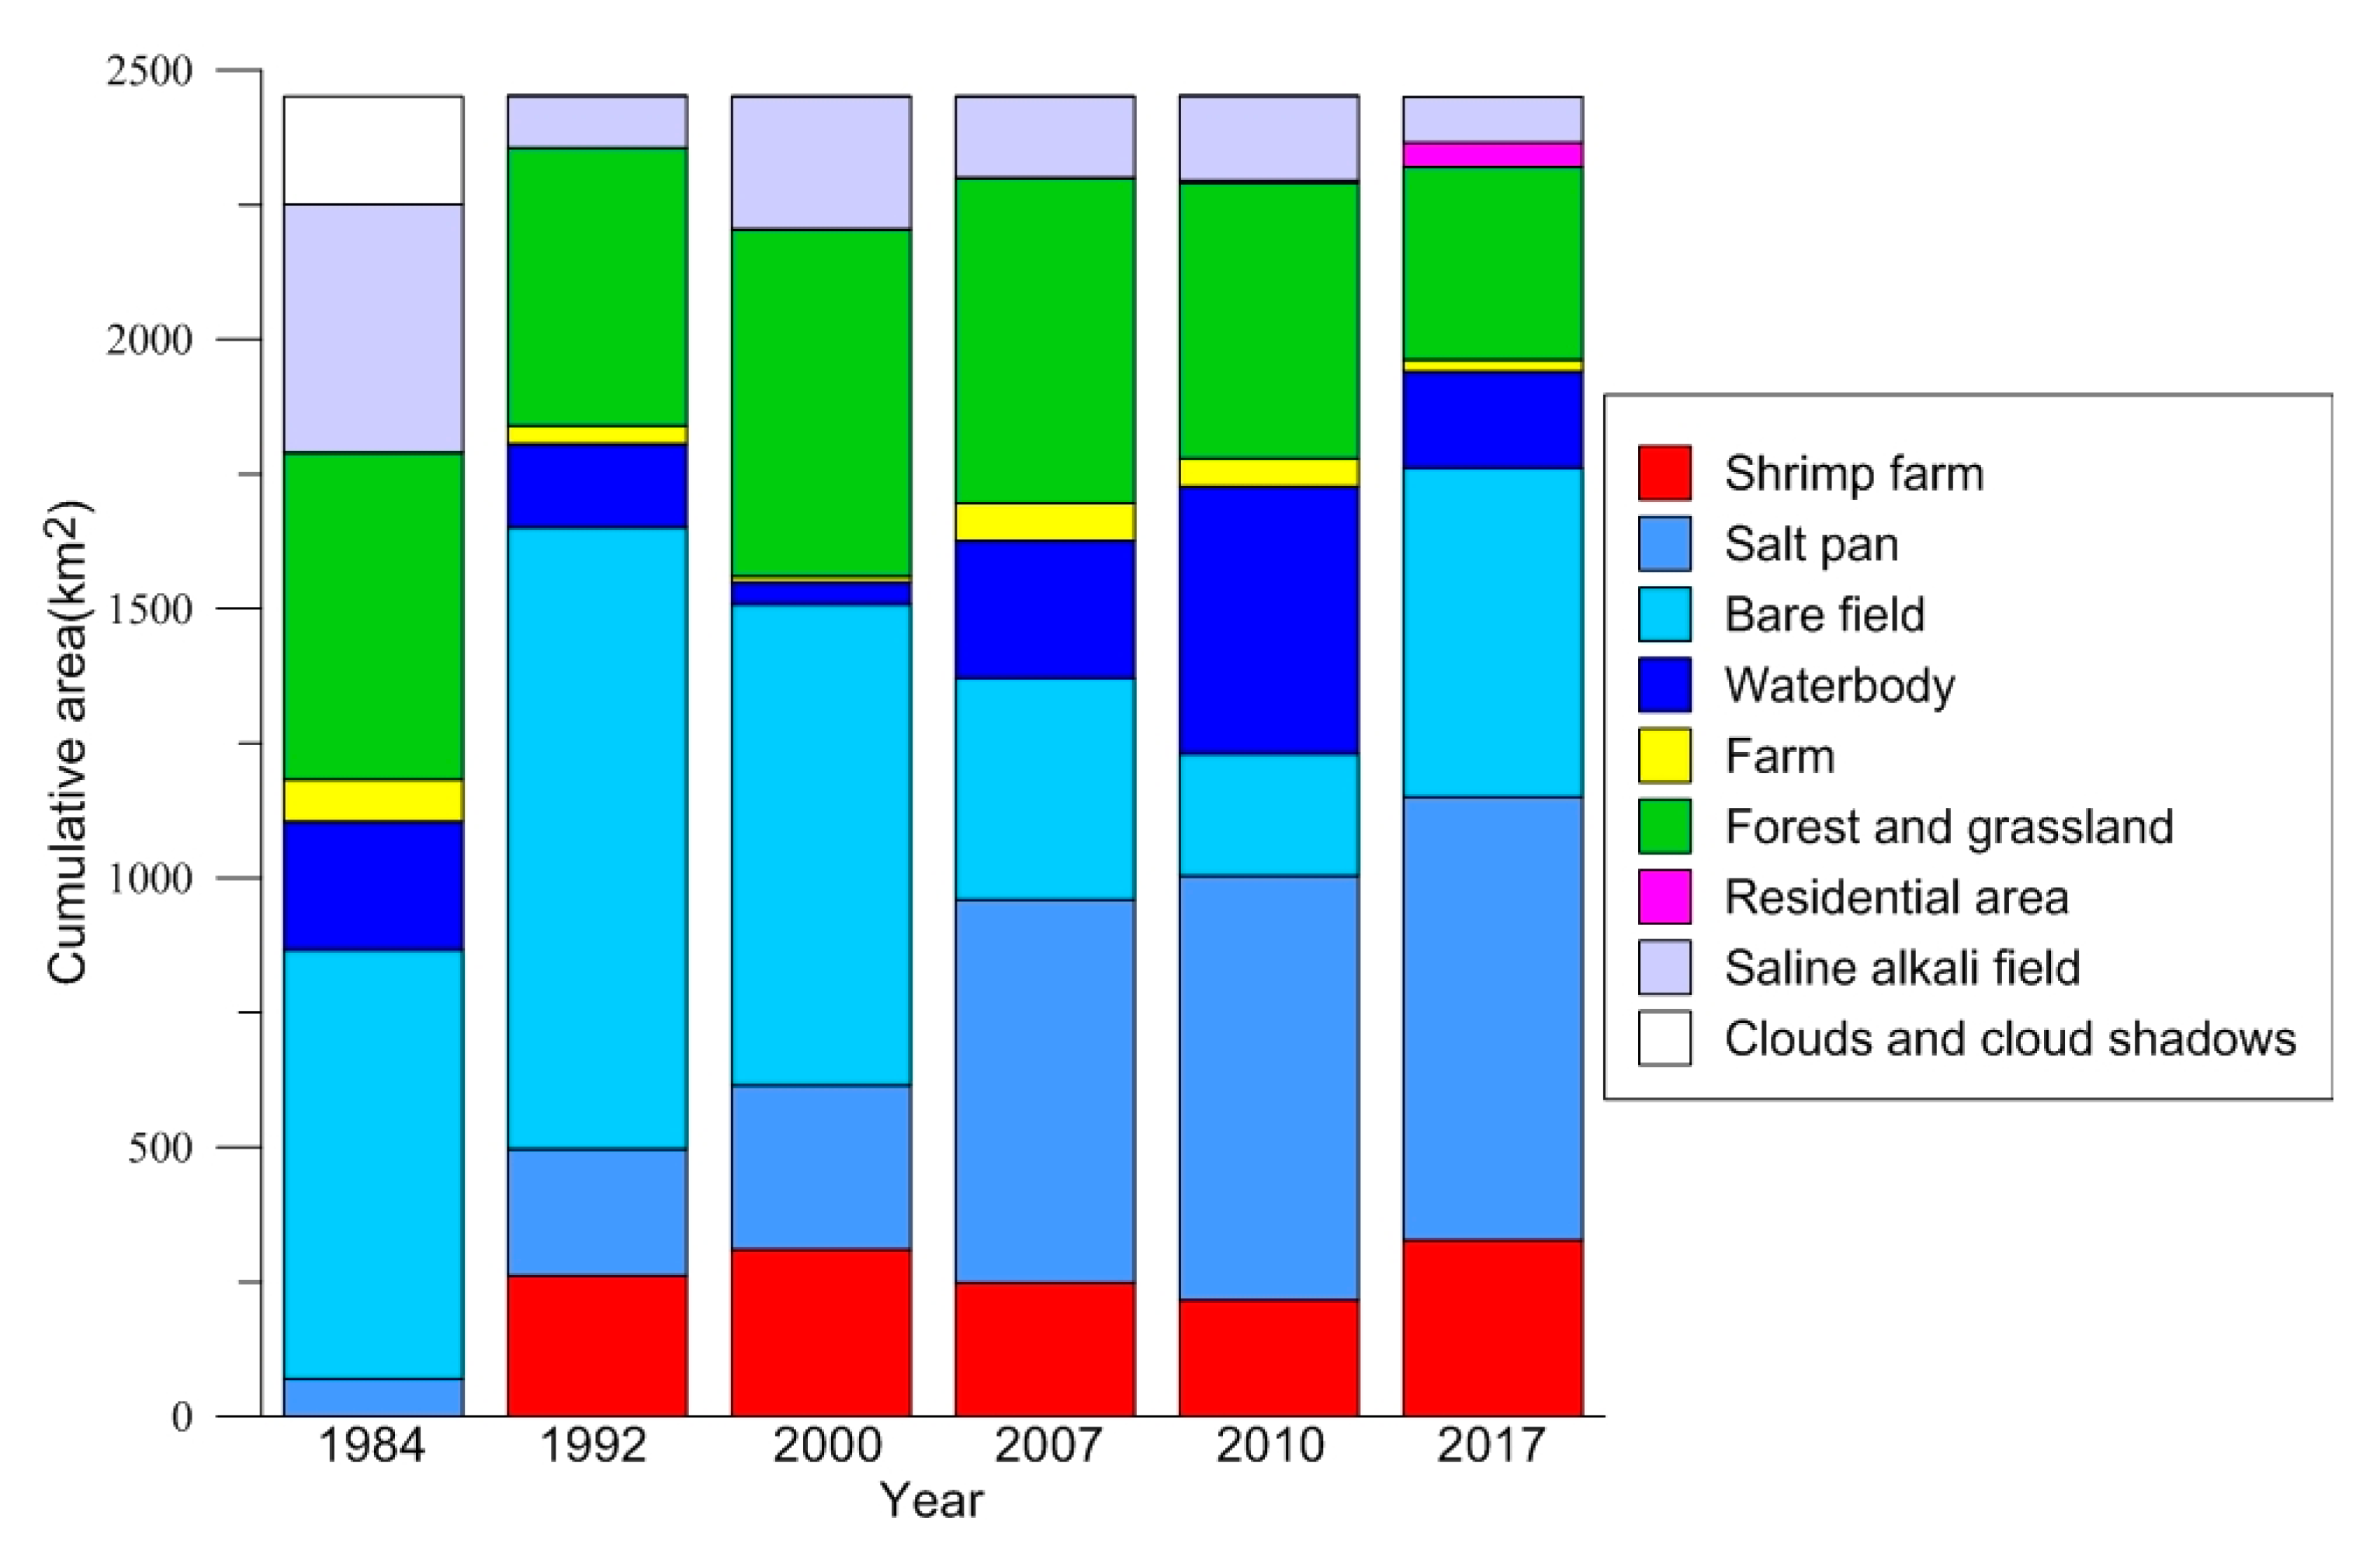
4.1.1. Land-Use Structure Change

Six maps of land-use/cover classifications were produced based on the Landsat satellite images, as shown in Figure 4. With the help of the topographic map dated 1998 (scale 1:50,000), the oil wells constructed since 2000 were digitized and added (black dots in Figure 4). The areal coverage of each land-use type is shown in Figure 5. The overall accuracies of the six land-use maps are mostly greater than 90% (Table 3).
Figure 4 shows that over approximately the past 30 years, the coastal land-use structure of the delta has undergone major changes. The most prominent change was the remarkable increase in the area of salt fields and shrimp ponds, which increased from less than 3% of the study area in 1984 to more than half of the area in 2017. Meanwhile, in response to the increased aquaculture and salt industries, residential areas have constantly grown. These developments directly reflect human activities and urbanization in the Yellow River Delta over the past few decades. Without artificial intervention, other land-use classes have remained relatively stable. Bare land mainly includes intertidal zones along the coast, and its size is greatly affected by the satellite image acquisition time. Water bodies include reservoirs, ponds, seasonal rivers, and tributaries of the Yellow River. The areas of farmland, forest, and grassland are primarily affected by seasonal alternations.

4.1.2. Land-Use Dynamic Change

Using a transition matrix, we can quantitatively describe the land-use conversion during a certain period. Since the satellite images in 1984 suffered from heavy cloud cover (~10%), two transfer matrices were built for the periods of 1992–2007 (Table 4) and 2007–2017 (Table 5). The bins are colored from blue (small) to purple (large). The values on the diagonals are those without land-use changes. A zero value means that no change occurred. The most noticeable conversion that occurred was the growth of salt pans, mainly by reclaiming bare fields, with the area increasing almost threefold (Table 4, 10–29%) during P1 (1992–2007). In this period, farmland, forest, and saline alkali land increased slightly, while shrimp ponds remained basically unchanged. Subsequently, during the next 10 years (P2: 2007–2017, Table 5), the salt field area steadily continued to expand, and the shrimp pond area increased by a third. Due to persistent urbanization, the areas of farmland, forest, grassland, and saline alkali land have been greatly reduced.

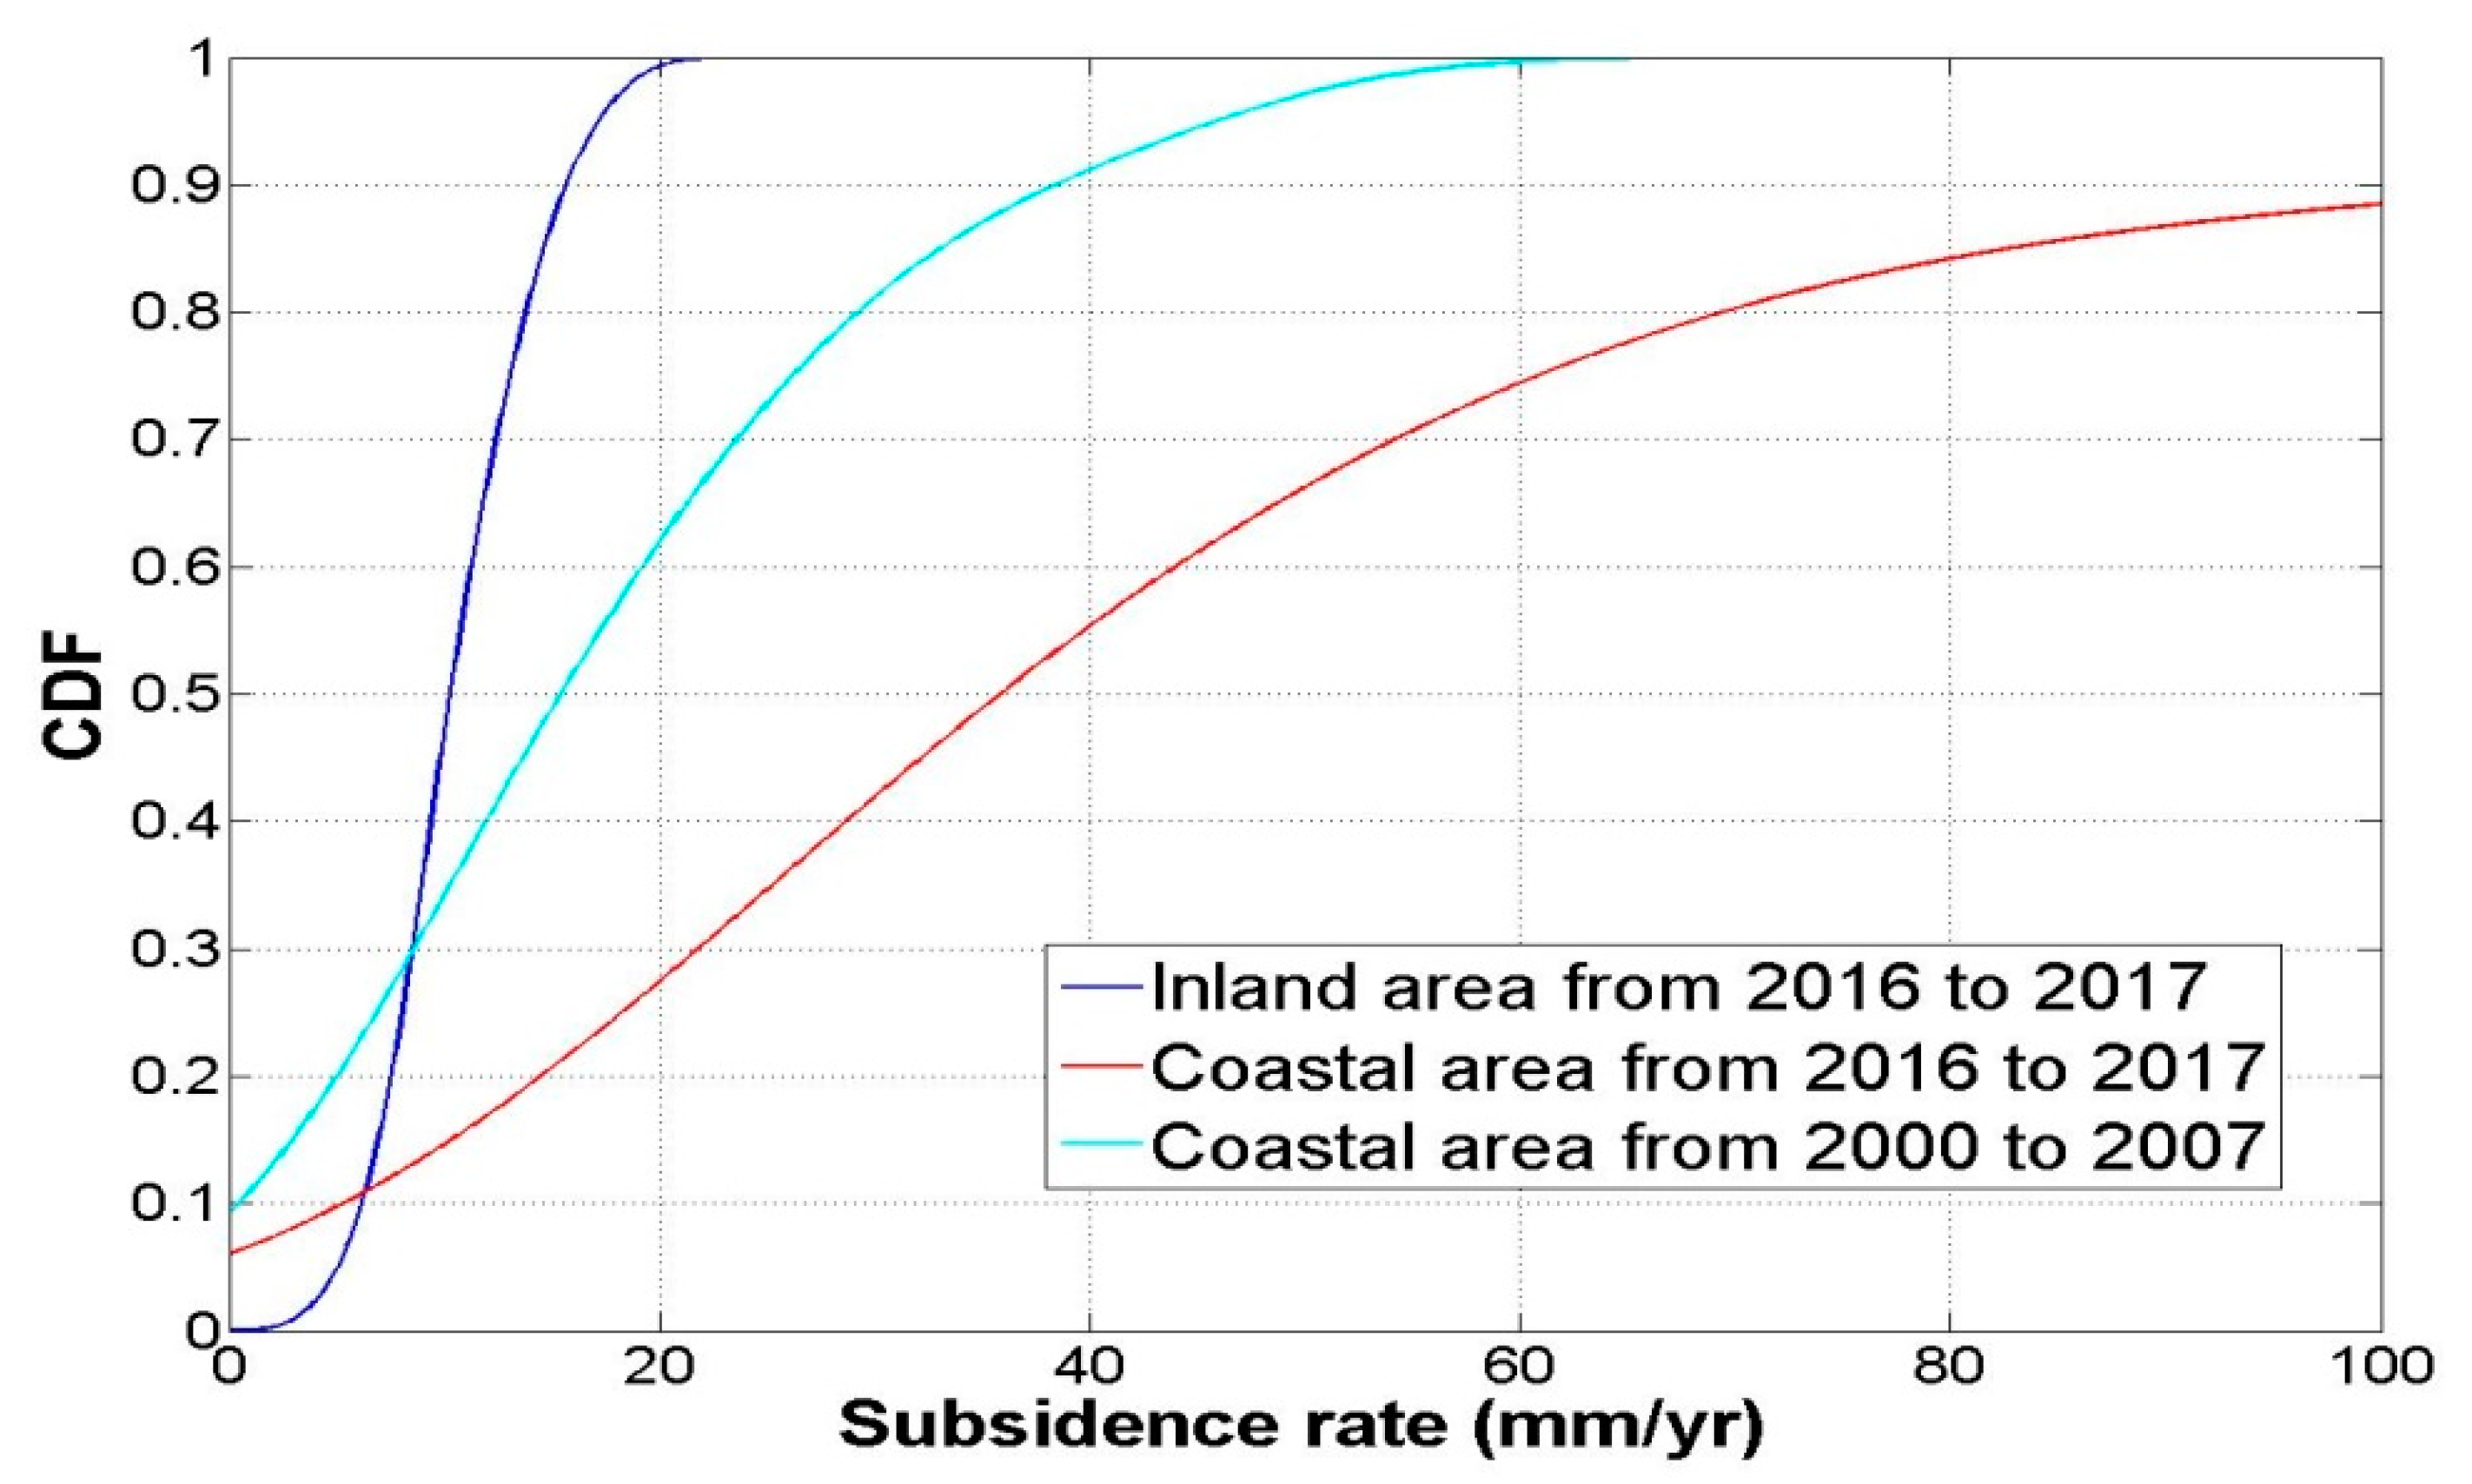
4.2. Subsidence Rates of Each Land-Use Type

The InSAR-derived subsidence rates measured from P1 and P2 to P3 for each land-use sequence are shown in Figure 6 (unchanged) and Figure 7 (changed). Since P3 is only one year (2016–2017), we assume that there is no significant change in land-use type during P3.
The category shown in Figure 6 comprises the constant land-use sequences during both periods (P1, P2, and P3). After the slow growth of the first two periods (P1 and P2), the subsidence rate of the land-use class exhibited explosive growth in P3. The highest subsidence rates occurred for salt pans, which increased from 13 mm/year (P1) and 32 mm/year (P2) to 453 mm/year (P3). The lowest subsidence rates were observed for bare land, which increased from 16 to 22 mm/year in the two periods. The average land subsidence rate varied from 3–5 mm/year (P1) and 9–12 mm/year (P2) to 24–83 mm/year (P3). The standard deviation was less than 7 mm/year.
A total of 26 patterns of changes were identified in the other category. The maximum value occurred for saline-alkali fields (27 mm/year, P2) that were previously bare lands, closely followed by salt pans (25 mm/year, P2) that were previously bare fields. In particular, severe coastal subsidence appeared in both of the typical anthropogenic conversions to shrimp ponds and salt fields (Figure 7).
Significantly, due to the insufficient coverage of the land settlement dataset in this study, the settlement in P2 is too small. However, the existing literature [8] shows that in the P2 period, the subsidence rate in the coastal area of the Yellow River Delta reached 250 mm/year.

4.3. Evolution and Prediction of Land-Use/Cover and Subsidence

The land-use map of 2050 (Figure 8) predicted by the LCM model shows that the scale of salt fields will further expand, and this prediction agrees with the distribution characteristics of the brine resources in the coastal zone of the Yellow River Delta. It has been shown that there are two large underground brine reserves on the southwest bank of Laizhou Bay and the south bank of the Bohai Sea [24]. Currently, the distribution of mining intensity is uneven, and the Yangkou salt field on the southwest bank is in a state of overmining; however, the other areas were all deemed to be potential mining areas (see potential area in Figure 8). The predicted distribution area of the salt fields is consistent with the distribution of underground brine in this area. The prediction results show that in the next 30 years, the scale of salt fields will increase by 38% at the cost of a reduction in natural land (e.g., bare land, saline-alkali land, and forest grassland). With the development of urbanization, the scale of residential areas will increase by 7%. Compared with the actual land-use maps for 2010 and 2017, the prediction accuracy-based land-use maps from 1984–2007 reached 51% and 68%, respectively, due to insufficient relevance of the input maps.

5. Discussion

5.1. Expansion of Salt Pans and Exploitation of Underground Brine

Over the past 30 years, land-use changes in the coastal zone of the Yellow River Delta have featured the rapid expansion of salt fields and aquaculture. These features are in line with spatial–temporal patterns reported for the delta in other studies [2,25]. In particular, the expansion of salt pans is the most remarkable land-use transformation, with an area growth rate of 23 km2/year, corresponding to the findings of Qiao [4]. The salt industry remained stable with slight variations from 1984 to 1992. Long-term unreasonable extraction has led to a decline in the underground brine concentration over time. For example, the concentration of brine in the Guangrao salt field decreased from 100–130 g/L at the beginning of 1959 to 40–70 g/L in 2007. Studies have shown that the underground brine in the salt field on the southeastern coast of Bohai Bay has declined by as much as 1 mm/year [17]. The appearance of land subsidence depressions in the salt fields denotes direct evidence of the decline in the underground brine levels [14].

5.2. Aquaculture and Oil Fields

In addition to salt fields, aquaculture (mainly shrimp ponds) and oil fields are two typical types of human activities in the delta, as well as two representative manmade subsidence factors supported by other studies [8,9,10]. Actually, all three of these land-use classes are closely related in space (Figure 4). In the Yellow River Delta, the terrain is relatively low-lying and flat, and groundwater resources are rich. Therefore, it is common to use underground salt water for shrimp culture. Recently, shrimp breeding ponds have been built in salt pan areas, increasing the yield of prawns and providing obvious economic benefits. Moreover, on the north bank of the Yellow River Delta, many oil wells have been interspersed among salt fields and shrimp ponds for decades. Long-term and high-intensity exploitation has contributed to declines in reservoir pressure. Furthermore, as the main method of oil exploration, water-driven exploitation accounts for 81.3% of the reservoir pressure effects. Therefore, artificial water injection pumped from shallow strata usually leads to more ground subsidence than does the exploitation of deep oil with a burial depth of 700–3500 m [13].

5.3. Land Subsidence per Land-Use Sequence

According to the InSAR measurement results of the three periods (P1, P2, and P3) and the spatial analysis of land-use classification data, the temporal and spatial characteristics of land subsidence under different land-use classes can be identified. In P1, in the early stage of the construction of the delta, the influence of human activities on the natural environment was not remarkable and was even less than the self-weight consolidation compaction effect of the sedimentary strata [26].
In P2, the average annual subsidence rates of all land-use classes changed markedly and became 2–3 times larger than those of the previous period. However, the differences in subsidence rates among different land-use types were still not significant, with values of less than 2 mm/year.
Although the average subsidence rates of various land-use classes were relatively similar (all less than 2 mm) during the period of either P1 or P2, the interperiod change of magnitude of subsidence increased by 2–3 times from P1 to P2. Remarkably, in P3, the subsidence rates were approximately an order of magnitude higher than those in P2, ranging from 24 mm/year (oil well) to 83 mm/year (salt field). This finding is consistent with the results of several recent studies [8,14]. In particular, due to the existence of subsidence depressions caused by groundwater exploitation (shown in Figure 2d), some land-use types around the subsidence center show a higher subsidence rate (Figure 6).
We believe that from P1 to P3, the salt field has further expanded in space, which is accompanied by excessive underground brine mining. Therefore, land subsidence disasters in the delta coastal zone are caused.

5.4. Prospect for the Future

To meet the needs of economic development, the scale of the salt industry is expected to expand further. According to Feng et al. [24], predatory exploitation of underground brine in 2005–2008 resulted in an average annual decrease in the brine level of 1.39 m. At present, shallow brine is the main resource in brine mining, while deep brine has not been developed. Therefore, the exploitation potential of brine is still great. Due to the unreasonable development of shallow brine resources, some environmental problems, such as the depletion of underground brine resources, waste of resources, ground fissures, ground subsidence funnels, and environmental pollution, have emerged.
Figure 9 shows the cumulative distribution function of the level-based (see locations in Figure 1) subsidence rates for different study areas during the same period (2016–2017). The 90% cumulative distribution of the coastal zone (red curve) is close to 100 mm/year, which is six times larger than that of the inland area (blue curve). Even during the early days of deltaic construction, the subsidence rates in the coastal zone were higher than those in the inland zone. For example, the 90% cumulative distribution of the subsidence rate from 2000 to 2007 (cyan curve) was 38 mm/year, which was more than twice that of 16 mm/year in 2016–2017 (blue curve).
According to the existing investigation, the average annual subsidence rate of the salt fields along the coastal zone varies from tens of millimeters to hundreds of millimeters [8,11,13,14,26,27]. Coastal zone subsidence combined with the absolute annual sea level rise in the Bohai Sea and extreme disaster events such as storm surges will likely have a great impact on the ecological environment and human life as well as on safety in the delta.

6. Conclusions

In the past three decades, the coastal zone of the Yellow River Delta has changed from an undisturbed natural condition to a state dominated by salt fields and shrimp ponds characterized by artificial activity. At the expense of the development of the natural ecological environment, approximately 50% coverage of the coastal zone has been used for salt fields and shrimp ponds. Such a rapid expansion of salt fields has led to the excessive extraction of groundwater (i.e., underground brine), presumably leading to serious geophysical disasters such as land subsidence depressions and ground fissures.
Through the analysis of land-use changes and InSAR data, it was found that after the slow growth (increased by 2–3 times) of the first two periods (P1 and P2), the subsidence rate of the land-use class increased by an order of magnitude in P3. Moreover, extreme land subsidence includes different characteristics and often occurs in areas with strong human imprints, such as salt fields and shrimp ponds. With the development of underground brine production and the coastal brine industry, as well as the environmental impact of future sea level rise, the ecological vulnerability of the deltaic coastal area should deserve more attention from broad public and governmental managers. Addressing the relationship between economic development and environmental protection is a problem worthy of consideration. We should pay more attention to the development of underground brine.

Author Contributions

Conceptualization, Y.L. and X.Z. (Xinyuan Zhang); methodology, Y.Z.; software, K.Q.; validation, X.Z. (Xinghua Zhou); formal analysis, Y.L.; investigation, X.Z. (Xinyuan Zhang); resources, Z.B.; data curation, Y.Z.; writing—original draft preparation, Y.Z.; writing—review and editing, Y.Z.; visualization, Y.Z.; supervision, H.H.; project administration, H.H.; funding acquisition, Y.Z. All authors have read and agreed to the published version of the manuscript.

Funding

This research was funded by the National Natural Science Foundation of China (No. 42006148).

Institutional Review Board Statement

Not applicable.

Informed Consent Statement

Not applicable.

Data Availability Statement

The data presented in this study are available on request from the corresponding author.

Acknowledgments

The authors express their thanks to the people who helped with this work and acknowledge the valuable suggestions from the peer reviewers. In this study, the Landsat 5, 7, and 8 images were downloaded from the United States Geological Survey (USGS) Global Visualization Viewer (Accessed date: 10 February 2019 http://glovis.usgs.gov/), and we would like to thank the European Space Agency for providing the Sentinel-1 data. We are grateful to them for allowing us to use their data.

Conflicts of Interest

The authors declare no conflict of interest.

References

  1. Ehlers, E.; Krafft, T. Earth System Science in the Anthropocene; Springer: Berlin/Heidelberg, Germany, 2006; pp. 52–54. [Google Scholar]
  2. Ye, Q.H.; Liu, G.; Tian, G.; Chen, S.; Huang, C.; Chen, S.; Liu, Q.; Chang, J.; Shi, Y. Geospatial-temporal analysis of land-use changes in the Yellow River Delta during the last 40 years. Sci. China Ser. B 2004, 47, 1008–1024. [Google Scholar] [CrossRef]
  3. Zhao, Z.J.; Zhang, C.Y. Temporal and Spatial Change of Land Use/Cover in Yellow River Delta. J. Basic Sci. Eng. 2016, 24, 731–740. [Google Scholar]
  4. Qiao, X.J.; Wang, Q.; Zhan, C.; Wang, X.; Wang, H.Y.; Du, G.Y.; Li, X.Y. Study on automatic extraction of coastline in the Yellow River Delta based on multispectral data. Acta Oceanol. Sin. 2016, 38, 59–71. [Google Scholar]
  5. Galloway, D.L.; Burbey, T.J. Review: Regional land subsidence accompanying groundwater extraction. Hydrogeol. J. 2011, 19, 1459–1486. [Google Scholar] [CrossRef]
  6. Tosi, L.; Teatini, P.; Strozzi, T. Natural versus anthropogenic subsidence of venice. Sci. Rep. 2013, 3, 2710. [Google Scholar] [CrossRef] [Green Version]
  7. Gambolati, G.; Teatini, P. Geomechanics of subsurface water withdrawal and injection. Water Resour. Res. 2015, 51, 3922–3955. [Google Scholar] [CrossRef]
  8. Higgins, S.; Overeem, I.; Tanaka, A.; Syvitski, J. Land subsidence at aquaculture facilities in the yellow river delta, China. Geophys. Res. Lett. 2013, 40, 3898–3902. [Google Scholar] [CrossRef]
  9. Liu, Y.; Huang, H.J. Characterization and mechanism of regional land subsidence in the Yellow River Delta, China. Nat. Hazards 2013, 68, 687–709. [Google Scholar] [CrossRef]
  10. Liu, P.; Li, Q.; Li, Z.; Hoey, T.; Liu, Y.; Wang, C. Land subsidence over oilfields in the Yellow River Delta. Remote Sens. 2015, 7, 1540–1564. [Google Scholar] [CrossRef] [Green Version]
  11. Liu, Y.L.; Huang, H.J.; Dong, J.F. Large-area land subsidence monitoring and mechanism research using the small baseline subset interferometric synthetic aperture radar technique over the Yellow River Delta, China. J. Appl. Remote Sens. 2015, 9, 096019. [Google Scholar] [CrossRef]
  12. Liu, Y.L.; Huang, H.J.; Liu, Y.X.; Bi, H.B. Linking land subsidence over the Yellow River delta, China, to hydrocarbon exploitation using multi-temporal InSAR. Nat. Hazards 2016, 84, 271–291. [Google Scholar] [CrossRef]
  13. Zhang, J.Z.; Huang, H.J.; Bi, H.B. Land subsidence in the modern Yellow River Delta based on InSAR time series analysis. Nat. Hazards 2015, 75, 2385–2397. [Google Scholar] [CrossRef]
  14. Zhang, B.W.; Wang, R.; Deng, Y.K.; Ma, P.F.; Lin, H.; Wang, J.L. Mapping the Yellow River Delta land subsidence with multitemporal SAR interferometry by exploiting both persistent and distributed scatterers. ISPRS J. Photogramm. Remote Sens. 2019, 148, 157–173. [Google Scholar] [CrossRef]
  15. Corbau, C.; Simeoni, U.; Zoccarato, C.; Mantovani, G.; Teatini, P. Coupling land use evolution and subsidence in the Po Delta, Italy: Revising the past occurrence and prospecting the future management challenges. Sci. Total Environ. 2019, 654, 1196–1208. [Google Scholar] [CrossRef]
  16. Minderhoud, P.S.J.; Coumou, L.; Erban, L.E.; Middelkoop, H.; Stouthamer, E.; Addink, E.A. The relation between land use and subsidence in the Vietnamese Mekong delta. Sci. Total Environ. 2018, 634, 715–726. [Google Scholar] [CrossRef] [PubMed]
  17. Zhang, Y.; Huang, H.J.; Liu, Y.X.; Liu, Y.L. Self-weight consolidation and compaction of sediment in the Yellow River Delta, China. Phys. Geogr. 2017, 1, 1–15. [Google Scholar] [CrossRef]
  18. Zou, Z.G.; Zhang, D.S.; Tan, Z.R. Ground brine resource and its exploitation in Shandong province. Geol. Surv. Res. 2008, 31, 214-21. [Google Scholar]
  19. Wen, W.; Mendel, J.M. Maximum-likelihood classification for digital amplitude-phase modulations. IEEE Trans. Commun. 2000, 48, 189–193. [Google Scholar] [CrossRef]
  20. Fisher, R.A. Contributions to Mathematical Statistics; John Wiley & Sons: Hoboken, NJ, USA, 1950; pp. 1–56. [Google Scholar]
  21. Eastman, J.R. Idrisi Guide to GIS and Image Processing; Clark Labs: Worcester, MA, USA, 1999; pp. 1–144. [Google Scholar]
  22. Anand, J.; Gosain, A.K.; Khosa, R. Prediction of land use changes based on Land Change Modeler and attribution of changes in the water balance of Ganga basin to land use change using the SWAT model. Sci. Total Environ. 2018, 644, 503–519. [Google Scholar] [CrossRef]
  23. Yao, Y.Q.; Yuan, F. Analysis on development status and exploitation potential of shallow brine resources in Dongying City. Shandong Land Resour. 2013, 1, 41–44. [Google Scholar]
  24. Feng, S.T.; Tan, X.F.; Liu, G. Analysis of exploitation potential of underground brine resources in Shandong Province. Shandong Land Resour. 2013, 1, 69–73. [Google Scholar]
  25. Ma, T.; Li, X.; Bai, J.; Cui, B. Tracking three decades of land use and land cover transformation trajectories in China’s large river deltas. Land Degrad. Dev. 2019, 30, 799–810. [Google Scholar] [CrossRef]
  26. Zhang, Y.; Huang, H.J.; Liu, Y.X.; Liu, Y.L.; Bi, H.B. Spatial and temporal variations in subsidence due to the natural consolidation and compaction of sediment in the yellow river delta, china. Mar. Georesour. Geotechnol. 2019, 37, 152–163. [Google Scholar] [CrossRef]
  27. Zhang, Y.; Huang, H.J.; Liu, Y.X.; Bi, H.B.; Zhang, Z.H.; Wang, K.F.; Yan, L.W. Impacts of soft soil compaction and groundwater extraction on subsidence in the Yellow River Delta. Mar. Georesour. Geotechnol. 2020, 1, 1–8. [Google Scholar] [CrossRef]
Figure 1. The location of the study area is outlined by the yellow polygon within the standard false-color Landsat 8 OLI image of the Yellow River Delta in September 2017.
Remotesensing 13 04563 g001
Figure 2. Land subsidence rate maps ((a,c,d,) derived from InSAR; (b) geodetic leveling) [11,13].
Remotesensing 13 04563 g002
Figure 3. Comparison between InSAR and leveling measurements from 2016 to 2017.
Remotesensing 13 04563 g003
Figure 4. Land-use maps of the coastal area of the Yellow River Delta, China, derived from Landsat images from 1984, 1992, 2000, 2007, 2010, and 2017.
Remotesensing 13 04563 g004
Figure 5. Changes in the area of each land-use type for each classified Landsat image.
Remotesensing 13 04563 g005
Figure 6. Statistics of the subsidence for unchanged land-use types from P1 (1992–2000) and P2 (2007–2010) to P3 (2016–2017).
Remotesensing 13 04563 g006
Figure 7. Statistics of the subsidence for changed land-use types in P1 (1992–2000) and P2 (2007–2010).
Remotesensing 13 04563 g007
Figure 8. Distribution map of brine exploitation potential (see Section 3.4) and land-use distribution map in 2050 based on the LCM model.
Remotesensing 13 04563 g008
Figure 9. Cumulative distribution functions (CDF) of the subsidence rates in two periods.
Remotesensing 13 04563 g009
Table 1. The detailed information of the six Landsat satellite images.
Sensor IDDate AcquiredPath/Row ResolutionCloud Cover
Landsat5 TM3 September 1984121/3430 m × 30 m9.92%
Landsat5 TM24 August 1992121/3430 m × 30 m0.02%
Landsat5 TM17 October 2000121/3430 m × 30 m0.42%
Landsat7 ETM+11 September 2007121/3430 m × 30 m0.31%
Landsat7 ETM+17 November 2010121/3430 m × 30 m0
Landsat8 OLI30 September 2017121/3430 m × 30 m3.08%
Table 2. Evaluation criteria for brine resource potential.
Zoning StandardsP ≥ 1.20.8 < P < 1.2P < 0.8
Evaluationpotential areacompensation balance areaoverexploitation area
Table 3. Validation statistics of each land-use map.
Land-Use198419922000200720102017
Overall accuracy94.892.691.692.080.590.1
Table 4. Land use/cover change transfer matrix of the study area in P1 (percentage).
Bare FieldFarmForestResidentialSaline Land Salt PanShrimp FarmWaterTotal 1992
Bare field130804132647
Farm011000001
Forest12140020221
Resident000000000
Saline land100011004
Salt pan0000090010
Shrimp farm0000037011
Water101011026
Total in 20071732506291010100
Table 5. Land use/cover change transfer matrix of the study area in P2 (percentage).
Bare FieldFarmForestResidentialSaline Land Salt PanShrimp FarmWaterTotal 2007
Bare field8000024217
Farm101000003
Forest80110041125
Resident000000000
Saline land401000106
Salt pan30021212129
Shrimp farm1000036010
Water2010131310
Total in 2017251152334137100
Publisher’s Note: MDPI stays neutral with regard to jurisdictional claims in published maps and institutional affiliations.

