Article

Biophysical Effects of Temperate Forests in Regulating Regional Temperature and Precipitation Pattern across Northeast China

1
School of Life Science, Liaoning Normal University, Dalian 116029, China
2
Remote Sensing and Geographic Information Research Center, Northeast Institute of Geography and Agroecology, Chinese Academy of Sciences, Changchun 130102, China
3
College of Geography Science, Changchun Normal University, Changchun 130031, China
4
Institute of Applied Ecology, Chinese Academy of Sciences, Shenyang 110016, China
5
Remote Sensing and Geographic Information Research Center, Changchun Jingyuetan Remote Sensing Observation Station, Chinese Academy of Sciences, Changchun 130102, China
*
Author to whom correspondence should be addressed.
Remote Sens. 2021, 13(23), 4767; https://0-doi-org.brum.beds.ac.uk/10.3390/rs13234767
Submission received: 1 November 2021 / Revised: 22 November 2021 / Accepted: 22 November 2021 / Published: 24 November 2021
(This article belongs to the Topic Climate Change and Environmental Sustainability)

Abstract

:
The temperate forests in Northeast China are an important ecological barrier. However, the way in which temperate forests regulate the regional temperature and water cycling remains unclear. In this study, we quantitatively evaluated the role that temperate forests play in the regulation of the regional temperature and precipitation by combining remote sensing observations with a state-of-the-art regional climate model. Our results indicated that the forest ecosystem could slightly warm the annual air temperature by 0.04 ± 0.02 °C and bring more rainfall (17.49 ± 3.88 mm) over Northeast China. The temperature and precipitation modification function of forests varies across the seasons. If the trees were not there, our model suggests that the temperature across Northeast China would become much colder in the winter and spring, and much hotter in the summer than the observed climate. Interestingly, the temperature regulation from the forest ecosystem was detected in both forested regions and the adjacent agricultural areas, suggesting that the temperate forests in Northeast China cushion the air temperature by increasing the temperature in the winter and spring, and decreasing the temperature in the summer over the whole region. Our study also highlights the capacity of temperate forests to regulate regional water cycling in Northeast China. With high evapotranspiration, the forests could transfer sufficient moisture to the atmosphere. Combined with the associated moisture convergence, the temperate forests in Northeast China brought more rainfall in both forest and agricultural ecosystems. The increased rainfall was mainly concentrated in the spring and summer; these seasons accounted for 93.82% of the total increase in rainfall. These results imply that temperate forests make outstanding contributions to the maintainance of the sustainable development of agriculture in Northeast China.

1. Introduction

Forest ecosystems are some of the crucial components of the terrestrial ecosystem. They provide a variety of ecosystem services, including water and soil conservation, carbon concentrations, climate regulation, and biodiversity maintenance, etc. [1,2,3]. Reforestation or afforestation is regarded as one of the most effective natural climate solutions in terms of maintaining warming below 2 °C [4,5]. China and various other countries have launched a series of forest protection and restoration programs to make full use of the role that forests play in improving the vulnerable ecological environment [6,7]. The six reports from the Intergovernmental Panel on Climate Change (IPCC) documented unprecedented global warming and increasingly frequent extreme events over the past decade resulting from human activities [8], suggesting that forests’ buffering impact on climate change has become more and more critical.
Generally, the forest ecosystem regulates the climate through biogeochemical processes and biogeophysical processes [9,10]. From the biochemical perspective, forest ecosystems are a crucial carbon sink, storing ~45% of terrestrial carbon [11]. Both tropical and temperate forests have high carbon storage capacities, and deforestation and forest fires convert the carbon sink into carbon dioxide sources, contributing to warming [12]. The biogeophysical processes are the energy, moisture, and momentum exchanges between the surface of the land and the atmosphere [13,14,15]. There is a general consensus regarding the cooling effects of tropical forests and the warming effects of boreal forests [16,17,18,19]. The competition between evapotranspirational cooling and albedo warming determines the final impact on temperature resulting from forests [20]. In tropical areas, deforestation significantly suppresses evapotranspiration (ET) and moderately increases albedo, exerting a warming influence on Earth’s climate [21]. Contrarily, deforestation in boreal regions strongly increases albedo and causes a slight decrease in ET, resulting in a cooling effect [18,19,22]. Bonan et al. (2008) believe that the net climate impact of temperate forests is highly uncertain because of the competition between low albedo in winter and high ET in summer [12]. As a result, the climate effects caused by temperate forests are much more complex, with apparent regional and seasonal dependence [23,24,25,26,27]. For example, Peng et al. (2014) demonstrated that afforestation in China cools the surface temperature, except in dry regions [23]. He et al. (2015) studied the impact of temperate forests on the local surface temperature, and found that the conversion from forests to farmland may lead to warming in summer and cooling in winter [24].
The temperate forests in Northeast China are a natural barrier for the Northeast Plain and Hulunbuir grasslands of Inner Mongolia. They play an indispensable role in maintaining the regional ecological balance and ensuring ecological security and environmental quality at the local and national levels. Furthermore, the Northeast Plain, surrounded by temperate forests, is one of the main grain-producing areas in China. The forest ecosystem provides plenty of ecological services at the regional scale, including water conservation, wind prevention, sand fixation, and climate regulation, which have been widely documented. However, the way in which the forest activity alters the agricultural climate, which may further influence crop growth and grain yield in the Northeast China plain, still lacks comprehensive understanding.
Therefore, the primary objective of this study was to quantitatively evaluate the role of forest ecosystems in the regulation of the temperature and precipitation pattern across Northeast China. First, spatial-temporal continuous multisource remote sensing datasets were used to characterize the land use/land cover pattern and surface properties for all the ecosystems in Northeast China. Moreover, we incorporated these remote sensing-based parameters into the regional climate model in order to better simulate the regional temperature and precipitation pattern. Thereafter, we adopted scenario simulations based on a regional climate model to identify the impact of forests on the regional temperature and precipitation. Finally, the biogeophysical mechanisms through which forest ecosystems regulate the regional temperature and water cycling were further analyzed, i.e., the energy exchanges and water cycling processes between the land surface and the atmosphere. Our study will provide a scientific basis for temperate forest ecological protection and decision support for the sustainable development of agriculture in Northeast China.

2. Materials and Methods

2.1. Study Area

Northeast China (Figure 1) extends from a latitude of 38°40′ N to 53°34′ N and a longitude of 115°05′ E to 135°02′ E [28]. Its total area is 1.24 million square kilometers, accounting for 12.9% of the total land area of China. It is primarily made up of mountains and plains. The mountains are mainly located in the east, west, and north of Northeast China, while the plains are in the middle and south. The climate is characterized as a temperate monsoon climate, with long and cold winters, and mild and wet summers. The average minimum temperature in January is lower than −20 °C, while the average temperature in July ranges from 18 °C to 20 °C. Influenced by the summer monsoon from the Pacific, most of the precipitation is concentrated in the summer, which can reach 400–700 mm. The soil types are mainly black soil, chernozem, dark brown soil, and brown soil, which provide excellent conditions for both forests and crops. Forests and farmland are the main landscape types in Northeast China, accounting for 35% and 30% of the total area, respectively. The forests in the region are mainly distributed in the mountains, including the Great Khingan Range, the Lesser Khingan Mountains, and the Changbai Mountains. Moreover, the farmland is primarily located in the plain regions, including the Songnen plain, the Liaohe plain, and the Sanjiang plain.
The temperate forests in Northeast China are cold-temperate coniferous forests in the north and temperate summer green forests in the south [29]. As a result, the forest composition is mainly characterized as deciduous coniferous forest, deciduous broadleaf forest, and mixed forest (Figure 2). The forest in Northeast China comprises one belt of the “two screens and three belts” national ecological security pattern. It is an essential ecological barrier for the environment in Northeast China. Northeast China is also China’s commodity grain production base, and thus, sustainable agricultural development is the primary objective in this region. Therefore, studying the way in which temperate forests modify the regional temperature and precipitation patterns is vital in order to fully understand the ecological functions of forests on both the individual forest and forest-agriculture ecosystem scale.

2.2. Data Sources

2.2.1. Land Use/Land Cover (LULC) Data

The land use/land cover data used in this study were divided into two parts: first, we selected the land use/land cover data in China from the resource and environmental science and data center of the Chinese Academy of Sciences (CAS). These LULC data were from Landsat Operational Land Imager, and had a spatial resolution of 1 km. Secondly, regarding the LULC pattern outside of China but within the simulation study area, we utilized the European Space Agency (ESA) climate change initiate (CCI) LULC data from 2015 [30]. Both LULC datasets were uniformly converted using the USGS LULC classification system, and then were projected onto the Lambert equal area projection system to match the model setup. Thereafter, the LULC percentage for each LULC category was calculated, and the primary LULC type in each 10 km grid was identified in order to update the original LULC-related datasets in the WRF model.

2.2.2. Other Surface Parameter Data

The spatially continuous surface parameter data used in this study mainly included leaf area index (LAI), the fraction of vegetation coverage (FVC), and albedo data. In the Noah land surface model, LAI and FVC are essential land surface parameters to express the energy, moisture, and carbon exchanges between the land surface and atmosphere. LAI reflects the physiological structure of plants and determines the water and carbon cycle for the vegetation canopy. For the water transfer process, LAI determines the canopy transpiration, respiration, and stomatal conductance, while for the carbon process, LAI is also an indispensable parameter for the calculation of vegetation photosynthesis and the soil carbon accumulation from falling leaves. In contrast, FVC is mainly involved in the energy and water cycle, which is used to calculate the physical processes, including radiation partitioning between vegetation canopy and soil, canopy evaporation interception, and precipitation interception and transmission to the surface. The LAI and FVC were obtained from the Global Land Surface Satellite Data Set (GLASS) [31], spanning from 1981 to 2018. The spatial resolution of the LAI and FVC data products is 0.05°, and the temporal resolution is eight days. In order to match the model requirements, the datasets were first integrated into monthly average data. Surface albedo data, which reflect the optical characteristics of the surface, were obtained from the fifth-generation reanalysis dataset of the European Center for medium range weather forecasting (ERA5-land) monthly dataset; they have a spatial resolution of 0.1°. In order to eliminate the impact of climate fluctuations on the surface parameters, we used the 3-year mean monthly averaged LAI, FVC, and albedo data from 2016 to 2018 to update the spatiotemporal data of the corresponding surface parameters in the WRF model.

2.2.3. Climate Forcing Data and Surface Meteorological Observational Data

We used the ERA5 data to provide the initial and boundary conditions for the model simulation. The ERA5 is a long-term, hourly climate reanalysis dataset, which has been widely used in climate change research [32]. The dataset provides near-real-time meteorological data concerning the surface and pressure levels from 1979, and has a spatial resolution of 0.25° × 0.25°. The meteorological observational data were obtained from the National Meteorological Science Data Center (http://data.cma.cn/, accessed on 8 May 2021). Our study area included 98 and 95 observational stations from 2016 to 2018 for temperature and precipitation, respectively. In this study, we used the annual average temperature and annual total precipitation to evaluate the accuracy of the model simulation results. We interpolated the meteorological observational data into the model resolution to eliminate the scale mismatch between the station and the model resolution using the Australian National University Spline (ANUSPLIN) method [33].

2.3. Experiment Design and Regional Climate Simulation

In this study, we used the weather research and forecasting (WRF) model to separate the biophysical impacts that forests have on the regional climate. The WRF model was developed by the National Center for Atmospheric Research (NCAR), the National Center for environmental prediction (NCEP), and other institutions, and has been widely used in numerical weather prediction and regional climate change research due to its flexibility in parametric scheme selection and simulation resolution setting [34]. The model has been registered and used by scientific researchers and relevant personnel in more than 160 countries. We chose the advanced research WRF (ARW) version 4.2 to conduct our experiments. As a result of the high spatial resolution of the ERA5 climate forcing data, we designed one domain covering Northeast China to carry out our simulation. The domain center is located at a latitude of 46° N and a longitude of 125° E. The horizontal resolution of the domain is 10 km, including 180 × 200 grids in the east-west and south-north directions (Figure 2).
We used two sets of simulation experiments, i.e., a forested scenario and an all-grassland scenario, to quantitatively evaluate the biophysical impact of the forest ecosystem on the local and regional climate. In the forested scenario, we used the LULC pattern from 2015, 3-year averaged monthly LAI, FVC, and albedo data from 2016 to 2018 to drive the regional climate model. Because there were no available LULC data from 2016 to 2018 in China from the Chinese Academy of Sciences, the LULC data from 2015 were used instead. In the all-grassland scenario, we assumed that all of the forests were degraded into grassland. All of the forests’ types from the LULC data were replaced with grassland, and the surface parameters—including LAI, FVC, and albedo—for the degraded forest were updated with the statistical mean values of grassland (Table 1). The surface parameters of the three dominant forest types are also displayed in Table 1 in order to distinguish the differences in the surface properties between forest and grassland. It should be noted that the input albedo in the WRF model was the background albedo, suggesting that the actual albedo in the snow-covered months should be calculated based on both the background albedo and snow properties, including the snow depth. Therefore, the snow albedo (SNOWALB) of the original forest (0.44) was replaced with the regional statistical mean values of grassland (0.66) to update the snow albedo in the all-grassland scenario.
In the two groups of scenario simulation experiments, we used the same initial and boundary conditions and the same surface physical parameterization schemes to isolate the contribution of forests to the regulation of the local and regional climate. Specifically, we used the ERA5 climate variables at 00:00 on 1 June 2015, to initialize the WRF model, and the data from 2015 to 2018 as the lateral boundary. The WRF model was started on 1 June 2015, and ran until 31 December 2018. The simulated model results from 1 June 2015 to 30 November 2015 were used for the model spin-up, and the results from the next three years and one month were used for further analysis. The differences between the forested and all-grassland scenarios were used to represent the biophysical impact of forests on the regulation of the regional climate. The scenario differences in air temperature at 2 m and the energy components—including incoming shortwave radiation, outgoing shortwave radiation, downward longwave radiation, upward longwave radiation, latent heat flux, sensible heat flux, and ground heat flux—were used to illustrate the temperature impact from forests, while the evapotranspiration, precipitation, and U-V wind were used to represent the impact of forests on water cycling.

3. Results and Discussion

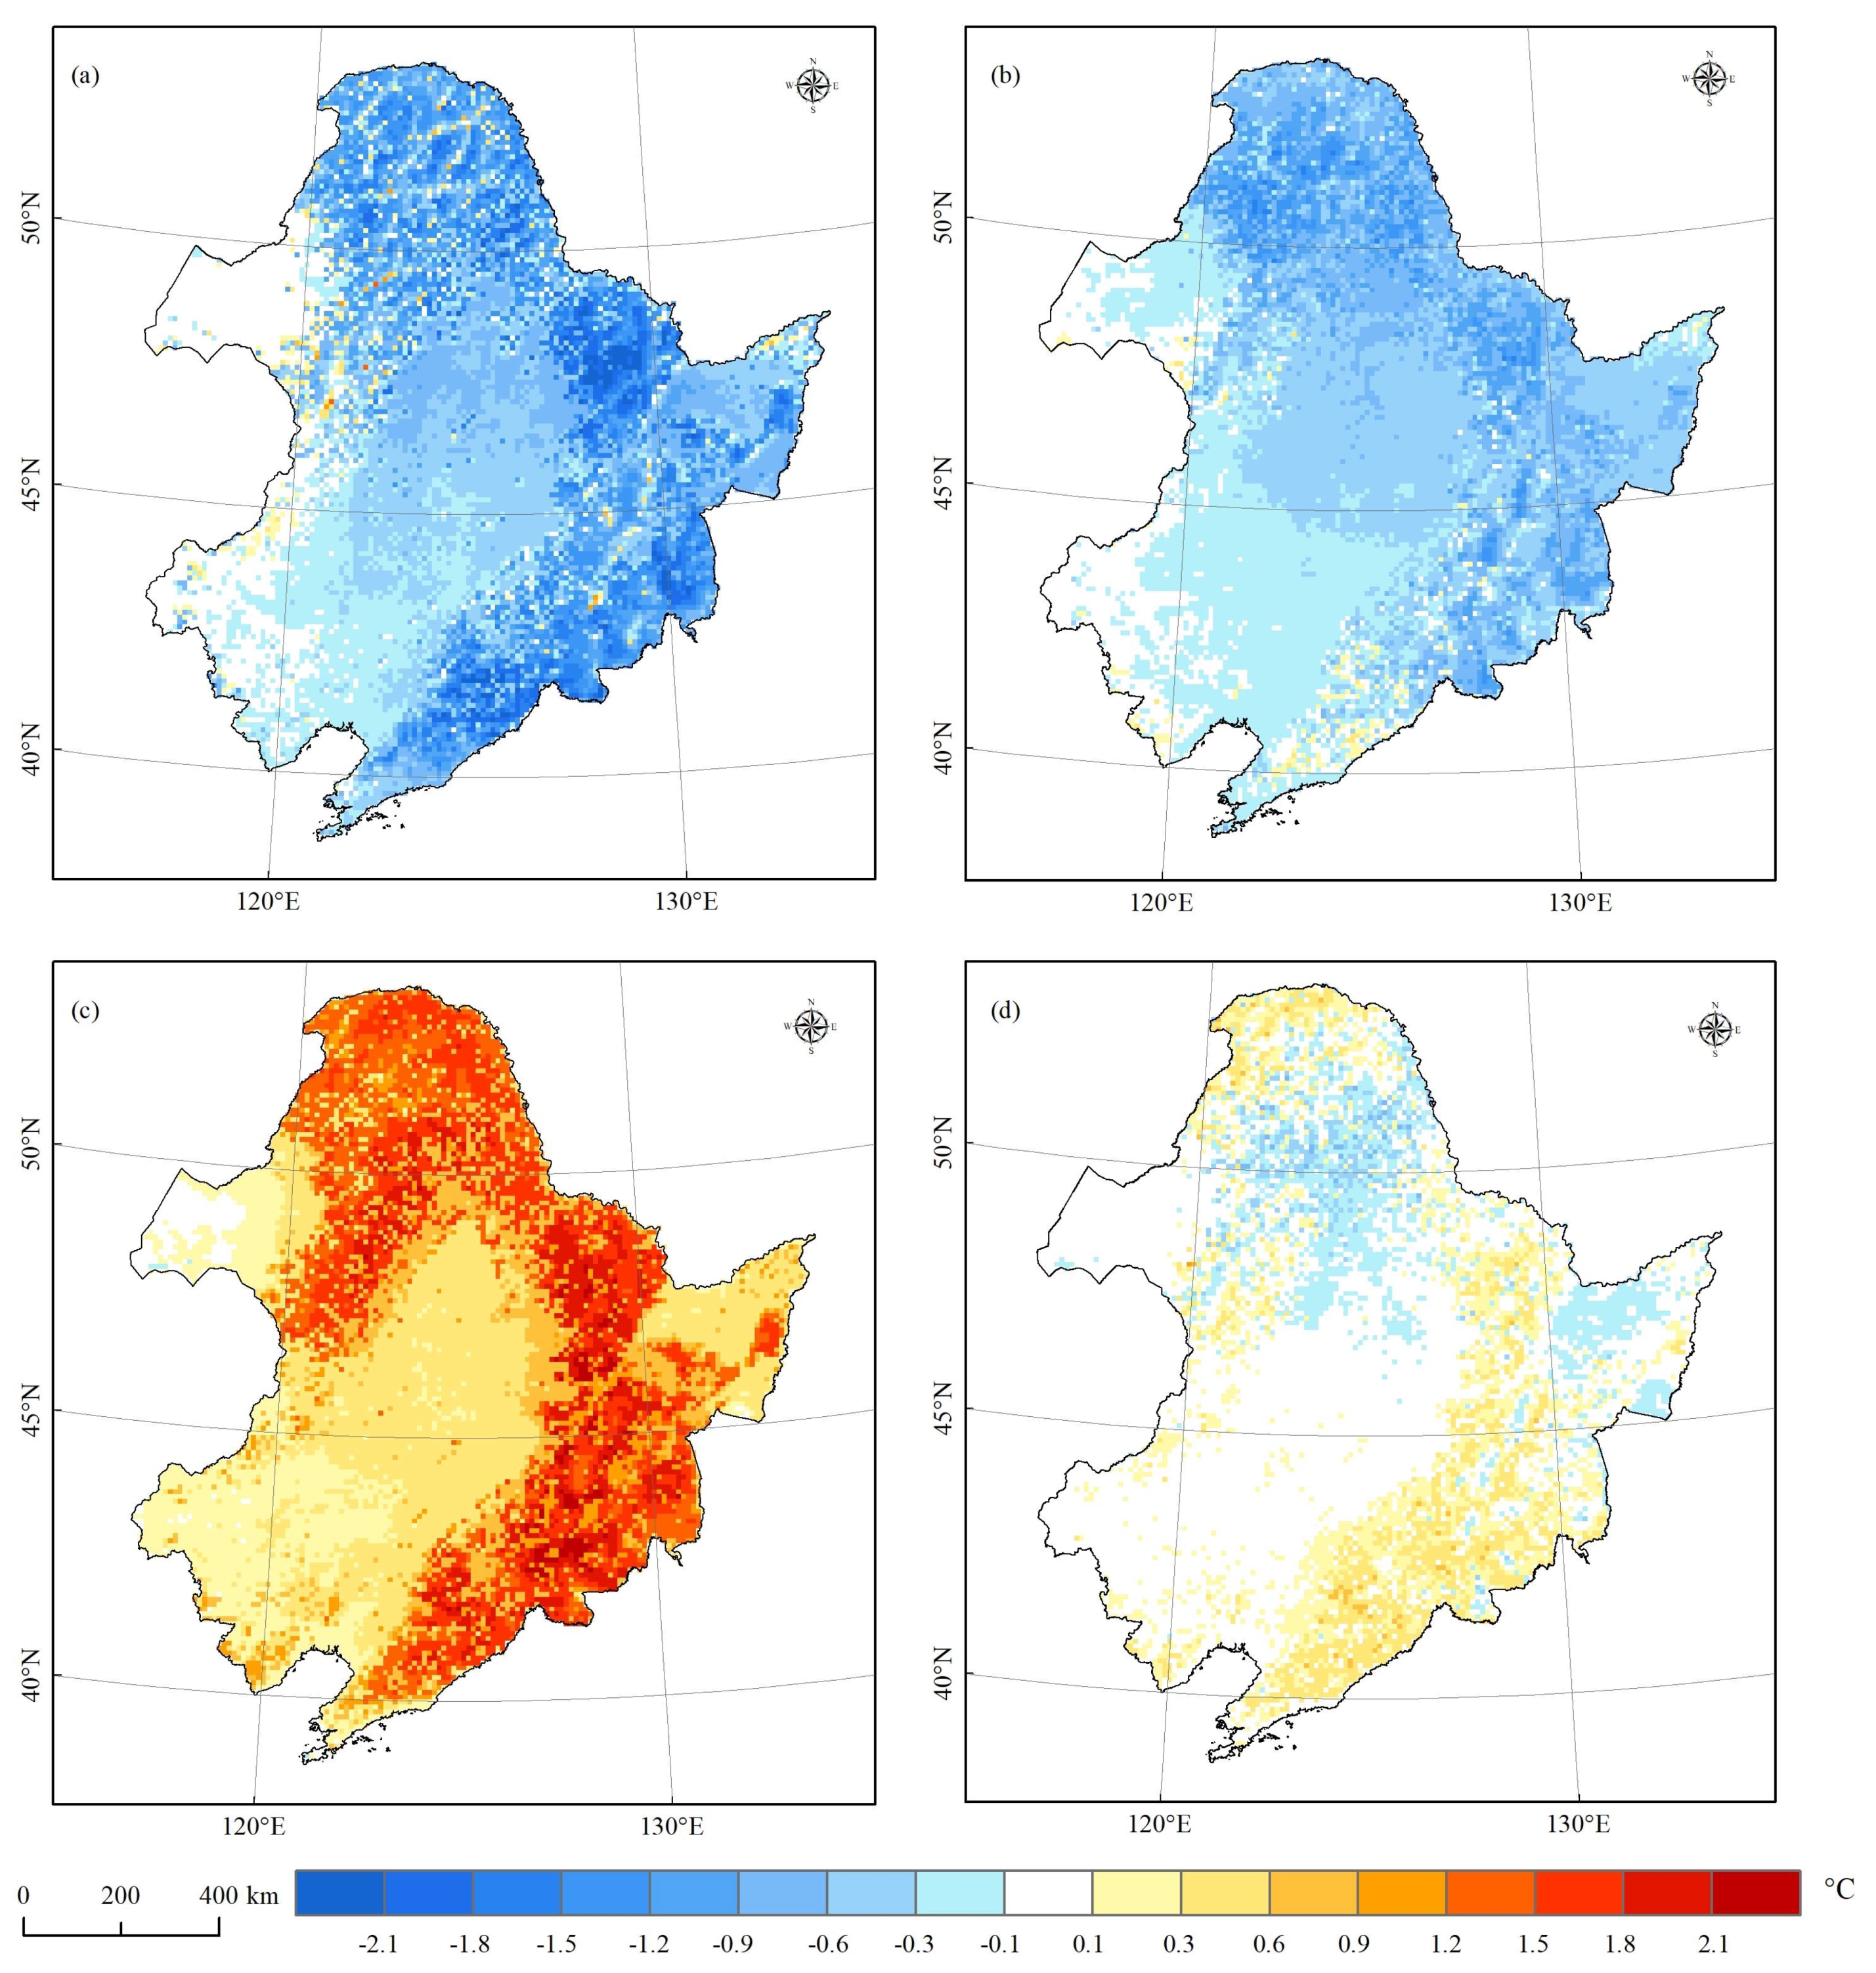
3.1. Biophysical Impact of Temperate Forests on the Local and Regional Air Temperature

In this study, we estimated the biophysical impact of temperate forests on both the local and regional temperature by combining a land surface model and a high-resolution regional climate model. On the basis of the differences between the simulated results of the forested scenario and the all-grassland scenario, we separated the role that temperate forests play in the regulation of the local and regional temperature (Figure 3). From the perspective of biogeophysical processes, the temperature-regulating effect of the temperate forest in Northeast China was generally characterized as a slight warming effect (0.04 ± 0.02 °C), which was generally consistent with various previous studies [35,36,37,38,39]. Moreover, the temperature regulation effects of the temperate forests exhibited significant seasonal differences. Generally, the forest activity in Northeast China decreased the annual temperature range by cooling the air temperature in the summer and autumn, and warming the air temperature in the winter and spring. Specifically, the summer air temperature would rise by 0.88 ± 0.05 °C (p < 0.01) and the autumn temperature would increase by 0.05 ± 0.04 °C if the trees were not there. In contrast, the winter and spring would become much colder, with the air temperature decreasing by 0.65 ± 0.06 °C and 0.44 ± 0.11 °C, respectively, if there were no trees.
Figure 3 illustrates the spatial pattern of the air temperature changes across different seasons compared to the scenario in which trees are absent. Generally, the temperature benefits from forests are usually evaluated locally or regionally based on observational and model simulation results. Contrary to previous studies, our results highlight the role that temperate forests in Northeast China play in the regulation of the temperature in the surrounding agricultural ecosystems. We found that temperate forests could warm the cropland by 0.47 ± 0.11 °C and 0.38 ± 0.10 °C in the winter and spring, respectively, and that they could cool the cropland by 0.51 ± 0.05 °C in the summer. This indicates that the forests provide a cushioning effect that acts against the regional cold and high temperatures in the cropland regions.
The surface energy budget and energy redistribution are often used to explain the mechanisms related to local temperature responses to land use and land cover changes. Given that the forest’s air temperature regulation varied across different seasons, we quantitatively evaluated how the forest ecosystem modifies the local temperature by altering shortwave radiation, longwave radiation, sensible heat flux, latent heat flux, and ground heat flux (Figure 4).
The simulated results from the regional climate model showed that forests significantly cooled the local summer air temperature, mainly due to their evapotranspiration being higher than grassland. Moreover, with higher surface roughness, the turbulent heat exchange between the forests and the atmosphere is more significant than when trees are absent. As a result, the latent heat flux would decline by 22.90 ± 2.05 W/m2 (p < 0.001). In the winter, the higher albedo with the loss of forest cover due to snow cover could significantly increase solar radiation reflection and reduce the net shortwave radiation by 18.39 ± 0.50 W/m2 (p < 0.001). Without the sheltering from forests, the decreased surface temperature would reduce the longwave radiation emitted by the surface and increase the net longwave radiation by 4.24 ± 0.35 W/m2 (p < 0.001). As a result, the surface net radiation would significantly decrease by 14.16 ± 0.40 W/m2 (p < 0.01) if the trees were not there. The ET differences between the forested and all-grassland scenarios are not evident (3.83 ± 0.48 W/m2, p < 0.001) compared with the net solar radiation, implying that the albedo-climate feedback plays a dominant role in determining the winter temperature changes. These results are in general accordance with the study of He et al. (2015) [23]. Using remote sensing observations and a space-for-time approach, He et al. (2015) concluded that the annual net climate effect, which signifies the land surface temperature change, is not evident because of the contrary effects of the energy budget change in summer and winter [23].
Unlike He et al.’s study, we also observed spring warming effects from forests. With lower snow albedos, forests can absorb more shortwave radiation (33.96 ± 2.78 W/m2, p < 0.01) in spring, the change magnitude of which is even greater than that in winter. This can be explained by the limited incoming solar radiation in winter, although with higher albedo differences. The growing season starts significantly earlier in the forests of Northeast China compared with the grassland. As a result, the latent heat flux in the forested scenario is higher by 15.76 ± 0.82 W/m2 (p < 0.001) due to stronger evapotranspiration. Due to forest loss, the sensible heat flux would reduce by 18.22 ± 1.65 W/m2 (p < 0.01) to balance the reduced net radiation. This means that the forest cooling effects due to evapotranspiration can be fully counteracted by the albedo warming effects in spring.

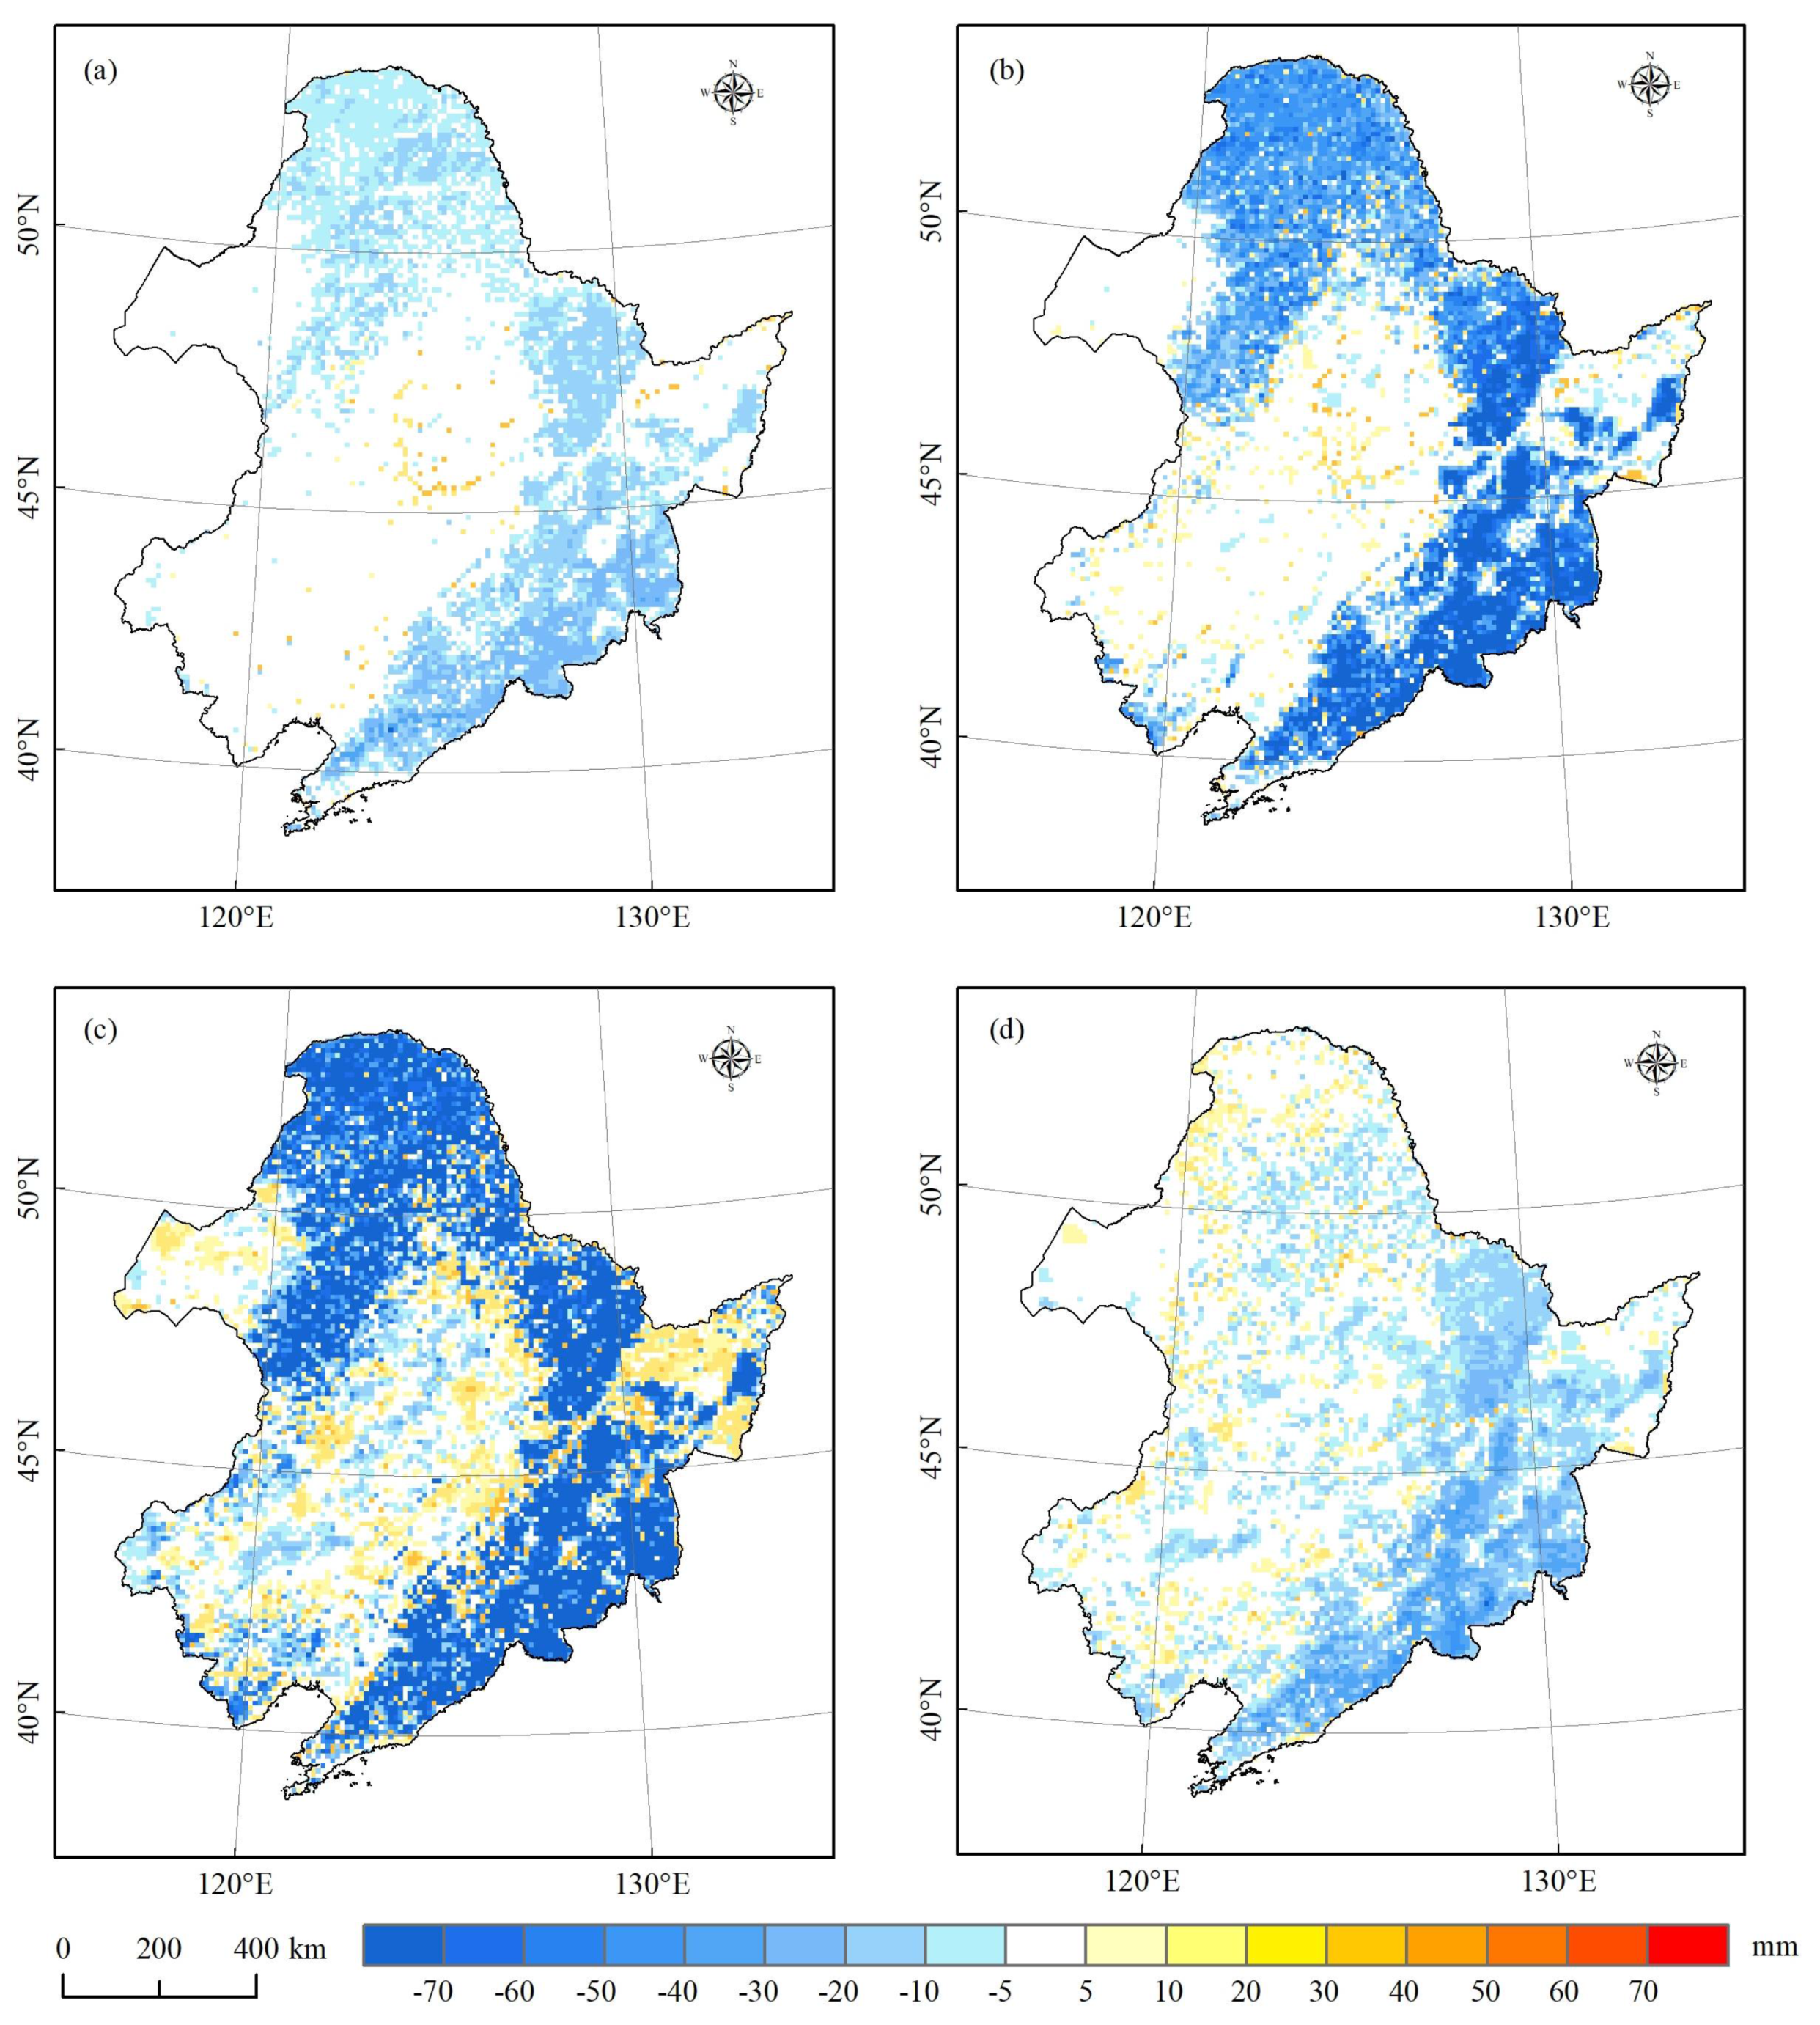
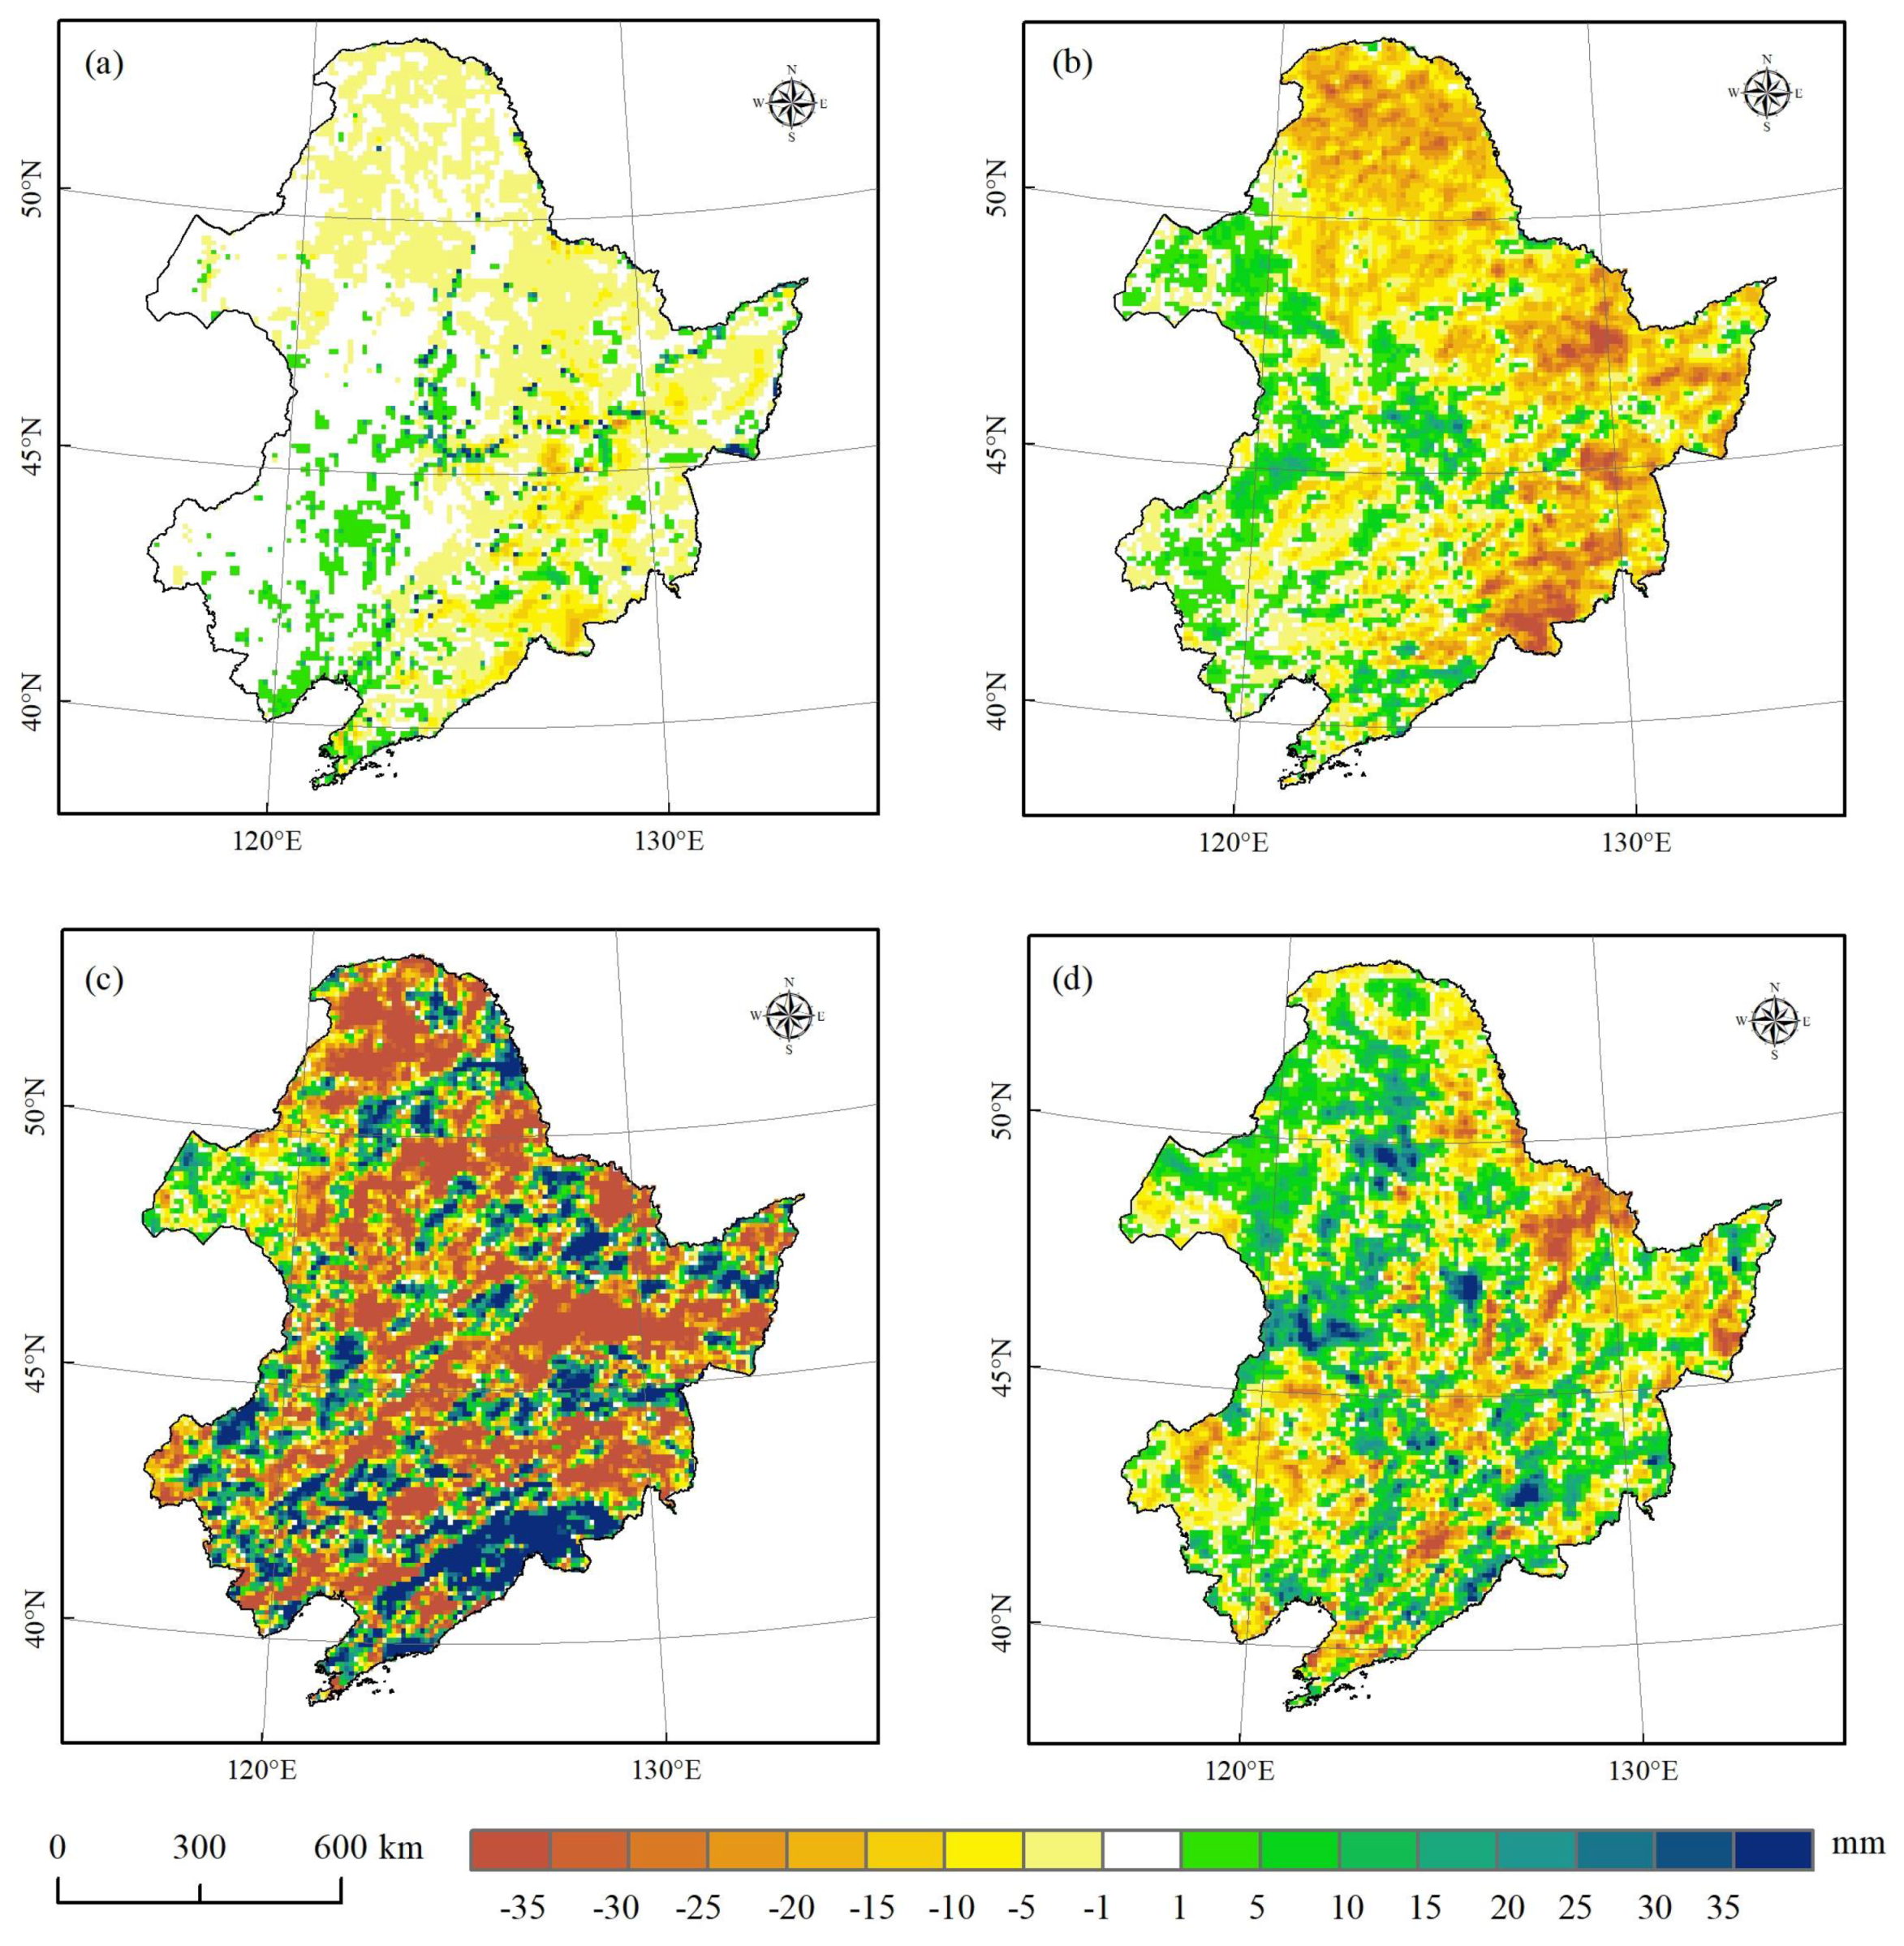
3.2. The Influence of Temperate Forests on the Regional Water Cycle

Evapotranspiration is one of the most important factors for the maintainance of the land surface water cycle. The simulated results indicated that temperate forests support higher rates of evapotranspiration compared with grassland. Without the forests, the total annual ET would decrease by 59.91 ± 0.44 mm (p < 0.001) in Northeast China. The decline in evapotranspiration was mainly concentrated in the summer, which registered decreases of 30.64 ± 2.68 mm (p < 0.01), followed by the spring (19.63 ± 1.00 mm, p < 0.05), autumn (5.60 ± 1.86 mm), and winter (4.10 ± 0.60 mm, p < 0.001). The spatial pattern of ET changes between the forested and all-grassland scenarios, as illustrated in Figure 5, showed that the significant ET changes were mainly concentrated in the forested areas.
Moreover, the ET responses showed apparent regional heterogeneity. The ET capacity of forests is highly dependent on latitude, forest type, season, and elevation [11,40,41,42]. Through all four seasons, the reduction in ET in the temperate forest areas at low latitudes was much more significant than that in the Great Khingan Range forests, which are located at a higher latitude. Because the deciduous broad-leaved forests at low latitudes have a larger leaf area index than the deciduous coniferous forests at a higher latitude, the evapotranspiration capacity of their vegetation canopy is higher. Furthermore, warmer temperatures have the potential to increase ET [43]. Compared with the all-grassland scenario, the temperate forests cool the summer air temperature, inhibiting the local ET in some agricultural areas without land surface changes. The summer ET in regions, including the west side of the Lesser Khingan and Changbai Mountains and the Sanjiang plain, would increase by approximately 10–30 mm if the forests were not there.
By comparing and analyzing the differences in precipitation in the two scenarios (Figure 6), we found that the forest ecosystem in Northeast China plays a critical role in the regulation of the regional precipitation patterns. Our climate model simulations showed that the forests increased the annual precipitation in Northeast China by 17.49 ± 3.88 mm compared with the all-grassland scenario. The precipitation improvement was most evident in the summer and spring seasons, which were 9.94 ± 5.08 mm and 6.46 ± 2.07 mm, respectively. The spatial pattern of the precipitation differences between the two scenarios, as illustrated in Figure 6, demonstrated that the precipitation regulation from forests was not only focused on the forested areas but also the surrounding regions. For example, the forest activity could increase the rainfall by 25.81 ± 7.86 mm in the forest ecosystem, and 55.68% and 29.19%, in the spring and summer, respectively. Regarding the agricultural ecosystem, our simulated results demonstrated that the annual precipitation would decrease by 21.31 ± 5.76 mm if the trees were not there, of which 15.60 ± 6.23 mm and 4.65 ± 0.88 mm occurred in the summer and spring. In some specific regions of the Songnen and Sanjiang plains, the loss of the forests would decrease the summer precipitation by more than 30 mm.
Sufficient water vapor and water vapor convergence are the conditions which are necessary for precipitation formation [42,44]. With higher surface roughness and surface drag coefficient, forests also modify the wind field and atmospheric circulation (Figure 7). The winter season in our study area is significantly affected by the extreme cold in Siberia. Without the forest barrier, the northwesterly wind on the northeast plain would intensify, bringing more cold air and reducing the air temperature in this region (Figure 3a). In the spring, although cyclonic conditions form in the border area between Northeast China and Russia, the evapotranspiration would decrease significantly if the forests were converted to grassland, making precipitation formation difficult due to a lack of water vapor.
In the summer, the forests can provide sufficient water vapor with higher evapotranspiration capacity, combining with the moisture convergence, generating more rainfall (Figure 6c). This is consistent with a recent study from O’Connor et al. (2021). They reported that the forest land cover in the upwind precipitationshed can reduce the monthly precipitation variability downwind [45]. The forest cover in the Lesser Khingan and Changbai mountains promoted atmospheric moisture recycling and caused increased precipitation in the plain regions compared to the scenario in which there is an absence of trees.

3.3. Model Validation and Uncertainty Analysis

By comparing the simulated model annual average temperature and precipitation data with the meteorological observational data, we found that the physical parameterization schemes and near-real-time surface parameters adopted in this study can accurately simulate the temperature and precipitation characteristics in Northeast China (Figure 8). Specifically, we found that the temperature simulated by the model had a cold bias of 0.07 °C, and the correlation coefficient with the observed temperature was 0.97. Regarding precipitation, the model overestimated the precipitation by 0.42 mm/d, and the correlation coefficient with the observed precipitation was 0.85. Considering the capability of the climate model to simulate precipitation, we assumed that the precipitation differences between scenarios are able to describe the precipitation benefits from forest ecosystems.

4. Conclusions

The temperate forest in Northeast China is an essential ecological barrier from the perspective of regional climate regulation. In this study, we quantitatively evaluated the role that temperate forests play in the regulation of the regional temperature and precipitation pattern by combining remote sensing observations and a state-of-the-art regional climate model (WRF). Our results indicated that the forest ecosystem slightly warms the annual air temperature by 0.04 ± 0.02 °C and brings more rainfall (17.49 ± 3.88 mm) over Northeast China. The temperature and precipitation modification function of forests varies across the seasons. If the trees were not there, our model suggests that the temperature across Northeast China would become much colder in the winter and spring, and much hotter in the summer than the observed climate. Interestingly, the temperature regulation from forest ecosystems was detected in both forested regions and the adjacent agricultural areas, suggesting that the temperate forests in Northeast China cushion the air temperature by increasing the temperature in the winter and spring, and decreasing the temperature in the summer over the whole region. Our study also highlights the capacity of temperate forests to regulate regional water cycling in Northeast China. With high evapotranspiration, the forests could transfer sufficient moisture to the atmosphere. Combined with the associated moisture convergence, the temperate forests in Northeast China brought more rainfall in both forest and agricultural ecosystems. The increased rainfall mainly occurred in the summer and spring; these seasons accounted for 93.82% of the total increase in rainfall.
It should be pointed out that there may exist some limitations in this study. First, our research assumed that the surface properties reflected by remote sensing products are reliable. In other words, the quality of the remote sensing products may affect the simulated results presented here. Second, this study used idealized experimental scenarios (forested and all-grassland) to evaluate the role that temperate forests play in the regulation of the regional temperature, precipitation, and atmospheric circulation in Northeast China. Future studies should assess the impact that the forest structure and changes in forest quality have on regional climates by using long-term observations and simulations to support regional ecological development and sustainable agricultural development.

Author Contributions

Conceptualization, L.Y.; investigation, Y.J.; methodology, T.L.; software, K.B.; visualization, K.B.; validation, Y.J. and G.L.; writing—original draft preparation, Y.J.; writing—review and editing, L.Y., T.L., L.S. and J.Y.; resources, S.Z. and H.Z.; project administration, L.Y. All authors have read and agreed to the published version of the manuscript.

Funding

This study was supported by the National Natural Science Foundation of China (41601093, 42071025), the Science and Technology Basic Resources Investigation Program of China (2017FY101301), a Strategic Priority Research Program (A) of the Chinese Academy of Sciences (XDA2003020301), and the 14th Five-year Network Security and Informatization Plan of the Chinese Academy of Sciences (WX145XQ06-07).

Institutional Review Board Statement

The study did not involve humans or animals.

Informed Consent Statement

The study did not involve humans.

Data Availability Statement

The land use/land cover data in China were from the resource and environmental science and data center of the Chinese Academy of Sciences (http://www.resdc.cn/ (accessed on 8 May 2021)). The CCI land cover data in 2015 are available from ESA (http://www.esa-landcover-cci.org/ (accessed on 8 May 2021)). Monthly LAI and FVC data were obtained from the product GLASS, which is available from the University of Maryland (http://www.glass.umd.edu/ (accessed on 8 May 2021)). The ERA5 and ERA5-Land reanalysis data were obtained from ECMWF (https://cds.climate.copernicus.eu/cdsapp#!/search?type=dataset&text=ERA5 (accessed on 8 May 2021)). The meteorological observation data were obtained from the China Meteorological Data Service Center (CMDC; http://data.cma.cn/en (accessed on 8 May 2021)) and the National Climate Data Center of the United States (https://gis.ncdc.noaa.gov/ (accessed on 8 May 2021)).

Acknowledgments

We sincerely appreciate the anonymous reviewers for their constructive comments and suggestions.

Conflicts of Interest

The authors declare no conflict of interest.

References

  1. Evaristo, J.; McDonnell, J.J. Global analysis of streamflow response to forest management. Nature 2019, 570, 455, reprinted in Nature 2020, 578, 326. [Google Scholar] [CrossRef]
  2. Farley, K.A.; Jobbagy, E.G.; Jackson, R.B. Effects of afforestation on water yield: A global synthesis with implications for policy. Glob. Chang. Biol. 2005, 11, 1565–1576. [Google Scholar] [CrossRef]
  3. Jackson, R.B.; Randerson, J.T.; Canadell, J.G.; Anderson, R.G.; Avissar, R.; Baldocchi, D.D.; Bonan, G.B.; Caldeira, K.; Diffenbaugh, N.S.; Field, C.B.; et al. Protecting climate with forests. Environ. Res. Lett. 2008, 3, 044006. [Google Scholar] [CrossRef]
  4. Griscom, B.W.; Adams, J.; Ellis, P.W.; Houghton, R.A.; Lomax, G.; Miteva, D.A.; Schlesinger, W.H.; Shoch, D.; Siikamaki, J.V.; Smith, P.; et al. Natural climate solutions. Proc. Natl. Acad. Sci. USA 2017, 114, 11645–11650. [Google Scholar] [CrossRef] [Green Version]
  5. Bastin, J.F.; Finegold, Y.; Garcia, C.; Mollicone, D.; Rezende, M.; Routh, D.; Zohner, C.M.; Crowther, T.W. The global tree restoration potential. Science 2019, 365, 76–79. [Google Scholar] [CrossRef] [PubMed]
  6. Liu, J.G.; Li, S.X.; Ouyang, Z.Y.; Tam, C.; Chen, X.D. Ecological and socioeconomic effects of China’s policies for ecosystem services. Proc. Natl. Acad. Sci. USA 2008, 105, 9477–9482. [Google Scholar] [CrossRef] [PubMed] [Green Version]
  7. Cai, D.; Ge, Q.; Wang, X.; Liu, B.; Goudie, A.S.; Hu, S. Contributions of ecological programs to vegetation restoration in arid and semiarid China. Environ. Res. Lett. 2020, 15, 114046. [Google Scholar] [CrossRef]
  8. IPCC. Climate Change 2021: The Physical Science Basis. Contribution of Working Group I to the Sixth Assessment Report of the Intergovernmental Panel on Climate Change; Cambridge University Press: Cambridge, UK, 2021. [Google Scholar]
  9. Pongratz, J.; Reick, C.H.; Raddatz, T.; Claussen, M. Biogeophysical versus biogeochemical climate response to historical anthropogenic land cover change. Geophys. Res. Lett. 2010, 37, L08702. [Google Scholar] [CrossRef] [Green Version]
  10. Devaraju, N.; Bala, G.; Nemani, R. Modelling the influence of land-use changes on biophysical and biochemical interactions at regional and global scales. Plant Cell Environ. 2015, 38, 1931–1946. [Google Scholar] [CrossRef] [PubMed]
  11. Bonan, G.B. Forests and climate change: Forcings, feedbacks, and the climate benefits of forests. Science 2008, 320, 1444–1449. [Google Scholar] [CrossRef] [Green Version]
  12. Bala, G.; Caldeira, K.; Wickett, M.; Phillips, T.J.; Lobell, D.B.; Delire, C.; Mirin, A. Combined climate and carbon-cycle effects of large-scale deforestation. Proc. Natl. Acad. Sci. USA 2007, 104, 9911. [Google Scholar] [CrossRef] [Green Version]
  13. Alkama, R.; Cescatti, A. Biophysical climate impacts of recent changes in global forest cover. Science 2016, 351, 600–604. [Google Scholar] [CrossRef] [Green Version]
  14. Perugini, L.; Caporaso, L.; Marconi, S.; Cescatti, A.; Quesada, B.; de Noblet-Ducoudre, N.; House, J.I.; Arneth, A. Biophysical effects on temperature and precipitation due to land cover change. Environ. Res. Lett. 2017, 12, 053002. [Google Scholar] [CrossRef]
  15. Zeng, Z.Z.; Piao, S.L.; Li, L.Z.X.; Zhou, L.M.; Ciais, P.; Wang, T.; Li, Y.; Lian, X.; Wood, E.F.; Friedlingstein, P.; et al. Climate mitigation from vegetation biophysical feedbacks during the past three decades. Nat. Clim. Chang. 2017, 7, 432–436. [Google Scholar] [CrossRef]
  16. Comarazamy, D.E.; Gonzalez, J.E.; Luvall, J.C.; Rickman, D.L.; Bornstein, R.D. Climate Impacts of Land-Cover and Land-Use Changes in Tropical Islands under Conditions of Global Climate Change. J. Clim. 2013, 26, 1535–1550. [Google Scholar] [CrossRef]
  17. Gullison, R.E.; Frumhoff, P.C.; Canadell, J.G.; Field, C.B.; Nepstad, D.C.; Hayhoe, K.; Avissar, R.; Curran, L.M.; Friedlingstein, P.; Jones, C.D.; et al. Tropical forests and climate policy. Science 2007, 316, 985–986. [Google Scholar] [CrossRef]
  18. Betts, R.A. Offset of the potential carbon sink from boreal forestation by decreases in surface albedo. Nature 2000, 408, 187–190. [Google Scholar] [CrossRef]
  19. Lee, X.; Goulden, M.L.; Hollinger, D.Y.; Barr, A.; Black, T.A.; Bohrer, G.; Bracho, R.; Drake, B.; Goldstein, A.; Gu, L.H.; et al. Observed increase in local cooling effect of deforestation at higher latitudes. Nature 2011, 479, 384–387. [Google Scholar] [CrossRef] [PubMed]
  20. Davin, E.L.; de Noblet-Ducoudré, N. Climatic Impact of Global-Scale Deforestation: Radiative versus Nonradiative Processes. J. Clim. 2010, 23, 97–112. [Google Scholar] [CrossRef]
  21. Feddema, J.J.; Oleson, K.W.; Bonan, G.B.; Mearns, L.O.; Buja, L.E.; Meehl, G.A.; Washington, W.M. The importance of land-cover change in simulating future climates. Science 2005, 310, 1674–1678. [Google Scholar] [CrossRef] [Green Version]
  22. Potter, S.; Solvik, K.; Erb, A.; Goetz, S.J.; Johnstone, J.F.; Mack, M.C.; Randerson, J.T.; Román, M.O.; Schaaf, C.L.; Turetsky, M.R.; et al. Climate change decreases the cooling effect from postfire albedo in boreal North America. Glob. Chang. Biol. 2020, 26, 1592–1607. [Google Scholar] [CrossRef]
  23. He, T.; Shao, Q.Q.; Cao, W.; Huang, L.; Liu, L.L. Satellite-Observed Energy Budget Change of Deforestation in Northeastern China and its Climate Implications. Remote Sens. 2015, 7, 11586–11601. [Google Scholar] [CrossRef] [Green Version]
  24. Peng, S.S.; Piao, S.L.; Zeng, Z.Z.; Ciais, P.; Zhou, L.M.; Li, L.Z.X.; Myneni, R.B.; Yin, Y.; Zeng, H. Afforestation in China cools local land surface temperature. Proc. Natl. Acad. Sci. USA 2014, 111, 2915–2919. [Google Scholar] [CrossRef] [Green Version]
  25. Arora, V.K.; Montenegro, A. Small temperature benefits provided by realistic afforestation efforts. Nat. Geosci. 2011, 4, 514–518. [Google Scholar] [CrossRef]
  26. Cao, Q.; Wu, J.G.; Yu, D.Y.; Wang, W. The biophysical effects of the vegetation restoration program on regional climate metrics in the Loess Plateau, China. Agric. Forest Meteorol. 2019, 268, 169–180. [Google Scholar] [CrossRef]
  27. Yu, L.; Liu, Y.; Liu, T.; Yan, F. Impact of recent vegetation greening on temperature and precipitation over China. Agric. Forest Meteorol. 2020, 295, 108197. [Google Scholar] [CrossRef]
  28. Yu, L.X.; Zhang, S.W.; Tang, J.M.; Liu, T.X.; Bu, K.; Yan, F.Q.; Yang, C.B.; Yang, J.C. The effect of deforestation on the regional temperature in Northeastern China. Theor. Appl. Climatol. 2015, 120, 761–771. [Google Scholar] [CrossRef]
  29. Zhang, S.W.; Zhang, Y.Z.; Li, Y.; Chang, L.P. Temporal and Spatial Characteristics of Land Use/Cover in Northeast China; Science Press: Beijing, China, 2006. [Google Scholar]
  30. ESA. Land Cover CCI Product User Guide Version 2. Tech. Rep. 2017. Available online: maps.elie.ucl.ac.be/CCI/viewer/download/ESACCI-LC-Ph2-PUGv2_2.0.pdf (accessed on 8 May 2021).
  31. Liang, S.L.; Zhao, X.; Liu, S.H.; Yuan, W.P.; Cheng, X.L.; Xiao, Z.Q.; Zhang, X.T.; Liu, Q.; Cheng, J.; Tang, H.; et al. A long-term Global LAnd Surface Satellite (GLASS) data-set for environmental studies. Int. J. Digit. Earth 2013, 6, 5–33. [Google Scholar] [CrossRef]
  32. NCAR. ERA5 Reanalysis (0.25 Degree Latitude-Longitude Grid). 2019. Available online: https://rda.ucar.edu/datasets/ds633.0/ (accessed on 8 May 2021).
  33. Hutchinson, M.F. Interpolation of Rainfall Data with Thin Plate Smoothing Splines—Part I: Two Dimensional Smoothing of Data with Short Range Correlation. J. Geogr. Inf. Decis. Anal. 1998, 2, 139–151. [Google Scholar]
  34. Skamarock, W.C.; Klemp, J.B.; Dudhia, J.; Gill, D.; Barker, D.M.; Duda, M.G.; Huang, X.Y.; Wang, W.; Powers, J.G. A Description of the Advanced Research WRF Version 3; NCAR Technical Note, NCAR/TN-475+STR; National Center for Atmospheric Research: Boulder, CO, USA, 2008.
  35. Betts, R.A. Afforestation cools more or less. Nat. Geosci. 2011, 4, 504–505. [Google Scholar] [CrossRef]
  36. Bonan, G.B. Effects of land use on the climate of the United States. Clim. Chang. 1997, 37, 449–486. [Google Scholar] [CrossRef]
  37. Betts, R.A. Biogeophysical impacts of land use on present-day climate: Near-surface temperature change and radiative forcing. Atmos. Sci. Lett. 2001, 2, 39–51. [Google Scholar] [CrossRef]
  38. Feddema, J.; Oleson, K.; Bonan, G.; Mearns, L.; Washington, W.; Meehl, G.; Nychka, D. A comparison of a GCM response to historical anthropogenic land cover change and model sensitivity to uncertainty in present-day land cover representations. Clim. Dyn. 2005, 25, 581–609. [Google Scholar] [CrossRef]
  39. Brovkin, V.; Claussen, M.; Driesschaert, E.; Fichefet, T.; Kicklighter, D.; Loutre, M.F.; Matthews, H.D.; Ramankutty, N.; Schaeffer, M.; Sokolov, A. Biogeophysical effects of historical land cover changes simulated by six Earth system models of intermediate complexity. Clim. Dyn. 2006, 26, 587–600. [Google Scholar] [CrossRef]
  40. Cerasoli, S.; Yin, J.; Porporato, A. Cloud cooling effects of afforestation and reforestation at midlatitudes. Proc. Natl. Acad. Sci. USA 2021, 118, e2026241118. [Google Scholar] [CrossRef]
  41. Zeng, Z.Z.; Wang, D.S.; Yang, L.; Wu, J.; Ziegler, A.D.; Liu, M.F.; Ciais, P.; Searchinger, T.D.; Yang, Z.L.; Chen, D.L.; et al. Deforestation-induced warming over tropical mountain regions regulated by elevation. Nat. Geosci. 2021, 14, 23–29. [Google Scholar] [CrossRef]
  42. Yu, L.; Xue, Y.; Diallo, I. Vegetation greening in China and its effect on summer regional climate. Sci. Bull. 2021, 66, 13–17. [Google Scholar] [CrossRef]
  43. Pascolini-Campbell, M.; Reager, J.T.; Chandanpurkar, H.A.; Rodell, M. A 10 per cent increase in global land evapotranspiration from 2003 to 2019. Nature 2021, 593, 543–547. [Google Scholar] [CrossRef]
  44. Ge, J.; Pitman, A.J.; Guo, W.D.; Zan, B.L.; Fu, C.B. Impact of revegetation of the Loess Plateau of China on the regional growing season water balance. Hydrol. Earth Syst. Sci. 2020, 24, 515–533. [Google Scholar] [CrossRef] [Green Version]
  45. O’Connor, J.C.; Dekker, S.C.; Staal, A.; Tuinenburg, O.A.; Rebel, K.T.; Santos, M.J. Forests buffer against variations in precipitation. Glob. Chang. Biol. 2021, 27, 4686–4696. [Google Scholar] [CrossRef]
Figure 1. The geographic location of Northeast China.
Remotesensing 13 04767 g001
Figure 2. Spatial distribution of the land use/land cover in our simulation domain.
Remotesensing 13 04767 g002
Figure 3. Differences (all-grassland scenario minus the forested scenario) in the air temperature (°C) at 2 m in December–January–February (a) March–April–May (b) June–July–August (c) and September–October–November (d) between the forested and all-grassland scenarios.
Remotesensing 13 04767 g003
Figure 4. Differences (all-grassland scenario minus the forested scenario) in net shortwave radiation (NetS), net longwave radiation (NetL), net radiation (RN), latent heat flux (LE), sensible heat flux (SH), and ground heat flux (GRDFLX) for the forest ecosystem. (a) Winter; (b) spring; (c) summer; (d) autumn. *, **, and *** indicate that the differences are significant at p < 0.05, p < 0.01, and p < 0.001, respectively.
Remotesensing 13 04767 g004
Figure 5. Differences (all-grassland scenario minus the forested scenario) in evapotranspiration (mm) in December–January–February (a) March–April–May (b) June–July–August (c) and September–October–November (d) between the forested and all-grassland scenarios.
Remotesensing 13 04767 g005
Figure 6. Differences (All-grassland scenario minus forested scenario) in precipitation (mm) in December–January–February (a) March–April–May (b) June–July–August (c) September–October–November (d) between the forested and all-grassland scenarios.
Remotesensing 13 04767 g006
Figure 7. Differences (all-grassland scenario minus the forested scenario) in 700-hPa U-V wind (m/s) in December–January–February (a) March–April–May (b) June–July–August (c) and September–October–November (d) between the forested and all-grassland scenarios.
Remotesensing 13 04767 g007
Figure 8. Simulated and observed air temperature at 2 m, and precipitation.
Remotesensing 13 04767 g008
Table 1. The regional statistical monthly mean albedo, FVC (%), and LAI (m2/m2) for grassland and forests.
Vegetation TypesParametersJanuaryFebruaryMarchAprilMayJuneJulyAugustSeptemberOctoberNovemberDecember
GrassAlbedo0.200.200.200.200.200.190.190.180.180.190.190.20
FVC1.541.261.071.7010.7922.8032.8233.4418.144.512.291.86
LAI0.110.100.140.220.430.781.171.120.610.250.170.15
Mixed forestAlbedo0.260.240.230.190.170.170.170.160.150.180.230.24
FVC4.764.425.047.4326.8253.9267.4867.4340.0612.407.365.88
LAI0.290.270.320.631.272.002.672.581.570.740.460.36
Deciduous coniferous forestAlbedo0.330.320.280.210.130.130.140.130.120.180.270.32
FVC14.9814.0013.5120.8554.9380.2185.5679.1742.5322.3318.0916.45
LAI0.670.610.580.752.053.844.363.952.110.810.750.69
Deciduous broadleaf forestAlbedo0.340.330.290.160.150.160.160.150.130.140.250.29
FVC11.319.479.2019.3359.2779.4886.9685.1160.7723.7915.5413.38
LAI0.490.500.500.792.524.024.444.162.640.920.580.49
Publisher’s Note: MDPI stays neutral with regard to jurisdictional claims in published maps and institutional affiliations.

