
Study on Urban Spatial Pattern Based on DMSP/OLS and NPP/VIIRS in Democratic People’s Republic of Korea


1
Institute of Geographic Sciences and Natural Resources Research, Chinese Academy of Sciences, Beijing 100101, China
2
University of Chinese Academy of Sciences, Beijing 100049, China
*
Author to whom correspondence should be addressed.
Remote Sens. 2021, 13(23), 4879; https://0-doi-org.brum.beds.ac.uk/10.3390/rs13234879
Submission received: 18 October 2021
/
Revised: 25 November 2021
/
Accepted: 28 November 2021
/
Published: 1 December 2021
(This article belongs to the Special Issue Applications of AI and Remote Sensing in Urban Systems)
Abstract
:In recent years, much attention has been given to the current situation and trend regarding economic development in the Democratic People’s Republic of Korea (DPRK), of which urbanization is an important indicator. In the present study, (i) the urbanized area is estimated using DMSP/OLS and NPP/VIIRS, (ii) the current spatial pattern and the change characteristics of typical cities are revealed, and (iii) the scale and developmental stage of major cities in the DPRK are judged through comparison. Although the DPRK is relatively closed, the financial crisis in 2008 indirectly affected its economic development, and a large gap remains between the urbanization level of the DPRK and that of China and the Republic of Korea. The large cities in the DPRK are located mainly in its eastern coastal areas and western plains, and there has been no significant expansion in Pyongyang, Chungjin, and Hamhung in the past 28 years. Although economic construction has begun again recently in the DPRK, further reform and opening are required. As the DPRK’s relations with its neighbors and countries around the world improve, its economic development and urban construction will present a new pattern.
1. Introduction
The Korean Peninsula has been the focus of international politics for more than half a century. In recent years, as the situation on the Korean Peninsula has changed, much attention has been given to the current situation and trend regarding economic development in the Democratic People’s Republic of Korea (DPRK). Between 2006 and 2017, because of the nuclear issue, the United Nations Security Council adopted eight resolutions on sanctions against the DPRK, which isolated it economically and affected its economic development and the lives of its people [1]. However, since 2018, the situation in the DPRK has changed in several major ways, and the focus of its national work is changing gradually from developing nuclear weapons to economic construction. Richly endowed by nature, the DPRK plays an important role in the construction of Northeast Asia and is in the golden transportation hub [2]. However, although the DPRK has many opportunities, it also faces many challenges, such as an imbalanced industrial structure and a shortage of capital and technology [3]. Therefore, there is widespread concern all over the world about the current situation regarding the DPRK’s economic development and the future trend of its reform-opening. Therefore, studying the DPRK’s urbanization and urban development is important for understanding both the contemporary economic operation of the DPRK and its social changes [4].
Urbanization is a dynamic change process of urban regional expansion to the periphery, and it is always accompanied by the spatial expansion of urban construction land, resulting in a changed landscape pattern [5]. Currently, relevant research on urbanization and urban development in the DPRK is lacking. Some studies of urbanization development have focused mainly on the transformation of economic life and public life [6], urban internal spatial structure [7], and urban economic cooperation and coordinated development [8]. Many studies of the DPRK have focused mainly on its economy [9], politics [10], agriculture [11], food security [12], land use [13], natural environment [14], and military strategic status [15]. However, relatively few studies have used remote-sensing data to reveal the grid-scale urban spatial pattern of the DPRK and compare it with other countries.
Traditional remote-sensing monitoring uses land use and other data to analyze the dynamic changes of urban spatial structure in the horizontal or vertical direction by extracting construction land, such as via the linear spectral method [16], classified regression trees [17], and support vector machines [7]. However, traditional remote-sensing monitoring is weak when it comes to analyzing a large-scale urban system and its spatial structure. Also, there is no effective direct monitoring method for traditional remote-sensing data in the monitoring of urban socio-economic characteristics, and there are some problems such as low estimation accuracy and low resolution of estimation results [18]. By contrast, night-light remote-sensing images have been shown to reflect more intuitively the differences of human activities at night: they have the advantages of large coverage, timeliness, and easy access, and they can be used widely for researching urban problems with multiple scales and long time series [19]. DMSP-OLS and NPP-VIIRS data have been used widely to extract the range and change of urban areas, with the threshold method and machine learning algorithms being two of the main methods for doing so [20,21,22]. The threshold method can be used to extract urban areas with large range and long time series, with auxiliary data and other methods being often used to determine the threshold [23,24,25]. Machine learning algorithms use a priori knowledge about the remote-sensing data to select training samples for urban and non-urban areas, and the model for recognizing urban area is trained by a learning machine [26,27,28]. Increasing attention is being given to extracting urban areas using night-light remote-sensing data, but there is yet to be research on its application to the DPRK.
Based on the aforementioned research, we propose the following research objectives. First, we correct the two aforementioned sets of night-light data to obtain unified and comparable continuous data. Second, we obtain the DPRK’s urban built-up area information and human activity range using the night-light data, and we reveal its current urban spatial pattern and change characteristics. Finally, we compare the main cities of the DPRK with those of China and the Republic of Korea (ROK) to judge the current stage of urban development in the DPRK. The present research is innovative in the following aspects. First, we reveal the current developmental stage of major cities in the DPRK through regional comparison, which fills a gap in DPRK research. Second, we reveal the intensity and change characteristics of human activities through night-light data instead of daytime remote-sensing data.
2. Data and Methods
2.1. Data
2.1.1. Study Area
The DPRK is China’s land neighbor—bordering China’s three eastern provinces—and one of only five socialist countries in the world (Figure 1). The DPRK and ROK refer to the two same nation counties on the Korean Peninsula. Approximately 80% of the DPRK’s total land area comprises mountains, plateaus, and hills. Pyongyang is relatively flat, mainly plain and hilly. The main plains are Pyongyang plain and Shun’an plain. Measurements show that precipitation across the DPRK decreases from the south to the north. Arable land is located mainly in the western and southern regions including North Pyongan, South Pyongan, Pyongyang, North Hwanghae, and South Hwanghae. The longer rivers in the DPRK include Datong River and Licheng River. The DPRK’s major cities include Pyongyang, Chungjin, Hamhung, Nanpu, and Kaesong. Pyongyang—the capital—is the political, economic, and cultural center of the DPRK. Chungjin and Wonsan are the port cities of the DPRK. Hamhung is the second-largest city after Pyongyang, and Chungjin is the third-largest city in the DPRK.
2.1.2. Remote-Sensing Data
The Defense Meteorological Satellite Program (DMSP) Operational Linescan System (OLS) (Version 4) nighttime light datasets were released by the National Geophysical Data Center (NGDC), which was affiliated with the National Oceanic and Atmospheric Administration (NOAA). They contain the light from cities, towns, and other sites with persistent lighting, with ephemeral events (e.g., fires, gas flares, volcanoes, background noise) removed. We use the annual average steady light data representing the average light intensity at night.
The National Polar-orbiting Partnership (NPP) Visible Infrared Imaging Radiometer Suite (VIIRS) Day/Night Band (DNB) provides cloud-free, atmospheric-, terrain-, vegetation-, snow-, lunar-, and stray-light-corrected radiances for estimating daily nighttime light, inheriting and optimizing the DMSP/OLS low-light-level detection capability [29]. The NPP/VIIRS monthly data are available on the website of the Earth Observation Group (EOG) of NOAA/NGDC.
The DPRK is a closed country, and the available data are very limited. The reasons for choosing night-light data are as follows. First, there are no reliable urban statistics for the DPRK as a reference. Second, land-use data have multiple sources and diverse production methods, whereas the night-light data have been produced continuously since 1992, thereby maintaining data continuity and consistency. Third, night-light data contain much information about human and economic activities that is unavailable in daytime remote-sensing image data, and the DN value reflects the intensity of human and economic activities.
2.1.3. Other Data
The land-use data used in this paper are from the 1992 ESA-CCI dataset, which provides data once a year from 1992 to 2015. The CCI-LC project delivers consistent global LC maps at 300-m spatial resolution. The coordinate reference system used for the global land-cover database is a geographic coordinate system (GCS) based on the World Geodetic System 84 Reference Ellipsoid. The Global Human Settlement Layer (GHSL) project provides information about built-up areas for the years 1990, 2000, and 2015 (https://ghsl.jrc.ec.europa.eu/download.php?ds=bu (accessed on 17 November 2021)).
2.2. Methods
2.2.1. Data Preprocessing
The DMSP/OLS night-light images used in this paper are annual synthetic global stable light images, whereas the NPP/VIIRS ones come from the monthly synthetic average light radiation data product. The spatial resolution, temporal resolution, pixel DN value, and other characteristics of the two data sets are different, therefore to obtain continuous and comparable night-light data in long time series, the two types of night-light data must be corrected and fitted (Figure 2).
The DMSP/OLS and NPP/VIIRS data preprocessing includes Define Projection and Resample. Taking the DPRK, China, and the ROK as the research objects, we extract 34 DMSP/OLS stable night-light images from 1992 to 2012 and monthly NPP/VIIRS night-light images from 2013 to 2019 as the images to be corrected. The coordinates of all the night-light images are converted uniformly to Asia North Albers equal area conic, resetting the 15- and 30-arc-second raster images to one-square-kilometer grids.
2.2.2. DMSP/OLS Correction
In this paper, the invariant-region method is used to correct the DMSP/OLS night-light image dataset [30,31]. The overall method is divided into three steps: (i) determining the invariant target region and reference image, (ii) mutual correction and saturation correction, and (iii) continuity correction.
- (1)
- Determining the invariant target area. Hegang City in Heilongjiang Province in China is selected as the constant target area, and the global radiometric calibration image (F162006) obtained by the F16 satellite sensor from 28 November 2005 to 24 December 2006 is used as the reference image.
- (2)
- Mutual correction and saturation correction. The defects of the DMSP/OLS data mean that mutual correction and saturation correction are required. The key is to calculate the parameter value and estimate the correlation coefficient of the regression correction model of each expected correction image and reference image. The specific operational steps are as follows: mask the Hegang area in the F162006 reference image, extract the DN values of all pixels of each expected correction image, and list them into the same gray matrix. Exponential, linear, logarithmic, quadratic polynomial, and idempotent regression analyses are performed between the image to be corrected and the reference image, giving five groups of correlation coefficients R2 (Table 1). In this paper, the power regression model (1) is used to correct the NSL data:where DN is the original DN value of the DMSP/OLS data, DNcor is DN after intercalibration, and a and b are coefficients as listed in Table 1.
- (3)
- Continuous correction. Because of the problem of abnormal wave DN value of simultaneous interpreting images from different sensors and images acquired by different sensors in different years, continuity correction is needed [32]. To make full use of the information from multiple satellites in the same year, Equation (2) is used to correct the NSL data in the same year, and Equation (3) is used to make cross-year correction:where is the DN value of the ith lit pixel from the intra-annual composition in the nth year, and and are the DN values of the ith lit pixel from two inter-calibrated NSL data in the nth year (n = 1994, 1997, …, 2007):
2.2.3. DMSP/OLS and NPP/VIIRS Mutual Correction
The NPP-VIIRS imagery is a preliminary product containing the light from cities, towns, transportation corridors, gas flares, biomass burning, and background noise, and in some places it has features associated with the reflectance of light off bright surfaces, such as snow-covered mountains or bright playa lake beds [33]. The original NPP-VIIRS data contain some negative pixel values and abruptly large pixel values, which may be associated with background noise and the weak light reflected by high-reflectance surfaces (e.g., snow-capped mountains) [34]. To ensure the comparability and continuity of the DMSP/OLS data and NPP/VIIRS data, we refer to Shi’s method for correcting NPP/VIIRS night-light image data [35], which can be divided into the following four steps. (1) We assume that the lit areas in the 2013 NPP-VIIRS data and the 2013 corrected DMSP-OLS stable light data are one in the same and generate a mask with all pixels with positive DN values from the DMSP-OLS data and then multiply the NPP-VIIRS image by the mask to extract the preliminary denoised NPP-VIIRS data. (2) We generate a mask with all positive-value pixels from the DMSP-OLS imagery in 2010 and multiply the NPP-VIIRS imagery by the mask to derive a denoised nighttime light imagery. To address the issue of abrupt brightness, the threshold-value method in which the DN values cannot exceed the maximum of the most-developed region is used [36]. Beijing, Shanghai, Guangzhou, and Seoul are selected as the representative regions to extract the maximum DN value of the NPP/VIIRS data from 2014 to 2019, so as to obtain the complete denoised NPP/VIIRS data. (3) The mean-value method is used to combine the NPP/VIIRS monthly data into annual data year by year. All pixels with negative DN values are assigned a zero value. (4) Referring to (3), inter-annual correction is used to guarantee that the DN value of NPP-VIIRS in a given year is less than that in each subsequent year.
2.2.4. Extraction of Urban Built-Up Areas
We use the optimal-error-threshold method to extract urban land in China, the DPRK, and the ROK [37,38]. This method uses existing statistical data, statistical images, and other data as auxiliary data and takes the minimum difference between the light area and the urban built-up area in the statistical data as the optimal threshold. The light pixels whose DN values are higher than the optimal threshold correspond to the urban built-up area, and the rest are error pixels whose DN value is zero. This method follows three principles: (i) because of the obvious human activity in urban centers, there is correlation between nighttime light and human activity at night, and areas with high pixel values in night-light images have a high consistency with the spatial distribution of urban area [39,40,41]; (ii) because the light data used in this paper have been subjected to saturation correction and continuity correction, the threshold selection result in 1992 is the best threshold from 1992 to 2019; (iii) considering the administrative area and other factors, for most Chinese mainland cities, the city is a threshold extraction unit; larger areas are threshold extraction units based on the county. For, China’s Beijing, Tianjin, Chongqing, Shanghai, Hongkong, Macao, and Taiwan provinces, the provincial administrative region is taken as a threshold extraction unit (Table 2). For the DPRK and the ROK, the country is taken as a threshold extraction unit, a total of 366 regions. The reference comparison data are from ESA/CCI land-use data, and the explicit threshold used to extract the built-up area is given in the Supplementary Material (Table S1).
2.2.5. Urbanization Dynamic Expansion Index
Based on the corrected night-light images, we analyze the change trend of light-image urban built-up area by using three indicators: (i) the night-light image brightness mean DN value (MDN), (ii) the total DN value (TDN), and (iii) the increase rate of MDN (IRMDN):
where DNi is the DN value of the i pixel in the image, Ci is the number of i pixels in the image, DNmax and DNmin are the maximum and minimum values of light brightness, respectively, ni and Ni are the number of pixels and total pixels with brightness, respectively, MDNa and MDNb are the average brightnesses of a and b pixels with year, respectively, and IRMDN is the average brightness change rate of light in years a and b.
3. Results
3.1. Night-Light Brightness Changes in DPRK, China, and ROK
From 1992 to 2019, TDN in the DPRK, China, and the ROK increased overall (Figure 3). There was a short decrease in TDN in the three countries around 2008, showing a V-shaped fluctuation; this decrease in TDN in the three countries was caused mainly by the fluctuation of TDN in the DPRK (Figure 3). Over the past 28 years, TDN in the DPRK has tended to increase. Specifically, TDN in the DPRK increased the fastest before 1997, then the growth rate decreased significantly between 1997 and 2002 and then remained basically unchanged from 2002 to 2007. Around 2008, TDN showed a V-shaped fluctuation and then returned to its level before 2008; the reason for this may have been that China—the DPRK’s largest trading partner—was affected by the global economic situation. After the outbreak of the financial crisis, China reduced the import of minerals and other resources from the DPRK, trade between China and the DPRK decreased significantly, and the price of minerals decreased accordingly. Minerals account for a large proportion of the DPRK’s export industry, and the substantial reduction of trade indirectly affected its domestic market supply and economic development. After 1992, China’s TDN grew rapidly and has remained stable since 2014; there were also small fluctuations around 2008, but the fluctuation range was much smaller than that of the DPRK. Before 2002, TDN in the ROK grew rapidly, but it has remained basically unchanged since 2002; the ROK also showed weak fluctuations around 2008.
For the three countries, MDN shows different intensities, the order being ROK > China > DPRK. From 1992 to 2019, MDN of the DPRK, China, and the ROK grew stably as a whole, but there were large gaps between the MDN values of the three countries. The DPRK has the lowest MDN (MDNmax = 11.8), China’s is slightly higher (MDNmax = 17.4), and the ROK has the highest MDN (MDNmax = 39.2). From analyzing the change trend of MDN, the DPRK and China showed a small growth trend, in which the DPRK had a small fluctuation around 2008; by contrast, MDN in the ROK has remained stable since reaching its peak in 2002 (MDN = 39).
For the three countries, IRMDN has grown rapidly in different periods but has approached zero in recent years. From MDN, the DPRK grew the fastest before 1997 and even exceeded the growth rate of China and the ROK in some years. Since then, it has maintained a low growth rate, showing negative growth around 2008 and approaching zero after 2014. Before 2007, China continued to maintain a high growth rate, with an average growth rate of 6.56%. There was a short period of negative growth in 2008, and then it resumed positive growth. After 2014, the growth rate approached zero; the ROK only maintained a high growth rate before 2002, and then the growth rate approached zero.
3.2. Analysis of Urban Spatial Pattern and Change
In this paper, the optimal-error-threshold method is used to extract the relative error of urban construction land area in the DPRK, the ROK, and China, as given in Table 2. From the current situation regarding urban spatial pattern, the DPRK has initially formed three regional central cities: Pyongyang, Hamhung, and Chongjin (Figure 4). Its large cities are located mainly in its eastern coastal area and western plains, but the scale and number of cities in the latter are much higher than those in the former. There is a large gap in the scale of different cities in the DPRK: the scale of the capital Pyongyang is much larger than that of other cities; Nanpu, Sinuiju, Kanggye, Sunchon, Chongjin, Hamhung, and other cities are of medium sized and are distributed as dots; the built-up area of other cities and counties is relatively small. China’s large-scale cities are located mainly in its eastern coastal areas (Beijing–Tianjin–Hebei, Yangtze River Delta, and Pearl River Delta) and the provincial capitals of its central provinces. The ROK’s large cities are located mainly in its western coastal areas and the southeast, such as Seoul, Incheon, Busan, and Daegu.
From the change of urban spatial pattern, the built-up area of most cities in the DPRK has hardly increased from 1992 to 2019, and only a few dot-shaped built-up areas have increased. Pyongyang and a few cities show a certain increasing trend, and other cities increase weakly. The growth of urban built-up area in China is concentrated mainly in Beijing–Tianjin–Hebei, the Yangtze River Delta, and the Pearl River Delta. However, after the implementation of the “Rise of Central China” development strategy, the area of some cities in Central China has increased significantly. The growth of urban built-up areas in the ROK is concentrated mainly in Gyeonggi (Seoul, Incheon, etc.), South Gyeongsang (Busan, etc.), and North Gyeongsang (Daegu, etc.).
4. Discussion
4.1. Selection and Spatial Pattern of Typical Cities in DPRK
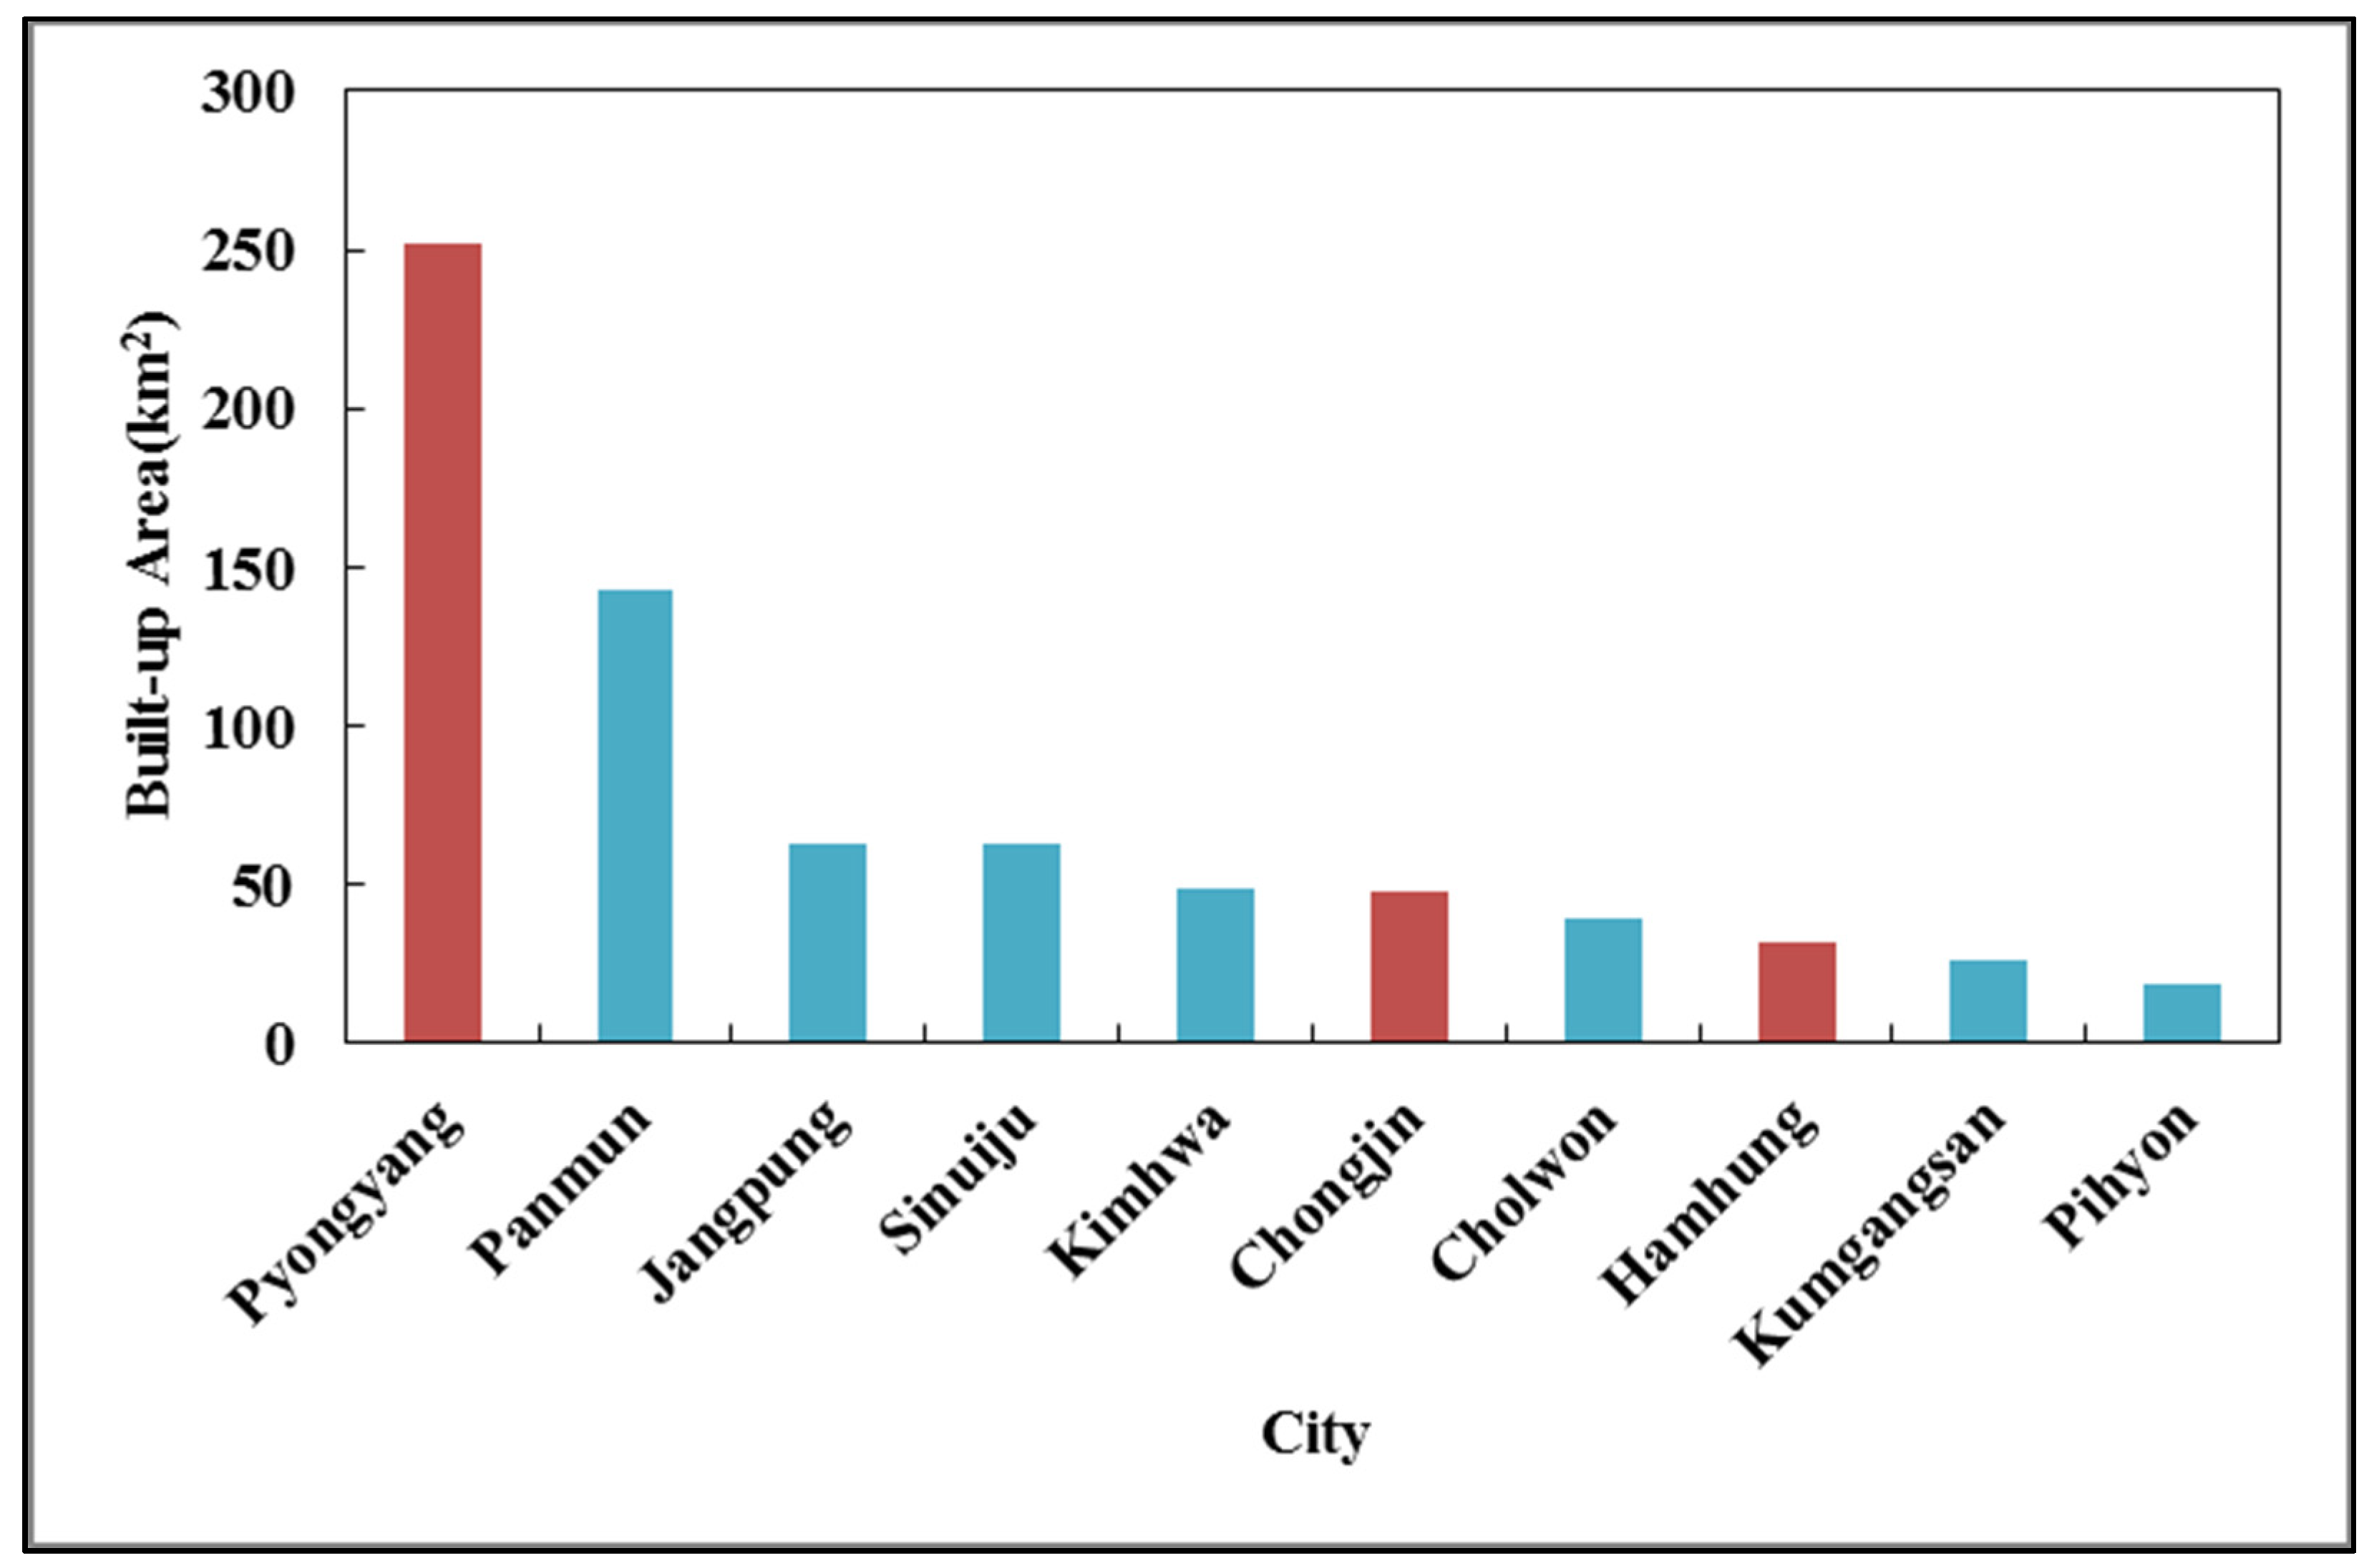
From the perspective of urban spatial scale, there are large gaps between different cities in the DPRK, and the number of relatively large cities is limited. Selecting typical cities in the DPRK as the research objects can help to understand its development. According to the statistical results for urban built-up area in 2019, the top ten cities in the DPRK are Pyongyang, Panmun, Jangpung, Sinuiju, Kimhwa, Chungjin, Cholwon, Hamhung, Kumgangsan, and Pihyon (Figure 5). Note that because of light-space overflow at the DPRK’s borders with China and the ROK [42], the statistical results for cities located at a border are often affected by cities of the neighboring country, as is the case for Sinuiju, Pihyon, and Kaesong (Panmunjom), for example. Therefore, the cities at the borders are not included as typical cities in the comparative analysis. Based on the statistical results and the locations of urban areas, Pyongyang, Chungjin, and Hamhung are selected as typical cities. Pyongyang is located in the middle of the DPRK, and Chungjin and Hamhung are located in its eastern coastal area, neither of which are affected by the spatial spillover effect.
In terms of urban built-up area, TDN, and MDN, Pyongyang ranks the highest in the DPRK (Table 3). In terms of urban built-up area, Pyongyang is the largest city in the DPRK, with an urban built-up area of 252 km2, accounting for 21.71% of the administrative area of Pyongyang. The urban built-up areas of Chungjin and Hamhung are 48 km2 and 32 km2, respectively; their urban scales are similar, belonging to the second level of urban scale in the DPRK. Compared with Pyongyang, Chungjin and Hamhung have only about a fifth of its urban built-up area. Regarding TDN, Pyongyang is still the largest in the DPRK (TDN = 10,269), with more than six times that of Chungjin (TDN = 1924) and more than 20 times that of Hamhung (TDN = 474). Regarding MDN, Pyongyang is also the largest in the DPRK (MDN = 40.75), with more than 1.3 times that of Chungjin (MDN = 33.90) and 2.5 times that of Hamhung (MDN = 14.81).
4.2. Dynamic Expansion of Typical Cities in DPRK
Taking Pyongyang, Chungjin, and Hamhung as typical cities, we reveal the law of urban dynamic expansion of the three cities in the past 28 years. In terms of urban area, Pyongyang, Chungjin, and Hamhung did not expand significantly from 1992 to 2019, and Chungjin has even decreased. However, TDN and MDN of the three cities showed an increasing trend (Table 3). They increased the most in Pyongyang (TDN increased by 3198 and MDN increased by 10.14), they increased slightly in Hamhung (TDN increased by 187 and MDN increased by 1.14), and they increased slightly in Chungjin (TDN increased by 67 and MDN increased by 8.33). From the maximum and minimum values of TDN and MDN, Hamhung remains basically unchanged, but the range in Pyongyang and Chungjin has increased significantly.
In terms of urban spatial structure, Pyongyang has always maintained a single-core urban structure, with the brightness highest in the center and decreasing gradually in the outer circumference (Figure 6). Note that the area of high brightness in the city center is shrinking and the area of low brightness around it is increasing. Chungjin and Pyongyang are similar in shape and show a similar change law. Hamhung has a double-core urban structure: the area of high brightness of the two centers is increasing, and the double-core structure is becoming more consolidated (Figure 5).
4.3. Comparison of Typical Cities in DPRK, China, and ROK
Cities in China and the ROK are selected for comparison with those in the DPRK to study urban development stage, scale, and area. According to geographical location, the DPRK is adjacent to Northeast China, has a similar natural geographical environment, and is inhabited by the Korean. Taking the county as the unit, the counties of Jilin Province and Liaoning Province in China are selected as typical regions for comparison, especially with the ROK.
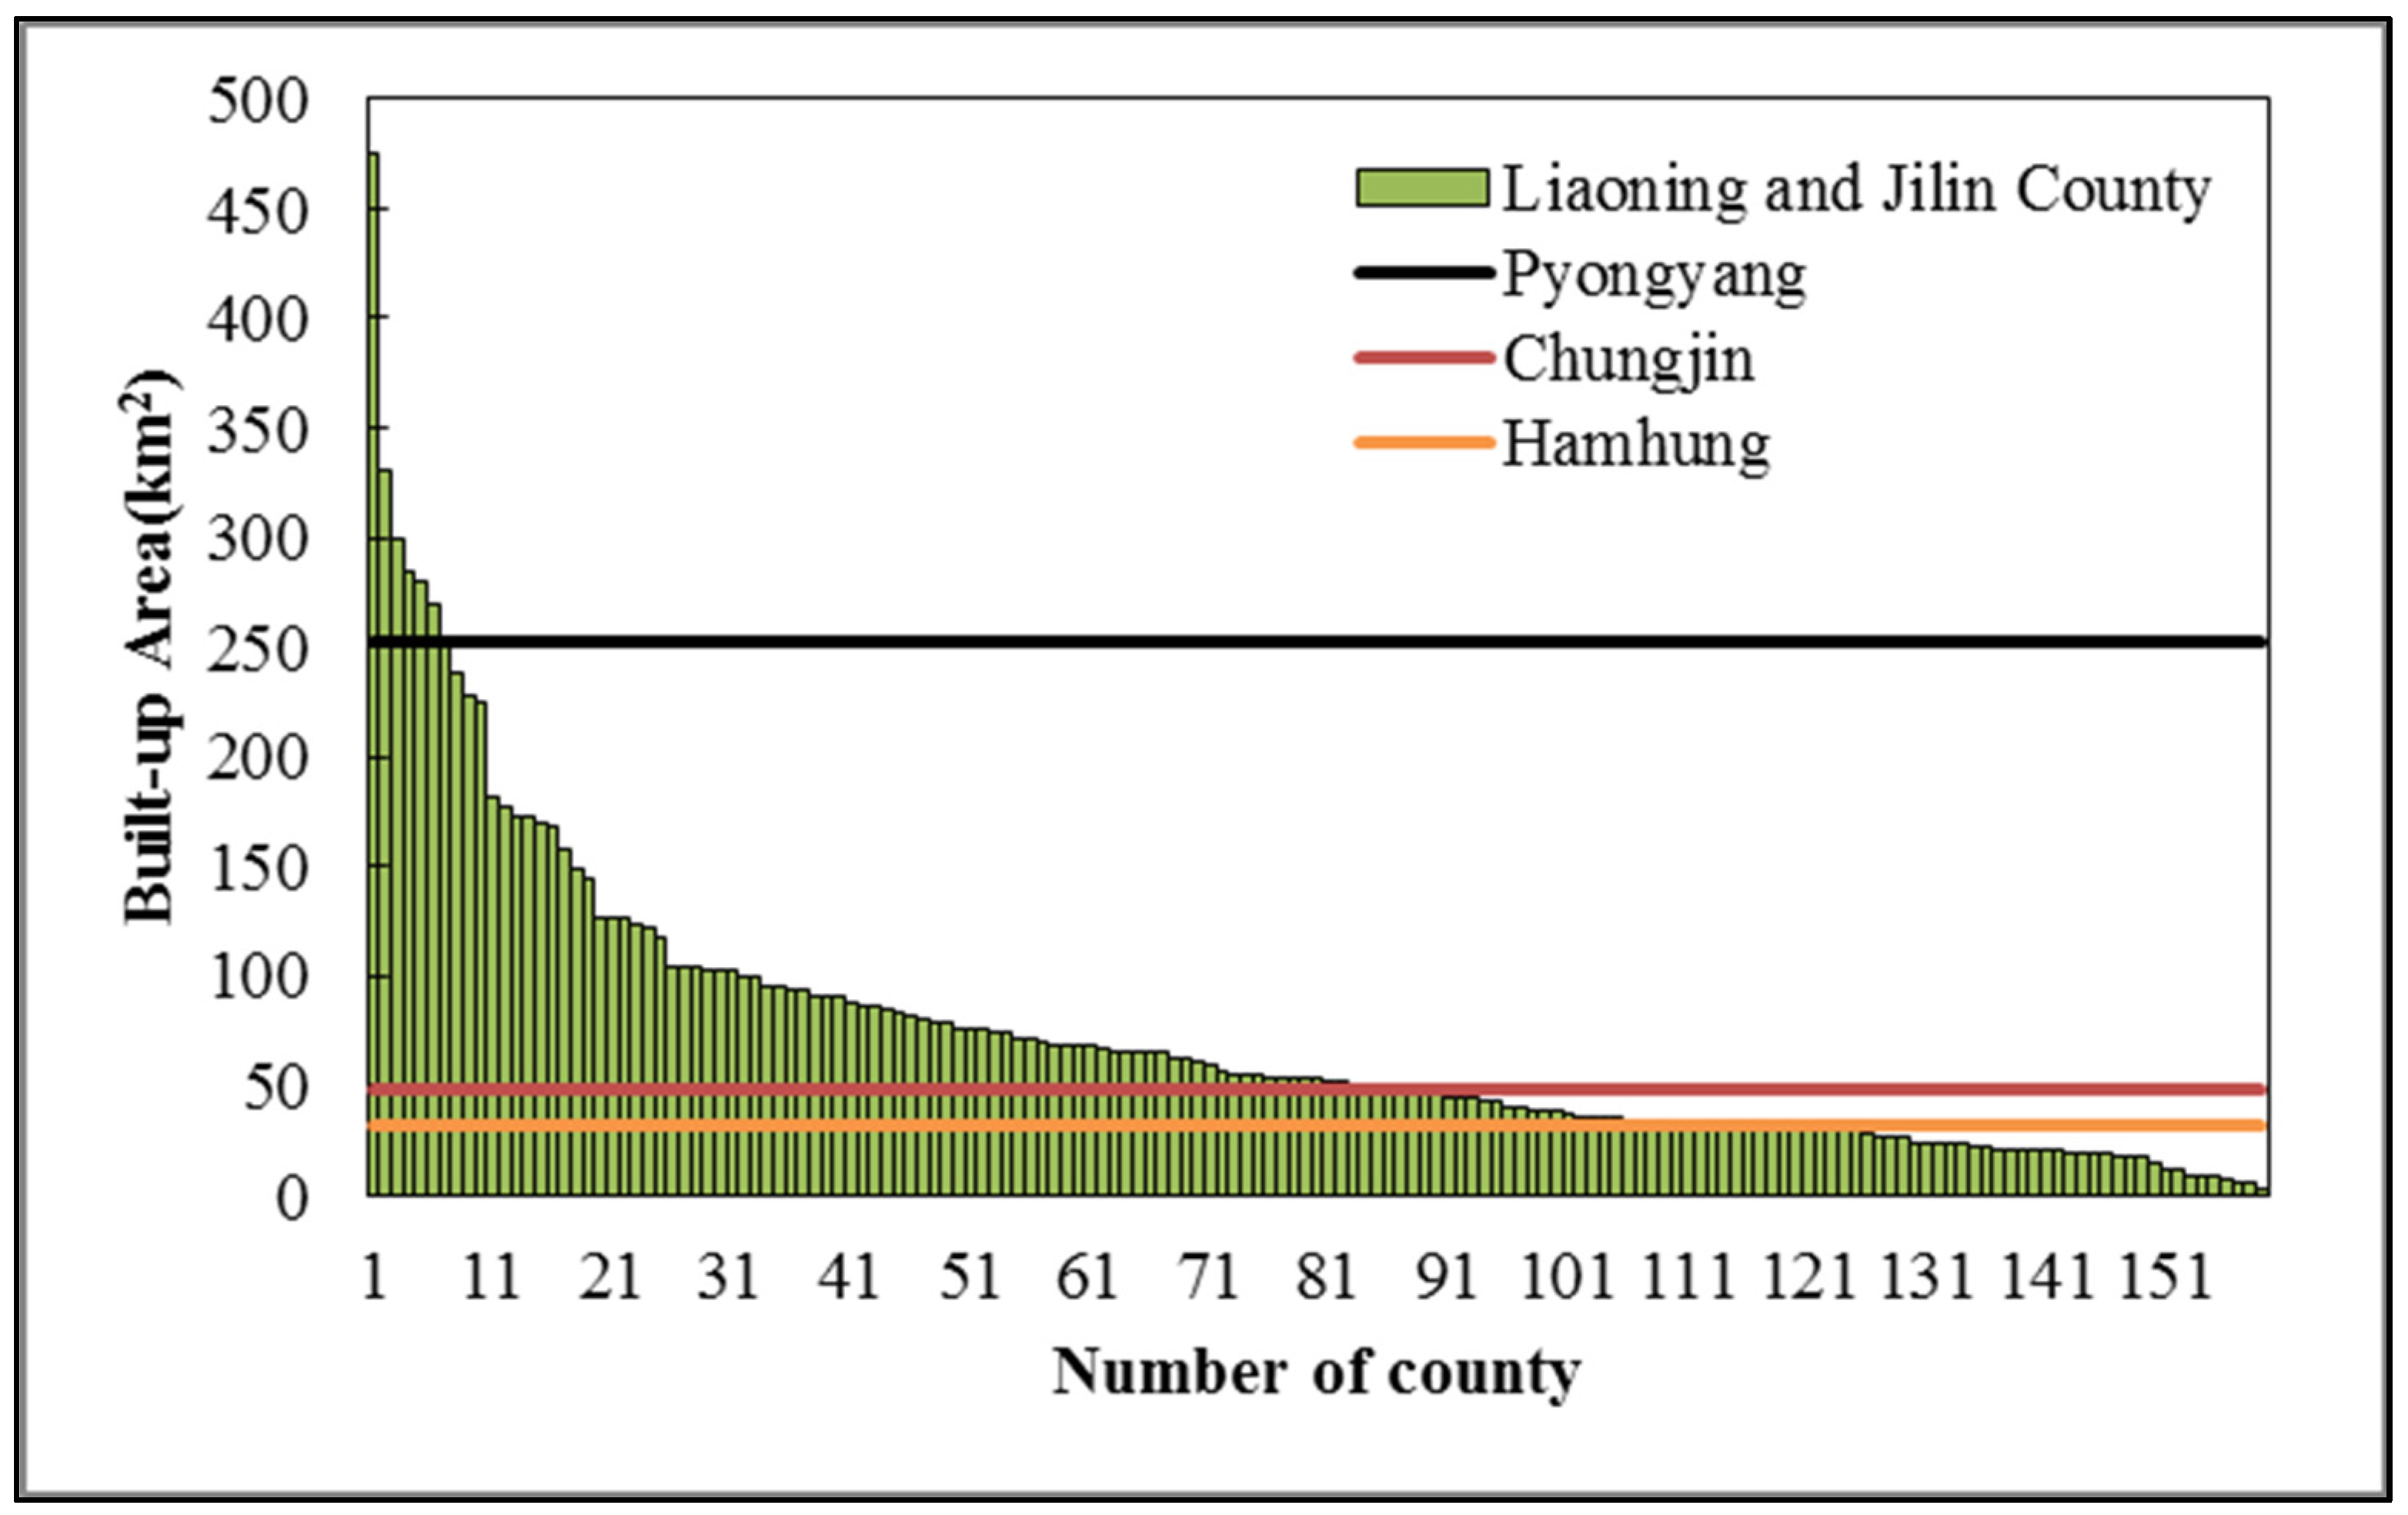
In 2019, the urban built-up area of Pyongyang was 252 km2, and the urban scale was at the upper levels of all counties in Liaoning Province and Jilin Province (Figure 7), equivalent to the built-up area of Dalian Jinzhou in Liaoning Province (251 km2) (Table 4). In 2019, the urban built-up areas of Chungjin and Hamhung were 48 km2 and 32 km2, respectively, which are only equivalent to the urban areas of Chaoyang Longcheng in Liaoning and Liaoyuan Xi’an in Jilin (47 km2 and 32 km2, respectively). Compared with the ROK, Pyongyang’s urban scale is at the upper level of counties (Figure 8). The urban built-up area of Pyongyang is equivalent to the built-up area of Pyeongtaek in Gyeonggi (256 km2). In 2019, the urban built-up areas of Chungjin and Hamhung were only equivalent to the areas of Ansan in Gyeonggi and Gongju in Chungcheongnam (49 km2 and 31 km2, respectively).
Although the urban built-up areas of Pyongyang, Chungjin, and Hamhung are equivalent to those of some urban areas in China and the ROK, the TDN and MDN values of the Chinese cities are significantly higher than those in the DPRK. Pyongyang has the same built-up area as that of Dalian Jinzhou in Liaoning Province in China, but its TDN and MDN values are much lower than those of the latter (the TDN and MDN values of Pyongyang are 12,781 and 51.08 lower, respectively, than those of Dalian Jinzhou). The comparison results for Chungjin and Hamhung are similar.
Similarly, the built-up area of Pyongyang is similar to that of Pyeongtaek in Gyeonggi, and the TDN and MDN values are lower than those of the latter (the TDN and MDN values of Pyongyang are 22,755 and 88.25 lower, respectively, than those of Pyeongtaek). The comparison results for Chungjin and Hamhung are similar.
Light per capita has become established as a welfare measure in development economics, so one would be able to interpret it in terms of living conditions. Although the built-up areas of Pyongyang, Chungjin, and Hamhung are equivalent to those in China and the ROK, there are great differences in light per capita. Pyongyang’s light per capita is 13% that of Dalian Jinzhou and only 4% that of Pyeongtaek. Chungjin’s light per capita is only 18% that of Chaoyang Longcheng and only 22% that of Ansan. Hamhung’s light per capita is only 5% that of Liaoyuan Xi’an and only 3% that of Gongju. Therefore, there is still a large gap between the living conditions of major cities in the DPRK and those in China and the ROK.
4.4. Robustness of Main Results
To make the research results more convincing, we refer to data from other sources; for example, the GHSL project provides information about built-up areas for the years 1990, 2000, and 2015. In any case, checking the robustness of the main results using the GHSL data would be sensible. According to the comparison results for the two sets of data, our research results are relatively accurate (Table 5). In terms of area and change trend, our research results are consistent with the GHSL ones, albeit lower; the reason for the discrepancy is that when extracting urban built-up areas, we do not extract all brightness areas as urban areas because we believe that areas with low brightness do not have the conditions to form an urban area.
5. Conclusions
Night-light data contain information about human activities and economic development that can reflect more intuitively the level of urban development. The coverage provided by nighttime light over a geographic area is an indicator of built-up areas, but luminosity shows development to some extent. Taking the Democratic People’s Republic of Korea (DPRK), China, and the Republic of Korea (ROK) as the study areas, we estimated the scale of urban built-up areas by using DMSP/OLS and NPP/VIIRS, and we revealed the current urban spatial pattern and change characteristics of typical cities. As was seen, as one of the most closed countries in the world, the DPRK’s economic development was affected indirectly by the 2008 financial crisis. The level of urbanization in the DPRK is affected by not only its level of domestic economic development but also those of countries closely related to it. Overall, there is still a large gap between the level of urbanization in the DPRK and that in China and the ROK. Most cities in the DPRK are concentrated in its western plains and eastern coastal areas. Pyongyang, Chungjin, Hamhung, and their surrounding areas have a high level of urbanization. In the past 28 years, the major cities of the DPRK—including Pyongyang, Chungjin, and Hamhung—have not expanded significantly. The urban scale of Pyongyang—the largest city in the DPRK—is at the upper level of counties in Jilin Province and Liaoning Province in China or counties in the ROK.
At present, the DPRK’s economic construction has just begun again, and it needs further domestic reform and opening to the outside world. With improved relations between the DPRK and its neighbors and other countries around the world, its economic development and urban construction will present a new pattern.
Supplementary Materials
The following is available online at https://www.mdpi.com/article/10.3390/rs13234879/s1, Table S1: Extraction threshold of urban built-up area.
Author Contributions
Conceptualization, L.J. and Y.L.; methodology, Y.L.; formal analysis, L.J.; resources, L.J., Y.L., S.W. and C.Y.; data curation, L.J., Y.L., S.W. and C.Y.; writing of original draft, L.J. and Y.L.; writing, review, and editing, L.J. and Y.L.; supervision, L.J. and Y.L.; project administration, L.J.; funding acquisition, L.J. All authors have read and agreed to the published version of the manuscript.
Funding
This research was funded by National Natural Science Foundation of China (grant number 42071253) and Consultation and Evaluation Project of the Academic Divisions of the Chinese Academy of Sciences (grant number 2017ZWH018A-042).
Data Availability Statement
The Defense Meteorological Satellite Program (DMSP) Operational Linescan System (OLS) (Version 4) nighttime light datasets are available on the website of the National Oceanic and Atmospheric Administration (NOAA) (http://ngdc.noaa.gov/eog/dmsp/ (23 June 2021)). The NPP/VIIRS monthly data are available on the website of the Earth Observation Group (EOG) of NOAA/NGDC (https://ngdc.noaa.gov/eog/viirs/ (12 May 2021)). The land-use data are from the 1992 ESA-CCI dataset (http://maps.elie.ucl.ac.be/CCI/viewer/ (10 May 2021).
Conflicts of Interest
The authors declare no conflict of interest.
References
- Hao, Q.H. Effectiveness and constraints of UN sanctions on DPRK. Contemp. Int. Relat. 2017, 5, 1–9. [Google Scholar]
- Zhang, S. The development and prospect of China–DPRK economic and trade relations under UN sanctions. J. Northeast Asian Stud. 2021, 1, 85–97. [Google Scholar]
- Wang, Q. Opportunities and challenges for DPRK to participate in Belt and Road construction. Chin. Foreign Invest. 2021, 6, 8–9. [Google Scholar]
- Zhang, Q.C.; Zhang, P.Y.; Wang, D.Y. North Korean urbanization process and spatial pattern. Econ. Geogr. 2019, 39, 14–21. [Google Scholar]
- Puertas, O.L.; Henríquez, C.; Francisco, J.M. Assessing spatial dynamics of urban growth using an integrated land use model. Application in Santiago Metropolitan Area, 2010–2045. Land Use Policy 2014, 38, 415–425. [Google Scholar] [CrossRef]
- Jo, J.C.; Adler, S. North Korean planning: Urban changes and regional balance. Cities 2002, 19, 205–215. [Google Scholar] [CrossRef]
- Wang, X.L.; Yan, H.W.; Zhou, L.; Dang, X.W. Using SVM classify Landsat image to analyze the spatial and temporal characteristics of main urban expansion analysis in Democratic People’s Republic of Korea. Remote Sens. Land Resour. 2020, 32, 163–171. [Google Scholar]
- Yuan, D.S.; Li, Z.Q. China–North Korea–South Korea Economic Cooperation Framework. Dongjiang J. 2019, 36, 97–103. [Google Scholar]
- Zhao, Y. Construction of Northeast Asia community of destiny from the perspective of Asian security concept. Northeast Asia Forum 2021, 30, 95–110,128. [Google Scholar]
- Li, K.S. Obligation-based cooperation: Role theory and Sino-US East Asian security interaction. J. Int. Secur. Stud. 2021, 39, 57–79,158,159. [Google Scholar]
- Okamoto, K.; Yamakawa, S. Estimation of flood damage to rice production in North Korea in 1995. Int. J. Remote Sens. 1998, 19, 365–371. [Google Scholar] [CrossRef]
- Quan, Z.N. Food shortage in North Korea and its solution. Contemp. Int. Relat. 2013, 1, 47–53. [Google Scholar]
- Yu, H.; Zhang, B. Comparative study on changes of croplands between North Korea and South Korea during 1990–2015. Chin. Geogr. Sci. 2018, 28, 920–934. [Google Scholar] [CrossRef] [Green Version]
- Choi, J.; Cha, Y. Interdecadal variation in Korean spring drought in the early 1990s. Dyn. Atmos. Ocean. 2017, 78, 165–177. [Google Scholar] [CrossRef]
- Wang, Z.W. The changes of geo-strategic status of Korean Peninsular vs. the unity of Japan and Korea. J. Yanbian Univ. 2010, 43, 51–56. [Google Scholar]
- Yue, W.Z.; Xu, J.H. Remote sensing research on spatial pattern of urban old city transformation based on linear spectral analysis: A case study of Shanghai central city in 1997–2000. Chin. Sci. Bull. 2006, 8, 966–974. [Google Scholar]
- Gao, Z.H.; Zhang, L.; Li, X.Y.; Liao, M.S.; Qiu, J.Z. Detection and analysis of urban land use changes through multi-temporal impervious surface mapping. J. Remote Sens. 2010, 14, 593–606. [Google Scholar]
- Yu, B.L.; Wang, C.X.; Gong, W.K.; Chen, Z.Q.; Shi, K.F.; Wu, B.; Hong, Y.C.; Li, Q.X.; Wu, J.P. Nighttime light remote sensing and urban studies: Data, methods, applications, and prospects. Natl. Remote Sens. Bull. 2021, 25, 342–364. [Google Scholar]
- Dong, H.S.; Li, R.J.; Li, J.M. Study on urban spatiotemporal expansion pattern of three first-class urban agglomerations in China derived from integrated DMSP-OLS and NPP-VIIRS nighttime light data. J. Geo-Inf. Sci. 2020, 22, 1161–1174. [Google Scholar]
- Levin, N.; Kyba, C.C.; Zhang, Q.; de Miguel, A.S.; Román, M.O.; Li, X.; Portnov, B.A.; Molthan, A.L.; Jechow, A.; Miller, S.D.; et al. Remote sensing of night lights: A review and an outlook for the future. Remote Sens. Environ. 2020, 237, 111443. [Google Scholar] [CrossRef]
- Yue, Y.L.; Li, T.; Yue, Q.; Wang, Z. Spatiotemporal variations in energy consumption and their influencing factors in China based on the integration of the DMSP-OLS and NPP-VIIRS nighttime light datasets. Remote Sens. 2020, 12, 1151. [Google Scholar] [CrossRef] [Green Version]
- Miller, S.D.; Straka, W.; Mills, S.P.; Elvidge, C.D.; Lee, T.F.; Solbrig, J.; Walther, A.; Heidinger, A.K.; Weiss, S.C. Illuminating the capabilities of the Suomi National Polar-Orbiting Partnership (NPP) Visible Infrared Imaging Radiometer Suite (VIIRS) day/night band. Remote Sens. 2013, 5, 6717–6766. [Google Scholar] [CrossRef] [Green Version]
- Imhoff, M.L.; Lawrence, W.T.; Stutzer, D.C.; Elvidge, C.D. A technique for using composite DMSP/OLS “City Lights” satellite data to map urban area. Remote Sens. Environ. 1997, 61, 361–370. [Google Scholar] [CrossRef]
- Liu, Z.F.; He, C.Y.; Zhang, Q.F.; Huang, Q.X.; Yang, Y. Extracting the dynamics of urban expansion in China using DMSP-OLS nighttime light data from 1992 to 2008. Landsc. Urban Plan. 2012, 106, 62–72. [Google Scholar] [CrossRef]
- Zhao, M.; Zhou, Y. Mapping urban dynamics (1992–2018) in Southeast Asia using consistent nighttime light data from DMSP and VIIRS. Remote Sens. Environ. 2020, 248, 111980. [Google Scholar] [CrossRef]
- Jing, W.L.; Yang, Y.P. Mapping urban areas with integration of DMSP/OLS nighttime light and MODIS data using machine learning techniques. Remote Sens. 2015, 7, 12419–12439. [Google Scholar] [CrossRef] [Green Version]
- Chen, X.; Nordhaus, W.D. VIIRS nighttime lights in the estimation of cross-sectional and time-series GDP. Remote Sens. 2019, 11, 1057. [Google Scholar] [CrossRef] [Green Version]
- Liu, C.; Yang, K. Automated extraction of built-up areas by fusing VIIRS nighttime lights and Landsat-8 data. Remote Sens. 2019, 11, 1571. [Google Scholar] [CrossRef] [Green Version]
- Román, M.O.; Wang, Z.; Sun, Q.; Kalb, V.; Miller, S.D.; Molthan, A.; Schultz, L.; Bell, J.; Stokes, E.C.; Pandey, B.; et al. NASA’s Black Marble nighttime lights product suite. Remote Sens. Environ. 2018, 210, 113–143. [Google Scholar] [CrossRef]
- Elvidge, C.D.; Ziskin, D.; Baugh, K.E.; Tuttle, B.T.; Ghosh, T.; Pack, D.W.; Erwin, E.H.; Zhizhin, M. A fifteen year record of global natural gas flaring derived from satellite data. Energies 2019, 2, 595–622. [Google Scholar] [CrossRef]
- Cao, Z.Y.; Wu, Z.F.; Kuang, Y.Q.; Huang, N.S. Correction of DMSP/OLS night-time light images and its application in China. J. Geo-Inf. Sci. 2015, 17, 1092–1102. [Google Scholar]
- Hsu, F.C.; Baugh, K.E.; Ghosh, T.; Zhizhin, M.; Elvidge, C.D. DMSP-OLS radiance calibrated nighttime lights time series with intercalibration. Remote Sens. 2015, 7, 1855–1876. [Google Scholar] [CrossRef] [Green Version]
- Li, X.; Chen, X.L.; Li, C. Potential of NPP-VIIRS nighttime light imagery for modeling the regional economy of China. Remote Sens. 2013, 5, 3057–3081. [Google Scholar] [CrossRef] [Green Version]
- Chen, Z.Q.; Hu, Y.J.; Huang, C.; Shi, K.F.; Wu, J.P. Estimating house vacancy rate in metropolitan areas using NPP-VIIRS nighttime light composite data. IEEE J. Sel. Top. Appl. Earth Obs. Remote Sens. 2015, 8, 2188–2197. [Google Scholar] [CrossRef]
- Shi, K.F.; Huang, Y.X.; Hu, Y.J.; Yin, B.; Chen, Z.Q.; Chen, L.J.; Wu, J.P. Evaluating the ability of NPP-VIIRS nighttime light data to estimate the gross domestic product and the electric power consumption of China at multiple scales: A comparison with DMSP-OLS data. Remote Sens. 2014, 6, 1705–1724. [Google Scholar] [CrossRef] [Green Version]
- Elvidge, C.D.; Baugh, K.E.; Zhizhin, M.; Hsu, F.C. Why VIIRS data are superior to DMSP for mapping nighttime lights. Proc. Asia-Pac. Adv. Netw. 2013, 35, 62–69. [Google Scholar] [CrossRef] [Green Version]
- He, C.Y. The urbanization model and process in Bohai Sea surrounding area in the 1990s by using DMSP/OLS. Acta Geogr. Sin. 2005, 60, 409–417. [Google Scholar]
- Zhuo, L. Application of compound night light index derived from DMSP/OLS data to urbranization analysis in China in the 1990s. Acta Geogr. Sin. 2003, 58, 893–902. [Google Scholar]
- Ma, M.; Lang, Q.; Yang, H.; Shi, K.; Ge, W. Identification of polycentric cities in China based on NPP-VIIRS nighttime light data. Remote Sens. 2020, 12, 3248. [Google Scholar] [CrossRef]
- Chen, J.; Zhuo, L.; Shi, P.J.; Toshiaki, I. The study on urbanization process in China based on DMSP/OLS data: Development of a light index for urbanization level estimation. J. Remote Sens. 2003, 7, 168–175. [Google Scholar]
- Chen, Z.Q.; Song, W.; Liu, H.X.; Wu, Q.S.; Shi, K.F.; Wu, J.P. A new approach for detecting urban centers and their spatial structure with nighttime light remote sensing. IEEE Trans. Geosci. Remote Sens. 2017, 55, 6309–6319. [Google Scholar] [CrossRef]
- Small, C.; Pozzi, F.; Elvidge, C.D. Spatial analysis of global urban extent from DMSP-OLS night lights. Remote Sens. Environ. 2005, 96, 277–291. [Google Scholar] [CrossRef]
Figure 1.
Geographical location and topography of Democratic People’s Republic of Korea (DPRK).

Figure 2.
Workflow of data and methods.

Figure 3.
Variation of TDN, MDN, and IR in DPRK, China, and ROK.

Figure 4.
Urban spatial pattern in DPRK: spatial distribution of urban built-up areas in (a) 1992, (b) 2000, (c) 2010, and (d) 2019.
Figure 4.
Urban spatial pattern in DPRK: spatial distribution of urban built-up areas in (a) 1992, (b) 2000, (c) 2010, and (d) 2019.

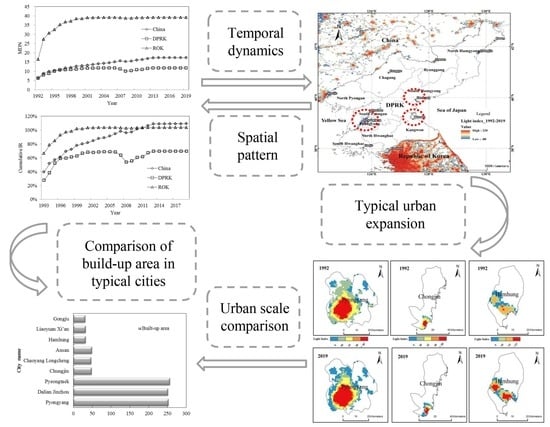
Figure 5.
Top ten urban built-up areas in DPRK.

Figure 6.
Spatial pattern of dynamic expansion of typical cities in DPRK.

Figure 7.
Comparison of urban built-up area between DPRK and China’s Jilin and Liaoning.

Figure 8.
Comparison of urban built-up area between DPRK and ROK.


Table 1.
Parameter values and estimated correlation coefficient for DMSP image regression correction model.
Table 1.
Parameter values and estimated correlation coefficient for DMSP image regression correction model.
| Sensor | Year | a | b | R2 | Sensor | Year | a | b | R2 |
|---|---|---|---|---|---|---|---|---|---|
| F10 | 1992 | 1.713 | 0.962 | 0.490 | F15 | 2001 | 0.655 | 1.284 | 0.883 |
| F10 | 1993 | 0.834 | 1.321 | 0.818 | F15 | 2002 | 0.901 | 1.132 | 0.780 |
| F10 | 1994 | 0.944 | 1.259 | 0.790 | F15 | 2003 | 1.400 | 1.064 | 0.834 |
| F12 | 1994 | 0.915 | 1.253 | 0.767 | F15 | 2004 | 1.201 | 1.060 | 0.807 |
| F12 | 1995 | 0.894 | 1.226 | 0.787 | F15 | 2005 | 1.093 | 1.107 | 0.898 |
| F12 | 1996 | 1.139 | 1.148 | 0.782 | F15 | 2006 | 1.453 | 0.978 | 0.717 |
| F12 | 1997 | 0.895 | 1.224 | 0.750 | F15 | 2007 | 2.149 | 0.865 | 0.575 |
| F12 | 1998 | 0.780 | 1.223 | 0.804 | F16 | 2004 | 0.895 | 1.085 | 0.737 |
| F12 | 1999 | 1.002 | 1.174 | 0.812 | F16 | 2005 | 1.502 | 0.968 | 0.668 |
| F14 | 1997 | 1.648 | 1.117 | 0.738 | F16 | 2006 | 1.171 | 1.039 | 0.714 |
| F14 | 1998 | 1.167 | 1.198 | 0.826 | F16 | 2007 | 1.129 | 1.034 | 0.731 |
| F14 | 1999 | 1.455 | 1.148 | 0.781 | F16 | 2008 | 0.892 | 1.078 | 0.753 |
| F14 | 2000 | 1.654 | 0.985 | 0.644 | F16 | 2009 | 0.545 | 1.167 | 0.739 |
| F14 | 2001 | 1.520 | 1.007 | 0.687 | F18 | 2010 | 0.475 | 1.130 | 0.538 |
| F14 | 2002 | 1.516 | 0.990 | 0.721 | F18 | 2011 | 0.542 | 1.153 | 0.721 |
| F14 | 2003 | 1.616 | 0.966 | 0.717 | F18 | 2012 | 0.722 | 1.033 | 0.547 |
| F15 | 2000 | 0.837 | 1.190 | 0.812 | F18 | 2013 | 0.503 | 1.090 | 0.531 |
Table 2.
Results for optimal error threshold for DPRK, China, and Republic of Korea (ROK), and error analysis.
Table 2.
Results for optimal error threshold for DPRK, China, and Republic of Korea (ROK), and error analysis.
| Region | Light Area after Extraction [km2] | Relative Error [%] | Region | Light Area after Extraction [km2] | Relative Error [%] |
|---|---|---|---|---|---|
| ROK | 1474 | 0.95 | Shandong | 2328 | 0.43 |
| DPRK | 518 | −13.13 | Henan | 1361 | 0.22 |
| Taiwan | 538 | 9.11 | Hubei | 853 | −1.41 |
| Hong Kong | 277 | 53.43 | Hunan | 907 | −0.99 |
| Macao | 2 | 0.00 | Guangdong | 4015 | −0.67 |
| Beijing | 1486 | 1.28 | Guangxi | 666 | −0.30 |
| Tianjin | 594 | −0.34 | Hainan | 383 | 1.04 |
| Hebei | 2667 | 2.06 | Chongqing | 324 | 0.93 |
| Shanxi | 833 | 2.16 | Sichuan | 1176 | 0.51 |
| Inner Mongolia | 664 | −0.45 | Guizhou | 155 | 3.87 |
| Liaoning | 2258 | −1.86 | Yunnan | 580 | 1.21 |
| Jilin | 1676 | −3.28 | Tibet | 76 | 7.89 |
| Heilongjiang | 3331 | −1.08 | Shaanxi | 372 | 0.27 |
| Shanghai | 785 | −3.57 | Gansu | 285 | 0.35 |
| Jiangsu | 1472 | −1.49 | Qinghai | 176 | 0.57 |
| Zhejiang | 1365 | 0.00 | Ningxia | 42 | 4.76 |
| Anhui | 758 | 1.85 | Xinjiang | 491 | 1.63 |
| Fujian | 1787 | 3.75 | Jiangxi | 657 | 1.22 |
Table 3.
Statistical results for relevant indicators of light intensity in typical cities in DPRK [km2].
Table 3.
Statistical results for relevant indicators of light intensity in typical cities in DPRK [km2].
| Year | City | Built-Up Area | Administrative Area | Minimum | Maximum | Average | Sum |
|---|---|---|---|---|---|---|---|
| 1992 | Pyongyang | 231 | 1160.67 | 12 | 80 | 30.61 | 7071.00 |
| Chungjin | 61 | 1512.68 | 12 | 66 | 25.57 | 1560.00 | |
| Hamhung | 21 | 545.77 | 12 | 17 | 13.67 | 287.00 | |
| 2019 | Pyongyang | 252 | 1160.67 | 12 | 158 | 40.75 | 10,269.00 |
| Chungjin | 48 | 1512.68 | 12 | 101 | 33.90 | 1627.00 | |
| Hamhung | 32 | 545.77 | 12 | 18 | 14.81 | 474.00 |
Table 4.
Comparison of typical cities in DPRK, China, and ROK [km2].
| Province | County | Built-Up Area | Minimum | Maximum | Average | Sum | Light per Capita |
|---|---|---|---|---|---|---|---|
| Pyongyang | Pyongyang | 252 | 12 | 158 | 40.75 | 10,269.00 | 33.55 |
| Liaoning | Dalian Jinzhou | 251 | 43 | 190 | 91.83 | 23,050.00 | 259.57 |
| Gyeonggi | Pyeongtaek | 256 | 86 | 186 | 129.00 | 33,024.00 | 757.43 |
| North Hamgyeong | Chungjin | 48 | 12 | 101 | 33.90 | 1627.00 | 25.42 |
| Liaoning | Chaoyang Longcheng | 47 | 40 | 146 | 64.30 | 3022.00 | 136.13 |
| Gyeonggi | Ansan | 49 | 139 | 194 | 167.53 | 8209.00 | 114.01 |
| South Hamgyeong | Hamhung | 32 | 12 | 18 | 14.81 | 474.00 | 8.57 |
| Jilin | Liaoyuan Xi’an | 32 | 41 | 131 | 73.13 | 2340.00 | 171.68 |
| Chungcheongnam | Gongju | 31 | 89 | 162 | 118.61 | 3677.00 | 260.78 |
Table 5.
Robustness of main results assessed using Global Human Settlement Layer (GHSL) data [km2].
| City | 1990 (GHSL) | 1992 | 2000 (GHSL) | 2015 (GHSL) | 2019 |
|---|---|---|---|---|---|
| Pyongyang | 248 | 231 | 263 | 274 | 252 |
| Chungjin | 64 | 61 | 69 | 57 | 48 |
| Hamhung | 26 | 21 | 31 | 34 | 32 |
Publisher’s Note: MDPI stays neutral with regard to jurisdictional claims in published maps and institutional affiliations. |
© 2021 by the authors. Licensee MDPI, Basel, Switzerland. This article is an open access article distributed under the terms and conditions of the Creative Commons Attribution (CC BY) license (https://creativecommons.org/licenses/by/4.0/).
Share and Cite
MDPI and ACS Style
Jiang, L.; Liu, Y.; Wu, S.; Yang, C. Study on Urban Spatial Pattern Based on DMSP/OLS and NPP/VIIRS in Democratic People’s Republic of Korea. Remote Sens. 2021, 13, 4879. https://0-doi-org.brum.beds.ac.uk/10.3390/rs13234879
AMA Style
Jiang L, Liu Y, Wu S, Yang C. Study on Urban Spatial Pattern Based on DMSP/OLS and NPP/VIIRS in Democratic People’s Republic of Korea. Remote Sensing. 2021; 13(23):4879. https://0-doi-org.brum.beds.ac.uk/10.3390/rs13234879
Chicago/Turabian StyleJiang, Luguang, Ye Liu, Si Wu, and Cheng Yang. 2021. "Study on Urban Spatial Pattern Based on DMSP/OLS and NPP/VIIRS in Democratic People’s Republic of Korea" Remote Sensing 13, no. 23: 4879. https://0-doi-org.brum.beds.ac.uk/10.3390/rs13234879
Note that from the first issue of 2016, this journal uses article numbers instead of page numbers. See further details here.