
A Remote-Sensing-Based Alteration Zonation Model of the Duolong Porphyry Copper Ore District, Tibet

1
Key Laboratory of Metallogeny and Resources Assessment, Institute of Mineral Resources Chinese Academy of Geological Sciences, Beijing 100037, China
2
Key Laboratory of Mineral Resources Research, Institute of Geology and Geophysics, Chinese Academy of Sciences, Beijing 100029, China
*
Author to whom correspondence should be addressed.
Remote Sens. 2021, 13(24), 5073; https://0-doi-org.brum.beds.ac.uk/10.3390/rs13245073
Submission received: 14 November 2021
/
Revised: 7 December 2021
/
Accepted: 9 December 2021
/
Published: 14 December 2021
(This article belongs to the Special Issue Surface Mineral Allocation and Lithological Mapping Based on Remote Sensing)
Abstract
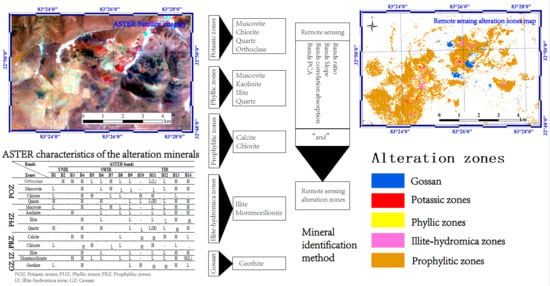
:Remote sensing (RS) of alteration zones and anomalies can provide information that is useful for geological prospecting and exploration. RS is an effective method for porphyry copper mineral exploration and prospecting prediction. More specifically, the Advanced Spaceborne Thermal Emission and Reflection radiometer (ASTER) data, which include 14 spectral channels from visible light to thermal infrared, are useful in such cases. This study uses visible-shortwave infrared and thermal infrared ASTER data together with surface material spectra from the Duolong porphyry copper ore district to construct an RS-based alteration zonation model of the deposit. In this study, an RS alteration zoning model is established based on ground-spectral alteration zoning results. The methods include PCA (Principal Component Analysis), Ratio, and Slope methods. The information obtained by each method is different. RS-based alteration zonation is developed based on the intersection of maps, resultant from the different methods for extracting information related to different minerals. The alteration zonation information extracted from ASTER RS data is consistent with geological observations. Using information from the RS-based model, we mapped the alteration minerals and zones of the Duolong ore district, thereby identifying prospecting target areas of the deposit.
1. Introduction
Multi-spectral remote sensing (RS) techniques have been increasingly and successfully applied in geological prospecting. Early work in this area includes the recognition of limonite alteration using Landsat multi-spectral data [1], as well as the extraction of the spectral characteristics of hydroxyl minerals in the visible near-infrared (VNIR) to short wave infrared (SWIR) bands [2,3]. Since the early studies, multi-spectral RS and allied techniques have been widely used to investigate the presence and type of alteration [4,5,6]. For example, a principal component analysis (PCA) has been applied to help classify and establish the distribution of alteration minerals in greenstone belt, Minas Gerais, Brazil [7]. Besides PCA, other techniques for extracting remote-sensing-based alteration information include the ratio method, spectral angle mapper (SAM), minimum noise fraction (MNF), and linear spectral unmixing (LSU) [8,9,10,11,12].
RS multi-spectral applications in mineral exploration have been summarized [13,14] and focus on mapping mineral resources and lithological units [14,15], as well as aspects related to RS-detected anomalies, such as deposit type [16], volcanic genesis [17], porphyry copper and epithermal gold exploration [18], and the alteration characteristics of rocks [19]. Landsat TM/ETM (Thematic Mapping /Enhanced Thematic Mapping) data can extract the information of hydroxyl minerals, carbonate minerals, and iron oxides, but cannot be used to distinguish minerals or mineral assemblages such as minerals consisting of magnesium hydroxyl and aluminium hydroxyl, due to band limitations. However, the Advanced Spaceborne Thermal Emission and Reflection Radiometer (ASTER) remote sensor provides high-spectral-resolution RS data, containing 14 bands, of which 9 bands are VNIR–SWIR RS and the remaining 5 bands are thermal infrared (TIR) RS data. Since the first use of ASTER, some alteration minerals have been identified using VNIR and SWIR RS data, including kaolinite, dickite, illite, and muscovite data for Cerro La Mina, Argentina [20]. Mars and Rowan [21] studied hydroxyl alteration mineral zonation of a porphyry copper deposit, using ASTER VNIR and SWIR data. ASTER-based mineral mapping has also been applied to investigations of geothermal resources [22], iron ore occurrence [23], and gold deposits [24]. ASTER RS data can also be used to perform alteration mineral mapping [25]. An ASTER spectral database containing single mineral and rock spectral information in the range of 400–15,400 nm has been established [26]. ASTER data have also been used to distinguish single minerals, information for which is held in an ECOSTRESS library [27,28]. ASTER TIR data have been applied to mineral mapping and quartz index research, according to the spectral characteristics of various minerals and the thermal infrared characteristics of silicified alteration zones [29], as well as information extracted from quartzite and carbonate rock [30]. Information on mafic–ultramafic rocks has also been extracted using ASTER TIR [31].
Most research on Copper (Cu) deposits using RS focus on extracting the alteration information of altered minerals and iron oxides. Using the spectral characteristics of altered minerals, various methods for extraction. The alteration information extracted by ASTER is mainly aluminum hydroxyl (Al-OH) and magnesium hydroxyl (Mg-OH) [32,33,34,35], and most of the research on porphyry Cu deposits using ASTER focus on hydrothermal alteration mapping [36,37,38,39,40,41]. Recently, a very large porphyry Cu deposit, the Duolong ore district, was discovered in north Tibet. This deposit is the largest Cu deposit in the Bangonghu–Nujiang metallogenic belt and shows highly developed alteration zonation [42,43]. Here, we use ASTER RS data to extract and analyze alteration zonation information for this porphyry Cu deposit, with the objective of guiding mineral prospecting in the region. Using RS methods to establish alteration zonation of porphyry copper deposits in the Bangonghu–Nujiang metallogenic belt should be useful for establishing mineral prospectivity in this region. We focus on alteration zone mapping based on an ASTER RS spectral analysis of surface materials and rocks to extract alteration zonation information and then construct an RS-based model of mineral alteration zonation.
2. Geological Setting
2.1. Tectonic Setting
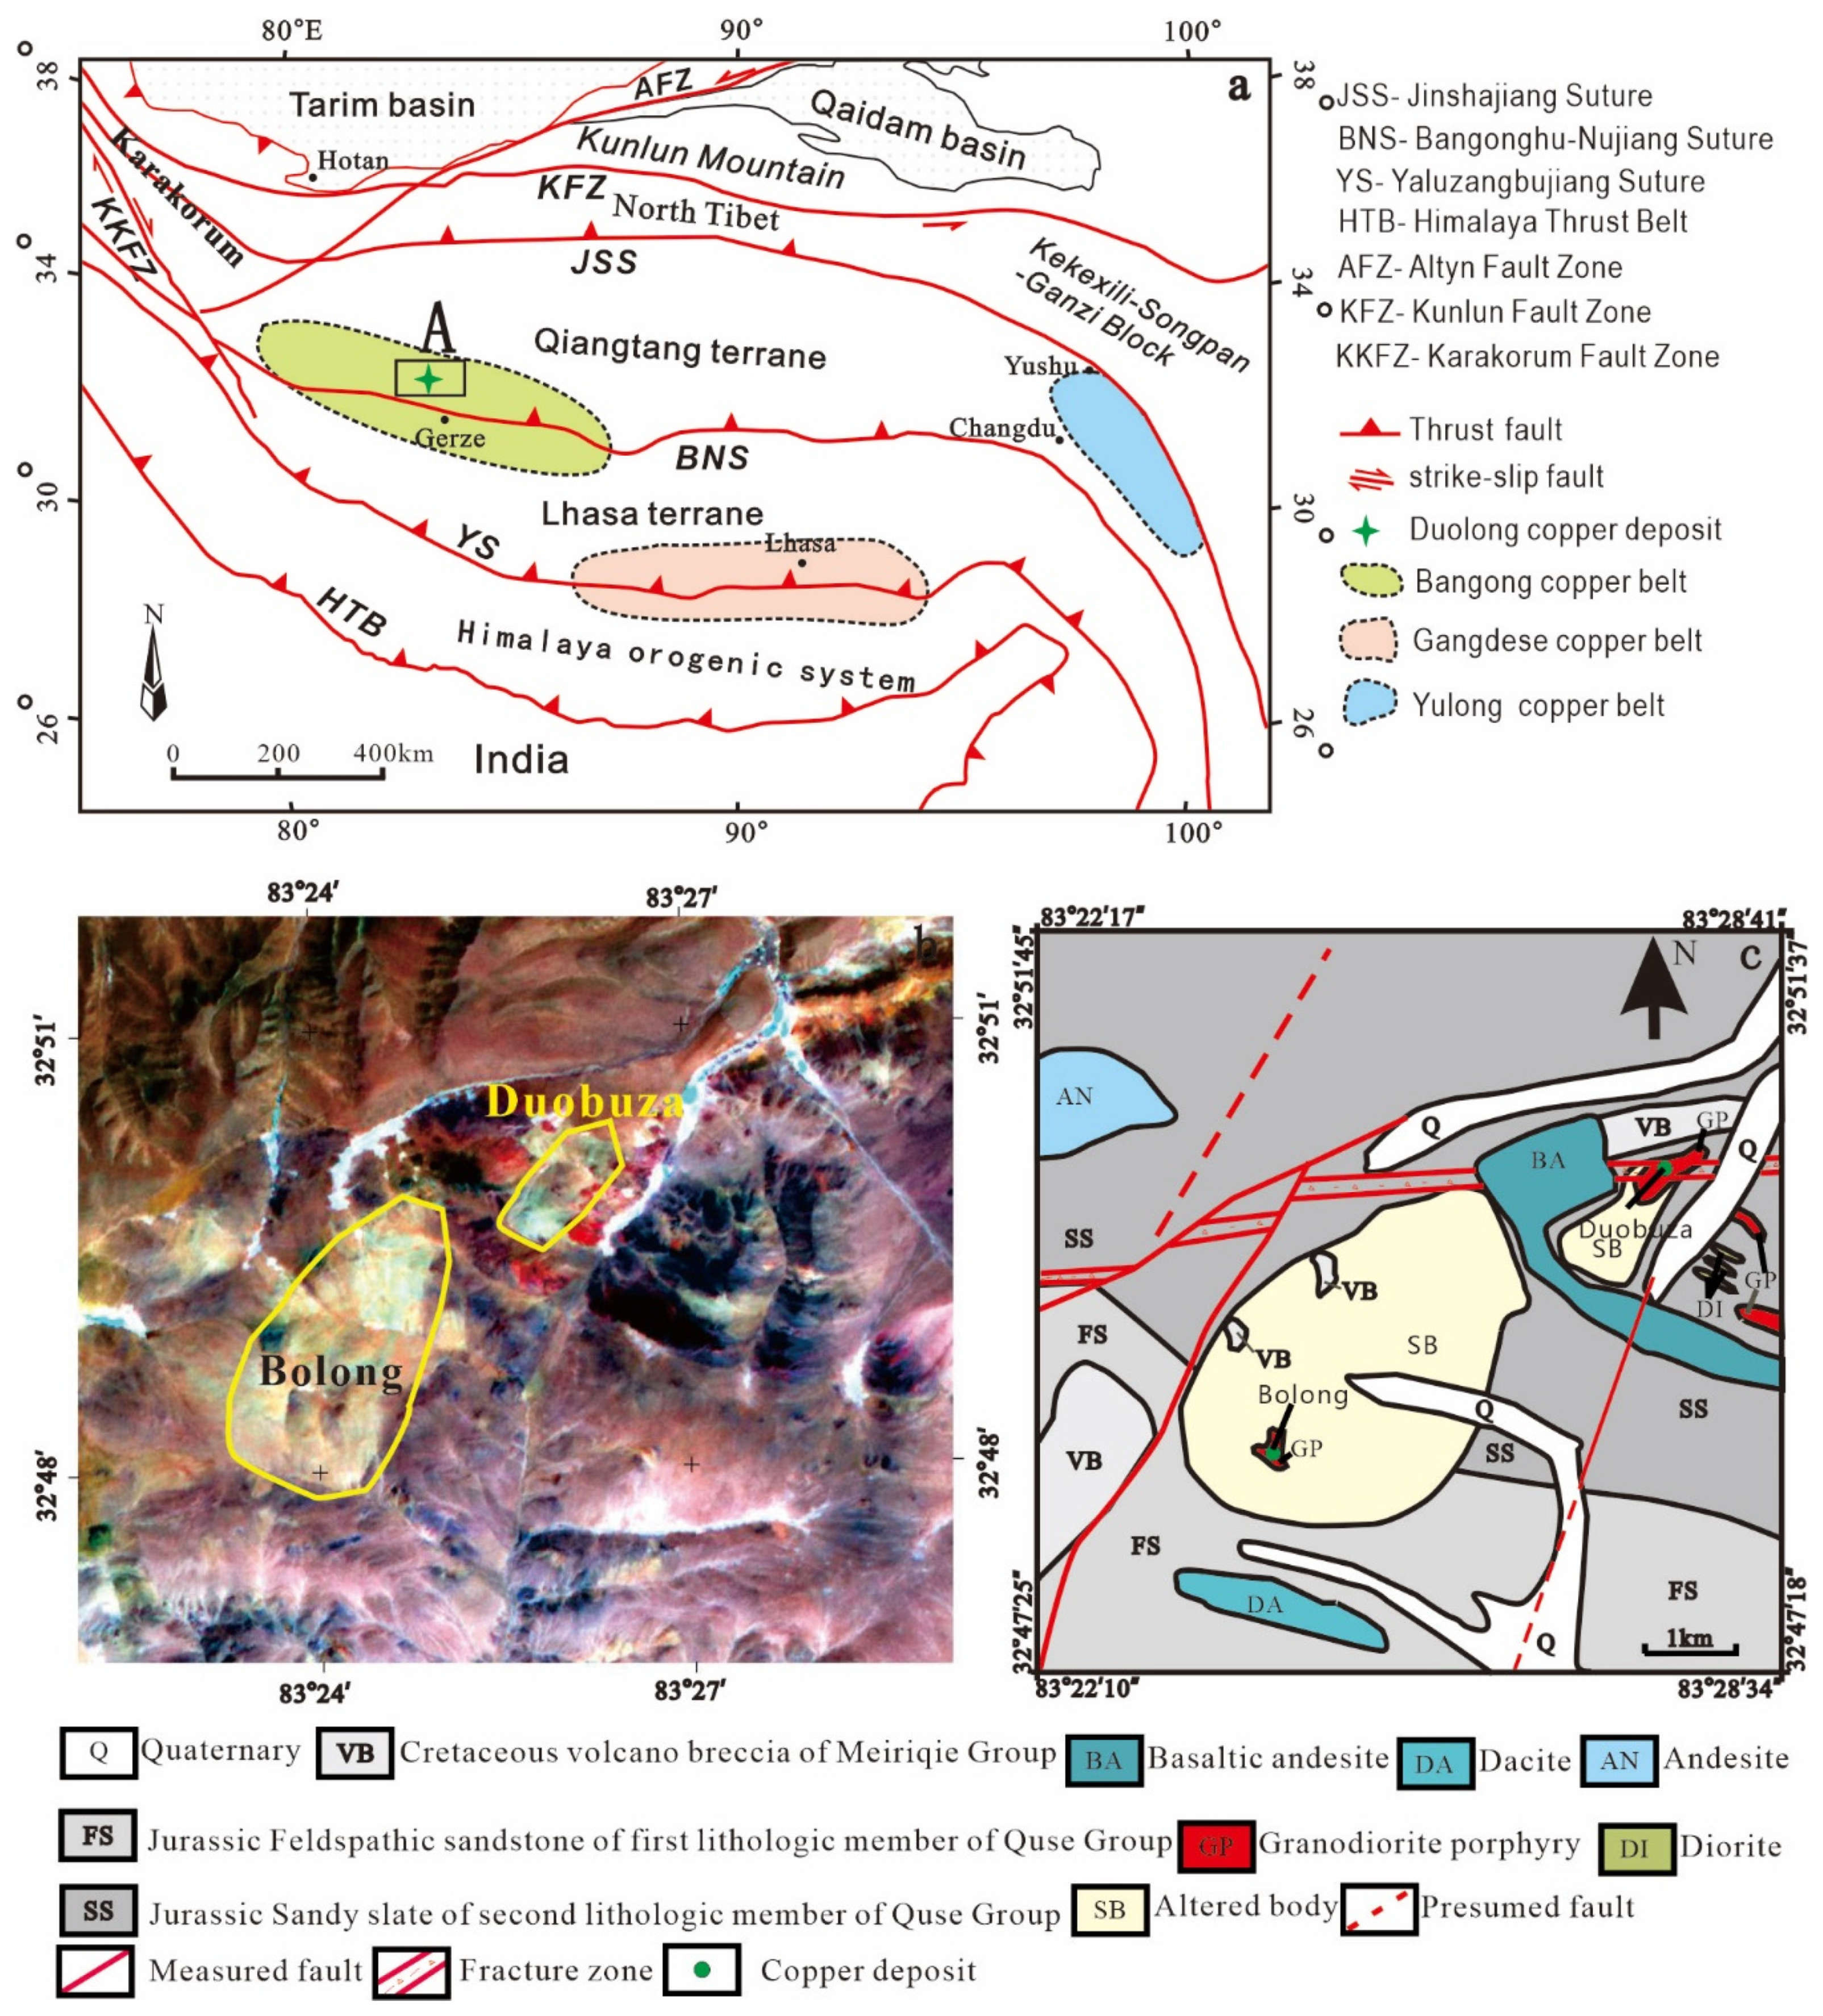
The Duolong district comprises two major deposits, namely Duobuza and Bolong. The Duolong district is located on the southern margin of the Qiangtang terrane, to the north of the Bangong–Nujiang suture zone (herein after referred to as BNS) in Tibet (Figure 1a). It extends over 2000 km across the central Tibetan plateau and western Yunnan province, and is thought represent the remnants of the Bangong-Nujiang Tethyan Ocean [44].
The oldest rocks in the Duolong district are represented by the Triassic Riganpeicuo Group, which mainly consists of marble and limestone (Figure 1b). Overlying the Triassic rocks is the Jurassic Quse Formation, comprising two units: the basal Quse Ι unit of quartz sandstone, overlain by the upper Quse ΙΙ unit that is composed of sequences of intercalated sandstone and slate. Cretaceous Meiriqie Formation is composed up of basaltic andesite and andesite, and widely distributed in the Duolong district (Figure 1c). An extensive emplacement of volumetrically small intermediate–felsic porphyritic intrusions that comprise similar major minerals (quartz,±plagioclase, ±amphibole, ±biotite) and accessory minerals (magnetite, ±zircon, ±apatite) took place from 120 to 110 Ma [45,46], which was accompanied by large-scale mineralization in the Duobuza and Bolong deposits.
2.2. Ore Geology
Porphyry Cu deposits are normally located in the basement beneath a comagmatic volcanic pile [47]. Generalized alteration mineralization zoning patterns show that sericitic alteration may project vertically downward as an annulus, separating the potassic and propylitic zones as well as cutting the potassic zone. Sericitic alteration tends to be more abundant in porphyry Cu–Au deposits, whereas chlorite sericite alteration develops preferentially in porphyry Cu–Au deposits. Alteration-mineralization in lithocap is commonly far more complex [48,49]. The Duobuza deposit protrudes in the center of the Duolong district. Several porphyritic intrusions have been recognized based on field mapping and exploration drilling, two of which are host rocks for Cu–Au mineralization of the Duobuza deposit, a granodiorite porphyry and a quartz diorite porphyry. Hydrothermal alteration and mineralization patterns of the Duobuza deposit are typical of Cu–Au porphyry deposits around the world [50,51]. The mineralized intrusions are affected by an early potassic alteration that is evident from the abundance of magnetite, K-feldspar, biotite and quartz, followed by chlorite alteration and characterized by partial to complete replacement of early potassic alteration minerals by chlorite and minor muscovite. Late sericitic alteration occurs along structurally controlled zones and/or as irregular sericite–quartz–pyrite replacement in altered zones. Most of the ore-grade Cu–Au mineralization at Duobuza appears to have a spatial association with the potassic alteration, which is represented by chalcopyrite, bornite and magnetite-bearing quartz veins as well as disseminations of chalcopyrite, bornite and magnetite.
3. Methodology
3.1. Remote Sensing Data
Landsat TM/ETM data and ASTER data can be analyzed to obtain alteration zone information from porphyry Cu deposits, including the Duolong ore district. TM/ETM data from the Landsat sensor encompass six spectral bands, one panchromatic band, and one thermal infrared band. ASTER data from the TERRA encompass nine spectral bands, one rearview band, and five thermal infrared bands. ASTER data have a wide spectral coverage, high spectral resolution, and are able to provide information for various fields of application. For geological applications, owing to the higher number of shortwave infrared bands (six) and thermal infrared bands (five) of ASTER compared with TM/ETM, ASTER data can be used to distinguish various alteration minerals and mineral assemblages and to examine alteration zonation. To obtain accurate spectral data, we used a field-portable shortwave infrared spectrometer (Analytical Spectral Devices) and a portable infrared mineral analyzer (ASD, Malvern Panalytical Ltd., Malvern, UK).
For this study, spectra of samples obtained from the ground surface were collected using the FieldSpec3 instrument, with a wavelength range of 350–2500 nm. Fieldspec3 has two fast-scanning and reflecting holographic diffraction gratings. Its spectral resolution is 3 nm at 350–700 nm and 10 nm at 700–2500 nm. The analysis of alteration minerals was performed using spectral measurements of surface samples in the horizontal and vertical directions. ASTER data were bought from Pasco China Corporation, Beijing, China in 2008. The scene number is ASTL1B 0704140516580707100089. The data acquisition date is 14 April 2007. The spectral features and variations of alteration zonation were analyzed based on the data collected using the portable instrument. According to these characteristics, ASTER data were used to obtain alteration zonation information for the porphyry Cu using PCA (Principal Component Analysis) and Ratio methods based on the reflectivity of ASTER different wavebands [27,52,53,54,55,56].
3.2. Technical Flow
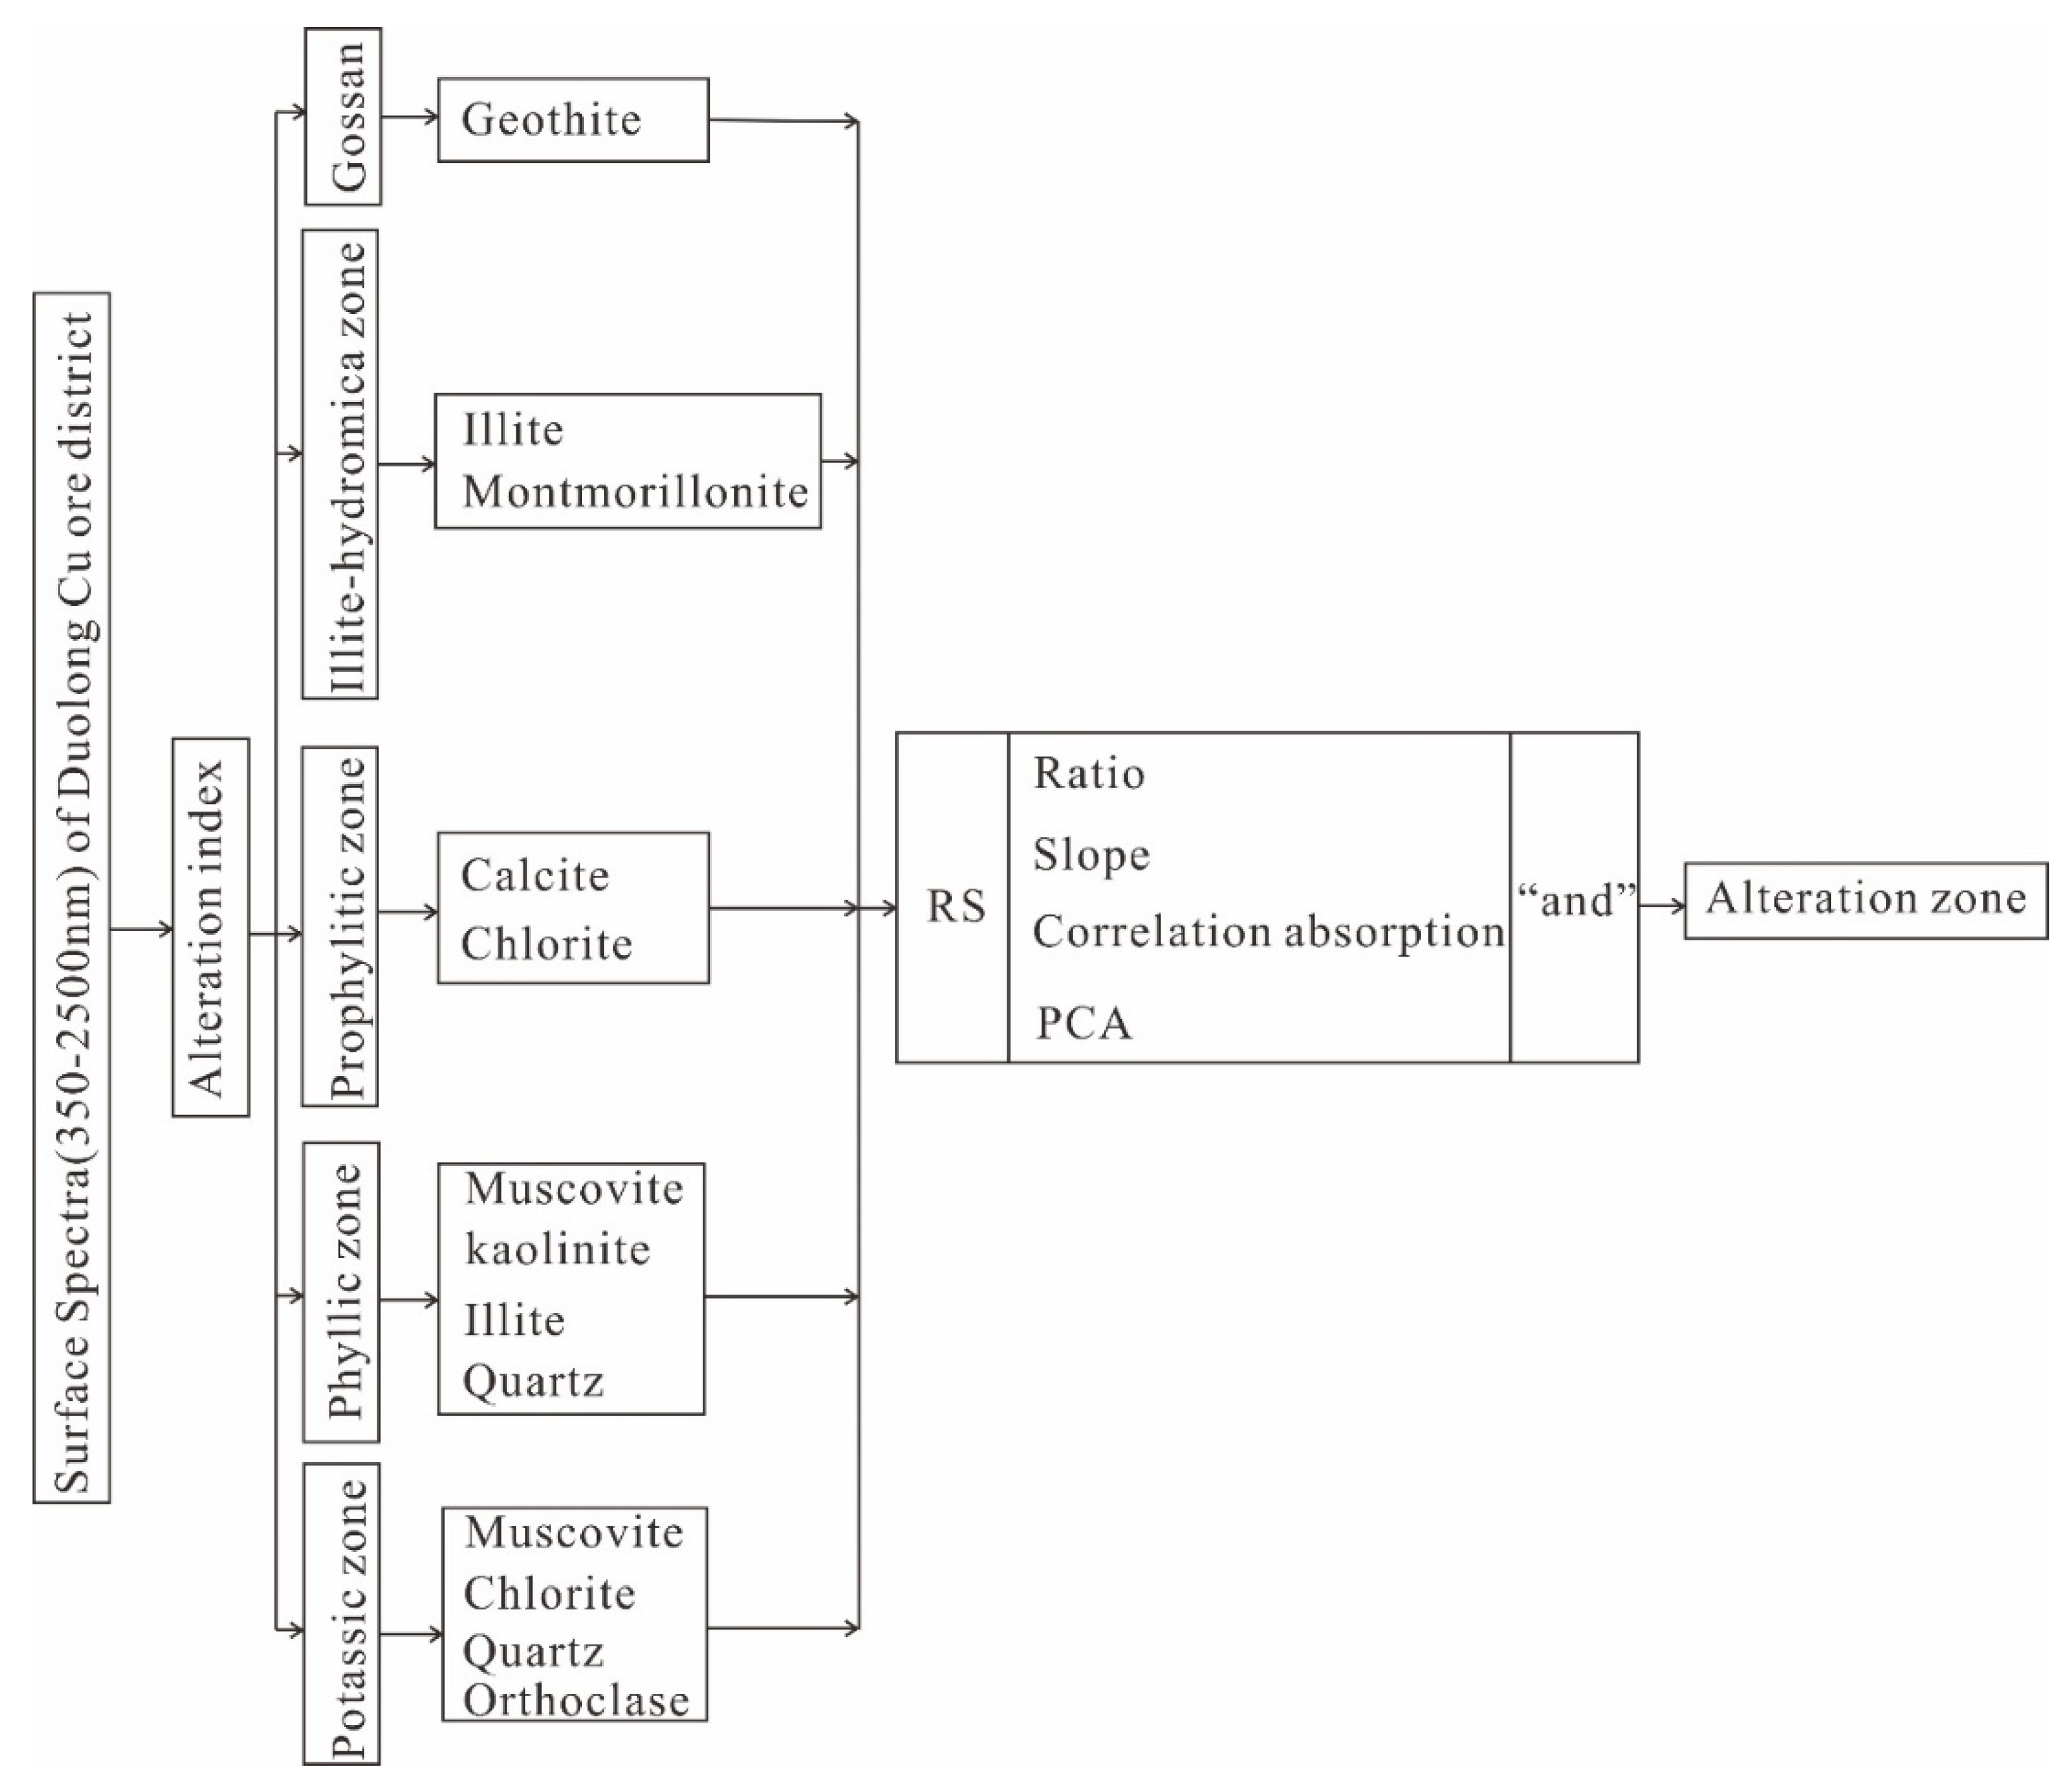
Alteration minerals and alteration zones are determined according to the spectra of ground samples. ASTER data was selected as the RS data source. The values of each band of ASTER data were compared according to the spectral alteration zonation of ground samples. Based on altered mineral assemblages in different zones, different information extraction methods were designed for each mineral. Ratio, slope, correction absorption, and PCA were used to extract mineral anomalies, and these anomalies were combined to extract alteration zonation. Finally, an RS alteration zoning model was built to interpret multiple hydrothermal centers in Duolong ore district (Figure 2).
3.3. Spectral Analysis of Ground Samples
Spectra were collected using a FieldSpec instrument. PimaView [57] software was used to process the spectra. To investigate surface alteration zonation, 280 samples were collected. Each sample was measured three times using the FieldSpec instrument, and each spectrum was then analyzed for alteration minerals using PimaView software.
To obtain surface samples at the Duolong district, we collected metamorphic feldspathic quartz sandstone, granite porphyry, lithic quartz sandstone, gabbro, breccia, granite, basaltic andesite, and quartz porphyry. Of these, 112 samples from the Duobuza deposit and 168 samples from the Bolong deposit were sampled at 300 m intervals according to variations in lithology and alteration (Figure 3).
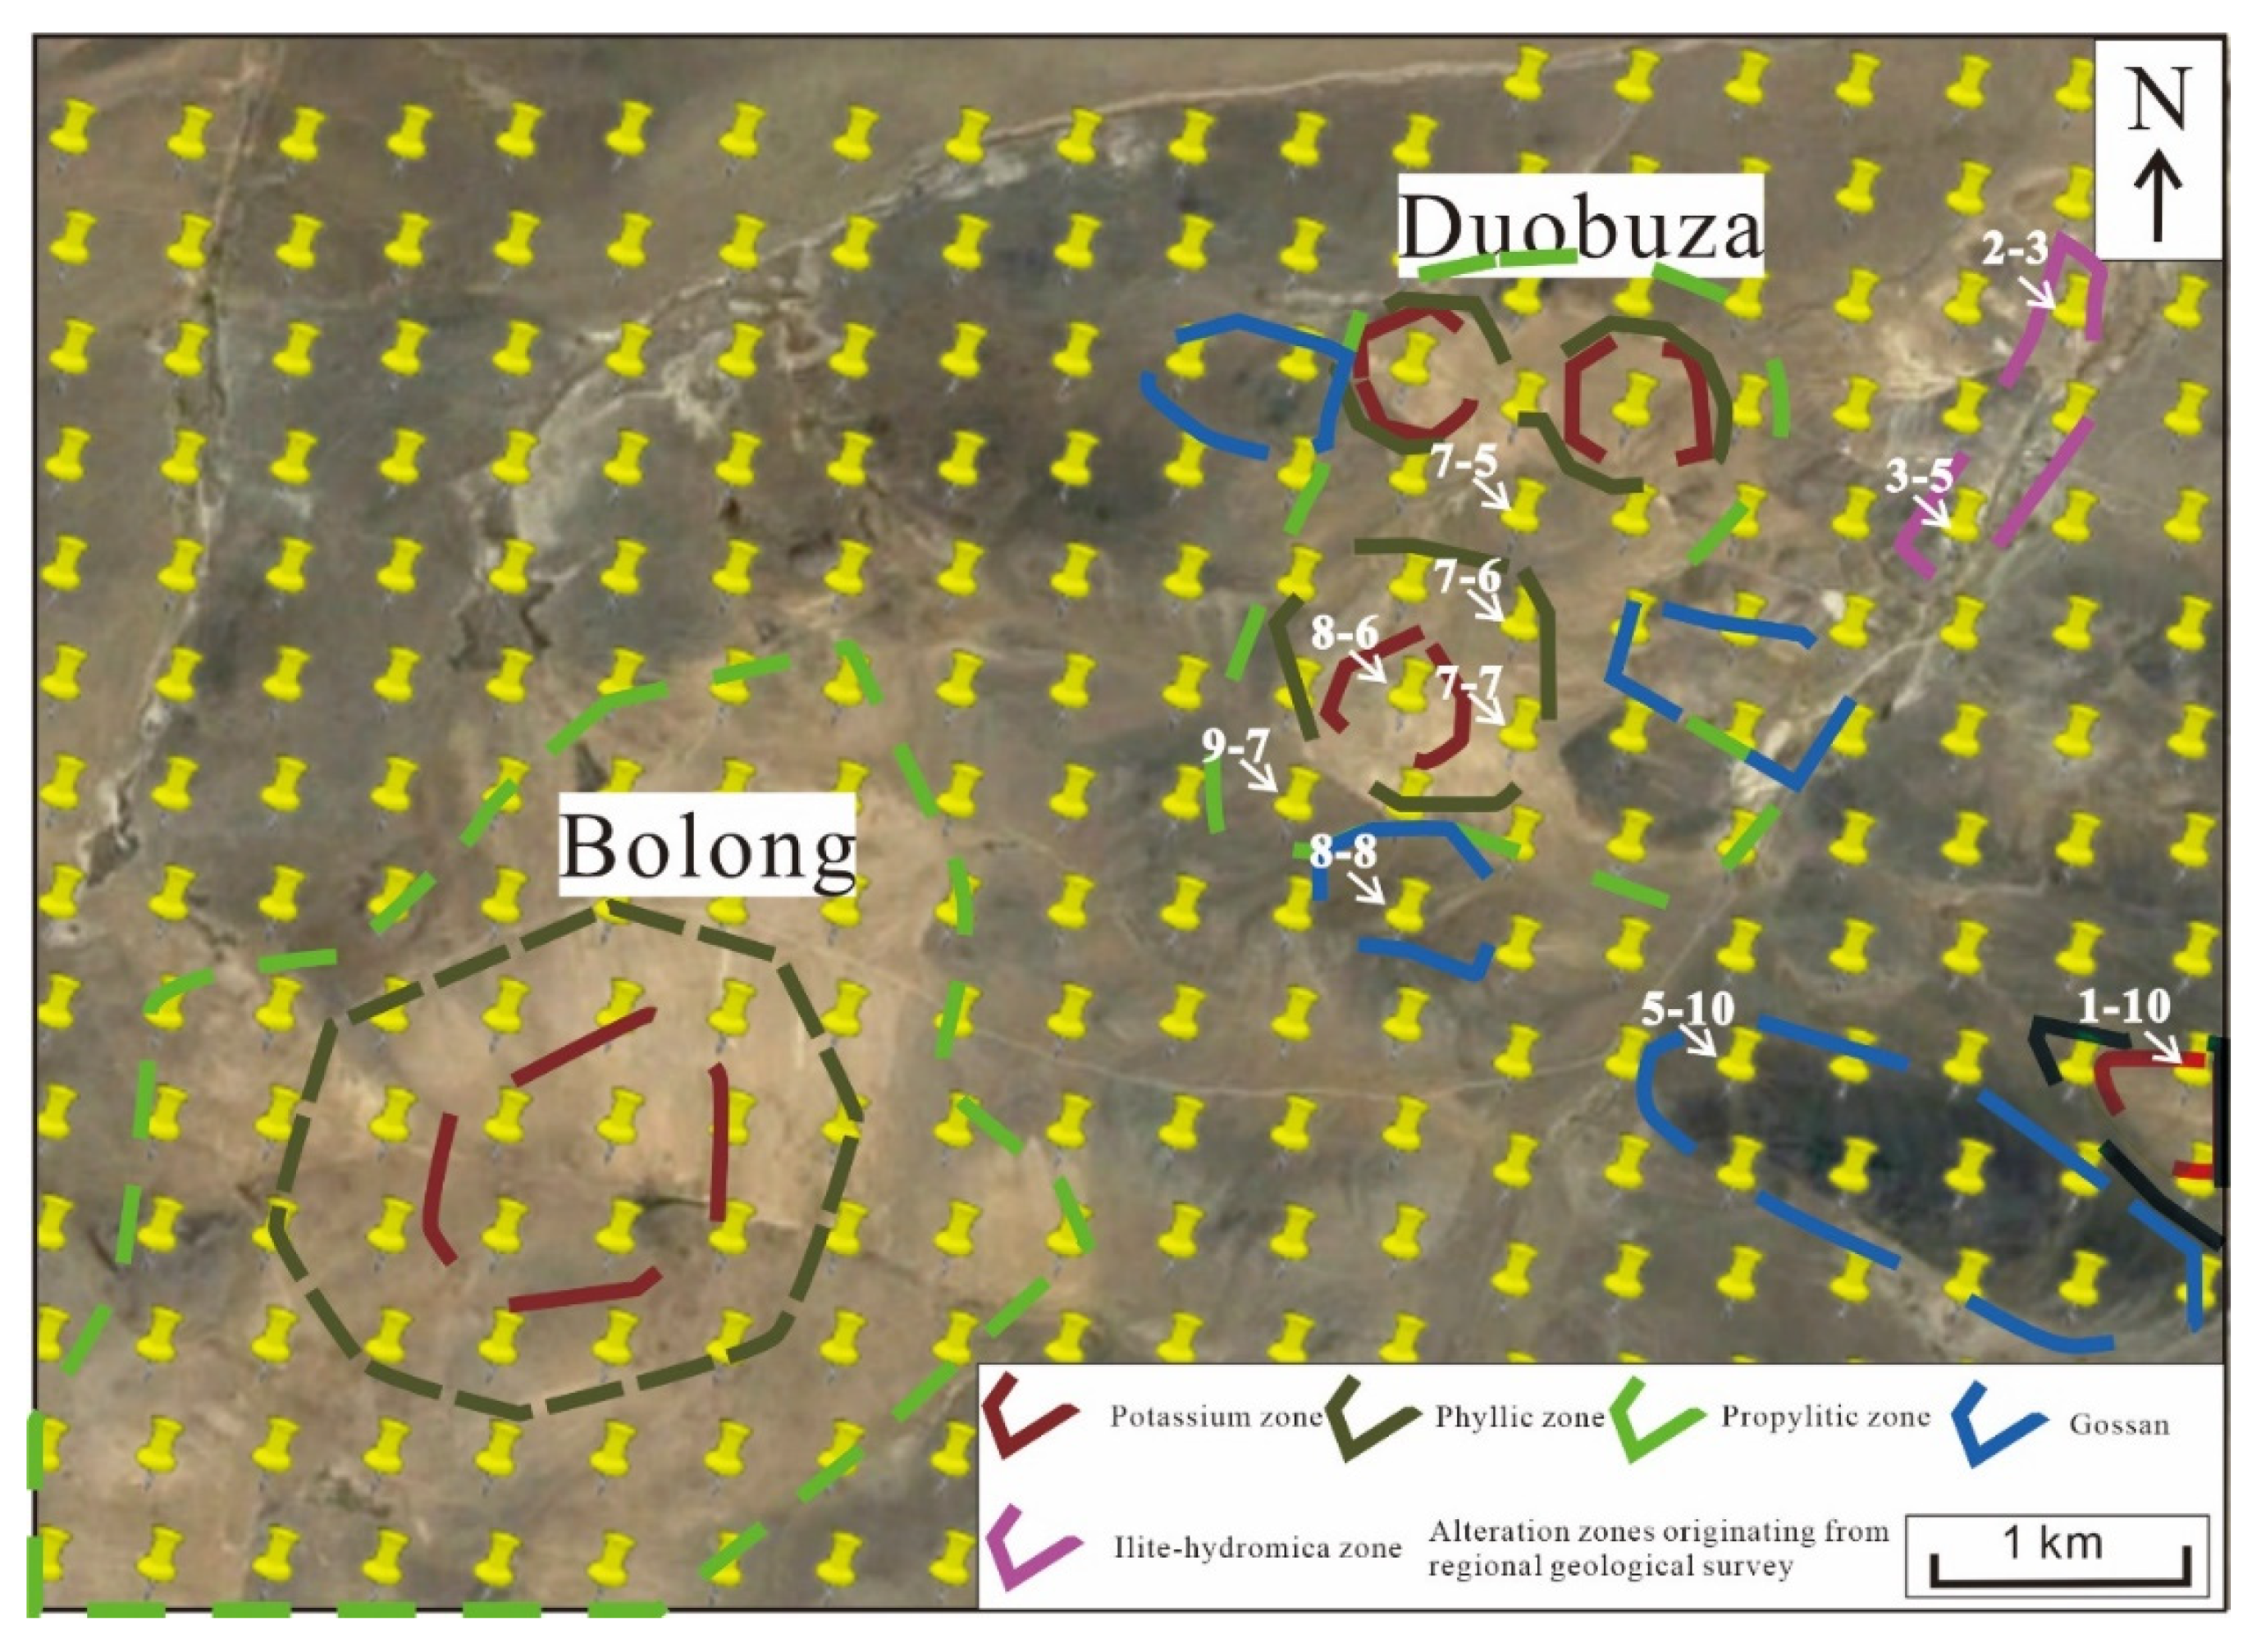
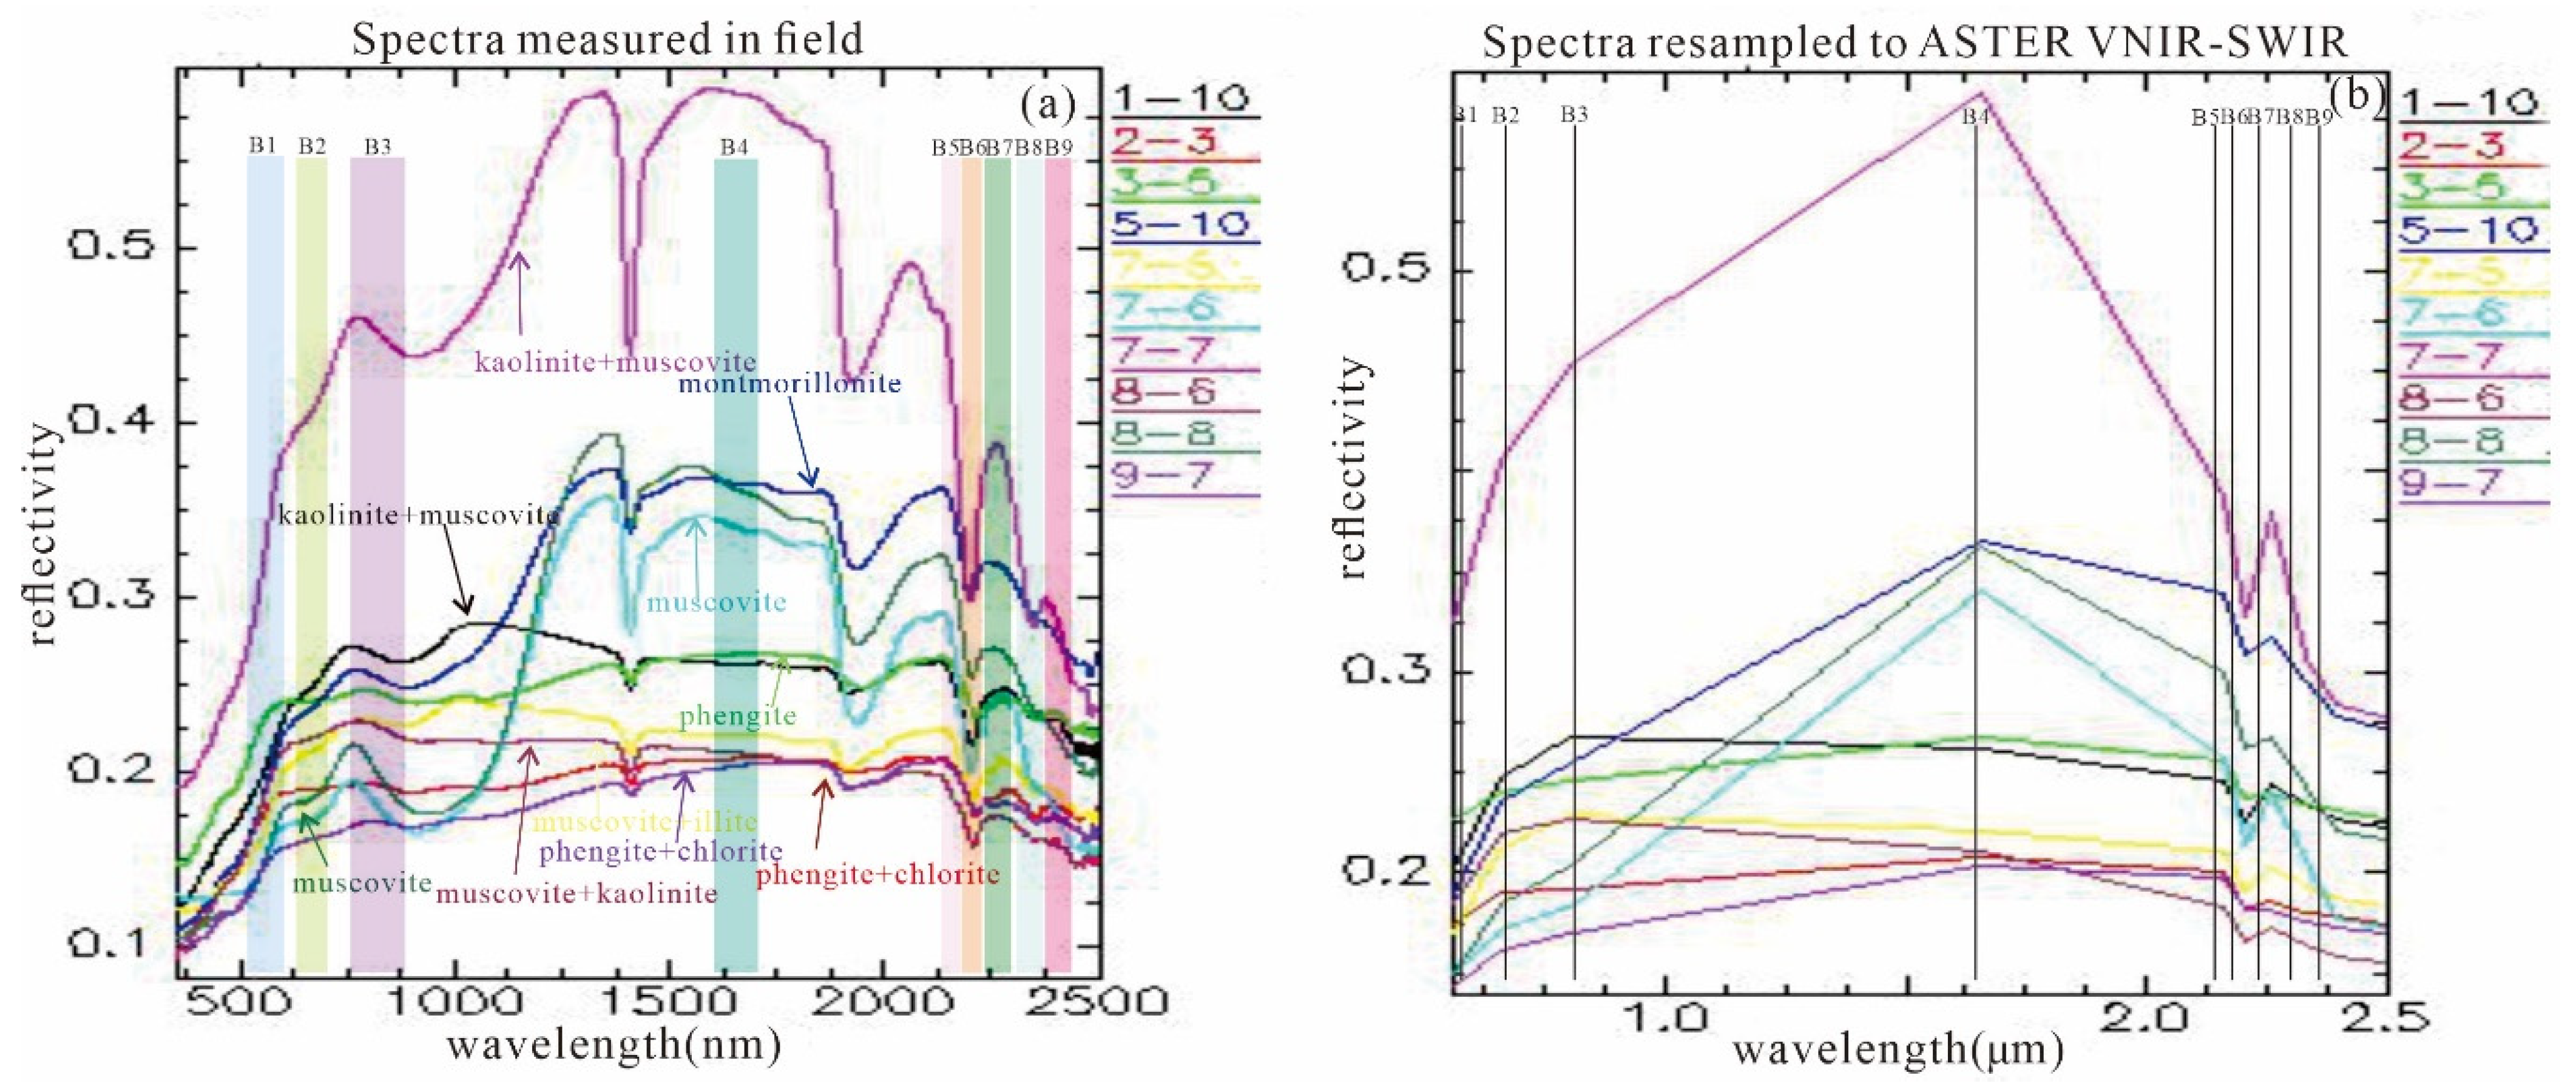
Spectral reflectances of typical rock samples for each alteration zone, collected from the land surface, were measured using an analytical spectral device (ASD) spectrometer with 2151 bands (350–2500 nm) in the field. The environments of all spectral measurements had sunny and dry weather conditions to reduce the influence of water vapor as far as possible. A contact probe with an internal light source was used to obtain spectra. Dark current correction and white reference correction were made again before each measurement at a new location (Figure 4a). All spectra were also resampled to match the ASTER VNIR–SWIR bands (Figure 4b). Location of the samples is shown in Figure 3. The spectrum number (No.) 2-3 and No. 3-5 were collected in the illite-hydromica zone; No. 8-6 and No. 1-10 were collected in the potassium zone; No. 7-5, No.7-6 and No.7-7 were collected in the propylitic zone; No. 8-8 and No.5-10 were collected in the gossan.
3.4. Remote Sensing of Alteration Minerals
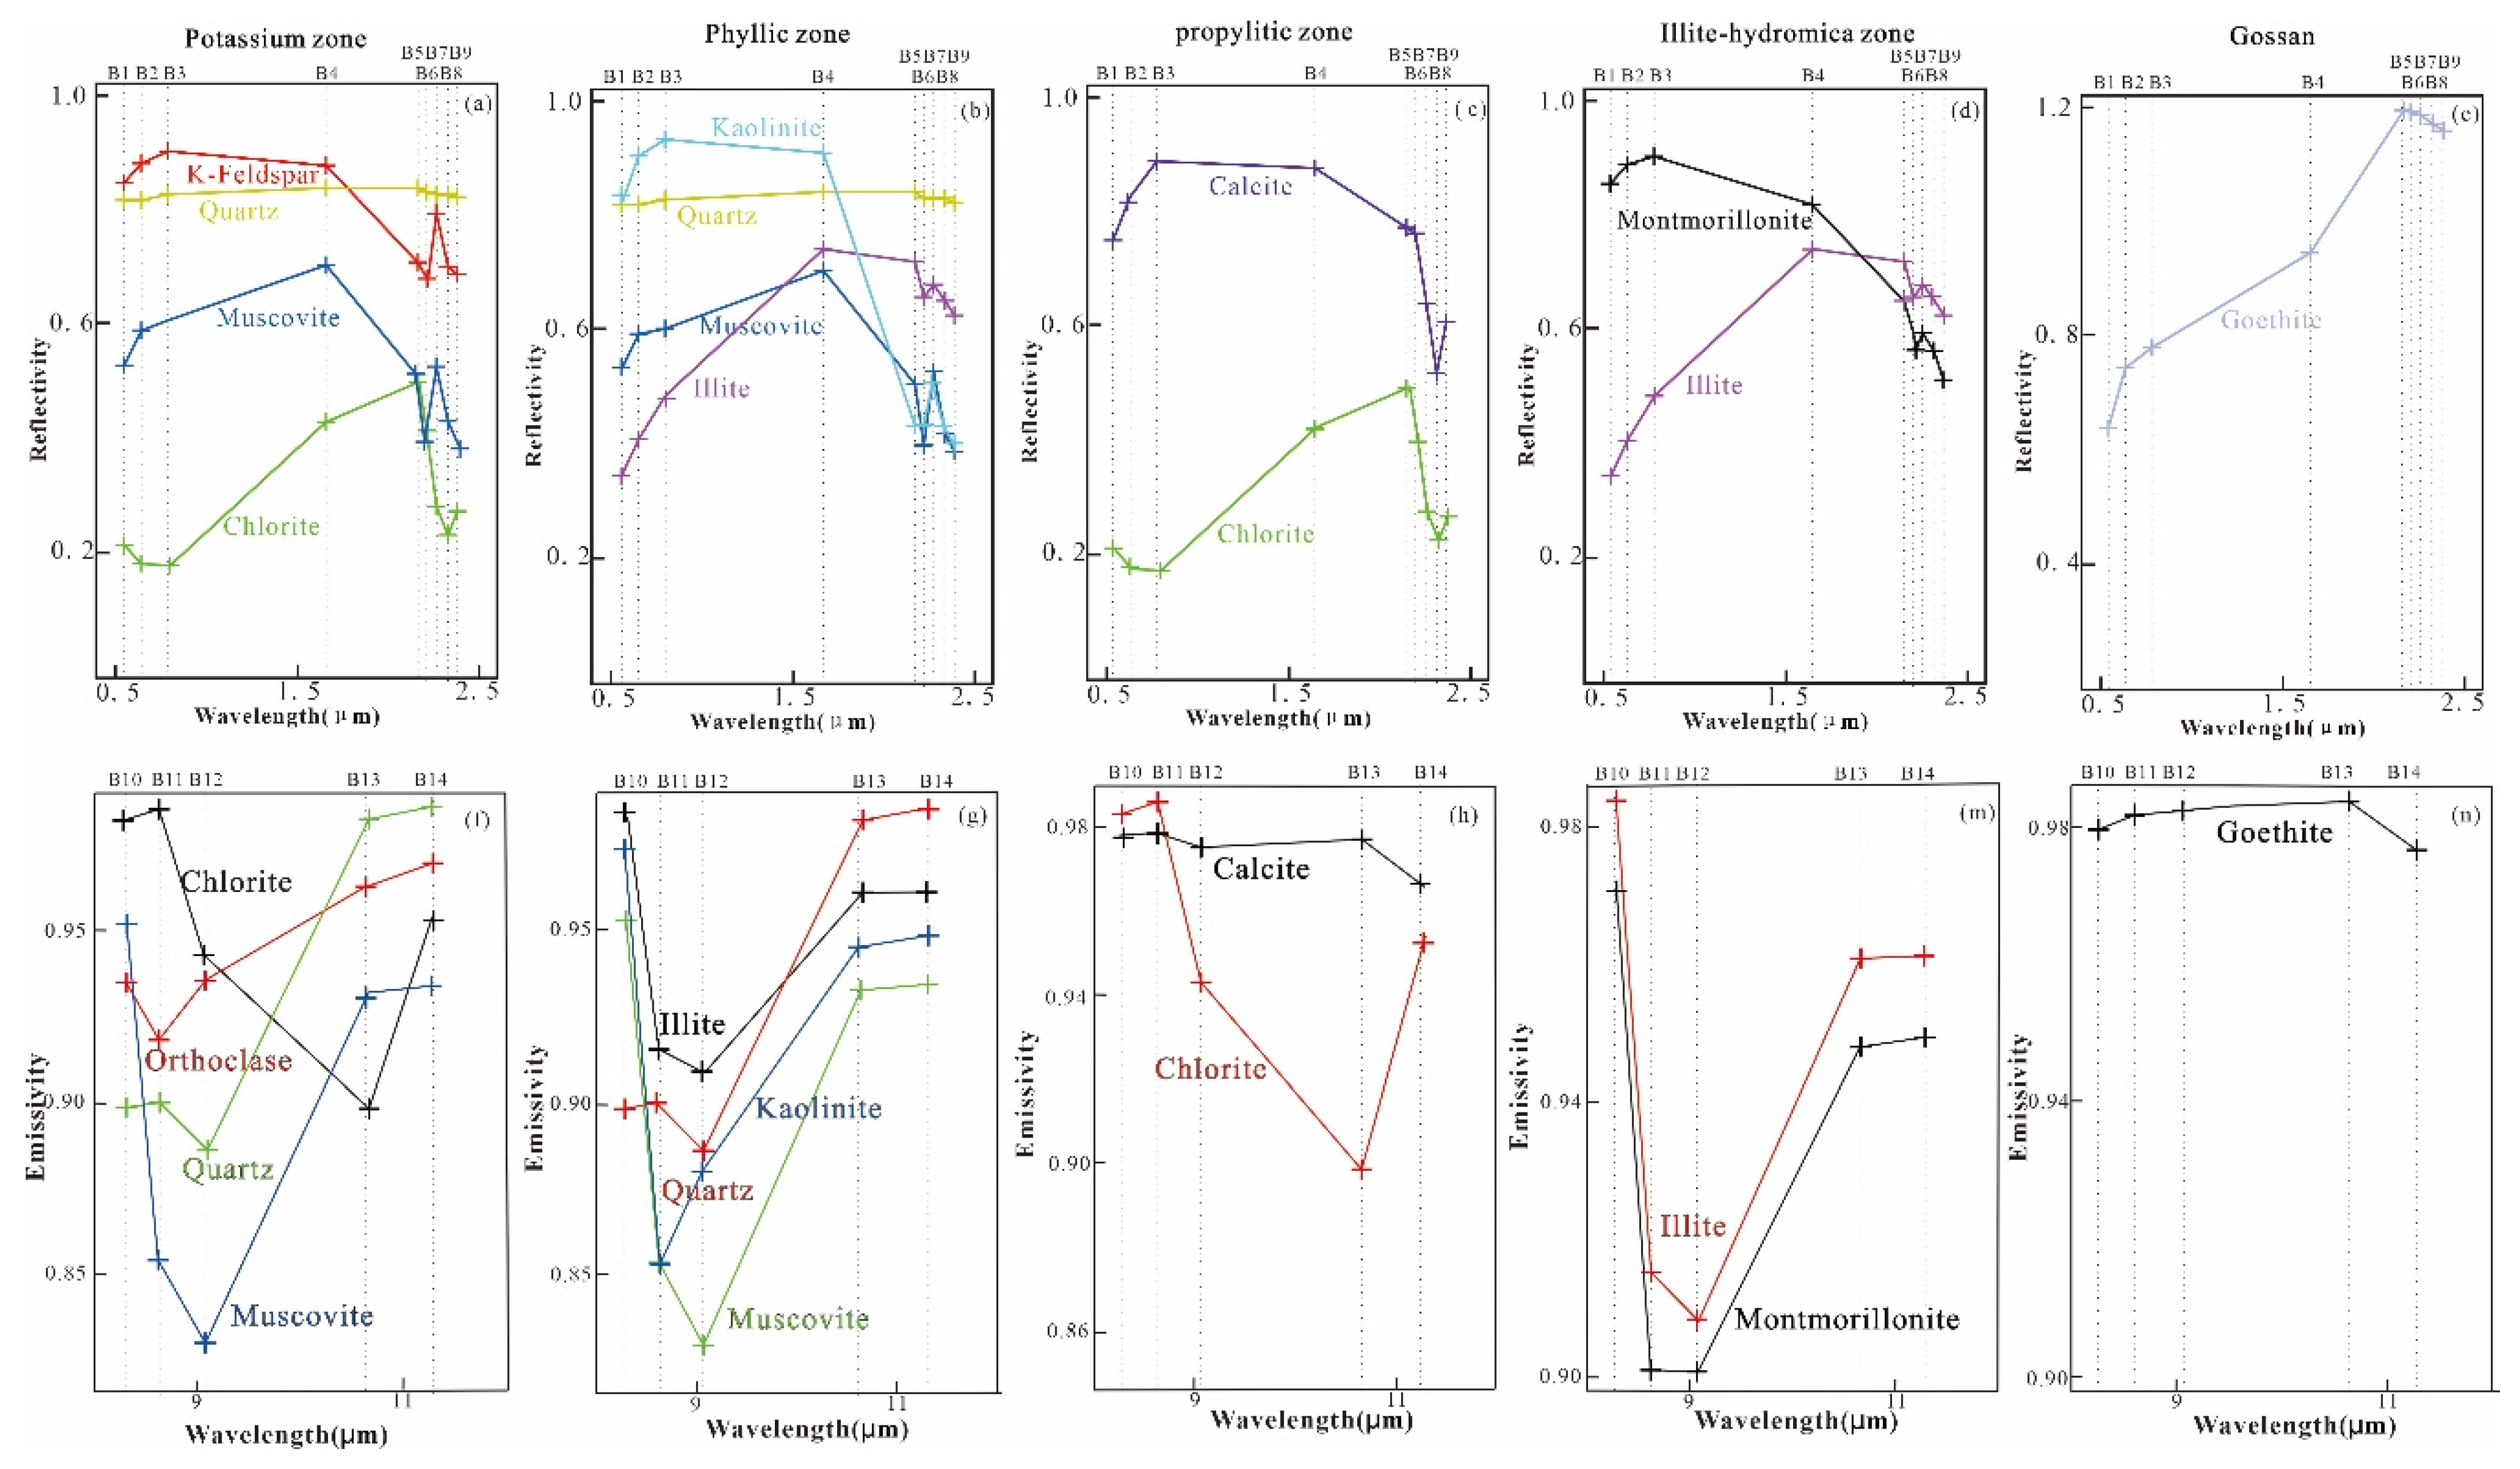
The major alteration zones of the Duolong ore district include potassic silicification, phyllic, prophylitic, illite–hydromica, and gossan zones [17,58]. Alteration minerals vary according to zone, as follows: (i) orthoclase, muscovite, chlorite, and quartz in the potassic silicification zone; (ii) muscovite, kaolinite(for substitute of halloysite), illite, and quartz in the phyllic zone; (iii) calcite and chlorite in the propylitic zone; (iv) illite and montmorillonite in the illite–hydromica zone; and (v) geothite in the gossan zone. The spectral characteristics of all alteration minerals were analyzed over the SWIR and TIR bands and then resampled to ASTER spectral responses [27,28,29,30,31,32,33,34,35,36,37,38,39,40,41,42,43,44,45,46,47,48,49,50,51,52,53,56] (Figure 5). The RS characteristics of these minerals are provided in Table 1.
3.5. Alteration Zones Information Extraction
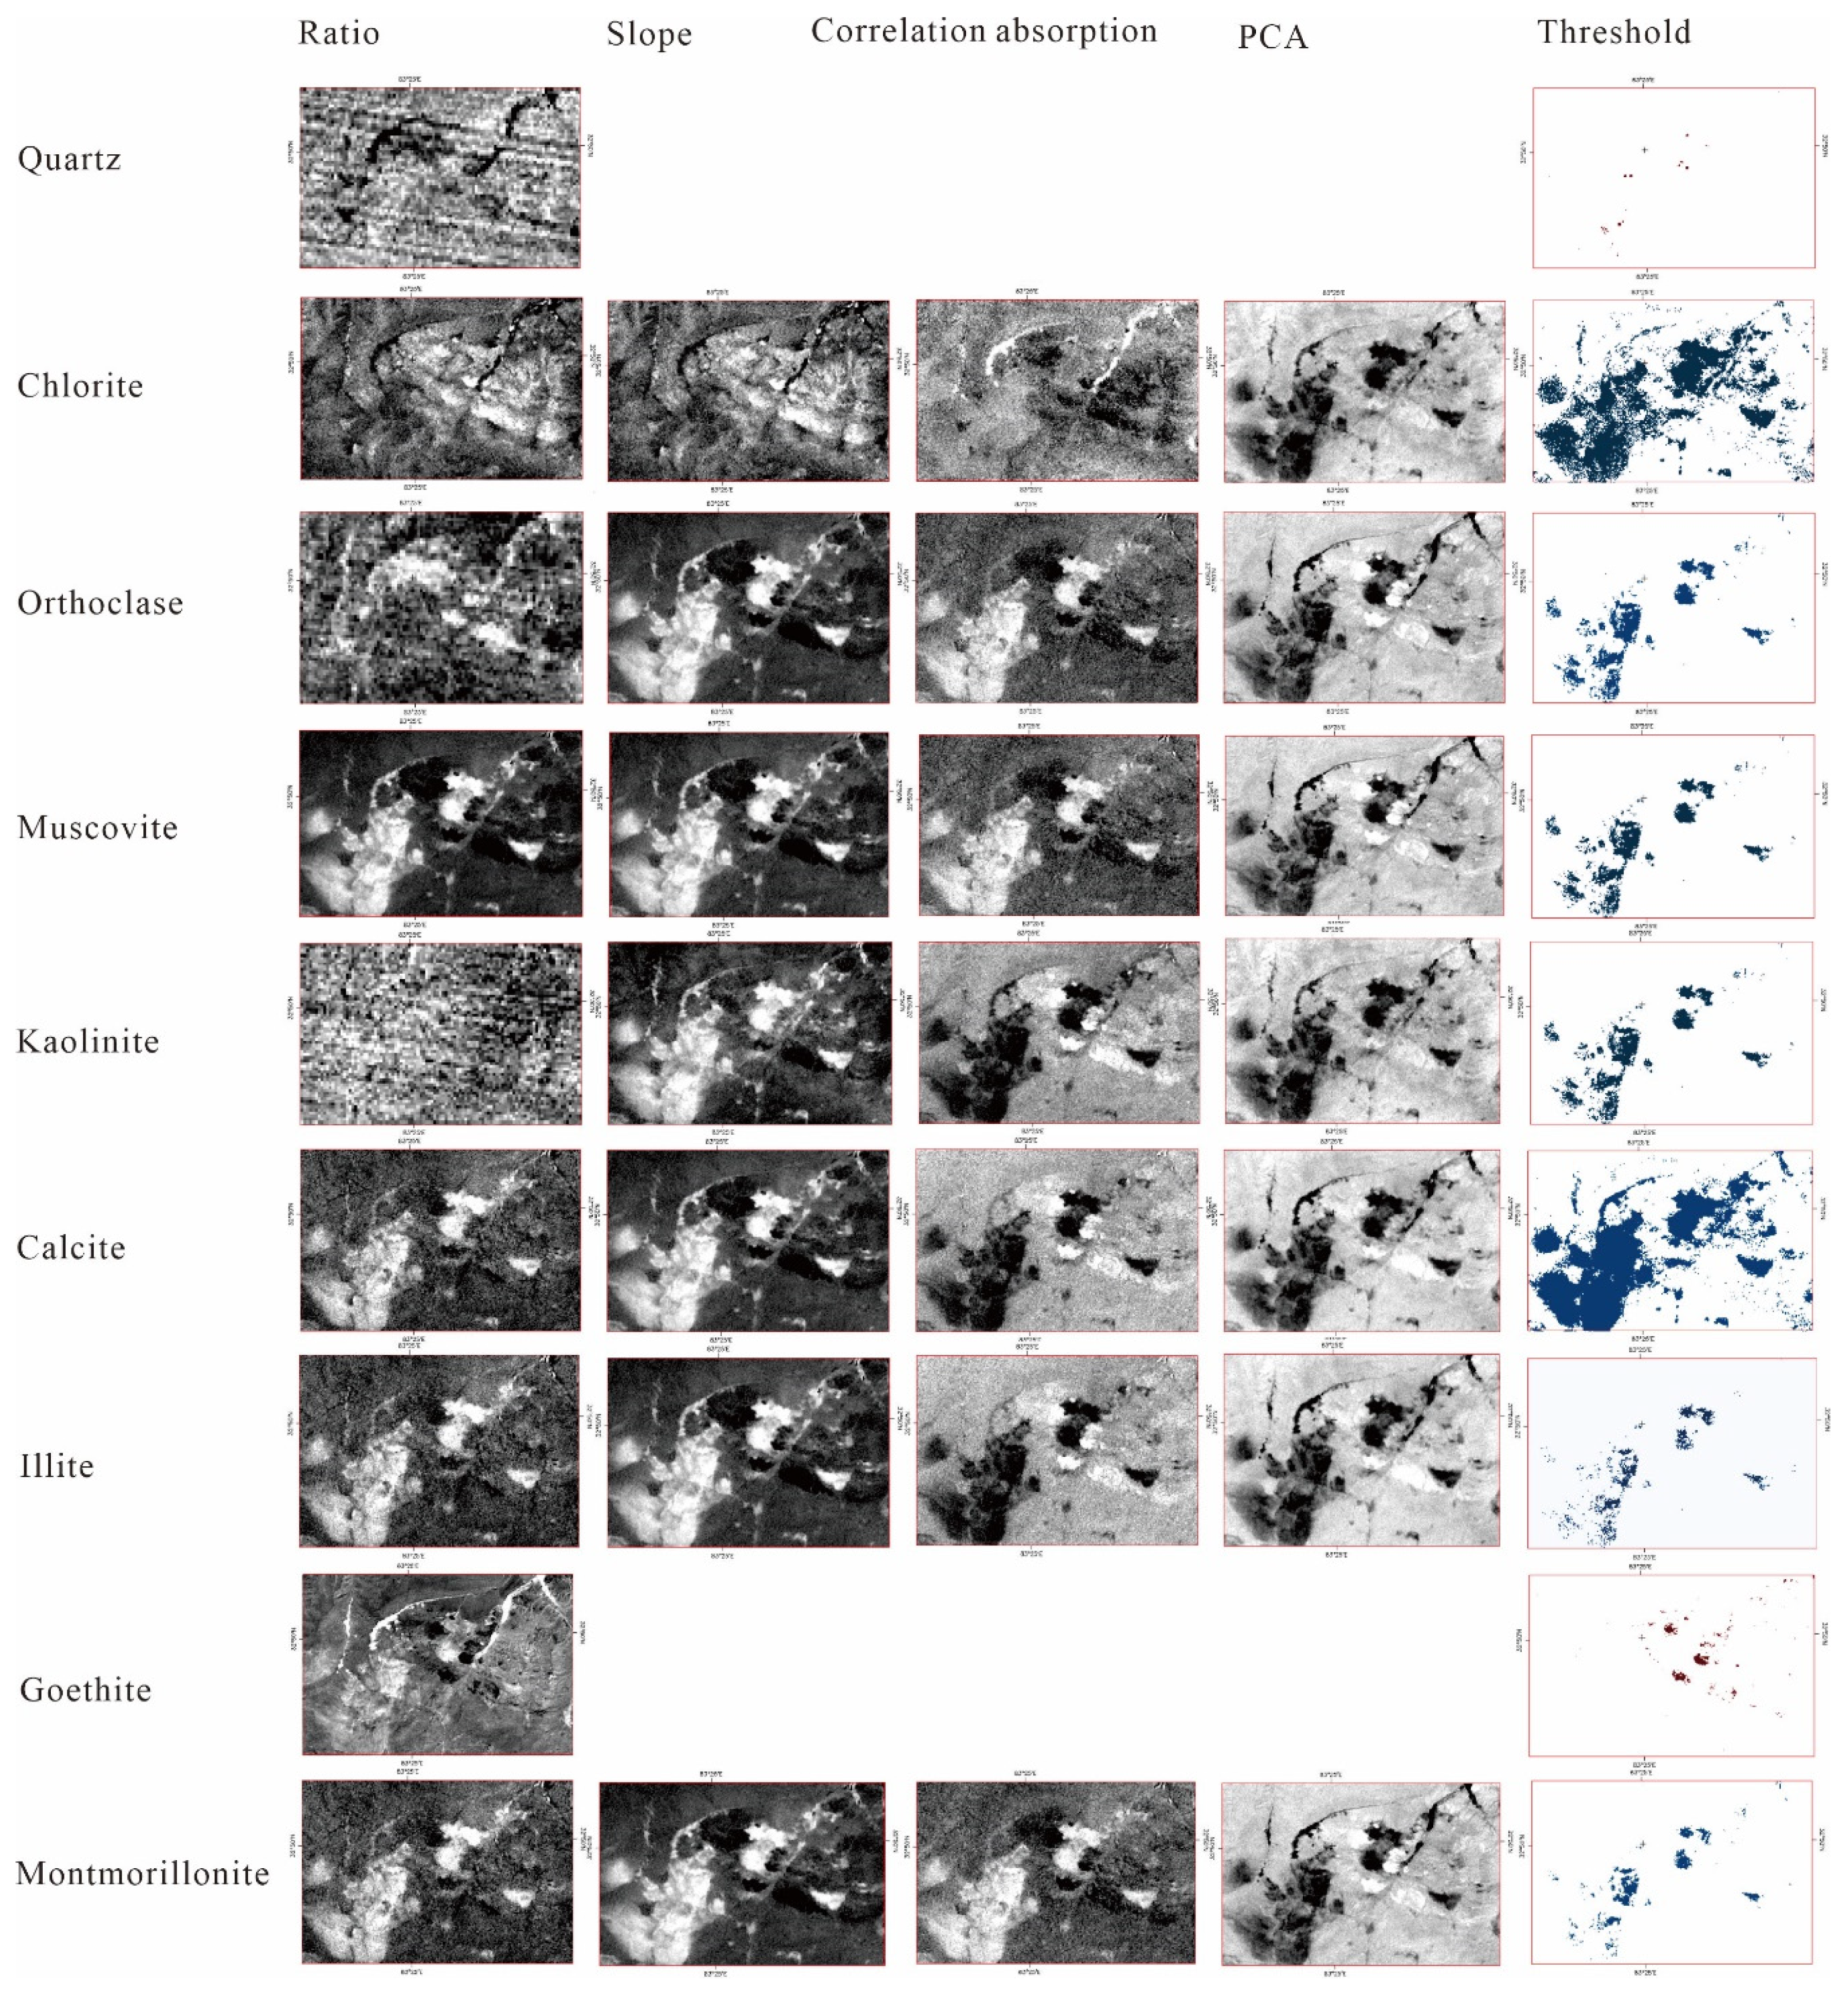
According to the characteristics of alteration minerals (Table 1), we used a variety of techniques to analyze spectral information, including PCA, the ratio method, the slope method, correlation absorption, polynomial equations, and the thermal and visible-shortwave infrared data of ASTER. Among these methods, PCA and ratio are quoted from Ninomiya and Crosta et al. [7,54,55]. Additionally, slope and correlation absorption are from the ratio, in order to amplify the spectral characteristics of minerals. For the same kinds of minerals, relevant information can be extracted by one method, which covers a large range. By designing these methods to extract the intersection information, the results are closer to the actual situation. Table 2 summarizes the main methods of information extraction with respect to the spectral characteristics of each alteration mineral. Different thresholds are used for each method in order to obtain a more suitable alteration range. The results for each method are shown in Figure 6.
3.6. Application of Magnetic Anomalies
Hydrothermal alteration causes mineralogical changes in the host rocks of ore bodies, and consequently, the original magnetic properties of these rocks could be strongly modified [58]. In Duolong district, a high-precision magnetic survey was performed. From the magnetic survey results, the porphyry Cu deposits were found to be in low positive magnetic anomalies, of around 300–650 nT [43].
4. Results and Analysis
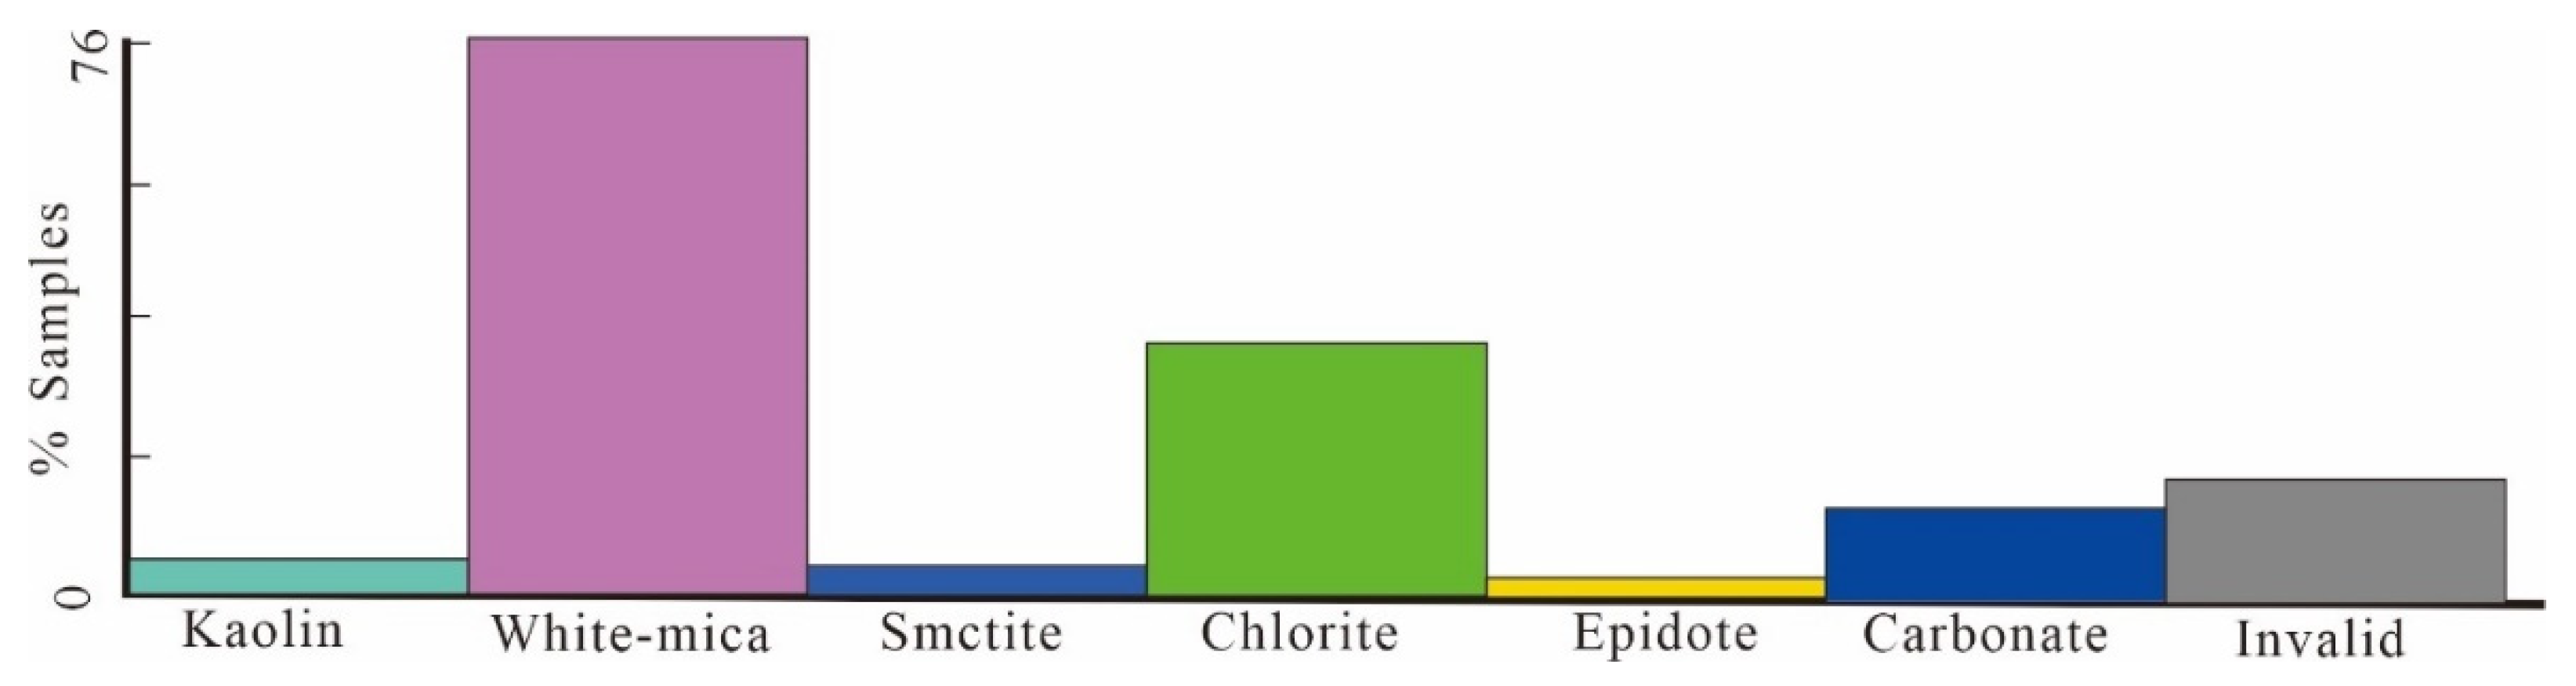
According to analysis results of the spectra of surface samples using PimaView software, the alteration mineral assemblage of the Duobuza and Bolong deposits comprises kaolin, white-mica, smectite, chlorite, epidote, carbonate, but 10% of the samples are invalid. The alteration types of surface samples include limonitization, propylitization, chloritization, and sericitization (Figure 7).
4.1. Horizontal Alteration Zonation
According to the frequency of minerals analyzed by spectra (Figure 7), muscovite, chlorite, and calcite were used to divide the alteration zonation with respect to the horizontal dimension because of high frequencies. The distribution of the main alteration minerals in the alteration zones at the Duolong district is as follows: potassic silicification zone: K-feldspar, kaolinite and muscovite; phyllic zone: kaolinite and muscovite; propylitic zone: chlorite and calcite.
The outcome is therefore a semi-quantitative description of the alteration zonation. The obtained results show that the potassic silicification zone is located mainly in the northeast of the Duobuza deposit, whereas the phyllic zone is in the center of the deposit and the propylitic zone is located in the periphery. In the Bolong deposit, the potassic silicification zone occurs in the western part, and the phyllic and propylitic zones are found in the southeastern part (Figure 3).
4.2. Remote Sensing Model
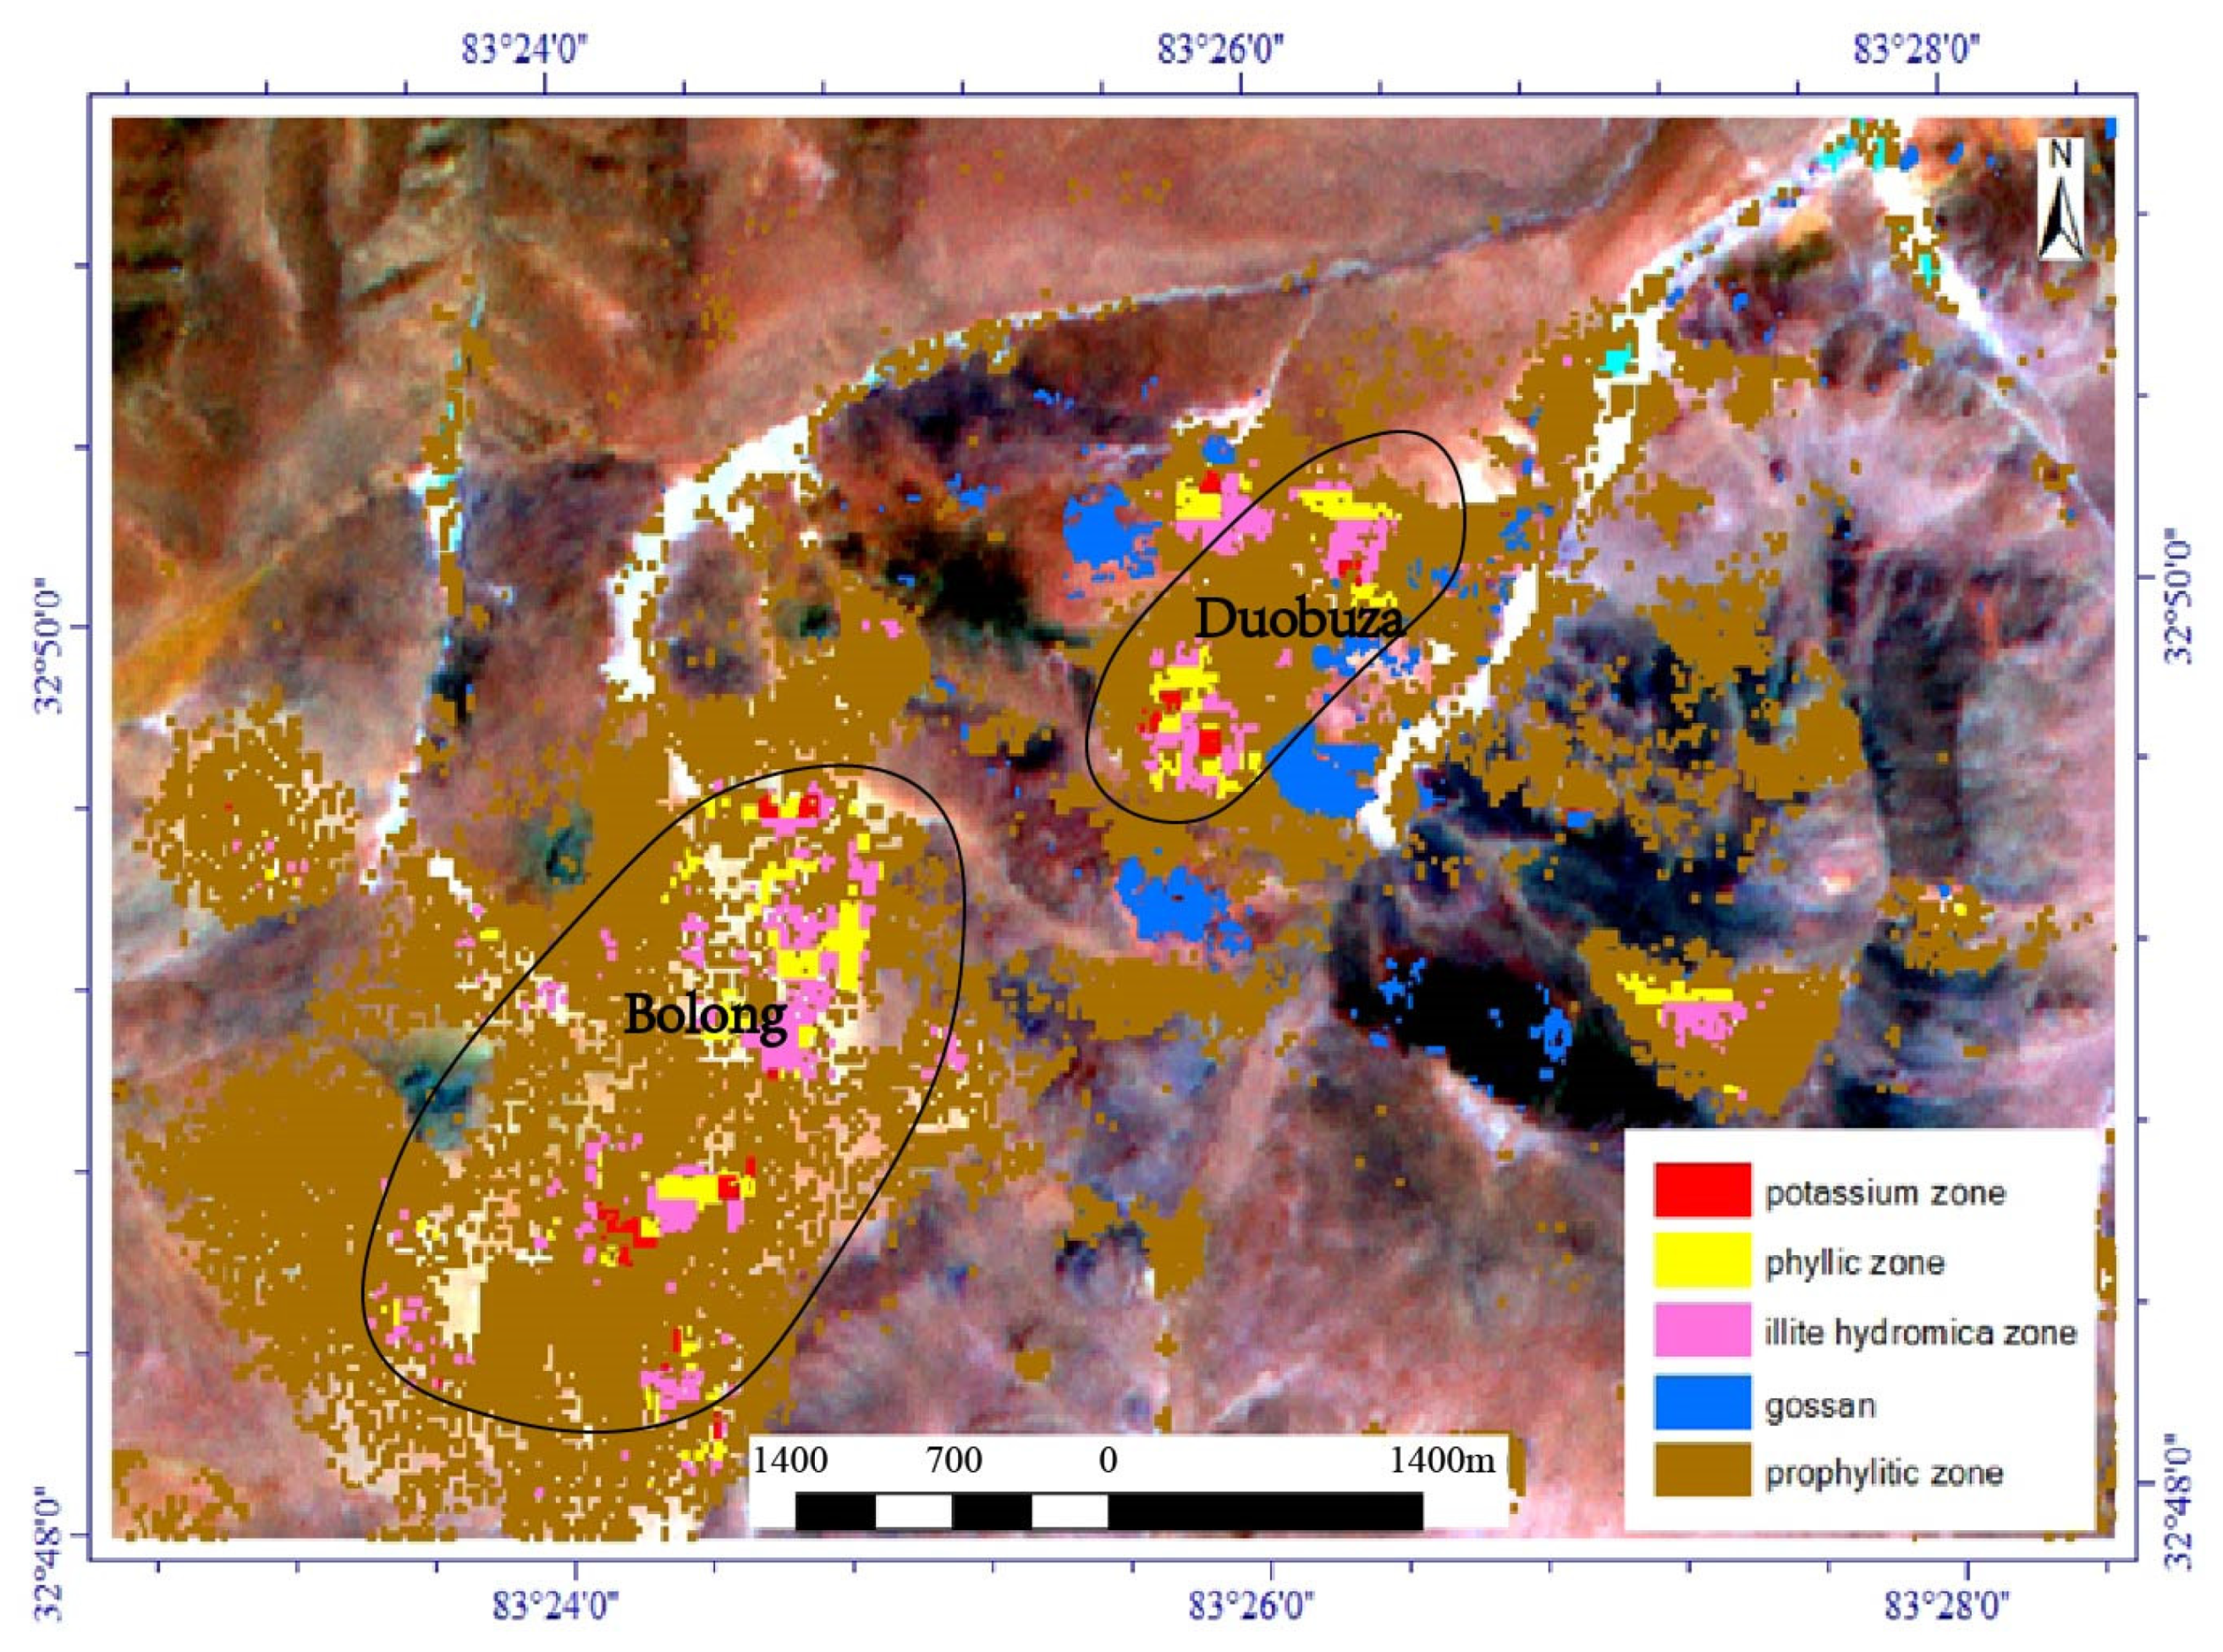
Alteration zonation information was extracted using superposition of minerals corresponding to each zone, including union information extracted using all methods, and revealed the following: quartz, orthoclase, muscovite, and chlorite in the potassic silicification zone; quartz, muscovite, halloysite, and illite in the phyllic zone; calcite and chlorite in the propylitic zone; illite and montmorillonite in the illite–hydromica zone; and limonite in the gossan zone. Results of the RS-based alteration zonation are shown in Figure 8.
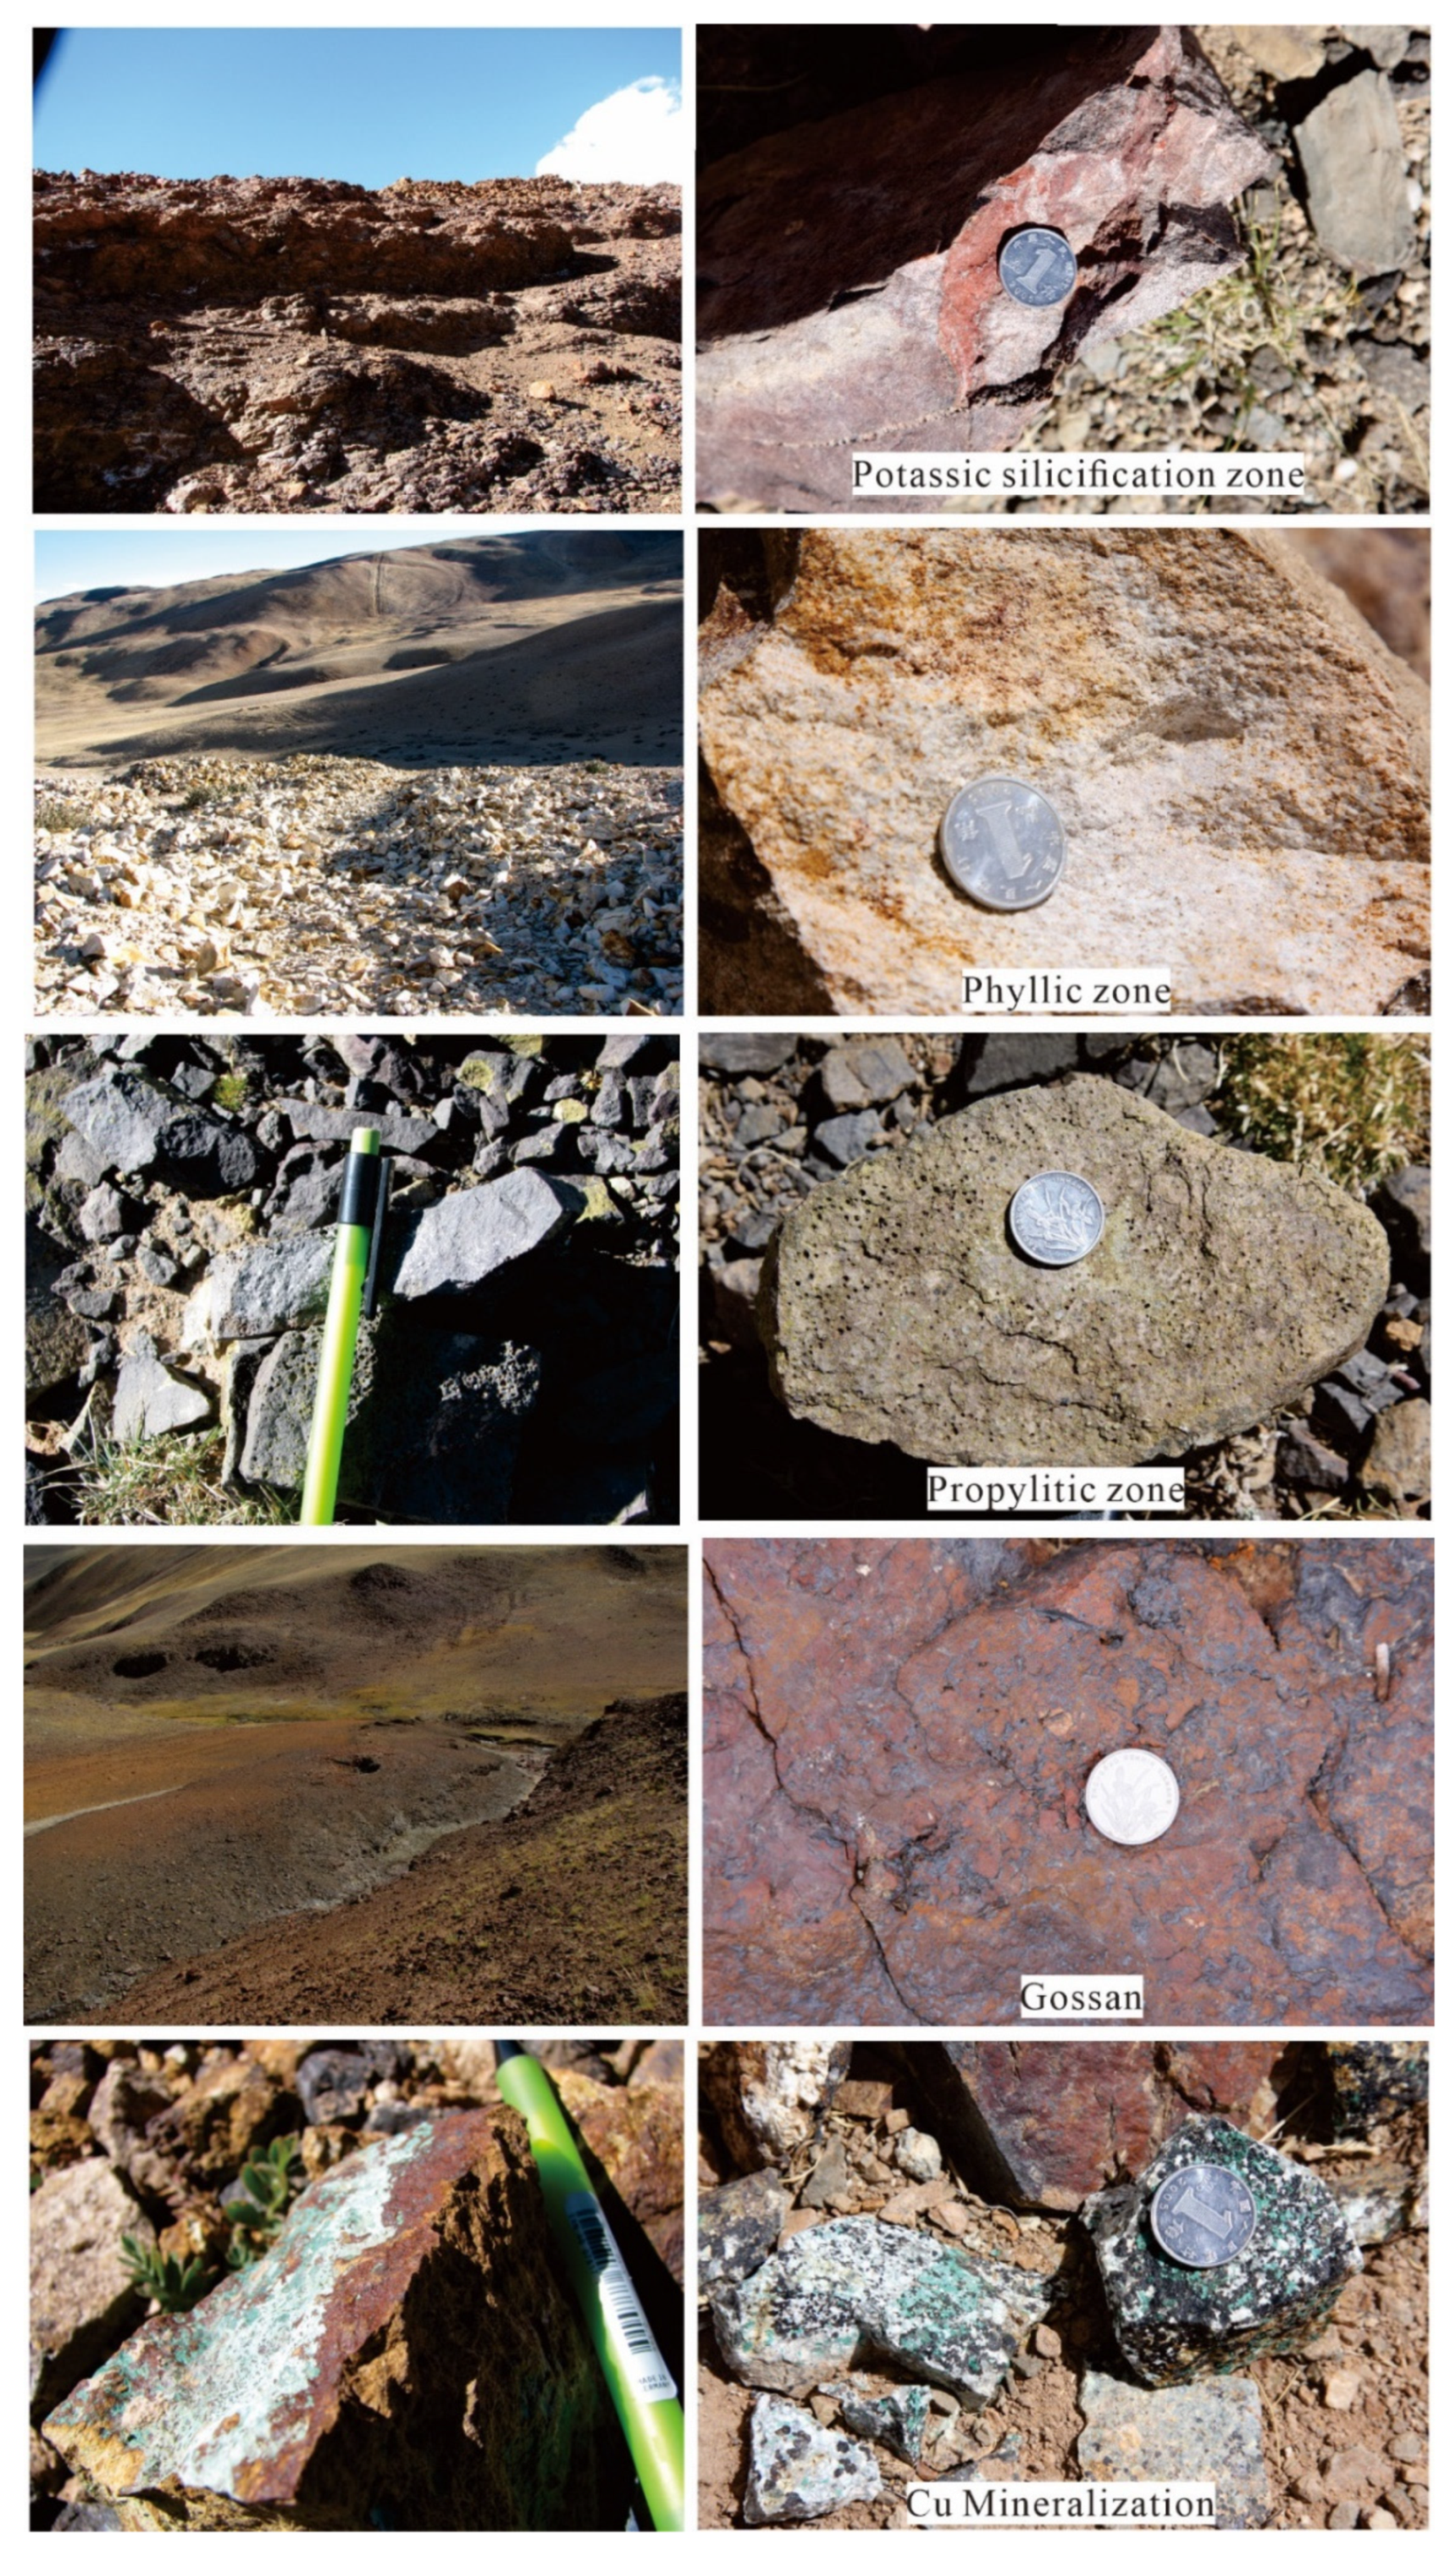
4.3. Field Validation
The alteration zones of Duolong ore district in Tibet were verified in the field (Table 3). The corresponding results of the potassic zone, phyllic zone and propylitic zone as extracted by RS are consistent with field (Figure 9). The main minerals in the potassic zone are quartz and orthoclase, and some kaolinite. The main altered minerals in phyllic zone are muscovite, halloysite, kaolinite and illite. Chlorite and calcite are the main altered components of propylitic zone. These minerals are generally consistent with the altered minerals analyzed by spectra. Additionally, the minerals composition and distribution are basically consistent with the minerals extracted by RS.
5. Discussion
Porphry Cu deposits are a veinlet type of sulfide copper deposit formed by a post magmatic medium high temperature hydrothermal solution of potash and hydrogen altered mineral [17,59]. Ideal porphyry Cu deposits are typically related to hydrothermal alteration zones, such as potassic, phyllic and propylitic zones [60]. Hydrothermal alteration minerals with diagnostic spectral absorption properties in VNIR, SWIR, and TIR can be identified by ASTER RS data [17,21,23,26,37,61,62,63,64,65,66]. The core of the potassium zone is surrounded by phyllic and propylitic zones. The phyllic zone is characterized by sericite, which has an Al-OH absorption feature at 2.20 μm, coinciding with ASTER band 6. The mineral assemblages of the outer propylitic zone include chlorite, epidote, and calcite have absorption features at 2.35 μm, coinciding with ASTER band 8 [2,17,21,63,67,68,69]. ASTER provides useful data for studying mapping hydrothermal alteration mineral zones associated with porphyry copper. Several spectral mineralogic indices, using ASTER VNIR, SWIR, and TIR bands, were proposed [70,71,72,73,74,75,76,77,78,79,80]. These indices provided accurate spectral information for minerals [17]. The PCA method can extract the characteristic spectral information of key hydrothermal alteration mineral end-members [76]. These methods can be used to extract information of minerals or mineral assemblages.
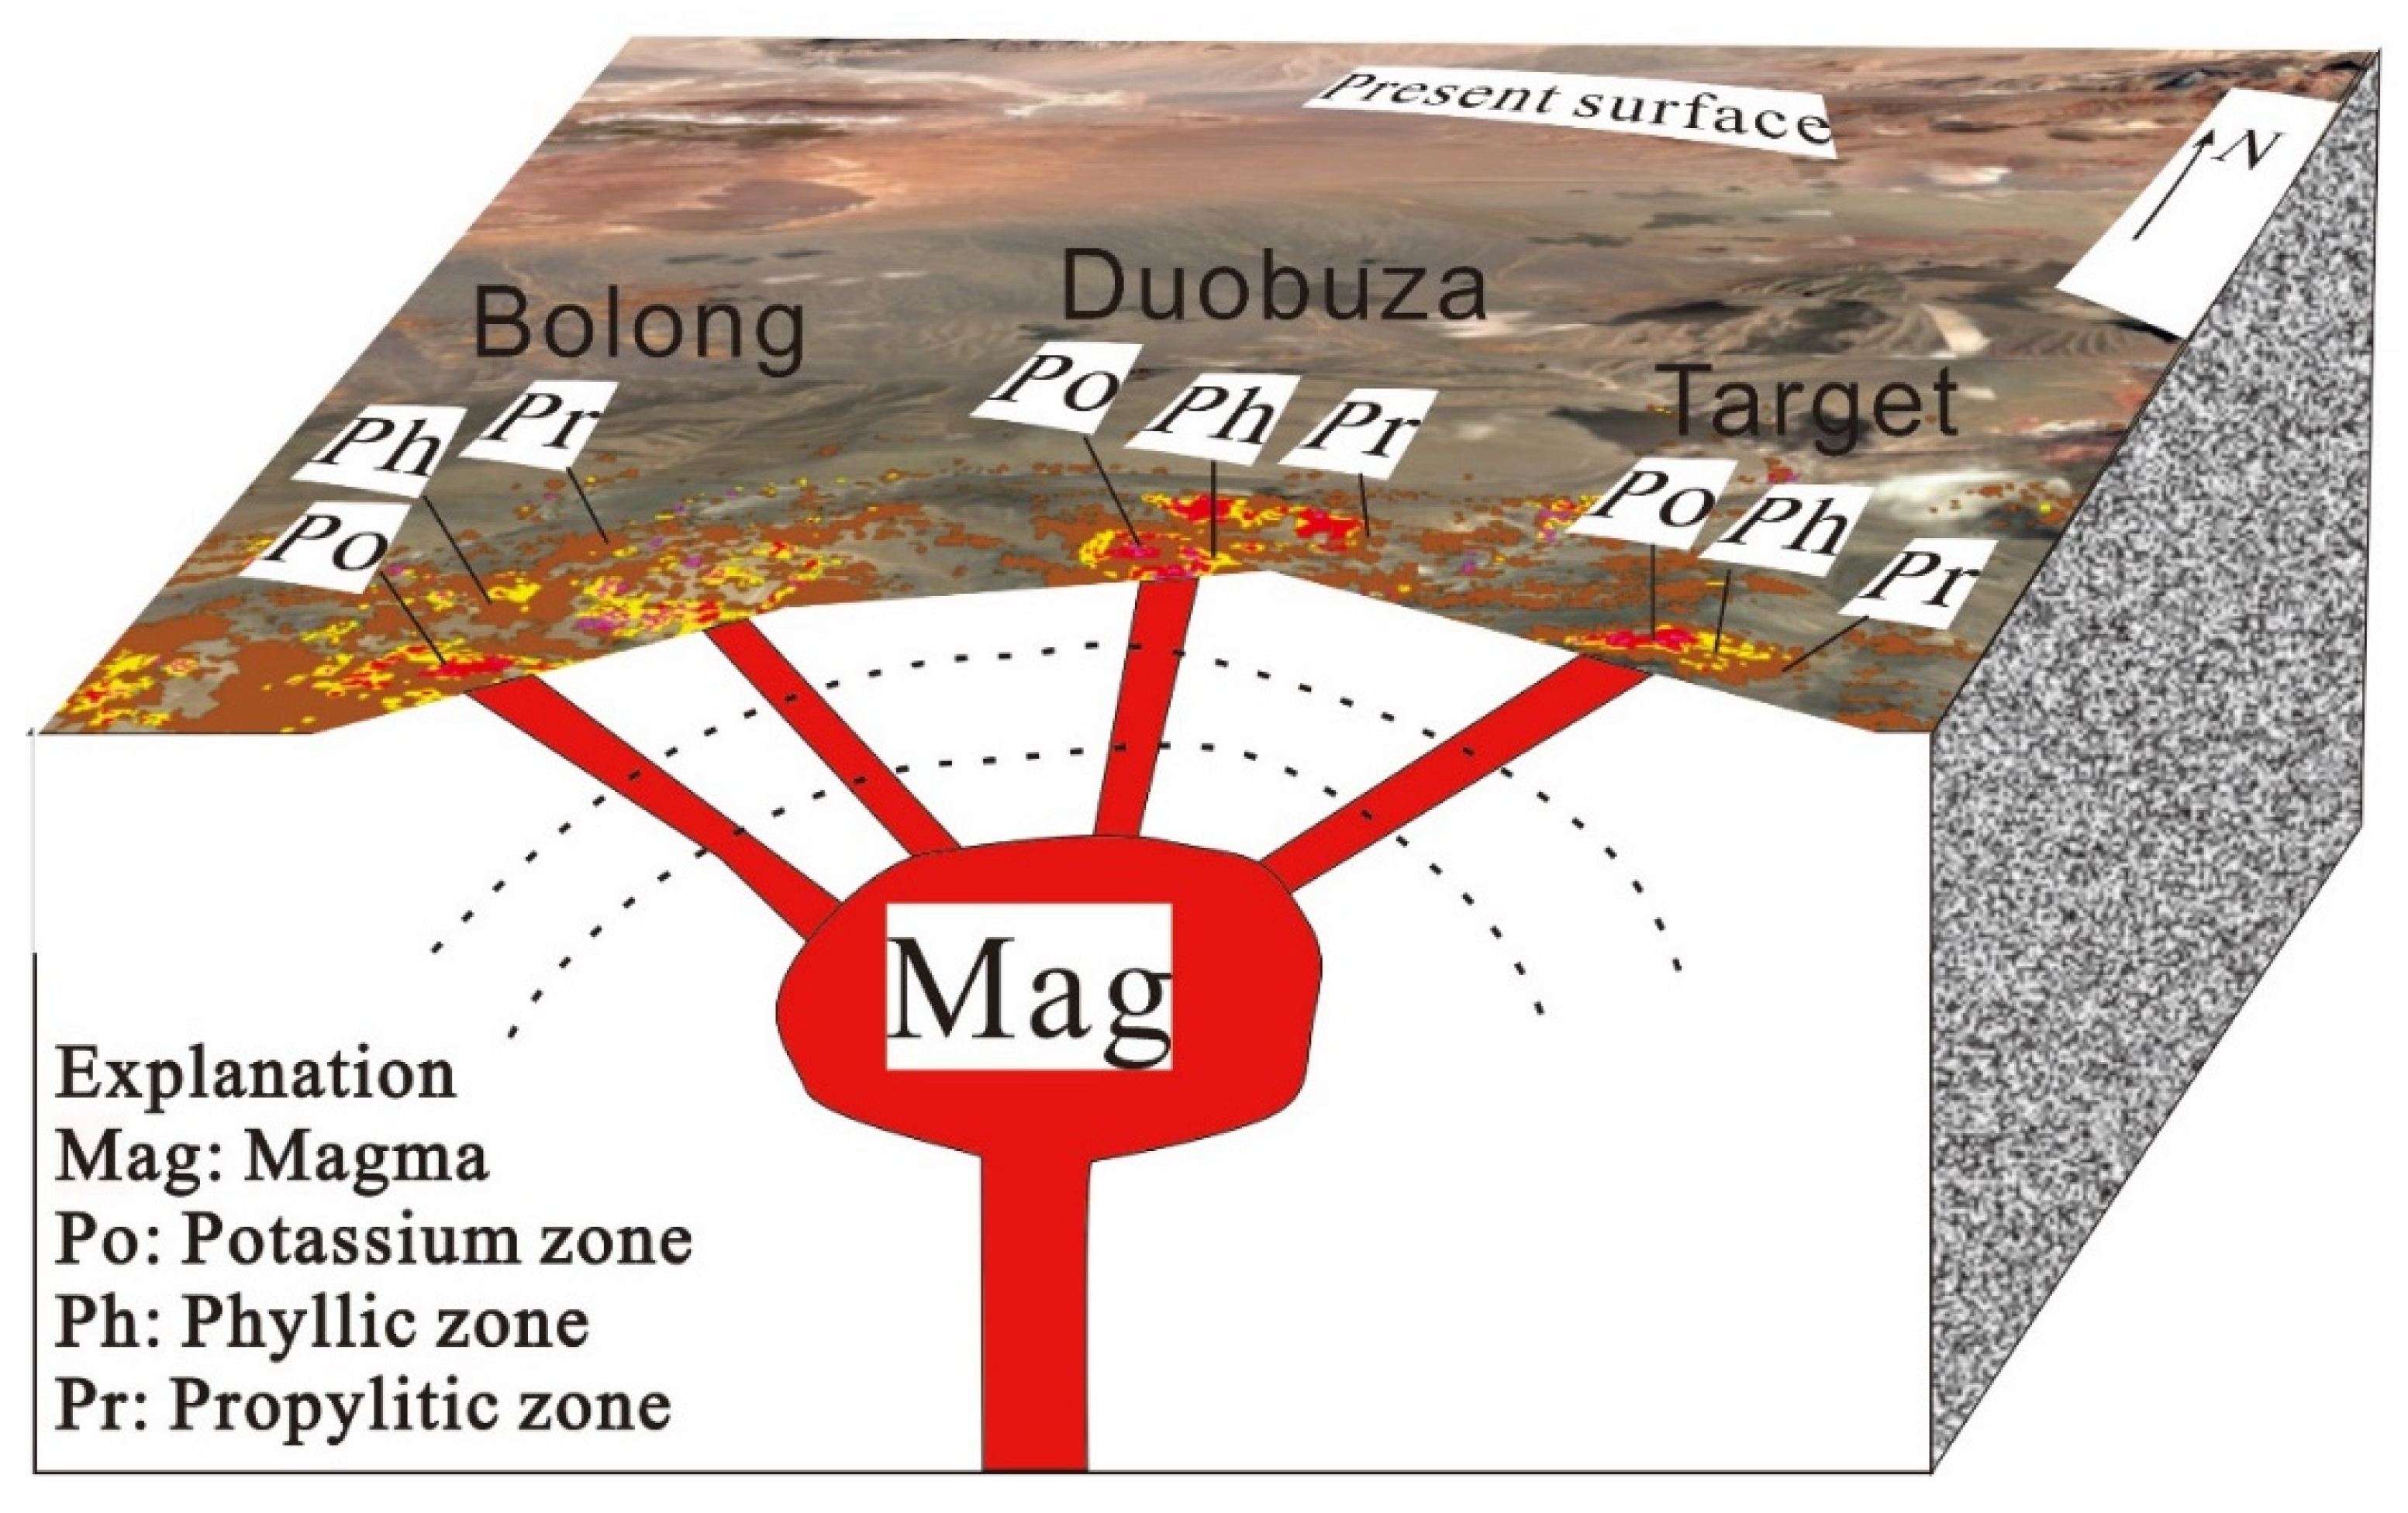
Previous studies indicated small intermediate–felsic porphyritic intrusions and Cu-Au sulfide ores in Duolong ore district were from 120 to 110 Ma [45,46], which was accompanied by large-scale mineralization. In fact, aluminum hydroxyl (Al-OH) and magnesium hydroxyl (Mg-OH) were important prospecting indicators [36,37,38,39]. The advantages of the RS alteration model of porphyry copper deposits mainly correspond with alteration zones of porphyry copper deposits. The study indicated multiple hydrothermal ore-forming centers with obvious signs. The magma involved in the formation of the porphyry copper deposit is inferred to have been intermediate–felsic in composition [38], forming hypabyssal or ultra-hypabyssal rocks and producing altered minerals. The diagnostic spectral absorption features of hydroxyl-bearing minerals including clay and sulfate groups, as well as carbonate minerals due to vibrational processes of fundamental absorptions of Al-OH, Mg-OH, and CO3 groups in the SWIR and TIR regions of the electromagnetic spectrum [2,17,67,68,77]. Some spectra of surface samples were collected. These spectra indicate spectral features of kaolin, white-mica, chlorite, epidote, carbonate and smectite by PimaView software analysis. These mineral assemblages belong to the alteration minerals of porphyry Cu deposits [60]. According to the combinations of alteration minerals in each alteration zone, the information extracted by RS corresponds to the characteristics of quartz, potash feldspar, kaolin, white-mica, chlorite, epidote, carbonate. In these samples, quartz, potash feldspar, biotite, anhydrite, halloysite and illite cannot be identified. Therefore, when the information of the alteration zones was extracted using RS image, we had to recommend the reference spectra [48,49,50,51,52]. Our ASTER RS-based alteration zonation model for the Duolong ore district should help to guide mineral exploration in the region. The alteration zonation model shows that the magmatic rock mass occupies the center of the deposit, the near periphery comprises the sericite zone, and the distal periphery contains the propylitic zone, with the illite–hydromica zone intersecting across these zones. The gossan zone is located in the periphery of the propylitic zone. During the ascent of the magma that was emplaced in the hypabyssal subsurface in the deposit area, the crust became domed, and fractures developed, providing channels for magmatic–hydrothermal fluids to migrate. The country rock was altered to form the potassic silicification zone. Biotite in the alteration zone was altered to chlorite, and K-feldspar was altered to muscovite and sericite. At a distance from the magmatic body, sericitization and silicification occurred in the surrounding rock outside the potassic silicified zone, with the inner part of this zone being characterized by sericite, illite, kaolinite, and halloysite. Further out, the illite–hydromica zone and the gossan zone constitute the propylitic zone, containing predominantly chlorite and calcite, and the sericitization zone. These zones were largely formed by the replacement and sulfurization of iron-bearing materials in volcanic rocks of the Early Cretaceous Meiriche Formation, by sulfur-containing magmatic–hydrothermal fluids (Figure 10). Meanwhile, hydrothermal magnetite coexists with chalco-pyrite at Duolong ore district, consistent with the mineralization characteristics of porphyry Cu–Au deposit [78,79,80]. Positive and low magnetic anomalies indicate the location of metallogenic porphyry (Figure 11). Here, we used RS to extract alteration zonation information for the Duolong porphyry copper ore district, based on geological information and the spectra of altered rocks of the deposit, after which we constructed a model of the zonation. Our model can be applied to optimizing ore prospecting target areas in the deposit. The metals and ore-forming fluids of Porphyry deposits in Duolong ore district are more likely to be released from magma chamber [45,46].
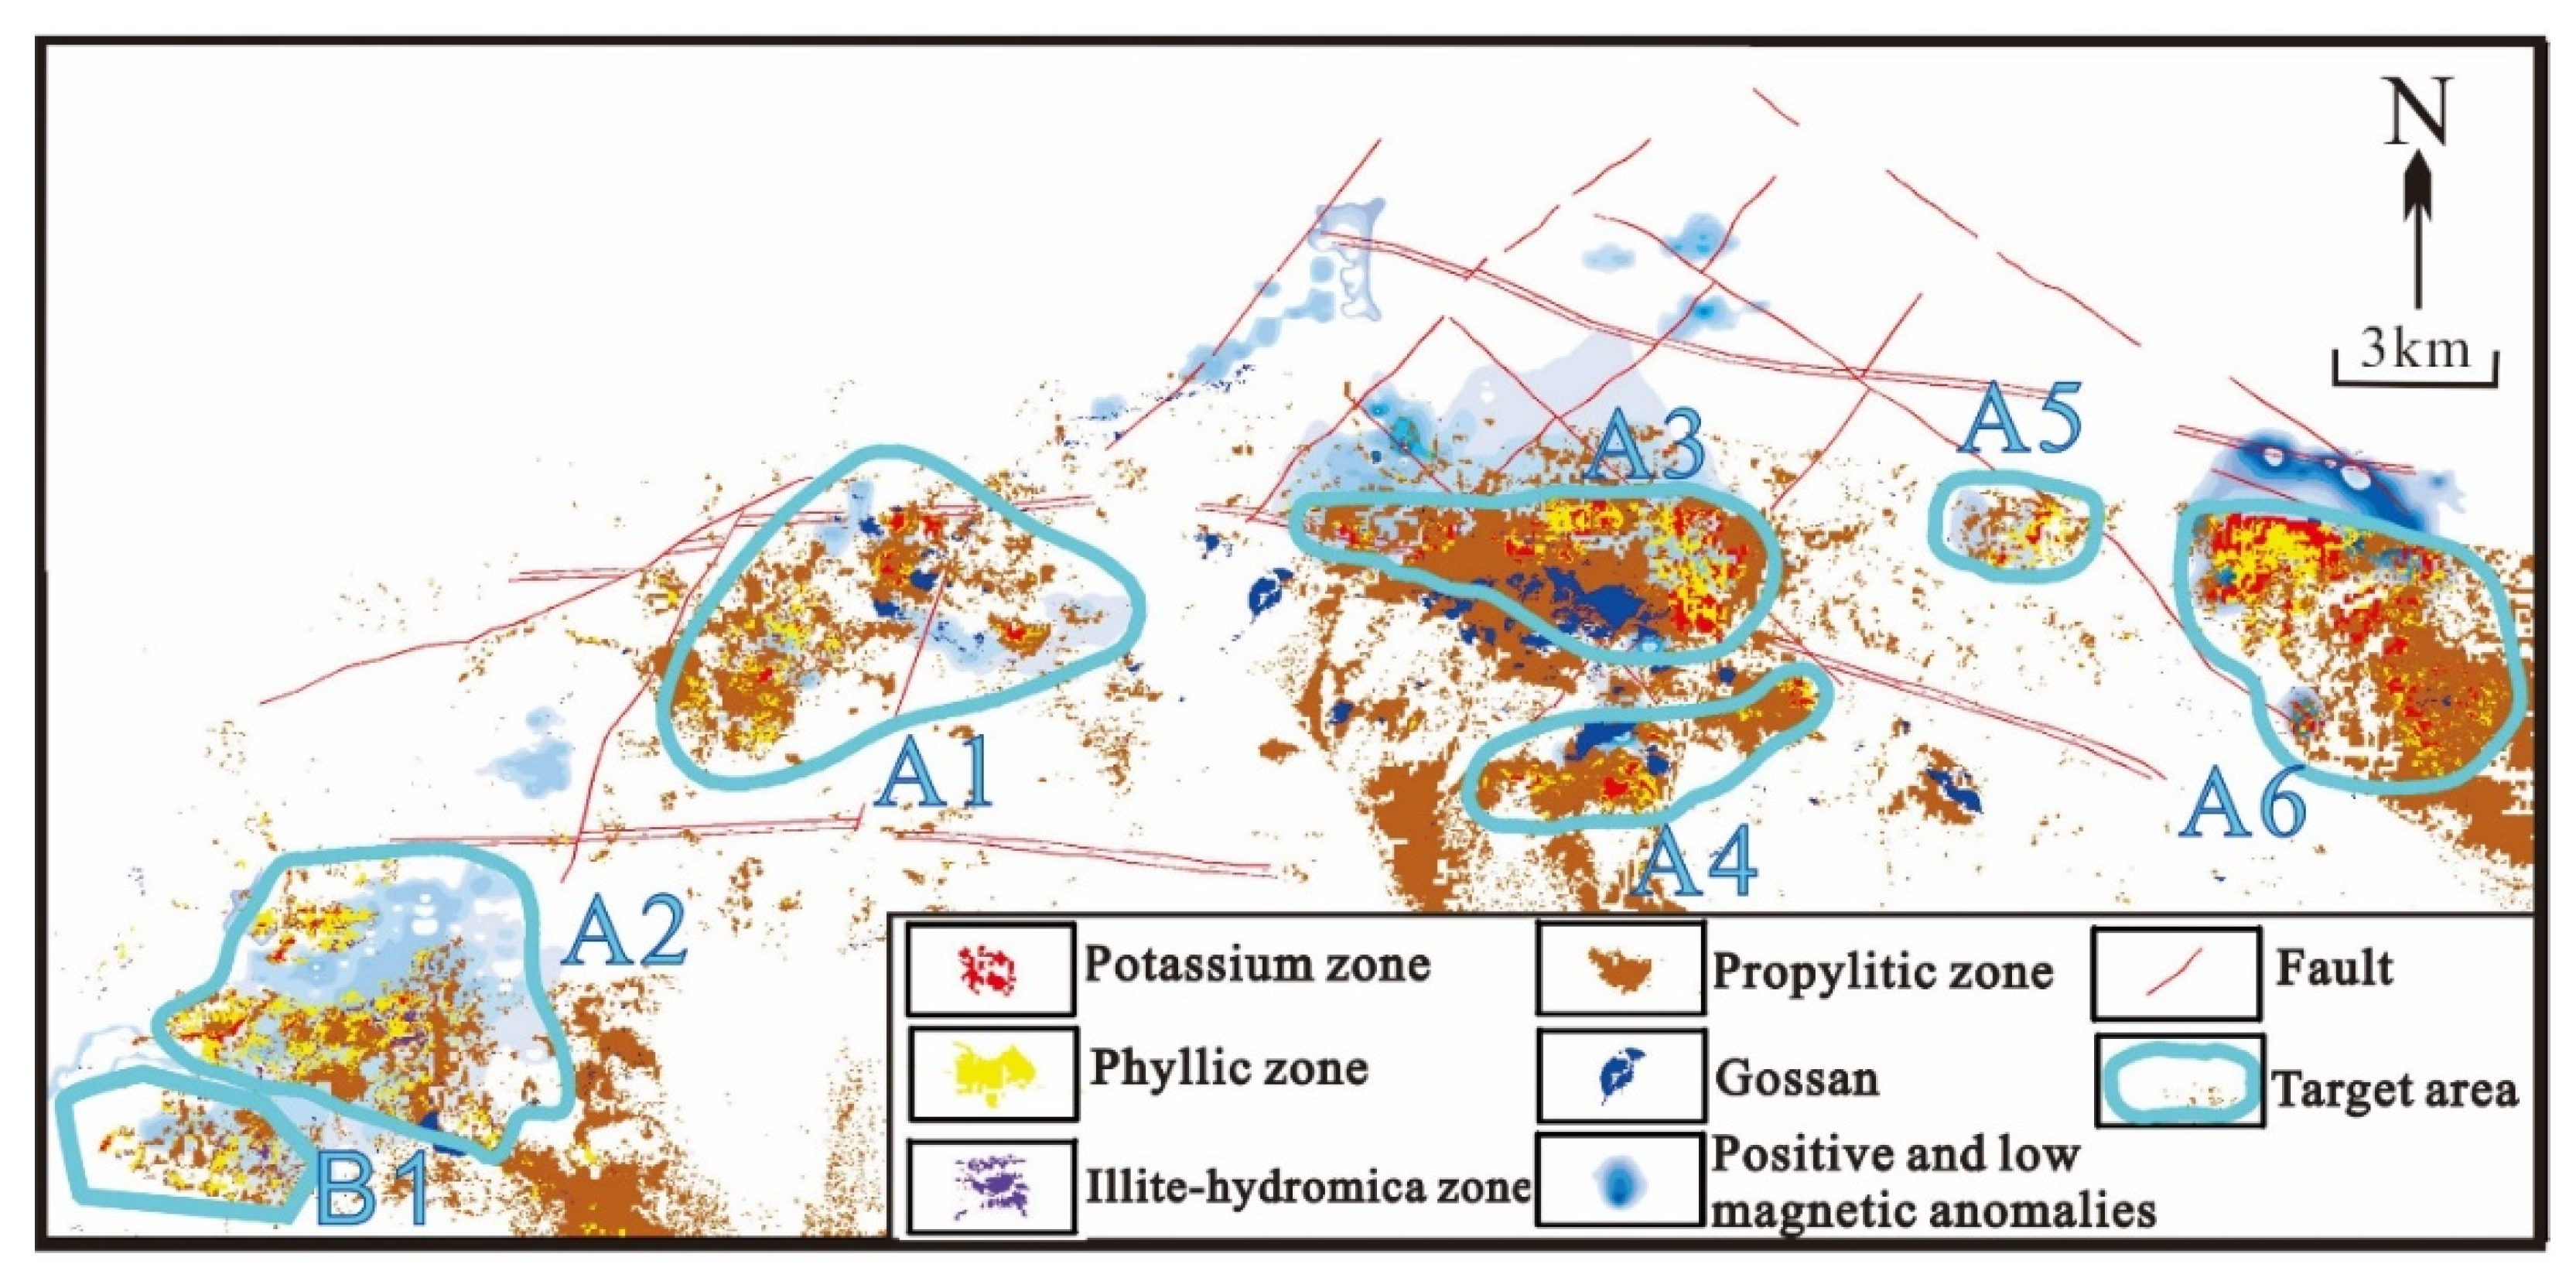
The RS-based model of alteration zonation constructed for the Duolong ore district was integrated with various prospecting factors in the western part of the Bangong–Nujiang metallogenic belt. Factors related to prospecting include magmatic rock type, country rock, geological structure, alteration zonation, geophysical properties, and geochemical characteristics [43]. These factors were superposed to evaluate prospectivity using GIS software. The predicted areas were located in typical RS alteration zones, in a favorable metallogenic geological position, and have a high geochemical value area of Cu or Au, as well as positive and low magnetic anomalies. Seven target areas were selected for porphyry Cu ore-deposit prospecting, distributed along the large-scale structural belt of the Tiegelong Mountains (Figure 11). Of the seven areas, six were class A target areas and one was a class B target area. A class A target area generally has outcrops of granodiorite porphyry and favorable geochemistry, alteration zonation, and magnetic anomalies, whereas a class B target area lacks one or two of these favorable characteristics.
6. Conclusions
We investigated alteration zonation and prospectivity in the Duolong porphyry copper ore district by analyzing the remote sensing (RS) spectra of altered rock on the surface and integrating this information with the deposit geology of the Duolong ore district. We established the spectral characteristics of altered minerals and distinguished alteration zones in the deposit. The mineralization of the deposit is magmatic–hydrothermal in origin and alteration zonation extends from the center of the deposit, where the magmatic body was emplaced into country rock, to the periphery. From the center to the periphery, with decreasing temperatures of magmatic–hydrothermal fluids from medium–high to medium–low, the order of alteration zoning is as follows: (i) potassic silicified zone (containing biotite and chlorite); (ii) sericitization zone (Sericite, illite and kaolinite); (iii) argillization zone (kaolinite, halloysite, chlorite, illite, and montmorillonite); and (iv) propylitic zone (carbonate, chlorite epidote, and montmorillonite).
In this study, an ASTER RS alteration zoning model was established based on ground spectral alteration zoning results. The methods include PCA (Principal Component Analysis), Ratio, and Slope methods. RS-based alteration zonation was developed based on the intersection of maps, resultant from the ratio, slope, extraction information of different minerals obtained through PCA methods. An RS-based alteration zonation model of the Duolong copper porphyry district was constructed by combining alteration-mineral and zone-spectral information with the mineral and geological characteristics of the deposit. This suggests that the model provides a suitable tool for establishing alteration zonation and, when combined with other information, for predicting prospectivity. Combining the RS-based alteration-zonation information with prospecting factors such as magnetic anomaly and geological structure information, allowed target areas to be established for the Duolong ore district. This method is applicable to an exploration of other similar porphyry copper deposits. In future, we will identify minerals using hyperspectral embedded with an unmanned aerial vehicle (UAV). A three-dimensional prospecting method will be built by satellite RS, UAV hyperspectral and ground and boreholes.
Author Contributions
X.X. contributed to the conception of the study; X.G. performed the experiment; F.Y. and J.Y. performed the data analyses and wrote the manuscript; J.Y. helped perform the analysis with constructive discussions. All authors have read and agreed to the published version of the manuscript.
Funding
This work was supported by National Natural Science Foundation of China (No. 41102205) and the Special Funds Projects for Basic Scientific Research Business Expenses of Mineral Resources Research Institutes in Chinese Academy of Geological Sciences (No. KK2006).
Data Availability Statement
Data is contained within the article.
Acknowledgments
We are grateful to the Tibet Bureau of Geology and Mineral Exploration and Development and its affiliated No. 5 geological parties and related leaders for their great logistical and moral support.
Conflicts of Interest
The authors declare no conflict of interest.
References
- Abrams, M.J.; Ashley, R.P.; Brown, L.C.; Goetz, A.F.H.; Kahle, A.B. Mapping of hydrothermal alteration in the cuprite mining district, Nevada, using aircraft scanning images for the spectral region 0.46 to 2.36 mm. Geology 1977, 5, 713–718. [Google Scholar] [CrossRef]
- Hunt, G.R. Spectral signatures of particulate minerals in the visible and near infrared. Geophysics 1977, 42, 501–513. [Google Scholar] [CrossRef] [Green Version]
- Hunt, G.R. Near-infrared(1.3–2.4μm) spectra of alteration minerals potential for use in remote sensing. Geophysics 1979, 44, 1974–1986. [Google Scholar] [CrossRef]
- Rutz-Armenta, J.R.; Prol-Ledesma, R.M. Techniques for enhancing the spectral response of hydrothermal alteratioin minerals in Thematic Mapper images of central Mexico. Int. J. Remote Sens. 1998, 19, 1981–2000. [Google Scholar] [CrossRef]
- Tangestani, M.H.; Moore, F. Comparison of three principal component analysis techniques to porphyry copper alteration mapping: A case study, Meiduk area, Kerman, Iran. Can. J. Remote Sens. 2001, 27, 176–181. [Google Scholar] [CrossRef]
- Crowley, J.K.; Hubbard, B.E.; Mars, J.C. Hydrothermal alteration on the cascade stratovolcanoes: A remote sensing survey. Geol. Soc. Am. Abstr. Programs 2003, 35, 552. [Google Scholar]
- Crosta, A.; Moore, M.J. Enhancement of Landsat Thematic Mapper imagery for residual soil mapping in SW Minais Gerais State, Brazil: A prospecting case history in greenstone belt terrain. In Proceedings of the 7th ERIM Thematic Conference: Remote Sensing for Exploration Geology, Calgary, AB, Canada, 2–6 October 1989; pp. 1173–1187. [Google Scholar]
- Mohammadzadeh, M.J.; Babaee, H.A. Application of Crosta Technique for Porphyry Copper Alteration Mapping Using TM data in Varzegan, East Azarbijan, Iran. Eur. J. Sci. Res. 2006, 13, 213–221. [Google Scholar]
- Kwatli, M.A.A.; Gillot, P.Y.; Zeyen, H.; Hildenbrand, A.; Gharib, I.A. Volcano-tectonic evolution of the northern part of the Arabian plate in the light of new K-Ar ages and remote sensing: Harrat Ash Shaam Volcanic province (Syria). Tectonophysicsn 2012, 580, 192–207. [Google Scholar] [CrossRef]
- Dehnavi, A.G.; Sarikhani, R.; Nagaraju, D. Image Processing and Analysis of Mapping Alteration Zones In environment Research, East of Kurdistan, Iran. World Appl. Sci. J. 2010, 11, 278–283. [Google Scholar]
- Kwatli, M.A.A.; Gillot, P.Y.; Gharib, I.A.; Lefevre, J.C. Integration of K-Ar geochronology and remote sensing: Mapping volcanic rocks and constraining the timing of alteration processes(Al-Lajat Plateau, Syria). Quat. Int. 2012, 251, 22–30. [Google Scholar] [CrossRef]
- Peng, G.X.; Chen, F.R.; Pang, Y. Molybdenum Mineralization Mapping Based on Hyperion Hyperspectral image in Angou, China. Appl. Mech. Mater. 2013, 246–247, 1135–1139. [Google Scholar] [CrossRef]
- Abrams, M.; Yamaguchi, Y. Twenty years of ASTER contributions to lithologic mapping and mineral exploration. Remote Sens. 2019, 11, 1394. [Google Scholar] [CrossRef] [Green Version]
- Rajan Girija, R.; Mayappan, S. Mapping of mineral resources and lithological units: A review of remote sensing techniques. Int. J. Image Data Fusion 2019, 10, 79–106. [Google Scholar]
- Meer, F.D.; Werff, H.M.A.; Ruitenbeek, F.J.A.; Hecker, C.A.; Bakker, W.H.; Noomen, M.F.; Meijde, M.M.; Carranza, J.M.; Smeth, J.B.; Woldai, T. Multi- and Hyperspectral geologic remote sensing: A review. Int. J. Appl. Earth Obs. Geoinf. 2012, 14, 112–128. [Google Scholar]
- King, T.V.V.; Koaly, R.F.; Hoefen, T.M.; Johnson, M.R. Hyperspectral remote sensing data maps minerals in Afghanistan. Eos Trans. Am. Geophys. Union 2012, 93, 325–326. [Google Scholar] [CrossRef]
- Morais, M.C.D.; Junior, P.P.M.; Paradella, W.R. Multi-scale approach using remote sensing images to characterize the iron deposit N1 influence areas in Carajas Mineral province (Brazilian Amazon). Environ. Earth Sci. 2012, 66, 2085–2096. [Google Scholar] [CrossRef]
- Pour, A.B.; Hashim, M. The application of ASTER remote sensing data to porphyry copper and epithermal gold deposits. Ore Geol. Rev. 2012, 44, 1–9. [Google Scholar]
- Petrovic, A.; Khan, S.D.; Thurmond, A.K. Integrated hyperspectral remote sensing, geochemical and isotopic studies for understanding hydrocarbon-induced rock alterations. Mar. Pet. Geol. 2012, 35, 292–308. [Google Scholar]
- Ducart, D.F.; Crosta, A.P.; Filho, C.R.S. Alteration Mineralogy at the Cerro La Mina Epithermal Prospect, Patagonia, Argentina: Field Mapping, Short-Wave Infrared Spectroscopy, and ASTER Images. Econ. Geol. 2006, 101, 981–996. [Google Scholar] [CrossRef]
- Mar, J.C.; Rowan, L.C. Regional Mapping of Phyllic- and Argillic-altered rocks in the Zagros magmatic arc, Iran, Using Advanced Spaceborne Thermal Emission and Reflection Radiometer (ASTER) data and Logical Operator Algorithms. Geosphere 2006, 2, 161–186. [Google Scholar]
- Kratt, C.; Calvin, W.M.; Coolbaugh, M.F. Mineral maping in the Pyramid lake basin: Hydrothermal alteration, chemical precipitates and geothermal energy potential. Remote Sens. Environ. 2010, 114, 2297–2304. [Google Scholar] [CrossRef]
- Rajendran, S.; Thirunavukkarasu, A.; Balamurugan, G.; Shankar, K. Discrimination of Iron Ore Deposits of Granulite Terrain of Southern Peninsular India using ASTER data. J. Asian Earth Sci. 2011, 41, 99–106. [Google Scholar] [CrossRef]
- Gabr, S.; Ghulam, A.; Kusky, T. Detecting areas of high-potential gold mineralization using ASTER data. Ore Geol. Rev. 2010, 38, 59–69. [Google Scholar] [CrossRef]
- Hubbard, B.E.; Crowley, J.K. Mineral mapping on the Chilean-Bolivian Altiplano using co-orbital ALI, ASTER and Hyperion imagery: Data dimensionality issues and solutions. Remote Sens. Environ. 2005, 99, 173–186. [Google Scholar] [CrossRef]
- Baldridge, A.M.; Hook, S.J.; Grove, C.I.; Rivera, G. The ASTER spectral library version 2.0. Remote Sens. Environ. 2009, 113, 711–715. [Google Scholar] [CrossRef]
- Zhang, X.F.; Pazner, M.; Duke, N. Lithologic and mineral information extraction for gold exploration using ASTER data in the south Chocolate Mountains (California). ISPRS J. Photogramm. Remote Sens. 2007, 62, 271–282. [Google Scholar] [CrossRef]
- Meerdink, S.K.; Hook, S.J.; Roberts, D.A.; Abbott, E.A. The ECOSTRESS spectral library version 1.0. Remote Sens. Environ. 2019, 230, 111196. [Google Scholar] [CrossRef]
- Aboelkhair, H.; Ninomiya, Y.; Watanabe, Y.; Sato, I. Processing and interpretation of ASTER TIR data for mapping of rare-metal-enriched albite granitoids in the Central Eastern Desert of Egypt. J. Afr. Earth Sci. 2010, 58, 141–151. [Google Scholar] [CrossRef]
- Rowan, L.C.; Mars, J.C. Lithologic mapping in the Mountain Pass, California area using advanced Spaceborne Thermal Emission and Reflection Radiometer (ASTER) data. Remote Sens. Environ. 2003, 84, 350–366. [Google Scholar] [CrossRef]
- Ninomiya, Y.; Fu, B.H.; Cudhy, T.J. Detecting lithology with Advanced Spaceborne Thermal Emission and Refection Radiometer (ASTER) multispectral thermal infrared “radiance-at-sensor” data. Remote Sens. Environ. 2005, 99, 127–135. [Google Scholar] [CrossRef]
- Zamyad, M.; Afzal, P.; Pourkermani, M.; Nouri, R.; Jafari, M.R. Determination of Hydrothermal Alteration Zones Using Remote Sensing Methods in Tirka Area, Toroud, NE Iran. J. Indian Soc. Remote Sens. 2019, 47, 1817–1830. [Google Scholar] [CrossRef]
- Son, Y.S.; Kim, K.E.; Yoon, W.J.; Cho, S.J. Regional mineral mapping of island arc terranes in southeastern Mongolia using multi-spectral remote sensing data. Ore Geol. Rev. 2019, 113, 103106. [Google Scholar] [CrossRef]
- Chen, Q.; Zhao, Z.F.; Jiang, Q.G.; Zhou, J.X.; Tian, Y.G.; Zeng, S.H.; Wang, J.L. Detecting subtle alteration information from ASTER data using a multifractal-based method: A case study from Wuliang Mountain, SW China. Ore Geol. Rev. 2019, 115, 103182. [Google Scholar] [CrossRef]
- Safari, M.; Maghsoudi, A.; Pour, A.B. Application of Landsat-8 and ASTER satellite remote sensing data for porphyry copper exploration: A case study from Shahr-e-Babak, Kerman, South of Iran. Geocarto Int. 2018, 33, 1186–1201. [Google Scholar] [CrossRef]
- Pour, A.B.; Hashim, M. Identification of hydrothermal alteration minerals for exploring of porphyry copper deposit using ASTER data, SE Iran. J. Asian Earth Sci. 2011, 42, 1309–1323. [Google Scholar] [CrossRef]
- Di Tommaso, I.; Rubinstein, N. Hydrothermal alteration mapping using ASTER data in the Infiernillo porphyry deposit, Argentina. Ore Geol. Rev. 2007, 32, 275–290. [Google Scholar] [CrossRef]
- Shirmard, H.; Farahbakhsh, E.; Pour, A.B.; Muslim, A.M.; Dietmar Müller, R.; Chandra, R. Integration of selective dimensionality reduction techniques for mineral exploration using ASTER satellite data. Remote Sens. 2020, 12, 1261. [Google Scholar] [CrossRef] [Green Version]
- Farahbakhsh, E.; Chandra, R.; Olierook, H.K.H.; Scalzo, R.; Clark, C.; Reddy, S.M.; Müller, R.D. Computer vision-based framework for extracting tectonic lineaments from optical remote sensing data. Int. J. Remote Sens. 2020, 41, 1760–1787. [Google Scholar] [CrossRef]
- Wu, M.J.; Zhou, K.F.; Wang, Q.; Wang, J.L. Mapping Hydrothermal Zoning Pattern of Porphyry Cu Deposit Using Absorption Feature Parameters Calculated from ASTER Data. Remote Sens. 2019, 11, 1729. [Google Scholar] [CrossRef] [Green Version]
- Janati, M.E. Application of remotely sensed ASTER data in detecting alteration hosting Cu, Ag and Au bearing mineralized zones in Taghdout area, Central Anti-Atlas of Morocco. J. Afr. Earth Sci. 2019, 151, 95–106. [Google Scholar] [CrossRef]
- Li, G.M.; Li, J.X.; Qin, K.Z.; Duo, J.; Zhang, T.P.; Xiao, B.; Zhao, J.X. Geology and Hydrothermal Alteration of the Duobuza Gold-Rich Porphyry Copper District in the Bangongco Metallogenetic Belt, Northwestern Tibet. Resour. Geol. 2011, 62, 99–118. [Google Scholar] [CrossRef]
- No.5 Geological Team, Tibet Bureau of Geology and Exploration (TBGE). Geological reconnaissance report of the Duobuza ore district. 2003; Unpublished work. [Google Scholar]
- Zhu, D.C.; Zhao, Z.D.; Niu, Y.L.; Dilek, Y.; Hou, Z.Q.; Mo, X.X. The origin and pre–Cenozoic evolution of the Tibetan Plateau. Gondwana Res. 2013, 23, 1429–1454. [Google Scholar] [CrossRef]
- Sun, J.; Mao, J.W.; Beaudoin, G.; Duan, X.Z.; Yao, F.; Ouyang, H.G.; Wu, Y.; Li, Y.B.; Meng, X.Y. Geochronology and Geochemistry of Porphyritic Intrusions in the Duolong Porphyry and Epithermal Cu-Au District, Central Tibet: Implications for the Genesis and Exploration of Porphyry Copper Deposits. Ore Geol. Rev. 2017, 80, 1004–1019. [Google Scholar] [CrossRef]
- Li, J.X.; Qin, K.; Li, G.; Xiao, B.; Zhao, J.; Chen, L. Magmatic-hydrothermal evolution of the Cretaceous Duolong gold-rich porphyry copper deposit in the Bangongco metallogenic belt, Tibet: Evidence from U-Pb and 40Ar/39Ar geochronology. J. Asian Earth Sci. 2011, 41, 525–536. [Google Scholar] [CrossRef]
- Gustafson, L.B.; Hunt, J.P. The porphyry copper deposit at El Salvador, Chile. Econ. Geol. 1975, 70, 857–912. [Google Scholar] [CrossRef]
- Sillitoe, R.H. The Tops and Bottoms of Porphyry Copper Deposits. 1973. Econ. Geol. 1975, 68, 799–815. [Google Scholar] [CrossRef]
- Sillitoe, R.H. Porphyry copper systems. Econ. Geol. 2010, 105, 3–41. [Google Scholar] [CrossRef] [Green Version]
- Proffett, J.M. Geology of the Bajo de la Alumbrera porphyry copper-gold deposit, Argentina. Econ. Geol. 2003, 98, 1535–1574. [Google Scholar] [CrossRef]
- She, H.Q.; Li, J.W.; Ma, D.F.; Li, G.M.; Zhang, D.Q.; Feng, C.Y.; Qu, W.J.; Pan, G.T. Molybdenite Re-Os and Shrimp Zircon U-Pb dating of Duolong porphyry copper deposit in Tibet and its geological implications (in Chinese). Miner. Depos. 2009, 28, 37–746. [Google Scholar]
- Li, J.X.; Qin, K.Z.; Li, G.M.; Xiao, B.; Zhao, J.X.; Cao, M.J.; Chen, L. Petrogenesis of ore-bearing porphyries from the Duolong Porphyry Cu-Au deposit, Central Tibet: Evidence from U-Pb geochronology, petrochemistry and Sr-Nd-Hf-O isotope characteristics. Lithos 2013, 160–161, 216–227. [Google Scholar] [CrossRef]
- Salisbury, J.W.; Wald, A.; D’Aria, D.M. Thermal-infrared Romote sensing and Kirchhloff’s Law 1. Laboratoy Meansurement. J. Geophys. Res. 1994, 99, 11897–11911. [Google Scholar] [CrossRef]
- Ninomiya, Y.; Fu, B.H. Thermal infrared multispectral Remote sensing of Lithology and Mineralogy Based on Spectral Properties of Materials. Ore Geol. Rev. 2019, 108, 54–72. [Google Scholar] [CrossRef]
- Ninomiya, Y.; Fu, B.H. Regioal Lithological Mapping Using ASTER-TIR Data: Case Study for the Tibetan Plateau and the Surrounding Area. Geosciences 2016, 6, 39. [Google Scholar] [CrossRef] [Green Version]
- Rajendran, S.; Hersi, O.S.; Al-Harthy, A.; Al-Wardi, M.; EI-Ghali, M.A.; Al-Abri, A.H. Capability of Advanced Spaceborne Thermal Emission and Reflection Radiometer (ASTER) on Discrimination of Carbonates and Associated Rocks and Mineral Identification of Eastern Mountain Region (Saih Hatat WIndow) of Sultanate of Oman. Carbonates Evaporites 2011, 26, 351–364. [Google Scholar] [CrossRef]
- Available online: www.intspec.com (accessed on 21 October 2006).
- Riveros, K.; Veloso, E.; Campos, E.; Menzies, A.; Veliz, W. Magnetic properties related to hydrothermal alteration processes at the Escondida porphyry copper deposit, northern Chile. Miner. Deposita 2014, 49, 693–707. [Google Scholar] [CrossRef]
- Gao, H.M. A Summary of Researches on Porphyry Copper Deposits. Adv. Earth Sci. 1995, 10, 40–46. (In Chinese) [Google Scholar]
- Lowell, J.D.; Guilbert, J.M. Lateral and Vertical Alteration-Mineralization Zoning in Porphyry Ore Deposit. Econ. Geol. 1970, 65, 373–408. [Google Scholar] [CrossRef]
- Abrams, M.J.; Brown, D. Silver Bell, Arizona, Porphyry Copper Test Site Report: Tulsa, Oklahoma. In The Joint NASA–Geosat Test Case Project, Final Report, Chapter 4; The American Association of Petroleum Geologists: Tulsa, OK, USA, 1984; pp. 4–73. [Google Scholar]
- Abrams, M.J.; Brown, D.; Lepley, L.; Sadowski, R. Remote sensing of porphyry copper deposits in Southern Arizona. Econ. Geol. 1983, 78, 591–604. [Google Scholar] [CrossRef]
- Spatz, D.M.; Wilson, R.T. Remote sensing characteristics of porphyry copper systems, western America Cordillera. In Porphyry Copper Deposits of the American Cordillera; Pierce, F.W., Bolm, J.G., Eds.; Arizona Geological Society Digest: Tucson, AZ, USA, 1995; Volume 20, pp. 94–108. [Google Scholar]
- Moore, F.; Rastmanesh, F.; Asady, H.; Modabberi, S. Mapping mineralogical alteration using principal component analysis and matched filter processing in Takab area, north-west Iran, from ASTER data. Int. J. Remote Sens. 2008, 29, 2851–2867. [Google Scholar] [CrossRef]
- Pour, B.A.; Hashim, M. Spectral transformation of ASTER data and the discrimination of hydrothermal alteration minerals in a semi-arid region, SE Iran. Int. J. Phys. Sci. 2011, 6, 2037–2059. [Google Scholar]
- Tangestani, M.H.; Mazhari, N.; Ager, B.; Moore, F. Evaluating advance spaceborne thermal emission and reflection radiometer (ASTER) data for alteration zone enhancement in a semi-arid area, northern Shahr-e-Babak, SE Iran. Int. J. Remote Sens. 2008, 29, 2833–2850. [Google Scholar] [CrossRef]
- Clark, R.N.; King, T.V.V.; Klejwa, M.; Swayze, G.A. High spectral resolution reflectance spectroscopy of minerals. J. Geophys. Res. 1990, 95, 12653–12680. [Google Scholar] [CrossRef] [Green Version]
- Crowley, J.K.; Vergo, N. Near-infrared reflectance spectra of mixtures of kaolin group minerals: Use in clay mineral studies. Clays Clay Miner. 1988, 36, 310–316. [Google Scholar] [CrossRef]
- Dalton, J.B.; Bove, D.J.; Mladinich, C.S.; Rockwell, B.W. Identification of spectrally similar materials using the USGS Tetracorder algorithm: The calcite–epidot–chlorite problem. Remote Sens. Environ. 2004, 89, 455–466. [Google Scholar] [CrossRef]
- Yamaguchi, Y.; Naito, C. Spectral indices for lithologic discrimination and mapping by using the ASTER SWIR bands. Int. J. Remote Sens. 2003, 24, 4311–4323. [Google Scholar] [CrossRef]
- Ninomiya, Y. A stabilized vegetation index and several mineralogic indices defined for ASTER VNIR and SWIR data. In Proceedings of the IEEE 2003 International Geoscience and Remote Sensing Symposium (IGARSS’03), Toulouse, France, 21–25 July 2003; Volume 3, pp. 1552–1554. [Google Scholar]
- Ninomiya, Y. Advanced remote lithologic mapping in ophiolite zone with ASTER multispectral thermal infrared data. In Proceedings of the IEEE 2003 International Geoscience and Remote Sensing Symposium (IGARSS’03), Toulouse, France, 21–25 July 2003; Volume 3, pp. 1561–1563. [Google Scholar]
- Ninomiya, Y. Rock type mapping with indices defined for multispectral thermal infrared ASTER data: Case studies. Proc. SPIE 2003, 4886, 123–132. [Google Scholar]
- Ninomiya, Y. Lithological mapping with ASTER TIR and SWIR data. Proc. SPIE 2004, 5234, 180–190. [Google Scholar]
- Ninomiya, Y.; Fu, B. Mapping quartz, carbonate minerals and mafic–ultramafic rocks using remotely sensed multispectral thermal infrared ASTER data. Proc. SPIE 2002, 4710, 191–202. [Google Scholar]
- Crosta, A.P.; Filho, C.R.S.; Azevedo, F.; Brodie, C. Targeting key alteration minerals in epithermal deposits in Patagonia, Argentina, using ASTER imagery and principal component analysis. Int. J. Remote Sens. 2003, 24, 4233–4240. [Google Scholar] [CrossRef]
- Hunt, G.R.; Ashley, P. Spectra of altered rocks in the visible and near infrared. Econ. Geol. 1979, 74, 1613–1629. [Google Scholar] [CrossRef]
- Li, J.X.; Qin, K.Z.; Li, G.M. Basic characteristics of gold-rich porphyry copper de posits and their ore sources and evolving processes of high oxidation magma and ore-forming fluid. Acta Petrol. Sin. 2006, 22, 678–688. [Google Scholar]
- Liang, H.Y.; Sun, W.D.; Su, W.C.; Zartman, R.E. Porphyry copper–gold mineraliza tion at Yulong, China: Promoted by decreasing redox potential during magnetite alteration. Econ. Geol. 2009, 104, 587–596. [Google Scholar] [CrossRef]
- Sillitoe, R.H. Gold-rich porphyry copper deposits: Descriptive and genetic models and their role in exploration and discovery. In Gold in 2000: Society of Economic Geologists Reviews in Economic Geology; Hagemann, S.G., Brown, P.E., Eds.; 2000; Volume 13, pp. 315–345. Available online: https://app.ingemmet.gob.pe/biblioteca/pdf/REG13-315.pdf (accessed on 18 January 2020).
Figure 1.
The geotectonic areal division sketch map of Duolong porphyry copper ore field (a); an ASTER false-color composite image of b6(R), b3(G) and b1(B) (b); the geological sketch of Duobuze and Bolong deposits [43] (c).
Figure 1.
The geotectonic areal division sketch map of Duolong porphyry copper ore field (a); an ASTER false-color composite image of b6(R), b3(G) and b1(B) (b); the geological sketch of Duobuze and Bolong deposits [43] (c).

Figure 2.
The work flowchart of RS alteration zonation in Duolong porphyry copper ore district.

Figure 3.
The horizontal alteration zoning of Duolong district.

Figure 4.
Reflectance curve of typical samples collected from each alteration zone (a) and the spectra curves resampled to the ASTER VNIR–SWIR bands (b).
Figure 4.
Reflectance curve of typical samples collected from each alteration zone (a) and the spectra curves resampled to the ASTER VNIR–SWIR bands (b).

Figure 5.
Visible-shortwave infrared and thermal infrared characteristics of each zone of porphyry Cu deposit (resampled to ASTER) [48,49,50,51,52]. Note: The spectra of K-feldspar, Halloysite, and Limonite from the USGS spectral library and wavelength in units of μm.

Figure 6.
The results of each method and merging information based on threshold.

Figure 7.
Frequency of alteretion minerals interpreted by surface spectra.

Figure 8.
The remote sensing alteration zoning of Duolong deposits extracted from ASTER.

Figure 9.
Field validation of alteration zones.

Figure 10.
Remote sensing alteration zoning model of porphyry copper deposits.

Figure 11.
Target area optimization map of Duolong district [43].
Figure 11.
Target area optimization map of Duolong district [43].


Table 1.
The characteristics of the alteration minerals.
| Bands | ASTER Bands | ||||||||||||||
|---|---|---|---|---|---|---|---|---|---|---|---|---|---|---|---|
| VNIR | SWIR | TIR | |||||||||||||
| Zones | B1 | B2 | B3 | B4 | B5 | B6 | B7 | B8 | B9 | B10 | B11 | B12 | B13 | B14 | |
| Potassium silicification zone | Orthoclase | H | H | H | L | L | H | L | L | - | L(L) | L | H | H | |
| Muscovite | L | H | L | H | L | L | - | L | L | H | H | ||||
| Chlorite | L | H | H | L | L | H | H | - | L | - | |||||
| Quartz | H | H | H | L | L | L(H) | L | H | H | ||||||
| Phyllic zone | Mucovite | L | H | L | H | L | L | - | L | L | H | H | |||
| kaolinite | H | L | L | L | - | L | L | H | H | ||||||
| Illite | H | L | L | - | L | L | H | H | |||||||
| Quartz | H | H | H | L | L | L(H) | L | H | H | ||||||
| Prophylitic zone | Calcite | H | H | L | H | H | H | H | L | ||||||
| Chlorite | L | H | H | L | L | H | H | - | L | - | |||||
| Illite-hydromica zone | Illite | H | L | L | - | L | L | H | H | ||||||
| Montmorillonite | H | H | L | L | L | L | - | L | L | H | H(L) | ||||
| Gossan | Geothite | L | H | L | H | H | H | H | L | ||||||
Note: “H” indicates a high value of reflectance or emissivity. “L” means a low value of reflectance or emissivity. VNIR: The Visible and Near-Infrared; SWIR: The Short-Wave Infrared; TIR: The Thermal Infrared.
Table 2.
The algorithm of information extraction of each alteration mineral of the Duolong ore district.
Table 2.
The algorithm of information extraction of each alteration mineral of the Duolong ore district.
| Methods | Ratio | Slope | Correlation Absorption | PCA [7] | |
|---|---|---|---|---|---|
| Minerals | |||||
| Quartz | B11*B11/B10/B12 [55] | ||||
| Chlorite | B5/B8 | (B5 − B8)/B5 | (B4 − B9)/(B4 − B8) | PCA1.3.4.8 PC4 | |
| Orthoclase | B7/B6 B11*B11/B10/B12 B12*B14*B14*B14/B13/B13/B13/BA13 [54,55] | (B4 − B6)/B4 | (B4 − B6)/(B4 − B7) | PCA1.3.4.6 PC4 | |
| Muscovite | B4/B6 | (B4 − B6)/B4 | (B4 − B6)/(B4 − B7) | PCA1.3.4.6 PC4 | |
| Kaolinite | B4/B6 | (B4 − B6)/B4 | (B4 − B6)/(B4 − B7) | PCA1.3.4.6 PC4 | |
| Calcite | (B6 + B7)/(2*B8) B13/B14 [54,55] | (B4 − B8)/B4 | (B4 − B8)/(B4 − B6) | PCA1.3.4.8 PC4 | |
| Illite | (B7 + B5)/(B6 + B9) | (B4 − B6)/B4 | (B4 − B9)/(B4 − B6) | PCA1.3.4.9 PC4 | |
| Geothite | B3/B6 | ||||
| Montmorillonite | (B7 + B5)/(B6 + B9) | (B4 − B6)/B4 | (B4 − B6)/(B4 − B7) | PCA1.3.4.6 PC4 | |
Note: B1 is first band of ASTER data. PCA: Principal Component Analysis. Some algorithms are given in experimental formula.
Table 3.
Field verification points.
| Field No. | Longitude | Latitude | Altered Rocks | Alteration |
|---|---|---|---|---|
| D01 | 83.45036111 | 32.84075 | Propylitic quartz sandstone | Chloritization, Carbonation |
| D02 | 83.44861111 | 32.83725 | Potassic quartz porphyry | Potassium, Silicification |
| D03 | 83.44538889 | 32.83722222 | Potassic quartz porphyry | Potassium, Silicification |
| D04 | 83.34377778 | 32.73613889 | Phyllic quartz sandstone | Muscovitization, Kaolinization |
| D05 | 83.34375 | 32.73641667 | Phyllic quartz sandstone | Muscovitization, Kaolinization |
| D06 | 83.34116667 | 32.74077778 | Phyllic quartz sandstone | Muscovitization, Kaolinization |
| D07 | 83.33833333 | 32.74188889 | Phyllic quartz sandstone | Muscovitization, Kaolinization |
| D08 | 83.33583333 | 32.74344444 | Phyllic quartz porphyry | Muscovitization, Kaolinization |
| D09 | 83.33947222 | 32.73866667 | Phyllic quartz porphyry | Muscovitization, Kaolinization |
| D10 | 83.29894444 | 32.72783333 | Phyllic quartz sandstone | Muscovitization, Kaolinization |
| D11 | 83.39752778 | 32.807 | Propylitic quartz sandstone | Chloritization, Carbonation |
| D12 | 83.39363889 | 32.812 | Propylitic quartz sandstone | Chloritization, Carbonation |
| D13 | 83.39238889 | 32.81647222 | Propylitic quartz sandstone | Chloritization, Carbonation |
| D14 | 83.38902778 | 32.82333333 | Propylitic quartz sandstone | Chloritization, Carbonation |
| D15 | 83.38833333 | 32.81644444 | Propylitic quartz sandstone | Chloritization, Carbonation |
| D16 | 83.40566667 | 32.80652778 | Potassic quartz sandstone | Potassium, Silicification |
| D17 | 83.41097222 | 32.81058333 | Propylitic quartz sandstone | Chloritization, Carbonation |
| D18 | 83.44463889 | 32.83075 | Propylitic quartz sandstone | Chloritization, Carbonation |
| D19 | 83.43777778 | 32.8275 | Propylitic quartz sandstone | Chloritization, Carbonation |
| D20 | 83.44347222 | 32.83641667 | Propylitic quartz porphyry | Chloritization, Carbonation |
| D21 | 83.70294444 | 32.79388889 | Phyllic schist | Muscovitization, Kaolinization |
| D22 | 83.54788889 | 32.78622222 | Propylitic quartz sandstone | Chloritization, Carbonation |
| D23 | 83.56686111 | 32.78875 | Phyllic quartz porphyry | Muscovitization, Kaolinization |
| D24 | 83.58688889 | 32.82641667 | Potassic quartz porphyry | Potassium, Silicification |
Publisher’s Note: MDPI stays neutral with regard to jurisdictional claims in published maps and institutional affiliations. |
© 2021 by the authors. Licensee MDPI, Basel, Switzerland. This article is an open access article distributed under the terms and conditions of the Creative Commons Attribution (CC BY) license (https://creativecommons.org/licenses/by/4.0/).
Share and Cite
MDPI and ACS Style
Yao, F.; Xu, X.; Yang, J.; Geng, X. A Remote-Sensing-Based Alteration Zonation Model of the Duolong Porphyry Copper Ore District, Tibet. Remote Sens. 2021, 13, 5073. https://0-doi-org.brum.beds.ac.uk/10.3390/rs13245073
AMA Style
Yao F, Xu X, Yang J, Geng X. A Remote-Sensing-Based Alteration Zonation Model of the Duolong Porphyry Copper Ore District, Tibet. Remote Sensing. 2021; 13(24):5073. https://0-doi-org.brum.beds.ac.uk/10.3390/rs13245073
Chicago/Turabian StyleYao, Fojun, Xingwang Xu, Jianmin Yang, and Xinxia Geng. 2021. "A Remote-Sensing-Based Alteration Zonation Model of the Duolong Porphyry Copper Ore District, Tibet" Remote Sensing 13, no. 24: 5073. https://0-doi-org.brum.beds.ac.uk/10.3390/rs13245073
Note that from the first issue of 2016, this journal uses article numbers instead of page numbers. See further details here.