
Outbreak of Negative Narrow Bipolar Events in Two Mid-Latitude Thunderstorms Featuring Overshooting Tops

1
CAS Key Laboratory of Geospace Environment, School of Earth and Space Sciences, University of Science and Technology of China, Hefei 230026, China
2
Key Laboratory of Atmospheric Optics, Anhui Institute of Optics and Fine Mechanics, HFIPS, Chinese Academy of Sciences, Hefei 230031, China
*
Author to whom correspondence should be addressed.
Remote Sens. 2021, 13(24), 5130; https://0-doi-org.brum.beds.ac.uk/10.3390/rs13245130
Submission received: 21 October 2021
/
Revised: 5 December 2021
/
Accepted: 9 December 2021
/
Published: 17 December 2021
(This article belongs to the Special Issue Remote Sensing of Lightning and Its Applications in Atmospheric Electricity Studies)
Abstract
:Lightning discharges are the electrical production in thunderclouds. They radiate the bulk of radio signals in the very low-frequency and low-frequency (VLF/LF) that can be detected by ground-based receivers. One kind of special intra-cloud lightning discharges known as narrow bipolar events (NBEs) have been shown to be rare but closely linked to the convective activity that leads to hazardous weather. However, there is still lack of understanding on the meteorological conditions for thunderstorm-producing NBEs, especially for those of negative polarity, due to their rare occurrence. In this work, we aim to investigate what meteorological and electrical conditions of thunderclouds favor the production of negative NBEs. Combining with the VLF/LF radio signal measured by Jianghuai Area Sferic Array (JASA), S-band Doppler radar observation and balloon sounding data, two mid-latitude thunderstorms with outbreaks of negative NBEs at midnight in East China were analyzed. The comparison with the vertical radar profile shows that the bursts of negative NBEs occurred near thunderclouds with overshooting tops higher than 18 km. Manifestation of negative NBEs is observed with a relatively low spectrum width near thundercloud tops. Our findings suggest that the detection of negative NBEs would provide a unique electrical means to remotely probe overshooting tops with implications for the exchange of troposphere and stratosphere.
1. Introduction
Due to their characteristic short-duration electromagnetic waveforms (10–30 μs) at very low-frequency and low-frequency (VLF/LF), and the strong radiation in the high frequency (HF) and very high frequency (VHF) bands, narrow bipolar events (NBEs), also named as compact intra-cloud discharges (CIDs), have been one of the most intriguing phenomena that has received enormous interest from lightning researchers [1,2,3,4,5,6]. The intense radio signals of NBEs can penetrate into the ionosphere and can be easily detected by satellites in space and ground-based receivers [7,8].
NBEs are segregated into positive and negative polarities originating at different altitudes of thundercloud regions in normally electrified thunderstorms [9,10,11]. Positive NBEs can occur as the initial discharge event of normal bi-level intra-cloud lightning flashes [5,12,13,14,15], and also serve as the initial event of negative gigantic jets [16,17,18]. The negative NBEs are far from being as frequent as their positive counterpart, whereas they are usually produced at higher altitudes (most in the altitude range of 14–18 km) between the upper positive charge layer and the negative screening charge region near the top of thunderclouds [9,19]. They can trigger positive blue discharges [20,21,22], one sort of upward discharges emitting from thunderstorm tops [23,24,25,26].
For decades, many studies have examined the characteristics of parent thunderstorms producing NBEs [27,28,29,30,31]. It is generally believed that NBEs tend to occur in some selective thunderstorms with strong convection, which can indicate the convective activity of a thunderstorm to a certain extent. However, NBEs do not always have a definite relationship with lightning and the convective intensity of thunderstorms. They are not always present in the region with the strongest convection [29]. More thunderstorm cases are still needed to investigate the relationship between NBEs and convection. Until now, the observations of NBEs have mainly focused on cases of positive polarity [30,31]. There is still a lack of studies on the meteorological parameters of parent thunderstorms producing outbreak negative NBEs, due to their rare occurrence [9,19].
In this work, we report the precious observations of two-midnight thunderstorms producing outbreaks of negative NBEs in East China. Combining with VLF/LF data, the balloon sounding data, the radar reflectivity, and spectrum width derived from ground-based Doppler S-band radar, it was found that negative NBEs always occur near overshooting thundercloud tops that are associated with convection surge. They are observed with a low value of spectrum width near thundercloud tops. These findings enrich our knowledge of the favorable meteorological conditions for producing negative NBEs, which could be a good proxy for monitoring intense convection based on the remote sensing of radio signals.
2. Data and Method
2.1. Lightning VLF/LF Data and NBE Height
The lightning data used in this paper were recorded by a local lightning network called the Jianghuai Area Sferic Array (JASA) [20,32]. JASA is a multi-station network that has the capability to continuously record VLF/LF lightning signals (bandwidth range from 800 Hz to 400 kHz) with no dead time. Each station is deployed at a distance of about 200–300 km and synchronously recording signals at a sampling rate of 5 MHz/s. The timing accuracy at each station is better than 50 ns. The time of arrival (TOA) algorithm is applied to obtain the lightning locations, and the location accuracy of the analyzed area is better than 1 km [33]. By developing the parallel computing program for the location, the system now can provide the real-time 2-D location of lightning events in China on the website (http://222.195.83.28/, accessed on 1 December 2021), including the information of occurrence time, position (latitude and longitude), location error, lighting types, and peak current.
The criteria presented by Ma (2017) [34] are used to distinguish cloud-to-ground (CG) lightning discharges, intra-cloud (IC) discharges, and NBEs based on their time-domain waveforms. The height of NBEs can be derived from the time difference between the ground wave and the two ionospheric reflection waves [35,36]. The estimation error of the NBEs height is within 0.5 km [9].
2.2. Radar and Sounding Data
The Base reflectivity and spectrum width used in this paper are derived from an S-band Doppler radar with a detection range of 340 km. The radar station used in the study is located in Nanjing (32°19′N, 118°69′E). The distance between the radar and center of the thunderstorm is approximately 200 km. The radar operates on a 6-min cycle to gain insight into the meteorological characteristics of thunderstorms. Radar reflectivity can be used as a factor of the convection strength, and spectrum width is a measure of the radial velocity spectrum in the radar cabin and can be used as an indicator of turbulence [37]. The height of the tropopause is obtained from the sounding data, including the information of the directional shear and vertical speed of the local environment (http://weather.uwyo.edu/upperair/sounding.html, accessed on 1 December 2021).
3. Analyses and Results
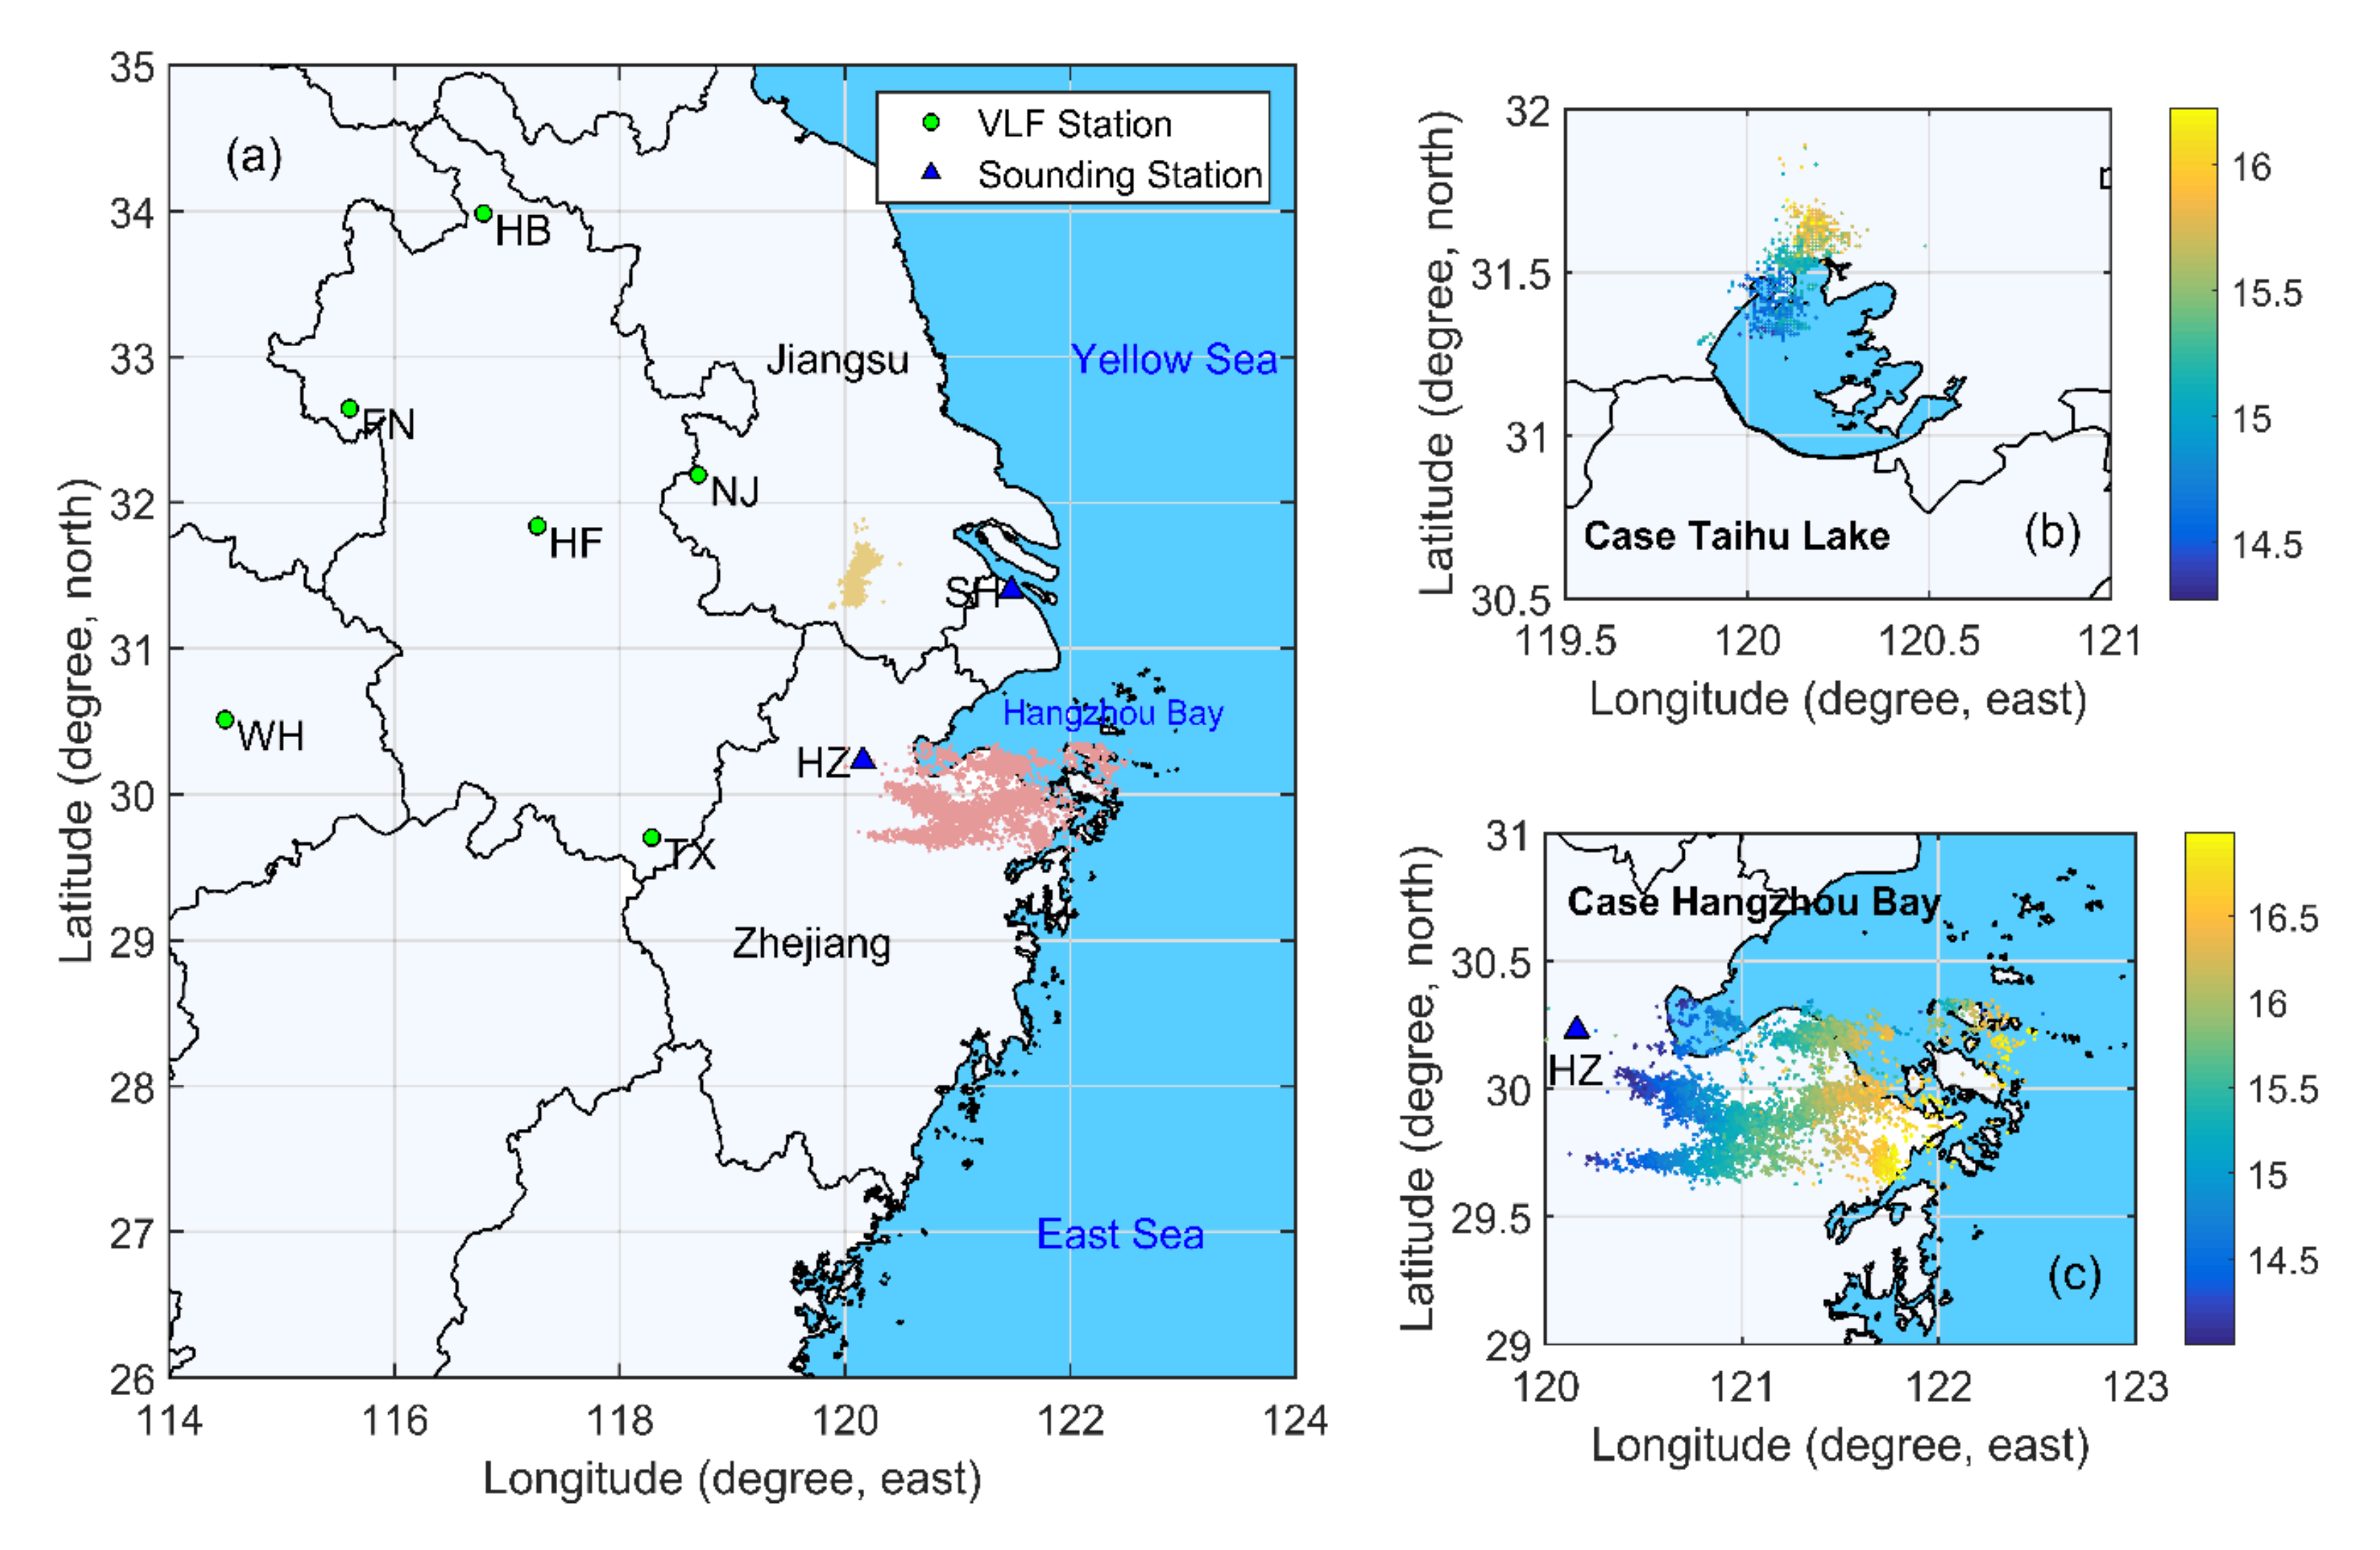
Figure 1a shows the locations of two thunderstorms at similar latitudes, and each was characterized by the outbreak of negative NBEs at midnight. The distribution of lightning activities for each thunderstorm is shown in Figure 1b and 1c, respectively. These two cases provide an important opportunity to investigate the potential meteorological parameters of parent thunderstorms producing outbreaks of negative NBEs.
3.1. Negative Narrow Bipolar Events Associated with Overshooting Tops
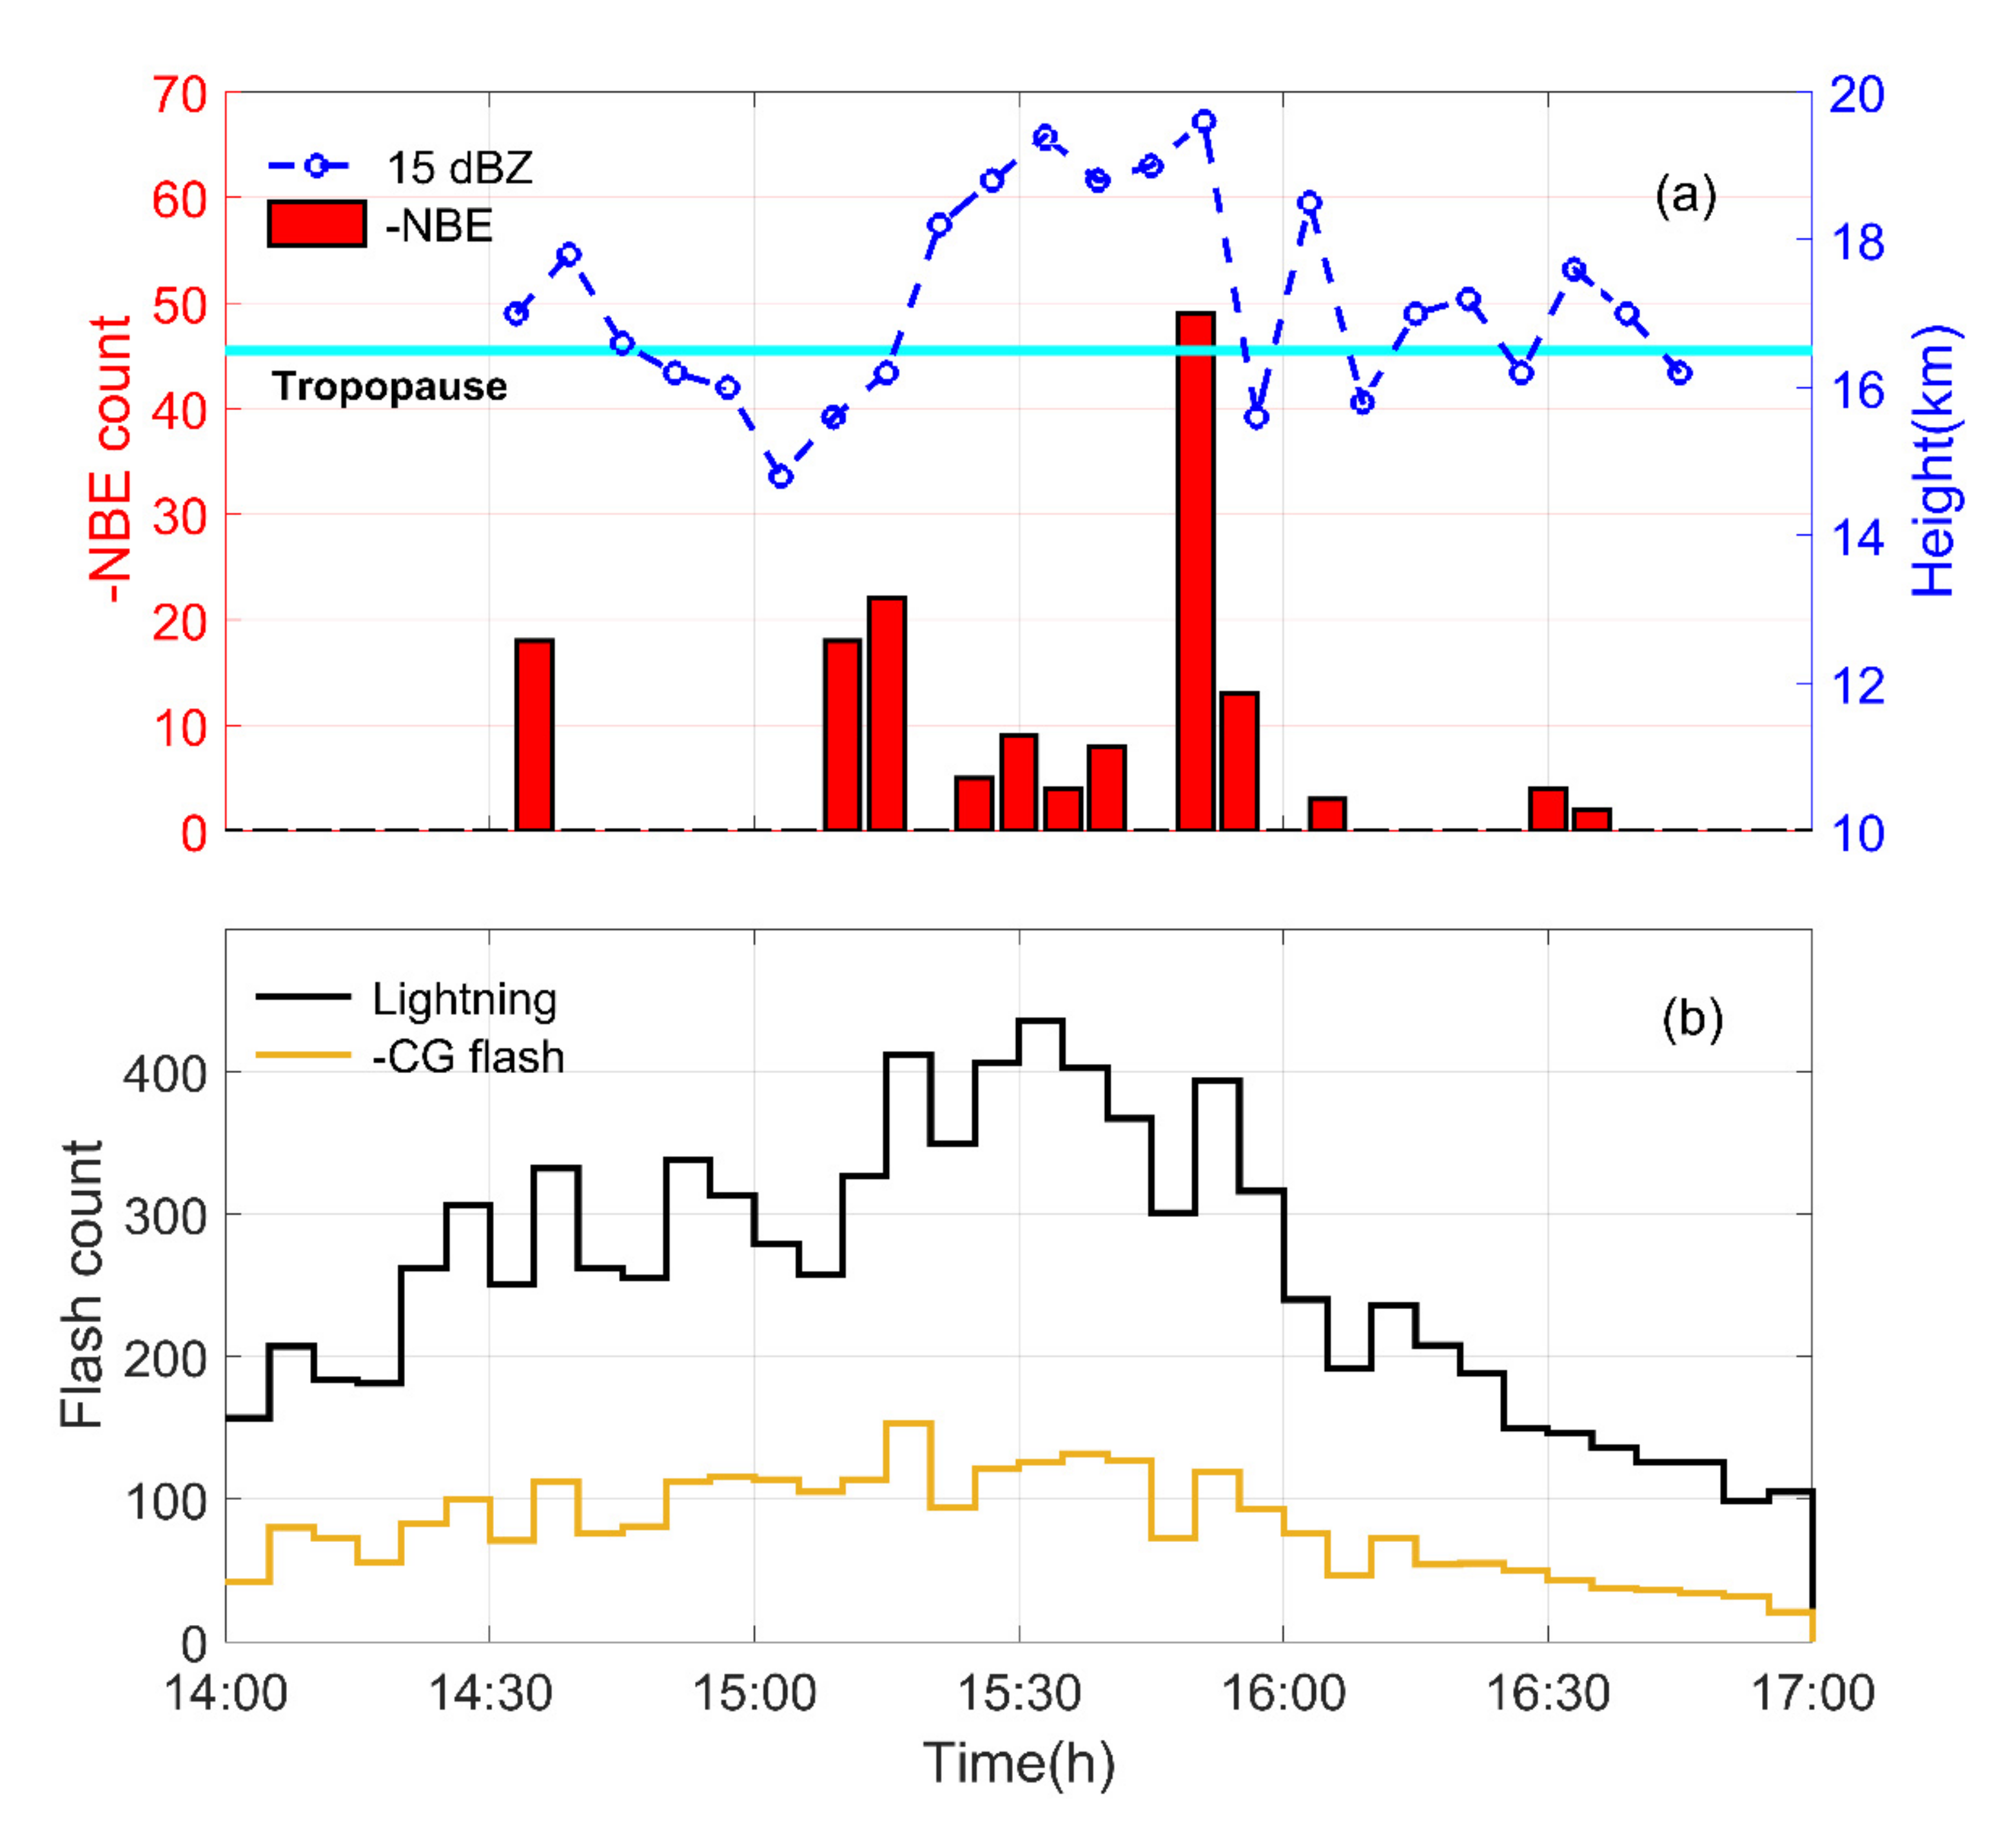
The first case started over the land around 1400 UTC on 12 September 2014 and then moved eastward to Hangzhou Bay at the inlet of the East China Sea. Figure 2 presents the NBE and normal lightning activity throughout the thundercloud. One hundred and thirty-six negative NBEs were recorded during the entire cycle of the thunderstorm. Almost all occurred above the tropopause as inferred from the balloon-sounding data (at about 16.5 km). The height distribution of NBEs indicates that the parent thunderstorm was normally electrified with the upper positive charge region concentrated at 15 km (msl).
As shown in Figure 2a, the occurrence of negative NBEs presents an intermittent burst pattern. The time interval between bursts is about tens of minutes, in which a relatively large amount of NBE is generated in a short period. Previous studies have shown that negative NBEs tend to gather in intense thunderstorms [29]. Wu et al. [9] examined the difference between negative and positive NBEs, and the result shows that the occurrence of negative NBEs at higher altitudes is more temporally compact and concentrated in a very short time, which is consistent with the observation in our case. They speculate that negative NBEs are often produced in extremely intense thunderstorms, whose vigorous state cannot be maintained for a long time.
We examined the occurrence of negative NBE bursts relative to the maximum altitude of 15 dBZ radar reflectivity (Figure 2a). The maximum height of 15 dBZ can be used to present the height of the cloud top. We see that there is a very good correlation between negative NBE outbreak and the maximum height for radar reflectivity of 15 dBZ. When the negative NBEs occurred in a burst, the cloud top inferred from 15 dBZ reached above the tropopause, penetrating into the stratosphere, which is defined as the overshooting tops (OTs) at this stage [38,39,40]. Wu et al. [12] analyzed two thunderstorms producing bursts of negative NBEs in Guangzhou and found that the negative NBEs were closely associated with sudden increases of the total volume of radar reflectivity larger than 30 dBZ above 15 km (V30-15), which is similar to our observations.
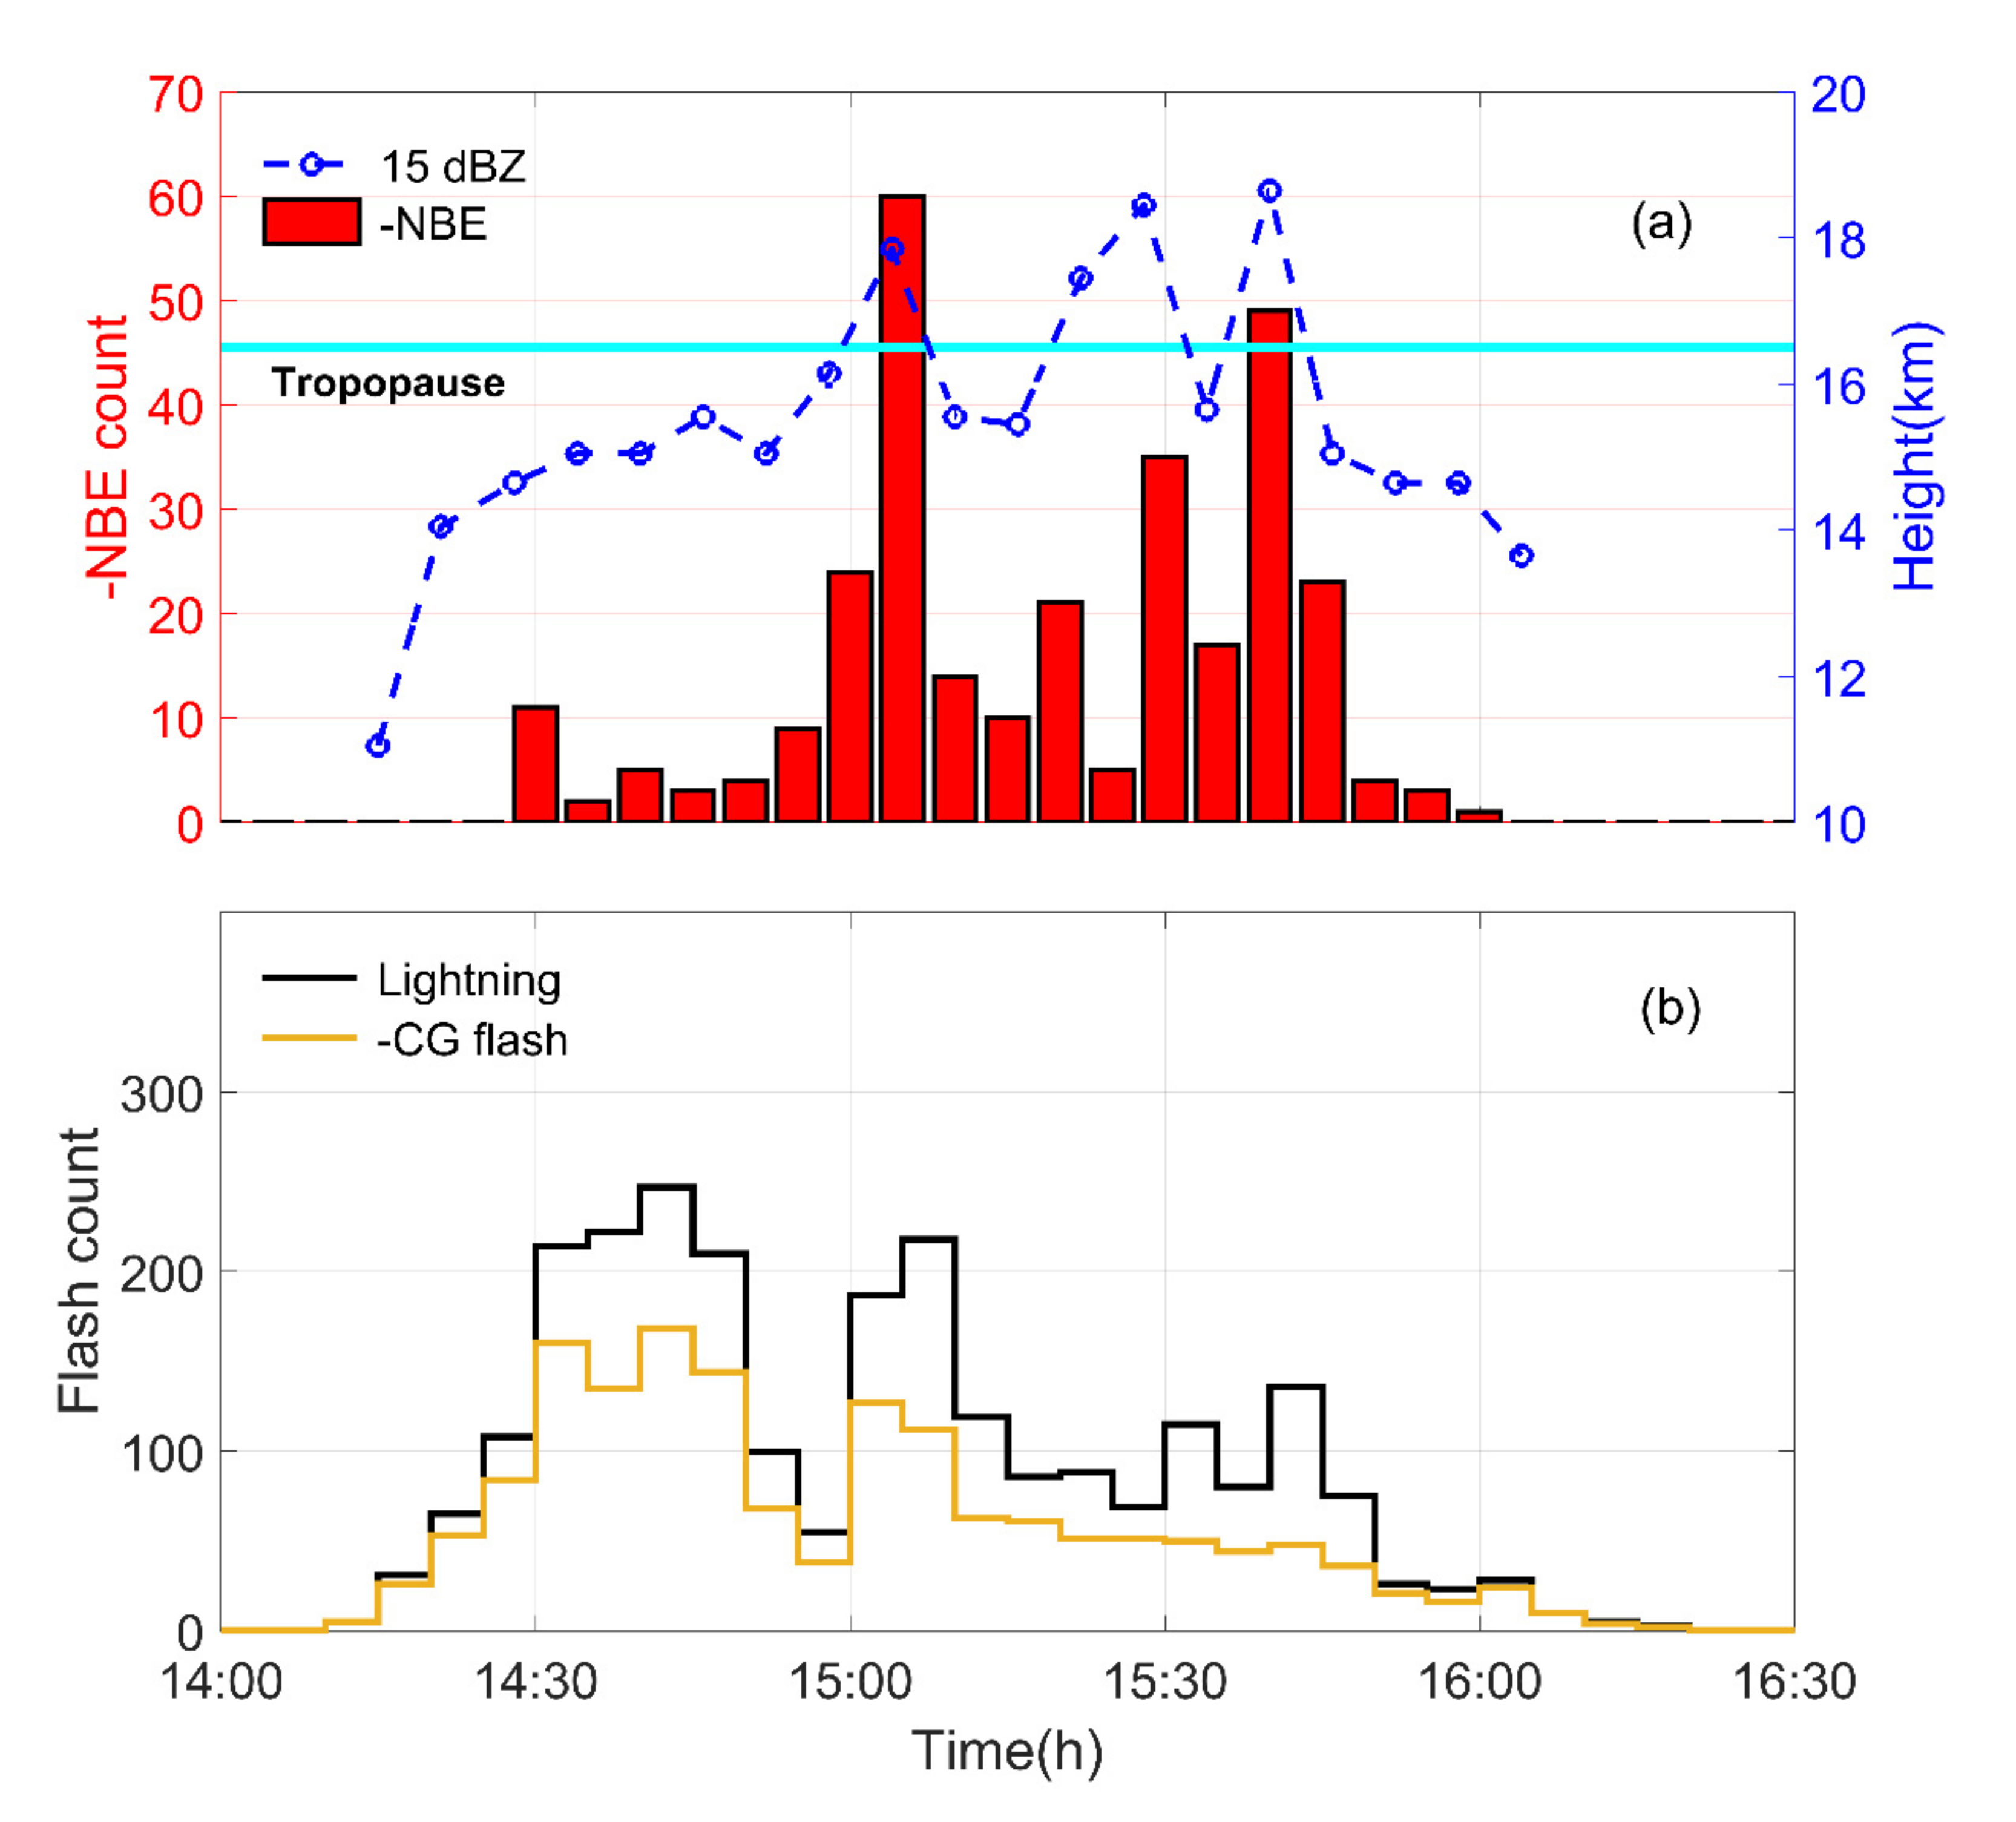
The second thunderstorm occurred over Lake Taihu, which has been examined to investigate the close relationship between negative NBEs and blue discharges [21]. Approximately 300 NBEs were observed, and most of them are of negative polarity (254 events). The altitude distribution of NBEs suggests that the parent thunderstorm was normally electrified with the upper positive charge layer centered at a high altitude of about 16 km.
Similar to the first case, negative NBEs exhibited an intermittent burst pattern in this thunderstorm. The occurrence of the outbreak of negative NBEs also has a close correlation with the variation in the maximum height of 15 dBZ radar reflectivity as shown in Figure 3a, except for NBEs at 1530 UTC. As the temporal resolution of radar observation is six minutes, the evolution of thunderstorms cannot be definitely examined. We speculate that NBEs associated with a relatively low maximum height of 15 dBZ at 1530 UTC are possibly attributed to the low temporal resolution of radar observation.
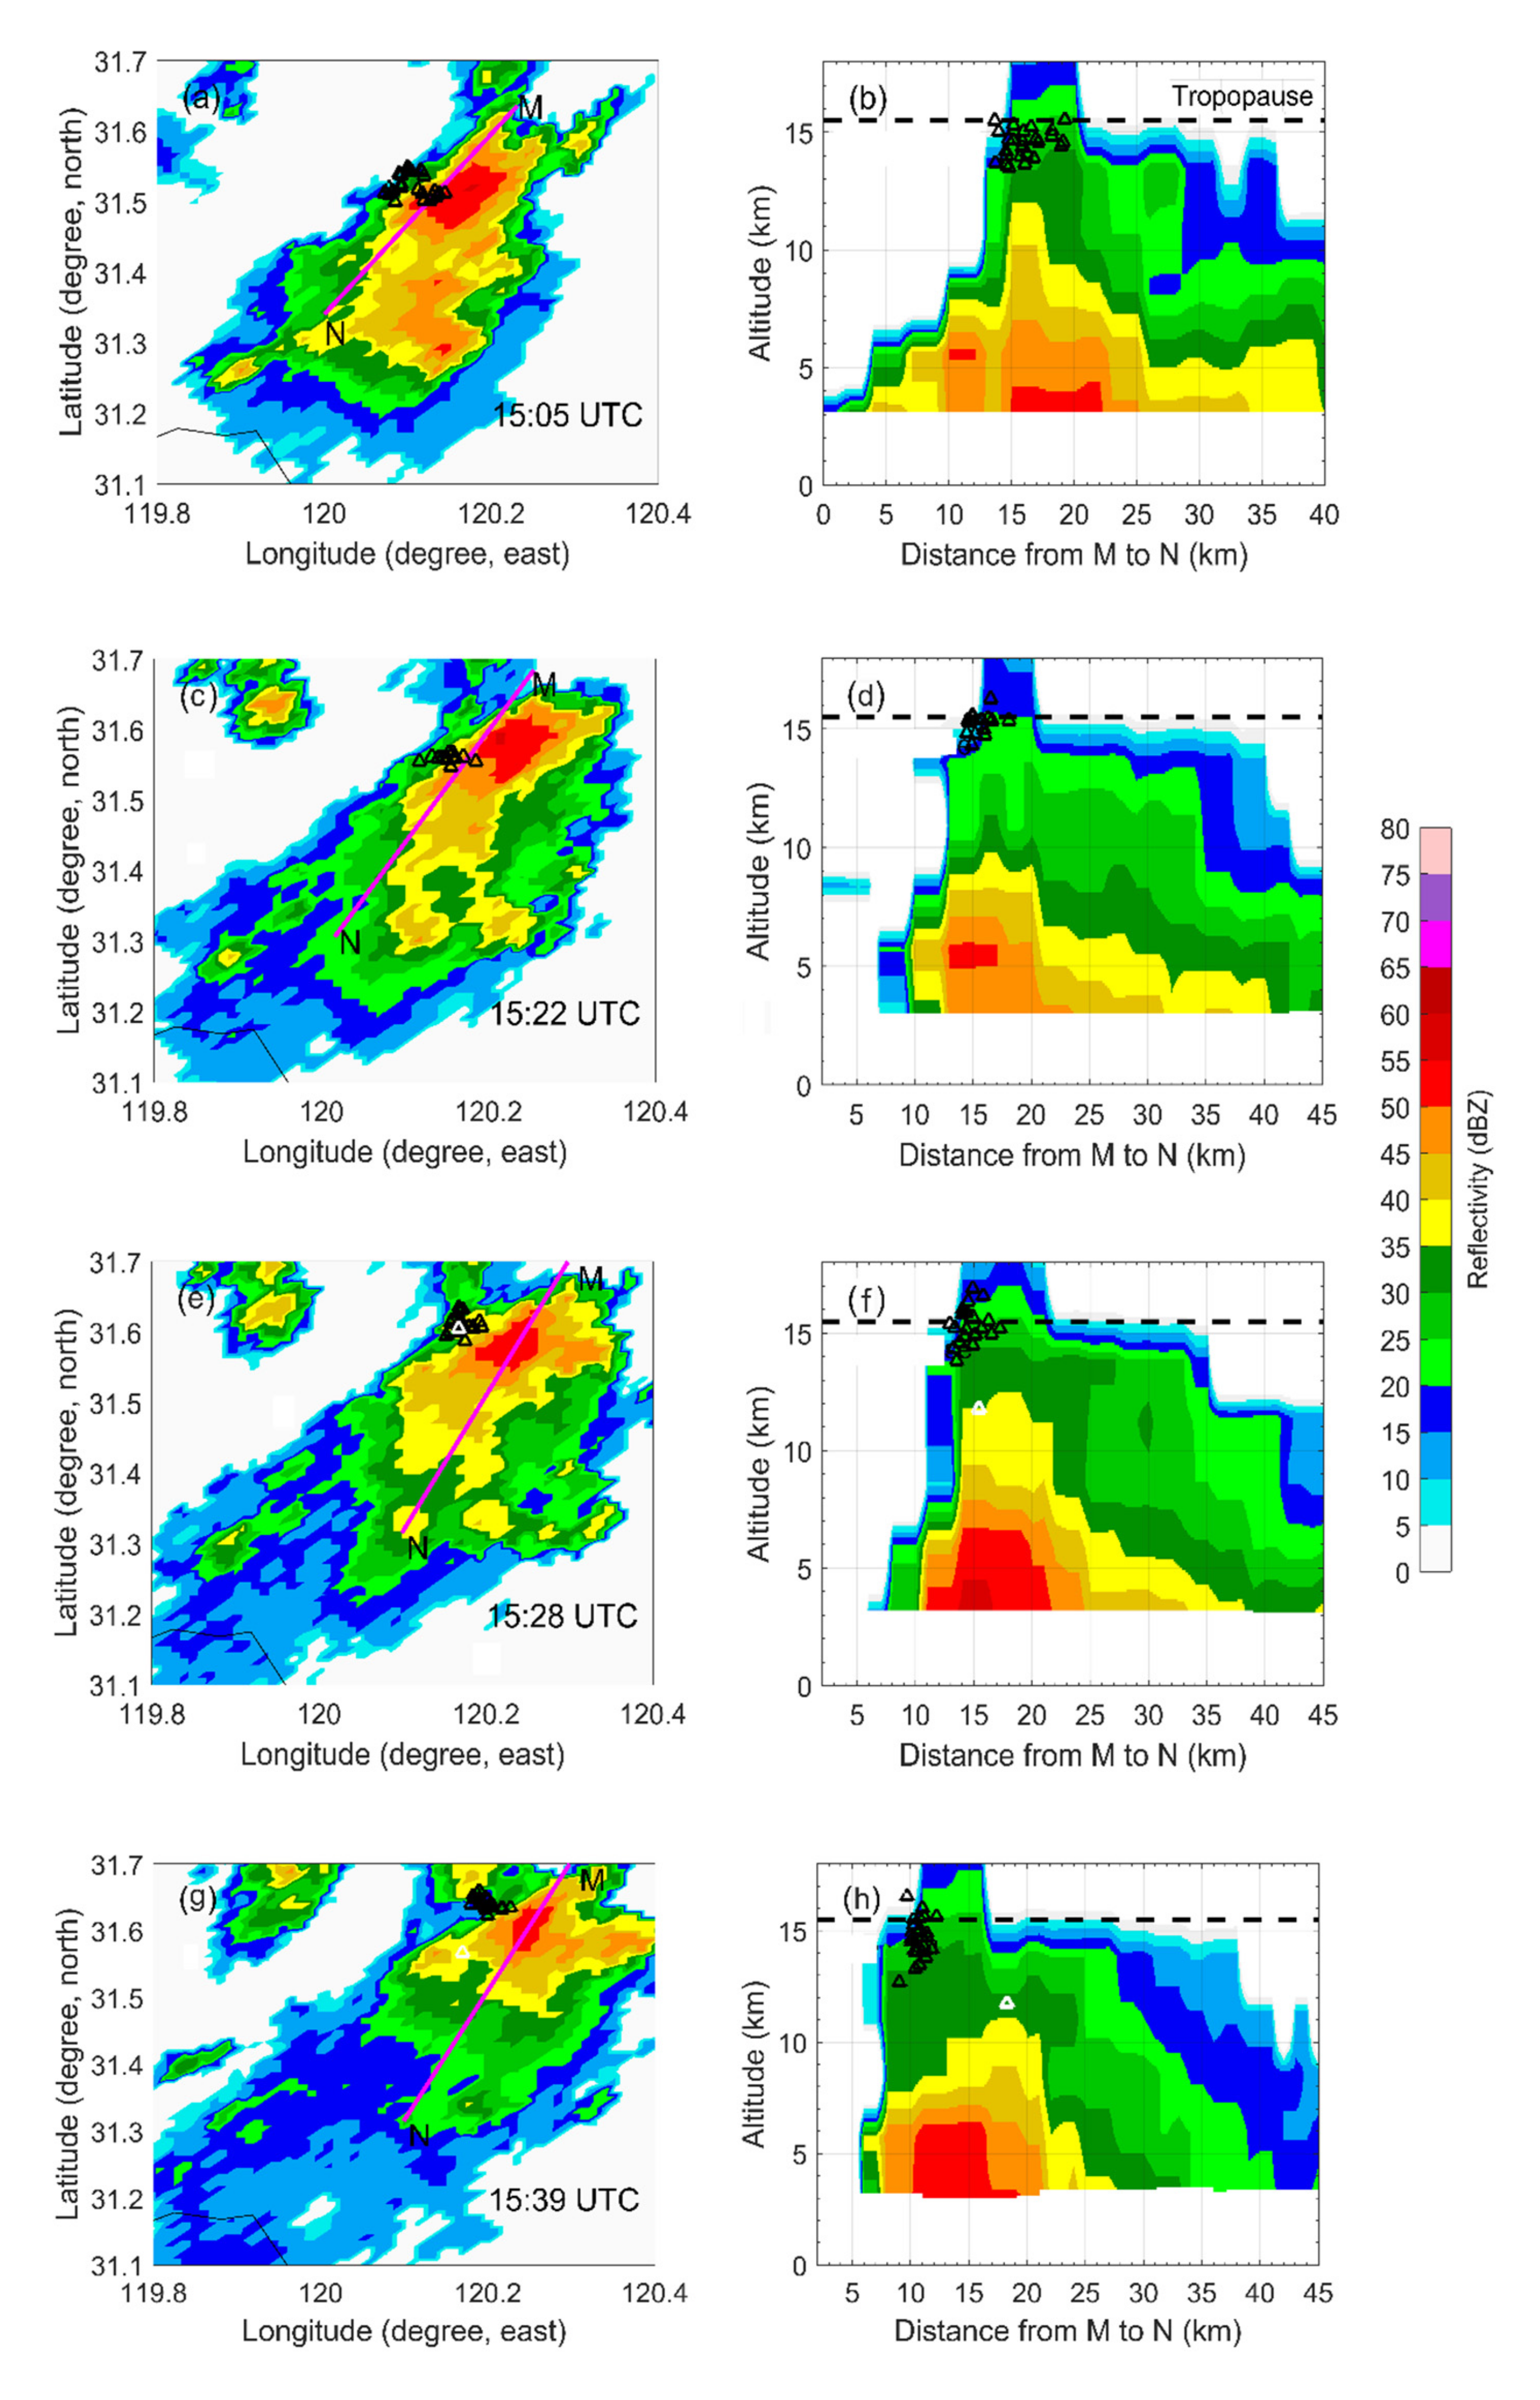
Figure 4 shows the positions of negative NBEs overlapped on the composed PPI radar echo and the vertical section of the radar reflectivity in the different periods of the thunderstorm. We see that negative NBEs cluster at the edge of strong convection contoured by radar reflectivity >40 dBZ. The maximum height of reflectivity even reaches above 18 km, which is much higher than that of the tropopause (~16 km). The outbreak of negative NBEs typically occurs around the edge of 15–25 dBZ near the overshooting tops with an intense convection surge region where significant updrafts drive the cloud top to penetrate above the tropopause. MacGorman et al. [41] examined the evolution of very high-frequency (VHF) signals detected by lightning mapping arrays (LMA) relative to the cloud top temperatures and radar reflectivity of overshooting tops in five thunderstorms. They found that small electrical discharges occur continually at low rates in the overshooting tops of thunderstorms. It was also found that the maximum height of discharges in an overshooting top has a good correlation with the maximum altitude of 18–30 dBZ radar reflectivity. The electrical breakdown mapped by LMA in the upper cloud is likely related to the discharge process of negative NBEs, which is consistent with our observations.
It is also worth noting that the outbreak of negative NBEs occurred even when the CGs flash rate was very low, as shown in Figure 3b. This is possible because CG flash rate is not always an effective indicator for convective strength, and in some stages of a thundercloud, CG rates may decrease but total lightning rates increase [42,43]. In the next section, we will go deep into the relationship between negative NBEs and normal lightning.
3.2. Negative Narrow Bipolar Events versus –CGs, IC and Total Lightning
Suszcynsky et al. [27] analyzed the relationship between NBEs and CG frequency as an indicator of thunderstorm intensity. They found that the frequency of NBEs tended to increase with CG flash, but the CG flash decreased with the increase of total flash frequency in certain thunderstorms [29,42]. Jacobson and Heavner [28] analyzed the relationship between NBEs, normal lightning, and cloud-top temperature and found that NBEs produce almost the same thunderstorm environment as normal lightning, so they suggested that NBEs could be used as a covariate to indicate thunderstorm intensity as conventional lightning. Lapp and Saylor [44] analyzed the relationships between CGs, ICs, and NBEs based on the two months of lightning observations in Florida, and found that CGs and ICs were well correlated, while there was no significant correlation between NBEs and normal lightning. It was also found that the correlation between ICs and NBEs is slightly better than that of CGs and NBEs.
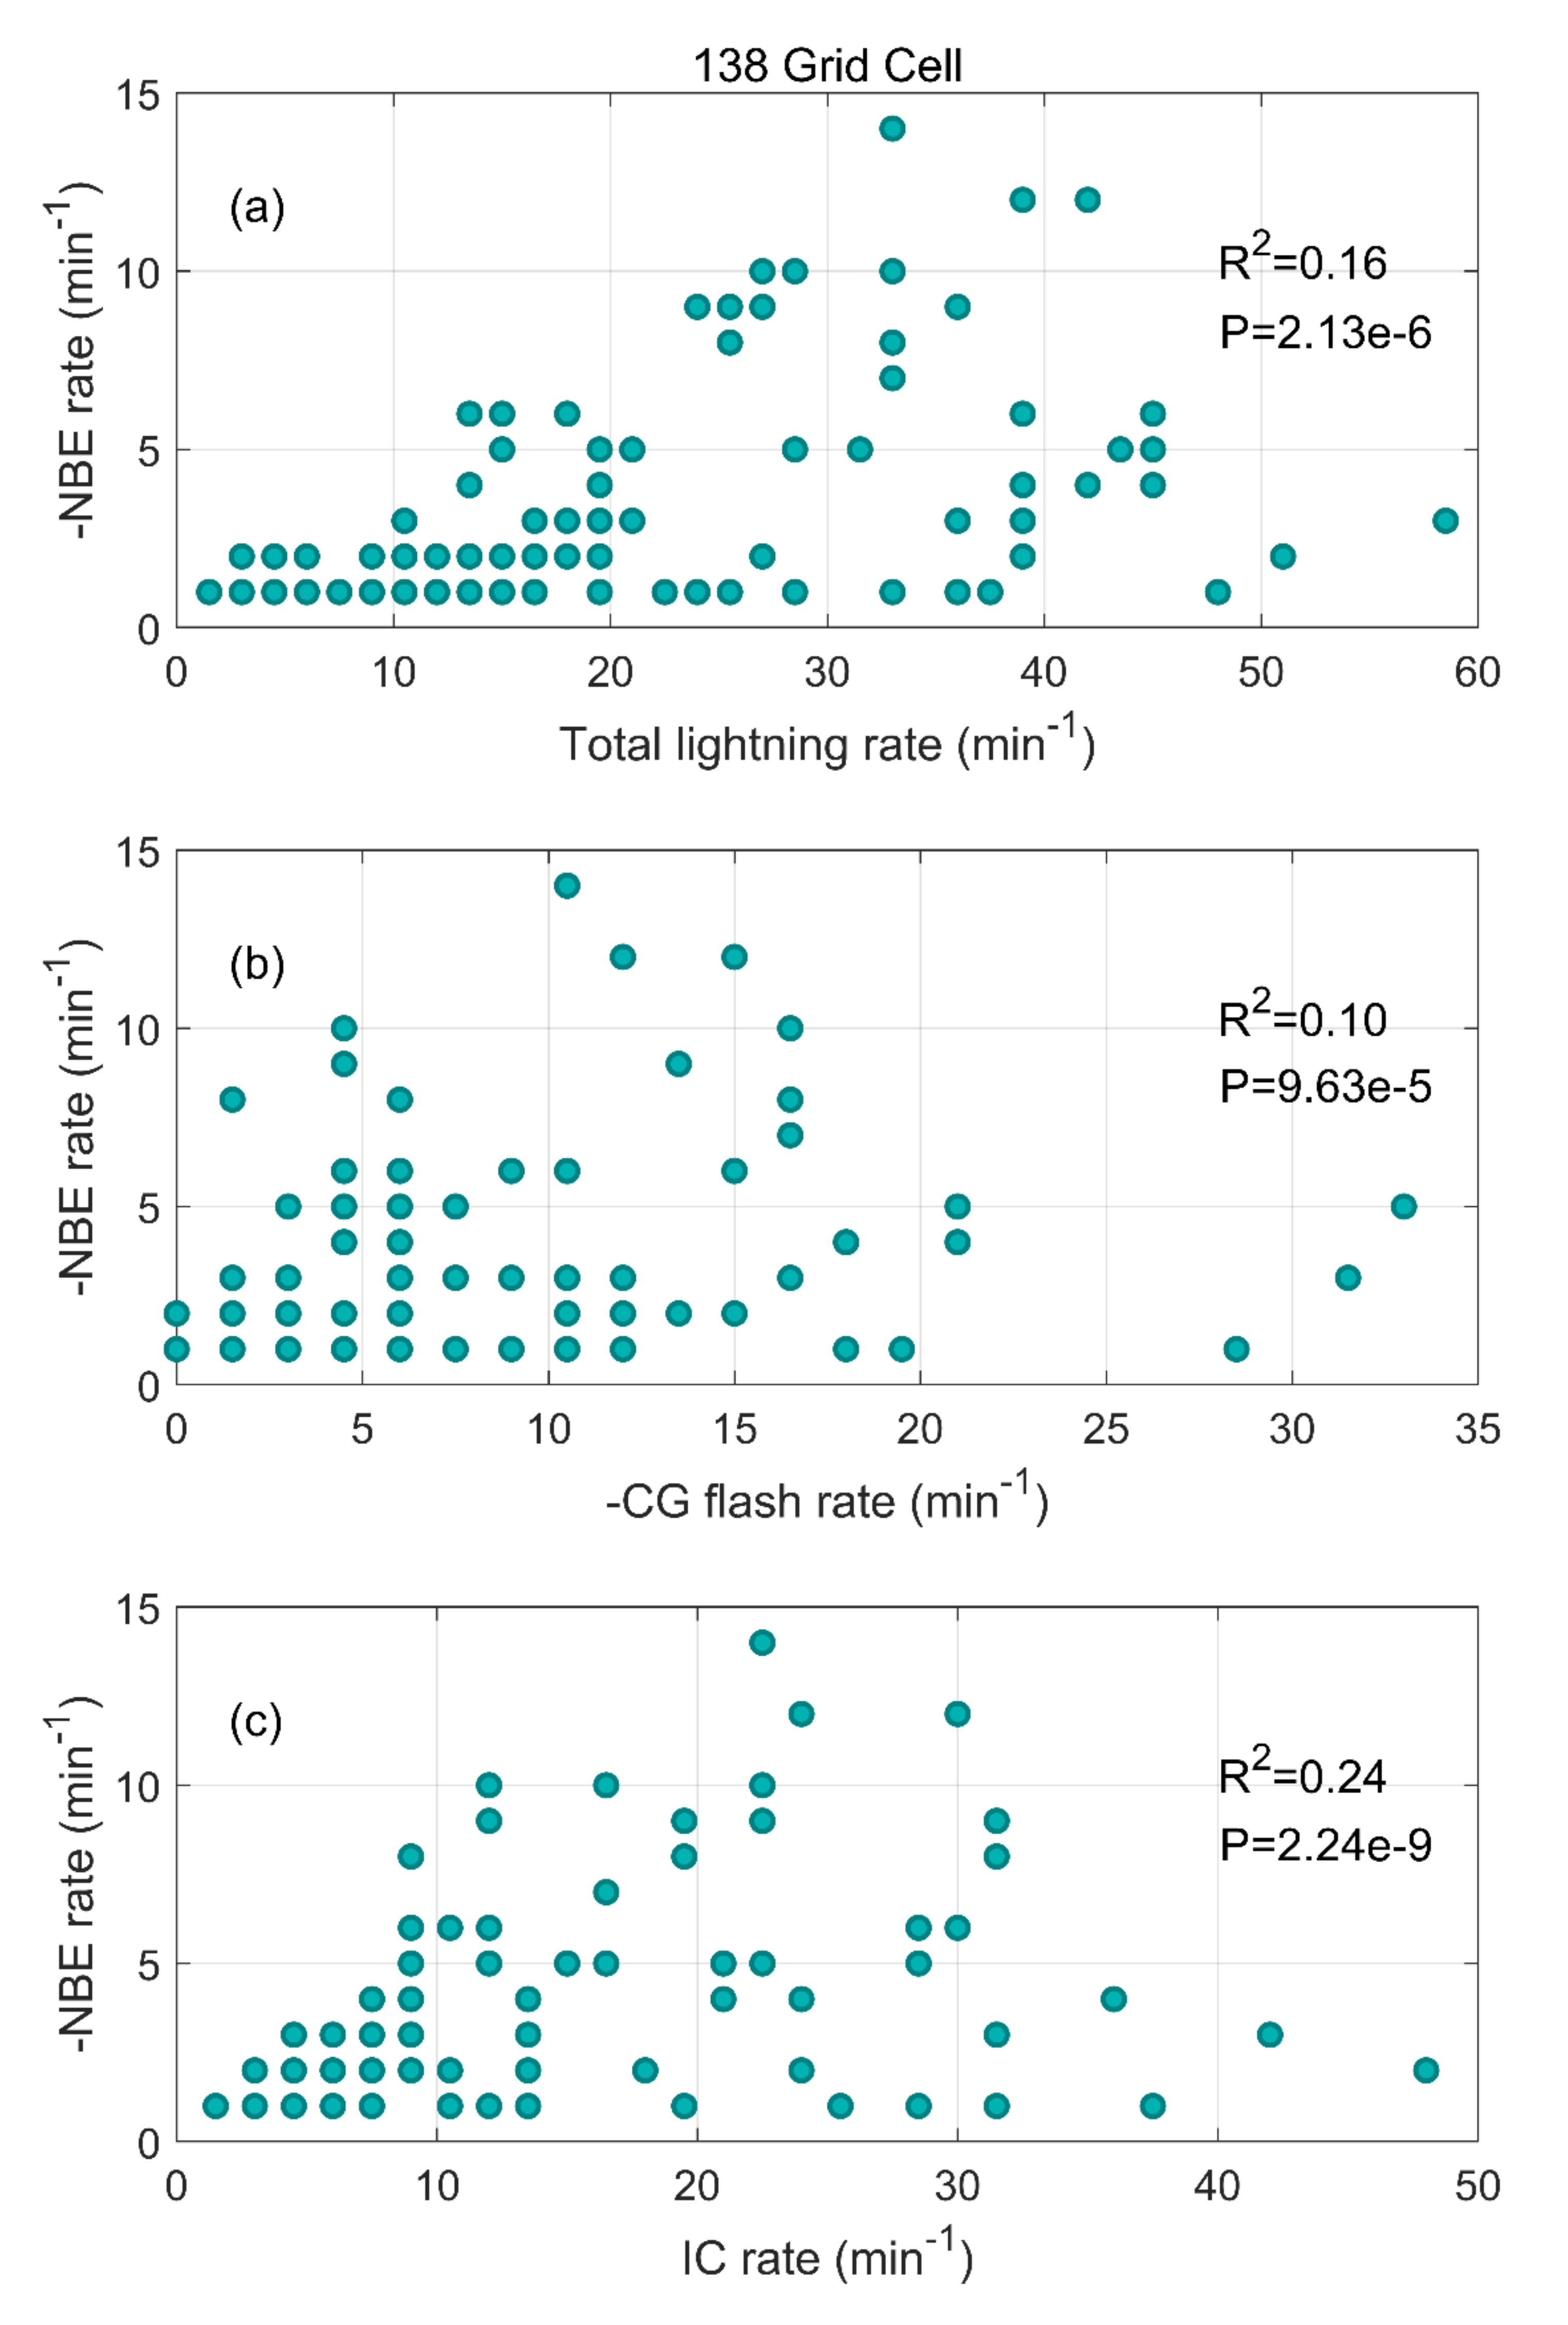
To investigate the relationship between negative NBEs and normal discharges, we examined the negative NBEs, –CGs, ICs and total lightning discharges for each 20 × 20 km grid cell and continuous 1 min intervals adopted by the approach from Jacobson and Heavner [28] and Wiens et al. [29]. Only the grid cell that has ≥1 negative NBEs is counted. A total of 138 grid cells, including 66 grid cells and 72 grid cells in Hangzhou Case and Taihu Case respectively, were picked. Figure 5 shows the statistical results of the relationship between negative NBEs and normal lightning discharges. Although the sample size here is relatively small, the NBE rate shows a positive correlation with the total lighting rate in Figure 5a, suggesting that the outbreak of negative NBEs is usually associated with frequent lightning discharges. In particular, we calculated the correlation coefficient between negative NBE, CG, and IC. We can see that the negative NBEs are more relevant with ICs than CGs from the correlation coefficient and significant level p, suggesting negative NBEs are prone to occur with active IC discharges. On a statistical basis, Wiens et al. [29] analyzed the NBE rates to lightning rate recorded by the Los Alamos Sferic Array (LASA) and the National Lightning Detection Network (NLDN). They found that the NBE flash rate does show some semblance of a correlation to LASA non-NBE rate but a much worse correlation with NLDN flash rate, which is consistent with our observations. They speculated that this anti-correlation may contribute to the mainly CG events of NLDN flash. The positive relationship between negative NBEs and ICs also reflects that strong convection activity in thunderclouds during outbreaks of negative NBEs.
3.3. Mixing Condition of Negative NBEs at Cloud Top
The question of what charge condition near cloud top produces negative NBEs is still unclear. Boggs et al. [45] examined the charge structure and mixing conditions of thunderclouds producing gigantic jets, one kind of upward electrical discharge triggered by positive NBEs [16,17,18]. They found that the large spectrum width is always associated with gigantic jets, suggesting strong mixing between the main negative charge layer and the upper positive charge layer. To investigate the charge mixing condition of negative NBEs at cloud top, the spectrum width with the elevation angle scans of 6° (15–17 km) derived from Doppler radar was used as a proxy for turbulence and charge mixing near cloud top for negative NBEs. The equation for spectral broadening is:
where the left-hand side is the total spectrum width, and is due to the wind shear, is due to turbulence, is due to radar antenna motion, is due to differential terminal velocities of hydrometeors, and is due to orientations of hydrometers [46]. The large values of spectrum width (>8 m/s) are generally accompanied with enhanced turbulence and strong mixing [37,45]. However, the distance from the parent thunderstorm could be the factor contributing to the spectrum width. The last three parameters are more sensitive to the distance, which may increase spectrum width if the radar is far from the storm (>180 km) [47]. If the radar spectrum width is large, then contributions from those other than turbulence can be large, meaning there is no actual mixing taking place. To eliminate the influence of distance, we chose the Lake Taihu case (<160 km) to investigate the mixing condition of negative NBEs near cloud top.
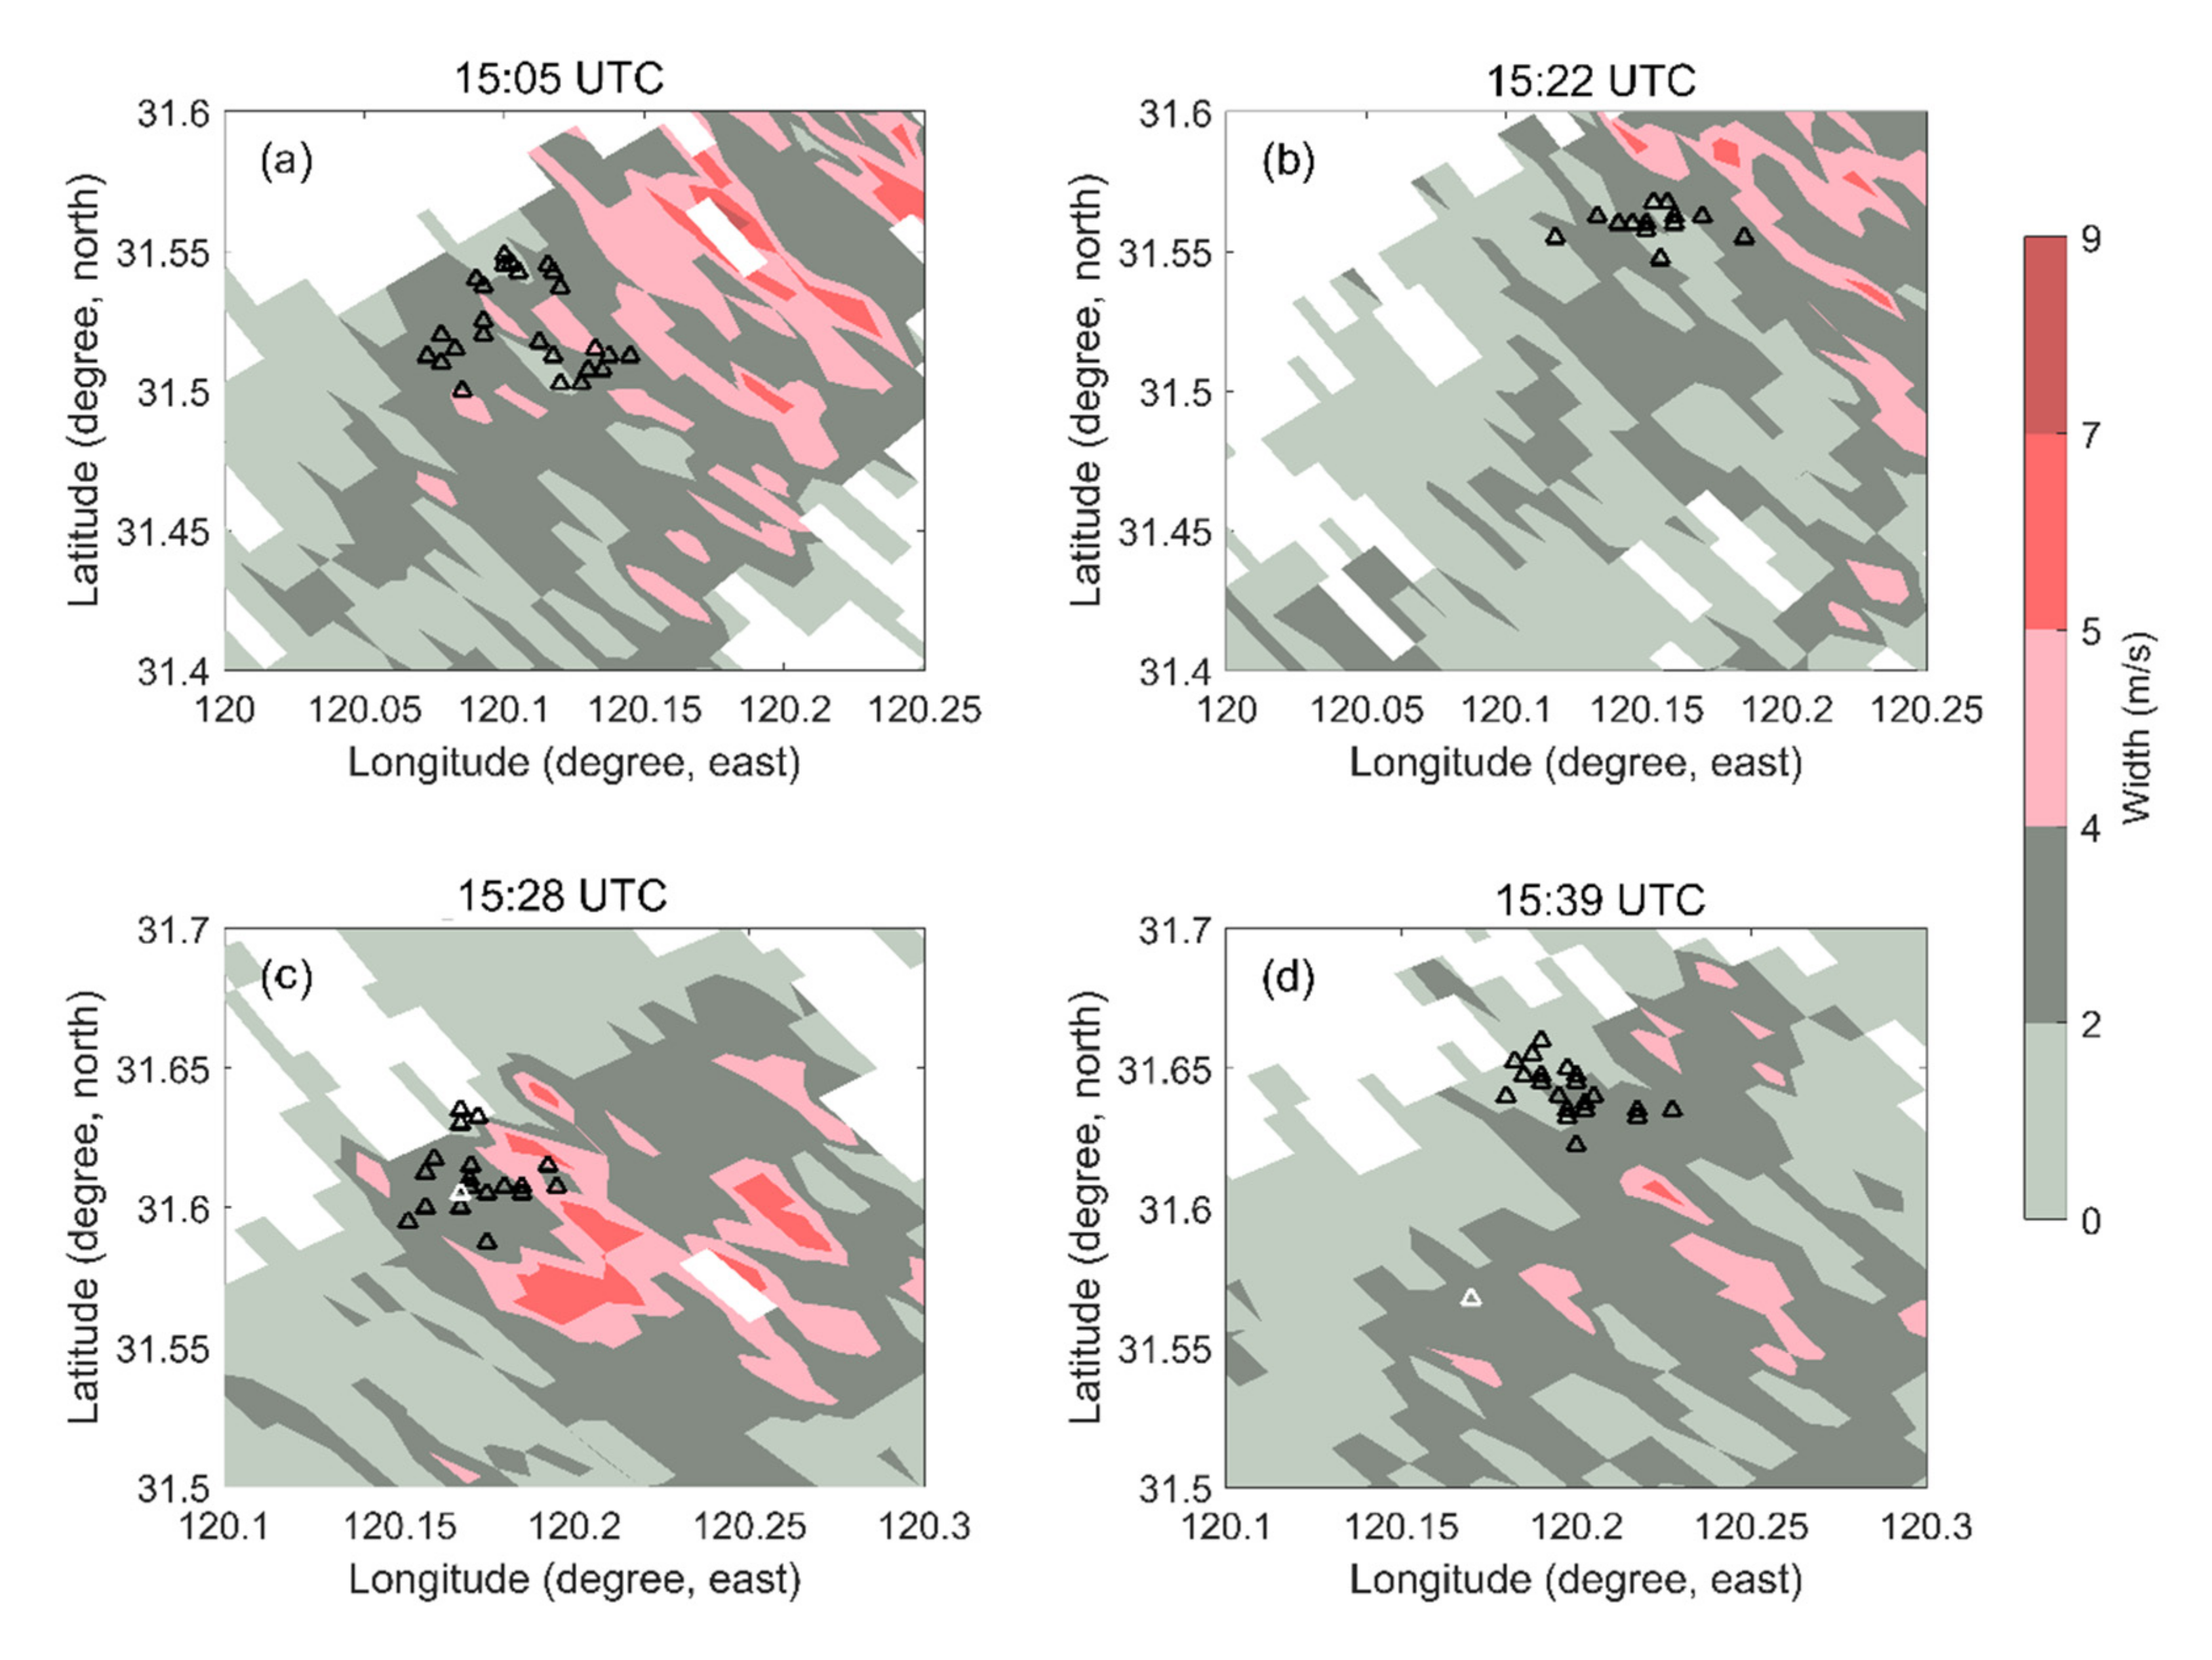
Figure 6 presents the locations of NBEs overlapped on the spectrum width with the elevation angle scans of 6° (15–17 km). We can see that the relatively low values of spectrum width (<5 m/s) were horizontally displaced from and just outside some bursts of negative NBEs. The height distributions of negative NBEs indicate that they are initiated between the upper positive charge and screening charge near thundercloud tops. These low values of spectrum width show low turbulent mixing near cloud top, indicating that the upper negative screening charge is separated from the upper positive charge. To initiate the electrical breakdown between the upper positive charge and screening charge, as described by previous simulation results [48], a relatively strong screening charge layer would be required, and this suggests that there is little mixing near the thunderstorm top.
4. Discussions
The meteorological condition and charge structure of thunderstorms producing negative NBEs have been rarely reported by prior studies [9,19,28]. Lü et al. [30] conducted two years of observations in the northeast of China in a high latitude region and found that no negative NBEs were detected in thunderstorms. They conjecture that the relatively small vertical extent of thunderstorms limited by the height of the tropopause and a lack of vigorous convective surges in higher-latitude regions might suppress negative NBEs.
For the two thunderstorms producing bursts of negative NBEs, the cloud top reached a height of 18 km, penetrating into the stratosphere (16.6 km). Both cases were characterized by convective surges and overshooting tops. Negative NBEs occurred when the height of 15 dBZ reached above the tropopause. It seems that a critical height of thunderclouds is necessary for the production of negative NBEs [9,10]. Strong updrafts could carry the upper positive charge layer to a relatively higher altitude, where the threshold for the lightning breakdown would be reduced [49], and the conductivity would be larger, which could speed up the formation of the screening layer [48]. Consequently, the chance for the occurrence of negative NBEs would be higher.
Additionally, we note that negative NBEs tend to occur in the lower spectrum width, showing low mixing between the negative screening charge and the upper positive charge in thunderclouds. The question is why negative NBEs are prone to occur in the low mixing condition near thunderclouds. To initiate the electrical breakdown between the upper positive charge and screening charge, as described by previous simulation results [48], a relatively strong screening charge layer would be required. Krehbiel et al. [49] suggested that blue jets rarely occur due to the strong degree of mixing between the negative screening charge and upper positive charge in normally electrified thunderstorms. The initiation of blue jets could be impeded when the screening charge is strongly mixed with the upper positive charge. The situation occurs in the overshooting convective top and creates a substantial imbalance between the main negative charge and upper positive charge that makes gigantic jets occur [45,50]. However, if such mixing is relatively low, blue jets rather than gigantic jets tend to occur. Thus, the degree of mixing plays a fundamental role in the triggering of jet phenomena [48,49]. As negative NBEs have been found to trigger blue emissions [20,21,22], it is reasonable that these negative NBEs are prone to occur with low mixing conditions near cloud top.
NBEs, especially of negative polarity, are accompanied by powerful VLF and VHF radio signals. These intense radio signals can be detected with satellites in space and ground-based receivers [7,8]. Owing to their easy detection and recognition, NBEs could serve as a useful remote-sensing proxy for strong convection. Our observations provide evidence that bursts of negative NBEs tend to occur in the overshooting tops of thunderclouds with intense updrafts. This would provide an electrical means to remote sense overshooting tops with implications for the exchange of troposphere and stratosphere.
5. Conclusions
In conclusion, we report on the analyses of two-midnight thunderstorms in East China that were both characterized by outbreaks of negative NBEs. The result shows that the outbreak of negative NBEs in both parent thunderstorms was produced near the overshooting tops with an intense convection surge region where the significant updrafts drove the cloud top to penetrate above the tropopause. The relatively low values of spectrum width (<5 m/s) around the outbreak of negative NBEs indicate that negative NBEs tend to occur under the relatively low mixing between the upper positive charge layer and screening charge layer at thundercloud tops.
Our findings suggest that the outbreak of negative NBEs is usually associated with overshooting tops of thunderclouds. This would provide an electrical means to remote sense overshooting tops with implications for the exchange of troposphere and stratosphere. However, one question is whether all thunderclouds with overshooting tops always produce negative NBEs. There is no doubt that more case studies, especially in different meteorological regions, are required for solid evidence on the relationship between the outbreak of negative NBEs and overshooting tops. Further observational experiments and statistical analysis should be carried out to address this issue. Moreover, due to the limitations of the frequency bands and the sampling rate of instruments used in this study, it is relatively difficult to measure some weak and refined features of the discharges. In the future, we are planning to perform imaging observations of NBEs with a high spatial and temporal resolution to go deep into the features of NBEs in overshooting thunderclouds.
Author Contributions
Conceptualization, F.L.; methodology, F.L.; software, F.L.; validation, F.L.; formal analysis, F.L and B.Z.; investigation, F.L.; resources, data curation, writing—original draft preparation, F.L., B.Z., G.L. and M.M.; writing—review and editing. All authors have read and agreed to the published version of the manuscript.
Funding
This research was funded by National Key R&D Program of China (2017YFC1501501), the National Natural Science Foundation of China (41831070, 41875006, 41974181, 42005068, and U1938115), and the Open Research Project of Large Research Infrastructures of CAS-“Study on the interaction between low/mid-latitude atmosphere and ionosphere based on the Chinese Meridian Project”.
Institutional Review Board Statement
Not applicable.
Informed Consent Statement
Not applicable.
Data Availability Statement
Data sharing is not applicable to this article.
Acknowledgments
The authors would like to thank the University of Wyoming for providing atmospheric sounding data (http://weather.uwyo.edu/upperair/sounding.html, accessed on 1 December 2021).
Conflicts of Interest
The authors declare no conflict of interest.
Abbreviations
List of abbreviations used in the paper:
| E-field | Electric field |
| CG | Cloud-ground discharges |
| NBE | Narrow bipolar events |
| NLDN | National Lightning Detection Network |
| OT | Overshooting tops |
| IC | Intra-cloud discharges |
| JASA | Jianghuai Area Sferic Array |
| TOA | The time of arrival |
| VLF/LF | Very low frequency and low frequency |
| VHF | Very high frequency |
References
- Le Vine, D.M. Sources of the strongest RF radiation from lightning. J. Geophys. Res. Oceans 1980, 85, 4091–4095. [Google Scholar] [CrossRef] [Green Version]
- Willett, J.C.; Bailey, J.C.; Krider, E.P. A class of unusual lightning electric field waveforms with very strong high-frequency radiation. J. Geophys. Res. Atmos. 1989, 94, 16255–16267. [Google Scholar] [CrossRef]
- Zhu, B.; Zhou, H.; Ma, M.; Tao, S. Observations of narrow bipolar events in East China. J. Atmos. Sol. Terr. Phys. 2010, 72, 271–278. [Google Scholar] [CrossRef]
- Nag, A.; Rakov, V.A.; Tsalikis, D.; Cramer, J.A. On phenomenology of compact intracloud lightning discharges. J. Geophys. Res. Atmos. 2010, 115. [Google Scholar] [CrossRef] [Green Version]
- Rison, W.; Krehbiel, R.; Stock, M.; Edens, H.; Shao, X.; Thomas, R.; Stanley, M.; Zhang, Y. Observations of narrow bipolar events reveal how lightning is initiated in thunderstorms. Nat. Commun. 2016, 7, 10721. [Google Scholar] [CrossRef] [Green Version]
- Bandara, S.; Marshall, T.; Karunarathne, S.; Stolzenburg, M. Electric field change and VHF waveforms of positive Narrow Bipolar events in Mississippi thunderstorms. Atmos. Res. 2020, 243, 105000. [Google Scholar] [CrossRef]
- Light, T.; Jacobson, A. Characteristics of impulsive VHF lightning signals observed by the FORTE satellite. J. Geophys. Res. Atmos. 2002, 107, ACL-8. [Google Scholar] [CrossRef]
- Jacobson, A.R. How do the strongest radio pulses from thunderstorms relate to lightning flashes? J. Geophys. Res. Atmos. 2003, 108, 4778. [Google Scholar] [CrossRef]
- Wu, T.; Dong, W.; Zhang, Y.; Wang, T. Comparison of positive and negative compact intracloud discharges. J. Geophys. Res. Atmos. 2011, 116, D03111. [Google Scholar] [CrossRef]
- Wu, T.; Dong, W.; Zhang, Y.; Funaki, T.; Yoshida, S.; Morimoto, T.; Ushio, T.; Kawasaki, Z. Discharge height of lightning narrow bipolar events. J. Geophys. Res. Atmos. 2012, 117, D05119. [Google Scholar] [CrossRef]
- Bandara, S.; Marshall, T.; Karunarathne, S.; Karunarathne, N.; Siedlecki, R.; Stolzenburg, M. Characterizing three types of negative narrow bipolar events in thunderstorms. Atmos. Res. 2019, 227, 263–279. [Google Scholar] [CrossRef]
- Wu, T.S.; Yoshida, S.; Ushio, T.; Kawasaki, Z.; Wang, D.H. Lightning-initiator type of narrow bipolar events and their subsequent pulse trains. J. Geophys. Res. Atmos. 2014, 119, 7425–7438. [Google Scholar] [CrossRef]
- Tilles, J.N.; Liu, N.; Stanley, M.A.; Krehbiel, P.R.; Rison, W.; Stock, M.G.; Wilson, J. Fast negative breakdown in thunderstorms. Nat. Commun. 2019, 10, 1648. [Google Scholar] [CrossRef] [PubMed] [Green Version]
- Lyu, F.C.; Cummer, S.A.; Qin, Z.L.; Chen, M.L. Lightning initiation processes imaged with very high frequency broadband interferometry. J. Geophys. Res. Atmos. 2019, 124, 2994–3004. [Google Scholar] [CrossRef]
- Leal, A.F.R.; Rakov, V.A. A study of the context in which compact intracloud discharges occur. Sci. Rep. 2019, 9, 12218. [Google Scholar] [CrossRef] [PubMed]
- Lu, G.; Cummer, S.A.; Lyons, W.A.; Krehbiel, P.R.; Li, J.; Rison, W.; Thomas, R.J.; Edens, H.E.; Stanley, M.A.; Beasley, W.; et al. Lightning development associated with two negative gigantic jets. Geophys. Res. Lett. 2011, 38, L12801. [Google Scholar] [CrossRef] [Green Version]
- Liu, N.; Spiva, N.; Dwyer, J.R.; Rassoul, H.K.; Free, D.; Cummer, S.A. Upward electrical discharges observed above Tropical Depression Dorian. Nat. Commun. 2015, 6, 5995. [Google Scholar] [CrossRef] [Green Version]
- Yang, J.; Qie, X.; Zhong, L.; He, Q.; Lu, G.; Wang, Z.; Li, H. Analysis of a gigantic jet in southern china: Morphology, meteorology, storm evolution, lightning, and narrow bipolar events. J. Geophys. Res. Atmos. 2020, 125, e2019JD031538. [Google Scholar] [CrossRef]
- Wu, T.; Takayanagi, Y.; Yoshida, S.; Funaki, T.; Ushio, T.; Kawasaki, Z. Spatial relationship between lightning narrow bipolar events and parent thunderstorms as revealed by phased array radar. Geophys. Res. Lett. 2013, 40, 618–623. [Google Scholar] [CrossRef]
- Liu, F.; Zhu, B.; Lu, G.; Qin, Z.; Lei, J.; Peng, K.-M.; Chen, A.; Huang, A.; Cummer, S.A.; Chen, M.; et al. Observations of blue discharges associated with negative narrow bipolar events in active deep convection. Geophys. Res. Lett. 2018, 45, 2842–2851. [Google Scholar] [CrossRef]
- Liu, F.; Zhu, B.; Lu, G.; Lei, J.; Shao, J.; Chen, Y.; Zhou, H. Meteorological and electrical conditions of two mid-latitude thunderstorms producing blue discharges. J. Geophys. Res. Atmos. 2021, 126. [Google Scholar] [CrossRef]
- Liu, F.; Lu, G.; Neubert, T.; Lei, J.; Chanrion, O.; Østgaard, N.; Zhu, B. Optical emissions associated with narrow bipolar events from thunderstorm clouds penetrating into the stratosphere. Nat. Commun. 2021, 12, 6631. [Google Scholar] [CrossRef] [PubMed]
- Wescott, E.M.; Sentman, D.; Osborne, D.; Hampton, D.; Heavner, M. Preliminary results from the Sprites94 Aircraft Campaign: 2. Blue jets. Geophys. Res. Lett. 1995, 22, 1209–1212. [Google Scholar] [CrossRef]
- Pasko, V.P.; Stanley, M.A.; Mathews, J.D.; Inan, U.S.; Wood, T.G. Electrical discharge from a thundercloud top to the lower ionosphere. Nature 2002, 416, 152–154. [Google Scholar] [CrossRef]
- Chanrion, O.; Neubert, T.; Mogensen, A.; Yair, Y.; Stendel, M.; Singh, R.; Siingh, D. Profuse activity of blue electrical discharges at the tops of thunderstorms. Geophys. Res. Lett. 2017, 44, 496–503. [Google Scholar] [CrossRef] [Green Version]
- Neubert, T.; Chanrion, O.; Heumesser, M.; Dimitriadou, K.; Husbjerg, L.; Rasmussen, I.L.; Østgaard, N.; Reglero, V. Observation of the onset of a blue jet into the stratosphere. Nature 2021, 589, 371–375. [Google Scholar] [CrossRef]
- Suszcynsky, D.M.; Heavner, M.J. Narrow Bipolar Events as indicators of thunderstorm convective strength. Geophys. Res. Lett. 2003, 30, 1879. [Google Scholar] [CrossRef] [Green Version]
- Jacobson, A.R.; Heavner, M.J. Comparison of narrow bipolar events with ordinary lightning as proxies for severe convection. Mon. Weather Rev. 2005, 133, 1144–1154. [Google Scholar] [CrossRef]
- Wiens, K.C.; Hamlin, T.; Harlin, J.; Suszcynsky, D.M. Relationships among narrow bipolar events, “total” lightning, and radar-inferred convective strength in Great Plains thunderstorms. J. Geophys. Res. Atmos. 2008, 113, D05201. [Google Scholar] [CrossRef] [Green Version]
- Lü, F.; Zhu, B.; Zhou, H.; Rakov, V.A.; Xu, W.; Qin, Z. Observations of compact intracloud lightning discharges in the northernmost region (51N) of China. J. Geophys. Res. Atmos. 2013, 118, 4458–4465. [Google Scholar] [CrossRef]
- Karunarathna, N.; Marshall, T.C.; Stolzenburg, M.; Karunarathne, S. Narrow bipolar pulse locations compared to thunderstorm radar echo structure. J. Geophys. Res. Atmos. 2015, 120, 11–690. [Google Scholar] [CrossRef]
- Qin, Z.; Zhu, B.; Ma, M.; Ma, D. Using time domain waveforms of return strokes to retrieve the daytime fluctuation of ionospheric D layer. Chin. Sci. Bull. 2015, 60, 654. [Google Scholar] [CrossRef]
- Qin, Z.; Chen, M.; Lyu, F.; Cummer, S.A.; Zhu, B.; Liu, F.; Du, Y. A GPU-Based Grid Traverse Algorithm for Accelerating Lightning Geolocation Process. IEEE Trans. Electromagn. Compat. 2019, 62, 489–497. [Google Scholar] [CrossRef]
- Ma, D. Characteristic pulse trains of preliminary breakdown in four isolated small thunderstorms. J. Geophys. Res. Atmos. 2017, 122, 3361–3373. [Google Scholar] [CrossRef]
- Smith, D.A.; Heavner, M.J.; Jacobson, A.R.; Shao, X.M.; Massey, R.S.; Sheldon, R.J.; Wiens, K.C. A method for determining intracloud lightning and ionospheric heights from VLF/LF electric field records. Radio Sci. 2004, 39, RS1010. [Google Scholar] [CrossRef]
- Lyu, F.; Cummer, S.A.; McTague, L. Insights into high peak current in-cloud lightning events during thunderstorms. Geophys. Res. Lett. 2015, 42, 6836–6843. [Google Scholar] [CrossRef]
- Istok, M.J.; Doviak, R.J. Analysis of the relation between doppler spectral width and thunderstorm turbulence. J. Atmos. Sci. 1986, 43, 2199–2214. [Google Scholar] [CrossRef] [Green Version]
- Todd, S.G.; Zenk, W. ; American Meteorological Society. Glossary of Meteorology, 2nd ed.; American Meteorological Society: Boston, MA, USA, 2000; p. 855. [Google Scholar]
- Liu, C.; Zipser, E.J. Global distribution of convection penetrating the tropical tropopause. J. Geophys. Res. Atmos. 2005, 110, D23104. [Google Scholar] [CrossRef] [Green Version]
- Pan, L.L.; Homeyer, C.R.; Honomichl, S.; Ridley, B.A.; Weisman, M.; Barth, M.C.; Hair, J.W.; Fenn, M.A.; Butler, C.; Huntrieser, H. Thunderstorms enhance tropospheric ozone by wrapping and shedding stratospheric air. Geophys. Res. Lett. 2014, 41, 7785–7790. [Google Scholar] [CrossRef]
- MacGorman, D.R.; Elliott, M.S.; DiGangi, E. Electrical discharges in the overshooting tops of thunderstorms. J. Geophys. Res. Atmos. 2017, 122, 2929–2957. [Google Scholar] [CrossRef]
- Williams, E.R.; Boldi, B.; Matlin, A.; Weber, M.; Hodanish, S.; Sharp, D.; Goodman, S.; Raghaven, R.; Buechler, D. The behavior of total lightning activity in severe Florida thunderstorms. Atmos. Res. 1999, 51, 245–265. [Google Scholar] [CrossRef] [Green Version]
- Lang, T.J.; Rutledge, S.A. Relationships between convective storm kinematics, precipitation, and lightning. Mon. Weather Rev. 2002, 130, 2492–2506. [Google Scholar] [CrossRef]
- Lapp, J.L.; Saylor, J.R. Correlation between lightning types. Geophys. Res. Lett. 2007, 34. [Google Scholar] [CrossRef]
- Boggs, L.D.; Liu, N.Y.; Riousset, J.A.; Shi, F.; Lazarus, S.; Splitt, M.; Rassoul, H.K. Thunderstorm charge structures producing gigantic jets. Sci. Rep. 2018, 8, 18085. [Google Scholar] [CrossRef] [PubMed]
- Brewster, K.A.; Zrnić, D.S. Comparison of eddy dissipation rates from spatial spectra of Doppler velocities and Doppler spectrum widths. J. Atmos. Ocean. Technol. 1986, 3, 440–452. [Google Scholar] [CrossRef] [Green Version]
- Fang, M.; Doviak, R.J.; Melnikov, V. Spectrum width measured by WSR-88D: Error sources and statistics of various weather phenomena. J. Atmos. Ocean. Technol. 2004, 21, 888–904. [Google Scholar] [CrossRef]
- Riousset, J.A.; Pasko, V.P.; Krehbiel, P.R.; Rison, W.; Stanley, M.A. Modeling of thundercloud screening charges: Implications for blue and gigantic jets. J. Geophys. Res. Space Phys. 2010, 115. [Google Scholar] [CrossRef] [Green Version]
- Krehbiel, P.R.; Riousset, J.A.; Pasko, V.P.; Thomas, R.J.; Rison, W.; Stanley, M.A.; Edens, H.E. Upward electrical discharges from thunderstorms. Nat. Geosci. 2008, 1, 233–237. [Google Scholar] [CrossRef]
- Boggs, L.D.; Liu, N.; Peterson, M.; Lazarus, S.; Splitt, M.; Lucena, F.; Nag, A.; Rassoul, H.K. First observations of gigantic jets from geostationary orbit. Geophys. Res. Lett. 2019, 46, 3999–4006. [Google Scholar] [CrossRef]
Figure 1.
Location of two thunderstorms that contained outbreaks of negative NBEs when the thunderstorms were crossing over an area of open water. (a) The colored points represent the locations of two thunderstorms. Green dots represent locations of the lightning stations on the map. The symbols ‘▲’ represent locations of the sounding data stations. (b) Location of thunderstorm occurring above in-land Lake Taihu on 19 August 2012. The color scale represents time variations. (c) Location of the thunderstorm near Hangzhou Bay on 12 September 2014.

Figure 2.
Variations in lightning activity and thundercloud top of the Hangzhou Bay Case. (a) The maximum height of 15 dBZ derived from the radar correlate with the outbreak of negative NBEs. The red histogram presents the negative NBEs in 5 min; the blue dashed line represents the maximum height of 15 dBZ derived from the radar, which was used to represent the thundercloud top; the cyan bold line represents the tropopause estimated from the sounding observations at Hangzhou station. (b) The normal lightning activity in the parent thunderstorm. The black histogram presents the lightning activity in 5 min while the dark yellow histogram presents negative CGs in 5 min.

Figure 3.
Variations of lightning activity and thundercloud top of the Lake Taihu case. Symbols are the same as Figure 2. (a) The maximum height of 15 dBZ derived from the radar correlate with the outbreak of negative NBEs; the cyan bold line represents the tropopause estimated from the sounding observations at Hangzhou station. (b) The normal lightning activity in the parent thunderstorm. The black histogram presents the lightning activity in 5 min while the dark yellow histogram presents negative CGs in 5 min.

Figure 4.
Locations of NBEs overlapped on the radar reflectivity in the Taihu thunderstorm. Black and white triangles represent the negative and positive NBEs, respectively. (a,c,e,g) Locations of negative NBEs overlapped on the composed PPI radar echo at 1505 UTC in case Hangzhou Bay. (b,d,f,h) Vertical profile of radar reflectivity along the path MN from PPI radar echo.

Figure 5.
Scatterplots of (a) total lightning versus negative NBEs, (b) –CG flash versus negative NBEs, and (c) IC versus negative NBEs. The value is the correlation coefficients between the values and binned abscissa values over the fitted functional relationships. p value presents the significance level.

Figure 6.
Locations of NBEs overlapped on the spectrum width with the elevation angle scans of 6° (15–17 km). (a–d) present the outbreak of negative NBEs overlapped on spectrum in different time of thunderstorm.
Figure 6.
Locations of NBEs overlapped on the spectrum width with the elevation angle scans of 6° (15–17 km). (a–d) present the outbreak of negative NBEs overlapped on spectrum in different time of thunderstorm.

Publisher’s Note: MDPI stays neutral with regard to jurisdictional claims in published maps and institutional affiliations. |
© 2021 by the authors. Licensee MDPI, Basel, Switzerland. This article is an open access article distributed under the terms and conditions of the Creative Commons Attribution (CC BY) license (https://creativecommons.org/licenses/by/4.0/).
Share and Cite
MDPI and ACS Style
Liu, F.; Zhu, B.; Lu, G.; Ma, M. Outbreak of Negative Narrow Bipolar Events in Two Mid-Latitude Thunderstorms Featuring Overshooting Tops. Remote Sens. 2021, 13, 5130. https://0-doi-org.brum.beds.ac.uk/10.3390/rs13245130
AMA Style
Liu F, Zhu B, Lu G, Ma M. Outbreak of Negative Narrow Bipolar Events in Two Mid-Latitude Thunderstorms Featuring Overshooting Tops. Remote Sensing. 2021; 13(24):5130. https://0-doi-org.brum.beds.ac.uk/10.3390/rs13245130
Chicago/Turabian StyleLiu, Feifan, Baoyou Zhu, Gaopeng Lu, and Ming Ma. 2021. "Outbreak of Negative Narrow Bipolar Events in Two Mid-Latitude Thunderstorms Featuring Overshooting Tops" Remote Sensing 13, no. 24: 5130. https://0-doi-org.brum.beds.ac.uk/10.3390/rs13245130
Note that from the first issue of 2016, this journal uses article numbers instead of page numbers. See further details here.