
The Morphology of Evolved Urban Fabric around Farm Ponds


Department of Architecture, National Taiwan University of Science and Technology, 43, Section 4, Keelung Road, Taipei 106, Taiwan
*
Author to whom correspondence should be addressed.
Remote Sens. 2021, 13(3), 437; https://0-doi-org.brum.beds.ac.uk/10.3390/rs13030437
Submission received: 14 December 2020
/
Revised: 18 January 2021
/
Accepted: 23 January 2021
/
Published: 27 January 2021
(This article belongs to the Special Issue Remote Sensing of Environmental Health Resilience)
Abstract
:Resilience, water-based ecosystems, and regional urbanization are closely related. Ponds, as a part of water-based ecosystems, are subject to the indicators of urbanization. The farm ponds in Taoyuan, Taiwan, represent a sustainable fulfillment of irrigation demand and are a system that has been resilient to the topological change in plate elevation over time. The old system was developed in three stages and gradually replaced by canals and reservoirs, with lands abolished or demolished for other purposes. This study aimed to investigate the resilience of farm ponds based on a quantitative estimation of the morphologically evolved urban fabric. Based on five types of map resources, case studies were made on the ponds located near or away from the Green Line of the Taoyuan Rapid Transit System in order to explore their potential relationship with urbanization and the concept of transit-oriented development (TOD). The results show high dynamics of land-use changes while each one was surrounded by a specific urban fabric and contributed to the individual history, designated role, and major type of buildings developed. Quantitative estimation made from satellite images found the developing patterns of resilience in different convergence stages. Each of the four pond cases represents a different stage and application pattern to the integration of water and urban resilience and, in the meantime, maintains the old pond culture. The verification of the water surface area was compared between former 3D scans and satellite images.

1. Introduction
The farm ponds in Taoyuan, Taiwan, represent a sustainable utilization of water resources and a system that has been resilient to the topological change in plate elevation over time. The ponds were developed as an irrigation system and have been recognized as a cultural icon in Taoyuan for a long time (Figure 1). Their role has been gradually replaced by reservoirs and canal systems. Many of the ponds are now obsolete and draw people’s attention.
Urban resilience is closely related to the ponds’ resilience, in which the former details the activation plan for the infrastructure that enables tourism promotion with regard to the pond landscape or system. Resilience is the capability of a system or a strategy to recover from disaster or overcome stress, with an emphasis on economy [1], culture [2], community [3], and ecology [4]. Tourism resilience applies related concepts and professional practices to investigate and alleviate the impacts of tourism on business [5] or communities [6]. Sustainable tourism demands proper management to fulfill economic, social, and esthetic needs [7]. Sustainable management or resilience planning of water-based ecosystems should be applied to a variety of perspectives from marine tourism [8] to coastal tourism [9,10,11] and lake tourism [12,13,14,15].
Climate is closely related to water temperature and consequently impacts regional tourism [16]. Similarly, tourism based on shallow lakes is subject to the impacts of environmental change [17]. Cyanobacteria cause health risks and economic costs to communities worldwide [18,19]. There is a higher chance for small water bodies to be in a vegetated state [20,21]. Although the problem can potentially be solved at an ecosystem level [22], farm ponds are a water body smaller than a shallow lake and the water quality is decaying. Pond-based water tourism may require new measures for better understanding the value of water [23].
Environmental factors only contribute to some of the overall land-use changes. Socioeconomic factors are the main forces influencing the character of land use [24]. Urbanization is a complex social, economic, political, and technological process, and there are no uniform patterns of this process [25]. Roads, buildings, the density of the population, impervious surfaces, and car traffic are indicators of urbanization, with case studies in Canada, the UK, the USA, and Australia in a buffer area within 100 to 1000 m [26]. When the process occurs on an infrastructure or specific land use, urbanization involves many measures of indicators that help us to understand the history of development. For example, the urban fabric can be impacted by transport infrastructure as a force determining landscape changes [27]. Military land use can have a significant beneficial impact on current land cover composition [28]. Although ponds serve different purposes, from irrigation and esthetics to recreation and commercial fishing, pondscapes in small cities are still subjected to the impact of washing, solid waste disposal, and emergency municipal dumping [29]. Ponds were filled up for new facilities in northern Taiwan in the past, but in the meantime, garbage dumping and solid waste disposal occur at undesignated ponds.
Urban resilience concerns the analysis, design, planning, and management of a city [30,31,32,33]. Zoning has been applied as a tool to manage water resources. The designated functions of zones play an important role in the distribution of water [34]. With the size and distribution of ponds, the earlier development of the pond system followed the topographic features of the terrain in Taoyuan, Taiwan. In lakes in Australia and New Zealand, zoning strategies were applied to tourism management to ensure the conservation of water in nature [35]. Moreover, management was extended to lakes under a broader angle so as to interpret the social environment for a sustainable approach [36], provide cultural opportunities such as community festivals [37], or fit into cultural construction [38].
Aside from applying remote sensing to monitor time series of water quality [39], satellite images were applied to estimate the decreasing area of ponds between 1978 and 2012 [40]. More detailed GIS data should be retrieved from more map sources to clarify the trend of local development as a record of the resilience developed through the quantitative estimation of the changing land types and areas.
2. Related Goal
This research aims to study the resilience of farm ponds based on the quantitative estimation of the morphologically evolving urban fabric in neighborhoods. Urbanization has drawn concerns regarding the management of urban biodiversity. In order to examine the historical development of a pond, a detailed investigation should be undertaken on the evolvement of land and building types. Based on the development that has occurred in peripheral regions and the conversation between the urban fabric and ponds, case studies should be undertaken to explore the resilience of farm ponds such as developing patterns at different convergence stages.
This paper is organized in the following sections: Introduction, Related Goal, Research Methodology, Historical Development of Ponds and Government Policies, Case Studies on Developing Patterns, Boundary Verifications, Discussions, and Conclusions.
3. Research Methodology
Questions were raised regarding the history and developing pattern of ponds.
- Was the local development or urbanization closely related to the ponds or the lands in peripherals?
- How could the urbanization around a pond by related indicators or classifications of land use be assessed?
- Did the urbanization around a pond create different developing patterns?
- Was there any relationship that occurred between the patterns?
- Could the evolved patterns be quantified in a manner that predicts a future trend of the urbanization?
- How was the activation of ponds related to government policies?
- How was the pond related to the resilience of the local environment?
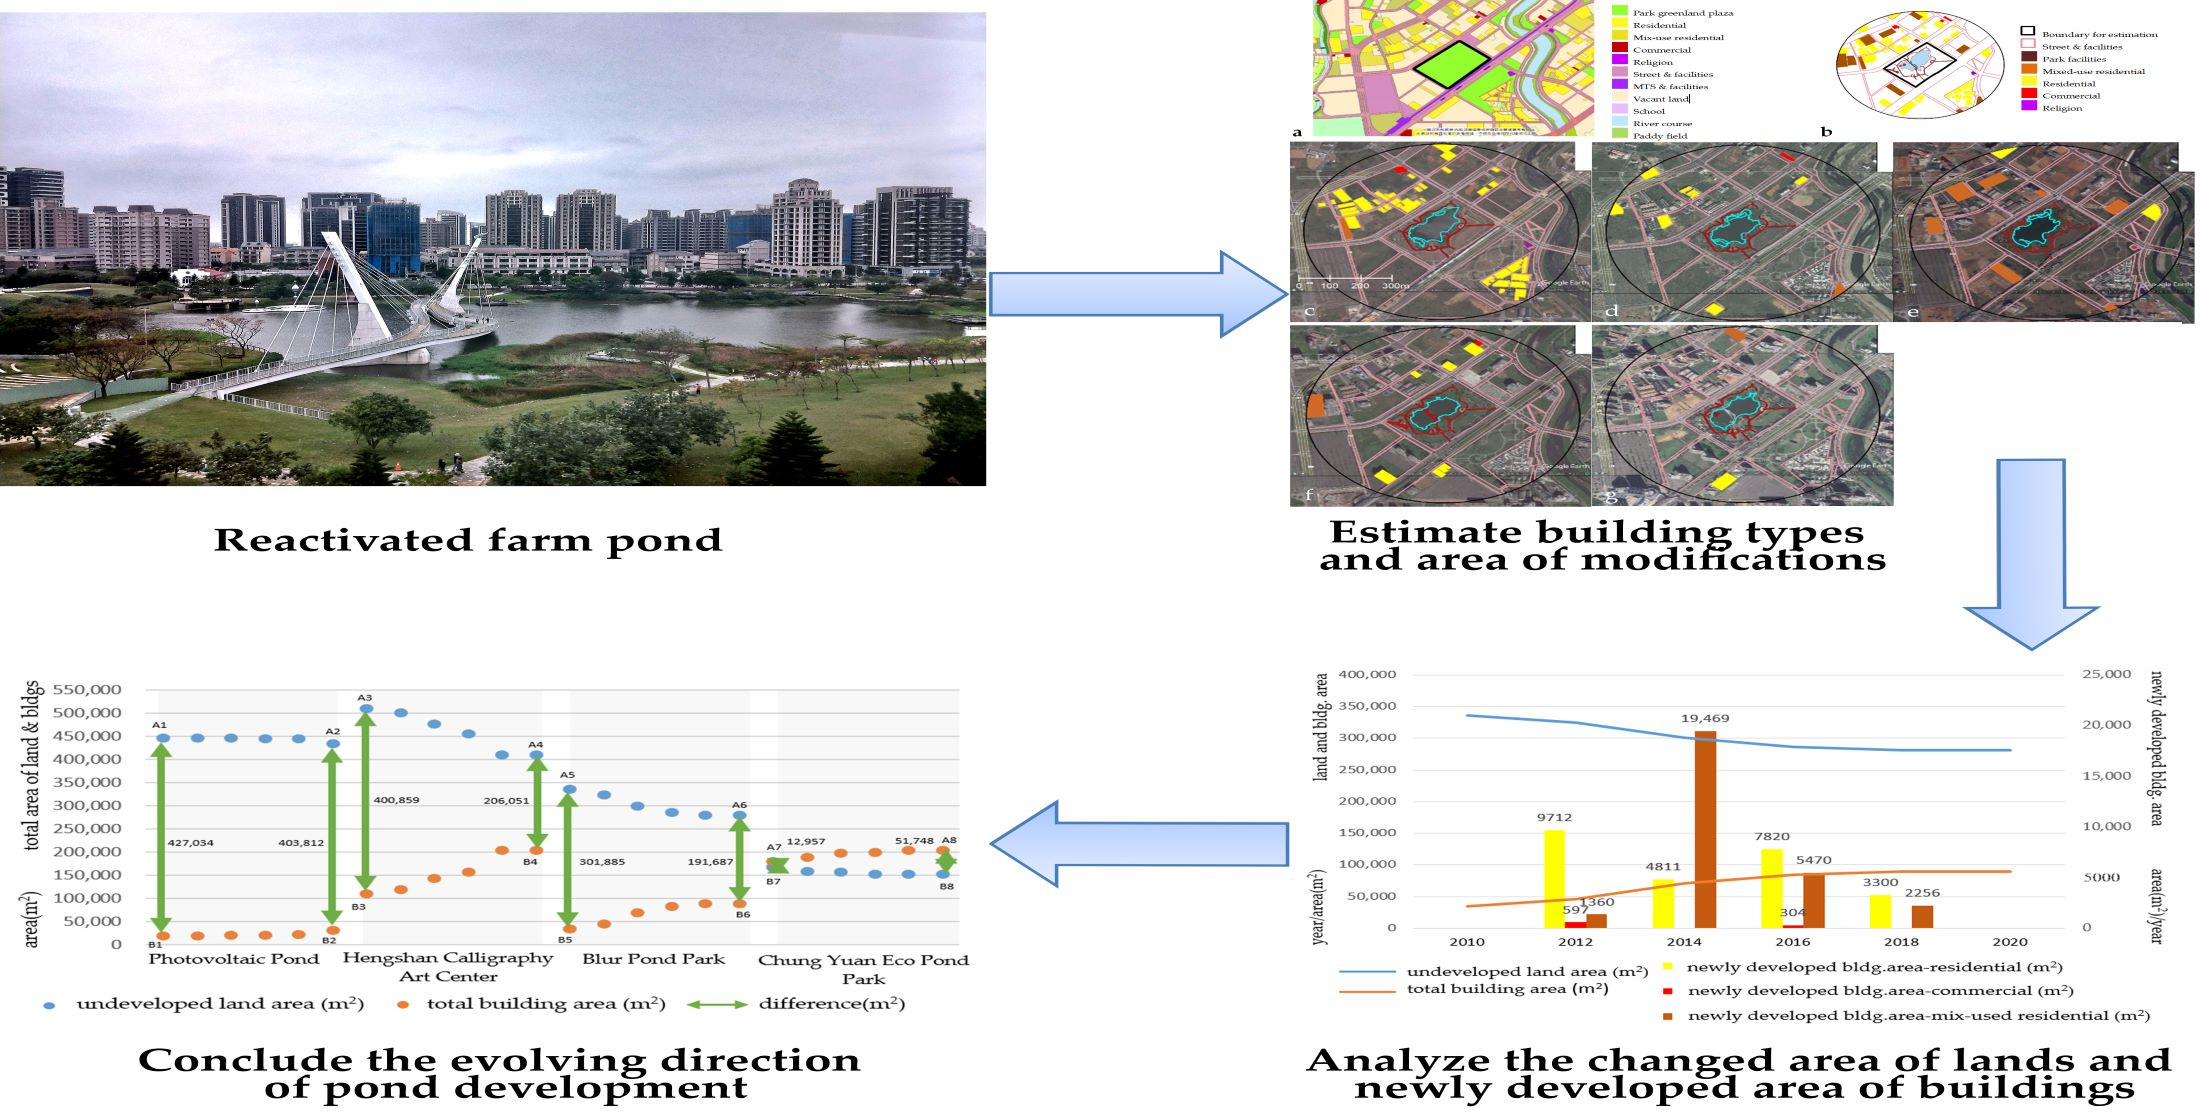
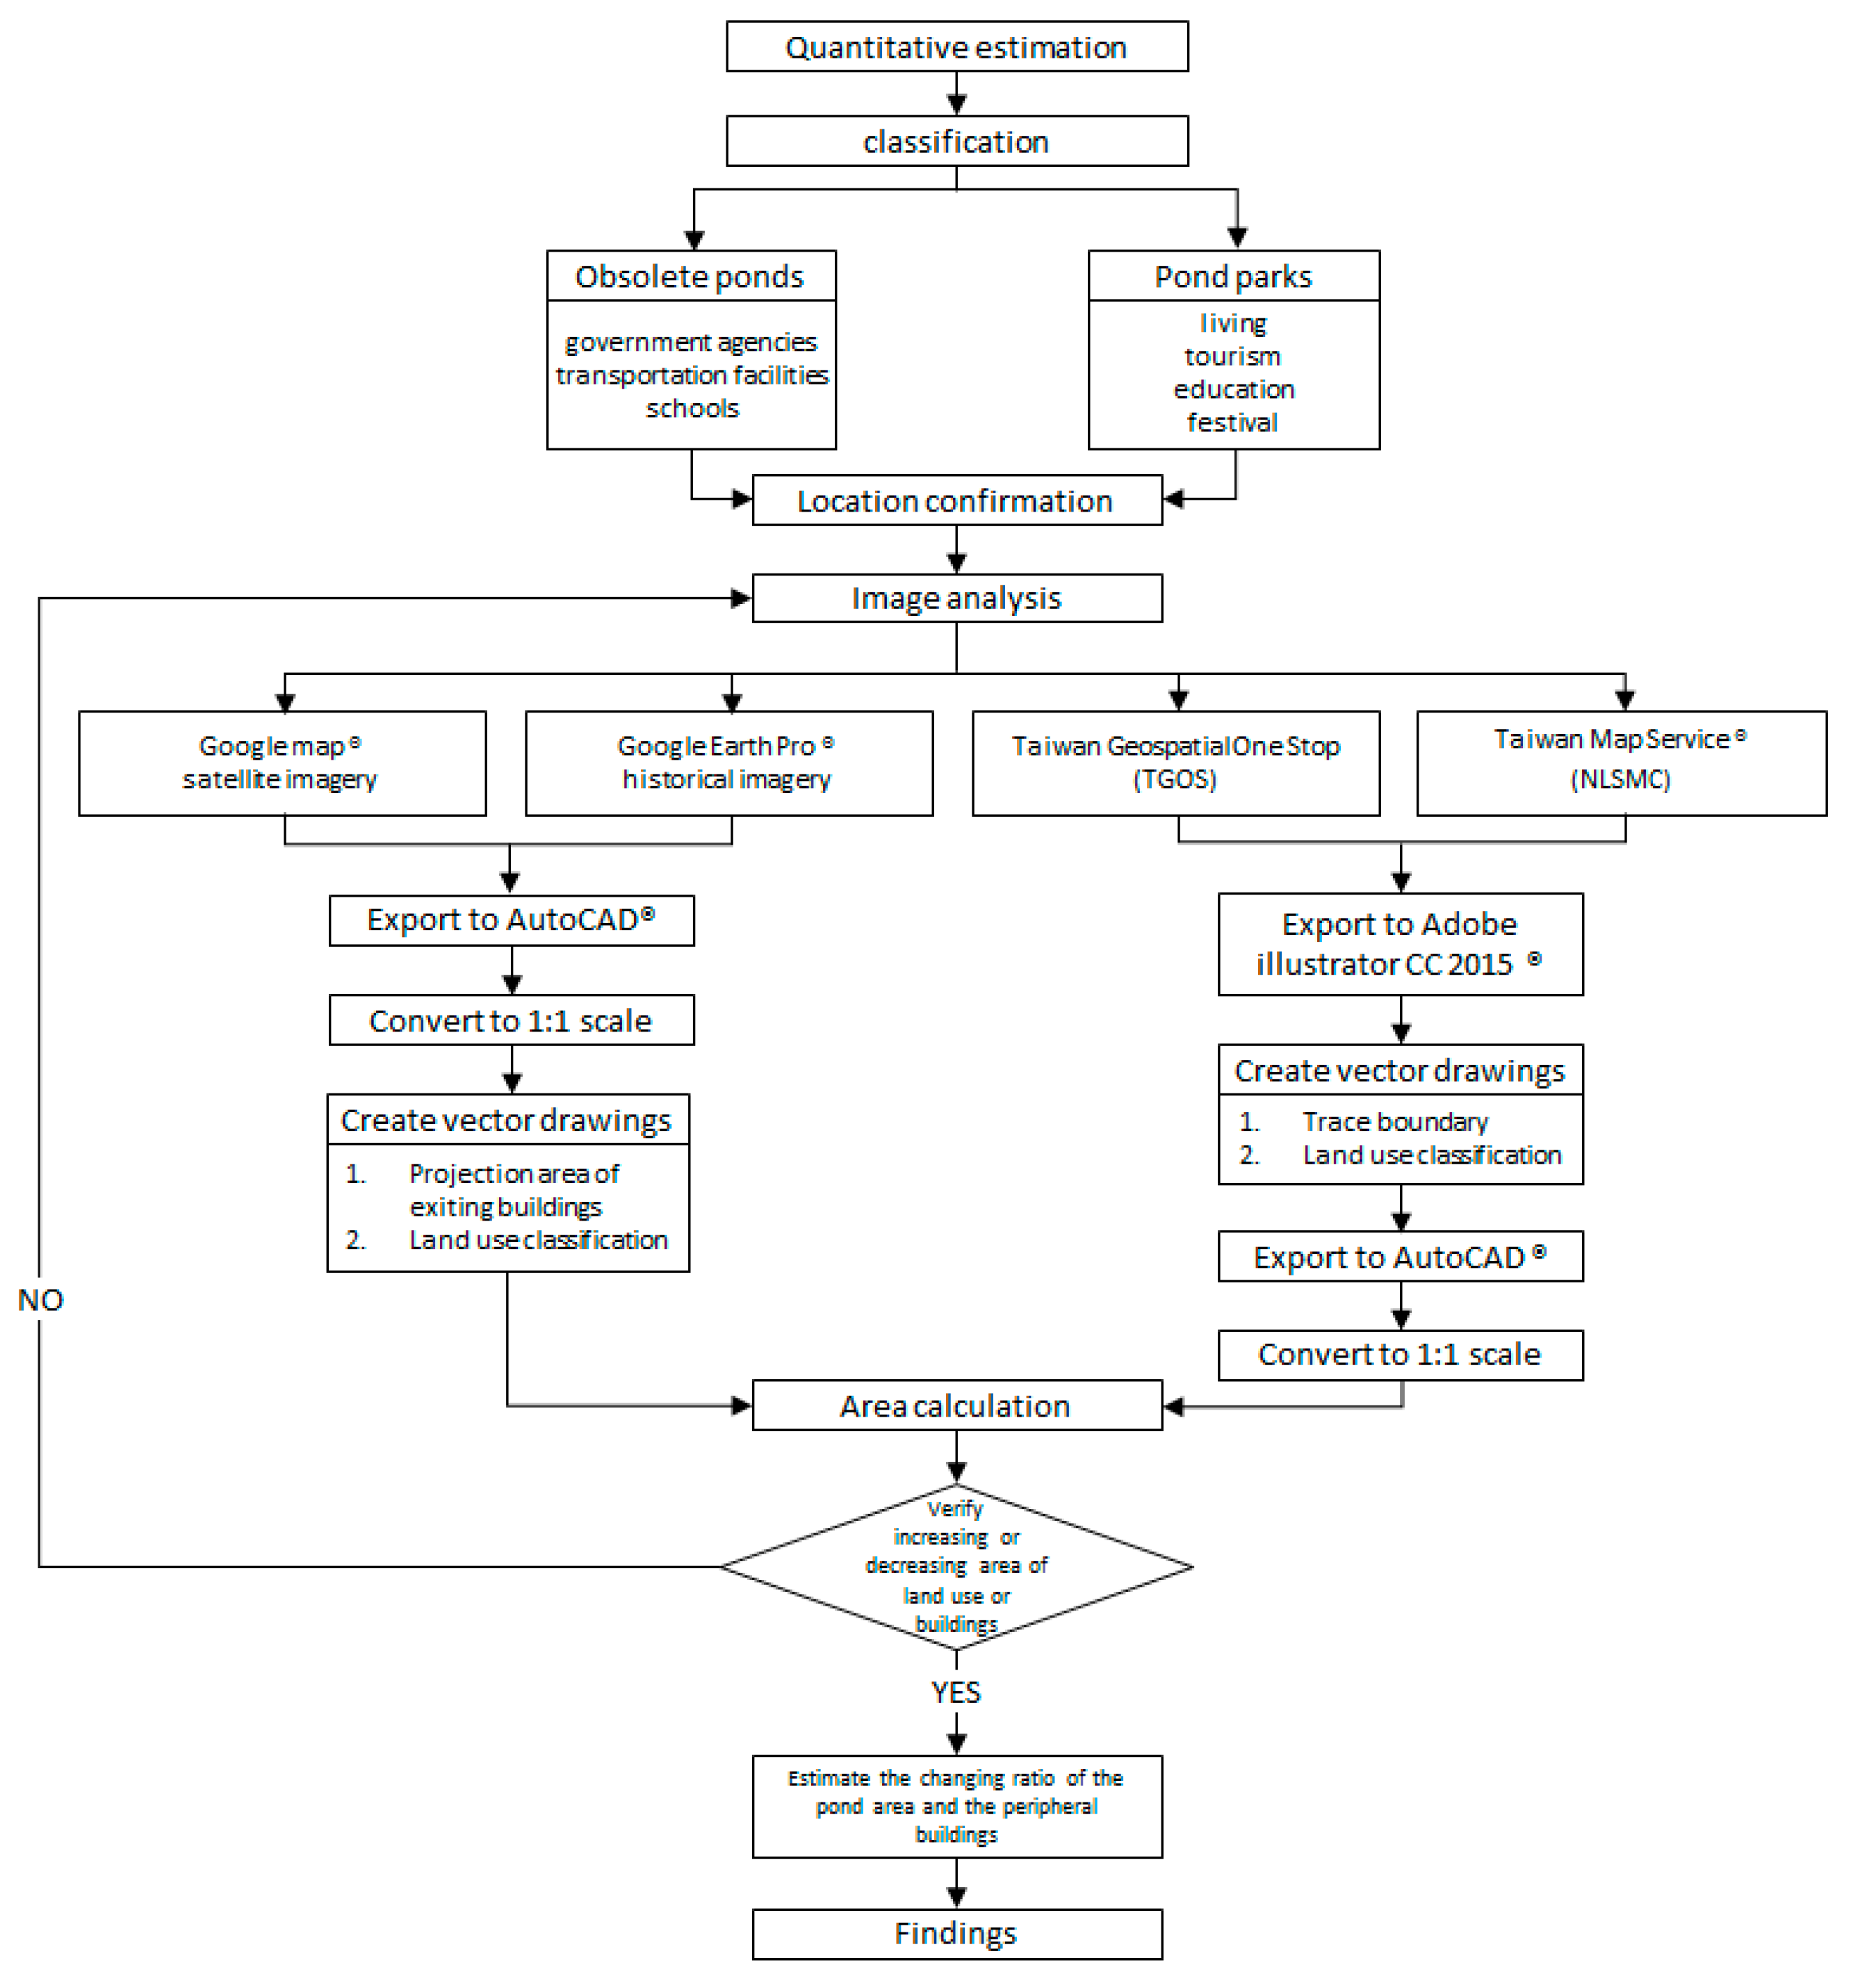
In order to correlate the historical development of the ponds, maps and satellite images were retrieved from the areas of different land and building types. Five types of maps and images were cross-referred, traced, exported, and estimated with areas to verify the increasing or decreasing area of land or buildings in order to determine the changing trends (Figure 2 and Figure 3). A 250 m boundary radius was encircled outside a pond or the park, roughly based on a 5 min walking distance at a speed of 100 m/min. The round boundary represents a closer relationship between the development and pond. The area actually displays an immediate impact on a pond, especially for buildings newly constructed in recent years. This is a pattern of development that should be of concern for the future development of other ponds.
The five types of maps and images are listed as follows.
- Digital topographic map, Department of Urban Development, Taoyuan City Government [41]: The enquiry and application webpage shows that cadastral maps are only available for the planned urban region in the same year. It was not clear if the content was updated each year.
- Taiwan Geospatial One Stop (TGOS), Urban and Rural Development Branch, Construction, and Planning Agency, Ministry of the Interior (MOI) [42]: Information from between 2015 and 2020 was referred to in order to check the zoning modification made to the classification of land use and whether matches were made between the construction types and classifications. The difference in area due to the modification of land use type was calculated to conclude the trend of regional development.
- Taiwan Map Service, National Land Surveying and Mapping Center (NLSC), MOI [43]: District maps of land use were retrieved and compared in 2006, 2010, 2012–2015, 2017, and 2019, and only the complete Taoyuan-related maps were available in 2006, 2010, 2017, and 2019. Due to the inconsistent illustration of color codes for land use between 2006 and 2019, cross-references had to be made with TGOS for newly updated data.
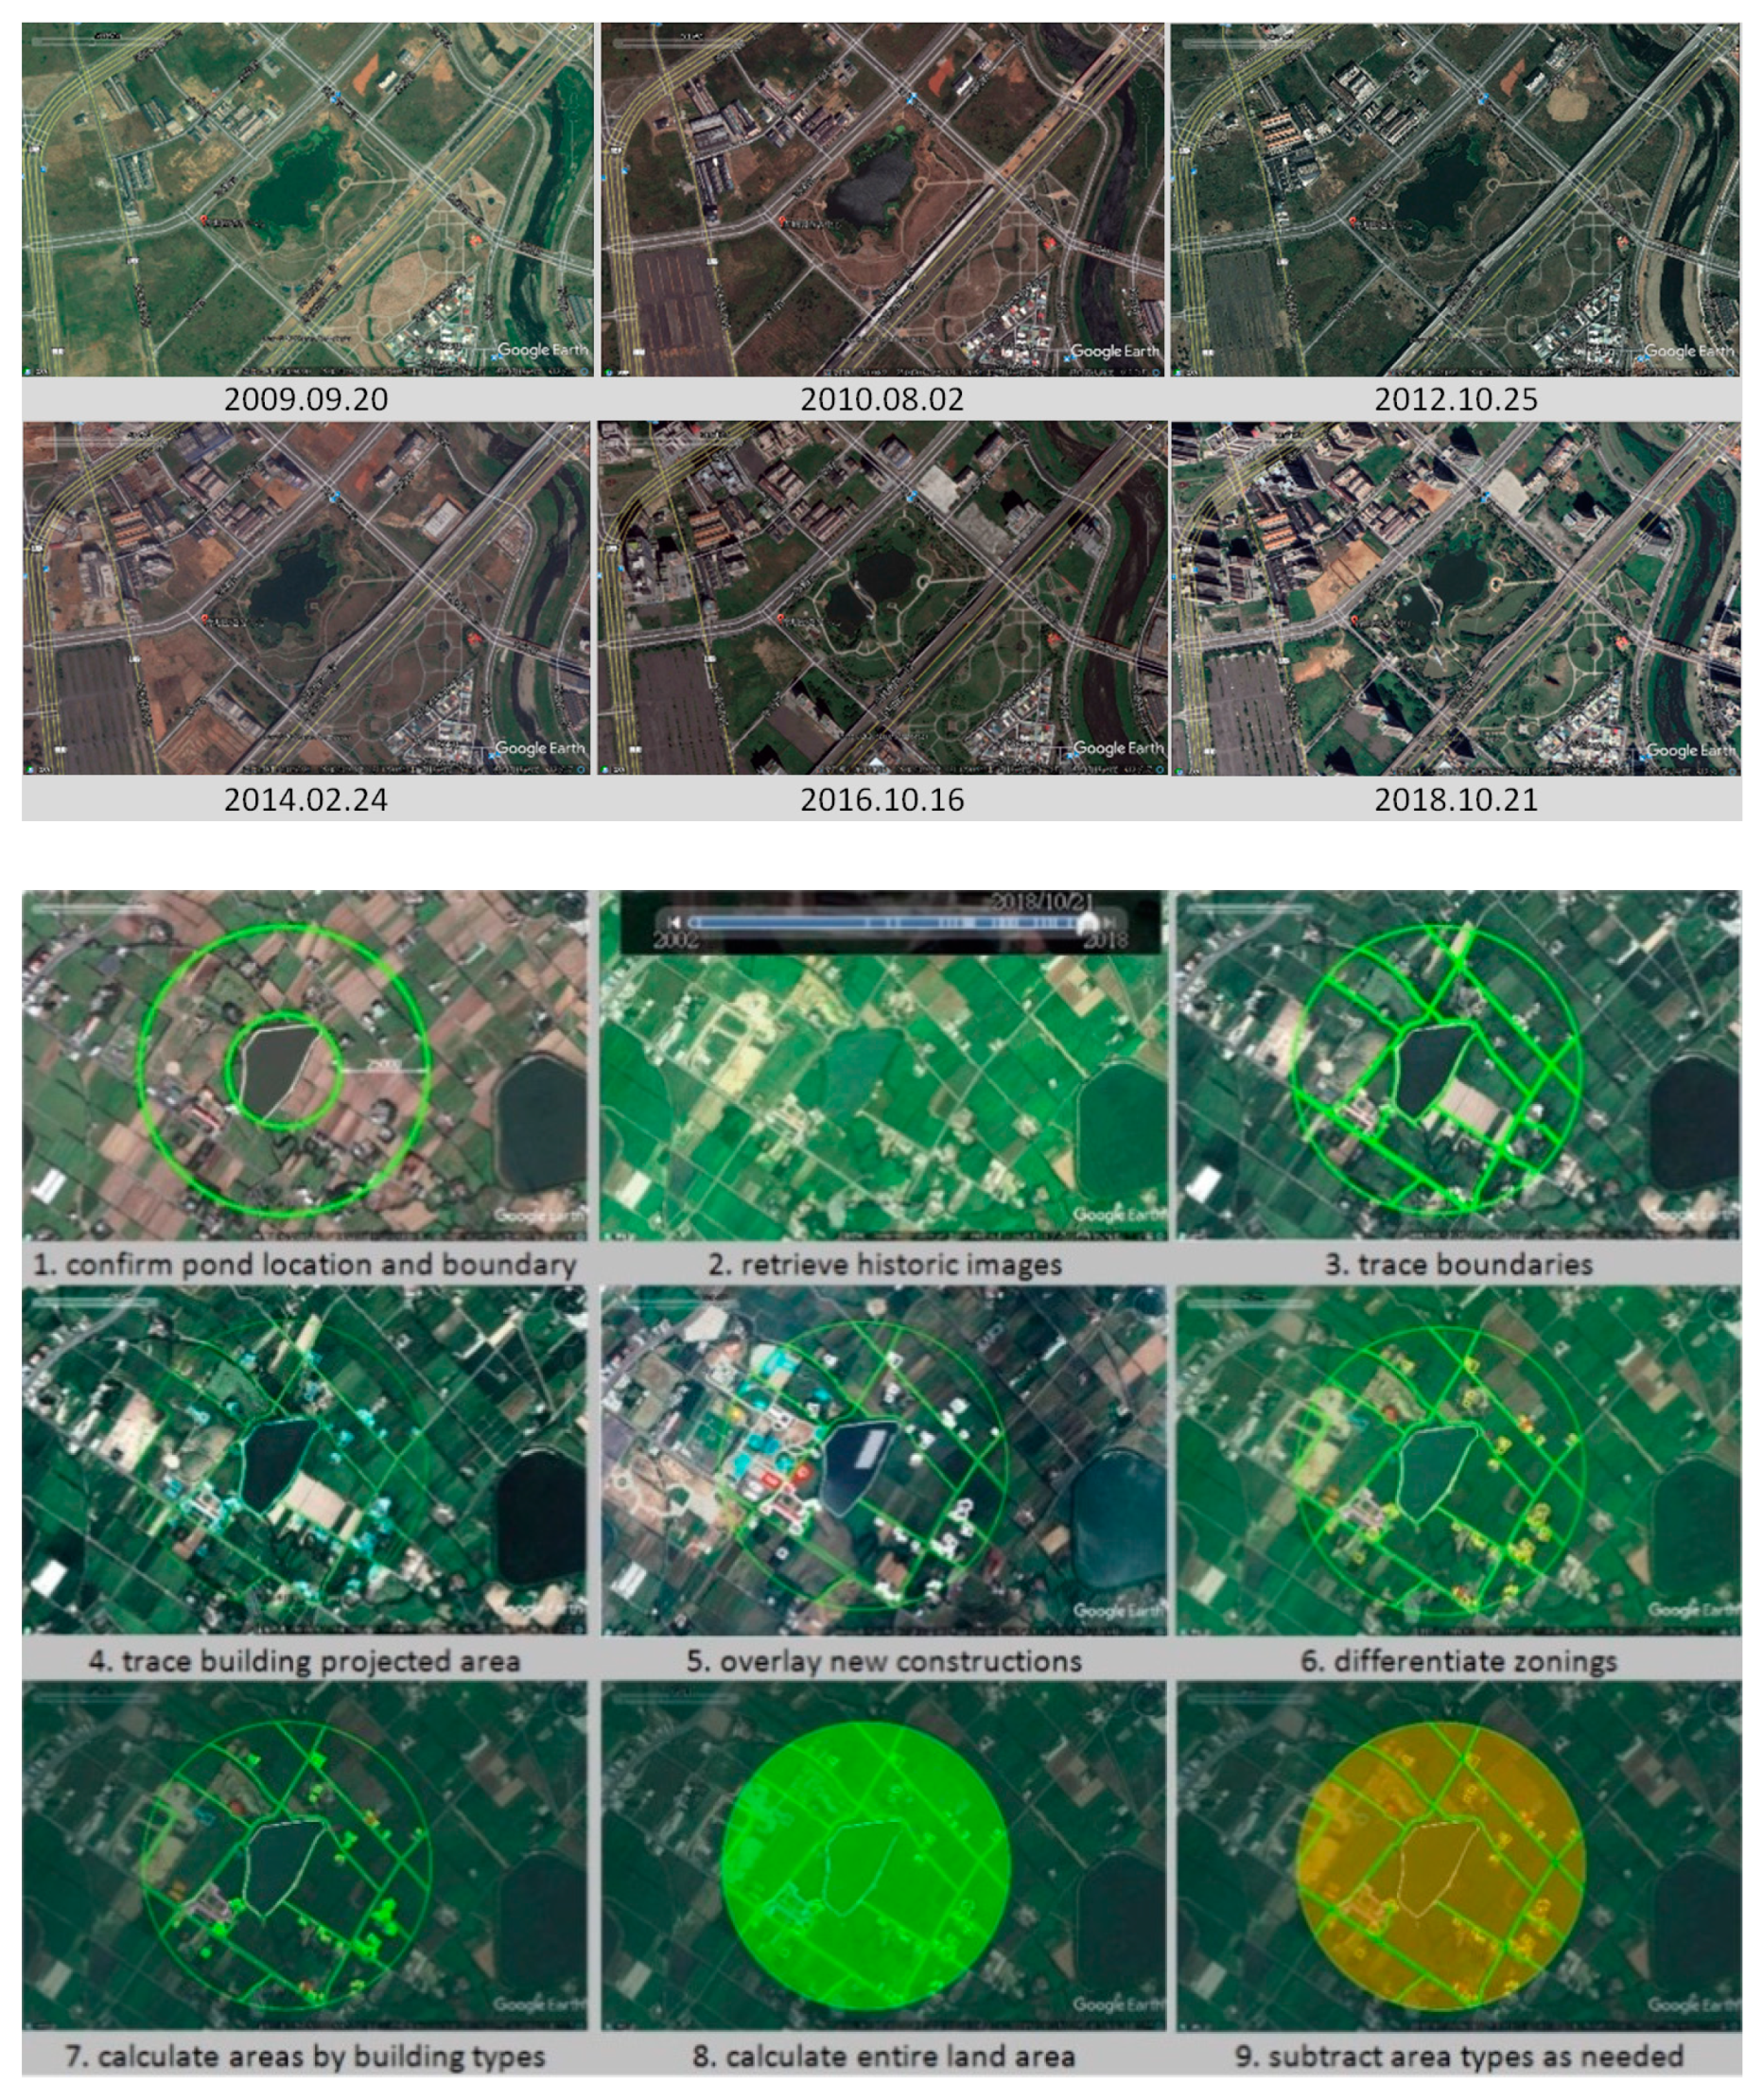
- Google Earth Pro: Historic satellite images were checked to calculate the area of increased buildings, reduced open space, and undeveloped land between 2010 and 2018 (Figure 3top). Images between 2002 and 2009 were missing.
- Google Maps: the most current aerial images were used to compare with the historic satellite images of Google Earth Pro as a reference for changes made between 2010 and 2020.
The classification is platform-dependent and can be different for each year. There are 167 classifications in 2016 and 57 in 2020. The latter was applied. The color for public facility, whose color was very close to that of government agency, was replaced by a blue color. The color for parks was replaced by a dark brown color. Land use (e.g., housing/mixed use) is listed next to the map.
The resolution at the 19th level of cadastral map tiles was about 0.3 m, close to 0.3 m per pixel. The standardized rendering pixel size at 90 dpi was 0.28 mm. The level of accuracy measured by area and distance was not confirmed and was used for reference only, since the maps came in different coordinates and went through a series of projections, overlays, and transformations between coordinate systems.
Selections of representative cases were mainly made for two ponds located near the Green Line of the Taoyuan Rapid Transit System and two apart from it in order to explore their potential relationship to the concept of transit-oriented development (TOD)—whether ponds are developed and influenced by the urban context and mass transportation system. Four ponds were selected for their individual history, designated role, and the major developing type of building around them. Each pond is surrounded by a specific urban fabric and thus creates a distinguishable pattern of development.
4. Historical Development of Ponds and Government Policies
The farm ponds in Taiwan were engineered to fulfill the irrigation demand, taking the specific regional topographic features, soil, hydrology, and river types into account. The irrigation area of the Taoyuan Canal is located to the west. The ponds planned by people in the past created an irrigation system for agriculture by taking advantage of rainwater and topographic features. The slope was changed from 1/40 to 1/120, which was sufficient to excavate the pond and irrigate land in the lower area. Extra water was consequently caught by the lower ponds.
The cultivated fields on the Taoyuan tableland are mainly made of clay-like red and yellow soil with limited permeability for water storage. There are more rainy days in winter than in summer. Rainfall is higher in summer than in winter. The rainwater in summer, which is short-term and has a high run-off volume, has to be stored in farm ponds for irrigation. Most of the rivers on the tableland are small, short, steep, flooded by heavy rain, low in the dry season, and for drainage only. The farm pond system was developed as an irrigation supplement to the rainwater and the small volume from stream water.
The farm pond system was developed in three stages (Figure 4):
- Stage one—before 1904: Ponds were privately owned due to the early cultivation of ancestors in the Quin Dynasty. A new drainage system was developed due to the reduced water resources caused by the fault subsidence of the Taipei Basin.
- Stage two—between 1904 and 1945: The main ponds were owned by the government during Japanese colonial rule. The Taoyuan Canal was planned and constructed by the Japanese in 1919. Upon the completion of the canal, the number of ponds was decreased from 285 in 1924 to 231 in 1928.
- Stage three—after 1945: The completion of the Shimen Canal (1963) and Shimen Reservoir (1964) contributed a sufficient water supply. Although 460 ponds were kept in the Shimen irrigation area, many ponds were abolished or demolished due to urban development, public construction, the new irrigation system, and the integration of land and water resources along the Taoyuan Canal. Figure 5 illustrates the current distribution of ponds in Taoyuan.
The maximum number of ponds reached over 10,000 and was reduced to 8845 after the completion of the Shimen Reservoir [48]. Currently, less than 3000 ponds exist. Based on the data released from the Taoyuan City Government, a survey carried out by the National Wetland Conservation Project in 2011 concluded that there were 2851 ponds covering 2599.73 hectare in Taoyuan [49]. The Taoyuan Canal was made of 12 branches and 257 ponds. Some were filled and leveled for the construction of new communities, parks, schools, and government agencies (Table 1).
The Wetlands Conservation Act [51] defines the suitable development pattern for ponds. It demands zero reduction in important wetlands with guidelines for the planning and review of any development. Designated construction materials should be applied. The act presents a national policy that each region has a detailed version of for the adaption of local conditions, for example, the Jianan Canal System was planned as a main irrigation system in southern Taiwan [52].
The erosion of resilience in an old ecosystem is an ecological crisis [53]. As a part of wetlands, pond-related concerns led to the initialization of the wetland act and the pattern of development for pond resilience [54]. A suggestion was made regarding the maintenance, conservation, and restoration of ponds to improve poor water quality [55]. Related studies were also conducted by central and local governments for the planning of databases, activation patterns, and demonstrations by the Water Resources Agency, Ministry of Economic Affairs [56]. Recently developed canals have created links and revitalized the local ecology system. The revitalization was specified in a detailed urban plan as part of the development strategy for a specific Taiwan High Speed Rail (THSR) district. Two pond parks, the Blue Pond Park and Calligraphy Art Center, were planned specifically and correlated to the future development of a specific district near the Taiwan High Speed Rail station in Taoyuan [57].
Farm ponds represent the chronological development of sustainability and resilience in the local environment. Policies and detailed plans were issued by the government to revitalize ponds annually to a green environment.
- 1.
- Greening and beautification policies:
Farm ponds were created for the purpose of irrigation and water distribution. To achieve a balance between natural ecosystems and engineering benefits for the best flood management design and water control awareness, debates were conducted between a non-engineering remediation of an ecological conservation group and a group that prefers the engineering-oriented control of water resources. The development of water resources is relevant to the corporate local tourism and leisure industry. A series of greening and beautification projects was conducted (Table 2) and gradually changed the perspective of ponds by two measures.
- Maintenance and management: the prerequisites for the policy’s success or failure are determined by how the follow-up maintenance and management will be implemented.
- Contents: the policies should consider the impact of local climate, humanistic conditions, and residence intentions, in addition to the constructions made around a pond, through the measurement of height, width, side slopes, and pavements.
- 2.
- Pond revitalization and rejuvenation plans:
Plans were begun by the Division of Urban Design under the category of Landscape Planning and Engineering Renovation between 2014 and 2016. Since 2012, it projected that three pond parks would be revitalized per year, with 10 in three years (Table 2).
5. Case Studies for Developing Patterns
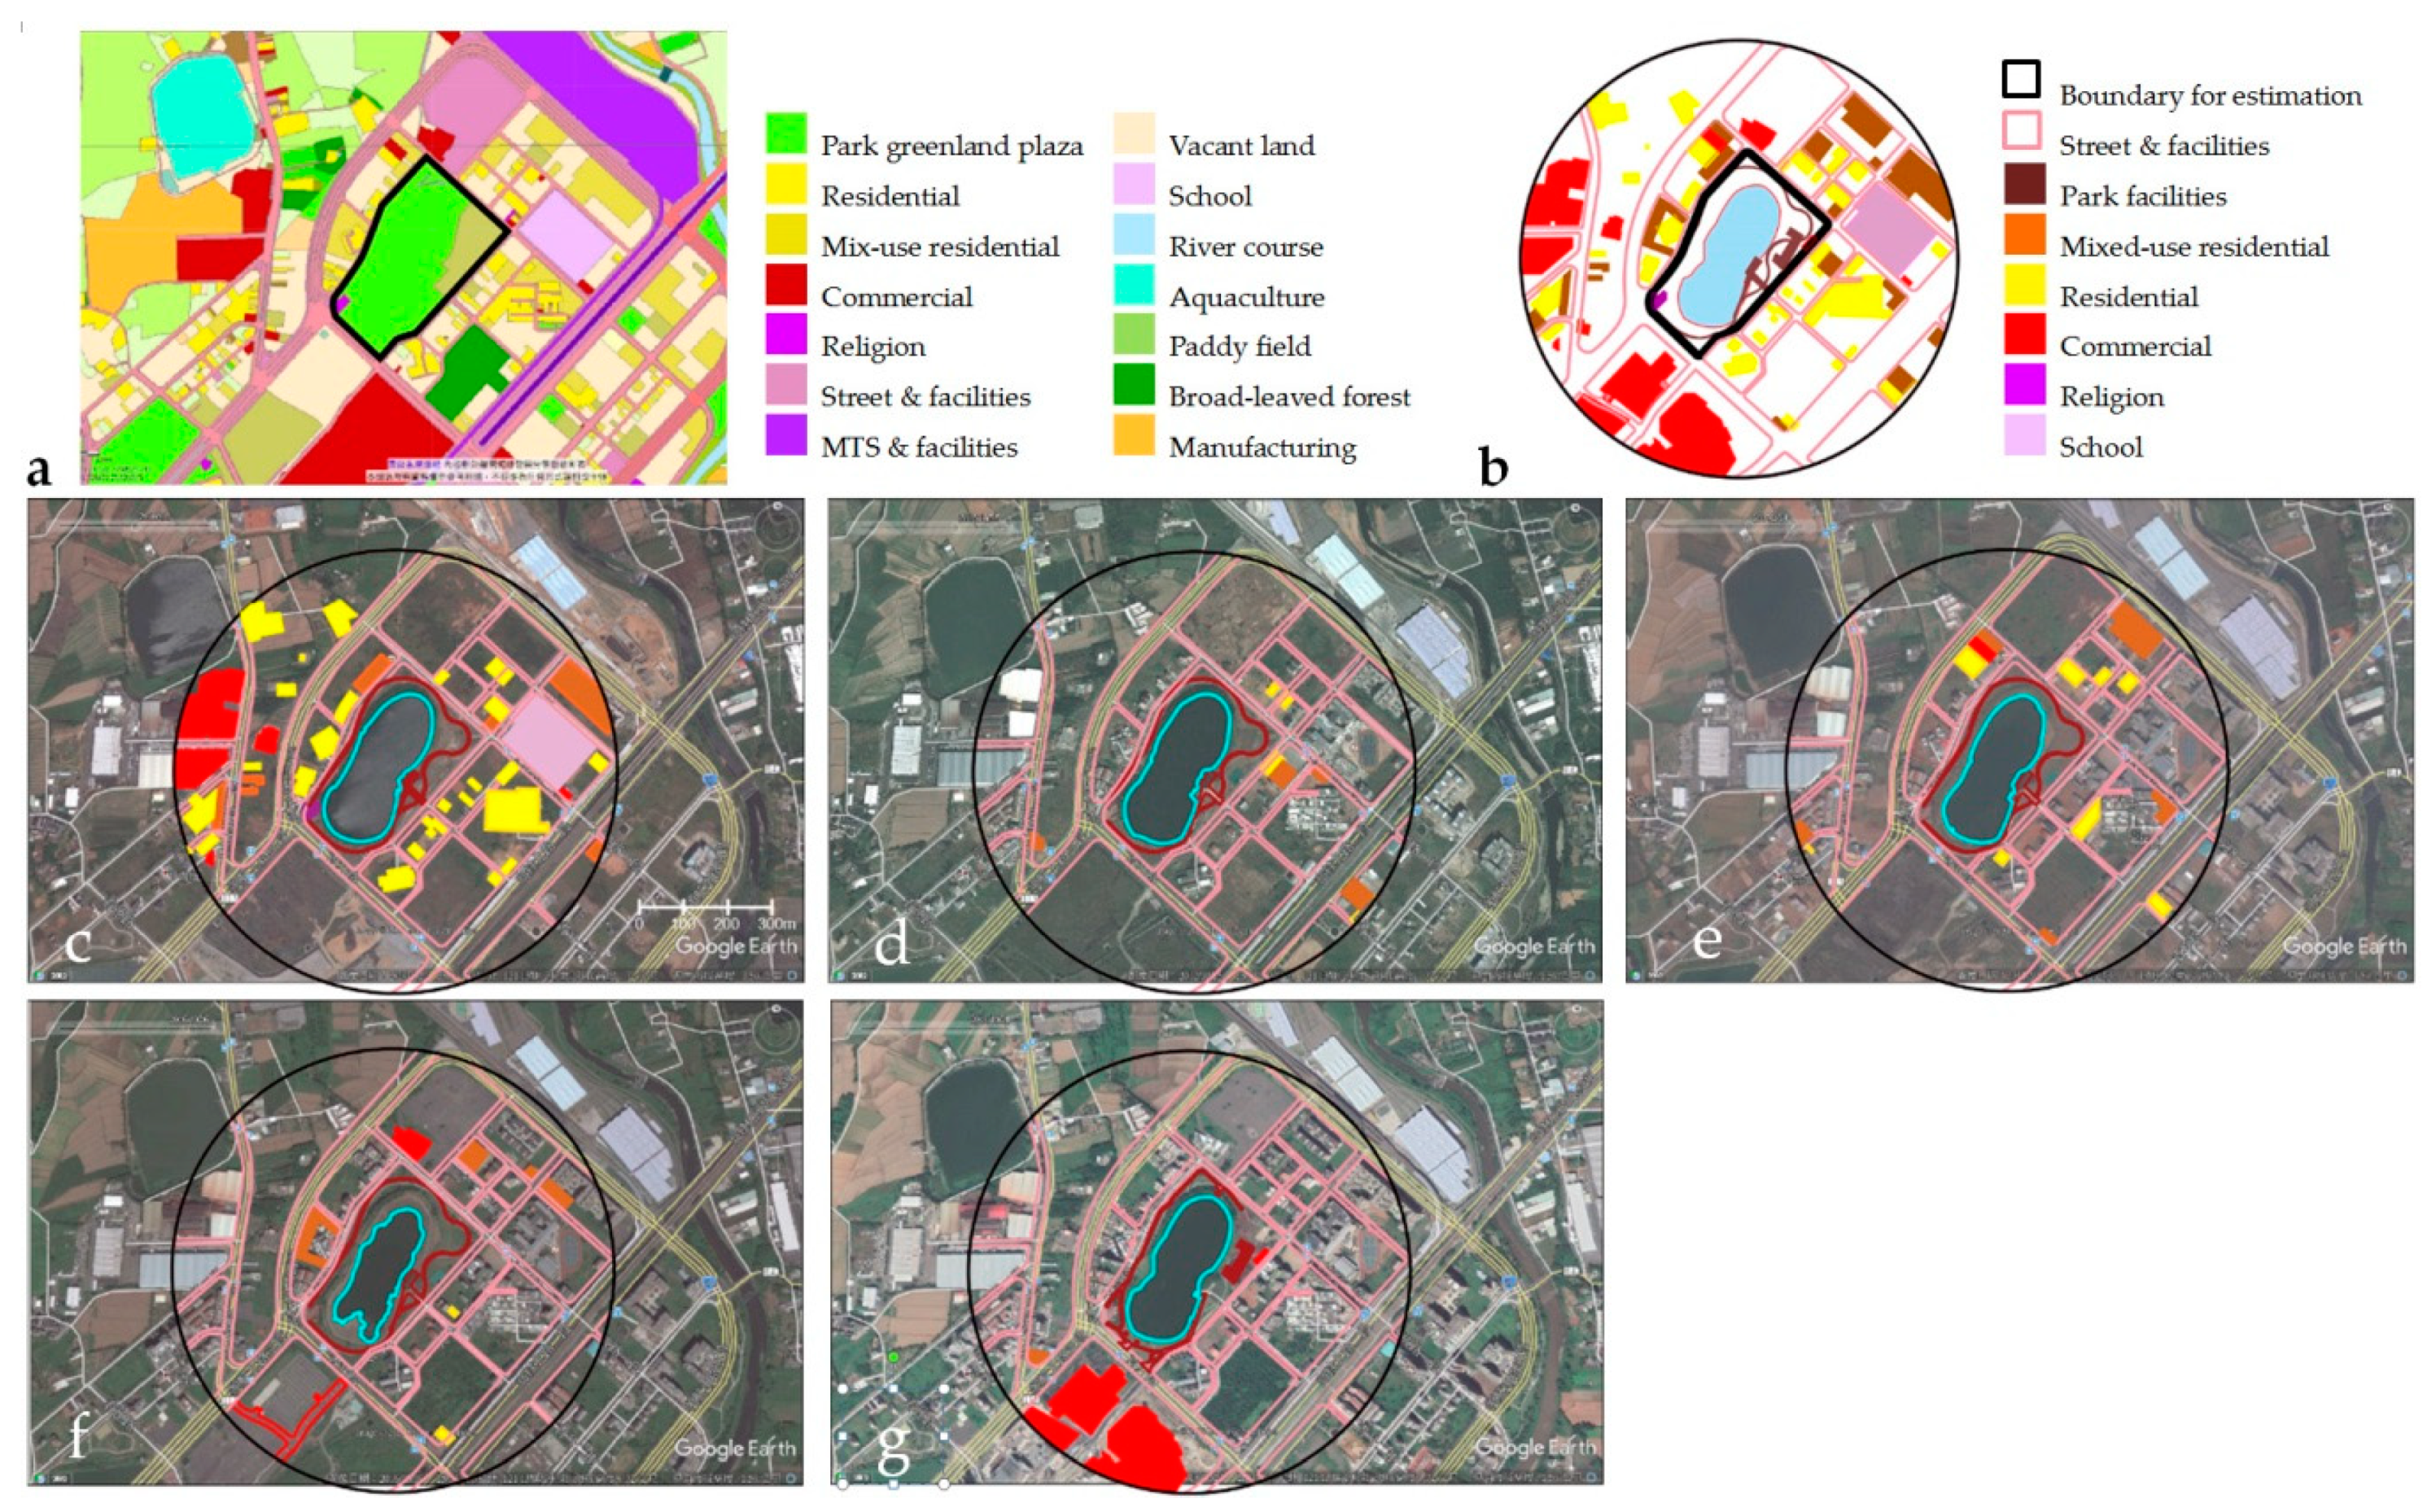
The case studies are represented by two major parts: the evolved morphology of land use cross-referred by maps and satellite images, and a chart illustrating the changed trend of lands and the newly added or developed area of building types next to a pond. The color code for mixed-use residential development was darkened purposely to differentiate it from residential building types (b) in land cover. The colors of public facilities and park facilities were not related to the color code and were added for illustration only.
5.1. Blue Pond Park
Blue Pond Park was the first eco park in Taoyuan since 2007. It went through a second renovation in 2014, with a new tourist center constructed in 2016 (Figure 6). It was one of the sightseeing locations promoted by the government and the first demonstration park for new development, with jointed lantern sites used during the 2016 Taiwan Lantern Festival. During the cultural event, a water show was deployed and surrounded by lotus lanterns next to the stages and cable-stayed bridge in the center of the pond.
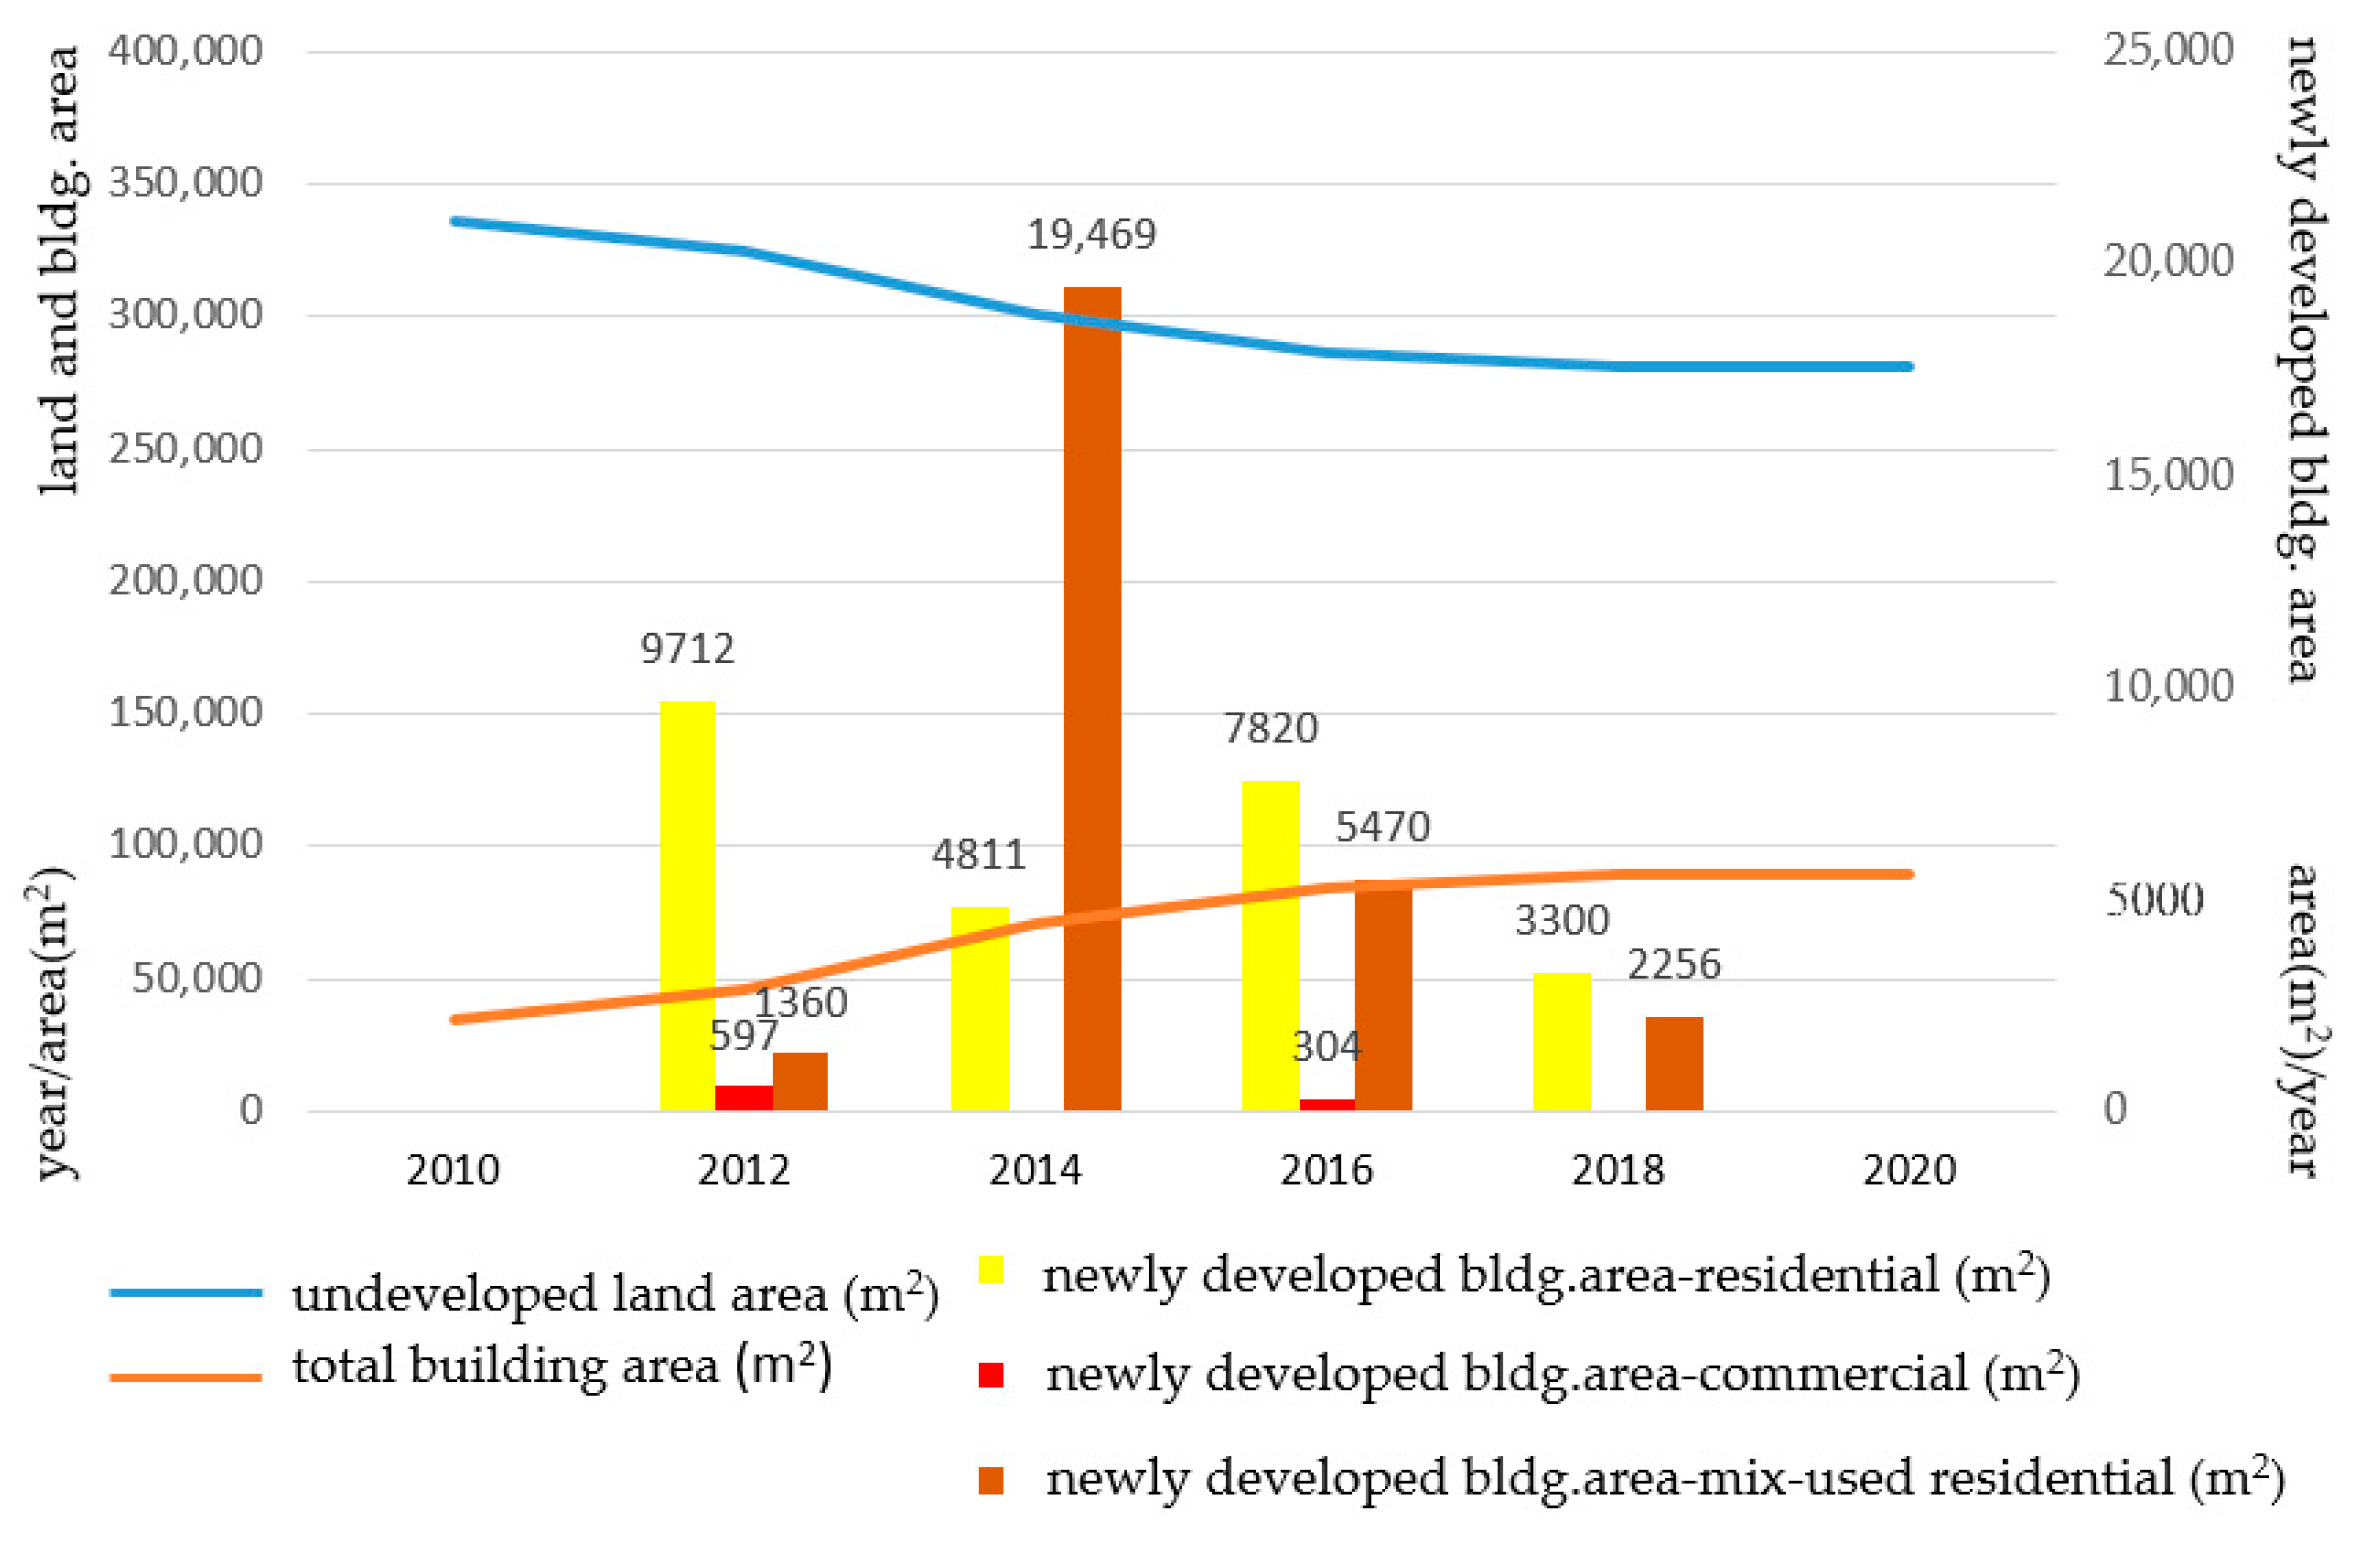
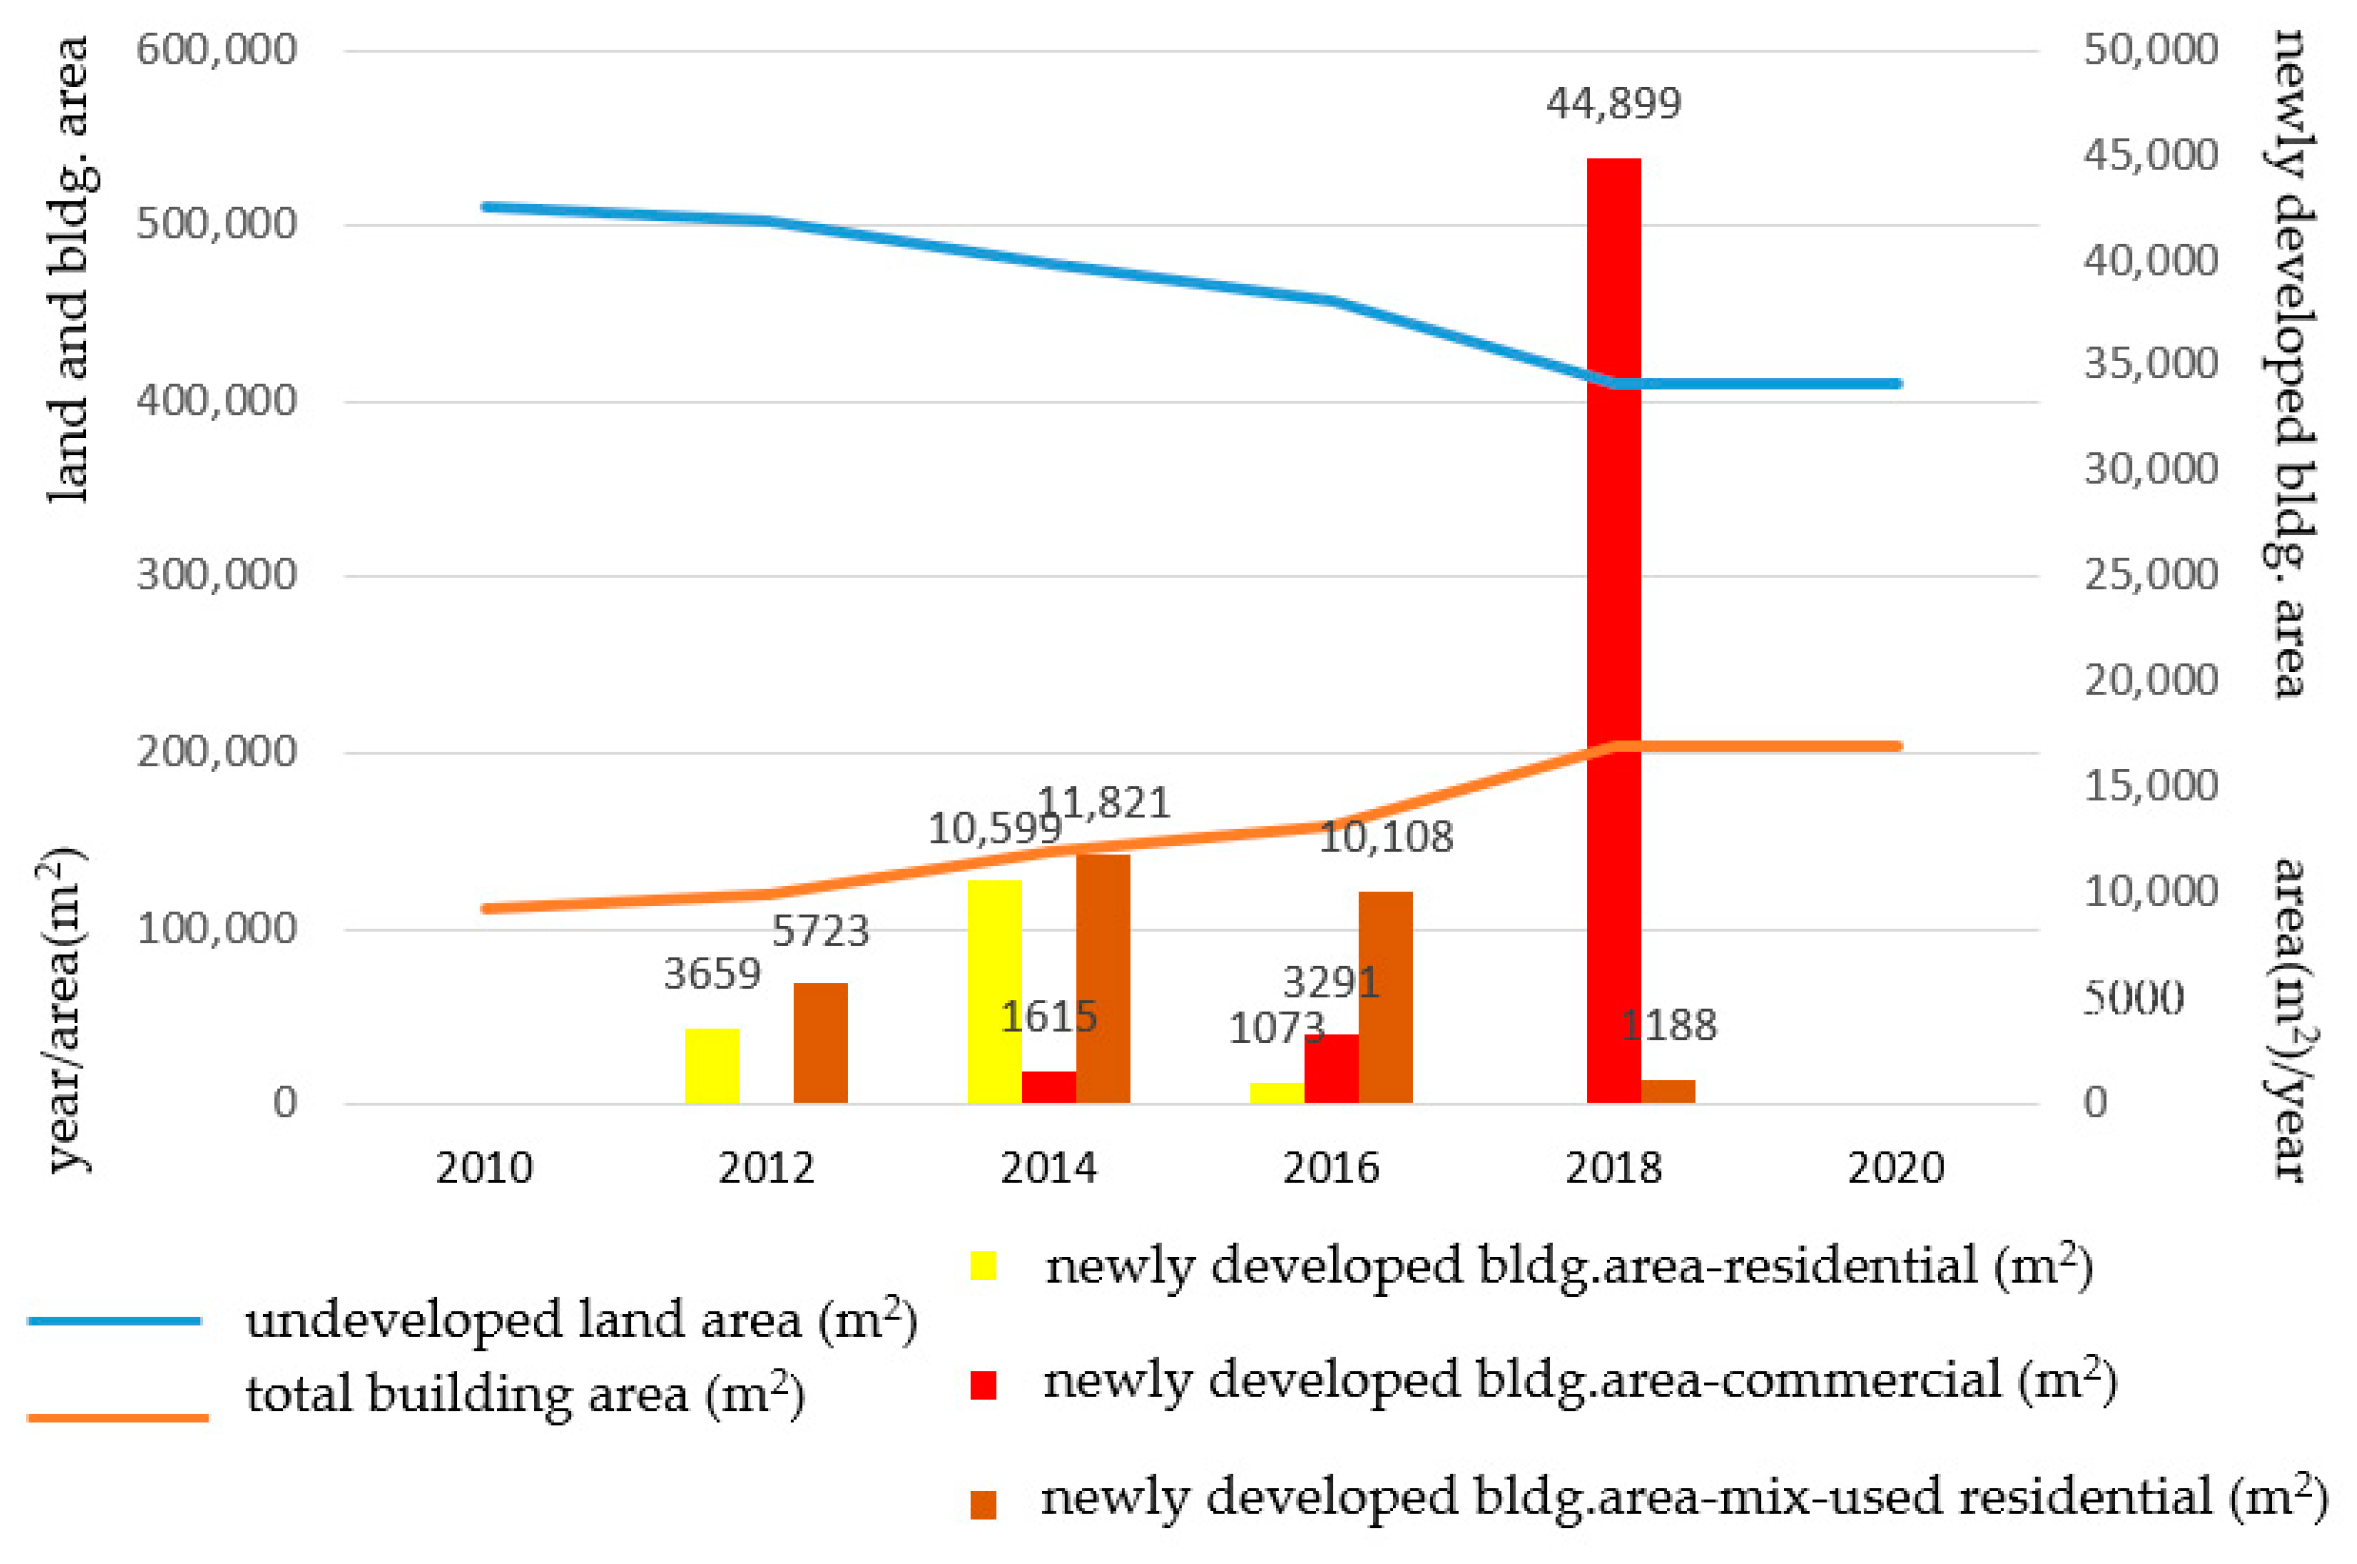
This park covers about 67,806 m². The area within the boundary of 250 m in semi-diameter was made up of 132,219 m² of street and 336,424 m² of undeveloped area in 2010. The construction area was mainly increased between 2012 and 2014 (Figure 7) and used for residential and mixed-used buildings. In 2016, 1723 m² of building construction was added. In 2018, a newly constructed area was added as the installations kept from the Taoyuan Land Art Festival. The total building area increased 4.8% from 2012 to 2014.
Residential buildings were the main type of construction added around the park. The mixed-used areas, which were increased mostly in 2014, were large-scale residential buildings with a ground floor for commercial use. The area of commercial buildings remained the same, and most of them were allocated within residential areas.
5.2. Hengshan Calligraphy Park Developed
The Calligraphy Park, which is centered on farm pond no. 5-8 of the Taoyuan Canal, was constructed between 2018 and 2020 (Figure 8). It consists of the calligraphy building (2970 m²), pavements (6160 m²), and the Village God Temple (979 m²). The area of buildings and streets was analyzed within the boundary, with the open area reduced from 110,742 m² (Figure 9) of buildings and 511,601 m² of undeveloped area in 2010 to 502,219 m² in 2012. The open space in the south was graded and prepared for theaters and boutiques in 2016, and about 44,899 m² of building area was added in 2018 as a large-scale commercial space. The street area increased 4%.
Due to the large amount of undeveloped area and the recent development of Qinpu District, the ascending rate of building area and the descending rate of open space may intersect in the near future. Residential buildings contributed to the main type of construction. The mixed-used areas were residential buildings with a ground floor for commercial use. The area of residential buildings increased significantly in 2014 to 144,159 m².
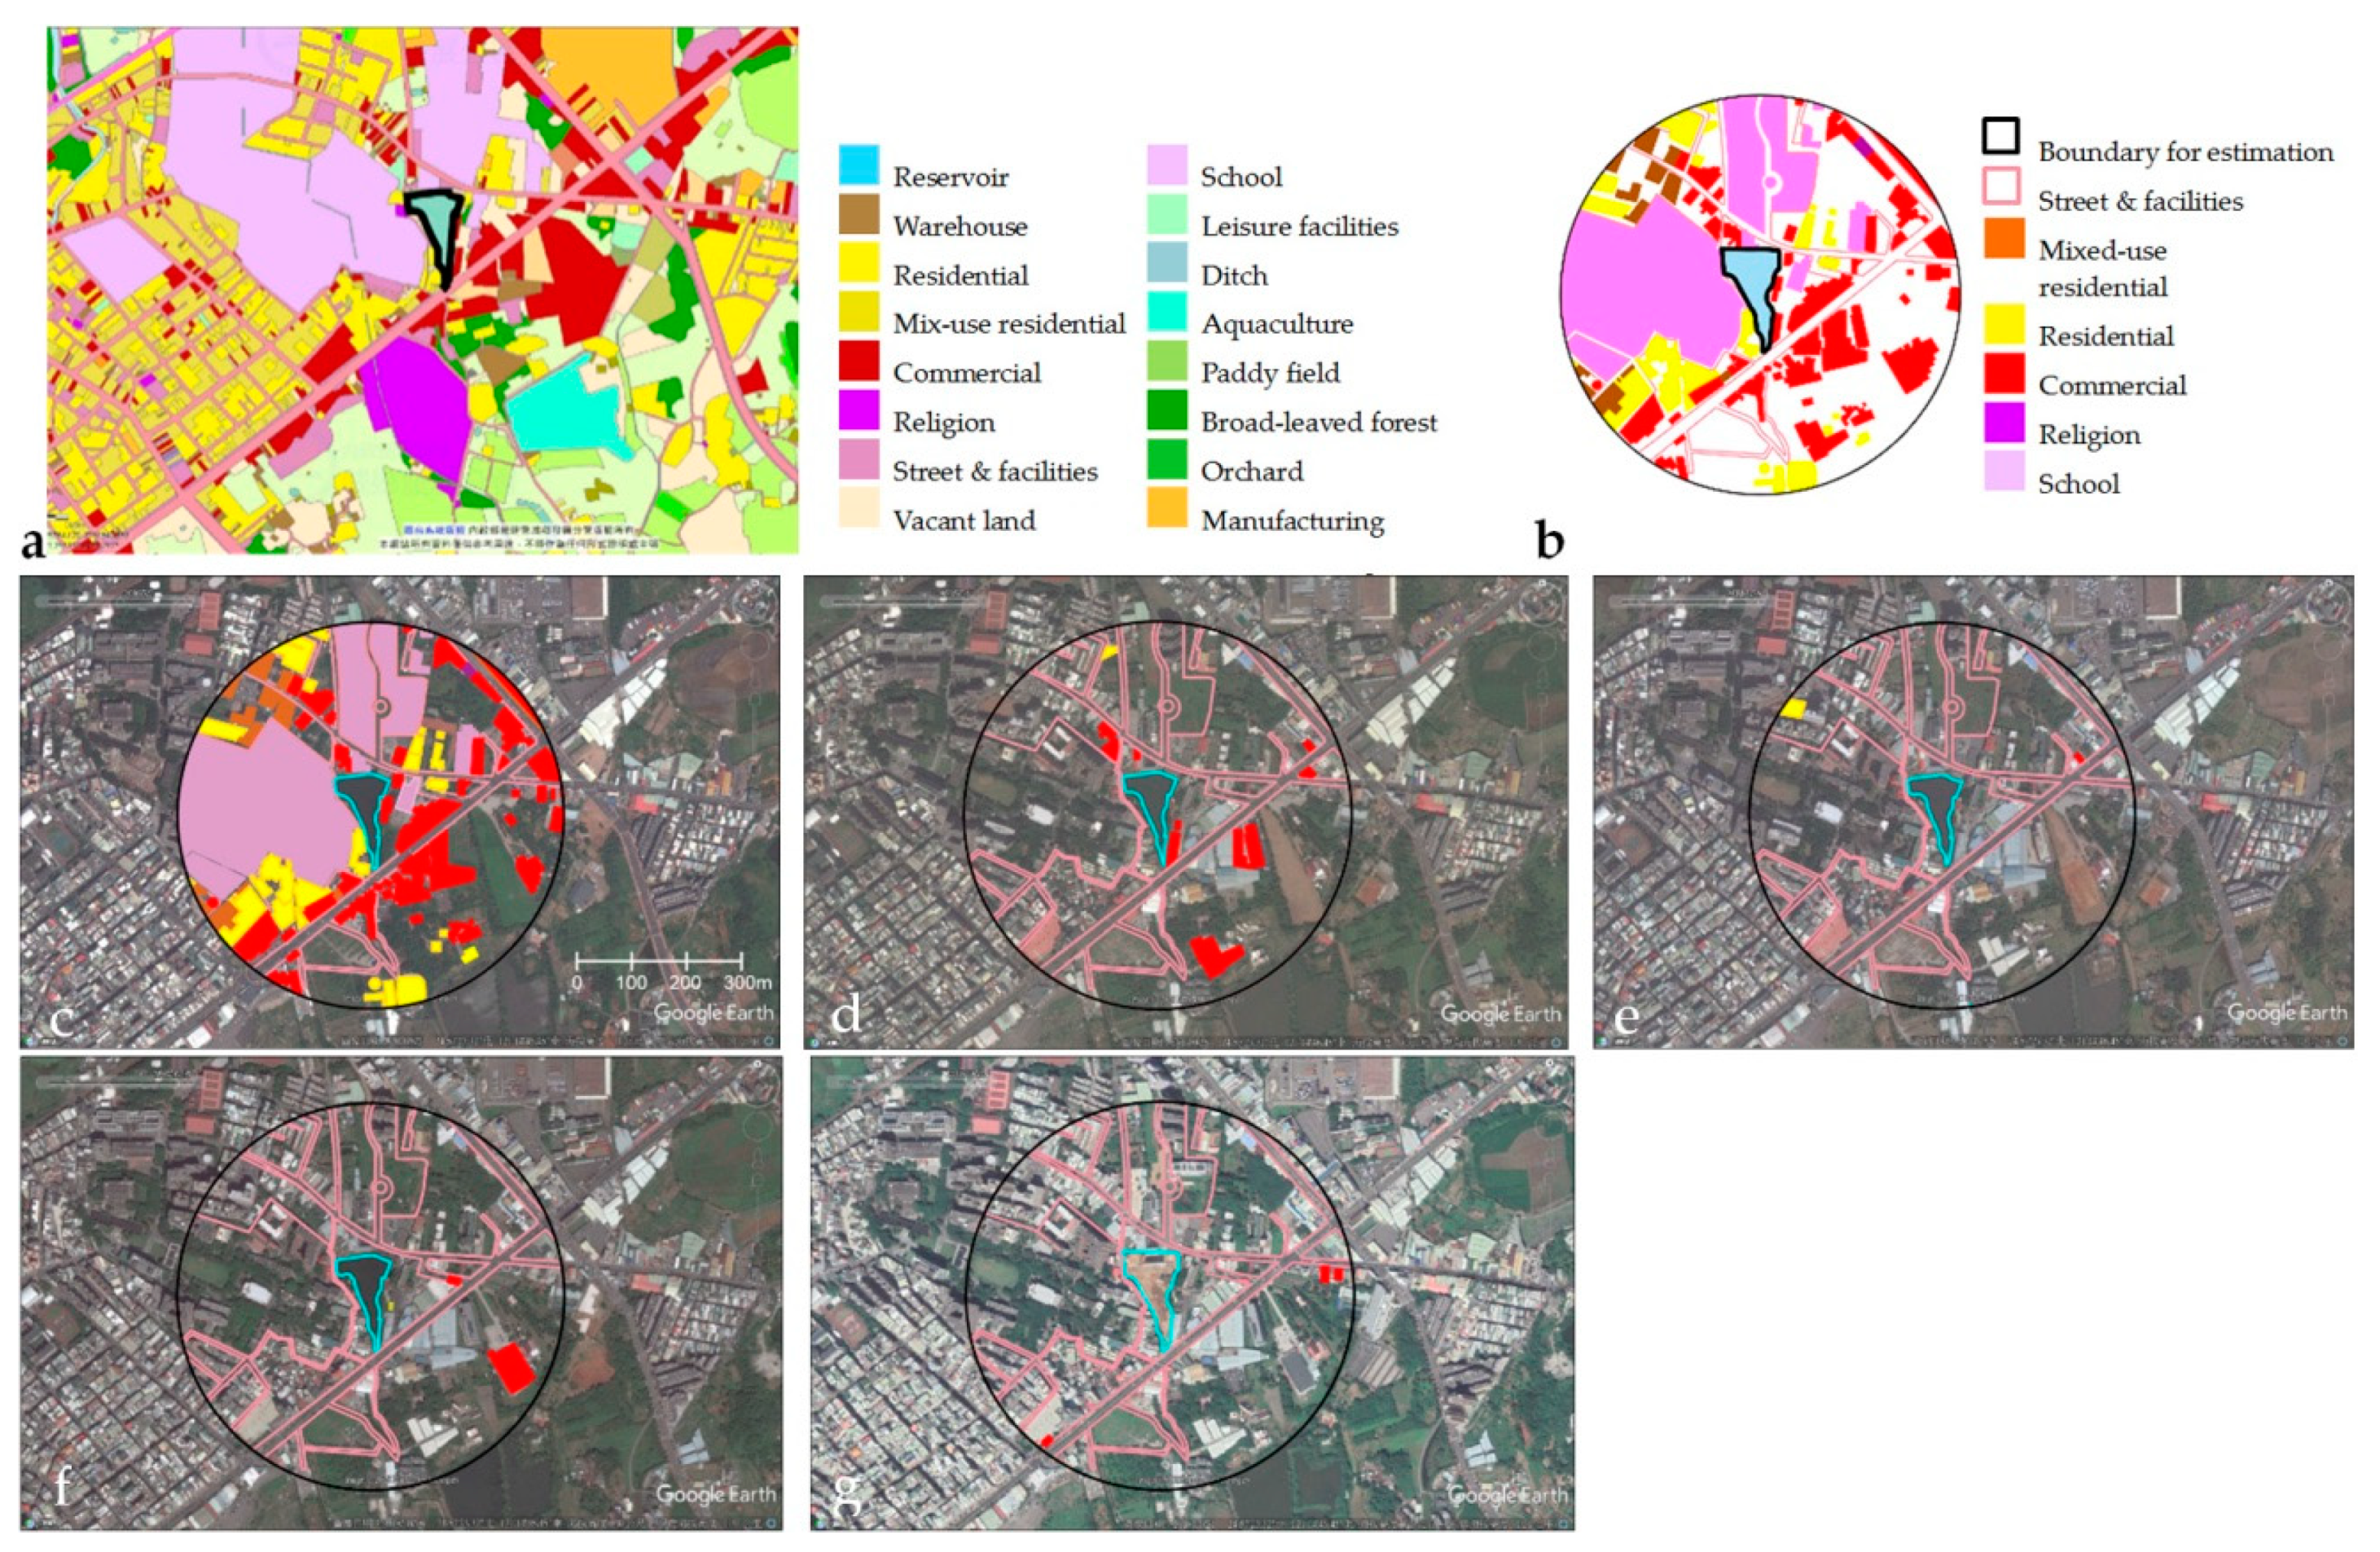
5.3. Chung Yuan Eco Pond Park
Chung Yuan Eco Pond Park is located next to the campus of Chung Yuan Christian University. The area has been well-developed since 2010 (Figure 10). New constructions were added to the open space within this region continuously. Since almost half of this area was occupied by the campus, the total area was relatively smaller with the campus excluded.
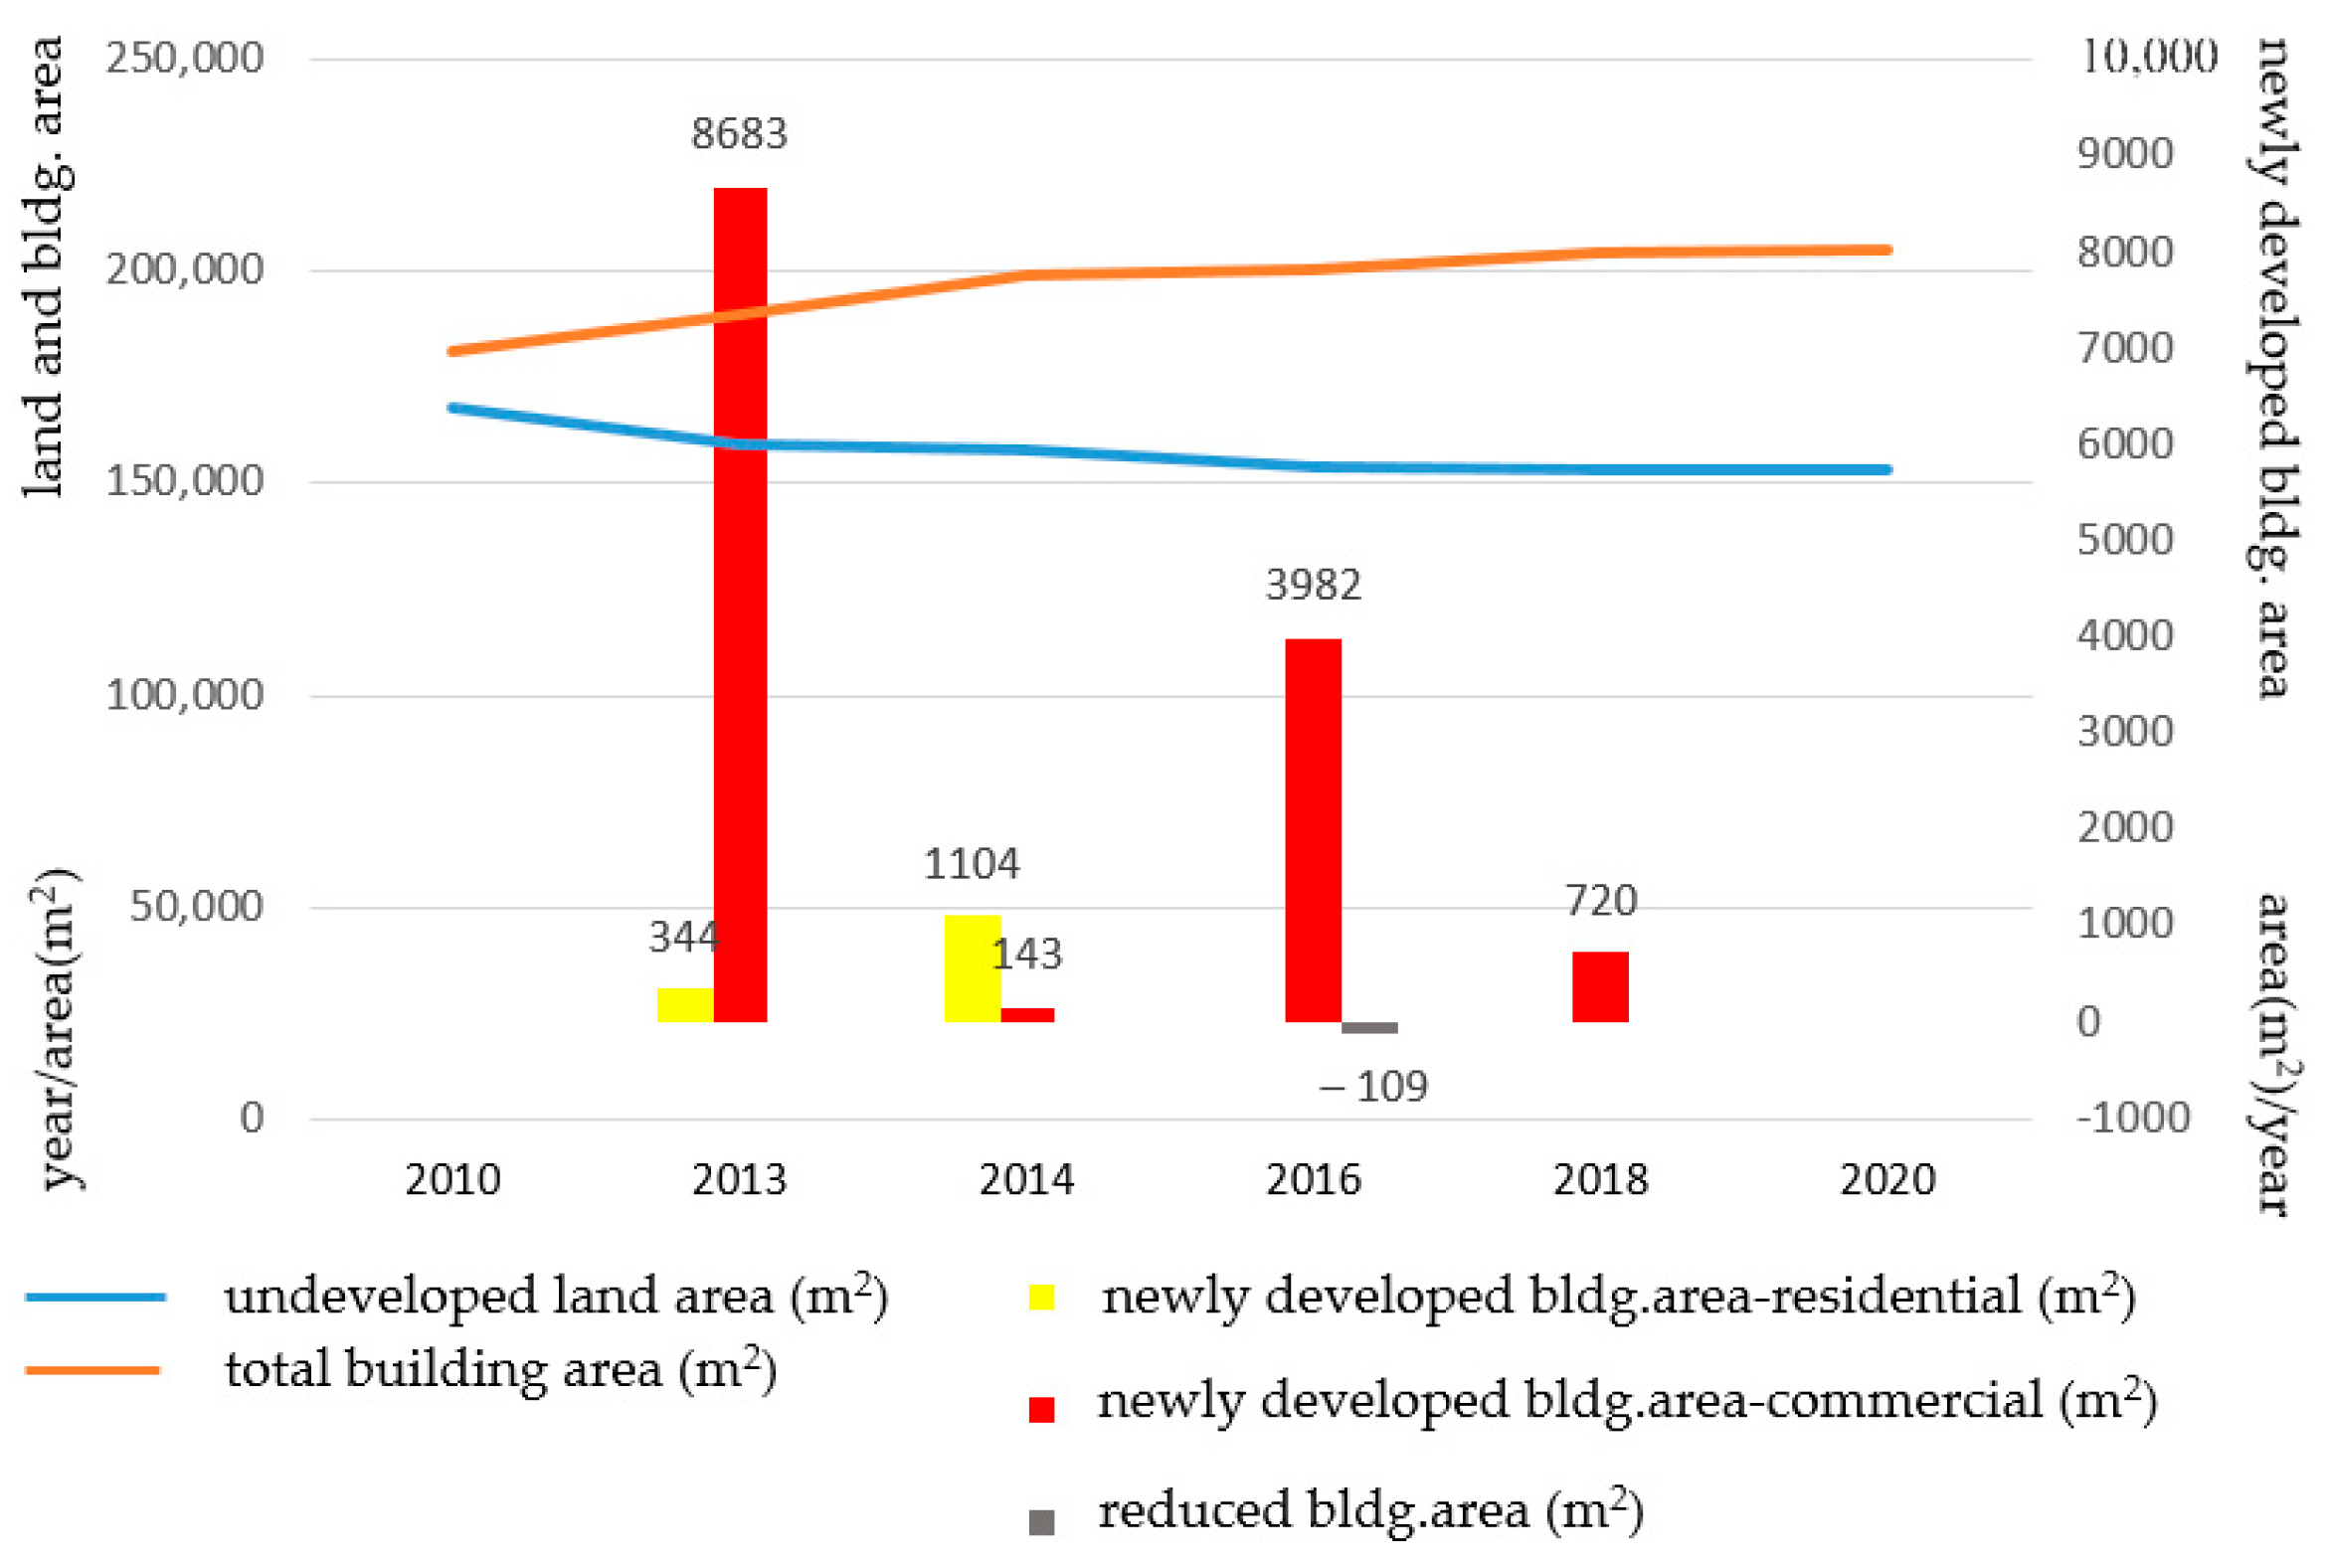
Most of the new constructions were commercial buildings such as factories made by sheet metal. The undeveloped green area has been replotted for commercial use, based on the information of the Land Planning GIS provided by the Urban and Rural Development Branch, Construction and Planning Agency, Ministry of the Interior (MOI). The original layout was reconstructed into a retention pond in 2016 and excavated 7 m deeper to add more than 30,000 cubic meters of water capacity [60]. The area was enlarged from 6814 to 9103 m² between 2016 and 2018, based on the calculation made from the aerial image of Google Earth 2018 (Figure 11).
5.4. Photovoltaic Pond
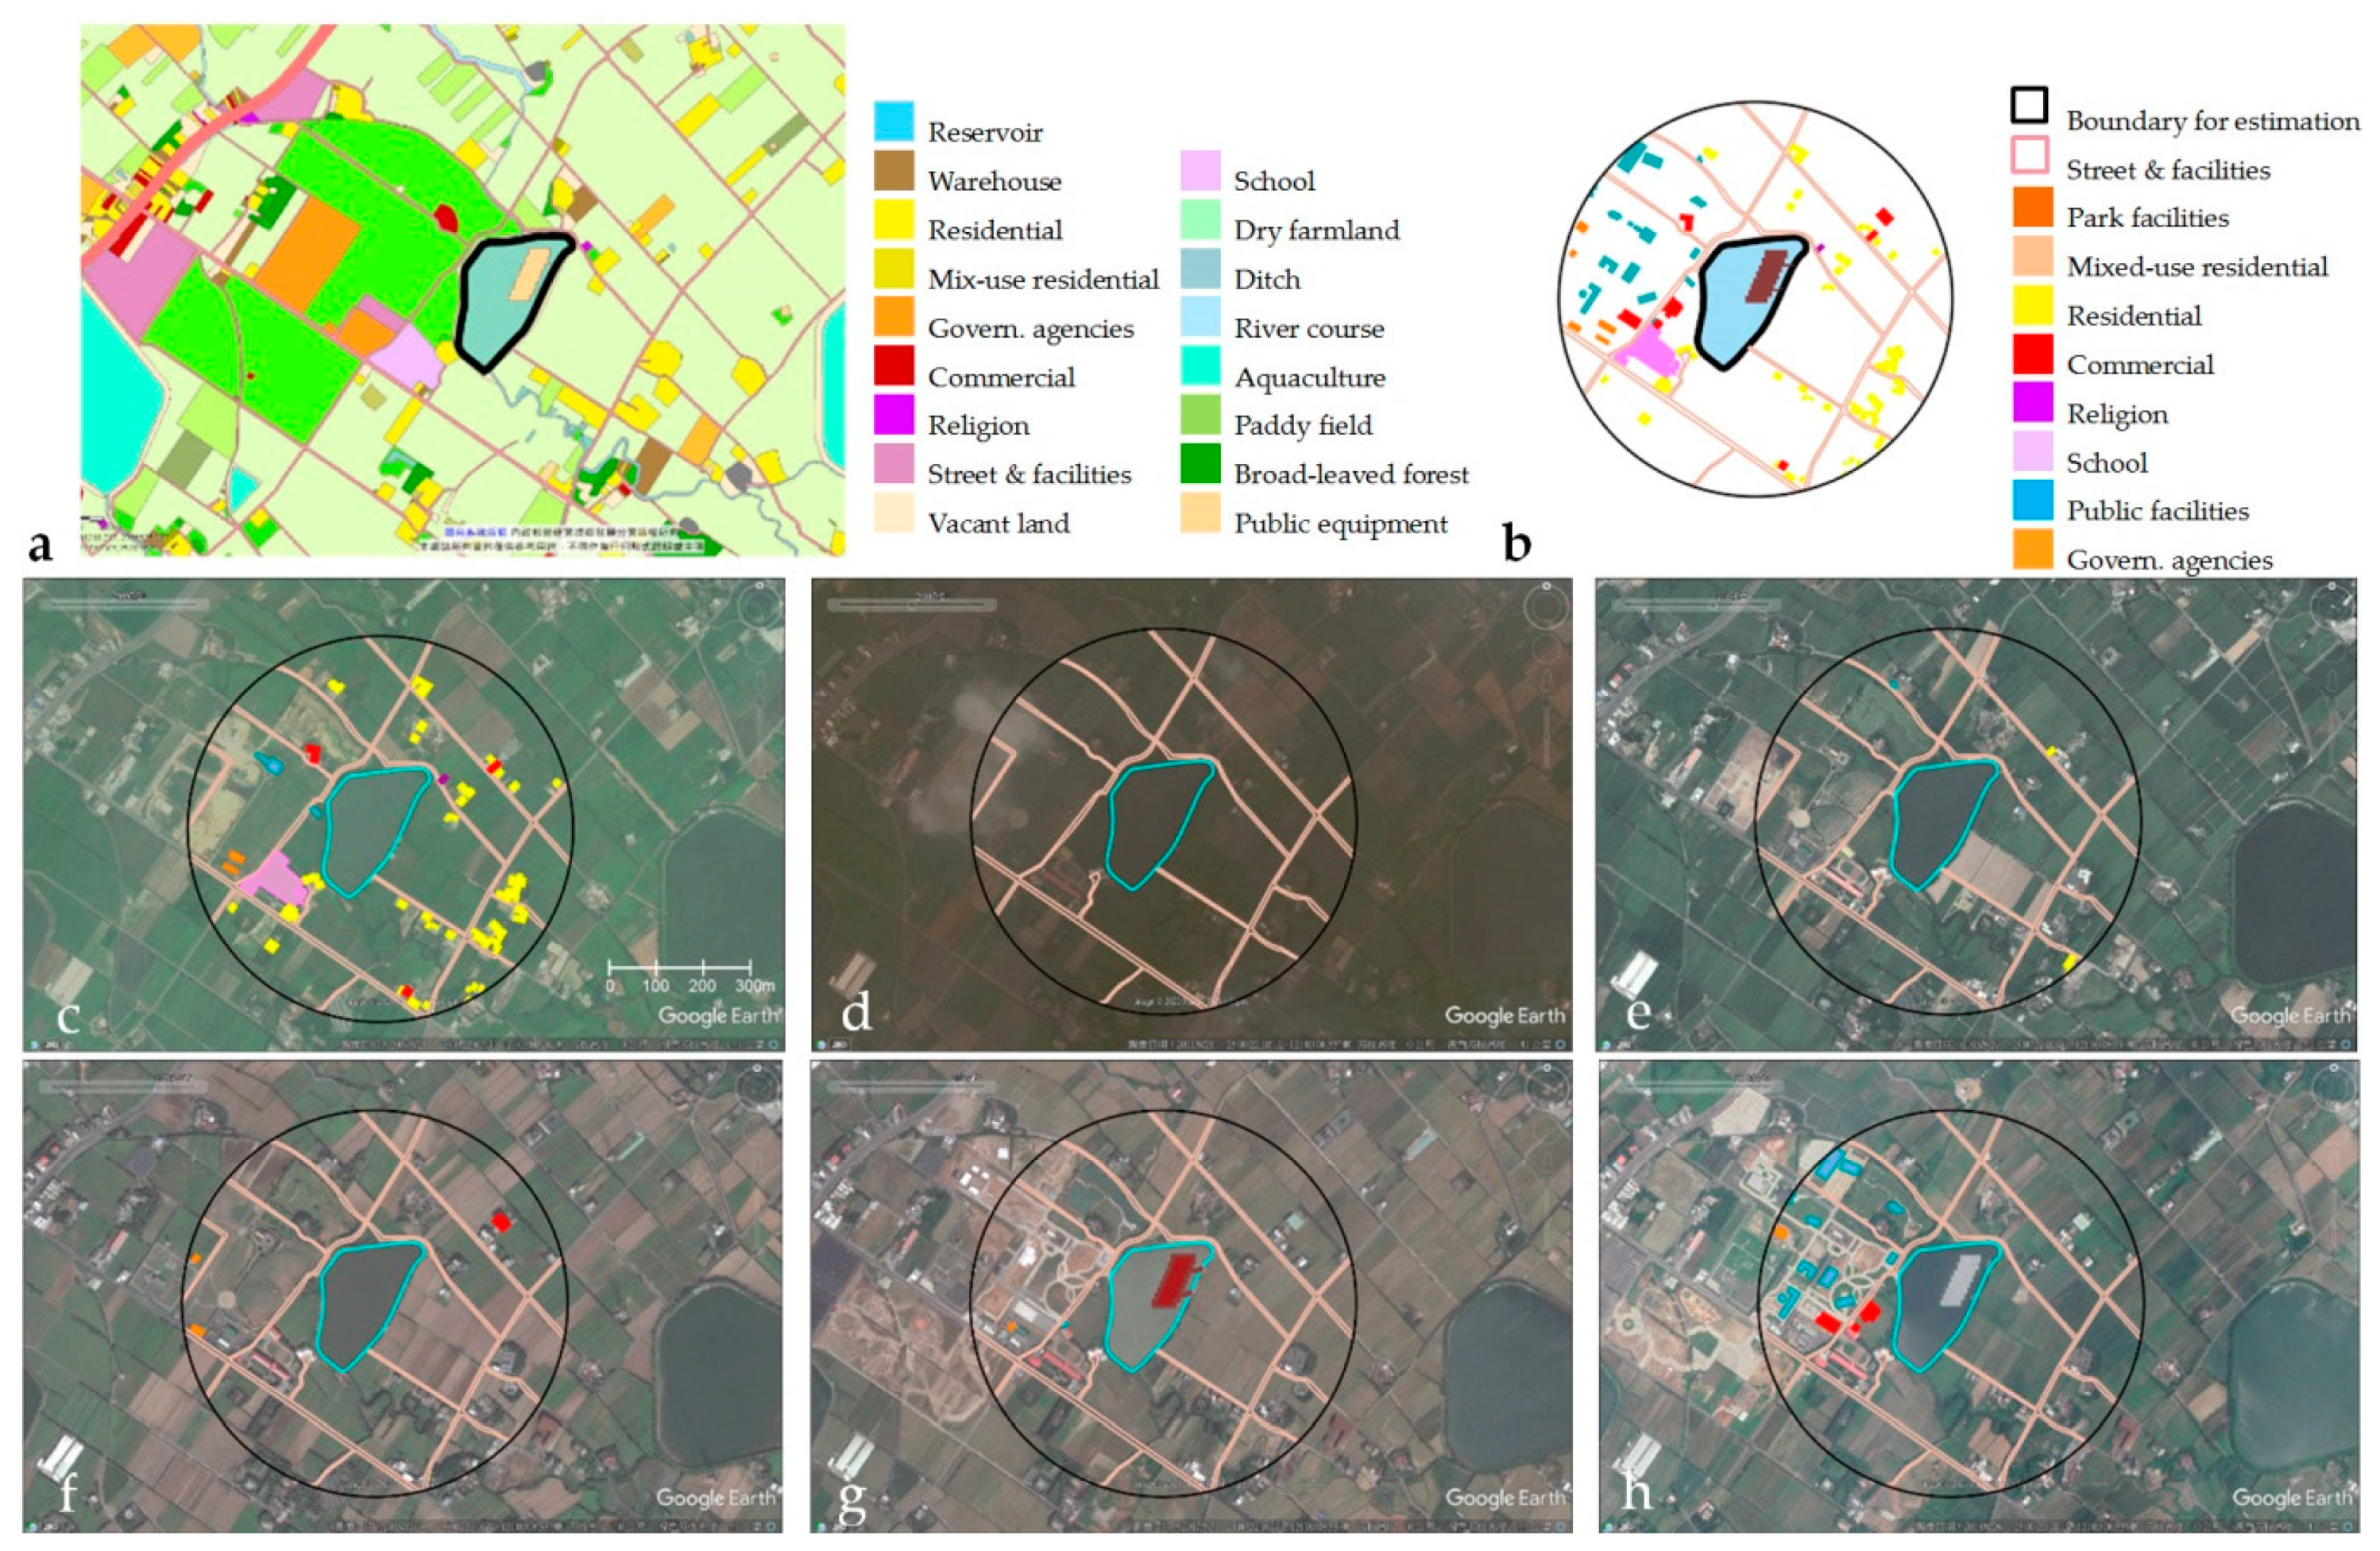
The no. 12-14 photovoltaic pond is located in Xinwu District, Taoyuan City. It was the first farm pond to be covered with 5000 m² of photovoltaic panels with the capacity increased from 481.44 in the first stage to 2000 kw in the second stage. The annual power generation will be 0.6 GWh (gigawatt hour), which is enough to support 170 families annually [61].
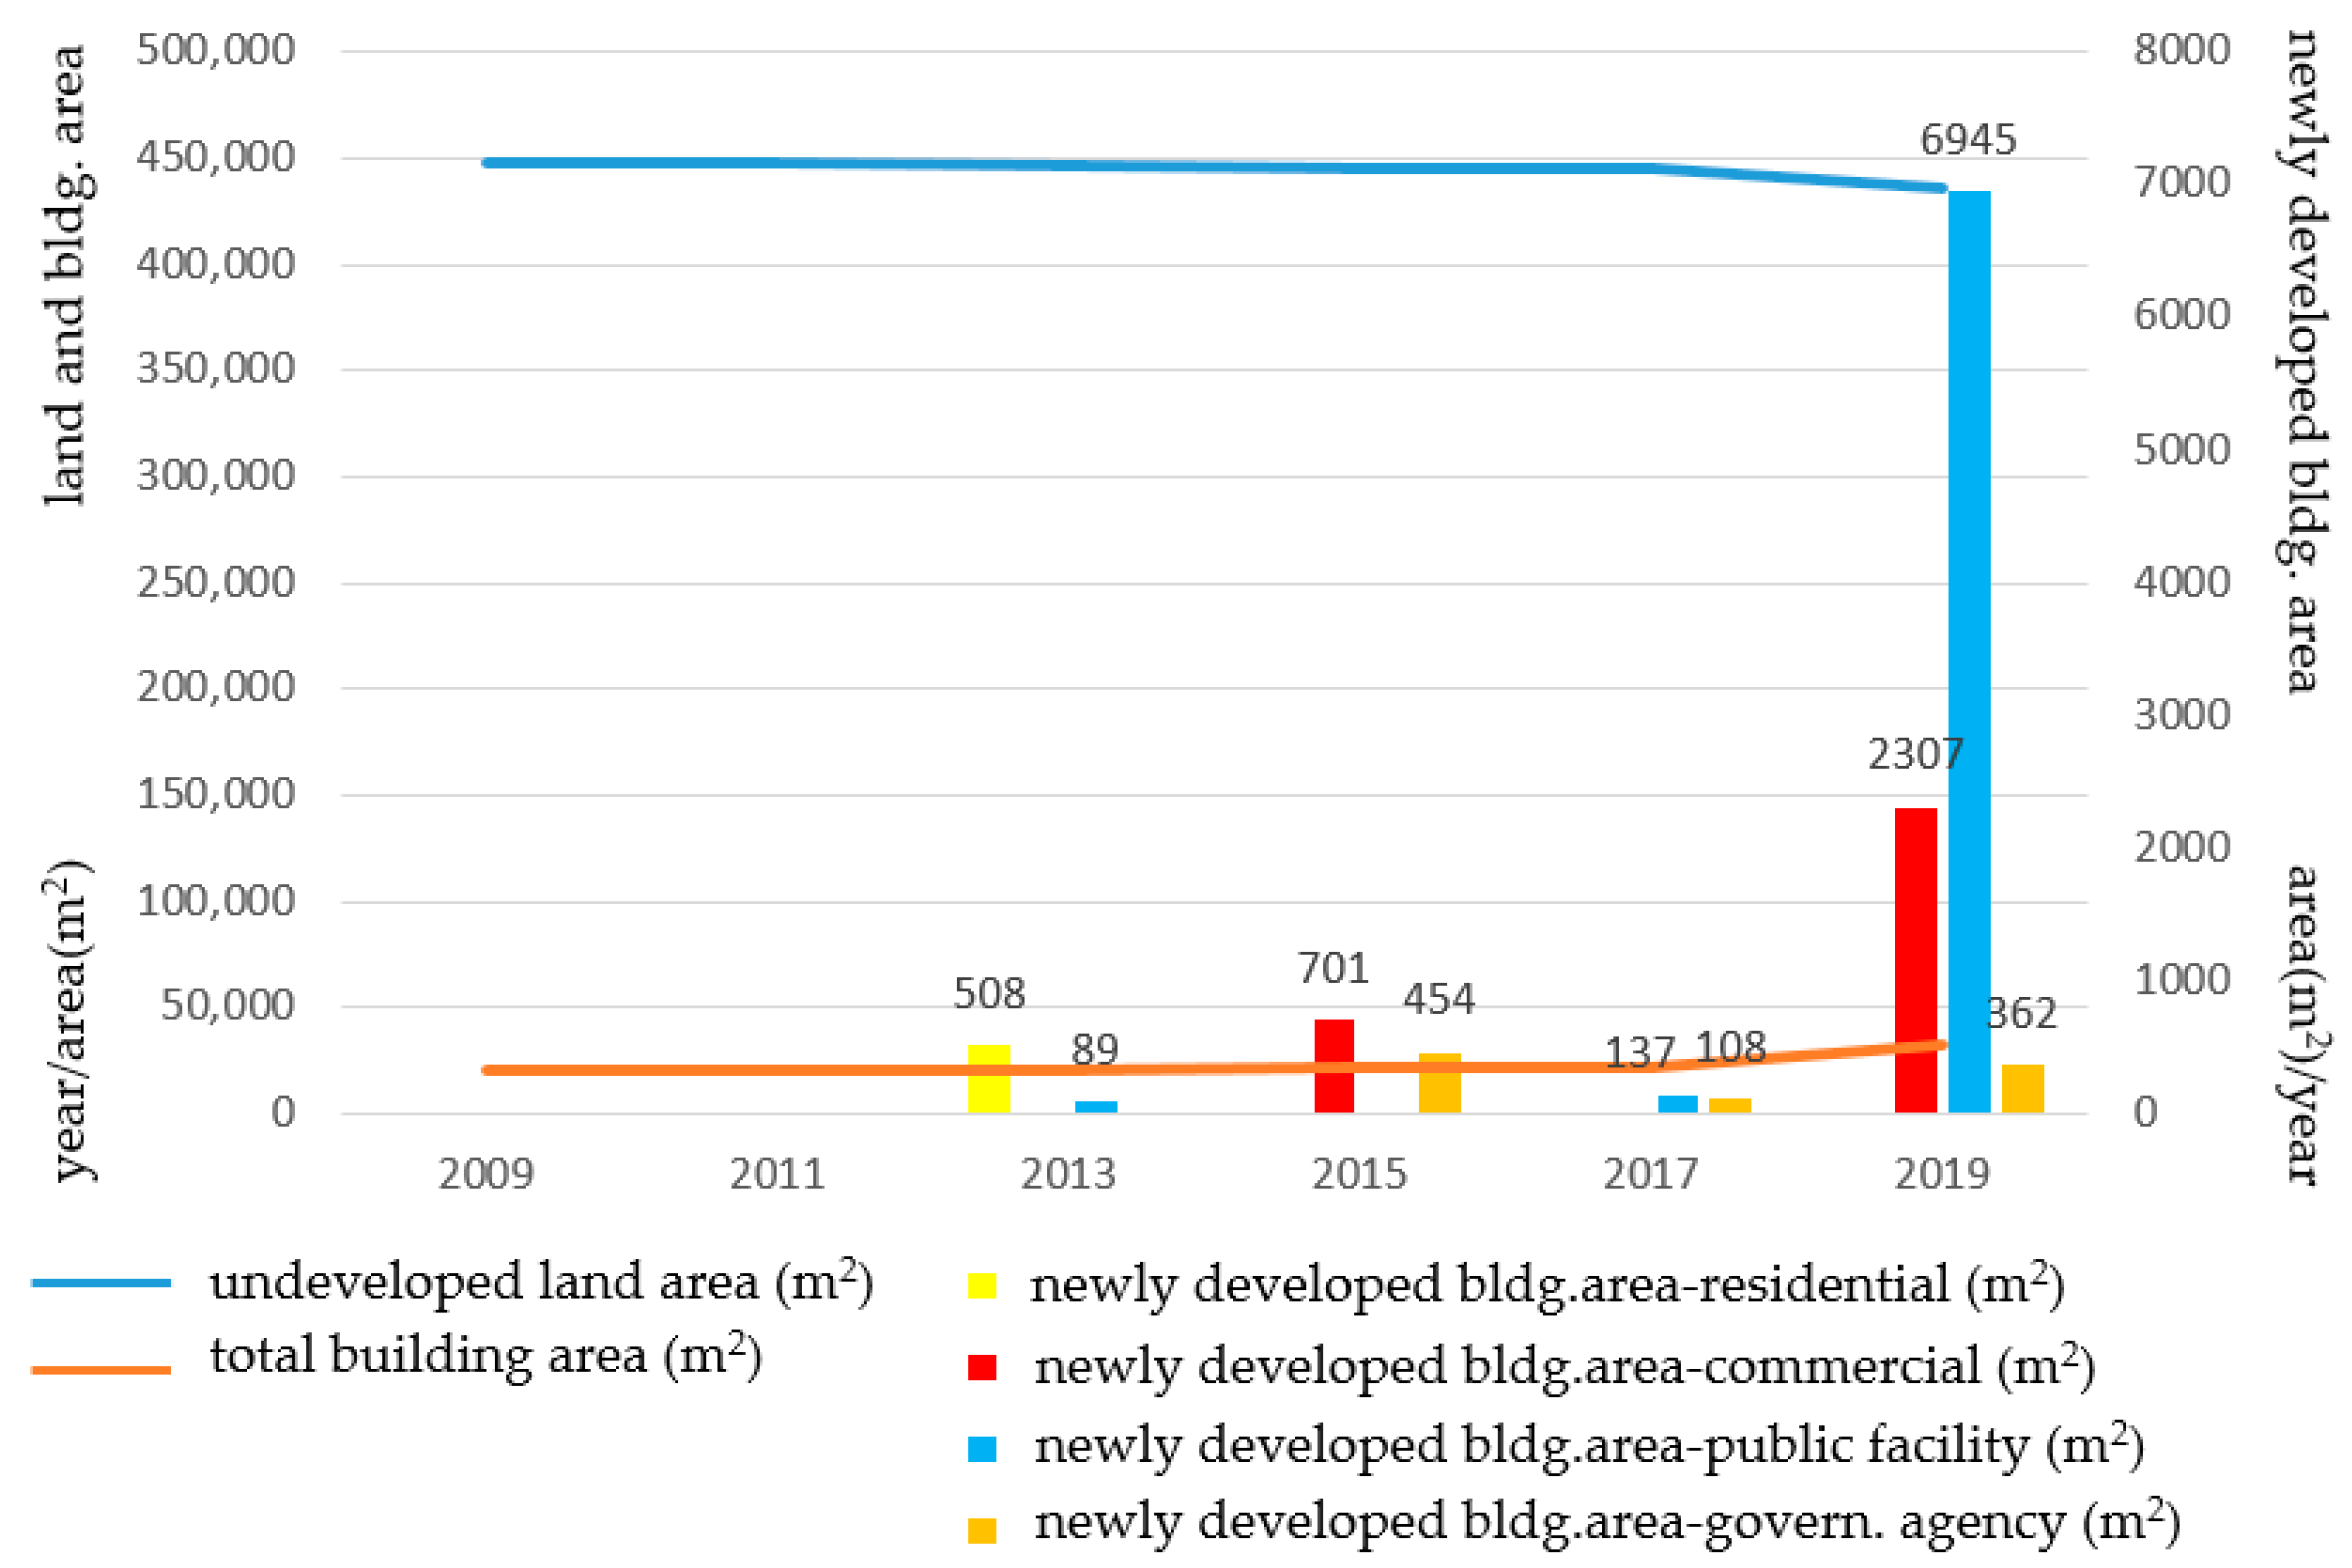
Since 2019, Taoyuan Agriculture Expo has been held in the park and the dry farmland next to the pond (Figure 12). Large-scale exterior installations were left for long-term education and demonstration purposes of leisure agriculture. The public facilities increased significantly in 2019 (Figure 13).
6. Boundary Verifications
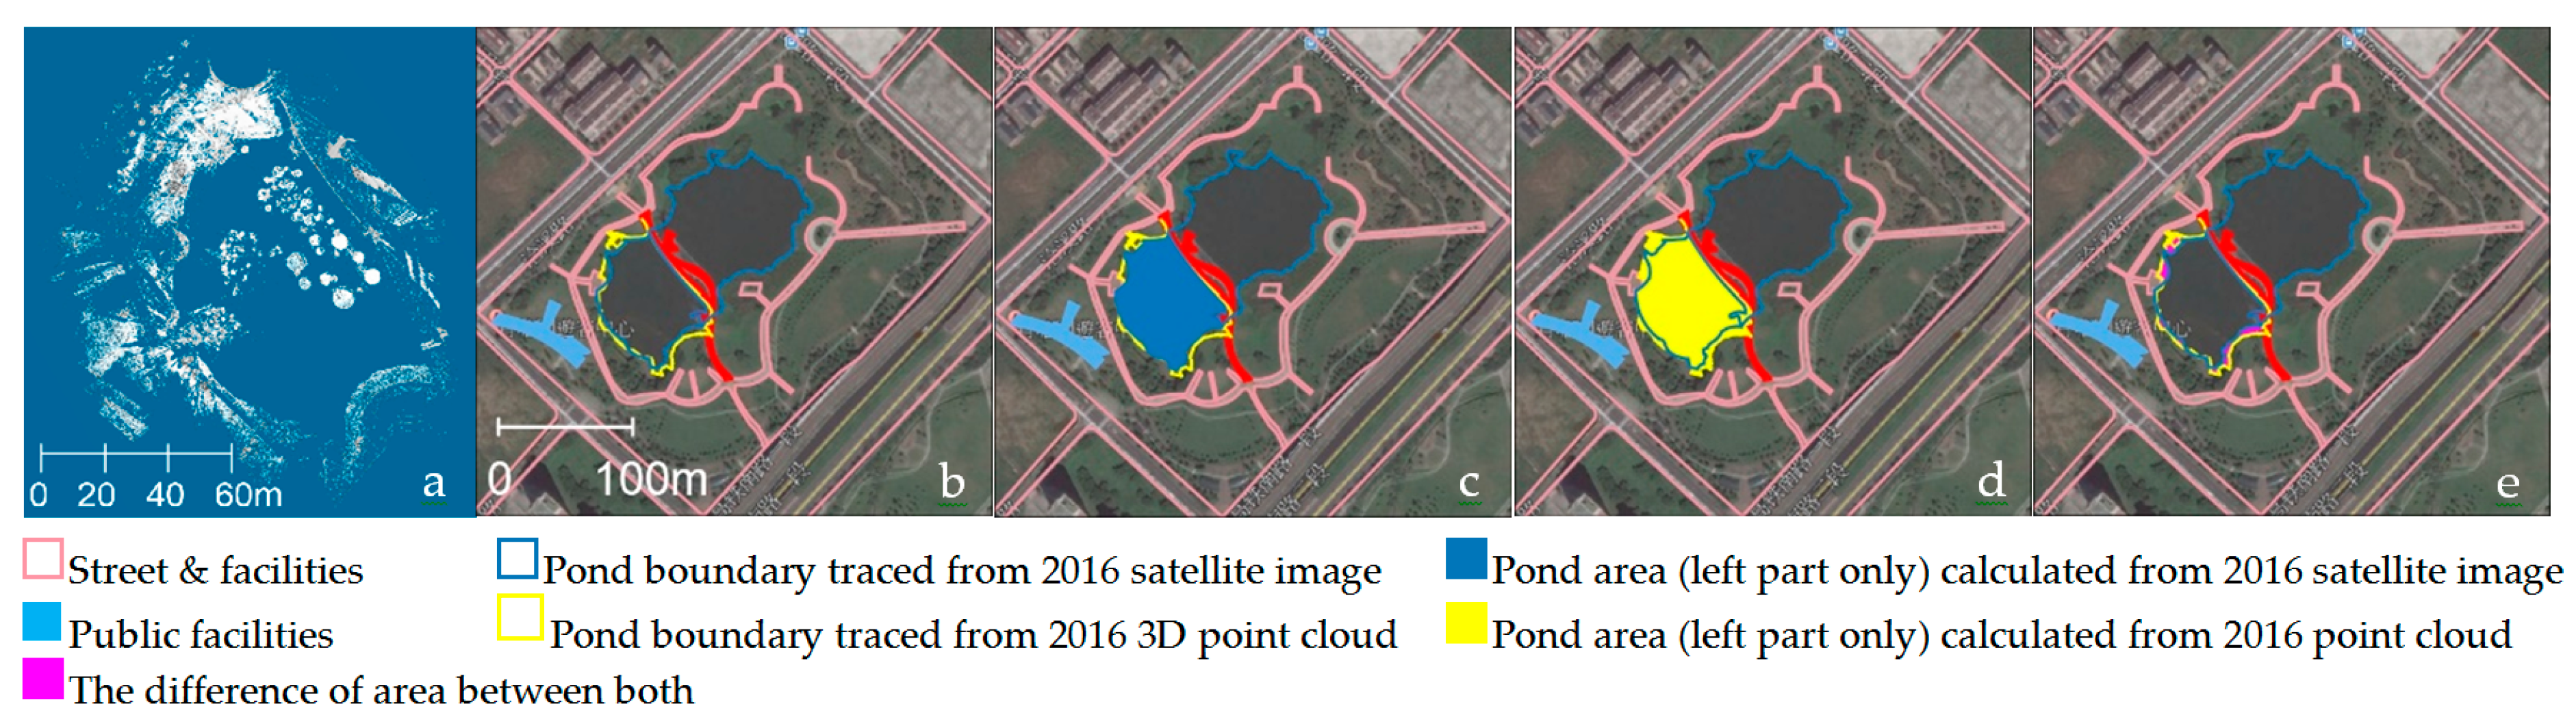
A quantitative analysis can be correlated from remote sensing, different map resources, and 3D scans at the ground level. Verification of the area of the water surface was made at 1:1 scale to the Blue Pond from former 3D scans made in 2016 (Figure 14). The result shows a difference existed between the area defined by the point cloud (5332.86 cm2) and the area traced from the satellite image (4635.26 cm2) at a tolerance of 15% larger. The illustration of the two types of boundary represents an enlarged scope of the pond scale as a more reliable reference, when a detailed survey was made possible. By referring to the area of the water surface, historical satellite images showed tolerances were changed by years, in terms of various amounts of increased or decreased area, except one (Table 3). Although the changes made in some years were not distinguishable from satellite images of the photovoltaic park in Figure 12, the dynamics of most pond boundaries can be seen in the sub-figures from c to g (or h) in Figure 6, Figure 8 and Figure 10. This is also an indicator of the accuracy measured from lands and buildings. The alternations of the pond water area (m2) between the satellite image and map vary from 7% to −29% (Table 4).
7. Discussions
Resilience can be planned by zoning control to accommodate diversity, enrich the urban context, propagate cultural festivals, increase people’s involvement, and eventually converge zoning characters. We concluded that each of the four ponds represents a different stage in the undeveloped area of land and newly added or developed area of buildings. The four stages and application patterns represent different approaches to the integration of water and urban resilience and, in the meantime, maintain the old pond culture.
A series of topographical maps and GIS information was correlated and compared with scanned data from the Blue Pond. A validation of development was made feasible from a more accurate source of data and possibly revealed more event-related detail of the installations.
7.1. Evolving Direction
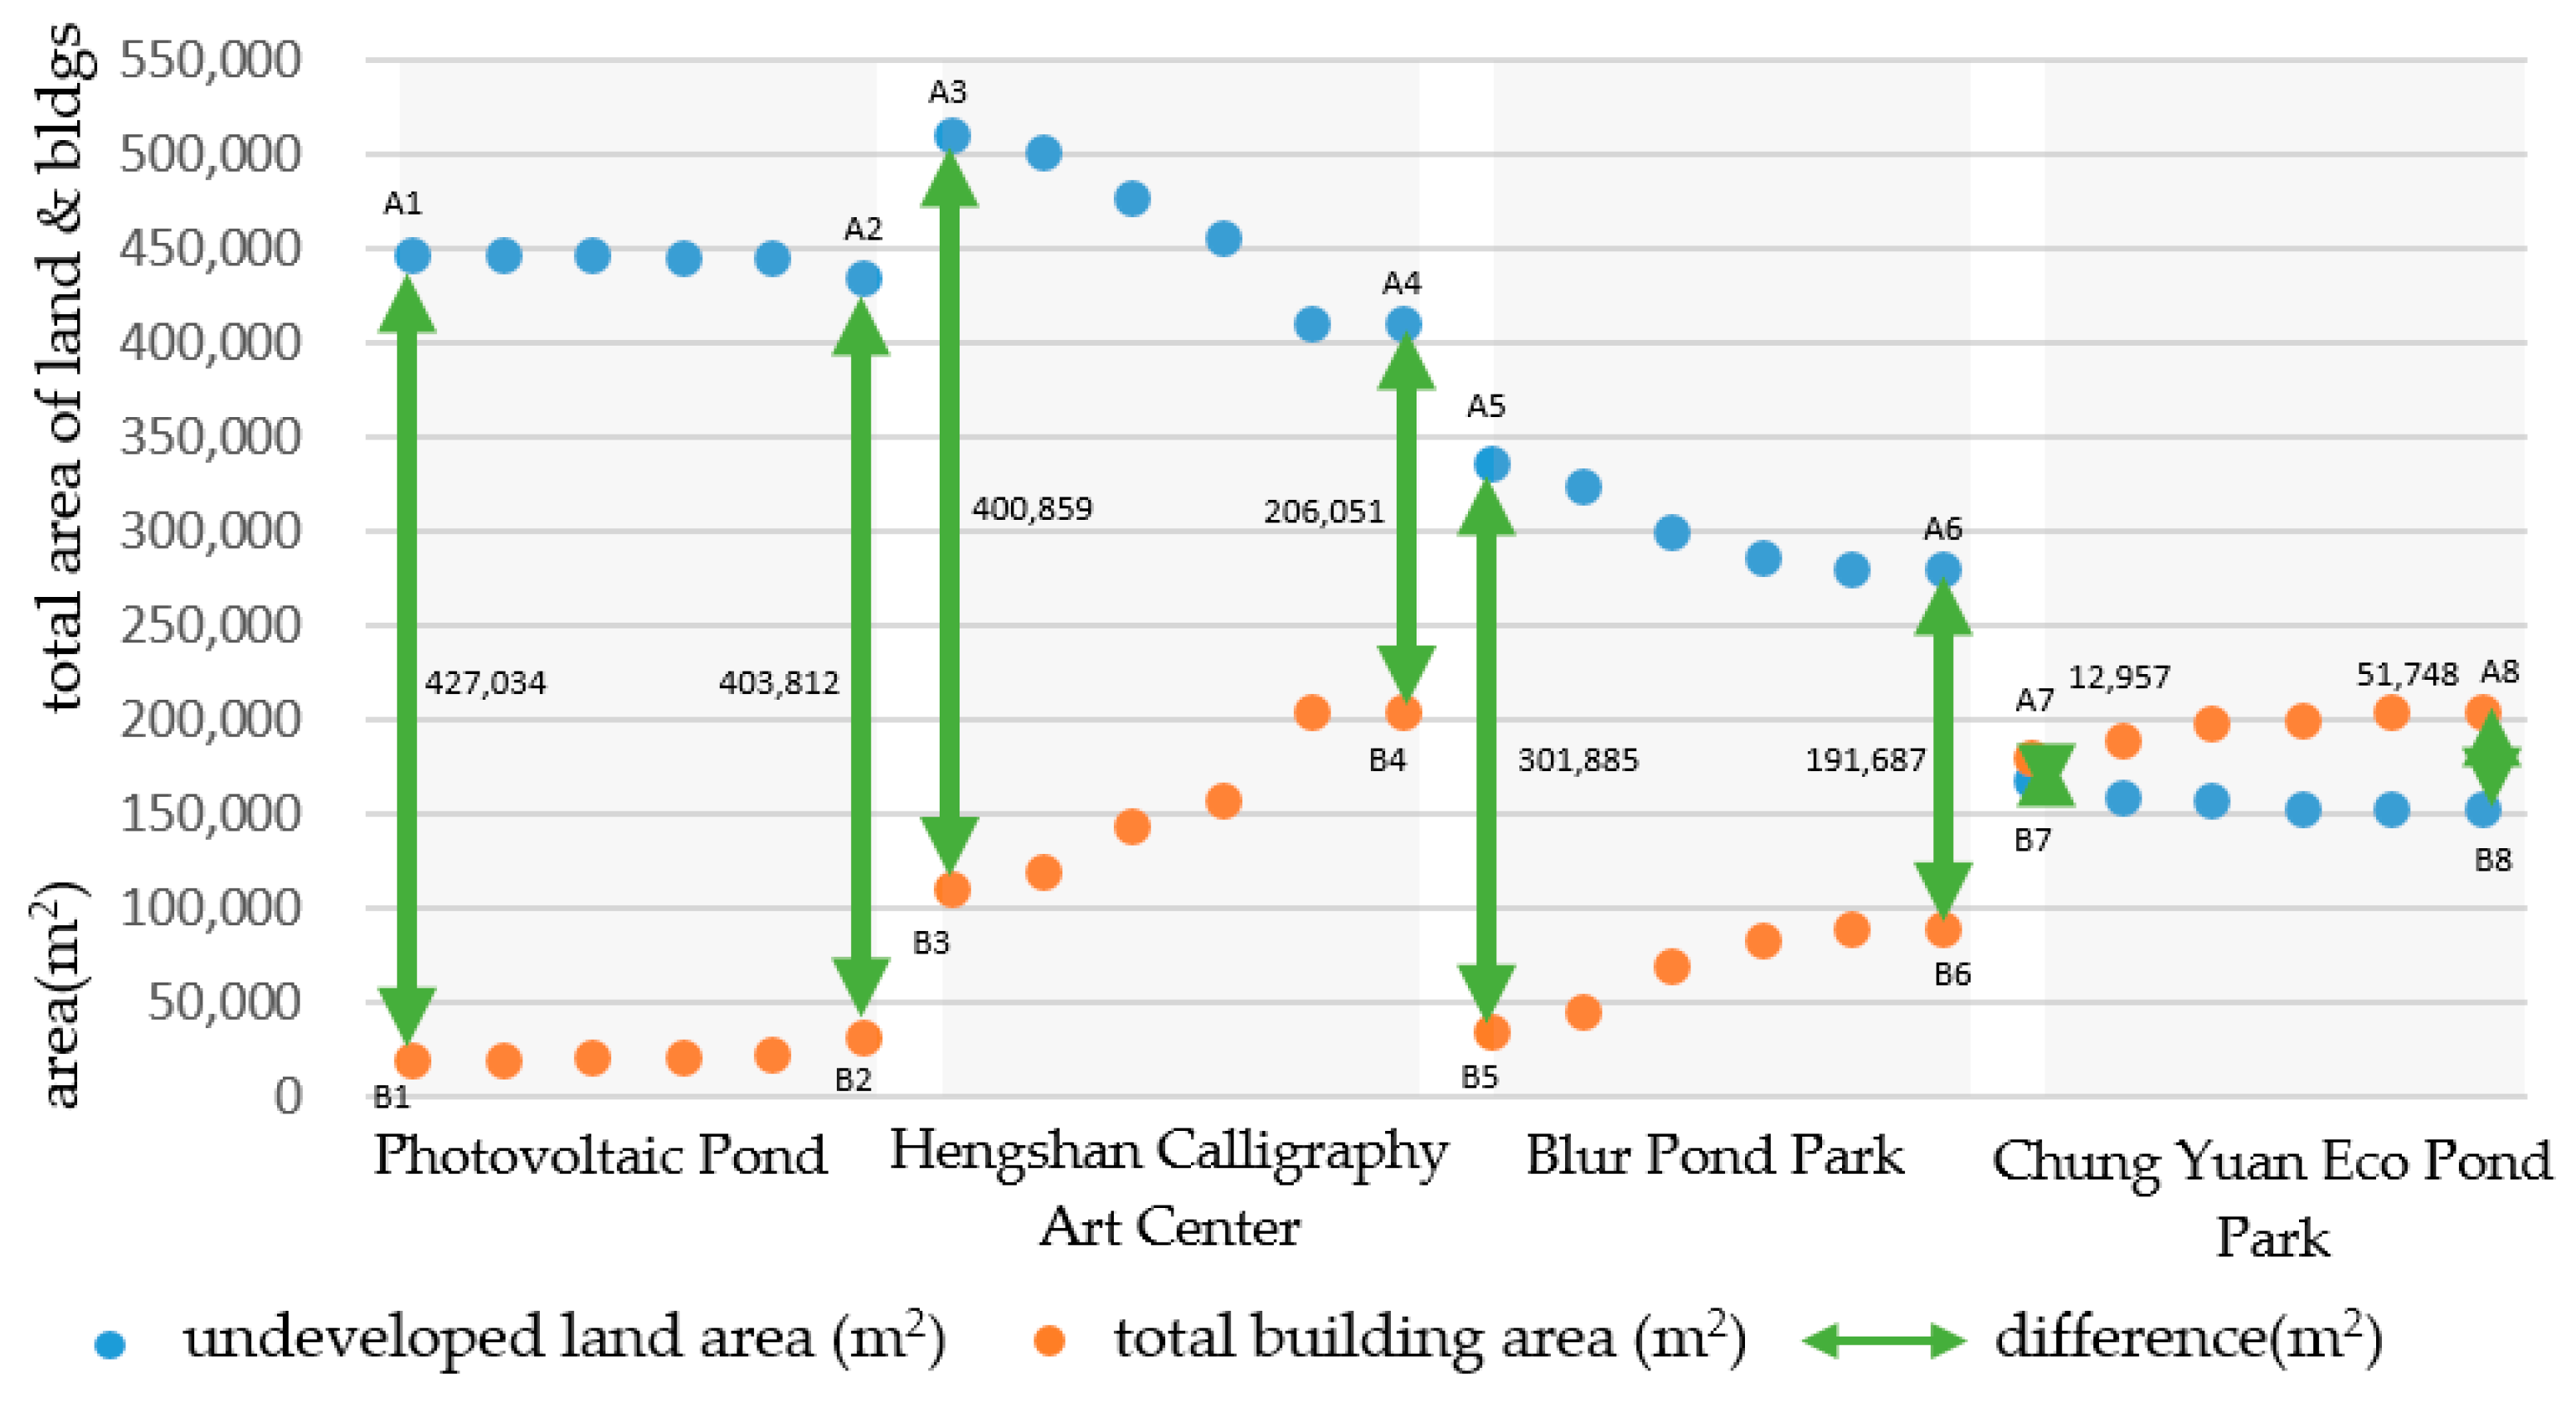
Since the development of the pond system in the first stage, its function in irrigation and catchment has been reduced, transferred, and reactivated for different purposes. Changes have been made, from the saturation of mix-used residences and mass development of office buildings to public facilities. However, different patterns of transformation occur. Aside from the difference in the zoning fabric and development history, the four ponds represent stages of evolvement moving from left to right (Figure 15), based on the undeveloped land area and total area of buildings. Whether the development direction can be reversed remains to be seen, and the ponds, still in their early development stage, can certainly be planned like the photovoltaic pond.
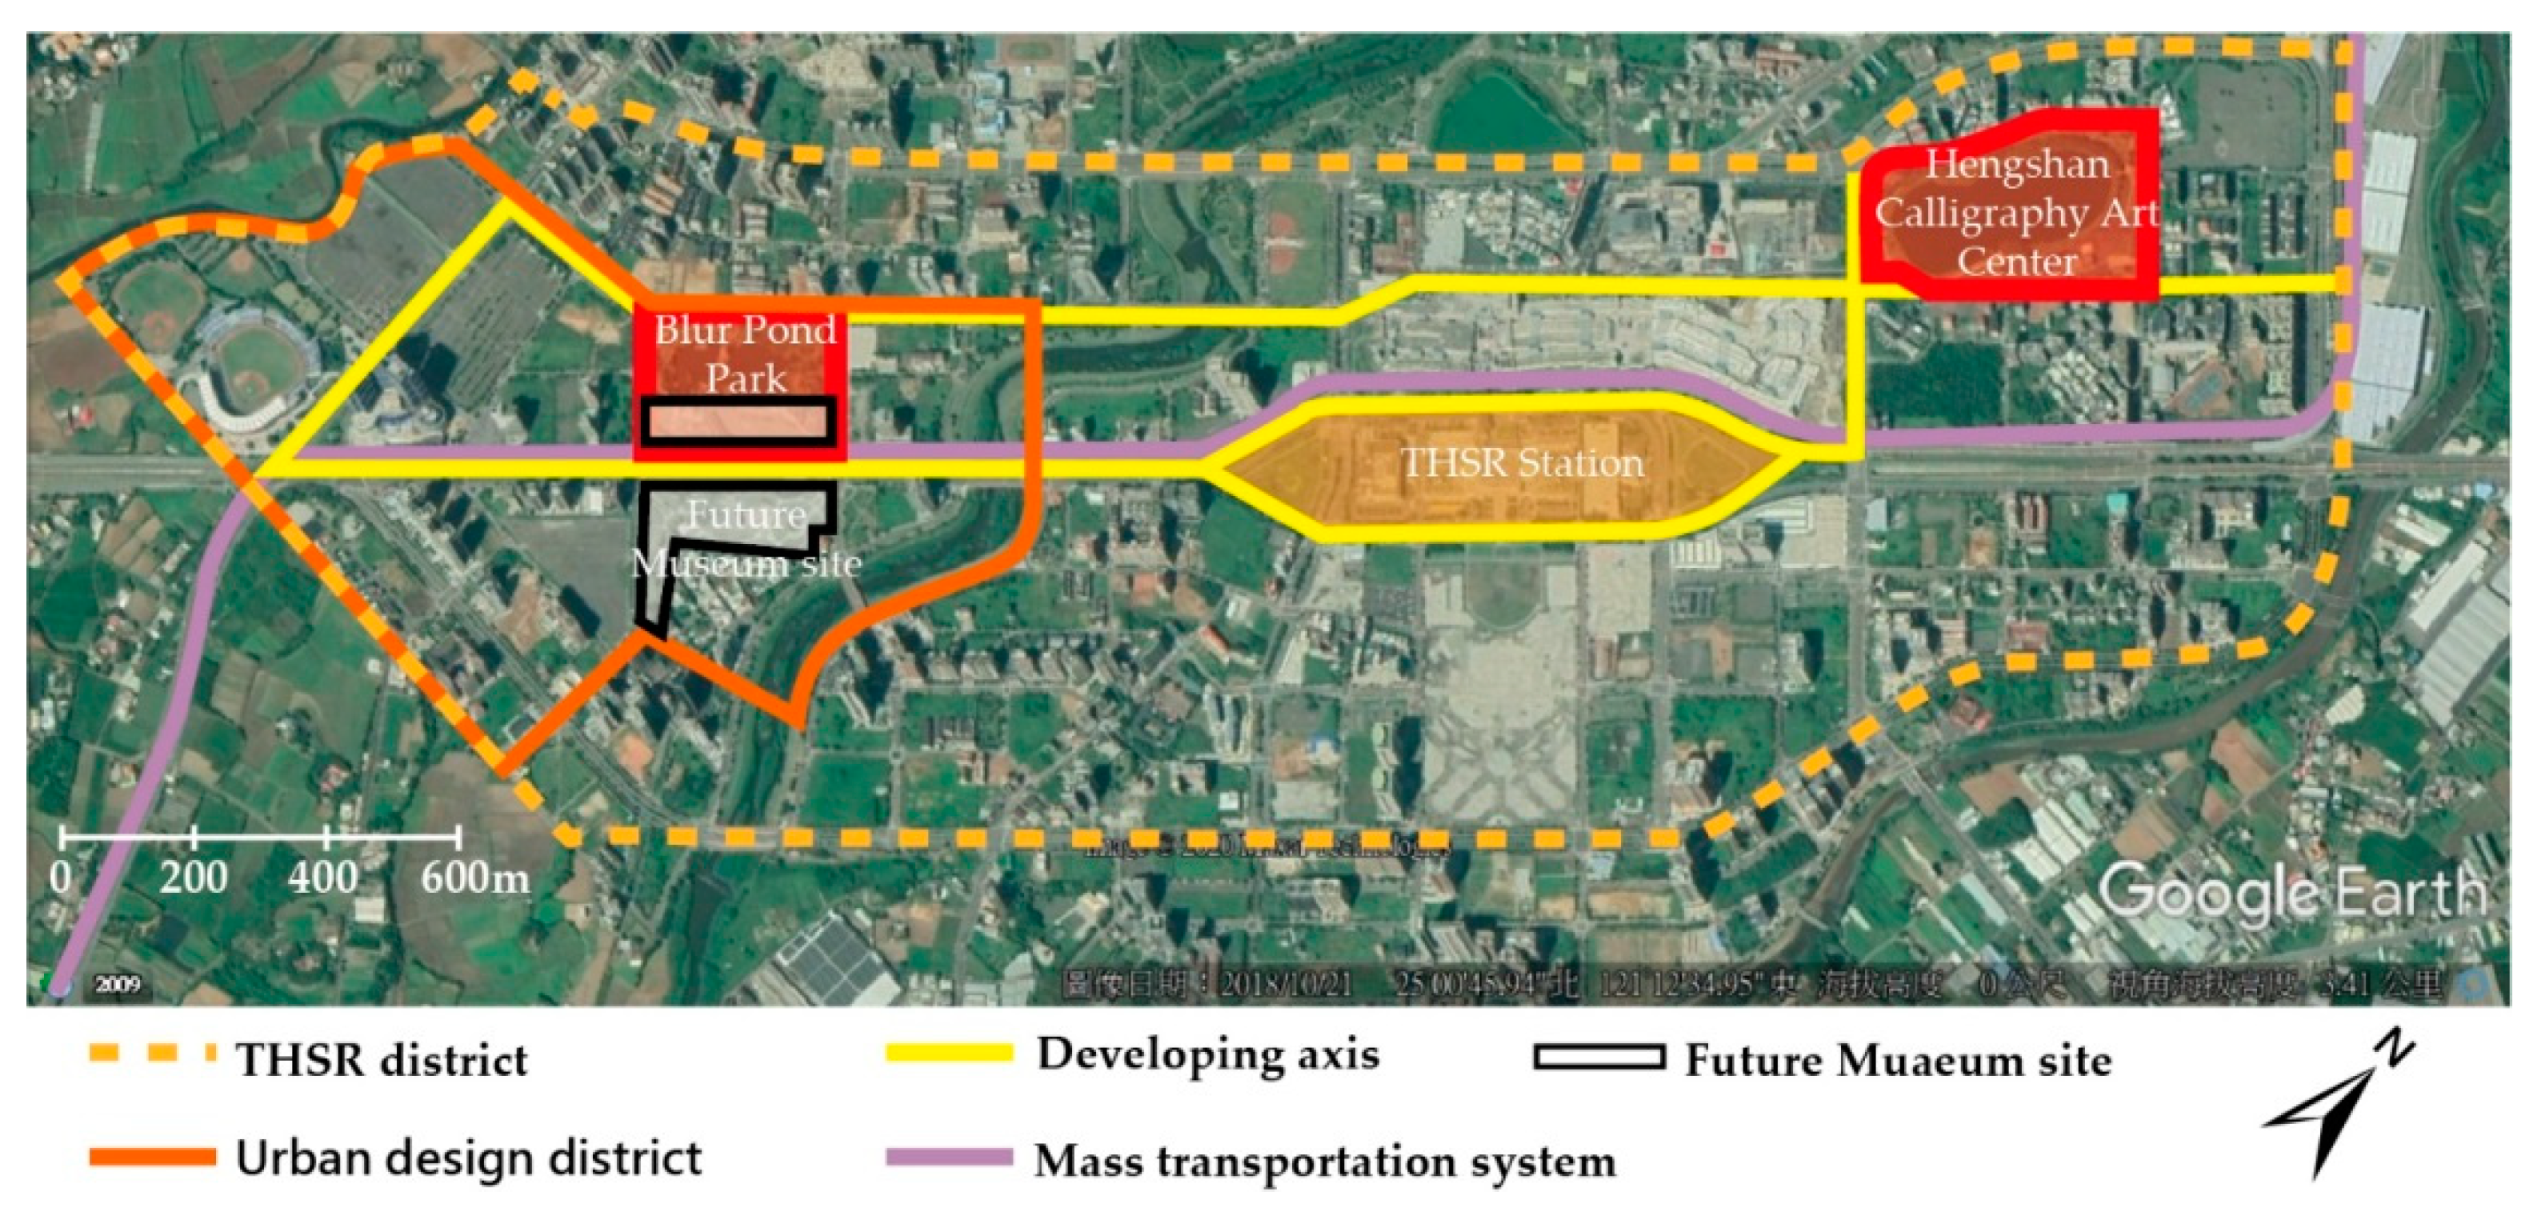
Two ponds and related designs coexist at the specific THSR district only about 500 m apart: the Blue Pond Park and the Hengshan Calligraphy Park. The former has a saturated development of mixed-used residences. It was the first demonstrative project of a pond revitalization and rejuvenation plan for systematic rainwater regulation of flood control. This park has been divided into zones for water purification, a pond canal experience, and an ecological island. It is located next to a future museum site [62]. The rich ecological context of the Blue Pond and the green open space outside the museum can be connected to form an extended axis of the landscape. The circulation system around the THSR station connects both locations to expand the outdoor space around the museum and enrich the diversity of regional activities (Figure 16).
Hengshan Calligraphy Park has an office building mass developed in its peripheral region. It was purposely planned to preserve the historic fabric of the farm pond. This center was designed to integrate the landscape of ponds, green spaces, and the night scene in the evening. The integration of the Art Center and museum in the future will help them complement each other with the pond landscape. The collections at both places can be coordinated, interchanged, or displayed to converge and expose visitors to local cultural characteristics.
Chung Yuan Eco Pond Park has a developed area of buildings that have saturated and declined. The photovoltaic pond has the mass propagation of the public facility deployed as photovoltaic panels on the water surface of the pond. Both contribute to contrasting patterns with the ponds located in the THSR district.
7.2. Active and Passive Resilience Planning
Resilience can be planned to fulfill different characteristic purposes [63]. For the original design, the native function of a pond can be planned for flood control, as an eco-pond with a night scene, or as a demonstrative engineering site of canal regeneration. For the resilience associated with extended emphases [54,55,57,58,59], planning was made to promote regional coordination and the interaction mechanism, connect to tourism of the landscape and cultural festivals, and enrich the diversity of local activity. A series connection of neighborhood open spaces was created by the propagating field domain of the museum, elongating landscape cross blocks and railroads and creating a connection to the circulation system on both sides of the THSR station. The highlight of the local artistic and cultural characteristics was also made possible by converging visitors through the response and interaction to the collections and displayed contents between the museum and the Calligraphy Art Center next to the pond.
Resilience comes in different scales, details, expected functions, and connections to the urban context [8,9,10,11,12,13,14,15]. This study shows that each pond represents a specific diversity in resilience with different developing patterns. Active resilience led to a likeness of higher overall sustainable quality in creating the correlation with the THSR circulation system and the specific regional development plan. A constant investment had been made to increase the future credential or potential of resilience from the detailed development plan for the THSR special district. For example, a purposely designed bridge was added to enrich the pond’s role of providing variety in the urban context. A rather passive resilience of pond development was to install photovoltaic panels to create the capacity of green energy.
Active resilience was also made possible through a festival event and temporary urban fabric. Increasing the variety of resilience in terms of sustainable festival contexts was made by event-dependent installations which were designed as consistent activations by the soft or temporary local urban fabric.
A typical pattern of resilience for early development but low flexibility can be seen in Chung Yuan Eco Pond Park, which is located in a region with a high density of residences. The pond is a wetland that cannot be developed privately. This pond has illustrated a strong resilience advantage as a retention pond excavated deeper to create more capacity for water storage and also as a typical pattern and a lesson learned as a consequence of replotted commercial use in an overdeveloped neighborhood.
7.3. Creative Design to the Peripheral Context
Former studies had extended management to lakes to interpret the social environment for a sustainable approach [36], cultural opportunities such as community festivals [37], or cultural construction [38]. The active act of resilience was conducted from the diversified connection to the peripheral context, as a window to creative design, and by refurbishing a pond as a cultural stage. A diversified connection to the peripheral context was accomplished through the interaction with the surrounding open space, which provides unlimited opportunities for interaction. In 2016, the Blue Pond Park became an auxiliary site of the lantern festival to the open space in front of the THSR station. It successfully attracted visitors along the route underneath the rail to the main site located a few blocks away.
A window for creative design was also created. The season-oriented scenes and installations enriched activities in the evening. Modern art installations were consistently deployed in these years. As a result, a pond was re-developed as a stage. A design pattern was developed to accommodate the pond surface as a stage for an active performance or a passive display. The bridge presents a new inter-relationship between visitors and the pond with, in the meantime, a performance and static display.
7.4. Methods and Tools
Difficulties were encountered in correlating information into a feasible representation prior to being exported to a working platform such as inconsistent pond boundaries between maps and satellite images, surveys with/without the pond displayed, different land-use color schemes, and an unknown creation date of maps for pond boundaries. Confirmations were made for the maps created by tiled stitches and coordinate transformation.
Quantitative estimation of the evolved morphology was conducted mainly using satellite images for defining boundaries and estimating areas outside of the inconsistent map resources. The straightforward approach was very helpful in referring the inconsistent representation of pond boundaries on maps. An AutoCAD® platform, which works with building information modeling (BIM) in full scale, was applied to correlate the color scheme for zoning and land-use checks. The estimation of the pond water area was required on an annual basis as a reference to verify the collected GIS information, or as a referred value of the alternations made to the urban fabrics. A more accurate proof was made by referring the data retrieved from 3D scans to the satellite image, using a 3D point cloud model of 32,982,330 points, as shown in Figure 14, instead of 1–2 points per m2 from an aerial scan or an unmanned aerial vehicle (UAV)-based photogrammetric model. Adobe Illustrator was mainly applied for the illustration shown in Figure 5, in terms of the county boundaries, canals, and ponds.
ArcGIS® and QGIS® are well-established tools for analysis. Historical developments or evolution need to be compared and connected between maps. Tests were carried out, and it was found that an easier way to work with the boundaries was to trace them on historical satellite images and refer to different maps by land use and land cover. For maps other than satellite images, the color codes were not consistent and added difficulty in identifying and matching zones on the same locations. The vector maps in open sources were not created precisely, compared to the satellite images. Cadastral maps provide a detailed and correct measurement of property boundaries. However, the collection of annual modifications and tiles was costly and time-consuming. Moreover, the map information was usually not updated, inconsistent, or was missing outside the urban replotted region. For example, the Blue Pond was only shown in the 2017 survey. The surface area of the water, which changed annually, can only be estimated from the satellite images.
Boundaries in small areas needed to be traced in detail. Nevertheless, some parts of the satellite images can be distorted and misleading. Compared to the regenerated maps, working with the images seemed feasible and could also be integrated with an architectural drafting and modeling environment in the future.
7.5. Contributions
The novelty or contribution of this study was made by quantifying the tangible indicators into the findings of intangible values. Correlations were made to the development of land use which had lost its function and reactivated to fulfill a new role of a cultural-oriented landscape. The cultural icon presents a direct connection to its historic identity under an evolved pattern of urbanization.
- Trends
Similar to the six trajectories of land-use change mentioned in [28], we concluded that at least four stages or three trends were developed as parallel, converging, and overdeveloped types. Depending on the intensity of urbanization, transitions were conducted with a seemingly irreversible status (Figure 1b). In contrast to the differences found across cities or nations, the trends actually occurred within a city boundary. The induced trends or trajectories were correlated especially under a similar historical background. Instead of natural evolvement of urbanization, policies contributed to the conservation of wetlands and cultures.
Based on the plotted trend, the evolving process was location- or zoning-dependent. Newly developed peripherals will have different impacts on an old or underdeveloped pond fabric in the future. The Chung Yuan Eco Pond Park has a close tie with the neighborhood with barely any vacancy in between. In contrast, as shown in Figure 1a, the distance between the Blue Pond and the distant urbanscape can be zoomed in as wanted. A new communication pattern is created. It remains to be seen if the pace of urbanization will be accelerated in each pond park.
- Meta-Indicators
Meta-indicators were induced from the intangible indicators or classifications of urbanization, such as morphology, patterns, cultural landscape, policies, resilience act, or activities. Morphology represents the changes that evolved over a long period of time. The collection of patterns contributes to a meta-description of constructions and policies.
As a symbol of the cultural landscape, a successful transformation of ponds had been made by special urban district development plans. Each pond presented a culture-oriented developing pattern integrated under different combinations of theme-based landscape design and a reactivated irrigation system. The area of the house estate [64] was one of the major indicators to assess the undeveloped and underdeveloped lands. Similar to the indicators specified in [26], the roads and buildings were also important ones assessed in this study, based on the areas estimated from the residences in peripherals and the facilities and galleries within a park. Moreover, the history of pond consumption and land abandonment has helped ponds collaborate together to form a meta-indicator of urbanization made of a new cultural landscape, irrigation system, and wetlands or green spaces.
Although the rapid transit system represents a traditional urbanization indicator, it creates a new pattern of conversation with a pond from a higher elevation, rather than from a canal system at the ground level. Similar to the transport infrastructure mentioned earlier [27], transit systems have played an important and positive force in changing the landscape of humanity by connecting pond parks. Although this new relationship was not visible from satellite images, we had depicted scenes to correlate the relationship and concluded a new intangible indicator that connects land use transition to a new cultural landscape based on the images taken on the transit. As a result, we concluded that the ponds, which are connected in 3D by either the canal system or the elevated rapid transit system, represent a new type of interaction between the ponds and urban fabric.
Policies inherited the sustainable vision and were oriented to future development. The Wetland Act was issued and applied with local adaption to ensure future resilience island-wide [54,55,57,58,59]. Activity is an important indicator, since a series of events held during annual festivals had enriched the morphology of the evolved urban fabric with people’s involvement.
We concluded that a pond is not just a part of a former irrigation system; it is a theme park with an inherited cultural identity to interact with the neighborhood community. Most important of all, it provides a cultural window of policies and revitalized community involvement. Exemplification was continuously witnessed from the lantern festival held four years ago to the current installations of art.
- Matrix and Dynamics
A study showed that the pondscape was dismantled in coexisting and overlapped complex ways [29], instead of a linear process. As indicated by [24], socioeconomic factors had influenced the character of land use from abandonment to reactivation, with the assistance of government policies. The dynamics of urbanization can be represented as a simple matrix mentioned in [64], in which the impact of all land use together is more than the sum of the individual “land unit-related” transitions and their effect. The transition includes the indicator matrix and associated dynamics in urbanization.
The representation of morphological dynamics created a new subject-related evaluation of the pond fabric for diversified developing patterns. Correlating patterns in overdeveloped and underdeveloped areas can cross-refer the representative patterns to predict the future trend of others which are located within or next to a similar context. Although the dynamics of the urban fabric was degenerated while the originally designated functions of ponds were eliminated before, the evolvement around an open (or void) space such as a pond can create themes in distinguishing dynamics.
Ponds are different by character, scale, types, and developing process. Compared to the different landscape matrix for rivers [65], the water system in Taoyuan was made by ponds, canals, and reservoirs. The scale is also different. Compared to the ponds surveyed under the scale of a nation, the old farm ponds as rural ponds had been changed into urban ponds instrumented by policies at the same locations. Urban ponds and rural ponds used to be different [26]. Farm ponds in Taoyuan are shallow but not young. Many of the former isolated ones are now connected by canals with improved water quality. As the dynamics accelerated, today’s ponds represent an integrated role of urban ponds and rural ponds.
Morphology, which is considered as a meta-indicator, represents a dynamic process with transitions made to the former spatial structure for follow-up evolvement. The four cases present concurrent dynamics to a new measure of meta-indicators by correlating the trend chart for similarity and diversity. The concurrency concludes that some places that developed faster may evidence others with slower development.
- Spatiotemporal Scale
Urbanization is a complex process [25]. Compared to the development made between 70 and 180 years ago [25,27,28,65], the ponds illustrate that intensive transitions occurred within these 10 years since 1904, with/without direct involvement of the rapid transit system or special zoning projects. The limited time span enabled a macro- or micro-point of view for the inspection of the fast-paced urbanization process.
A difference exists depending on whether the comparison is made to a single city or cities in different countries [65]. Although most of the comparisons were made based on subjects in adjacent locations or similar regional peripherals, our study was different by assessing diversities within a relatively smaller area and limited geographic distribution in northern Taiwan. The rich diversities highlight those closely connected points of interest within a city’s boundary under an uneven developing pace.
8. Conclusions
The Wetland Act issued in 2013 has classified 83 local important wetlands island-wide. The Jianan area and Taoyuan are just two of them, in which the former has selected 18 ponds out of about 10,000 for designated conservation in southern Taiwan. The latter planned three parks per year for revitalization purposes within an area of about 1191.75 km2 in northern Taiwan. The density or the planning efforts become a measure in plotted and replotted urban areas. Although the actually achieved number remains to be seen, several significant exemplifications (as shown in Figure 1) have already served communities with public commitments.
The sustainable development of farm ponds and properly evolved urban fabric can be achieved from a strategy defined by a special zoning specification. A balanced development strategy under the diversified emphases can enable pond resilience through the historic and well-developed local character. The integrated open space can take advantage of a future museum in the neighborhood and, in the meantime, maintain systematic rainwater regulation for flood control.
Ponds are transferred and reactivated for different purposes. Differences in the zoning fabric and developing history apply. It remains to be seen whether the development direction can be reversed, since the ponds are still in their early development stage. A typical example of development is the TOD, in which an elevated transit system was developed in 3D to connect parks created by a formal planning strategy for a canal system at the ground level. A picture which was taken in the research on the transit cart above ground showed the beautiful Blue Pond Park in front and the urban skyline in the background. This was a new measure of resilience and greatly expanded the perspective of the city as bringing it to the park or, alternatively, bringing the park to the city. The inter-relationship between the two has created conversation and a more convergent cultural landscape that defines a new resilience effort which did not exist before.
Although the local fabric was changed by the saturated area of new residential buildings and the mass development of office buildings, the similarity in resilience development illustrated the potential convergence trend between the increased developed area and the decreased undeveloped area. The consistent enrichment of the eco-system enables the resilience of the water resources. Active planning was made by the consistent enrichment of the contributions of the tourist center, landscape, and cable-stayed bridge. The planning has combined the resilience results of cultural festivals and pond contexts by planning installation varieties to illustrate the artworks of light to take advantage of the water and pond surface.
This study only presented an initial effort to share wetland conservation findings. Future research should aim to explore diversified developing patterns of ponds with extended relationships to local cultural events, such as the Lotus Festival held in summer.
Author Contributions
Conceptualization, methodology, validation, formal analysis, investigation, resources, 3D scan data curation, writing—original draft preparation, writing—review and editing, visualization, supervision, and project administration, N.-J.S.; validation, formal analysis, investigation, resources, writing—original draft preparation, visualization, data curation, Figure 1. photograph credit, Y.-T.Q. All authors have read and agreed to the published version of the manuscript.
Funding
This research received no external funding.
Institutional Review Board Statement
Not applicable for studies not involving questionnaires, humans, or animals.
Informed Consent Statement
Not applicable.
Data Availability Statement
Data, images, government reports are available in publicly accessible repositories that do not issue DOIs. GIS-related information can be seen from https://www.tcd.gov.tw/statement_c.php and https://maps.nlsc.gov.tw/MbIndex_qryPage.action?fun=3. (in Chinese).
Acknowledgments
The authors would like to appreciate the providers of open source data, images, and government reports.
Conflicts of Interest
The authors declare no conflict of interest.
References
- Bristow, G.; Healy, A. Crisis response, choice and resilience: Insights from complexity thinking. Camb. J. Reg. Econ. Soc. 2015, 8, 241–256. [Google Scholar] [CrossRef] [Green Version]
- Lyon, C.; Parkins, J.R. Toward a Social Theory of Resilience: Social Systems, Cultural Systems, and Collective Action in Transitioning Forest-Based Communities: Social Systems and Cultural Systems. Rural Sociol. 2013, 78, 528–549. [Google Scholar] [CrossRef]
- Norris, F.H.; Stevens, S.P.; Pfefferbaum, B.; Wyche, K.F. Community Resilience as a Metaphor, Theory, Set of Capacities, and Strategy for Disaster Readiness. Am. J. Community Psychol. 2008, 41, 127–150. [Google Scholar] [CrossRef] [PubMed]
- Welsh, M. Resilience and responsibility: Governing uncertainty in a complex world. Geogr. J. 2014, 180, 15–26. [Google Scholar] [CrossRef]
- LaDon, S.; Sempier, T.; Boehm, C.; Wright, C.; Thompson, J. Tourism Resilience Index: A Business Self-Assessment. In MASGP-15-007-02. U.S. Department of Commerce; National Oceanic and Atmospheric Administration (NOAA): Washington, DC, USA, 2015. [Google Scholar]
- Strickland-Munro, J.K.; Allison, H.E.; Moore, S.A. Using resilience concepts to investigate the impacts of protected area tourism on communities. Ann. Tour. Res. 2010, 37, 499–519. [Google Scholar] [CrossRef] [Green Version]
- United Nations. United Nations Sustainable Development Knowledge Platform. Sustainable Tourism. 2016. Available online: https://sustainabledevelopment.un.org/topics/sustainabletourism (accessed on 18 November 2020).
- Ettenger, K. Marine Tourism, Climate Change, and Resilience in the Caribbean, Vol. I—Ocean Health, Fisheries, and Marine Protected Areas; Ettenger, K., Ed.; Business Expert Press: New York, NY, USA, 2017; pp. 3–8. [Google Scholar]
- National Oceanic and Atmospheric Administration (NOAA). Sea Grant Coastal Tourism Vision Plan 2018–2028, Submitted August 31, 2018. Available online: https://seagrant.noaa.gov/Portals/1/FINAL%20%20Coastal%20Tourism%20Vision%20Plan%20.pdf (accessed on 14 November 2020).
- Sandhu, S.C.; Kelkar, V.; Sankaran, V. Resilient Coastal Cities for Enhancing Tourism Economy: Integrated Planning Approaches. Asian Development Bank Institute, No. 1043. November 2019. Available online: https://www.adb.org/sites/default/files/publication/541031/adbi-wp1043.pdf (accessed on 14 November 2020).
- Cole, S.; Browne, M. Tourism and Water Inequity in Bali: A Social-Ecological Systems Analysis. Hum. Ecol. 2015, 43, 439–450. [Google Scholar] [CrossRef]
- Hadwen, W.L. Lake Tourism: An Integrated Approach to Lacustrine Tourism Systems. Ann. Tour. Res. 2006, 34, 555–556. [Google Scholar] [CrossRef]
- Cooper, C. Lakes as Tourism Destination Resources. In Lake Tourism—An Integrated Approach to Lacustrine Tourism Systems 2006; Hall, C.M., Härkönen, T., Eds.; Channel View Publications: Bristol, UK, 2006; pp. 27–42. [Google Scholar]
- Water as Leverage. City Report—Semarang/Indonesia. 2018. Available online: https://waterasleverage.org/file/download/57980135/waterasleverage-city-report-semarang.pdf (accessed on 13 November 2020).
- Özkundakci, D.; Lehmann, M.K. Lake resilience: Concept, observation and management. N. Z. J. Mar. Freshw. Res. 2019, 53, 481–488. [Google Scholar] [CrossRef] [Green Version]
- Chin, N.; Day, J.; Sydnor, S.; Prokopy, L.S.; Cherkauer, K.A. Exploring tourism businesses’ adaptive response to climate change in two Great Lakes destination communities. J. Destin. Mark. Manag. 2019, 12, 125–129. [Google Scholar] [CrossRef]
- Dokulil, M.T. Environmental Impacts of Tourism on Lakes. In Eutrophication: Causes, Consequences and Control; Ansari, A.A., Gill, S.S., Eds.; Springer: Dordrecht, The Netherlands, 2014; pp. 81–88. [Google Scholar] [CrossRef]
- Brookes, J.D.; Carey, C.C. Resilience to Blooms. Science 2011, 334, 46–47. [Google Scholar] [CrossRef]
- Lusen Environmental Engineering Office. Beinan Creek Watershed Wetland Ecological Corridor Survey Report. Taitung County Government. Available online: https://wetland-tw.tcd.gov.tw/upload/file/20190603154347298.pdf (accessed on 18 November 2020). (In Chinese)
- Scheffer, M.; van Nes, E.H. Shallow lakes theory revisited: Various alternative regimes driven by climate, nutrients, depth and lake size. Hydrobiologia 2007, 584, 455–466. [Google Scholar] [CrossRef] [Green Version]
- Jeppesen, E.; Meerhoff, M.; Davidson, T.A.; Trolle, D.; Søndergaard, M.; Lauridsen, T.L.; Beklioglu, M.; Brucet, S.; Volta, P.; González-Bergonzoni, I. Climate change impacts on lakes: An integrated ecological perspective based on a multi-faceted approach, with special focus on shallow lakes. J. Limnol. 2014, 73, 88–111. [Google Scholar] [CrossRef] [Green Version]
- Zhou, X.Y. The research of the Anodonta Woodiana to Improve the Water Color of Pond. Master’s Thesis, Institute of Civil Engineering, National Chiao Tung University, Hsinchu, Taiwan, 2009. [Google Scholar]
- Folgado-Fernández, J.A.; Di-Clemente, E.; Hernández-Mogollón, J.M.; Campón-Cerro, A.M. Water Tourism: A New Strategy for the Sustainable Management of Water-Based Ecosystems and Landscapes in Extremadura (Spain). Land 2019, 8, 2. [Google Scholar] [CrossRef] [Green Version]
- Opršal, Z.; Kladivo, P.; Machar, I. The role of selected biophysical factors in long-term land-use change. Appl. Ecol. Environ. Res. 2016, 14, 23–40. [Google Scholar] [CrossRef]
- Izakoviˇcová, Z.; Mederly, P.; Petroviˇc, F. Long-Term Land Use Changes Driven by Urbanisation and Their Environmental Effects (Example of Trnava City, Slovakia). Sustainability 2017, 9, 1553. [Google Scholar] [CrossRef] [Green Version]
- Oertli, B.; Parris, K.M. Review: Toward management of urban ponds for freshwater biodiversity. Ecosphere 2019, 10, e02810. [Google Scholar] [CrossRef] [Green Version]
- Nozdrovická, J.; Dostál, I.; Petrovič, F.; Jakab, I.; Havlíˇcek, M.; Skokanová, H.; Falt’an, V.; Mederly, P. Land-Use Dynamics in Transport-Impacted Urban Fabric: A Case Study of Martin–Vrútky, Slovakia. Land 2020, 9, 273. [Google Scholar] [CrossRef]
- Svenningsena, S.R.; Levinb, G.; Perner, M.L. Military land use and the impact on landscape: A study of land use history on Danish Defence sites. Land Use Policy 2019, 84, 114–126. [Google Scholar] [CrossRef]
- Zimmer, A.; Véron, R.; Cornea, N.L. Urban ponds, environmental imaginaries and (un)commoning: An urban political ecology of the pondscape in a small city in Gujarat, India. Water Altern. 2020, 13, 225–247. [Google Scholar]
- Sharifi, A. Resilient urban forms: A macro-scale analysis. Cities 2019, 85, 1–14. [Google Scholar] [CrossRef]
- Cardoso, M.A.; Telhado, M.J.; Almeida, M.D.C.; Brito, R.S.; Pereira, C.; Barreiro, J.; Morais, M. Following a Step by Step Development of a Resilience Action Plan. Sustainability 2020, 12, 9017. [Google Scholar] [CrossRef]
- Desouza, K.C.; Flanery, T.H. Designing, planning, and managing resilient cities: A conceptual framework. Cities 2013, 35, 89–99. [Google Scholar] [CrossRef]
- Meerow, S.; Newell, J.P.; Stults, M. Defining urban resilience: A review. Landsc. Urban Plan. 2016, 147, 38–49. [Google Scholar] [CrossRef]
- Zhang, M.; Zhang, J.; Li, G.; Zhao, Y. A Framework for Identifying the Critical Region in Water Distribution Network for Reinforcement Strategy from Preparation Resilience. Sustainability 2020, 12, 9247. [Google Scholar] [CrossRef]
- Kurleto, M. Sustainable management of lakes taking into consideration the tourism and nature conservation in Australia and New Zealand. Pol. J. Natur. Sc. 2013, 28, 91–106. [Google Scholar]
- Mitchell, B. Integrated water management. In Integrated Water Management; Mitchell, B., Ed.; Belhaven: London, UK, 1990; pp. 1–21. [Google Scholar]
- Klessig, L.L. Lakes and society: The contribution of lakes to sustainable societies. Lakes Reserv. Res. Manag. 2001, 6, 95–101. [Google Scholar] [CrossRef]
- Mark, S.R. Natural Heritage and the Maintenance of Iconic Stature: Crater Lake, Oregon, USA. In Lake Tourism: An Integrated Approach to Lacustrine Tourism Systems 2006; Hall, C.M., Härkönen, T., Eds.; Channel View Publications: Bristol, UK, 2006; pp. 45–66. [Google Scholar] [CrossRef]
- Lehmann, M.K.; Nguyen, U.; Muraoka, K.; Allan, M.G. Regional trends in remotely sensed water clarity over 18 years in the Rotorua Lakes, New Zealand. N. Z. J. Mar. Freshw. Res. 2019, 53, 513–535. [Google Scholar] [CrossRef]
- Liou, Y.; Wang, T.S.; Chan, H.P. Impacts of Pond Change on the Regional Sustainability of Water Resources in Taoyuan, Taiwan. Adv. Meteorol. 2013, 2013, 243456. [Google Scholar] [CrossRef] [Green Version]
- Department of Urban Development, Taoyuan City Government. Digital Topographic Map. Available online: https://tymap.tycg.gov.tw/tygispreview/apply/ (accessed on 10 July 2020).
- Urban and Rural Development Branch, Construction and Planning Agency Geospatial One Stop (TGOS). Ministry of the Interior, Taiwan. Available online: http://nsp.tcd.gov.tw/ngis/ (accessed on 10 July 2020).
- National Land Surveying and Mapping Center (NLSC). Map Service. Ministry of the Interior, Taiwan. Available online: https://maps.nlsc.gov.tw/ (accessed on 10 July 2020).
- Center for GIS, RCHSS, Academia Sinica. A 100-Year historical Map of Taiwan. Available online: http://gissrv5.sinica.edu.tw/GoogleApp/JM20K1904_1.php (accessed on 19 October 2020). (In Chinese).
- Taoyuan Irrigation Association. Irrigation Plans of Taoyuan. In Collections of Irrigation-Related Maps in Japanese Colonial Rule. 2009. Available online: http://webgis.sinica.edu.tw/map_irrigation/Canal_E01.html (accessed on 25 November 2020). (In Chinese).
- Chen, C.S. A Geography of Taiwan Vol. III—Irrigation Ponds in Tao-Yuan Alluvial Fan; Fu-Min Geographical Institute of Economic Development: Taipei, Taiwan, 1955; p. 1108. (In Chinese) [Google Scholar]
- Urban and Rural Development Branch, Ministry of the Interior, Taiwan. Wetland Conservation and Utilization Plan. 2014. Available online: https://wetland-tw.tcd.gov.tw/tw/Landprotect.php (accessed on 19 October 2020). (In Chinese)
- Taoyuan City Government. Land. Available online: https://www.tycg.gov.tw/ch/home.jsp?id=10450&parentpath=0,10403,10449 (accessed on 25 November 2020).
- Department of Urban Development, Taoyuan. National Wetland Conservation Project—Farm Ponds Survey; Taoyuan City Government: Taoyuan, Taiwan, 2011.
- Chen, C.P. Taoyuan Canal and Kwangfu System Survey. 2013. Available online: https://www.hakka.gov.tw/File/Attach/37587/File_70121.pdf (accessed on 22 May 2020).
- Ministry of the Interior. The National Key Wetland Conservation and Use Plan of the Ponds and Canals in Taoyuan Area, Taiwan; Ministry of the Interior: Taipei, Taiwan, 2019. (In Chinese) [Google Scholar]
- Ministry of the Interior. The National Key Wetland Conservation and Use Plan of the Ponds and Canals in Jianan Area, Taiwan; Ministry of the Interior: Taipei, Taiwan, 2019. (In Chinese) [Google Scholar]
- Gunderson, L.H.; Carpenter, S.R.; Folke, C.; Olsson, P.; Peterson, G.D. Water RATs (resilience, adaptability, and transformability) in lake and wetland social-ecological systems. Ecol. Soc. 2006, 11, 16. [Google Scholar] [CrossRef]
- Urban and Rural Development Branch, Ministry of the Interior, Taiwan. Wetland Conservation Act. Available online: https://wetland-tw.tcd.gov.tw/en/Law.php (accessed on 20 November 2020).
- Tsai, Y.Y.; Yen, K.C.; Chi, S.N. Study on the Impact of Pond Landscape Changes on the Urban Land Resource Use in Taiwan Taoyuan City. In Proceedings of the 2015 6th International Conference on Environmental Science and Technology, IPCBEE 2015, Singapore, 23–24 May 2015; Volume 84, pp. 63–69. [Google Scholar] [CrossRef]
- North Region Water Resources Office. Water Activation Plan of Shimen Reservoir Water Supply District; Water Resources Agency, Ministry of Economic Affairs: Taipei, Taiwan, 2014. (In Chinese)
- Taoyuan City Government. Report of the Detail Plan for the Special District of High Speed Rail Station in Taoyuan—the Second Comprehensive Review of First Stage Zoning Ordinance; Taoyuan City Government: Taoyuan, Taiwan, 2017; pp. 2, 10, 15 & 17. (In Chinese)
- Ministry of Interior, Taiwan. Conservation Plan for Important National Wetland 2011–2016. 2010. Available online: http://subject.forest.gov.tw/web/2015/%E3%80%8C%E5%9C%8B%E5%AE%B6%E9%87%8D%E8%A6%81%E6%BF%95%E5%9C%B0%E4%BF%9D%E8%82%B2%E8%A8%88%E7%95%AB%E3%80%8D_100-105%E5%B9%B4__%E6%A0%B8%E5%AE%9A%E6%9C%AC%EF%BC%89990701.pdf (accessed on 20 November 2020). (In Chinese)
- Ministry of Interior, Taiwan. Conservation and Utilization Plan of the Ponds and Canals on Taoyuan Tableland. 2017. Available online: https://wetlandfiles.tcd.gov.tw/upload/file/20190823094350863.pdf (accessed on 19 October 2020). (In Chinese)
- Chen, C.M. Intelligent hydraulic engineering of Taoyuan 14A Detention Pond Eliminates the Suffering of Flood. Taoyuan E-News. 23 May 2020. Available online: https://tyenews.com/2020/05/62825/ (accessed on 7 June 2020).
- Irrigation Agency. Detailed description of Pond Character, Taoyuan Management Office. Available online: https://www.iatyu.nat.gov.tw/canal-detail.asp?w=91 (accessed on 7 June 2020).
- Office of Public Construction, Taoyuan. Commissioned Planning, Design, and Supervision Project of Taoyuan Museum. 2017. Available online: https://opc.tycg.gov.tw/pubprogram/upload/imgprview.jsp?file=hotnews/201710311450401.jpg&flag=pic&filetablename=HotNewsFile&serno=201710310040&detailno=2 (accessed on 24 November 2020).
- Taoyuan City Government. Revision to the Detailed Plan of the Special District of Taoyuan THSR Station (the Second Comprehensive Review) (Land Zoning Control Act) (the First Stage); Taoyuan City Government: Taoyuan, Taiwan, 2020.
- Nuissl, H.; Haaseb, D.; Lanzendorf, M.; Wittmer, H. Environmental impact assessment of urban land use transitions—A context-sensitive approach. Land Use Policy 2009, 26, 414–424. [Google Scholar] [CrossRef]
- Kilianova, H.; Pechanec, V.; Brus, J.; Kirchner, K.; Machar, I. Analysis of the development of land use in the Morava River floodplain, with special emphasis on the landscape matrix. Morav. Geogr. Rep. 2017, 25, 46–59. [Google Scholar] [CrossRef] [Green Version]
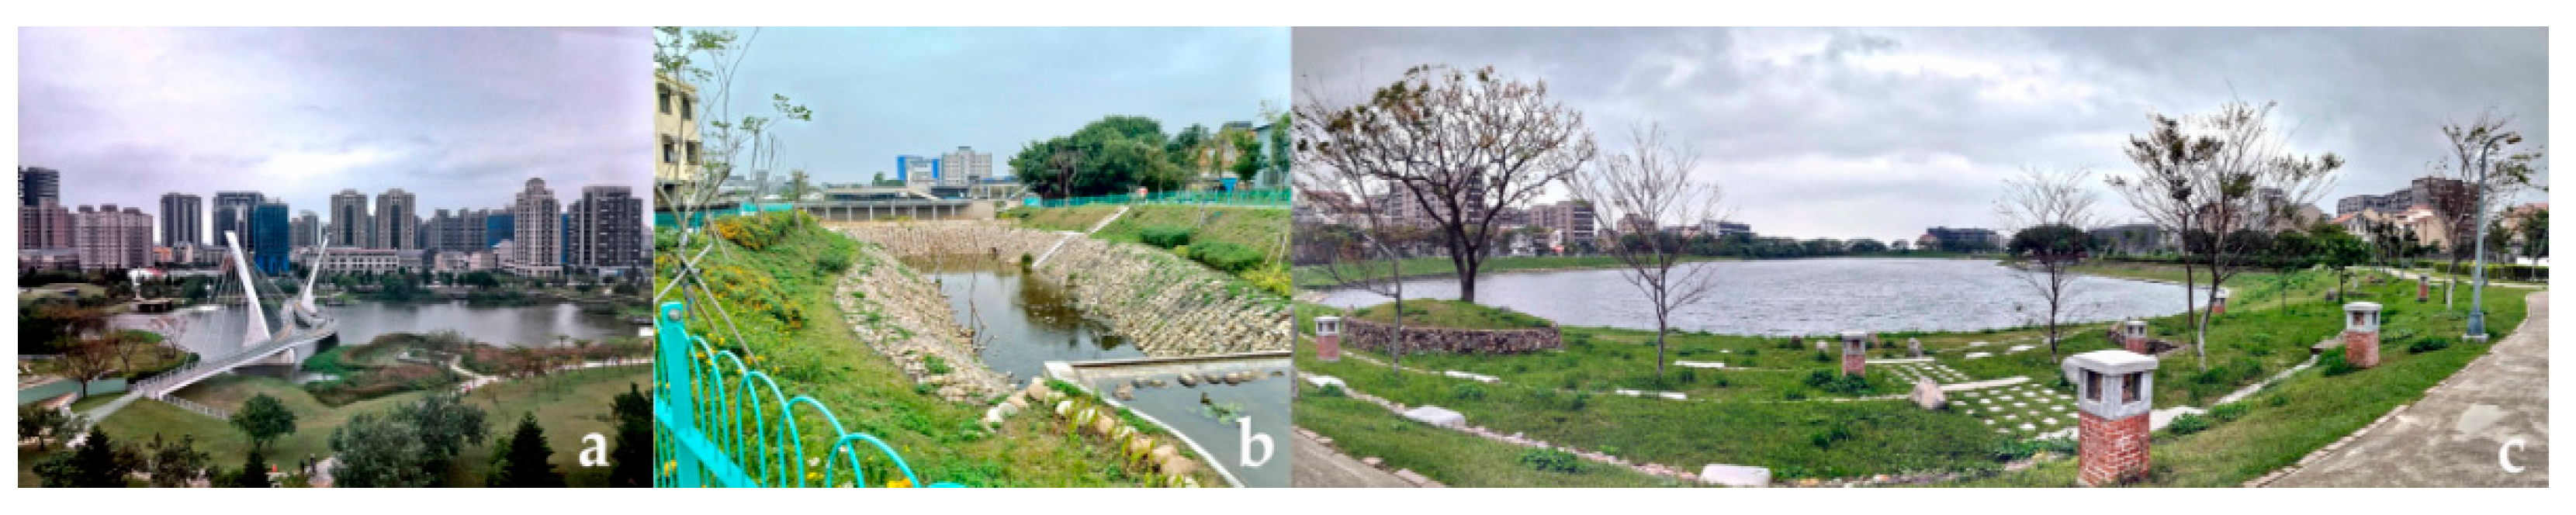
Figure 1.
Various installations and facilities around (a) Blue Pond Park, (b) Chung Yuan Eco Pond Park, and (c) Hengshan Calligraphy Park.
Figure 1.
Various installations and facilities around (a) Blue Pond Park, (b) Chung Yuan Eco Pond Park, and (c) Hengshan Calligraphy Park.

Figure 2.
Flowchart.

Figure 3.
Historic satellite images (top) and the process to define the boundary and estimate the area (bottom).
Figure 3.
Historic satellite images (top) and the process to define the boundary and estimate the area (bottom).

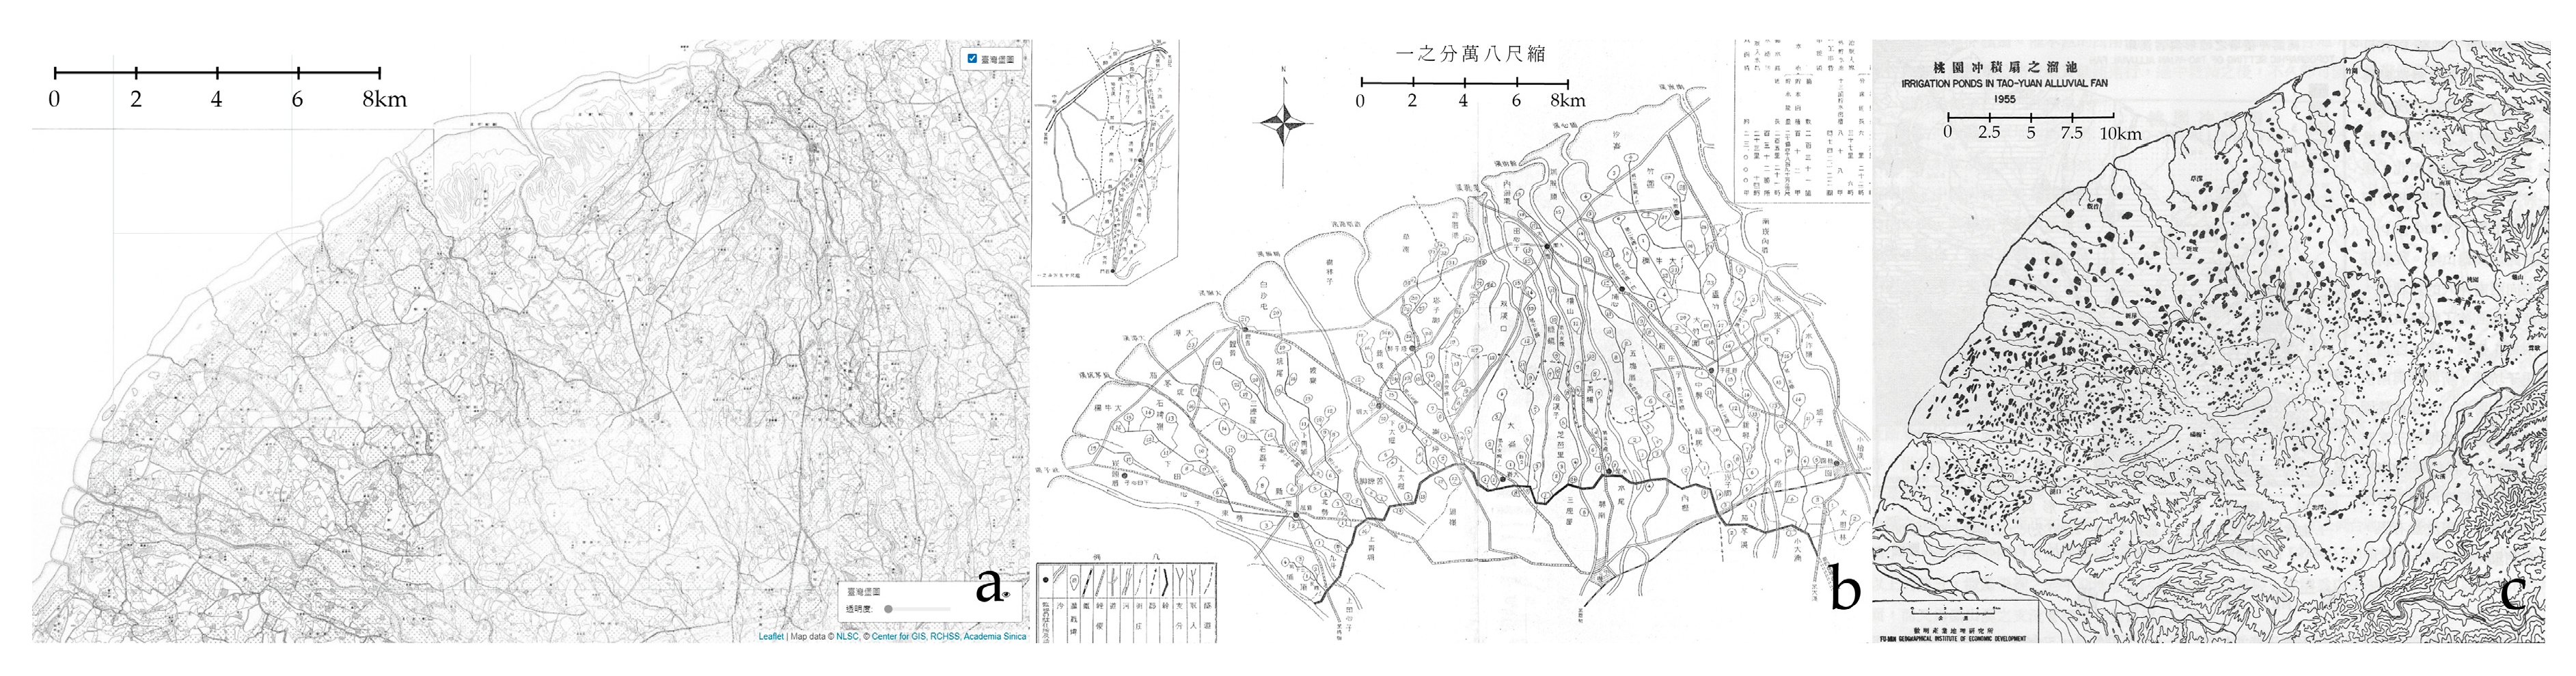
Figure 4.
Farm pond system developed (a) in 1904 [44], adapted from Center for GIS, (b) upon the completion of the Taoyuan Canal in 1924 [45], adapted from Taoyuan Irrigation Association with a scale representing the original Chinese note of 1/80,000 on top, and (c) upon the completion of the Shimen Reservoir in 1964 [46], adapted from Chen, C.S.

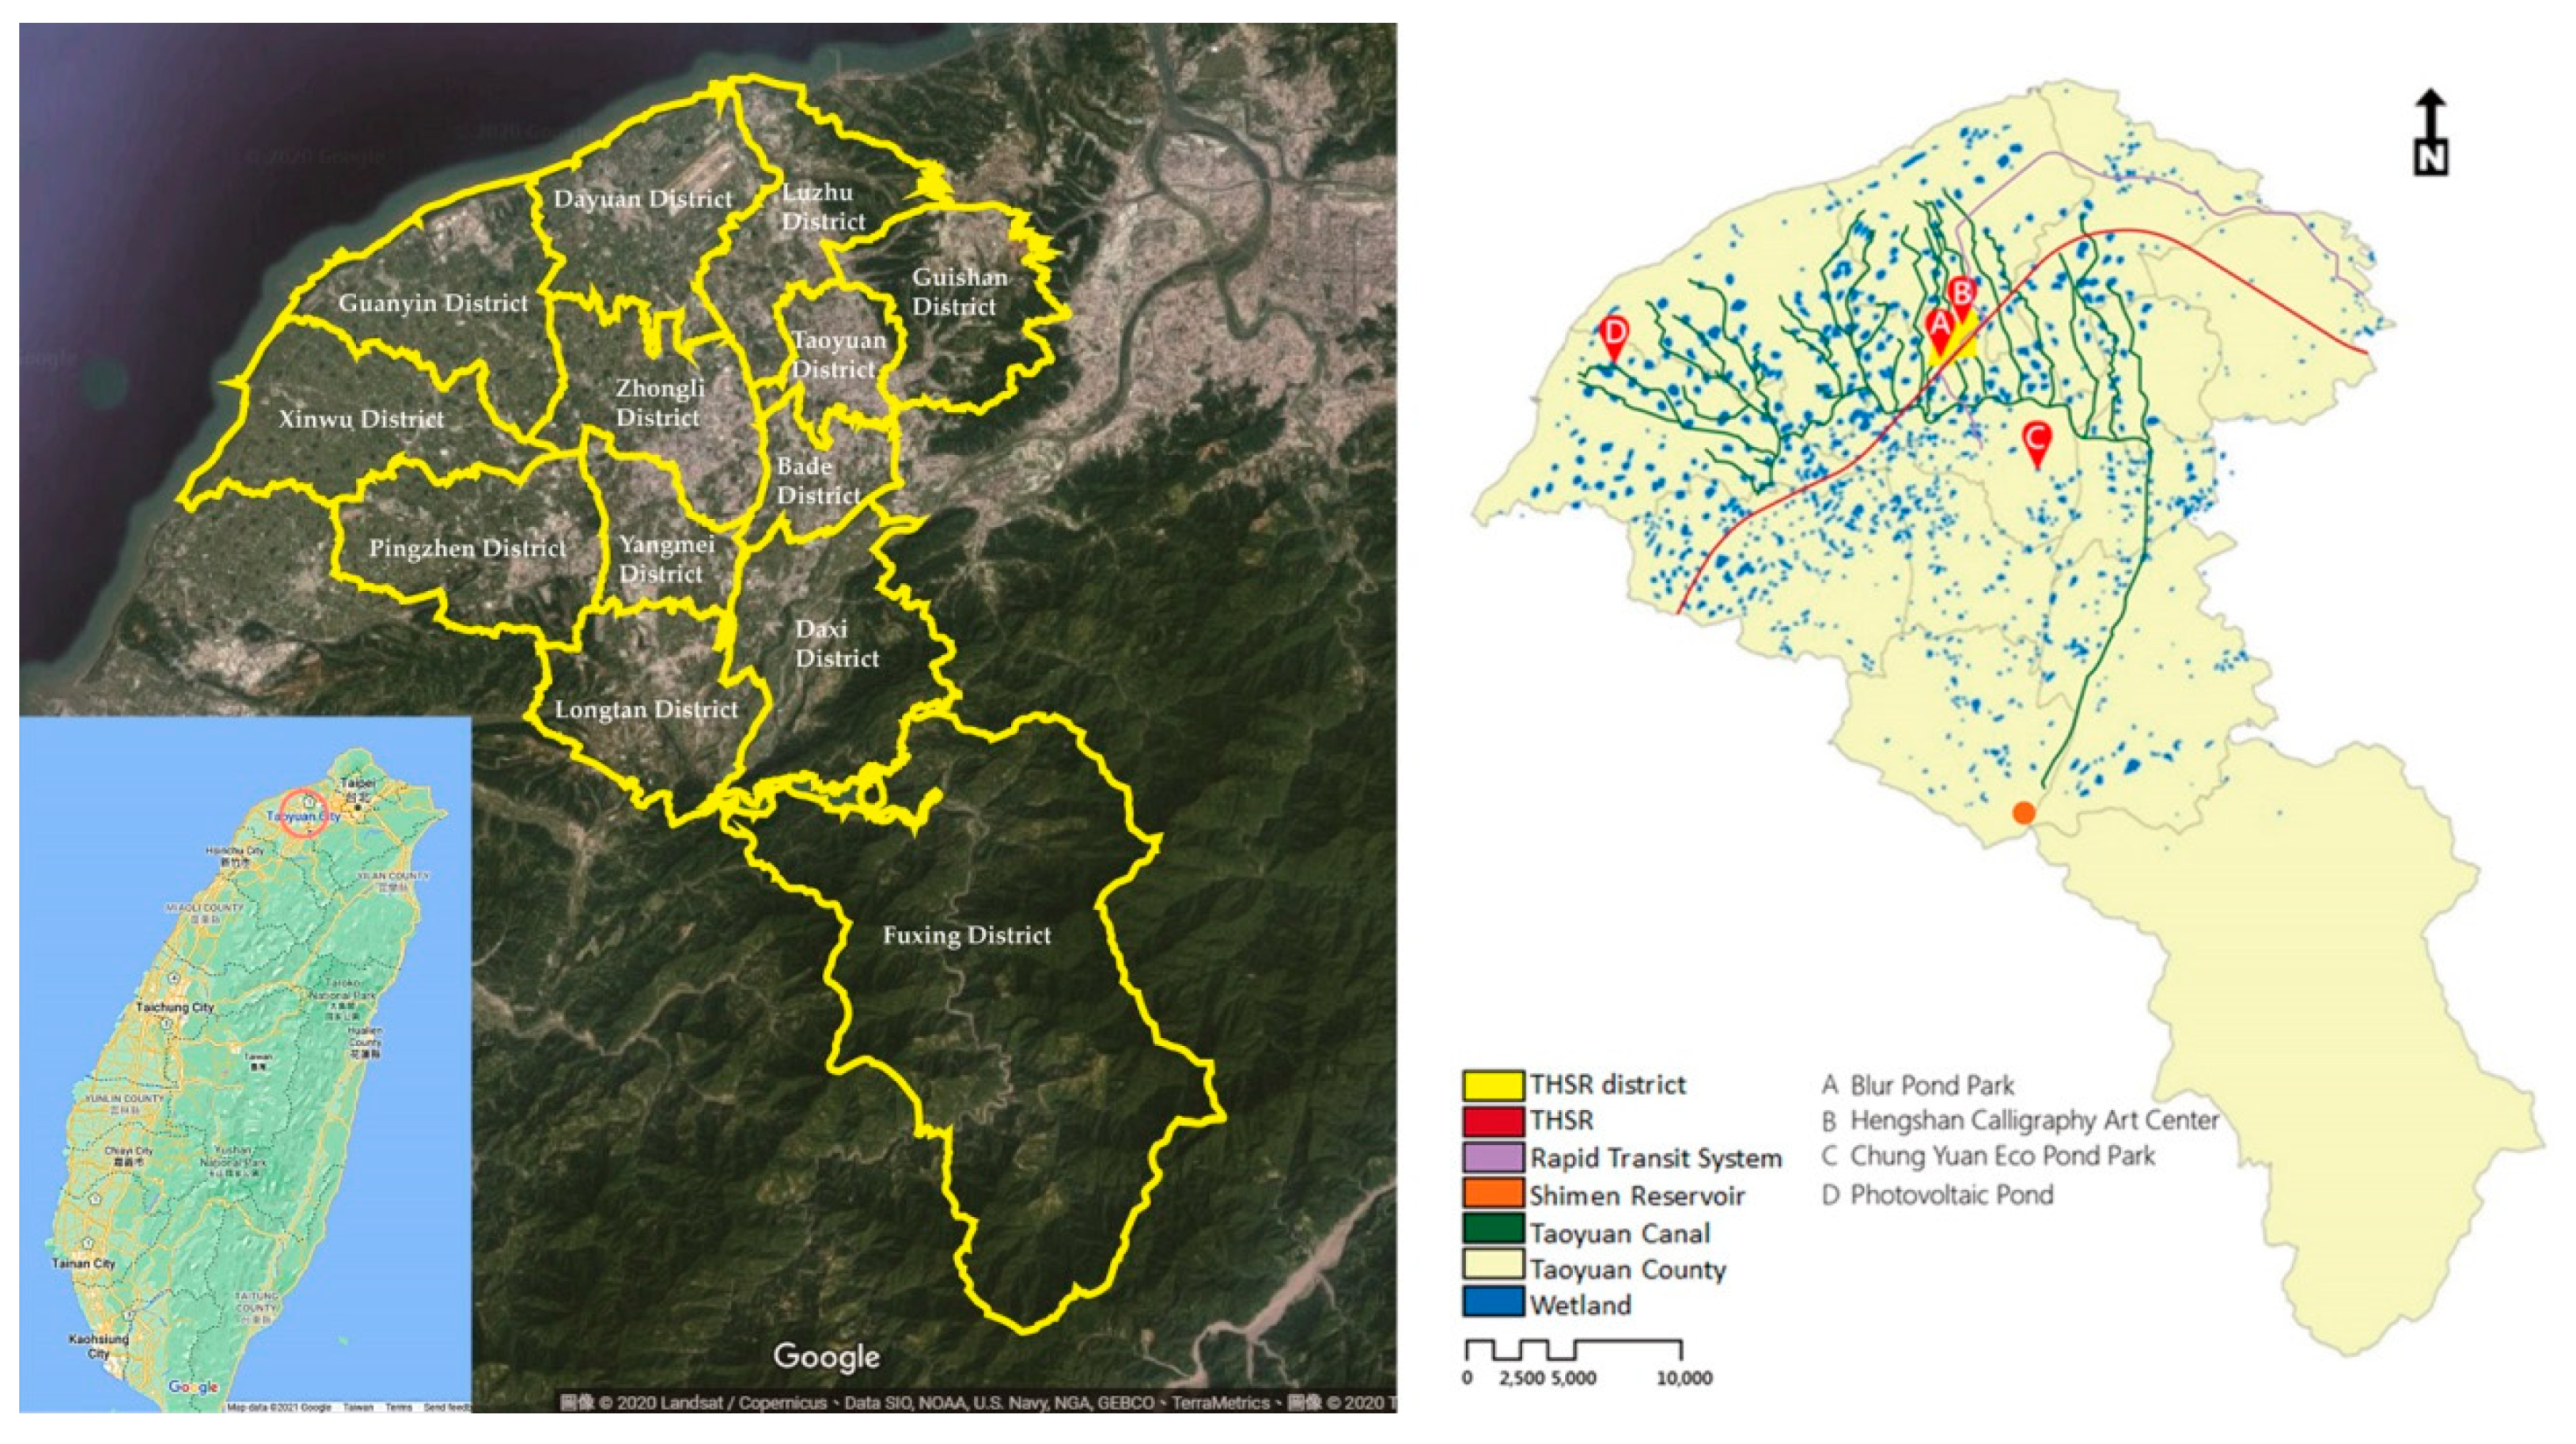
Figure 5.
Pond distribution (left) and wetland conservation boundary (right [47], adapted from Urban and Rural Development Branch) in Taoyuan.
Figure 5.
Pond distribution (left) and wetland conservation boundary (right [47], adapted from Urban and Rural Development Branch) in Taoyuan.

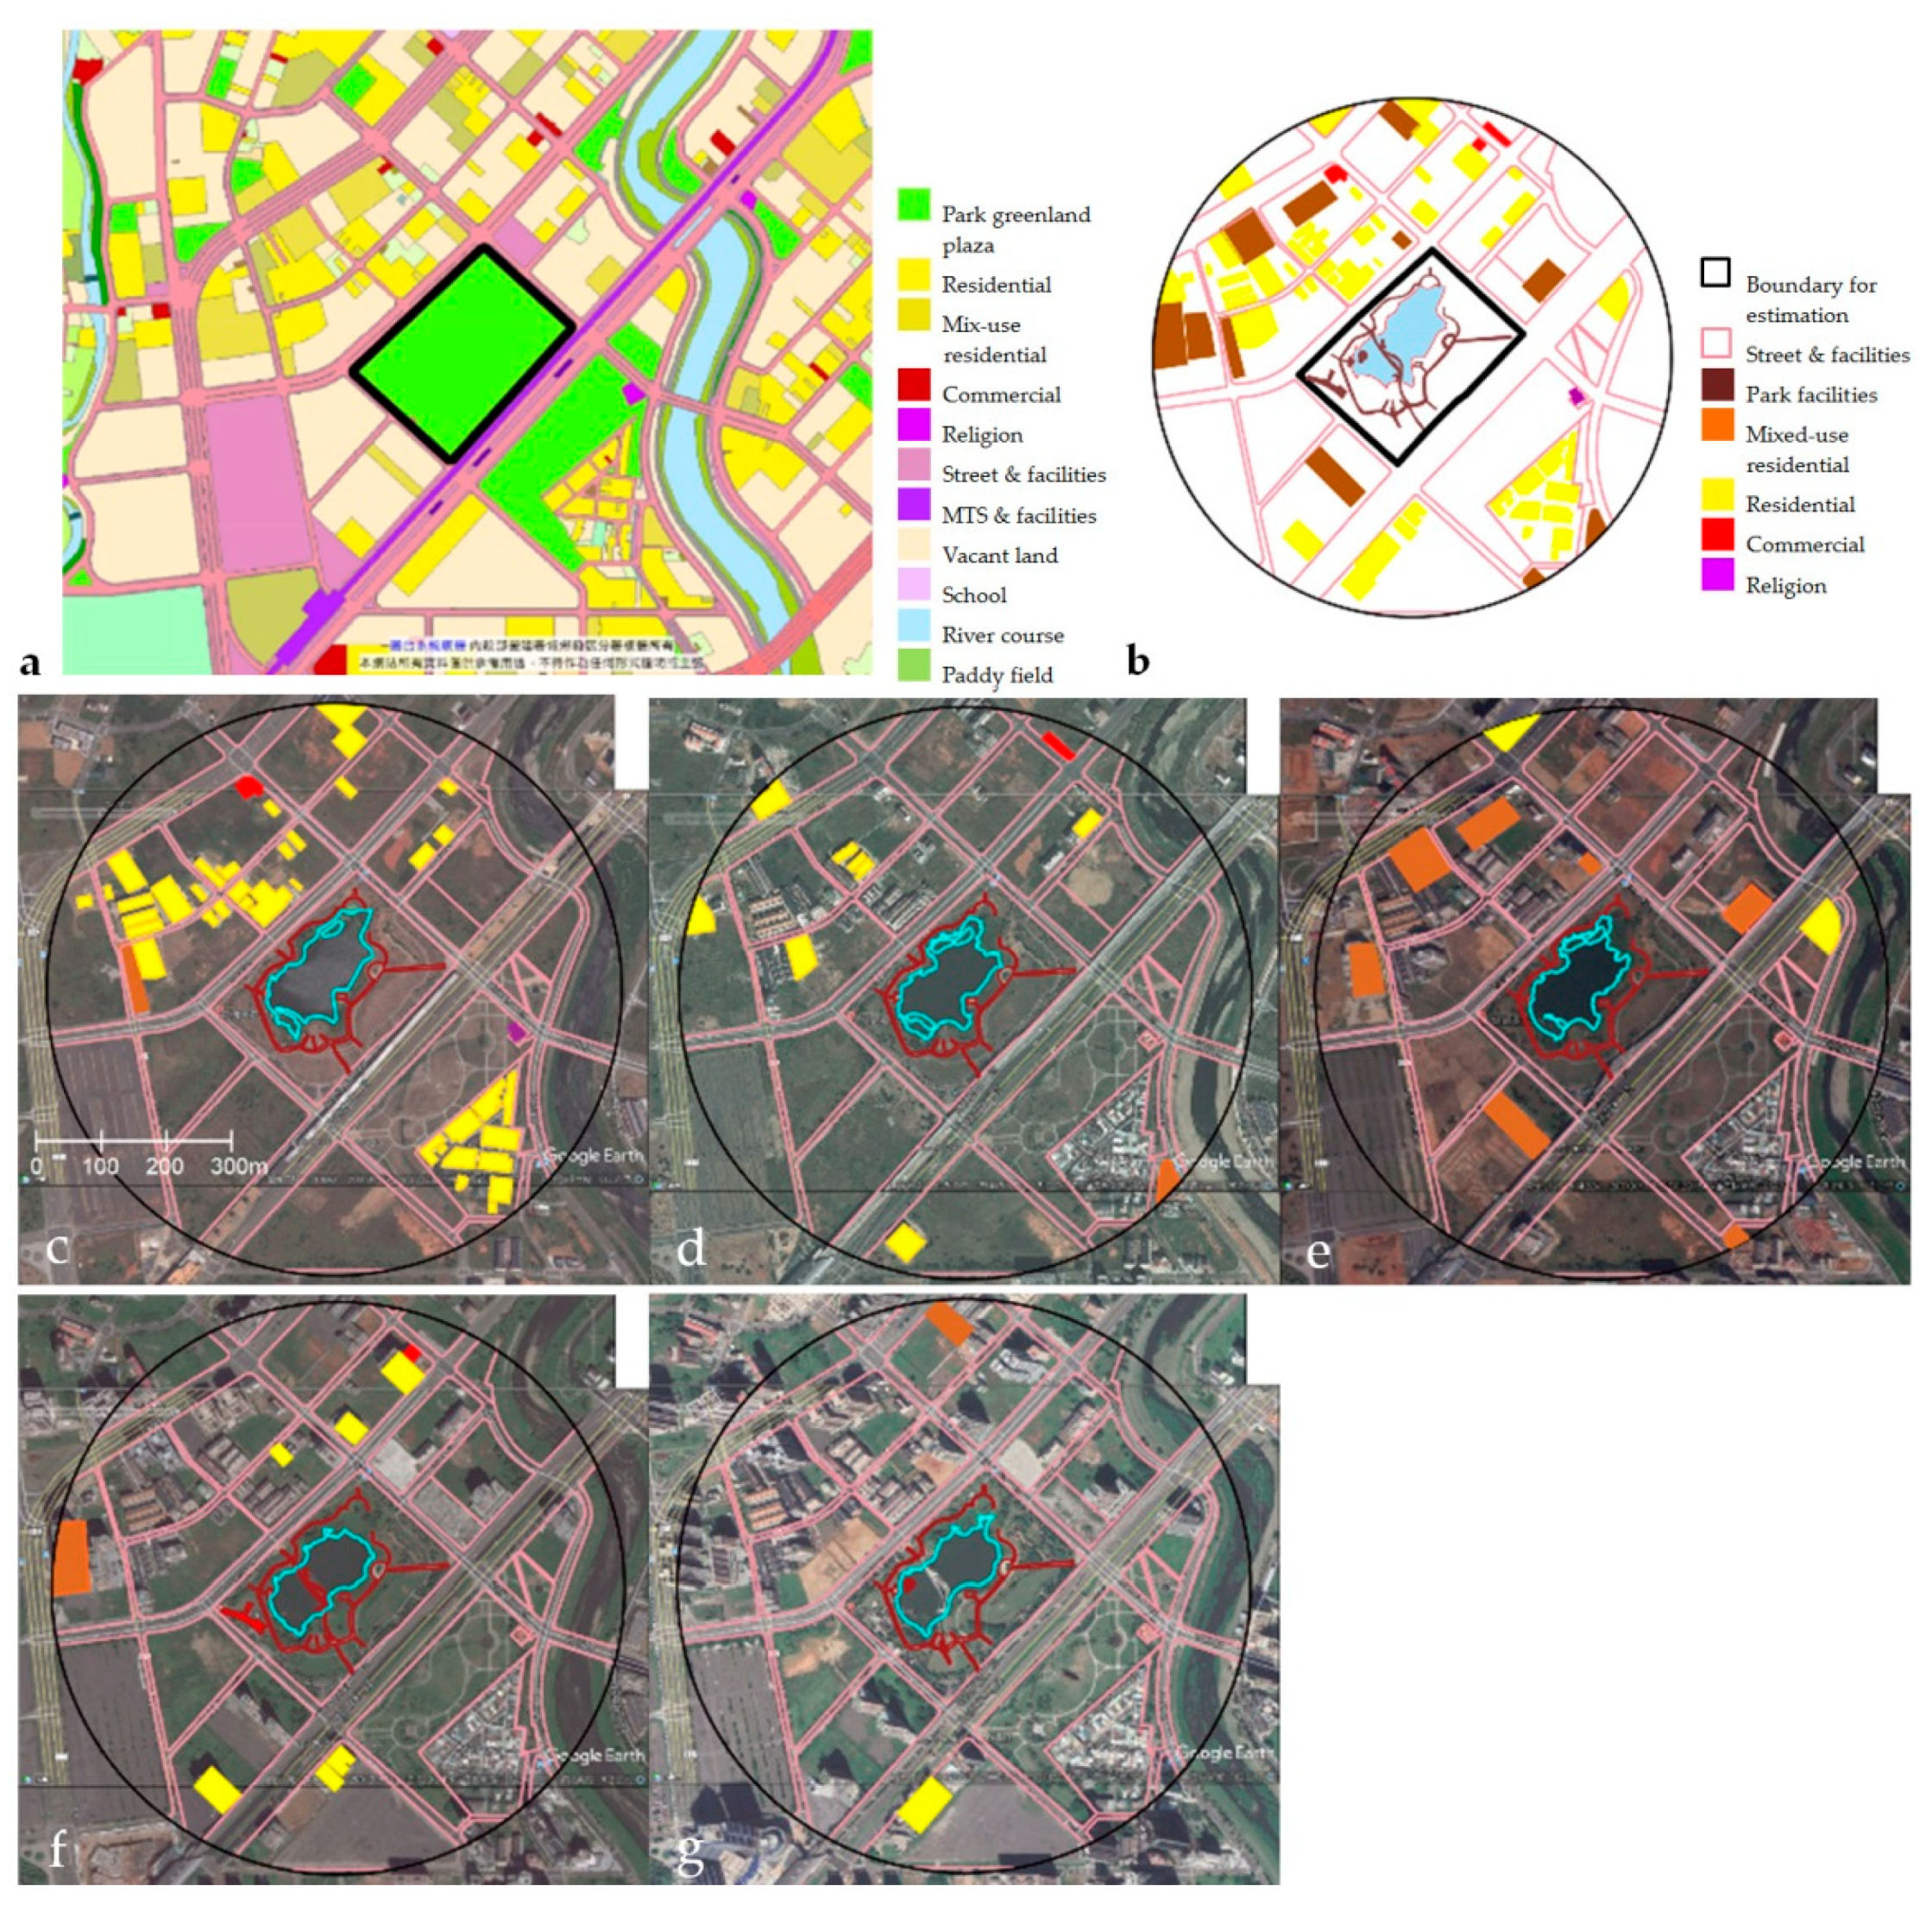
Figure 6.
Land use districts in 2019 (a) and building types in 2020 (b); area of modifications is highlighted for (c) 2010, (d) 2012, (e) 2014, (f) 2016, and (g) 2018.
Figure 6.
Land use districts in 2019 (a) and building types in 2020 (b); area of modifications is highlighted for (c) 2010, (d) 2012, (e) 2014, (f) 2016, and (g) 2018.

Figure 7.
Changed area of lands and the newly added or developed area of buildings around Blue Pond Park.
Figure 7.
Changed area of lands and the newly added or developed area of buildings around Blue Pond Park.

Figure 8.
Land use districts (a) and building types (b) around Hengshan Calligraphy Park; highlighted area of modifications made in (c) 2010, (d) 2012, (e) 2014, (f) 2016, and (g) 2018.
Figure 8.
Land use districts (a) and building types (b) around Hengshan Calligraphy Park; highlighted area of modifications made in (c) 2010, (d) 2012, (e) 2014, (f) 2016, and (g) 2018.

Figure 9.
Changed area of lands and newly added or developed area of building types around Hengshan Calligraphy Park.
Figure 9.
Changed area of lands and newly added or developed area of building types around Hengshan Calligraphy Park.

Figure 10.
Land use districts (a) and building types (b) around Chung Yuan Eco Pond Park; highlighted area of modifications made in (c) 2010, (d) 2013, (e) 2014, (f) 2016, and (g) 2018.
Figure 10.
Land use districts (a) and building types (b) around Chung Yuan Eco Pond Park; highlighted area of modifications made in (c) 2010, (d) 2013, (e) 2014, (f) 2016, and (g) 2018.

Figure 11.
Newly added or developed area of building types around Chung Yuan Eco Pond Park.

Figure 12.
Land use districts (a) and building types (b) around the photovoltaic pond; highlighted area of modifications made on (c) 2009, (d) 2011, (e) 2013, (f) 2015, (g) 2017, and (h) 2019.
Figure 12.
Land use districts (a) and building types (b) around the photovoltaic pond; highlighted area of modifications made on (c) 2009, (d) 2011, (e) 2013, (f) 2015, (g) 2017, and (h) 2019.

Figure 13.
Changed area of undeveloped land and newly added or developed area of building types around the photovoltaic pond (no. 12-14).
Figure 13.
Changed area of undeveloped land and newly added or developed area of building types around the photovoltaic pond (no. 12-14).

Figure 14.
The illustration of the two types of boundary: (a) the projection of the 3D point cloud; (b) the Blue Pond in the yellow color boundary and 2016 Google Earth Pro® image in the blue color boundary; (c) blue boundary: 4635.26 m2; (d) yellow boundary: 5332.86 m2; (e) pink boundary: 697.6 m2 in 15% tolerance.

Figure 15.
The evolving direction of pond development from the initial stage, converging, and intersection to the switching position.
Figure 15.
The evolving direction of pond development from the initial stage, converging, and intersection to the switching position.

Figure 16.
Two ponds, museum (2024), rails, and Taiwan High Speed Rail (THSR) station.


Table 1.
Constructions made at the same location as ponds [50], adapted from Chen, C.P.
Table 1.
Constructions made at the same location as ponds [50], adapted from Chen, C.P.
| Pond No. | Constructions | Year |
|---|---|---|
| 1-1 | community and junior high school | 1976 |
| 1-2 | elementary school and junior high school | 1995 |
| 1-3 | high school and special education school | 1991 |
| 1-5 | city hall | 1980 |
| 1-6 | government office and court building | 1980 |
| 1-8 | elementary school and junior high school | 1980 |
| 1-13 | social welfare organization | 1991 |
| 1-14 | elementary school and eco-park | 1998 |
| 2-21, 2-22, 2-1-4 | air base | around 1941 |
| 2-27, 2-28, 2-29, 2-1-5, 2-1-6, 2-3-2, 2-4-2, 2-4-3 | international airport | 1976 |
| 5-7, 6-5 | Taiwan High Speed Rail (THSR) station | 2001 |
Table 2.
Planning strategy for the development of ponds by the government [54], adapted from Urban and Rural Development Branch; [58], adapted from Ministry of Interior; [59], adapted from Ministry of Interior].
| Year | Plans and Policies | Contents |
|---|---|---|
| 2000 | Greening and Beautification Policies, Taoyuan County | |
| 2003 | Pond Canal Revitalization Plan, Taoyuan County | |
| 2005 | Demonstrative Engineering Site of Canal Revitalization | |
| 2007 | Blue Pond Park: 6.3 hectare, USD 1.2 million with USD 1.0 million supported by government. | |
| 2009 | Conservation and Reward Regulation of Canal Revitalization, Taoyuan County | Conservation of water resource and humanity landscape with supporting functions, such as irrigation, landscape, culture, leisure, ecology, and hazard prevention. |
| 2011 | Wetland Conservation and Utilization Plan, Taoyuan County (2011–2016) | Applicable to 11 districts, 340 ponds. |
| 2012 | Pond Revitalization and Rejuvenation Plan, Taoyuan County | Including three pond parks per year, ten parks in three years, since 2012. |
| 2015 | Wetland Conservation Act | Applied level and number: 2 international and 40 national activities in Taiwan were involved. |
| 2016 | Wetland Regional Strategic Program of Action | Sustainable development of wetland and cross-agencies collaboration and interaction. |
Table 3.
Annual alternations of pond water area based on satellite images.
| Blue Pond Park | year | 2010 | 2012 | 2014 | 2016 | 2018 | 2020 |
| area (m2) | 15,615.64 | 14,251.24 | 13,910.23 | 12,750.67 | 13,215.28 | 14,590.87 | |
| difference | 0 | –1364.40 | –341.01 | –1159.56 | +464.61 | +1375.59 | |
| Hengshan Calligraphy Park | year | 2010 | 2012 | 2014 | 2016 | 2018 | 2020 |
| area (m2) | 45,571.60 | 45,390.46 | 42,041.57 | 28,602.53 | 42,552.33 | 43,541.57 | |
| difference | 0 | –181.14 | –3348.89 | –13,439.04 | +13,949.8 | +989.24 | |
| Chung Yuan Eco Pond Park | year | 2010 | 2012 | 2014 | 2016 | 2018 | 2020 |
| area (m2) | 6814.0 | 6042.58 | 6469.01 | 6631.76 | 9103.78 | 9103.78 | |
| difference | 0 | –771.42 | +426.43 | +162.75 | +2472.02 | 0 | |
| Photovoltaic Park | year | 2010 | 2013 | 2014 | 2016 | 2018 | 2020 |
| area (m2) | 37,322.81 | ||||||
| difference | 0 | ||||||
Table 4.
The annual changes in pond water area (m2) between satellite image and map.
| Blue Pond Park | Hengshan Calligraphy Park | Chung Yuan Eco Pond Park | Photovoltaic Park | |
|---|---|---|---|---|
| A: satellite image |  |  |  |  |
| 2020 | 2020 | 2020 | 2019 | |
| B: map |  |  |  |  |
| 2008 | ||||
| A area (m2) | 14,590.87 | 43,541.57 | 9103.78 | 37,322.81 |
| B area (m2) | 14,318.40 | 46,785.70 | 8107.68 | 28,834.41 |
| A − B (m2) | −272.47 | +3244.13 | −996.1 | −8488.4 |
| A − B (%) | −2 | 7 | −12 | −29 |
Publisher’s Note: MDPI stays neutral with regard to jurisdictional claims in published maps and institutional affiliations. |
© 2021 by the authors. Licensee MDPI, Basel, Switzerland. This article is an open access article distributed under the terms and conditions of the Creative Commons Attribution (CC BY) license (http://creativecommons.org/licenses/by/4.0/).
Share and Cite
MDPI and ACS Style
Shih, N.-J.; Qiu, Y.-T. The Morphology of Evolved Urban Fabric around Farm Ponds. Remote Sens. 2021, 13, 437. https://0-doi-org.brum.beds.ac.uk/10.3390/rs13030437
AMA Style
Shih N-J, Qiu Y-T. The Morphology of Evolved Urban Fabric around Farm Ponds. Remote Sensing. 2021; 13(3):437. https://0-doi-org.brum.beds.ac.uk/10.3390/rs13030437
Chicago/Turabian StyleShih, Naai-Jung, and Yi-Ting Qiu. 2021. "The Morphology of Evolved Urban Fabric around Farm Ponds" Remote Sensing 13, no. 3: 437. https://0-doi-org.brum.beds.ac.uk/10.3390/rs13030437
Note that from the first issue of 2016, this journal uses article numbers instead of page numbers. See further details here.