Article

New Understanding of Bar Top Hollows in Dryland Sandy Braided Rivers from Outcrops with Unmanned Aerial Vehicle and Ground Penetrating Radar Surveys

1
School of Geosciences, China University of Petroleum (East China), Qingdao 266580, China
2
Key Laboratory of Deep Oil and Gas, China University of Petroleum (East China), Qingdao 266580, China
3
College of Earth Science and Engineering, Shandong University of Science and Technology, Qingdao 266590, China
4
Research Institute of Shanghai Branch, CNOOC, Shanghai 200335, China
5
College of Oceanography and Space Informatics, China University of Petroleum (East China), Qingdao 266580, China
*
Author to whom correspondence should be addressed.
Submission received: 14 December 2020 / Revised: 24 January 2021 / Accepted: 3 February 2021 / Published: 4 February 2021
(This article belongs to the Special Issue Remote Sensing of Dryland River Systems)

Abstract

:
Bar top hollows (BTHs) are morphological elements recognized in modern braided rivers; however, information regarding their depositional features and types of filling units in ancient strata is unclear. This is an important reason behind why it is difficult to identify BTH units in subsurface reservoirs. A Middle Jurassic dryland sandy braided river outcrop in northwestern China is characterized in this study through the application of an unmanned aerial vehicle (UAV) surveying and mapping, and ground penetrating radar (GPR). A workflow of UAV data processing has been established, and a 3D digital outcrop model has been built. By observation and measurement of the outcrop model and GPR profiles, two types of BTH filled units were found: (a) sandstone-filled, and (b) mudstone-filled hollows. Both of these units were located between two adjacent bar units in an area that is limited to a compound bar, and were developed in the upper part of a braided bar depositional sequence. The ellipse-shaped, sandstone-filled unit measures 10 m × 27 m in map view and reaches a maximum thickness of 5 m. The transversal cross-section across the BTHs displays a concave upward basal surface, while the angle of the inclined structures infilling the BTHs decreases up-section. The GPR data show that, in the longitudinal profile, the basal surface is relatively flat, and low-angle, inclined layers can be observed in the lower- and middle part of the sandstone-filled BTHs. In contrast, no obvious depositional structures were observed in the mudstone-filled BTH in outcrop. The new understanding of BTH has a wide application, including the optimization of CO2 storage sites, fresh water aquifers exploration, and oil and gas reservoir characterization.

1. Introduction

Sandy braided rivers are often attractive as oil and gas reservoirs, as they have a high net-to-gross sand ratio, and have always been of interest to geographers, geomorphologists, and sedimentologists [1,2,3,4,5,6,7,8,9]. Sandy braided rivers in dryland often display trough cross-stratified and planar cross-stratified sandstone deposits, which overlie a basal conglomeration lag. However, due to the highly dynamic and complex nature of braided river systems, the resulting sedimentary architecture can become much more intricate (e.g., [2,5,6,10,11,12,13,14,15,16]). Different schemes for the classification of reservoir architecture elements in braided rivers exist. For instance, Miall (1985, 1996) identified eight reservoir architecture elements in the channels and overbanks of braided rivers [17,18]. In addition to sandy architecture elements, braided river systems also deposit fine-grained sediments [19]. Lynds (2006) summarized six types of fine-grained depositional elements in braided rivers: mud plugs, channel-lining muds, inter-bar muds, inclined hetero-lithic strata, flood-plain, and overbank sediments [16]. Hjellbakk (1997) proposed mud-filling channels that differ from sand-filling channels [20]. Best (2006) proposed BTH, a new type of architecture element, in a study of the modern South Saskatchewan River [21]. A BTH is circular to ovoid topographic depression, and is filled by a series of distinct angle of repose foresets. Although BTHs are relatively small in size, they may indicate the paleo-environment and paleo-hydrodynamic conditions, and are therefore helpful for the reservoir heterogeneity characterization of braided bars. However, geological origin and depositional features of BTH fillings are not understood clearly.
In the present study, the reservoir architecture of the Jurassic sandy braided river outcrops in northwestern China is investigated using rock outcrop observations, GPR detection, and UAV mapping. Two types of BTH units are identified including sandstone fillings and mudstone fillings.
In the last ten years, GPR and UAV have been widely used in geological study and the mining industry as useful tools in the characterization of outcrops, modern deposition and in the mapping of mining areas [22,23,24,25,26]. The application of GPR extends the research scope of sedimentologists from visible outcrop sections to invisible outcrop strata and shallow underground strata, which promotes the development of 3D outcrop research. In the outcrop area which has been eroded for a long time, the weathering resistance of different lithologic strata is different. Therefore, the landform of the outcrop area can reflect the characteristics of large-scale plane sedimentation to a certain extent. This understanding extends outcrop study from profile description to regional geomorphological analysis. Due to the above reasons and the development of UAV oblique photography technology, UAV surveying and mapping has shown great application prospects in outcrop research [27]. Jackisch et al. present their work in a carbonatite-hosting outcrop with the integration of multi-technologies and UAV, addressed the limitations and highlights of the use of an integrated unmanned aerial system [28]. Booysen et al. demonstrate the efficiency of the proposed approach at the Lofdal Carbonatite Complex in Namibia, using remotely piloted aircraft system (RPAS)-based hyperspectral imaging [29]. Additionally, multi-technology combination, for instance, gamma exploration, and magnetic survey, becomes the development trend of the application of UAV in geoscientific research. Although UAV is more commonly used in earth surface study and is changing geoscientific research, it is still not widely used in outcrop characterization because of the missing of expertise and guidance [28]. In fact, the application of UAV in outcrop study, which is a basic and important research method in geology, has different research objectives, objects and requirements from that in mining exploration. In this study, a typical application of UAV and GPR in the sedimentary characterization of outcrops is demonstrated. In this case study, a workflow of integrated outcrop study with UAV mapping, GPR detection, in lab test of rock samples, and field observation is introduced, and a new understanding of bar top hollows is proposed.

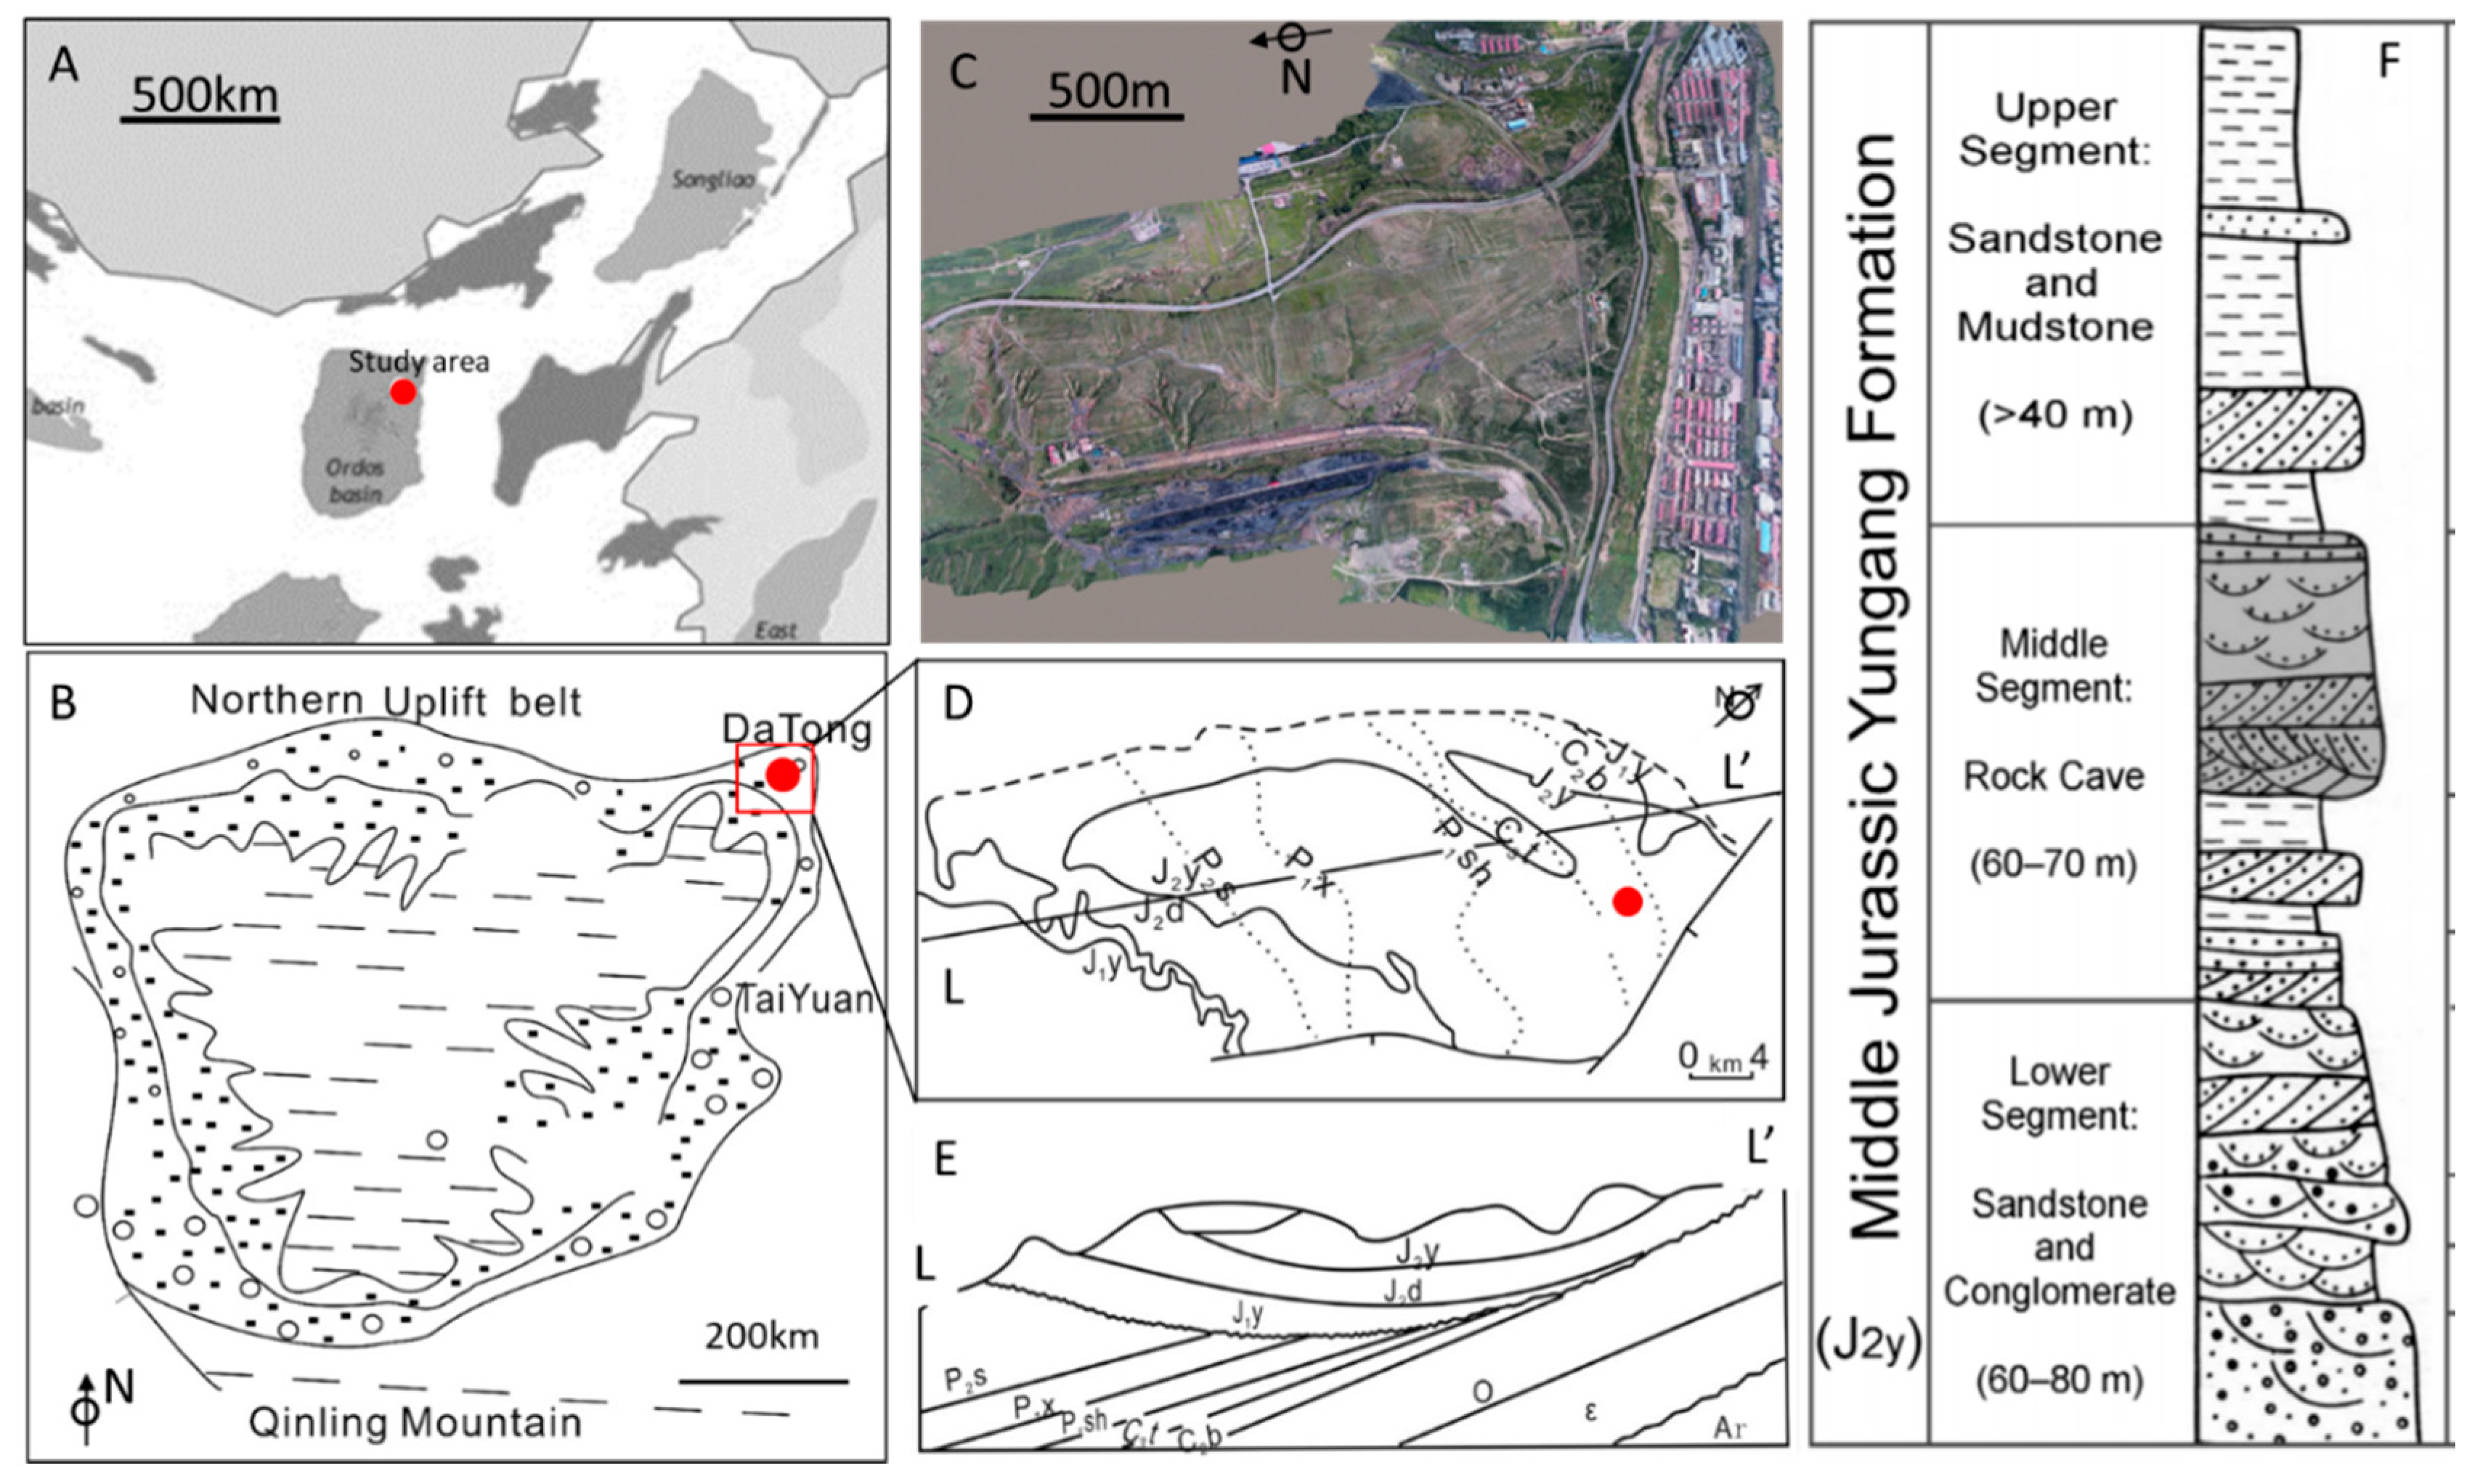
2. Geological Setting

The study outcrop area is located in the Datong region of the Ordos Basin in northwestern China, and is ~10 km away from the present basin margin (Figure 1A,B). Influenced by the late Indosinian movement and Yanshan movement, Jurassic strata in the area have undergone multi-episodes of uplift denudation and down-warp sedimentation, and are in unconformable contact with the underlying strata [30,31] (Figure 1D,E). The paleoclimate of the Ordos Basin changed from semi-humid to arid during the Jurassic period. In the Middle Jurassic period, the basin was dominated by a semi-arid to arid climate [32]. During the Yungang stage of the Middle Jurassic period, the compressional stress of the basin changed from western to eastern compression and a huge fluvial fan system in the dry environment developed in the north of the basin [33]. Braided rivers extend from the fluvial fan to the central part of the basin. Li’s study shows two braided rivers deposited in the study area; they are part of the braided river system and each of them are about 1.5 km in width [4]. During the Late Jurassic period, continuous tectonic uplift exposed the area [31] and the sandy braided river depositions of the Rock Cave member in the Yungang Formation (Middle Jurassic) outcropped (Figure 1C,F). The total thickness of the Yungang Formation in the Datong area is > 160 m, and that of the Rock Cave member is approximately 60–70 m with an exposed thickness of < 40 m [30,34]. In the study area, an east–west railway, which is perpendicular to the paleo-current direction of the ancient river, runs through the five adjacent braided bars and cuts each of them into two parts. Reservoir architecture outcrops in the profiles along the railway (Figure 2).

3. Data and Methods

In addition to observing the outcrop profile, thin section, and porosity analysis, as well as UAV surveying and mapping, 3D digital outcrop modeling, and GPR detection were used. The traditional outcrop study, in which profile observation is the main method, mainly focused on the description of sedimentary structures and reservoir architectures.

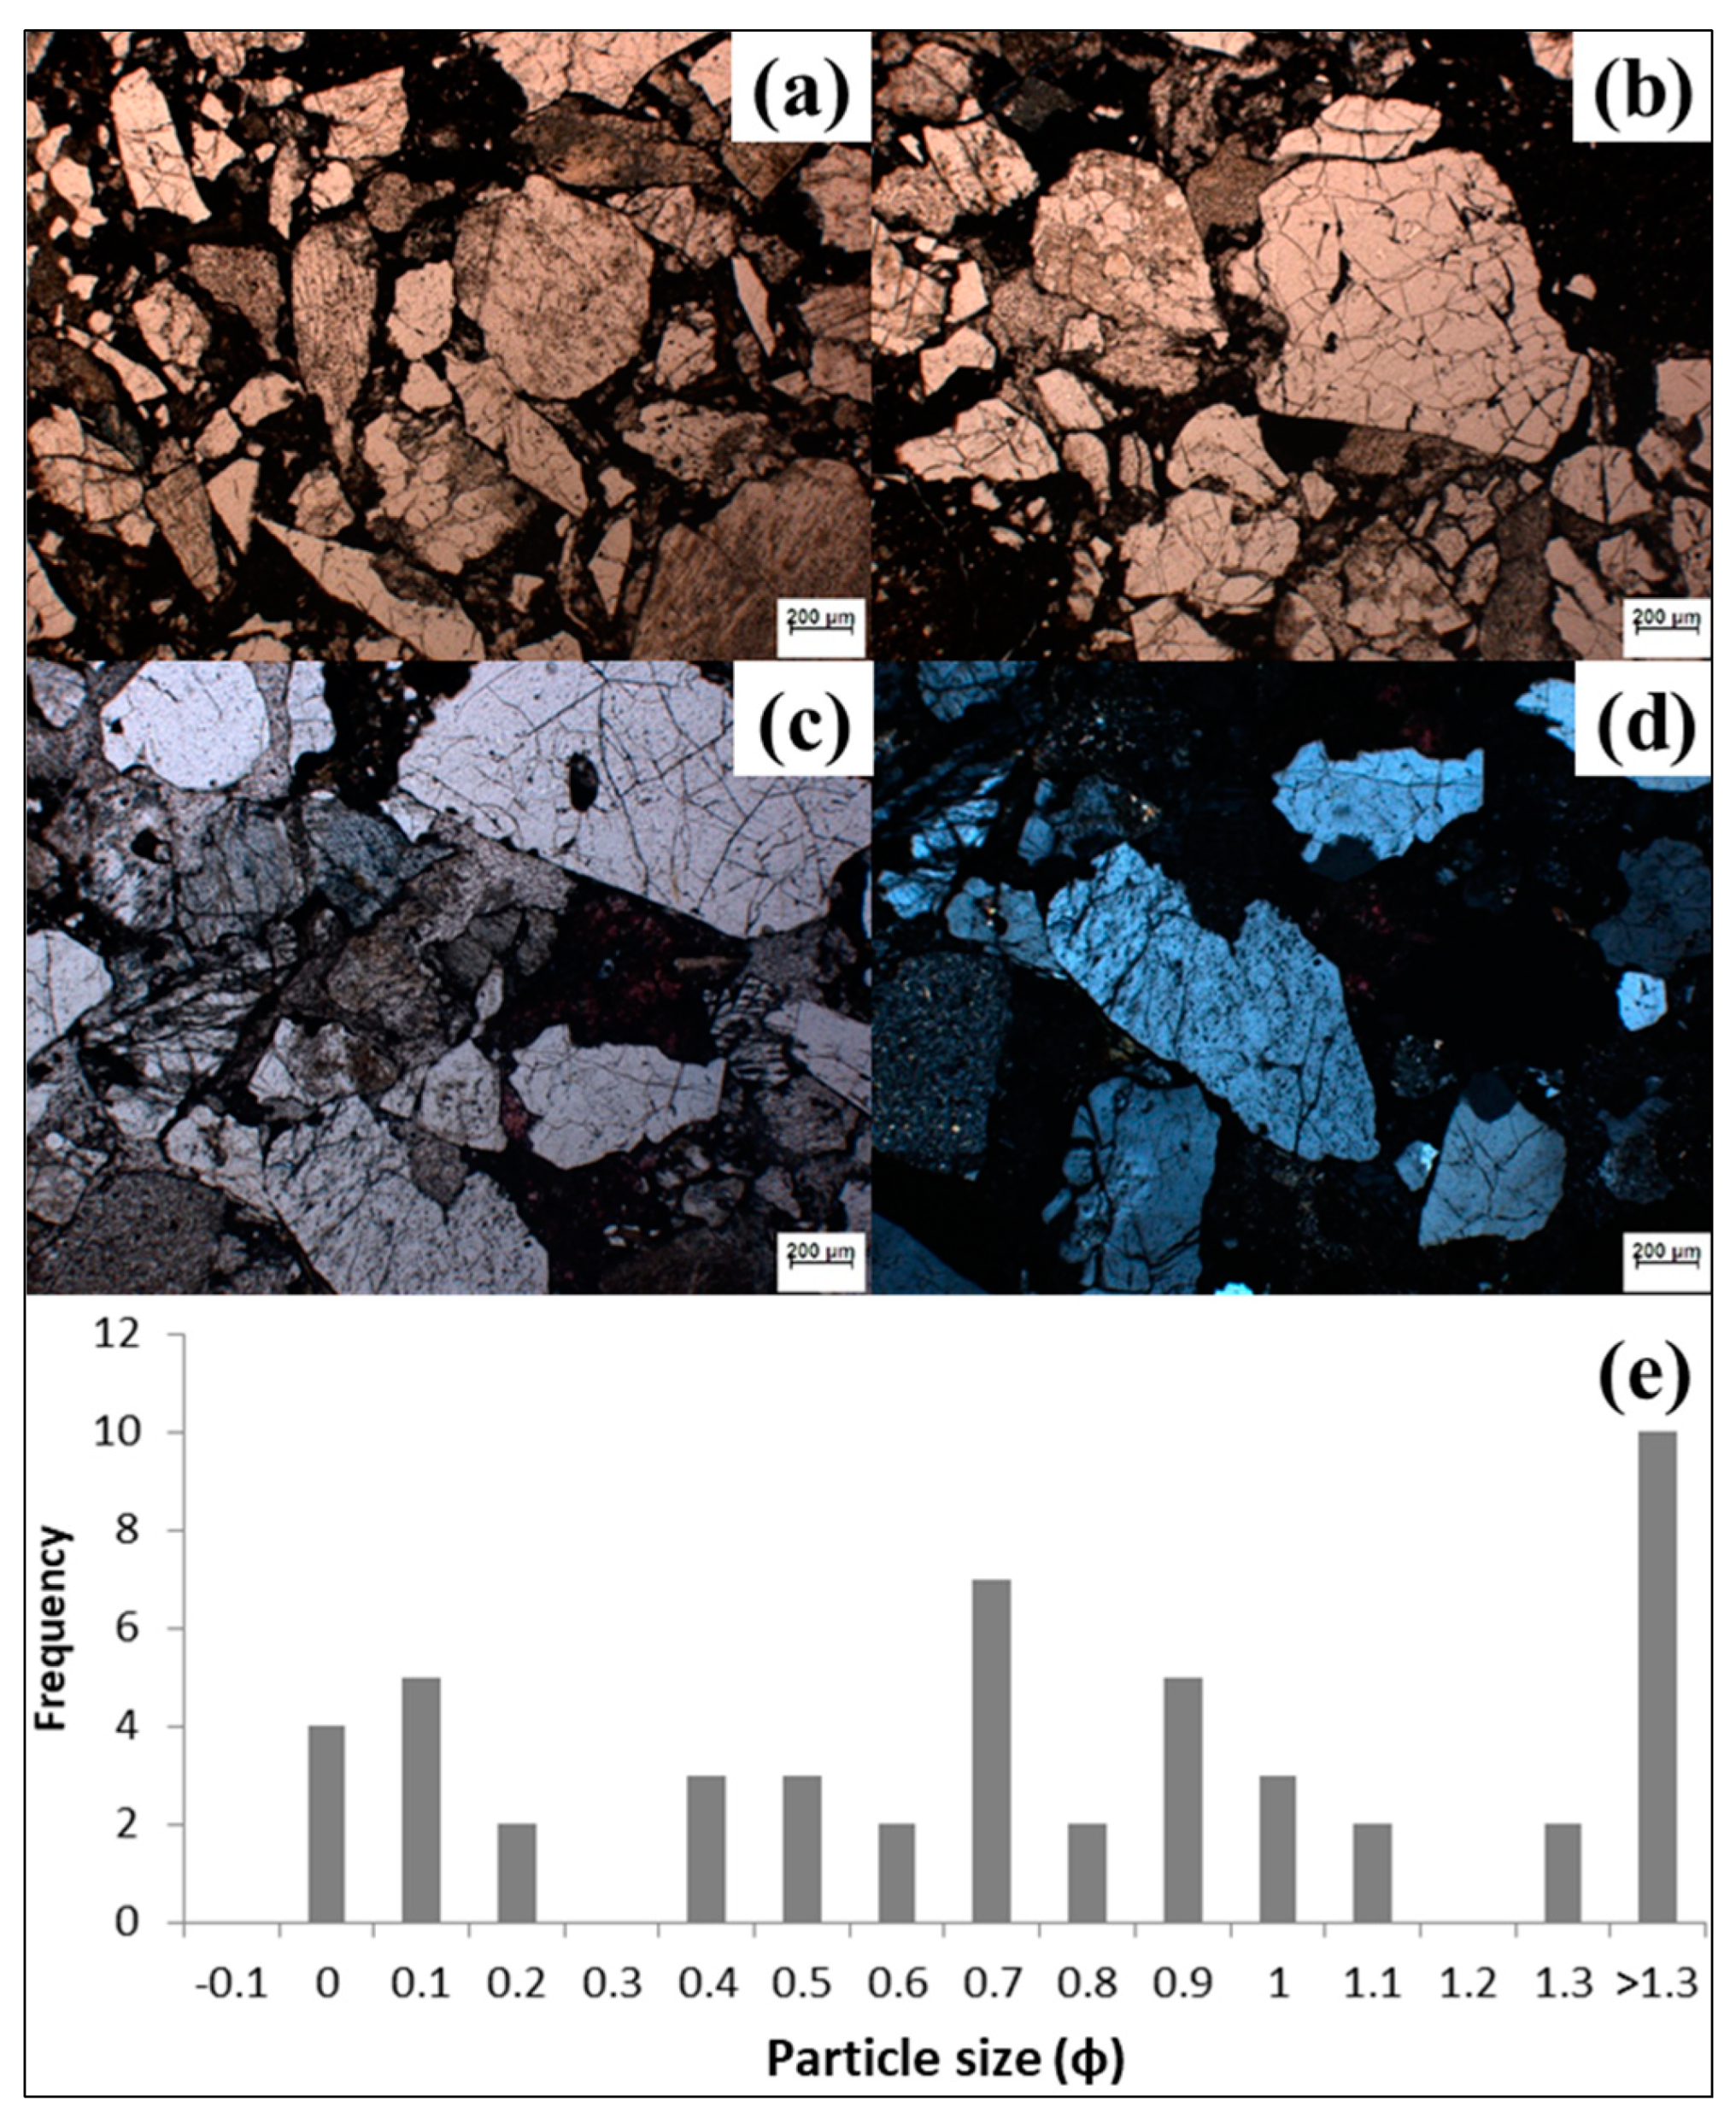
3.1. Thin Section Analysis and Petrophysical Parameters Test

Thin sections of 20 sandstone samples were analyzed to identify lithological features including rock components, content of matrix and cement, particle size, and sorting and roundness of particles. Rock porosity and permeability of 25 sandstone samples were tested with a SCMS-C3 automatic porosity and permeability measurement instrument. These analyses were used to determine the depositional environment of the outcrop strata. Additionally, the rock dielectric constant which is used in GPR data processing was tested with a ZJD-C Dielectric Constant Tester.

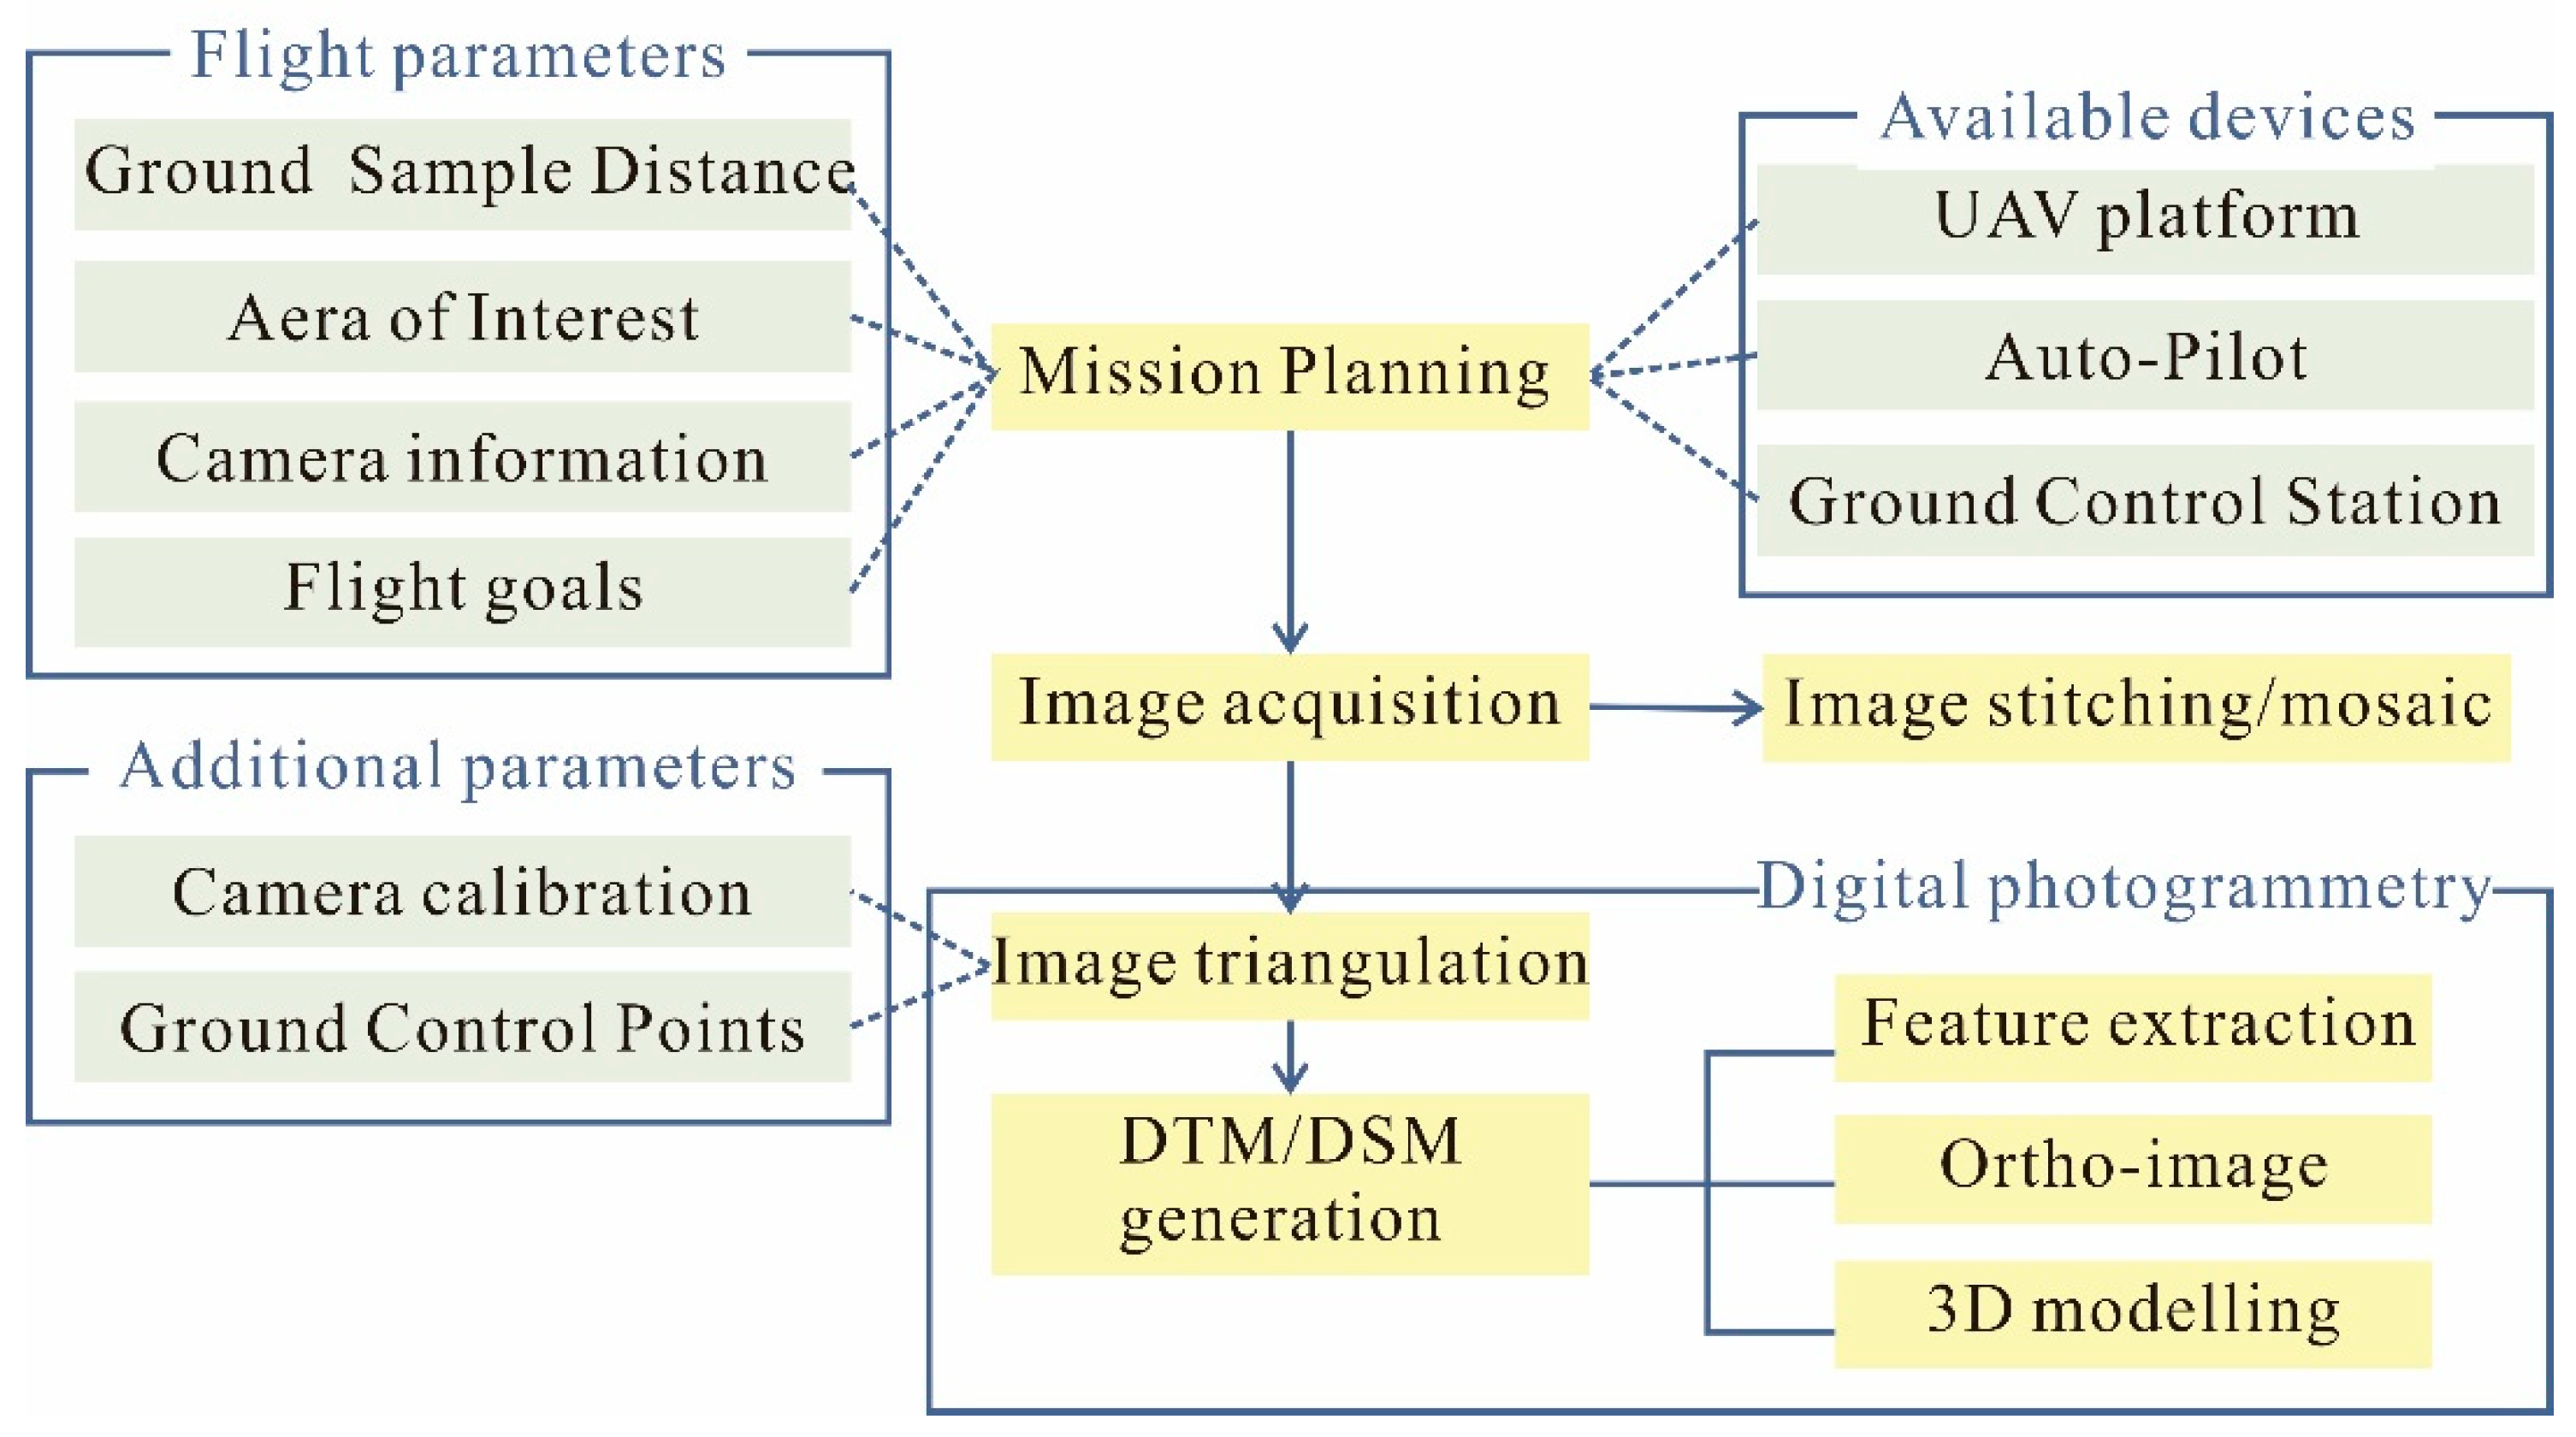
3.2. UAV Surveying and Mapping

In the field geological observation, it was found that the lithology of the outcrop strata which influence the weathering resistance of rocks has a close relationship with the present geomorphology. Therefore, it was necessary to map the landform of the outcrop area. This is beyond the traditional outcrop geological research method. Additionally, in outcrop research, sedimentologists expect a three-dimensional outcrop model which contains not only the plane stratigraphic fluctuation, but also the stratigraphic information of the section [35]. Traditional surveying and mapping methods, for instance, the use of spaceborne digital elevation data (DEM), and geological outcrop research methods cannot resolve this problem [28]. UAV surveying and mapping provide an effective method for the above problem, because it can provide high resolution photos for landscape and exposed strata profiles, coordinate information, and elevation data. This means the application of UAV developed a new workflow and method for field geological research.
The DJI Inspire 2 UAV platform with a ZENMUSE X7 camera was used in this study. The maximum flight height of the UAV is 500 m and the actual flight altitude in this work was 120 m. The technical parameters of the UAV are listed in Table 1. A landform of ~5 km2 and 12 outcrop profiles were mapped by the UAV camera system (Figure 1C and Figure 2). The UAV data were processed according to the workflow in Figure 3 and a 3D digital outcrop model was built. The digital outcrop model had an accuracy of 10 cm in the planar view and 3 cm in the profile view. In this study, the smallest research unit is single sand body, which is formed in a flood event and is of tens of centimeters in thickness.
In the UAV surveying and mapping, photos and POS (positioning and orientating system) data are the main objectives. The photo is located with GPS while its angular elements are measured by the gyro system. Before surveying, the cruise route of the UAV is planned according to the scale of the area. The mission planning software is pix4D. The percent front is 80% and the sidelap is 75%. Geomorphic photos, POS information, and some other information such as state information of camera including shooting width, height, focal length and pixel size are recorded. The point cloud data and image are processed after the field acquisition and a 3D geomorphic model is built.
In addition to the plane mapping of the study area which is used to describe the geomorphology, outcrop profiles are also scanned to build a real 3D model. In traditional outcrop study, outcrop profiles are imaged by taking pictures or drawing sketch maps. While taking pictures for a wide outcrop profile, difference of shooting perspective, uneven illumination, and shaking during shooting can cause radiation differences between the images. In this work, high resolution pictures of the outcrop profiles are taken by the UAV pan tilt. In fact, the above factors, for instance, uneven illumination and shaking of the UAV during the shooting of geological outcrops, also exist in the UAV picture acquisition and can cause radiation differences between images. Although it does not affect the matching of feature points and model generation, it will cause discontinuous alternation of light and dark in the model texture. In this study, Wallis filter is used in the image processing with uniform light and color. The expression of Wallis filter is as follows:
f ( x , y ) = [ g ( x , y ) m g ] c s f c s g + ( 1 c ) s f + b m f + ( 1 b ) m g
where g(x, y) is the gray value of the original image, f(x, y) is the gray value of the processed image, mg and ms are separately the mean and standard deviation of the gray value of the original image, mf and mf are separately the mean and standard deviation of the gray value of the processed image, c is the spread function of variance in [0, 1], b is the image brightness coefficient in [0, 1].
Wallis filter can not only increase the gray difference between the original images, but also suppress the image noise, and can effectively increase the texture information of different scale images, so as to enhance the overall color difference of the images, highlight the texture information and reduce the noise interference. By the filter processing, the images are consistent in brightness, saturation, and color difference and so on.

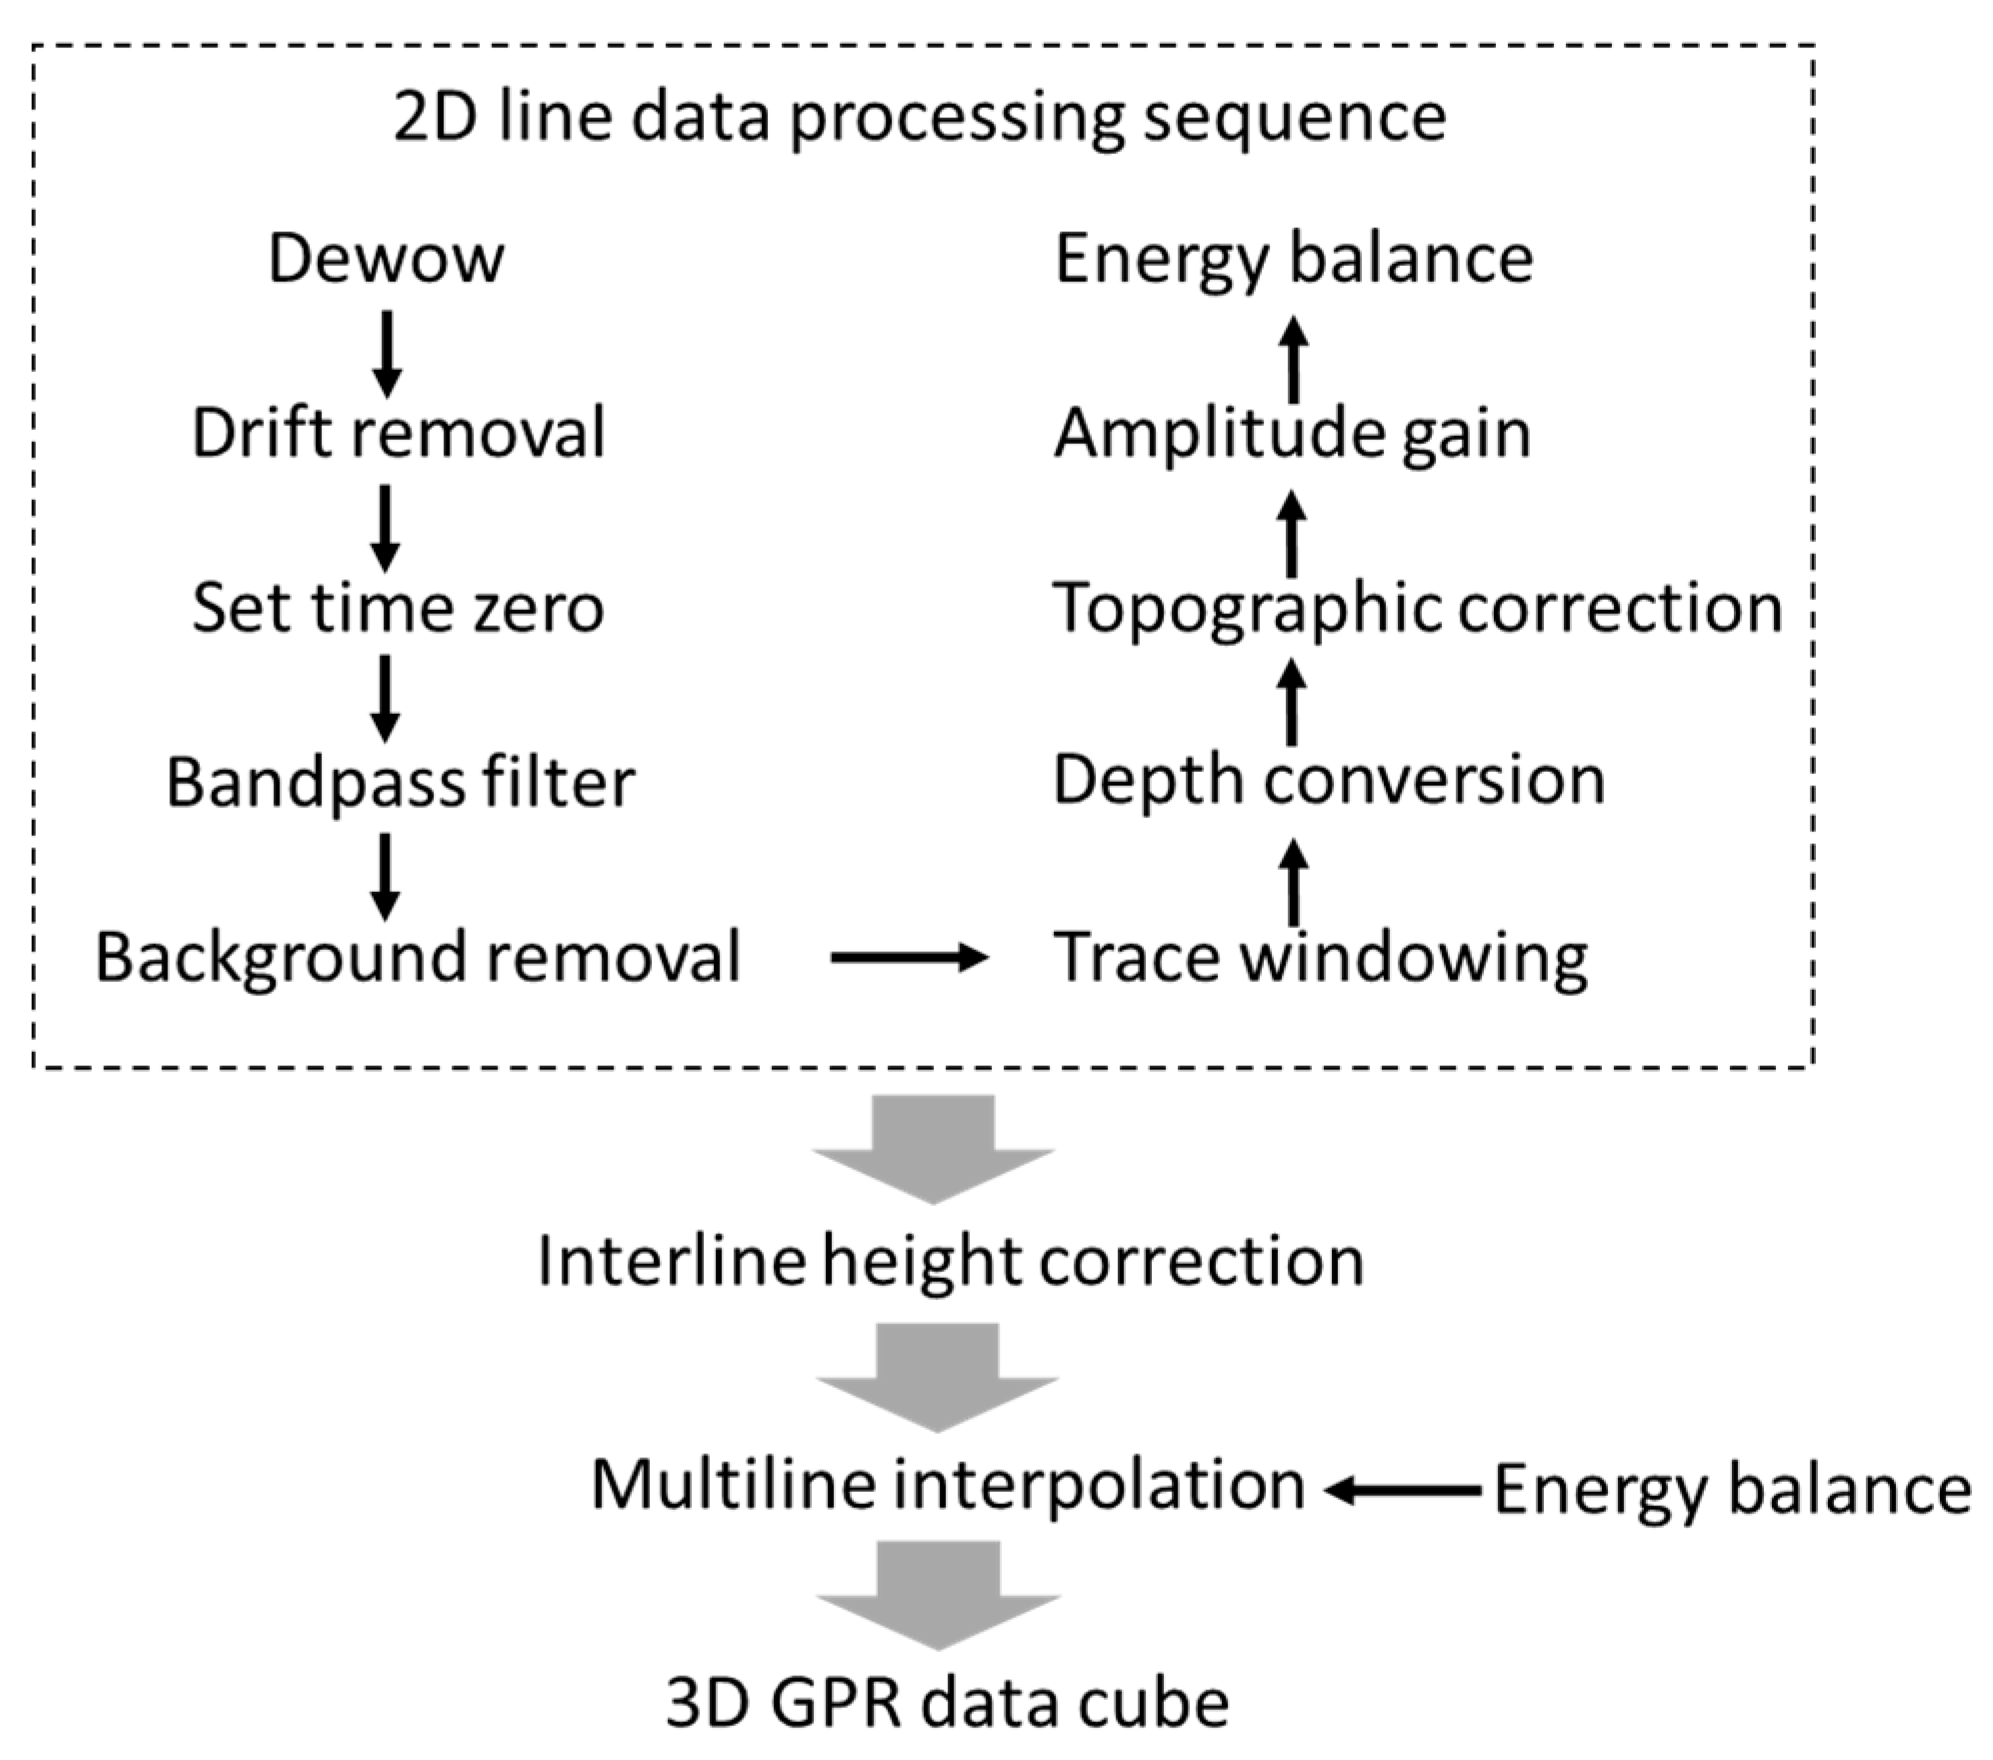
3.3. Ground Penetrating Radar Investigation

GPR is an effective method for shallow exploration and is commonly used to image geological body surfaces and internal architecture in outcrop and modern deposition studies [15,36,37,38,39,40,41]. For example, GPR has been used to study BTHs in shallow deposits of the modern South Saskatchewan River [21]. In the present study, an SIR 30E GPR system with antenna frequencies of 100 MHz, 200 MHz, and 400 MHz was used to detect the reservoir architecture of outcropping compound braided bars. The GPR data processing workflow is illustrated in Figure 4.
The reflection wavelength of the GPR was calculated according to Equation (2). By referring to seismic data interpretation in oil and gas reservoirs, the vertical resolution of GPR data in an outcrop detection is a quarter wavelength [36,38,39]. The detection accuracy (or vertical resolution) in GPR profiles with antenna frequencies of 100 MHz, 200 MHz, and 400 MHz is 37 cm, 18 cm, and 9 cm, respectively. The average dielectric constant of five sandstone samples in the outcrop area was 4.11.
λ = v f = c / ε r f = c f ε r
where c is the velocity of light in a vacuum, valued 3 × 10⁸ m/s, εr is the relative dielectric constant of rock (i.e., 4.11), and f is the antenna frequency in Hz.
The ground is required to be relatively flat for GPR detection to ensure a good coupling between the radar antenna and the ground, and to acquire data of a high signal-to-noise ratio. The GPR investigation was undertaken at compound bars 3 (exposed profiles on both sides of the railway) and 4 (Figure 2), which had relatively flat top surfaces. Outcropping rock profiles of the three compound bars were imaged by GPR to calibrate the relationship between the geological architectures and the GPR reflection features. Additionally, a 30 m × 60 m 3D orthogonal grid with 3 m intervals was designed at the northern part of compound bar 3 (Figure 2).

4. Results and Discussion

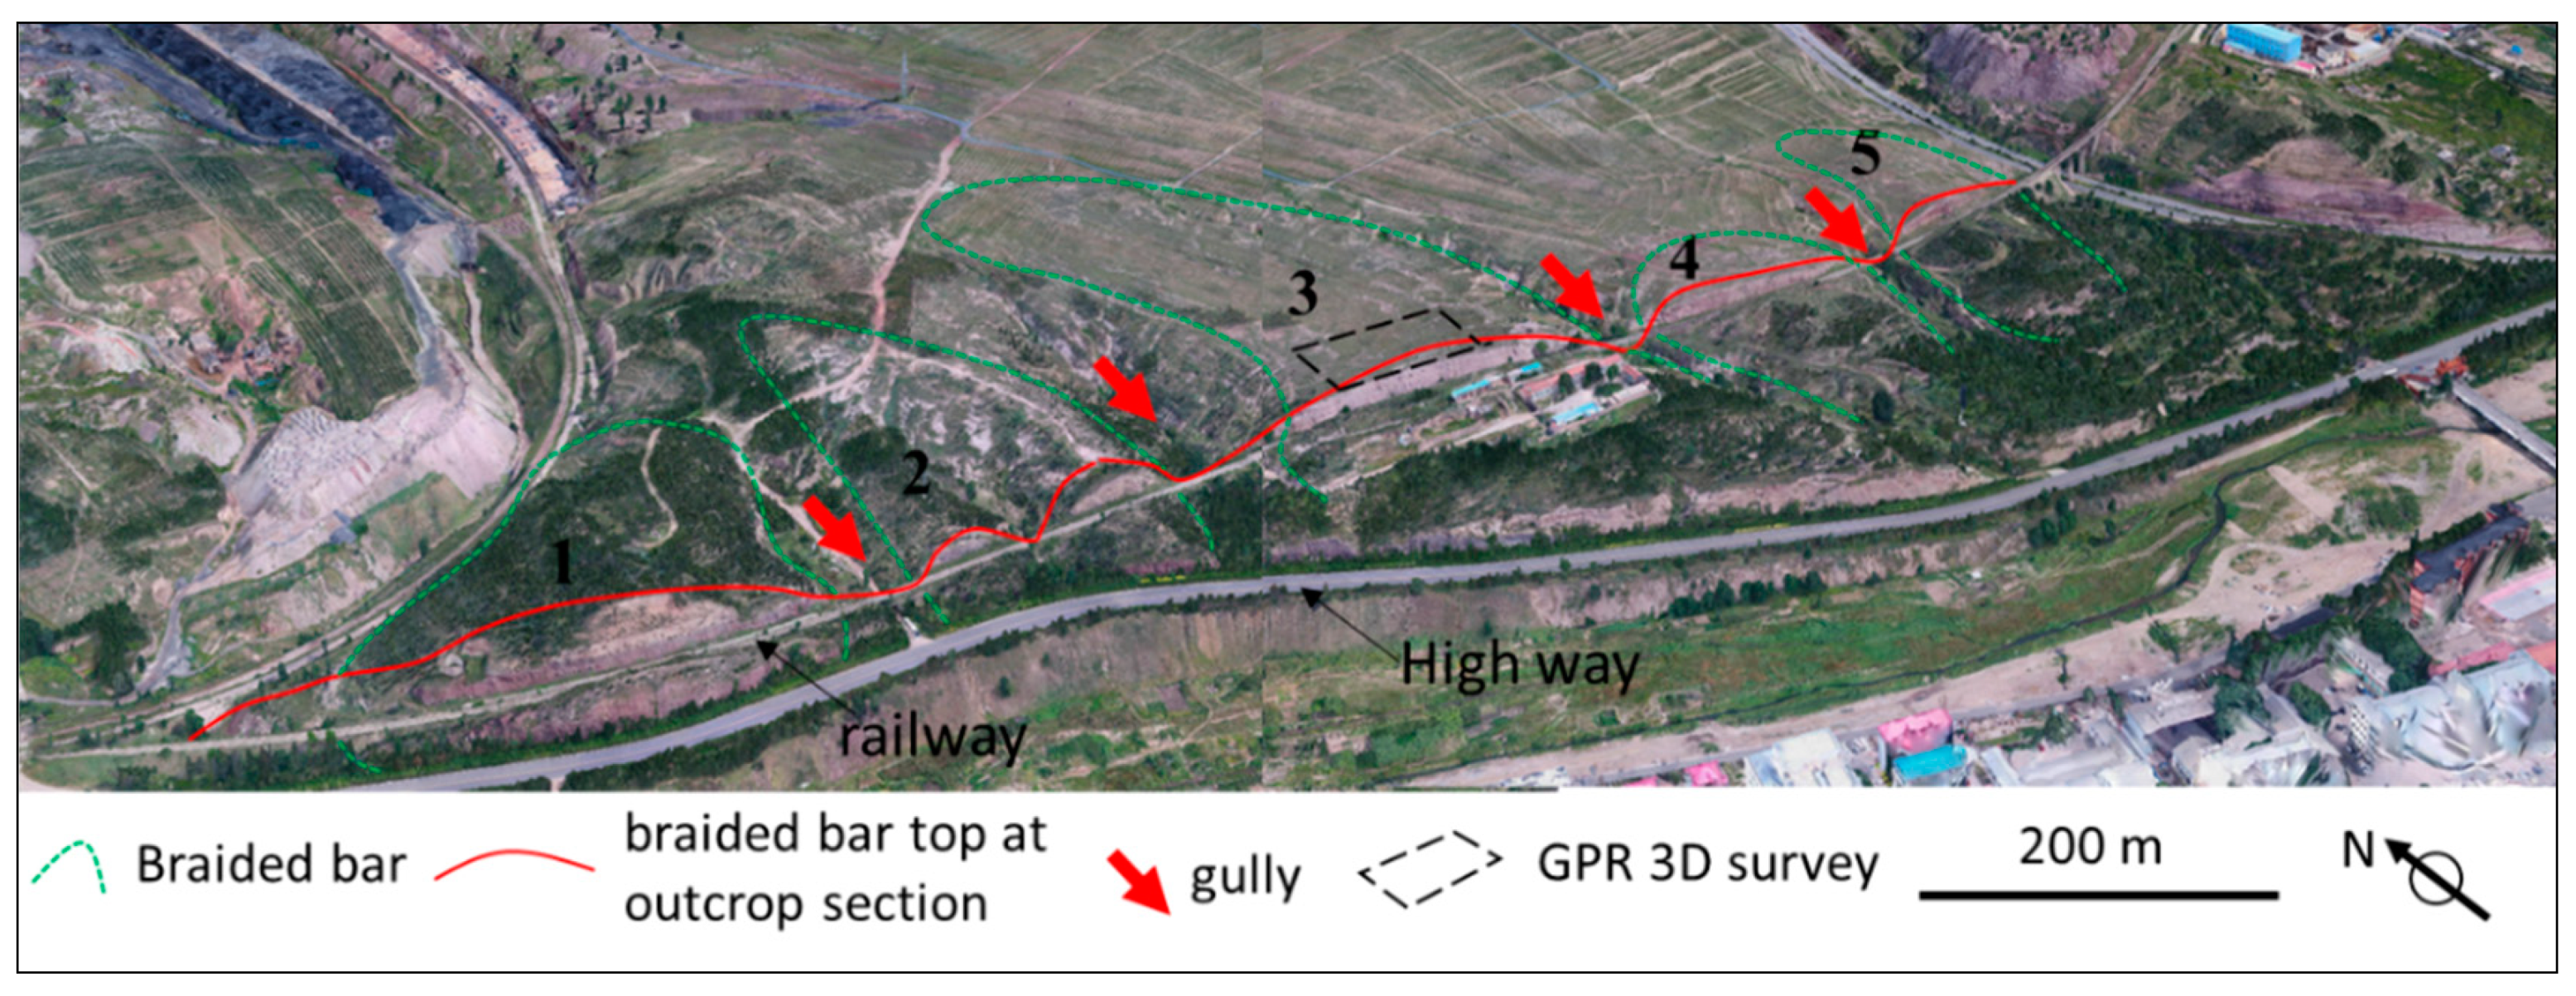
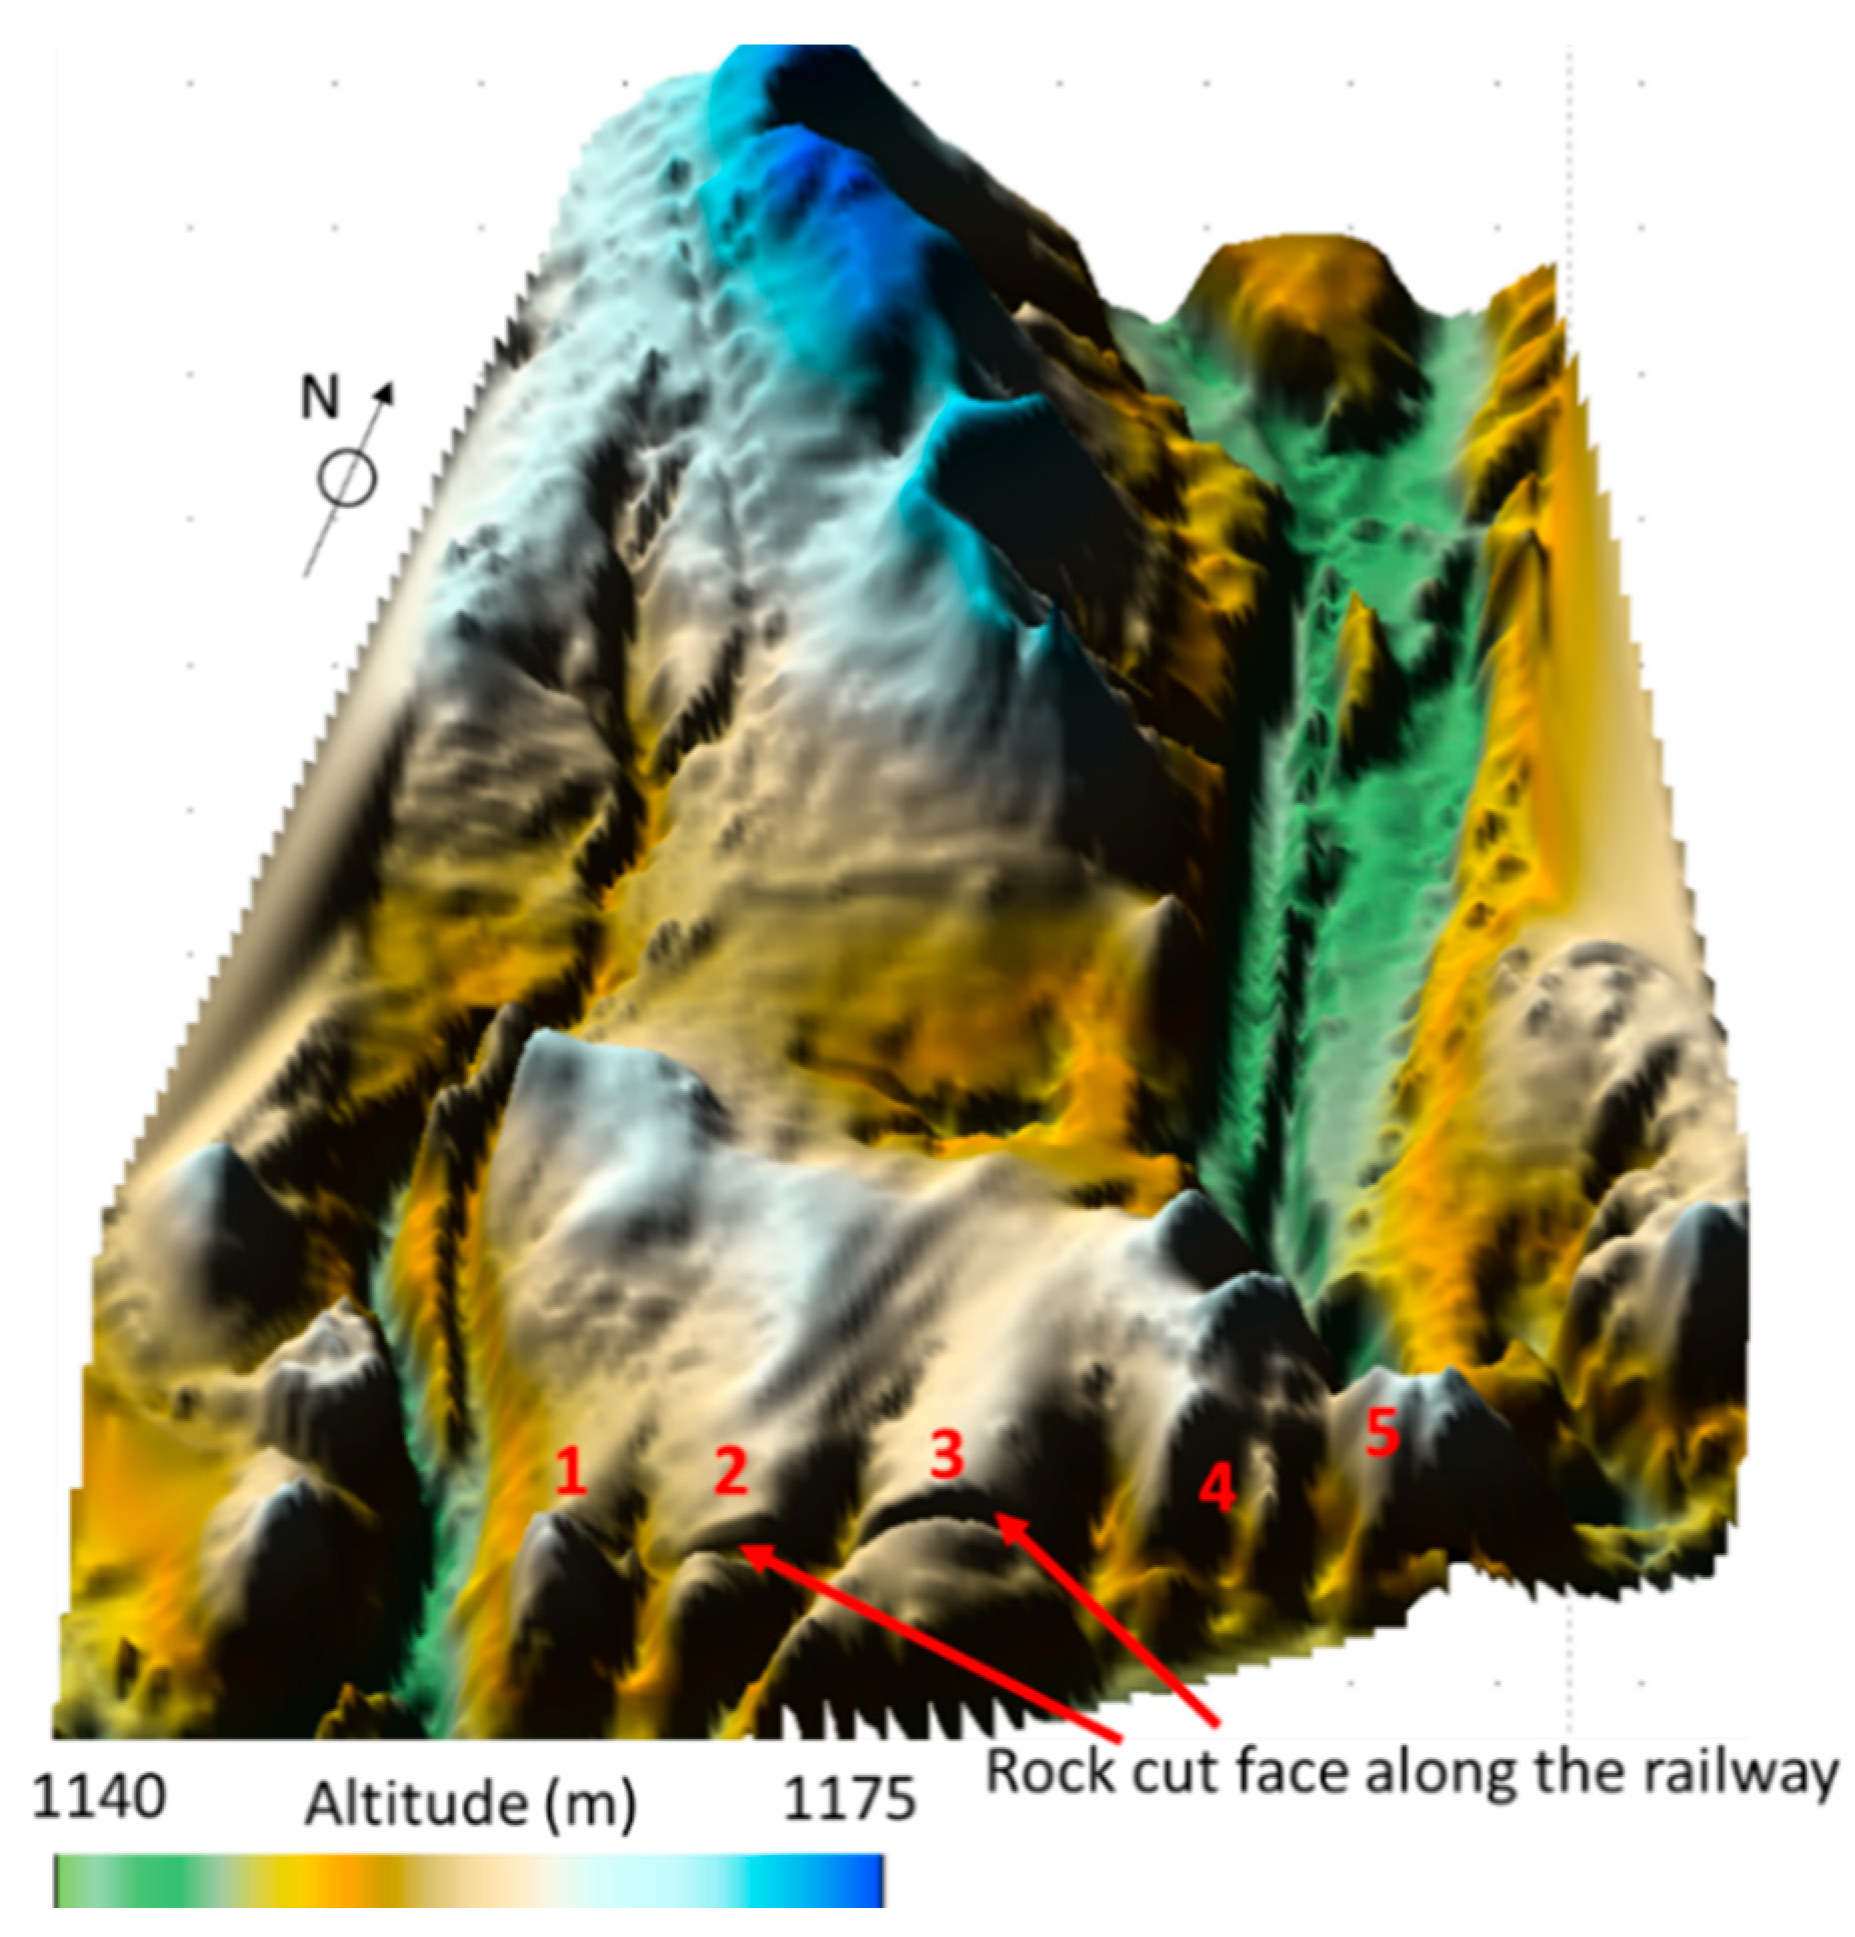
4.1. Geomorphic Features

During the Middle Jurassic period, the study area was poorly vegetated and the climate was arid to semi-arid. The present geomorphology was observed during the fieldwork to have a good correspondence with the lithology, depositional types, and forms of paleo-sedimentary units (Figure 5). The sandstone of the braided bar has a strong resistance to weathering and forms low amplitude hills in the topography. Red mudstones fill the gullies and are the residual deposition of the last-stage abandoned channel, which remained during the subsequent erosion. These fine-grained sediment fillings, which are mainly mudstones, are partly eroded and currently exist as negative geomorphic units. The gullies are commonly 10–20 m deep with respect to the highest point of the braided bar. The wide, flat, low geomorphic areas were formed by the Jurassic floodplain.

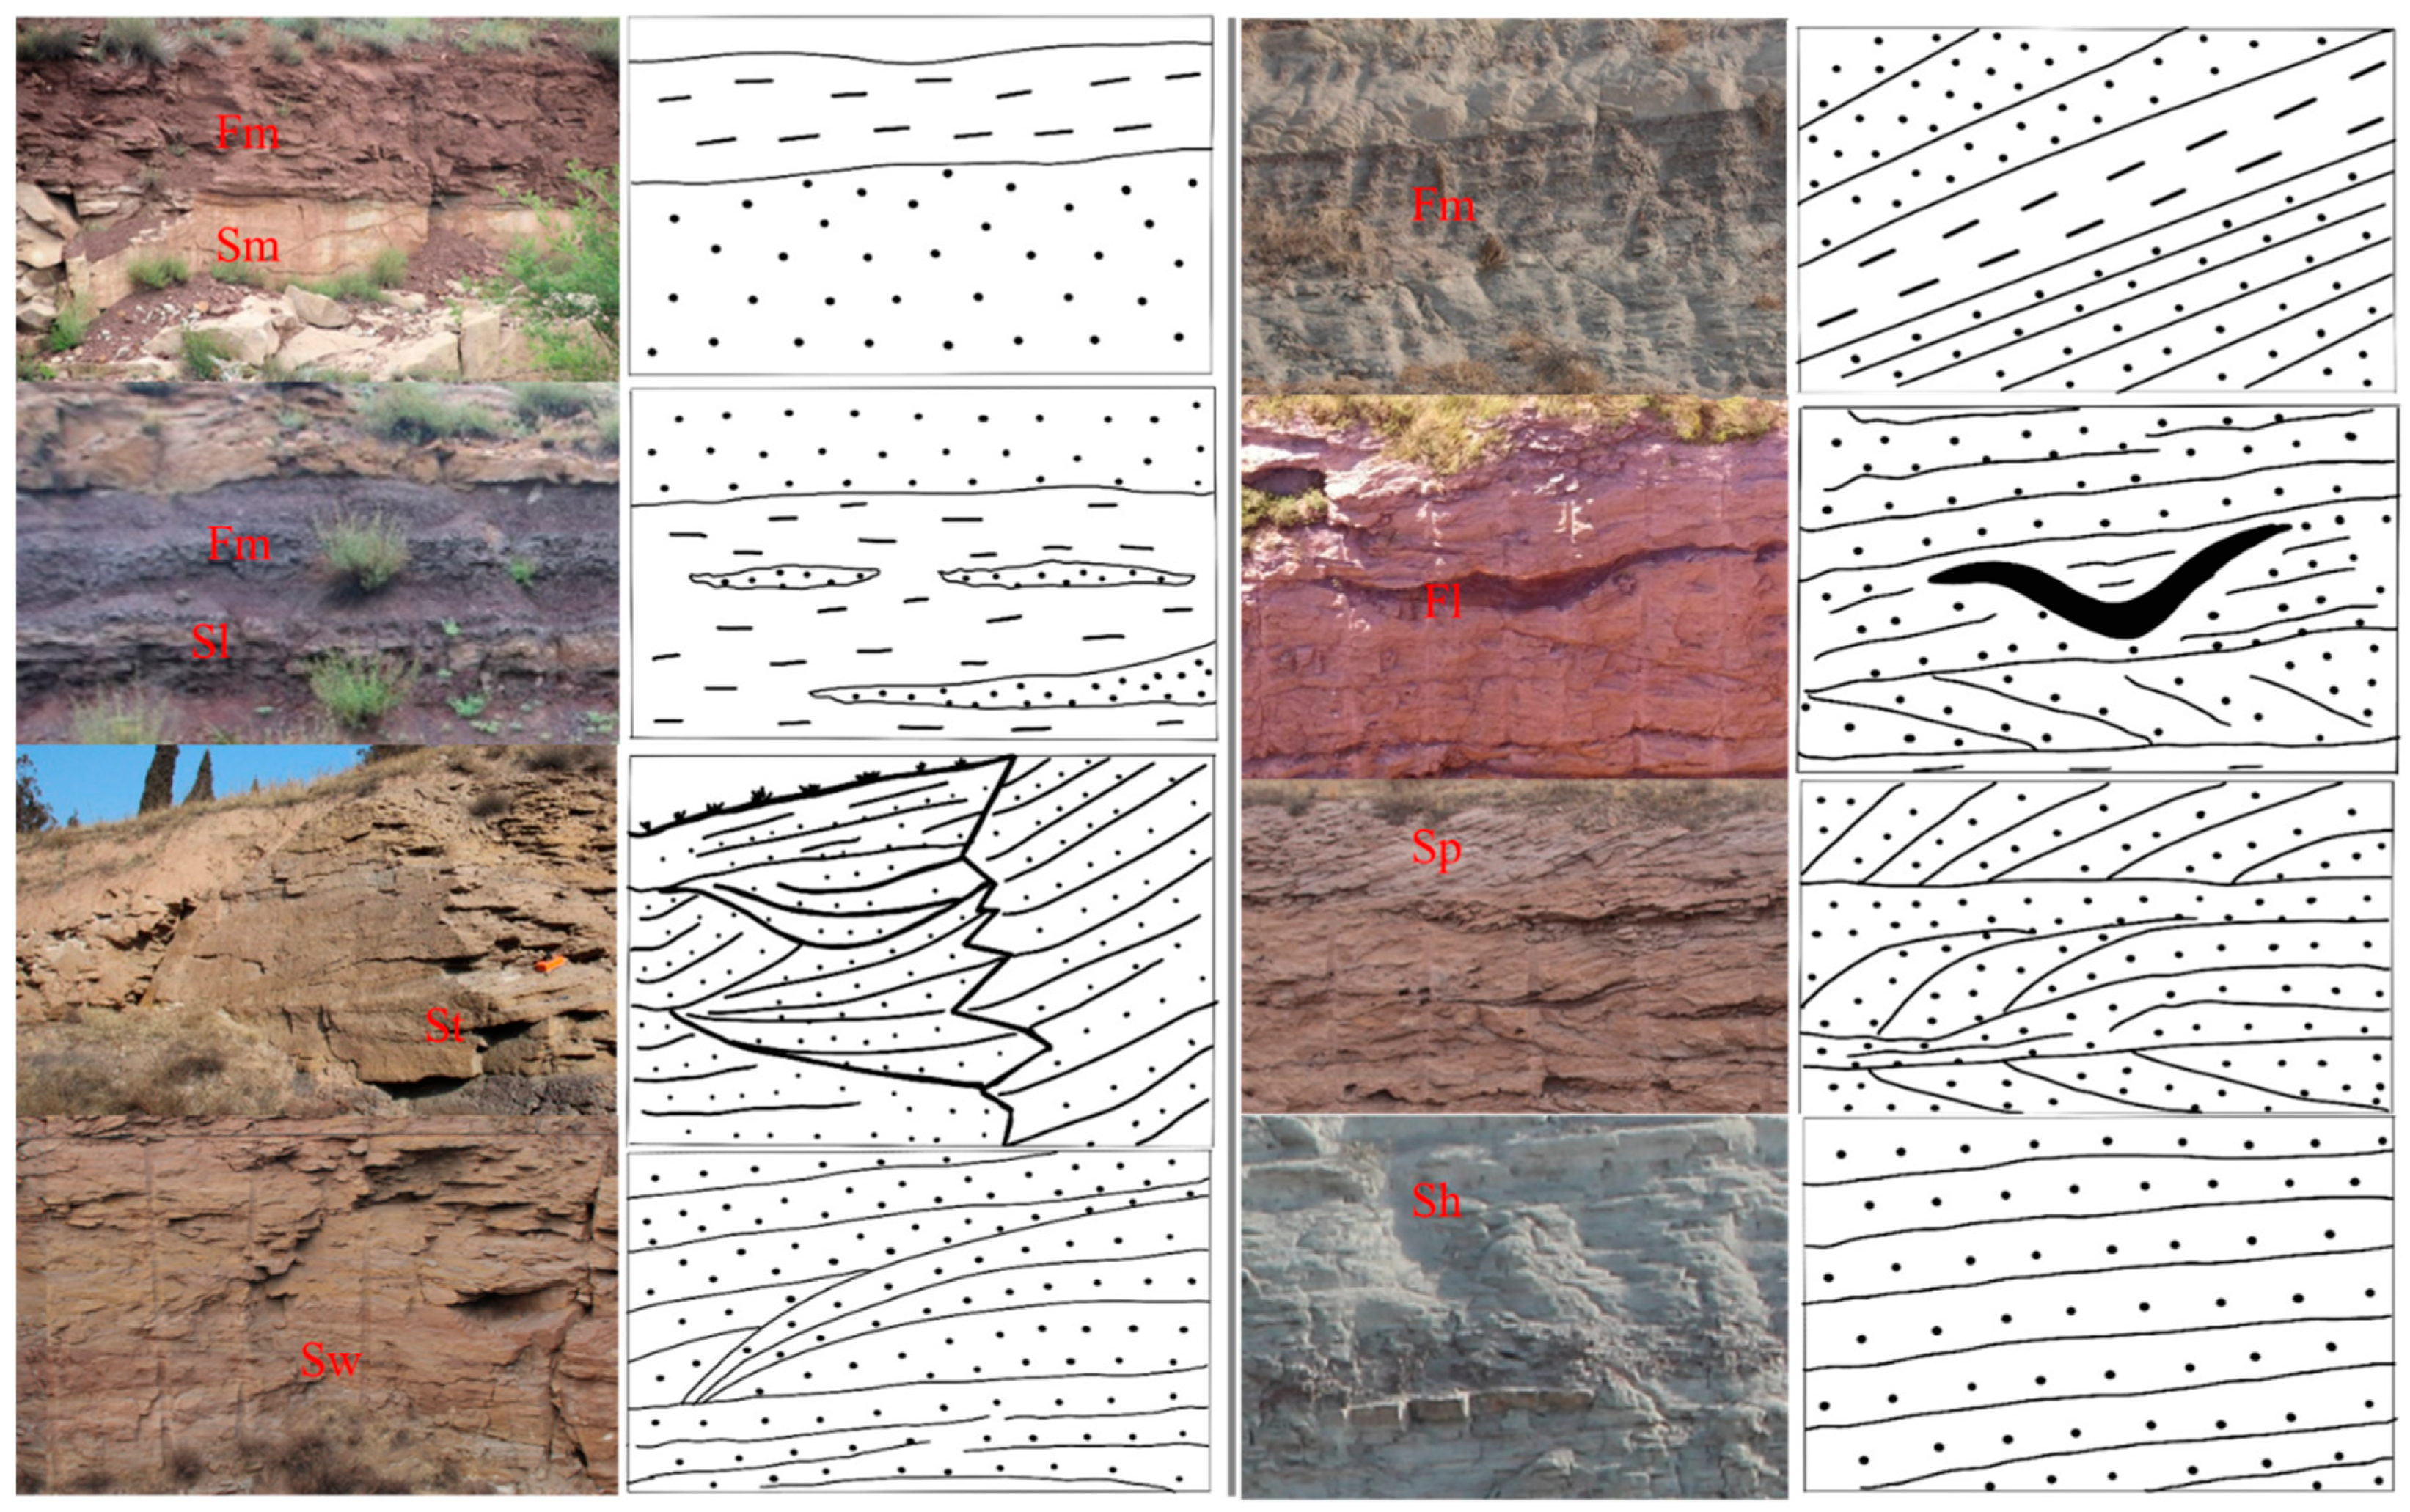
4.2. Lithological Features and Reservoir Architecture Elements

The main lithology of the outcrop rocks are feldspar graywacke and lithic graywacke. Pebbles are developed locally at the river bottom. From thin section observation of 20 sandstone samples, the average content of the matrix and cement in the sandstone was determined to be ~26%, and the total content of feldspar and rock debris in grains was >40% (Figure 6). The roundness and sorting of the grains was observed to be poor. Both the component maturity and structure maturity were low [42]. The median particle size ranged from −0.1 φ to 2 φ (Figure 6e). According to a test of 49 samples, the sandstone porosity ranged from 4.24% to 27% (average of 8.63%).
Simplistically, there are three types of sedimentary units in the outcrop area: channel units, bar units, and overbank deposition. Each of these is further classified in Table 2 and illustrated in Figure 7. It should be noted that the channel hollow fillings (HO) in Table 2, which are described as “filling of an erosional hollow in abandoned channels or confluence scours” [4,43,44], are a different reservoir architecture element from BTHs. A HO is an architecture element in channel units, whereas a BTH is an element in bar units. A HO is sandstone by filling of an erosional hollow or confluence scour, which indicates erosion and filling under high-energy hydrodynamic conditions.

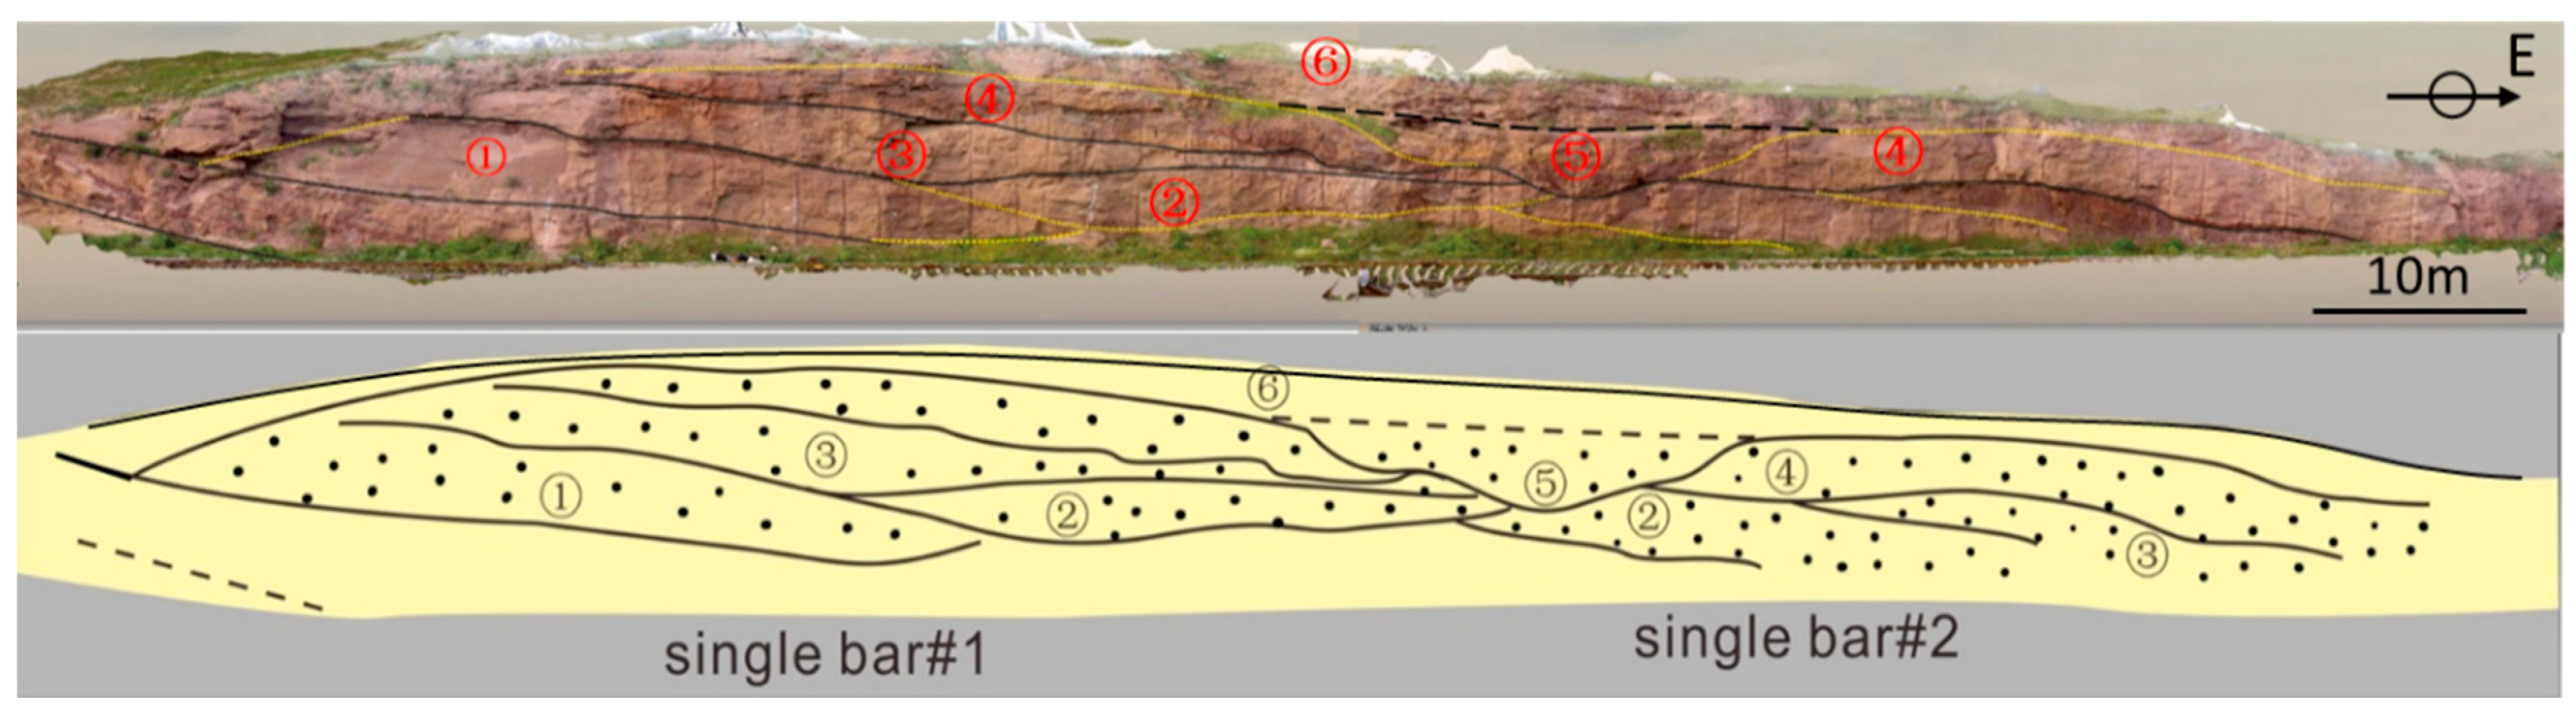
4.3. Braided Bar Profiles

Two outcrop profiles in compound braided bars three and four are described in this paper.

4.3.1. Profile of Braided Bar Four

Braided bar four (Figure 8) was observed to be composed of two single bars with four periods of unit bar accretion. The spatial association of these unit bars appears as a lateral migration and vertical accretion. The geometry parameters of these bars were measured from the outcrop model (Table 3), whereby the average width and thickness of the accretion bodies were 35.2 m and 2.73 m, respectively. A hollow was located within the top of the compound bar between the two single bars. The hollow bottom was a weak erosive surface and was convex from the top-down perspective.
The maximum thickness of the BTH filling unit was 5 m and its width in the profile shown in Figure 8 was 25 m. As a part of the compound bar, its depositional architecture differed from the channel units in sandy braided rivers. Sandstones with low-angle planar-bedded and wavy-bedded structures filled the hollow. No obvious difference was observed in the particle size between the BTH fillings and the adjacent unit bar.

4.3.2. Profile of the Southern Braided Bar Three

The width of braided bar three in its cross-section profile was found to be 150 m. Part of the rock cut face is imaged in Figure 9. It is a compound braided bar formed by a complex multi-period processing. Single braided bars were observed to have level bottoms and convex-up tops. The accretion bodies inside the single bar migrate laterally and were found to be superimposed vertically one by one. The main litho-facies types of the unit bars were determined to be massive sandstone, planar cross-bedded sandstone, and planar-bedded sandstone. Changes in the dip direction and dip angle in accretion bodies indicate frequent changes of hydrodynamic conditions. In this cross-section profile, the BTH was situated within the uneven bar top between two unit bars. The BTH thickness and width were 1 m and 10.7 m, respectively, and it was filled by mudstone (Figure 9c,d). As for compound bar four (Figure 8), the BTH units were developed within the upper part of the compound bar sequence. Furthermore, shale interlayers were locally present in the unit bars. The thickness of these shale layers was generally < 20 cm and their planar area was limited to the unit bars. At the main erosion surfaces within the compound bar, thin layers of gravel-bearing sandstone were also evident.

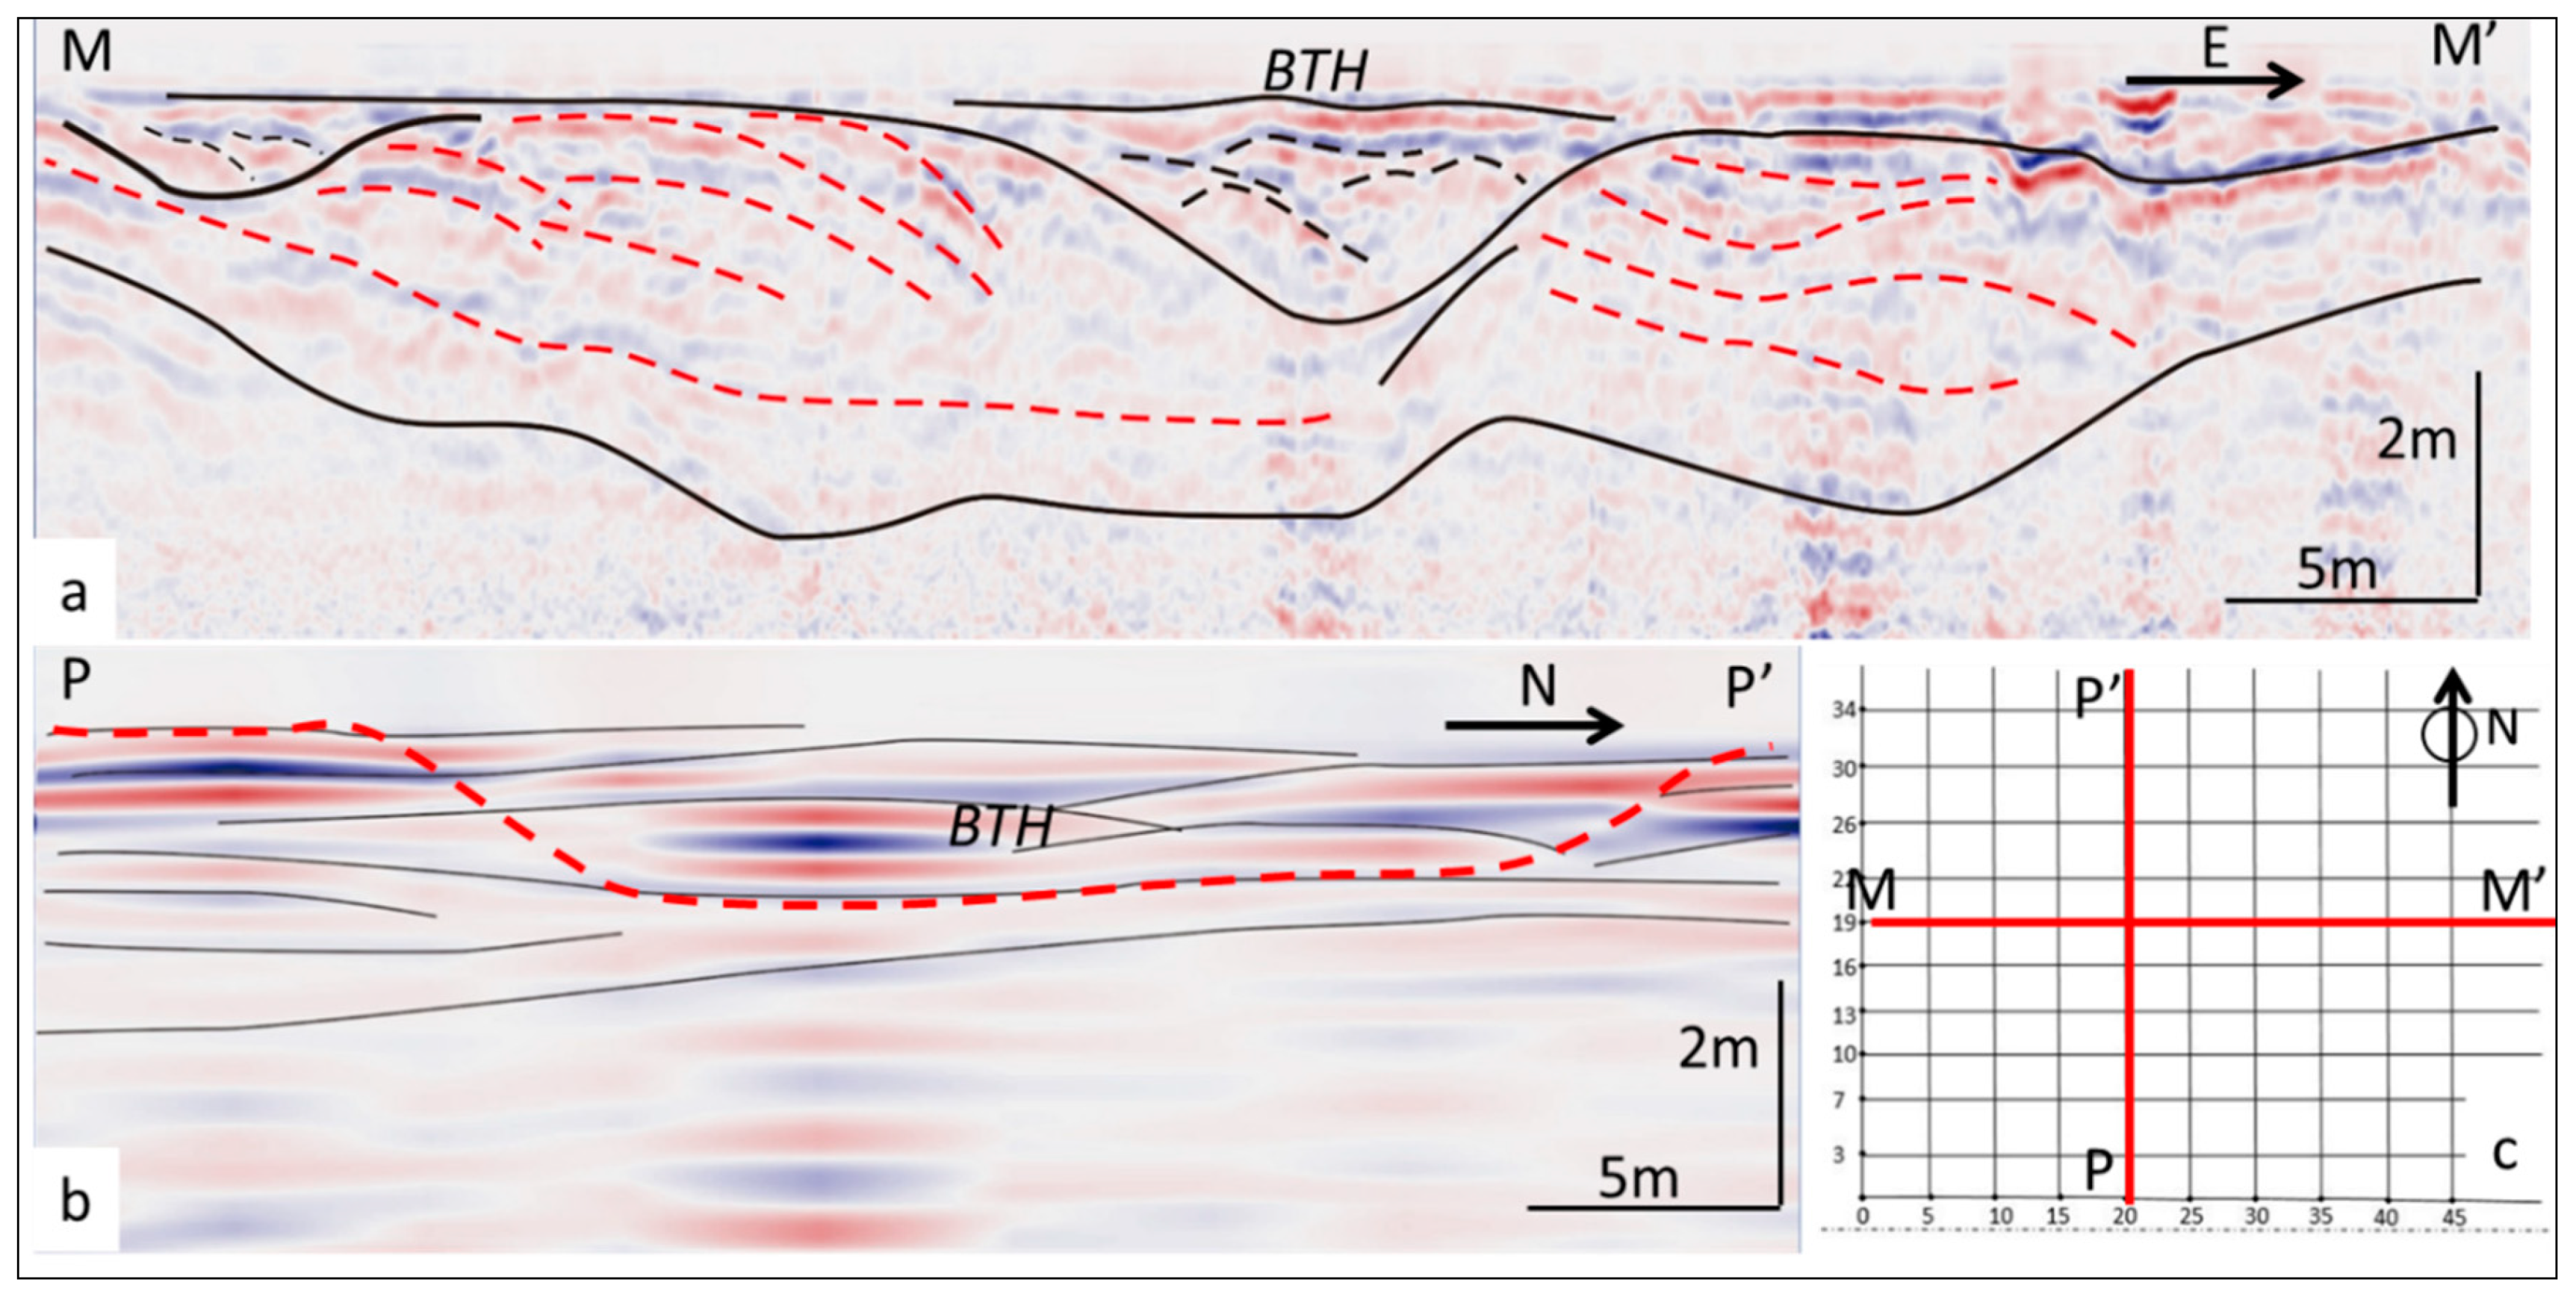
4.3.3. GPR Profiles of the Northern Braided Bar Three

Two orthogonal GPR lines in the northern part of braided bar three with an excitation frequency of 400 MHz (Figure 10) revealed an architectural feature similar to that described in Section 4.3.1 for the outcrop profile of braided bar four (Figure 8). The GPR reflection from the region of the compound bar was of a medium to high amplitude (Figure 10). In the cross-section profile, a BTH measuring 10 m wide and 2 m deep within the top of the compound bar was recognized between two unit bars (Figure 10a). The GPR reflection was distinct in this BTH. The visible GPR reflection of the base of the hollow filling revealed that the hollow possessed an erosive surface towards the adjacent bar margin. In the middle and lower parts of the BTH unit, GPR reflection events were oblique. The dip angle of the accretion bodies in the hollow decreased upwards. GPR reflection events in the upper part of the hollow filled unit were wavy to level.
In the longitudinal profile, the width of the BTH was found to be 27 m along the flow direction of the paleo-river (Figure 10b). In this direction, strong GPR reflections were wavy and the reflection event extended 10–15 m laterally. The infilled accretion units were inclined at a very low angle to the center of the hollow. According to the geometry of the hollow in the two directions, the BTH here was determined to be elliptical with a length/width ratio of 2.7 in the planar view.

4.4. Depositional Types and Features of BTH Unit

As a new understanding of the reservoir architectural element BTH, two types of BTH deposition are observed in this work. Depositional types and features of BTH unit are discussed herein.
BTHs were first reported by Best (2006) as a new reservoir architectural element in a study of the modern South Saskatchewan River [21]. The author described BTHs as being circular to ovoid in the planar view, with an internal architecture of the hollow units expressed as oblique planar-bedded layers and trough cross-bedded layers around the hollow [21]. Through our description of the outcropping profiles in braided bars three and four, two types of BTH units can be observed. TypeⅠis the hollow unit characterized in Figure 8 (braided bar four, labelled ⑤) and Figure 10 (the northern part of braided bar three), while type II is laminated mudstone filling, present in the southern part of braided bar three (Figure 9).
According to the planar geometry, size, and lithology of the filling deposits and internal architecture, the previously reported BTHs in the modern South Saskatchewan River belong to type I. The association between the trough cross-bedding and oblique planar-bedding in the BTHs indicates a relative high energy and complex hydrodynamic condition and paleo-environment in the bar top during its forming. The second type of BTH outcropping in the profile of the southern part of braided bar three (Figure 9) was found to be 10.7 m long and 1 m deep and filled by mudstone. There was no obvious bedding in this mudstone-filled unit. Erosion by the subsequent high-stage flow over the bar top resulted in an uneven top of the hollow filled mudstone.

5. Conclusions

The application of UAV and GPR in outcrop study changes the traditional workflow and method of outcrop sedimentary description. Quantitative sedimentary information from both exposed profiles and geomorphic features are integrated into a 3D digital outcrop model with UAV survey and mapping. GPR survey reveals the reservoir architecture far from the exposed profiles which is invisible to the eyes. Geomorphic information can be mapped and used in the analysis of depositional elements. By the integrated methods and workflow, outcrop study is extended from the observation of discontinuous profiles to quantitative characterization of 3D geo-bodies.
BTHs are a reservoir architecture element that are developed within braided bars in the planar view and in the upper part of the depositional sequence of braided bars. Through a Jurassic outcrop study, two types of BTH units in ancient deposits were identified: sandstone-filled BTHs and mudstone-filled BTHs.
Two sandstone-filled BTHs were recognized in the outcrop area. A scour structure could be observed at the bottom of the units. The BTH filling unit in the outcrop cross-section profile was 25 m wide and 5 m deep. In the cross-section profile, inclined structures with a dip angle that decreased upwards were developed in the unit. Wavy and level accretion deposits were observed in the upper part of the unit. The unexposed part of the BTH filling unit was elliptical in the planar view, and its geometry was 27 m (longitudinal section) by 10 m (cross-section). Its bottom was relatively flat in the longitudinal profile and it was U-shaped in the cross-section profile. No obvious depositional structures were found in the mudstone-filled BTH. Both of these types of deposit were situated between two adjacent unit bars within a compound bar.
This study provides a new understanding of the classification of BTHs. It is helpful for identifying BTHs in subsurface reservoirs, and is significant for reconstructing depositional environments and the sedimentary evolution. This new understanding can be used in reservoir architecture description and heterogeneity characterization of oil and gas reservoirs.
The limitations of this study should be noted. (1) River bedform topography, hydrodynamic conditions, and distribution of sediment grain size need further study. (2) Depositional features of BTH fillings are summarized in this work. However, there is still a lack of effective criteria for the accurate identification of BTHs on vertical sequences, which is important in subsurface reservoir study with drilling well data.

Author Contributions

Conceptualization, X.Z.; methodology, C.L.; software, T.Z.; validation, C.L.; formal analysis, T.Z.; investigation, X.Z., and S.L.; resources, D.H. (Daowu Huang); data curation, D.H. (Derong Huang) and S.L.; writing—original draft preparation, Xianguo Zhang; writing—review and editing, D.H. (Derong Huang). All authors have read and agreed to the published version of the manuscript.

Funding

This study was funded by the Natural Science Foundation of China (Grant No. 41672129 and U19B200129), Fundamental Research Funds for the Central Universities (Grant No. 19CX02001A).

Institutional Review Board Statement

Not applicable.

Informed Consent Statement

Not applicable.

Acknowledgments

Thanks are given to Wei Guo, Zhongxiang Zhao, and Xin Huang in the GPR detection team and Haixu Chi in the UAV mapping team for field work. Special thanks to Jiaguang Li from China University of Geosciences, Wuhan, for his constructive suggestions. The discussion with him has played a positive role in my research and article writing. Thank the three anonymous reviewers and editor for their detailed and valuable comments.

Conflicts of Interest

The authors declare no conflict of interest.

References

  1. Best, J.L.; Ashworth, P.; Bristow, C.S.; Roden, J.E. Three-Dimensional Sedimentary Architecture of a Large, Mid-Channel Sand Braid Bar, Jamuna River, Bangladesh. J. Sediment. Res. 2003, 73, 516–530. [Google Scholar] [CrossRef]
  2. Bridge, J.S.; Greco, A.; Spencer, D.A. The Interaction between Channel Geometry, Water Flow, Sediment Transport and Deposition in Braided Rivers. Geol. Soc. Lond. Spéc. Publ. 1993, 75, 13–71. [Google Scholar] [CrossRef]
  3. Chien, N. on the Classification and Causes of Formation of Different Channel Patterns. Acta Geogr. Sin. 1985, 40, 1–10. [Google Scholar]
  4. Li, S.; Yu, X.; Chen, B.; Li, S. Quantitative Characterization of Architecture Elements and Their Response to Base-Level Change in a Sandy Braided Fluvial System at A Mountain Front. J. Sediment. Res. 2015, 85, 1258–1274. [Google Scholar] [CrossRef] [Green Version]
  5. Miall, A.D. A Review of the Braided-River Depositional Environment. Earth Sci. Rev. 1977, 13, 1–62. [Google Scholar] [CrossRef]
  6. Smith, N.D. Sedimentology and Bar Formation in the Upper Kicking Horse River, a Braided Outwash Stream. J. Geol. 1974, 82, 205–223. [Google Scholar] [CrossRef]
  7. Xu, J.X. Regional Distribution of Wandering River Type and Jiangxinzhou River Type in China. Chin. Sci. Bull. 1990, 35, 439–442. [Google Scholar]
  8. Zhang, X.; Lin, C.; Zhang, T. Seismic Sedimentology and Its Application in Shallow Sea Area, Gentle Slope Belt of Chengning Uplift. J. Earth Sci. 2010, 21, 471–479. [Google Scholar] [CrossRef]
  9. Zhang, X.; Zhang, T.; Lin, C.; Wu, X.; Huang, D.; Lutome, M.S.; Chen, D.; Liu, W. Reservoir Architecture and Evolution of Meandering Belt: A Subsurface Case in the Jiyang Depression, Eastern China. J. Pet. Sci. Eng. 2020, 193, 107380. [Google Scholar] [CrossRef]
  10. Williams, P.F.; Rus, B.R. The Sedimentology of a Braided River. J. Sediment. Res. 1969, 39, 649–679. [Google Scholar] [CrossRef]
  11. Cant, D.J.; Walker, R.G. Fluvial Processes and Facies Sequences in the Sandy Braided South Saskatchewan River, Canada. Sedimentology 1978, 25, 625–648. [Google Scholar] [CrossRef]
  12. Bridge, J.S.; Smith, N.D.; Trent, F.; Gabel, S.L.; Bernstein, P. Sedimentology and Morphology of a Low-Sinuosity River: Calamus River, Nebraska Sand Hills. Sedimentology 1986, 33, 851–870. [Google Scholar] [CrossRef]
  13. Bristow, C.S. Sedimentology of the Rough Rock: A Carboniferous Braided River Sheet Sandstone in Northern England. Geol. Soc. London Spéc. Publ. 1993, 75, 291–304. [Google Scholar] [CrossRef]
  14. Liao, B.F.; Zhang, W.M.; Li, L.; Lu, J.T.; Ge, Y.L.; Wen, L.; Xue, P.H.; Guo, R. Study on Modern Deposit of a Braided Stream and Facies Model: Taking the Yongding River as an Example. Acta Sedimentol. Sin. 1998, 16, 34–39. [Google Scholar]
  15. Lunt, I.A.; Bridge, J.S. Evolution and Deposits of a Gravelly Braid Bar, Sagavanirktok River, Alaska. Sedimentology 2004, 51, 415–432. [Google Scholar] [CrossRef]
  16. Lynds, R.; Hajek, E. Conceptual Model for Predicting Mudstone Dimensions in Sandy Braided-River Reservoirs. AAPG Bull. 2006, 90, 1273–1288. [Google Scholar] [CrossRef]
  17. Miall, A.D. Architectural-Element Analysis: A New Method of Facies Analysis Applied to Fluvial Deposits. Earth Sci. Rev. 1985, 22, 261–308. [Google Scholar] [CrossRef]
  18. Miall, A.D. The Geology of Fluvial Deposits: Sedimentary Facies, Basin Analysis, and Petroleum Geology; Springer: Berlin/Heidelberg, Germany, 1996; ISBN 978-3-540-59186-3. [Google Scholar]
  19. Ashworth, P.; Best, J.L.; Leddy, J.O.; Geehan, G. The Physical Modelling of Braided Rivers and Deposition of Fine-Grained Sediment. In Process Models and Theoretical Geo-Morphology; Kirkby, M.J., Ed.; John Wiley and Sons Ltd.: Hoboken, NJ, USA, 1994; pp. 115–139. [Google Scholar]
  20. Hjellbakk, A. Facies and Fluvial Architecture of a High-Energy Braided River: The Upper Proterozoic Seglodden Member, Varanger Peninsula, Northern Norway. Sediment. Geol. 1997, 114, 131–161. [Google Scholar] [CrossRef]
  21. Best, J.; Woodward, J.; Ashworth, P.; Smith, G.S.; Simpson, C.; Ashworth, P.J. Bar-Top Hollows: A New Element in the Architecture of Sandy Braided Rivers. Sediment. Geol. 2006, 190, 241–255. [Google Scholar] [CrossRef]
  22. Lang, J.; Sievers, J.; Loewer, M.; Igel, J.; Winsemann, J. 3D Architecture of Cyclic-Step and Antidune Deposits in Glacigenic Subaqueous Fan and Delta Settings: Integrating Outcrop and Ground-Penetrating Radar Data. Sediment. Geol. 2017, 362, 83–100. [Google Scholar] [CrossRef]
  23. Magalhães, A.; Lima-Filho, F.; Guadagnin, F.; Silva, V.; Teixeira, W.; Souza, A.; Gabaglia, G.R.; Catuneanu, O. Ground Penetrating Radar for Facies Architecture and High-Resolution Stratigraphy: Examples from the Mesoproterozoic in the Chapada Diamantina Basin, Brazil. Mar. Pet. Geol. 2017, 86, 1191–1206. [Google Scholar] [CrossRef]
  24. Lee, S.; Choi, Y. Reviews of Unmanned Aerial Vehicle (Drone) Technology Trends and Its Applications in the Mining Industry. Geosystem Eng. 2016, 19, 197–204. [Google Scholar] [CrossRef]
  25. Ren, H.; Zhao, Y.; Xiao, W.; Hu, Z. A Review of UAV Monitoring in Mining Areas: Current Status and Future Perspectives. Int. J. Coal Sci. Technol. 2019, 6, 320–333. [Google Scholar] [CrossRef] [Green Version]
  26. Cunningham, M.; Samson, C.; Wood, A.; Cook, I. Aeromagnetic Surveying with a Rotary-Wing Unmanned Aircraft System: A Case Study from a Zinc Deposit in Nash Creek, New Brunswick, Canada. Pure Appl. Geophys. 2017, 175, 3145–3158. [Google Scholar] [CrossRef]
  27. Yin, S.; Tan, Y.; Zhang, L.; Feng, W.; Liu, S.; Jin, J. 3D Outcrop Geological Modeling Based on UAV Oblique Photography Data: A Case Study of Pingtouxiang Section in Lüliang City, Shanxi Province. J. Paleogeogr. 2018, 20, 909–924. [Google Scholar]
  28. Jackisch, R.; Lorenz, S.; Kirsch, M.; Zimmermann, R.; Tusa, L.; Pirttijärvi, M.; Saartenoja, A.; Ugalde, H.; Madriz, Y.; Savolainen, M.; et al. Integrated Geological and Geophysical Mapping of a Carbonatite-Hosting Outcrop in Siilinjärvi, Finland, Using Unmanned Aerial Systems. Remote Sens. 2020, 12, 2998. [Google Scholar] [CrossRef]
  29. Booysen, R.; Zimmermann, R.; Lorenz, S.; Gloaguen, R.; Nex, P.A.; Andreani, L.; Möckel, R. Towards Multiscale and Multisource Remote Sensing Mineral Exploration Using RPAS: A Case study in the Lofdal Carbonatite-Hosted REE Deposit, Namibia. Remote Sens. 2019, 11, 2500. [Google Scholar] [CrossRef] [Green Version]
  30. Yu, X.; Ma, X.; Quing, H. Sedimentology and Reservoir Characteristics of a Middle Jurassic Fluvial System, Datong Basin, Northern China. Bull. Can. Pet. Geol. 2002, 50, 105–117. [Google Scholar] [CrossRef]
  31. Cheng, S.T.; Huang, Y.Q.; Fu, X.H. Paleogeography Reconstruction of the Early-Middle Jurassic Large or-Dos Basin and Development and Evolution of Continental Downwarping. Acta Sedimentol. Sin. 1997, 15, 43–49. [Google Scholar]
  32. Zhang, T.; Zhang, Y.; Jin, R.; Yu, R.; Sun, L.; Cheng, Y.; Ao, C.; Ma, H. Characteristics of Jurassic Sequence Boundary Surfaces on the Northeastern Margin of Ordos Basin and Their Constraints on the Spatial- Temporal Properties of Sandstone Uranium Mineralization. Geol. China 2020, 47, 278–299. [Google Scholar]
  33. Wang, S. Fluvial Depositional Systems and River Pattern Evolution of Middle Jurassic Series, Datong Basin. ACTA Sedimentol. Sin. 2001, 19, 501–505. [Google Scholar]
  34. Chen, B.; Yu, X.; Wang, T.; Ma, F.; Li, S.; Yang, L. Lithofacies and architectural characteristics of sandy braid-ed river deposits: A case from outcrops of the Middle Jurassic Yungang Formation in the Datong Basin, Shanxi Province. Oil Gas Geol. 2015, 36, 111–117. [Google Scholar] [CrossRef]
  35. Chilton, K.D.; Spotila, J.A. Preservation of Valley and Ridge Topography via Delivery of Resistant, Ridge-Sourced Boulders to Hillslopes and Channels, Southern Appalachian Mountains, U.S.A. Geomorphology 2020, 365, 107263. [Google Scholar] [CrossRef]
  36. Neal, A. Ground-Penetrating Radar and Its Use in Sedimentology: Principles, Problems and Progress. Earth Sci. Rev. 2004, 66, 261–330. [Google Scholar] [CrossRef]
  37. Stepler, R.P.; Witten, A.J.; Slatt, R. Three-Dimensional Imaging of a Deep Marine Channel-Levee/Overbank Sandstone behind Outcrop with EMI and GPR. Geophysics 2004, 23, 974–978. [Google Scholar] [CrossRef]
  38. Lee, K.; Szerbiak, R.; McMechan, G.A.; Hwang, N. A 3-D Ground-Penetrating Radar and Wavelet Transform Analysis of the Morphology of Shoreface Deposits in the Upper Cretaceous Ferron Sandstone Member, Utah. AAPG Bull. 2009, 93, 181–201. [Google Scholar] [CrossRef]
  39. Garrison, J.R.; Williams, J.; Miller, S.P.; Weber, E.T.; McMechan, G.; Zeng, X. Ground-Penetrating Radar Study of North Padre Island: Implications for Barrier Island Internal Architecture, Model for Growth of Progradational Microtidal Barrier Islands, and Gulf of Mexico Sea-Level Cyclicity. J. Sediment. Res. 2010, 80, 303–319. [Google Scholar] [CrossRef]
  40. Bowling, R.; Laya, J.C.; Everett, E.M. Resolving Carbonate Platform Geometries on the Island of Bonaire, Caribbean Netherlands through Semi-automatic GPR Facies Classification. Geophys. J. Int. 2018, 214, 687–703. [Google Scholar] [CrossRef]
  41. Phillips, J.; Ewing, R.; Bowling, R.; Weymer, B.; Barrineau, P.; Nittrouer, J.; Everett, M. Low-Angle Eolian Deposits Formed by Protodune Migration, and Insights into Slipface Development at White Sands Dune Field, New Mexico. Aeolian Res. 2019, 36, 9–26. [Google Scholar] [CrossRef]
  42. Yu, X.H. Reservoir Architecture Model and Hierarchy Surface Analysis, 1st ed.; Petroleum Industry Press: Beijing, China, 2004. [Google Scholar]
  43. Miall, A.D.; Jones, B.G. Fluvial Architecture of the Hawkesbury Sandstone (Triassic), Near Sydney, Australia. J. Sediment. Res. 2003, 73, 531–545. [Google Scholar] [CrossRef]
  44. Jo, H.R.; Chough, S. Architectural Analysis of Fluvial Sequences in the Northwestern Part of Kyongsang Basin (Early Cretaceous), SE Korea. Sediment. Geol. 2001, 144, 307–334. [Google Scholar] [CrossRef]
Figure 1. Geological setting of the outcrop area (modified from Yu (2002) and Cheng (1997) [30,31]). (A) Location of the Ordos Basin. (B) Paleogeography of the Ordos Basin in J2. The Datong area is at the northeast of the basin. (C) Aerial view of the unmanned aerial vehicle (UAV) survey area in this study. This map is from a 3D digital outcrop model built for this study. (D) Geological map of the study outcrop area. (E) Geological profile of the study outcrop area. (F) Strata column of the Yungang Formation, J2 in the outcrop area. The outcropped rocks are part of the Rock Cave member in the middle segment of the Yungang Formation.
Remotesensing 13 00560 g001
Figure 2. Aerial view of the study area in the 3D digital outcrop model. Five braided bars (1–5) are recognized through the morphology. A railway cuts through and separates these braided bars and rock outcrops. A 30 m × 45 m 3D ground penetrating radar (GPR) survey was undertaken on the northern part of braided bar 3. Gullies are formed by erosion of mudstone fillings, which are deposited in abandoned last-period channels.
Remotesensing 13 00560 g002
Figure 3. UAV data acquisition and processing workflow (after Nex and Remondino, 2013). DTM: digital terrain model; DSM: digital surface model.
Remotesensing 13 00560 g003
Figure 4. Ground penetrating radar (GPR) data processing workflow used in this study.
Remotesensing 13 00560 g004
Figure 5. Topographic aerial view of study area. The elevation data is from the UAV surveying and mapping. The braided bars are labelled from 1 to 5, and are cut off by the railway and rock profile outcrops along the railway.
Remotesensing 13 00560 g005
Figure 6. (a–d) Thin section pictures and (e) particle size distribution of outcrop area. The rocks in (a–d) are arkose graywacke and lithic graywacke with a high argillaceous matrix content. A little calcite cement can be identified in c and d. The overall grain size of the clastic particles was coarse, and the sandstone was mainly medium to coarse. The component maturity and structural maturity were low, roundness was sub-angular to angular, and sorting was medium.
Remotesensing 13 00560 g006
Figure 7. Photographs and sketches of main litho-facies types in the study outcrop area (refer to the footnote in Table 2 for the definitions of the geological abbreviations).
Remotesensing 13 00560 g007
Figure 8. Outcrop profile image in the geomorphology model from UAV mapping and its reservoir architecture interpretation in braided bar 4 (see Figure 2). Unit bars ① to ④ are accretion sand bodies in braided bars. Unit ⑤ is BTH fillings with planar-bedded sandstone. Depositional unit ⑥ covers the entire compound braided bar.
Remotesensing 13 00560 g008
Figure 9. Photograph and reservoir architecture sketch of a cross profile in the southern part of braided bar 3 (see Figure 2). The section outcrops by the railway cutting. (a) Reservoir architecture sketch of the outcropping profile; (b) photograph of the cross profile from the UAV digital model; (c) partially enlarged photograph of the profile in (a,b). The area is marked with a red square box in picture (b); (d) reservoir architecture sketch of the profile in photograph c.
Remotesensing 13 00560 g009
Figure 10. Ground penetrating radar (GPR) profiles in the northern part of braided bar 3. The entire 3D GPR survey was conducted in the compound braided bar marked in Figure 2a. In cross-section profile M-M’, (a) BTH unit within the compound bar can be seen between two unit bars. (b) In longitudinal profile P-P’, an electromagnetic reflection association of the BTH is present as a unit with a concave-up bottom and level top. (c) GPR survey grid in the planar view.
Remotesensing 13 00560 g010
Table 1. Selected technical parameters of the camera and remote control in this work.
Camera
Sensor size23.5 × 15.7 mm
Effective pixels24 Megapixel
Resolution6016 × 4008
Focal length16–50 mm
Remote Control
Communication distanceCE compliance: 3.5 km;
FCC compliance: 7 km
Table 2. Generalized summary of architecture elements identified in the study outcrop area (modified from Li 2015 [4]).
Reservoir Architecture ElementsChannel UnitsBar UnitsOverbank
CHmCHfHODALAUBCBBTHOF
Litho-faciesSt, Sp, Sm, Sh, Sl, GlSt, Sm, Sl, FlSt, SpSt, Sp, Sh, SwSt, Sp, SwSt, Sp, ShFm, Sh, SpFm, Fl, Sl
Note: CHm: migrating channel; CHf: filling channel; HO: channel hollow fillings; DA: downstream-accretion unit; LA: lateral-accretion unit; UB: unit bar; CB: compound bar; OF: overbank deposition; St: trough cross-bedded sandstone; Sm: massive sandstone; Sp: planar cross-bedded sandstone; Sh: planar-bedded sandstone; Sw: wedge-shaped cross bedding; Sl: laminated sandstone; Gl: thin-layer gravel; Fl: laminated mudstone; Fm: massive mudstone.
Table 3. Geometry parameters of accretion units in compound braided bar 4 measured in the 3D geomorphic model from UAV mapping.
Accretion Unit No.Width (m)Thickness (m)Width/Thickness
1403.2312.4
2312.8610.8
3392.4916.0
430.82.3413.1
Average35.22.7313
Publisher’s Note: MDPI stays neutral with regard to jurisdictional claims in published maps and institutional affiliations.

