Technical Note

Localization of the Chang’e-5 Lander Using Radio-Tracking and Image-Based Methods

1
Beijing Aerospace Control Center (BACC), Beijing 100094, China
2
State Key Laboratory of Remote Sensing Science, Aerospace Information Research Institute, Chinese Academy of Sciences, Beijing 100101, China
3
CAS Center for Excellence in Comparative Planetology, Hefei 230026, China
*
Author to whom correspondence should be addressed.
Submission received: 12 January 2021 / Revised: 30 January 2021 / Accepted: 3 February 2021 / Published: 7 February 2021
(This article belongs to the Special Issue Planetary Remote Sensing: Chang’E-4/5 and Mars Applications)

Abstract

:
Chang’e-5, China’s first unmanned lunar sample-return mission, was successfully landed in Northern Oceanus Procellarum on 1 December 2020. Determining the lander location precisely and timely is critical for both engineering operations and subsequent scientific research. Localization of the lander was performed using radio-tracking and image-based methods. The lander location was determined to be (51.92°W, 43.06°N) by both methods. Other localization results were compared for cross-validation. The localization results greatly contributed to the planning of the ascender lifting off from the lander and subsequent maneuvers, and they will contribute to scientific analysis of the returned samples and in situ acquired data.

Graphical Abstract

1. Introduction

Chang’e-5, China’s first unmanned lunar sample-return mission, was launched from Wenchang Space Launch Center in Hainan Province on 24 November 2020. The spacecraft entered an elliptical lunar orbit on 28 November 2020 and moved to a near-circular lunar orbit on 29 November 2020. After separating from the orbiter–re-entry capsule combination on 30 November 2020, the lander–ascender combination successfully landed in Northern Oceanus Procellarum of the Moon at 23:11 (UTC +8) on 1 December 2020 [1]. Subsequently, the lander–ascender combination completed collection of lunar samples using a drill and a mechanical arm on 2 December 2020, and the ascender carried the samples and lifted itself to the lunar orbit on 3 December 2020. On 6 December 2020, the ascender and re-entry capsule completed a rendezvous and docking after a series of sophisticated maneuvers, and the ascender delivered the sealed sample container into the re-entry capsule. The orbiter–re-entry capsule combination travelled in a lunar orbit for nearly six days and entered the Moon-Earth transfer orbit after two injection maneuvers on 12 and 13 December. Finally, the re-entry capsule returned to Earth at the preset landing site in North China’s Inner Mongolia autonomous region at 1:59 (UTC +8) on 17 December 2020 [2], marking the complete success of the mission, which is also the first lunar sample-return mission of the world since 1976. Figure 1 shows a diagram of the descending, landing, ascending, rendezvous and docking processes.
Determining the lander location precisely and timely is critical for both engineering operations and subsequent scientific research. For example, the lander location is a key parameter for making and fine-tuning the plans of ascender taking off from the lander on the lunar surface and rendezvous and docking with the orbiter–re-entry capsule combination on orbit. The lander localization result, when associated with a geologic map of the area, is also important to provide the geologic context of the collected samples.
Lander localization methods can be broadly divided into two categories: the radio-tracking method and image-based method; both have been used for determining the locations of lunar and Mars landers of previous missions [3,4]. In China, landing position research of extraterrestrial bodies started from the Chang’e-1 mission [5]. Chang’e-1 spacecraft collided on the Moon in a controlled manner in 2009. The radio-tracking team used the deep space network and interferometry system to track the entire collision process of Chang’e-1 and gave the position of the final signal vanishing point (the collision point) [6]. Chang’e-3 is China’s first soft landing mission and landed in Mare Imbrium in December 2013. The deep space network and interferometry system in China were used to track the lander after landing, and the positioning calculation of the extraterrestrial lander based on radio measurement was realized for the first time in China [7,8]. In January 2019, Chang’e-4 landed on the far side of the Moon. Since the ground station cannot directly observe the lander, it is impossible to locate the lander directly by radio measurement.
Image-based localization of the lunar lander was applied in both Chang’e-3 and Chang’e-4 missions using the descent images and other images taken by the landers and base maps generated from Chang’e-2 images and/or Lunar Reconnaissance Orbiter Camera (LROC) Narrow Angle Camera (NAC) images [9,10,11,12,13,14,15,16]. A number of teams involved in the work and the results supported mission operations and scientific investigations in different turnaround times.
In the Chang’e-5 mission, we performed lander localization using both the radio-tracking method and image-based method immediately after landing. In the radio-tracking method, the measurement data of Unified X-band (UXB) and Very Long Baseline Interferometry (VLBI) were used for statistical positioning calculations. In image-based localization, descent images taken by the lander during the descending and landing process and the base map produced from Chang’e-2 images were used to determine the lander location; an LROC NAC base map was also used for cross-validation.
The descending and landing trajectory of Chang’e-5 is different from that of Chang’e-3 and Chang’e-4, bringing some new problems and challenges for lander localization. For example, most descent images that are matched to the base maps are oblique images instead of vertical ones. To tackle the problem, a geometric rectification has been incorporated in the registration of the descent images to the base maps. Moreover, because the predefined landing area is much larger, production of the LROC NAC base map involves hundreds of geometrically inconsistent images and has been accomplished using our newly developed two-stage method. Overall, Chang’e-5 lander localization has been achieved precisely and timely using the image-based method and radio-tracking method, and the result has greatly supported the mission operations.

2. Methodology

2.1. Radio-Tracking Method

As the Moon is still within the gravitational range of the Earth, Terrestrial Time (TT) or Barycentric Dynamical Time (TDB) can be chosen for the theoretical measurement model. However, in practical calculations, the position of the Moon is usually obtained through the Development Ephemeris (DE) series planetary calendar provided by the Jet Propulsion Laboratory (JPL) [17], so the establishment of the lunar-probe observation model is more suitable to be completed in Barycentric Celestial Reference System (BCRS), and TDB is adopted correspondingly.
We take the three-range distance measurement as an example to briefly describe the establishment of the observation model. Different from two-way measurement, the three-way measurement is an open-loop measurement, in which the uplink station and the downlink station are different. The calculation of three-way ranging can be expressed as Equation (1), while the modeling of two-way measurement can be simply realized using the same formula by setting up the same uplink and downlink stations.
ρ ( t R ) = | r ( t V ) R ( t T ) | + | r ( t V ) R ( t R ) | + [ Δ ρ T V + Δ ρ V R ] + [ Δ ( T D B T T ) t r Δ ( T D B T T ) t R ] c ,
T, V and R correspond to signal uplink, forwarding and downlink time, respectively; r ( t V ) represents the position of the detector receiving/forwarding signal time (ignoring the delay of receiving and forwarding); R ( t T ) represents the position when the uplink station sends the signal; R ( t R ) represents the position when the downlink station receives the signal; Δ ρ T R and Δ ρ V R represent the gravitational delay of uplink and downlink, respectively; and c represents the speed of light. Items 1 and 2 of the right side correspond to straight distance; Items 3 corresponds to relativistic gravity delay, the influence of which can be up to several meters for lunar exploration; and Item 4 corresponds to the difference between time systems, which is dependent on the station locations, and its influence is about tens of meters for three-range distance measurement and can be ignored for two-way measurement. In addition, the effect of tides (Earth, polar and sea) on the site (on the order of 10 cm), the conversion relationship between the reference frame of the Earth and the BCRS (on the order of 10 cm) and the tidal effect of the Earth and the Sun on the Moon (on the order of 10 cm) must also be considered in accurate observational modeling.
The positioning calculation of the lander used all available UXB and VLBI data. The construction of the lunar orbit and the lunar optical balance in the DE 421 ephemeris released by JPL completely relied on laser lunar measurement data, using laser ranging including Apollo 11/14/15 and Lunokhod 2 laser reflection arrays, a total of 16,601 sets of data [18]. Through the analysis of the measurement data of the past 30 years, the accuracy of the ephemeris and the lunar orbit was at the submeter level, and the error in the direction of the Earth’s viewing direction was only a few centimeters, so the ephemeris error was not considered in the positioning calculation.
The location calculation of Chang’e-5 lander was realized by an in-house developed statistical batch processing algorithm. Since the lander was attached to the lunar surface, its coordinates in the lunar fixed coordinate system are fixed values without considering the effect of tides. Therefore, the establishment of the lander motion equation only involved the conversion relationship between the fixed coordinate system of the Moon and the BCRS [19].
The fixed coordinate system of the Moon includes Principal Axis and the Mean Earth/Mean Rotation coordinate. The Mean Rotation coordinate system is based on the directional parameter model provided by the International Astronomical Union (IAU), which only considers the motion of the lunar pole but not nutation. The Principal Axis coordinate system is connected with the celestial reference system by three Euler angles, and the DE calendar table provides Euler angles for conversion calculation. Three rotation angles can be used to establish a connection between the Mean Rotation coordinate system and the Principal Axis coordinate system. The maximum difference of the coordinates of the same point on the lunar surface in the two coordinate systems is 860 m [20]. Due to the fact that the Mean Rotation coordinate system ignores the nutation of the Moon, the error is in the order of 150 m. Therefore, the Principal Axis coordinate system was used to describe the position of the lander in the positioning calculation.
The basic process of lunar-probe positioning is to make differential corrections to the estimates of a set of parameters from an observation model so that the weighted sum of squares between the measured observations and the corresponding values calculated by the model is minimized. The determination of measurement equation can be expressed as [21]:
q c = q ( r ( t + δ t , R ) ) + b + R F c ,
Based on the first-order Taylor expansion near the predicted observation data, the model of the deviation between the actual observation data and the predicted observation data was established. This expansion formula establishes the relationship between the deviation in the residual error of the observation data and the station site R , the systematic error of the observation b and the time bias δ t , and it establishes the required linear regression equations. R F c represents the correction value of the observation data caused by atmospheric refraction, transponder delay and the error correction of the antenna base. Taylor expansion of the measurement equation is as follows:
q ¯ q c = q σ Δ σ + e ,
where q ¯ is observation data, q c is the calculated observation value, σ is the parameter to be estimated (including the position of the fixed Moon system and other kinematic parameters), e is the observed white noise and q σ is the partial derivative of the measurement equation.
The positioning vector r discussed above is estimated in the principal axis system (x, y, z). If a lunar geographic coordinate system ( λ , ϕ , h ) is used for the estimation, a conversion matrix from the lunar fixed coordinates to the lunar geographic coordinates is added in the partial derivative in Equation (3), which can be expressed as:
B l b = ( x , y , z ) ( λ , φ , h ) ,
If the reference shape of the Moon is considered to be a sphere, B l b can be easily obtained to perform positioning calculations. The method of using the lunar geographic coordinates to estimate is suitable for the calculation of the lunar surface elevation, which can be restricted when there is only UXB measurement within a short time after the lunar landing and the positioning error is large, so as to improve the positioning accuracy of the landing point.
Incorporating prior constraint of the orbital initial value, the parameters to be estimated for positioning calculation are:
σ = ( r ( λ , ϕ , h ) b ( Δ R JMS , Δ R NM , Δ R KS ) ) T ,
where r is the resultant longitude, latitude and altitude of the landing point, and b is the system errors of the three deep space stations.
Retrieving the elevation near the landing point from a Digital Elevation Model (DEM), and taking it as the prior information of the height parameter to be estimated, the statistical positioning of the landing point can be reduced from 3D to 2D [22].

2.2. Image-Based Method

Image-based localization of the lander was based on matching of the descent images to a base map previously produced from orbital images. Both Chang’e-2 Digital Orthophoto Map (DOM) and LROC NAC DOM were used as base maps for cross-validation.
In order to generate a DOM from a lunar orbital image, the rigorous sensor model (RSM) of the image should be established based on collinearity equations with interior orientation (IO) and exterior orientation (EO) parameters.
The RSM of a Chang’e-2 image or an LROC NAC image can be expressed as [23,24]:
[ X X S Y Y S Z Z S ] = λ R o l R b o R i b [ x y f ] = λ R [ x y f ] ,
where f is the focal length of the camera, (x,y,Z) are the 3D coordinates of a point on lunar surface in the lunar body-fixed coordinate system (LBF), (x,y) are the focal plane image coordinates of the point, ( X S , Y S , Z S ) represent the 3D ground coordinates of the optical center in the LBF and are part of the EO parameters, R i b is the rotational matrix from the image space coordinate system to the spacecraft body coordinate system (BCS), R b o is the rotational matrix from the BCS to the orbit coordinate system (OCS), R o l is the rotational matrix from the OCS to the LBF, R is the combination of these three rotation matrices using three EO angle parameters ( ω , φ , κ ) and λ is a scale factor. The focal plane image coordinates (x,y) can be obtained by transforming from the image coordinates (row, sample) using IO parameters, which include focal length, principal point coordinates and lens-distortion parameters.
For linear array push-broom images, each line has a different set of EO parameters. As only a small portion of the image lines have EO parameters from direct measurements, the EO parameters of all other image lines are obtained by interpolation with respect to the scan time t, using a mathematical model (e.g., third order polynomial) [25].
Based on collinearity equations, the ground coordinates of an image point measured in a single image can be calculated with a known elevation, which is provided by an existing DEM. This is the basis of DOM generation using a single image, its RSM and a corresponding DEM.
The Chang’e-2 base map (CE2TMap2015) includes 7 m/pixel DOM and 20 m/pixel DEM, which were produced using 7 m/pixel Cheng’e-2 stereo images by the Lunar and Deep Space Exploration Science Applications Center of the National Astronomical Observatories [26,27] and can be downloaded from the Data Publishing and Information Service System of China’s Lunar Exploration Program (http://moon.bao.ac.cn/ (accessed on 12 January 2021)). The CE2TMap2015 was produced after a global adjustment of the Chang’e-2 images, in which the five lunar laser ranging retroreflector (LRRR) points were used as ground control points. The adjustment results indicated that the planimetric and height deviations between neighboring strips were 5 m and 2 m after the adjustment; in comparison with the LRRR positions, the planimetric and height errors ranged from 21 to 97 m and −19 to 10 m, respectively [26].
We processed LROC NAC images of the landing site region and produced a number of DOMs. LROC NAC Experimental Data Record images were downloaded from the NASA Planetary Data System [27] and preprocessed using the USGS ISIS software [28]. The IO and EO parameters of the LROC NAC images were retrieved from SPICE kernels [29].
To support landing site analysis and characterization long before the launching, we produced a 1.5 m/pixel seamless DOM mosaic of the predefined landing area (approximately 413.8 km × 121.4 km) using 765 LROC NAC images acquired before December 2017 based on a developed two-stage method [30]. After launching but before landing, we had better knowledge of the predicted landing point and thus produced several more DOMs using LROC NAC images taken at different times covering the predicted site. The SLDEM2015 [31], which generally has a good geometric consistency with LROC images, was used to support the DOM generation. The resultant DOMs have the same resolutions as the original images.
After matching of a descent image and the base map, the corresponding points were used to build a mathematical model to transform the descent image coordinates to the base map coordinates so that the descent image was rectified and registered to the base map. The following projective transformation model was used for rectification of the descent imagery:
x = a X + b Y + c g X + h Y + 1 y = d X + e Y + f g X + h Y + 1 ,
where (x,y) are image coordinates of the matched points in the descent image; (X,Y) are the map projected coordinates; and a , b , c , d , e , f , g and h are the transformation parameters, which are solved using the coordinates of the matched points. A minimum of 4 points is required to solve these parameters. We always used more than 4 points and solved the parameters in a least-squares manner to ensure reliability and high precision.

3. Results

After the Chang’e-5 lander–ascender combination landed on the Moon and until the ascender lifted off, UXB tracking was performed through the Jiamous, Kashgar and South America stations of the deep space network, and meanwhile, VLBI tracking was performed through the Shanghai, Beijing, Kunming and Urumqi stations. A total of 48 h of tracking data was obtained between 23:11 (UTC+8) on 1 December and 23:10 (UTC+8) on 3 December 2020.
Based on the radio positioning algorithm and UXB/VLBI tracking data, the statistical positioning calculation of the landing ascender was carried out. The calculated residuals are shown in Figure 2.
Delay stands for VLBI delay residual, BJ-SH stands for Beijing-Shanghai baseline, BJ-KM stands for Beijing-Kunming baseline, BJ-ULMQ stands for Beijing-Urumqi baseline, KM-SH stands for Kunming-Shanghai baseline, KM-ULMQ stands for Kunming-Urumqi baseline and ULMQ-SH stands for Urumqi-Shanghai baseline. Range stands for UXB Range residual, JMS for the Jiamusi station, NM for the South America station and KS for the Kashgar station. According to the analysis, VLBI delay residual error is approximately better than 2 m, and UXB ranging residual error is better than 10 m.
Finally, the results of the statistical positioning were converted from the Principal Axis system to the Mean Rotation coordinate system. The first part of Table 1 lists the positioning results of different measuring arcs.
Image-based localization, also called vision-based localization, was performed immediately after the Cheng’e-5 lander–ascender combination touched down on the Moon and the descent images were downlinked. About 240 images were acquired by the lander’s descent camera from an altitude of 9 km until touchdown. The image size is 2352 × 1728 pixels. First, a descent image with a resolution close to the Chang’e-2 base map was registered to the base map by a matching of the same features (e.g., craters) and geometric rectification with projective transformation (an example is shown in Figure 3a). Then, descent images of higher resolutions were sequentially registered to the base map and the previously rectified descent images (Figure 3b). After the last few images of highest resolutions were registered to the base map through matching to the previously rectified descent images, the lander location, which is at the center of the last images, was determined to be (51.9162° W, 43.0584° N) in the Chang’e-2 DOM (Figure 3c), and the elevation was measured as −2550.4 m in the Chang’e-2 DEM. For comparison purposes, we produced an LROC NAC DOM using image M1132169436LE and used it as a base map for lander localization with the same procedure. The lander location was determined to be (51.9156° W, 43.0591° N) in the LROC NAC DOM (Figure 3d), and the elevation was measured as −2552.5 m in the SLDEM2015. The image-based localization was accomplished about half an hour after landing. The results are listed in Table 1 for comparison.
One day after Chang’e-5 touched down on the lunar surface, Lunar Reconnaissance Orbiter acquired an off-nadir (13° slew) NAC image of the landing site on 4 December 2020 at 14:53:55 UTC. The lander is directly observable in this image (M1361560086R). The LROC team computed the Chang’e-5 lander location to be (43.0576°N, 308.0839°E, −2570 m) and posted the result on the LROC team’s website on 4 December 2020 at 21:48 UTC [32]. This result provides a good third-party reference for cross-validation of our results.
Table 1 lists all the above-mentioned localization results for comparison purposes. Using the image-based localization result from the Chang’e-2 base map as a benchmark, the differences of other localization results are also listed in the table. Comparative analysis of the lander localization results shows that:
(1)
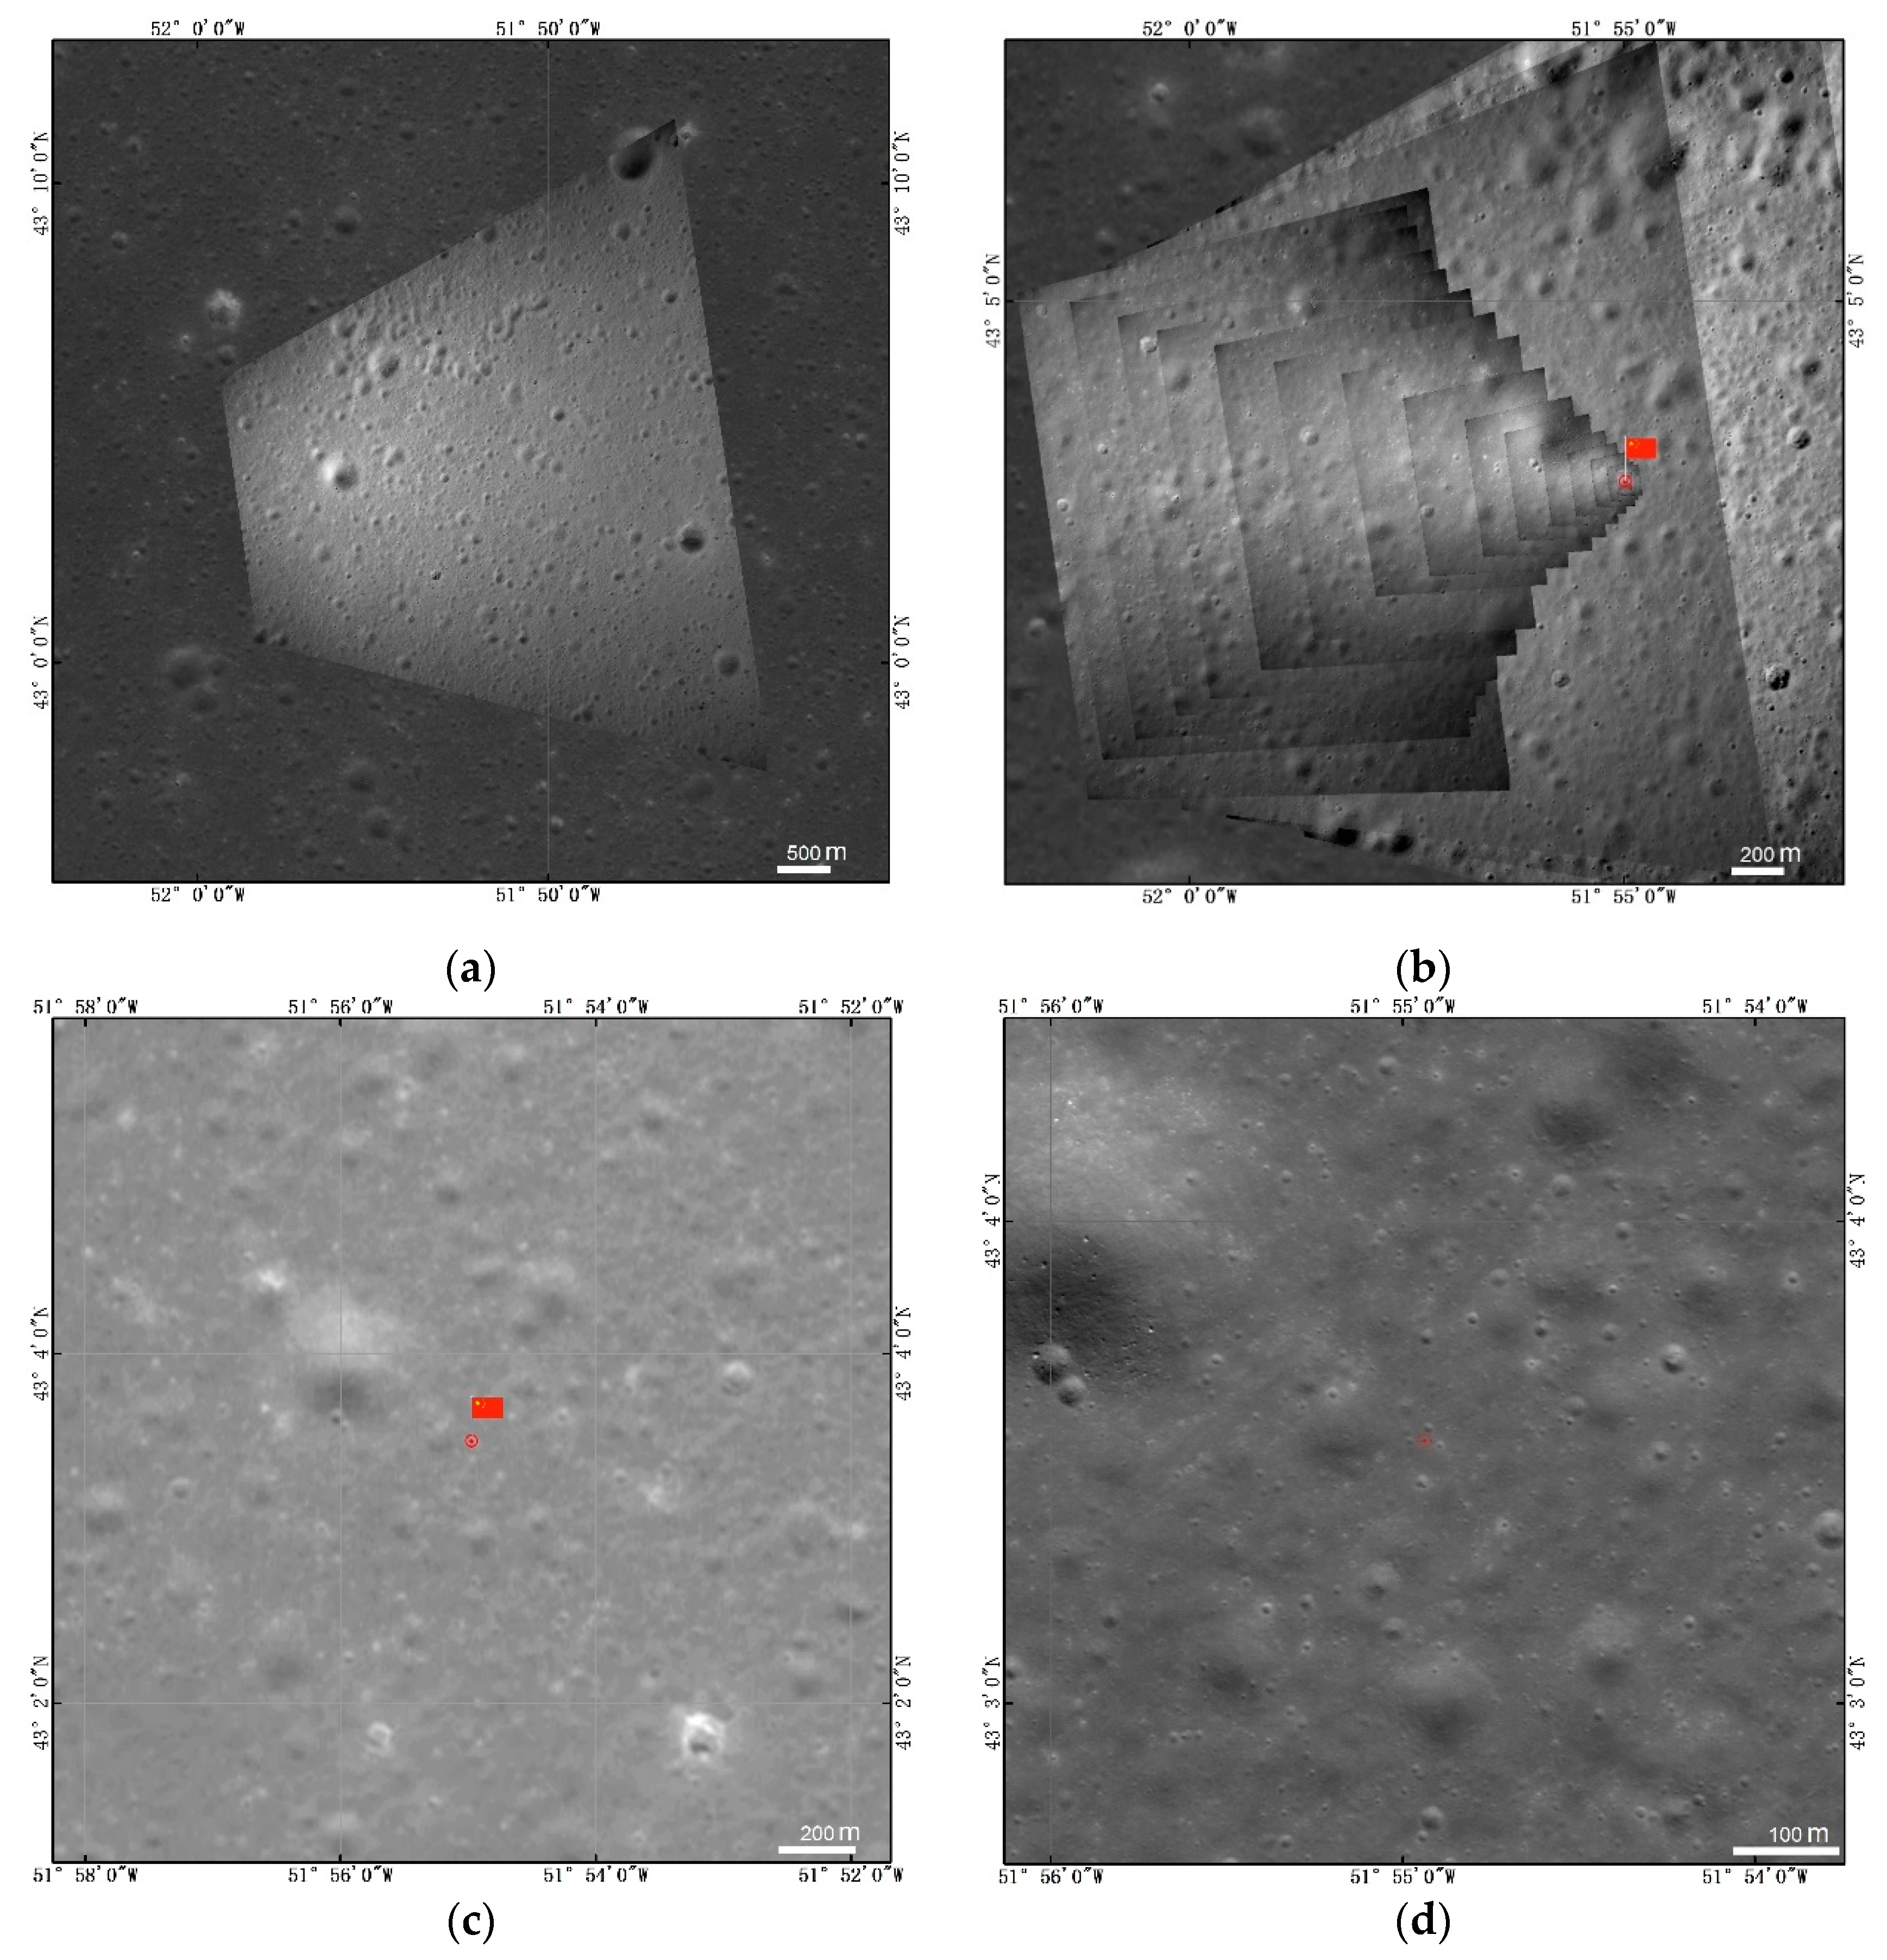
The location differences (converted to the distances on the lunar surface) between the benchmark result (Chang’e-2 DOM) and 12 h, 24 h and 48 h radio-tracking results and other image-based localization results are less than 100 m;
(2)
The location difference between our image-based localization results (Chang’e-2 DOM vs. LROC NAC DOM) is less than 30 m, and the location difference between our image-based localization result (Chang’e-2 DOM) and the localization result of the LROC team is also less than 30 m;
(3)
Among the radio-tracking results, the location differences of 24 h and 12 h results with respect to the 48h results are less than 100 m.
Overall, the lander localization results from radio-tracking and image-based localization methods are consistent and precise, i.e., the location differences are reasonably small.

4. Discussion and Conclusions

The precise position of the Chang’e-5 lander is the basic parameter for the ascender to lift off from the lander on the lunar surface, which has a great influence on the ascender’s launch direction, orbit insertion parameters and maneuver strategies for the subsequent rendezvous and docking with the orbiter–re-entry capsule combination in the lunar orbit. The landing position is also one of the basic parameters for lunar surface sampling and in situ observations. Therefore, high precision lander localization is extremely important for engineering operations.
The landing site of Chang’e-5 in Northern Oceanus Procellarum has a number of scientific significances; e.g., the lander is within one of the youngest lunar mare basalts (Em4) [33,34,35,36], which was never investigated in situ by previous landed missions. Evidently, the lander location information is very important for further investigation of the landing site; particularly, it helps to provide geologic context for the collected lunar samples. The sources of the rock and soil samples can be analyzed using lander location, the high-resolution base maps and other relevant remote sensing data. With the accurate isotope dating results of the samples and the crater distribution statistics (e.g., N(D ≥ 1 km)) of the source units, the lunar chronology function, which is the cornerstone of lunar-surface dating and was previously built based on isotopic dating of samples from Apollo and Luna missions [37], can be refined. This will have a great impact on lunar-surface dating and a significant contribution to lunar science.
In summary, immediately after Chang’e-5 landing, lander localization was performed using radio-tracking and image-based methods in parallel. The lander location is (51.9162°W, 43.0584°N) from the image-based method using Chang’e-2 base map and (51.9158°W, 43.0587°N) from 48 h of radio-tracking. Other localization results, i.e., image-based localization using LROC NAC imagery and radio-tracking of fewer hours, are also listed in Table 1. All the localization results are consistent with a reasonable range of difference. If only two decimals are kept, all the localization results are the same, i.e., (51.92°W, 43.06°N). Timely and precise localization of the lander greatly contributed to the planning of the ascender lifting off from the lander and subsequent maneuvers, and it will contribute to scientific analysis of the returned samples and in situ acquired data.

Author Contributions

Conceptualization, J.W., Y.Z., K.D., M.C. and W.W.; methodology, J.W., J.D., Z.L. and W.W.; software, J.K., J.X., W.W. and B.L.; validation, J.W., Y.Z., K.D., M.C., B.L. and M.P.; investigation, J.W., Y.Z., K.D., M.C., W.W., B.L. and M.P.; writing—original draft preparation, J.W., Y.Z., K.D., Z.R. and Y.W.; writing—review and editing, K.D. and W.W.; All authors have read and agreed to the published version of the manuscript.

Funding

This research was funded by the Strategic Priority Program of the Chinese Academy of Sciences, grant number XDB41000000, and the National Natural Science Foundation of China (grant number 41671458, 41941003, and 41771490).

Acknowledgments

The Chang’e-5 mission was carried out by the Chinese Lunar Exploration Program. We thank the Lunar and Deep Space Exploration Science Applications Center of the National Astronomical Observatories for providing the Chang’e-2 DOM and DEM and thank the LROC team for making the LROC NAC images available. We are grateful to academician Mengfei Yang of China Academy of Space Technology for his instructive advices.

Conflicts of Interest

The authors declare no conflict of interest.

Abbreviations

BCRSBarycentric Celestial Reference System
DEDevelopment Ephemeris
DEMDigital Elevation Model
DOMDigital Orthophoto Map
EOExterior Orientation
IAUInternational Astronomical Union
IOInterior Orientation
JPLJet Propulsion Laboratory
LBFLunar Body-Fixed coordinate system
LROCLunar Reconnaissance Orbiter Camera
LRRRLunar Laser Ranging Retroreflector
NACNarrow Angle Camera
OCSOrbit Coordinate System
RSMRigorous Sensor Model
TDBBarycentric Dynamical Time
TTTerrestrial Time
UXBUnified X-band
VLBIVery Long Baseline Interferometry

References

  1. China Daily. Chang’e 5 Lands on Moon, Starts Surface Operations. Available online: https://www.chinadaily.com.cn/a/202012/02/WS5fc6cd7ea31024ad0ba992ca.html (accessed on 2 December 2020).
  2. China Daily. Chang’e 5 Returns Home with Lunar Samples. Available online: https://global.chinadaily.com.cn/a/202012/17/WS5fda4ed3a31024ad0ba9c3d5.html (accessed on 17 December 2020).
  3. Guinn, J.R.; Ely, T.A. Preliminary results of Mars Exploration Rover in situ radio navigation. In Proceedings of the 14th Space Flight Mechanics Meeting, AAS/AIAA, Maui, HI, USA, 8–12 February 2004. Paper AAS 04-270. [Google Scholar]
  4. Li, R.; Squyres, S.W.; Arvidson, R.E.; Archinal, B.A.; Bell, J.; Cheng, Y.; Xu, F. Initial results of rover localization and topographic mapping for the 2003 Mars Exploration Rover mission. Photogramm. Eng. Remote Sens. 2005, 71, 1129–1142. [Google Scholar] [CrossRef] [Green Version]
  5. Chen, M.; Tang, G.; Cao, J. Precision orbit determination of CE-1 lunar satellite. Geomat. Inf. Sci. Wuhan Univ. 2011, 36, 212–217. [Google Scholar]
  6. Xia, J.; Ren, X.; Liu, J.; Mou, L.L.; Li, C.L. Positioning of Lunar High-Precision Control Points on Chang’e-1/2 Original Images. J. Jilin Univ. 2012, 42, 461–468. [Google Scholar]
  7. Murphy, T.W., Jr.; Adelberger, E.G.; Battat, B.R.; Hoyle, C.D.; Johnson, N.H.; McMillan, R.J.; Swanson, H.E. Laser Ranging to the Lost Lunokhod-1 Reflector. Icarus 2011, 211, 1103–1108. [Google Scholar] [CrossRef] [Green Version]
  8. Williams, J.G.; Turyshev, S.G.; Boggs, D.H. Lunar Laser Ranging Tests of the Equivalence Principle with the Earth and Moon. Int. J. Mod. Phys. D 2009, 18, 1129–1175. [Google Scholar] [CrossRef] [Green Version]
  9. Jia, Y.; Liu, S.; Li, M.; Li, Q.; Peng, S.; Wen, B.; Zhang, S. Chang’e-3 system pinpoint landing localization based on descent image sequence. Chin. Sci. Bull. 2014, 59, 1838–1843. [Google Scholar]
  10. Wan, W.; Liu, Z.; Liu, Y.; Liu, B.; Di, K.; Zhou, J.; Wang, J. Descent Image Matching Based Position Evaluation for Chang’e-3 Landing Point. Spacecr. Eng. 2014, 23, 5–12. [Google Scholar]
  11. Liu, Z.; Di, K.; Peng, M.; Wan, W.; Liu, B.; Li, L.; Chen, H. High precision landing site mapping and rover localization for Chang’e-3 mission. Sci. China-Phys. Mech. Astron. 2015, 58, 1–11. [Google Scholar] [CrossRef]
  12. Di, K.; Liu, Z.; Liu, B.; Wan, W.; Peng, M.; Wang, Y.; Niu, S. Chang’e-4 lander localization based on multi-source data. J. Remote Sens. 2019, 23, 177–184. [Google Scholar]
  13. Wan, W.; Liu, Z.; Liu, B. Descent trajectory recovery of Chang’e-4 lander based on descent images. In Proceedings of the ISPRS Geospatial Week 2019—GSW2019, International Workshop on Planetary Remote Sensing and Mapping, Enschede, The Netherlands, 10–14 June 2019; pp. 1457–1461. [Google Scholar]
  14. Liu, J.; Ren, X.; Yan, W.; Li, C.; Zhang, H.; Jia, Y.; Wen, W. Descent trajectory reconstruction and landing site positioning of Chang’e-4 on the lunar farside. Nat. Commun. 2019, 10, 4229. [Google Scholar] [CrossRef] [PubMed] [Green Version]
  15. Liu, Z.; Di, K.; Li, J. Landing site topographic mapping and rover localization for Chang’e-4 mission. Sci. China Inf. Sci. 2020, 63, 170–181. [Google Scholar] [CrossRef] [Green Version]
  16. Wang, J.; Wu, W.; Li, J. Vision Based Chang’e-4 Landing Point Localization. Sci. Sin. Technol. 2020, 50, 41–53. (In Chinese) [Google Scholar] [CrossRef] [Green Version]
  17. Qiu, S.; Cao, X.; Wang, F.; Yue, C.; Zhang, Z. Deep space exploration orbit design departing from circumlunar orbit of lunar base. Aerosp. Sci. Technol. 2019, 95, 105505. [Google Scholar] [CrossRef]
  18. Folkner, W.M.; Williams, J.G.; Boggs, D.H. The Planetary and Lunar Ephemeris DE 421. IPN Prog. Rep. 2009, 42, 1–34. [Google Scholar]
  19. Cao, J.; Zhang, Y.; Hu, S. An analysis of precise positioning and accuracy of the CE-3 lunar lander soft Landing. Geomat. Inf. Sci. Wuhan Univ. 2016, 41, 274–278. [Google Scholar]
  20. Williams, J.G.; Boggs, D.H. DE421 Lunar Orbit, Physical Librations, and Surface Coordinates. In Proceedings of the International Workshop on Laser Ranging, Poznan, Poland, 13–17 October 2008. [Google Scholar]
  21. Zhang, Y.; Cao, J.; Xie, J. Lunar object positioning research based on ground-based radiometric tracking Techniques. J. Electron. Meas. Instrum. 2013, 27, 907–915. [Google Scholar]
  22. Zhang, Y.; Wang, J.; Duan, C. Three-way measurement data accuracy analysis based on deep-space station. J. Spacecr. TT&C Technol. 2014, 33, 268–274. [Google Scholar]
  23. Di, K.; Liu, Y.; Liu, B. A Self-calibration bundle adjustment method for photogrammetric processing of Chang’e-2 stereo lunar imagery. IEEE Trans. Geosci. Remote Sens. 2014, 52, 5432–5442. [Google Scholar]
  24. Liu, B.; Jia, M.; Di, K. Geopositioning precision analysis of multiple image triangulation using LROC NAC lunar images. Planet. Space Sci. 2018, 162, 20–30. [Google Scholar] [CrossRef]
  25. Di, K.; Jia, M.; Xin, X. High-resolution large-area digital orthophoto map generation using LROC NAC images. Photogramm. Eng. Remote Sens. 2019, 85, 481–491. [Google Scholar] [CrossRef]
  26. Li, C.; Liu, J.; Ren, X. Lunar global high precision terrain reconstruction based on Chang’e-2 stereo images. Geomat. Inf. Sci. Wuhan Univ. 2018, 43, 486–495. [Google Scholar]
  27. NASA Planetary Data System. Available online: https://pds.nasa.gov (accessed on 10 January 2021).
  28. USGS ISIS Software. Available online: https://isis.astrogeology.usgs.gov (accessed on 10 January 2021).
  29. Ren, X.; Liu, J.; Li, C. A global adjustment method for photogrammetric processing of Chang’e-2 stereo images. IEEE Trans. Geosci. Remote Sens. 2019, 57, 6832–6843. [Google Scholar] [CrossRef]
  30. NAIF. Lunar Reconnaissance Orbiter Camera (LROC) Instrument Kernel v18. 2014. Available online: http://naif.jpl.nasa.gov/pub/naif/pds/data/lro-l-spice-6-v1.0/lrosp_1000 (accessed on 10 April 2018).
  31. Barker, M.K.; Mazarico, E.; Neumann, G.A. A new lunar digital elevation model from the Lunar Orbiter Laser Altimeter and SELENE Terrain Camera. Icarus 2016, 273, 346–355. [Google Scholar] [CrossRef] [Green Version]
  32. Robinson, M. First Look: Chang’e 5. Available online: https://www.lroc.asu.edu/posts/1172.2020 (accessed on 10 December 2020).
  33. Qian, Y.; Xiao, L.; Zhao, S. Geology and scientific significance of the Rümker region in northern Oceanus Procellarum: China’s Chang’E-5 landing region. J. Geophys. Res. Planets 2018, 13, 1407–1430. [Google Scholar] [CrossRef] [Green Version]
  34. Qian, Y.; Xiao, L.; Head, J.W.; van der Bogertd, C.H.; Hiesinger, H.; Wilson, L. Young lunar mare basalts in the Chang’e-5 sample return region, northern Oceanus Procellarum. Earth Planet. Sci. Lett. 2021, 555, 116702. [Google Scholar] [CrossRef]
  35. Wu, B.; Huang, J.; Li, Y. Rock abundance and crater density in the candidate Chang’e-5 landing region on the Moon. J. Geophys. Res. Planets 2018, 123, 3256–3272. [Google Scholar] [CrossRef]
  36. Jia, M.; Yue, Z.; Di, K. A catalogue of impact craters larger than 200 m and surface age analysis in the Chang’e-5 landing area. Earth Planet. Sci. Lett. 2020, 541, 116272. [Google Scholar] [CrossRef]
  37. Neukum, G. Meteoriten Bombardement und Datierung Planetarer Oberflachen. Habilitation Thesis, University München, Munich, Germany, 1983. [Google Scholar]
Figure 1. Diagram of descending, landing, ascending, rendezvous and docking.
Remotesensing 13 00590 g001
Figure 2. Residuals of radio-tracking computations. Detailed explanations in the text below.
Remotesensing 13 00590 g002
Figure 3. Image-based localization of the lander (a) image matching and rectification, (b) sequential image matching and rectification, (c) lander localization in the Chang’e-2 base map and (d) lander localization in Lunar Reconnaissance Orbiter Camera (LROC) Narrow Angle Camera (NAC) base map.
Remotesensing 13 00590 g003
Table 1. Lander localization results and comparison.
Method and StrategyL (°W)B (°N)δL (°W)δB (°N)δL (m)δB (m)
Radio-tracking method48 h data51.915843.0587−0.00040.0003−8.99.1
24 h data51.916643.05940.00040.0018.930.3
12 h data51.918143.05910.00190.000742.121.2
Image-based methodImage matching to Chang’e-2 DOM51.916243.0584————————
Image matching to LROC NAC DOM51.915643.0591−0.00060.0007−13.321.2
Direct observation in LROC NAC image [32]51.916143.0576−0.0001-0.0008−2.2−24.3
Publisher’s Note: MDPI stays neutral with regard to jurisdictional claims in published maps and institutional affiliations.

