
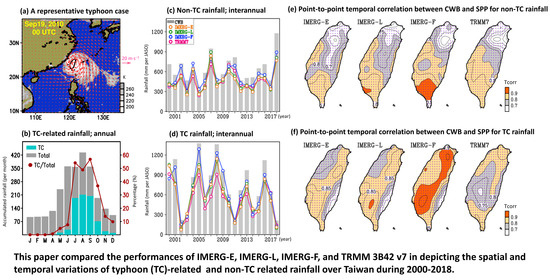
Evaluation of IMERG Level-3 Products in Depicting the July to October Rainfall over Taiwan: Typhoon Versus Non-Typhoon


Abstract
:
1. Introduction
2. Data and Methods
2.1. Data
2.2. Identification of TC and Non-TC Rainy Days
2.3. Statistical Methods for Comparison
3. Results
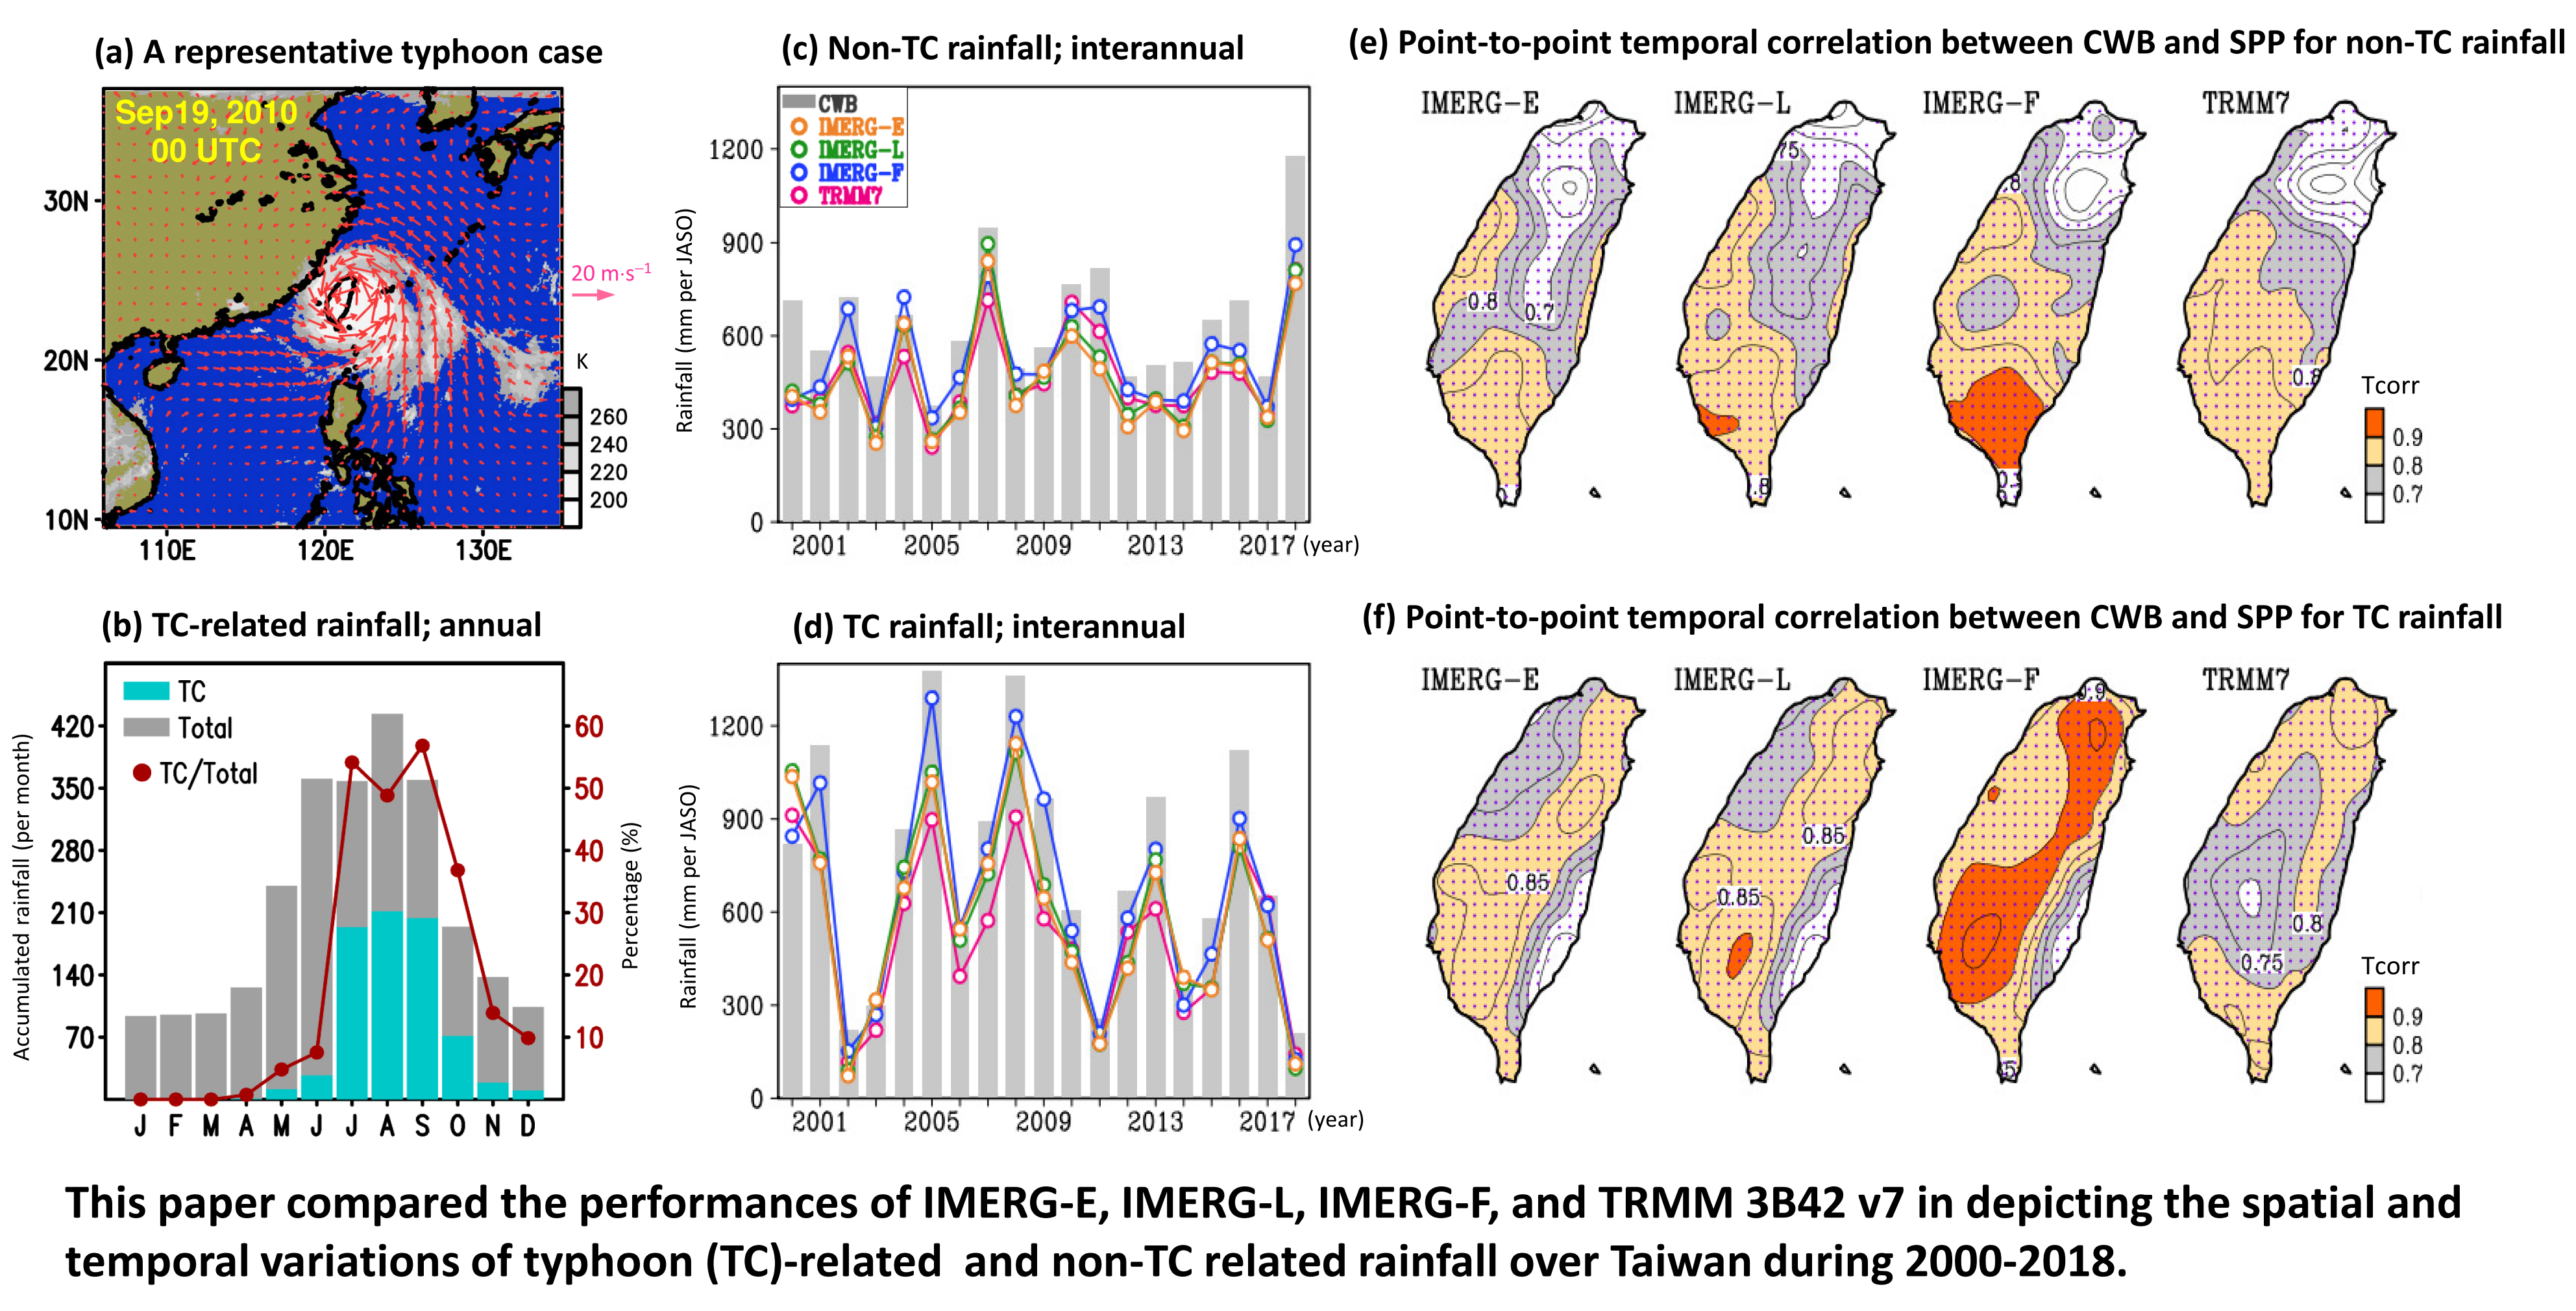
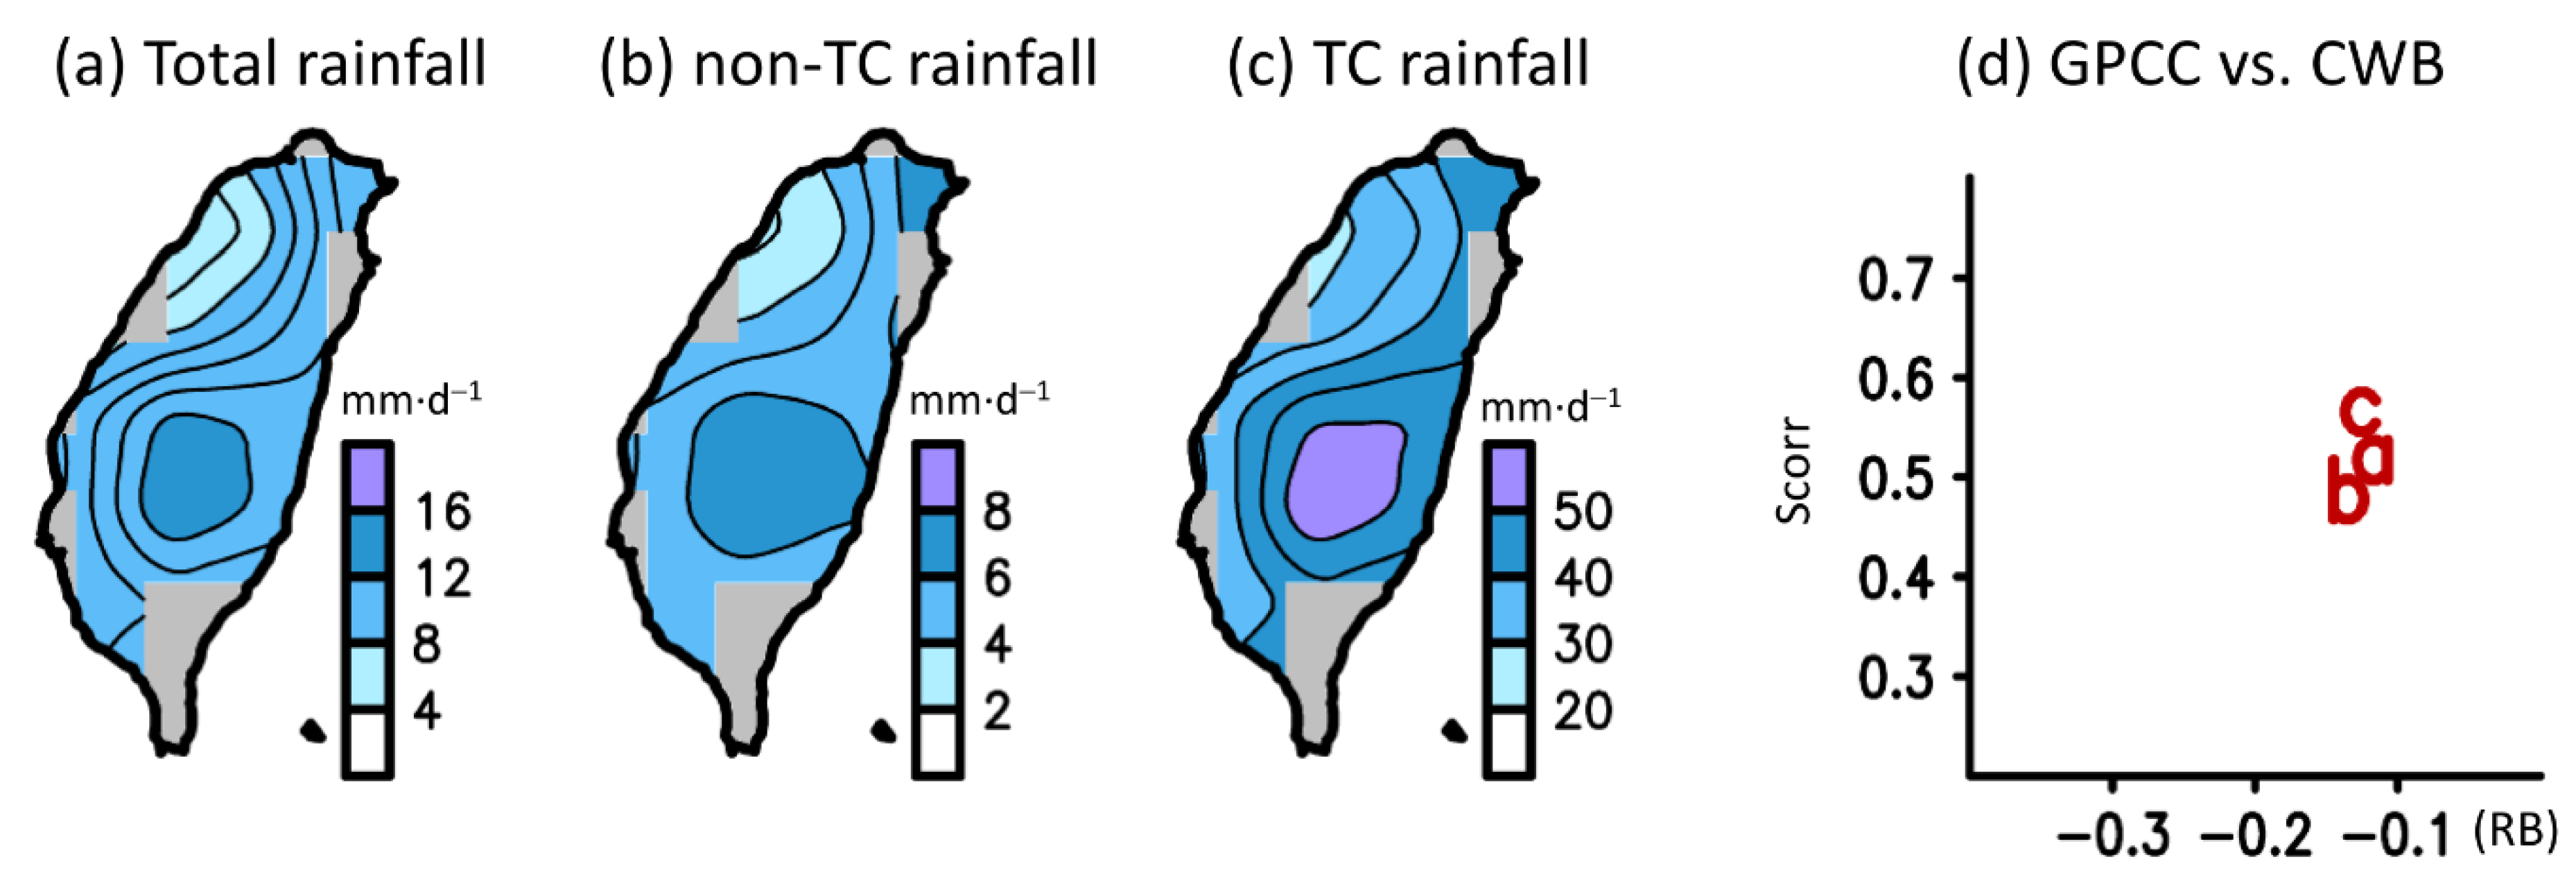
3.1. Seasonal Mean
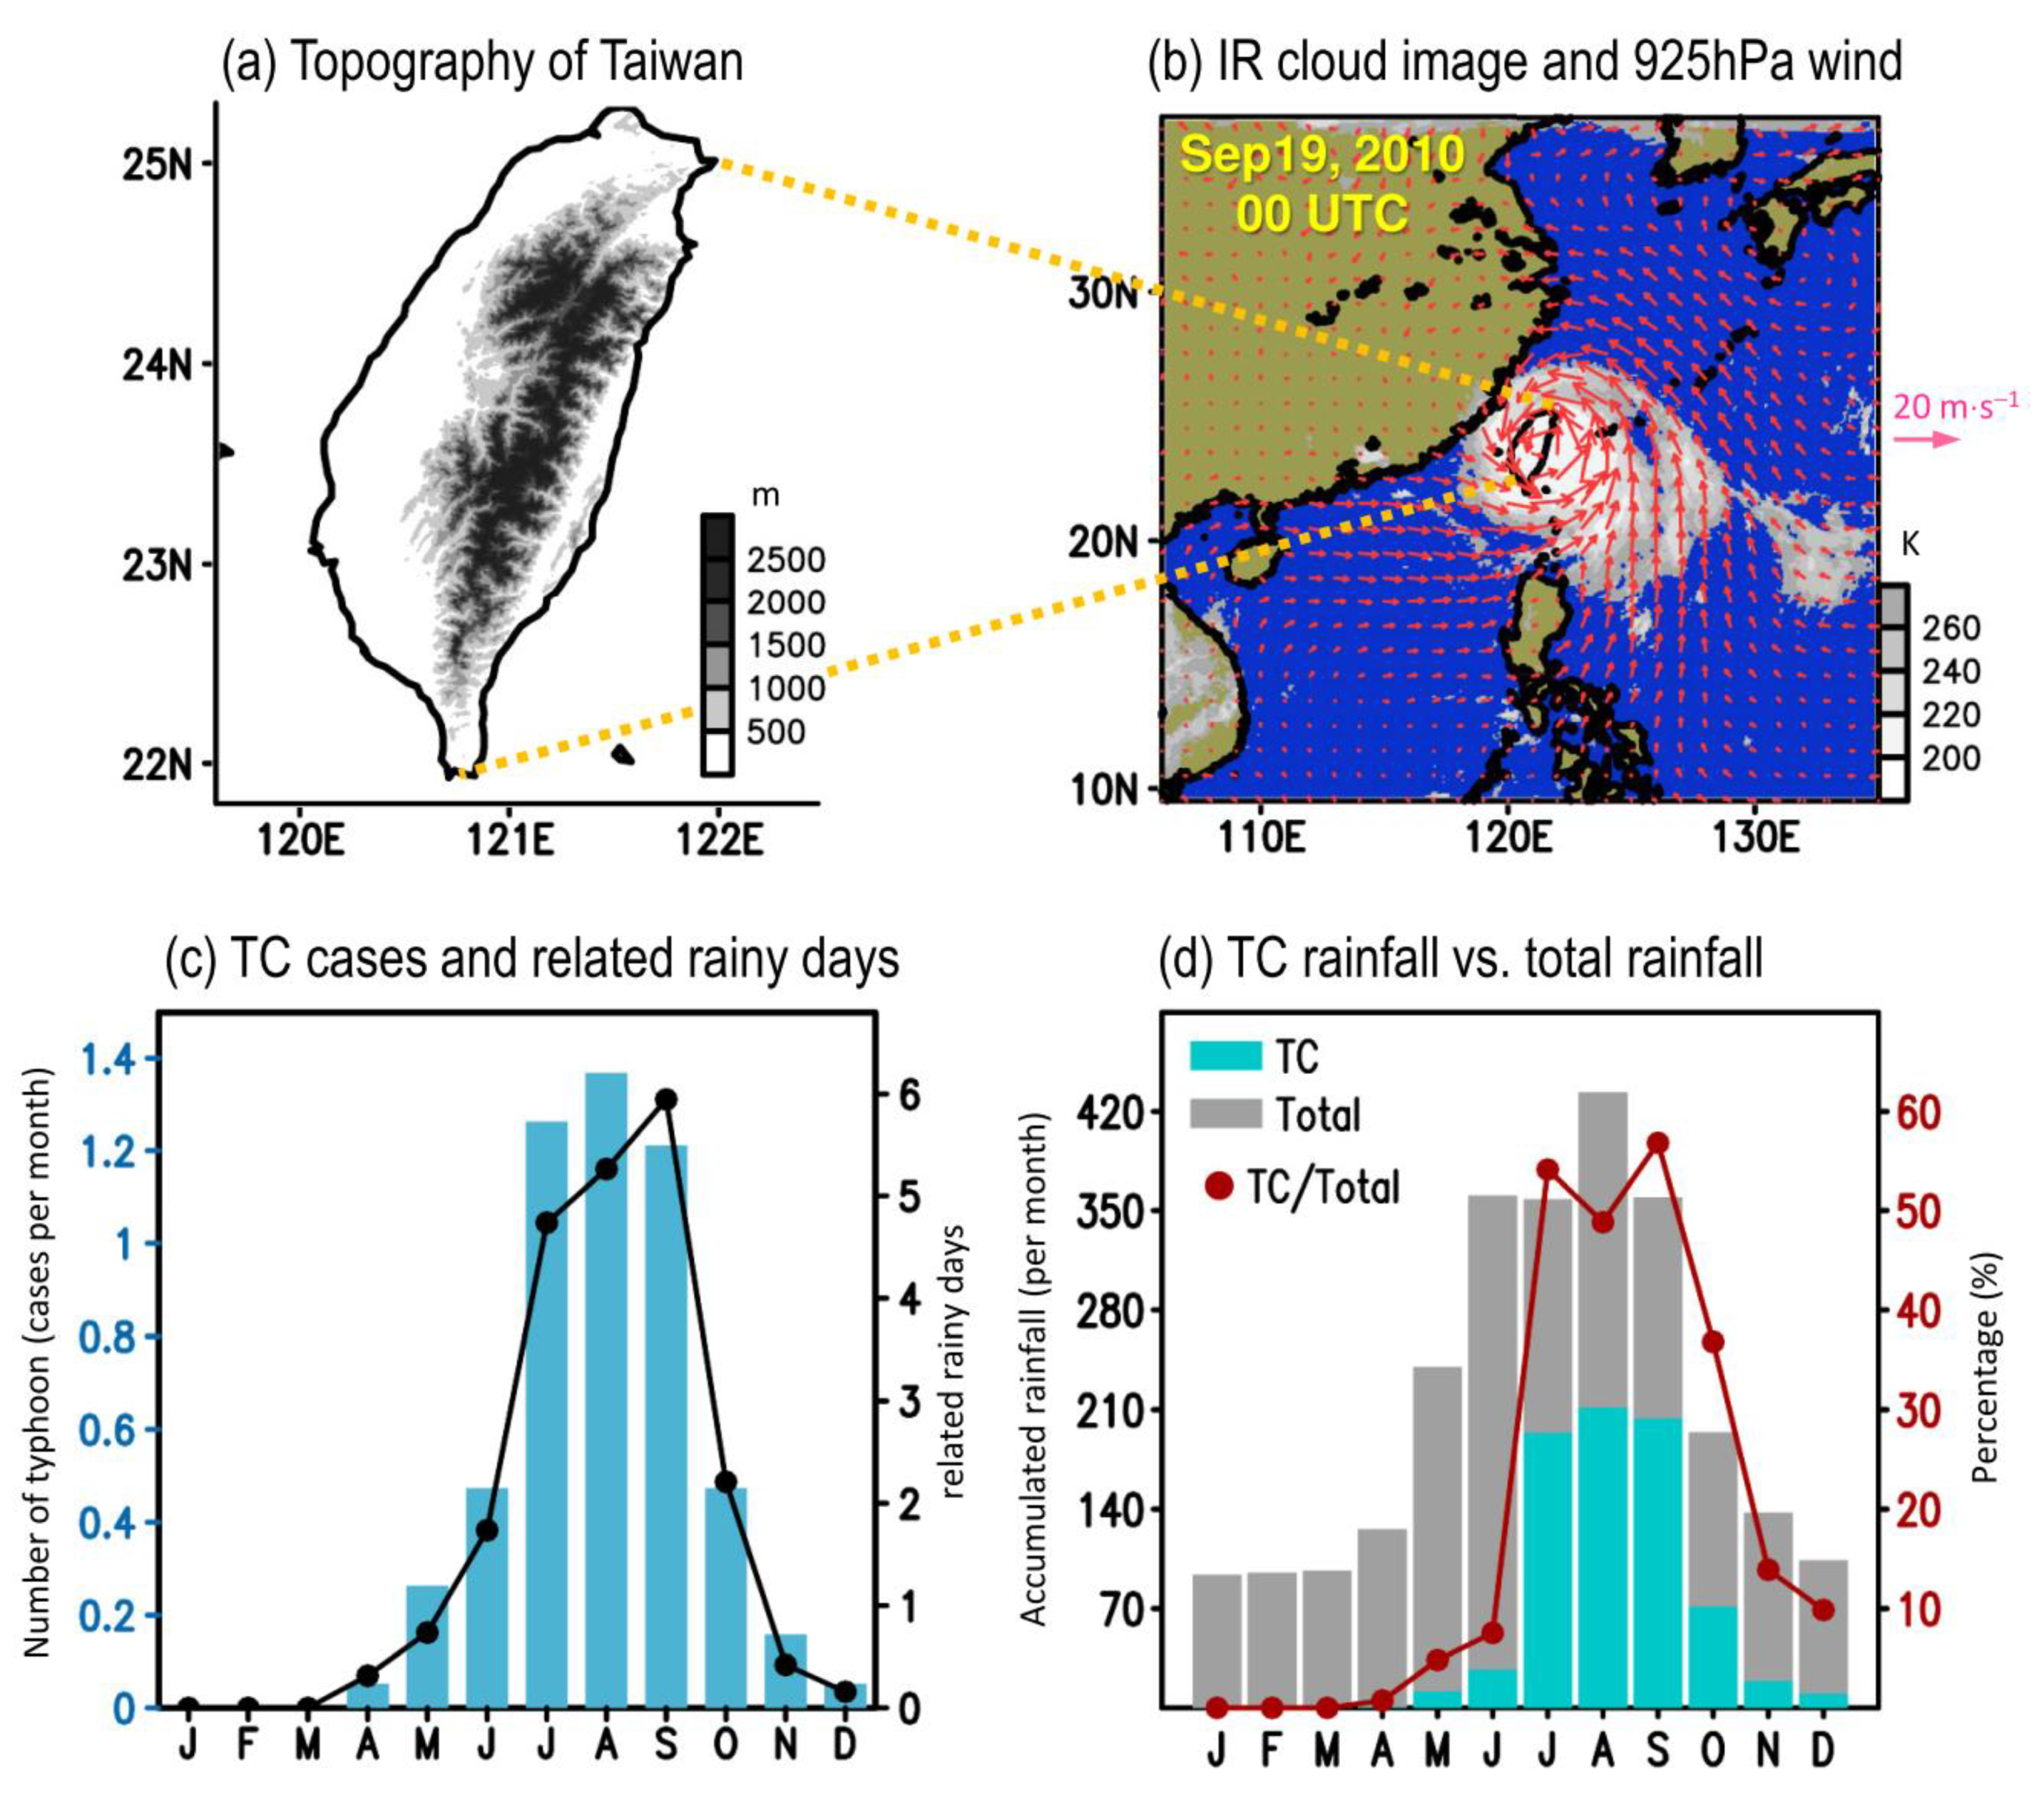
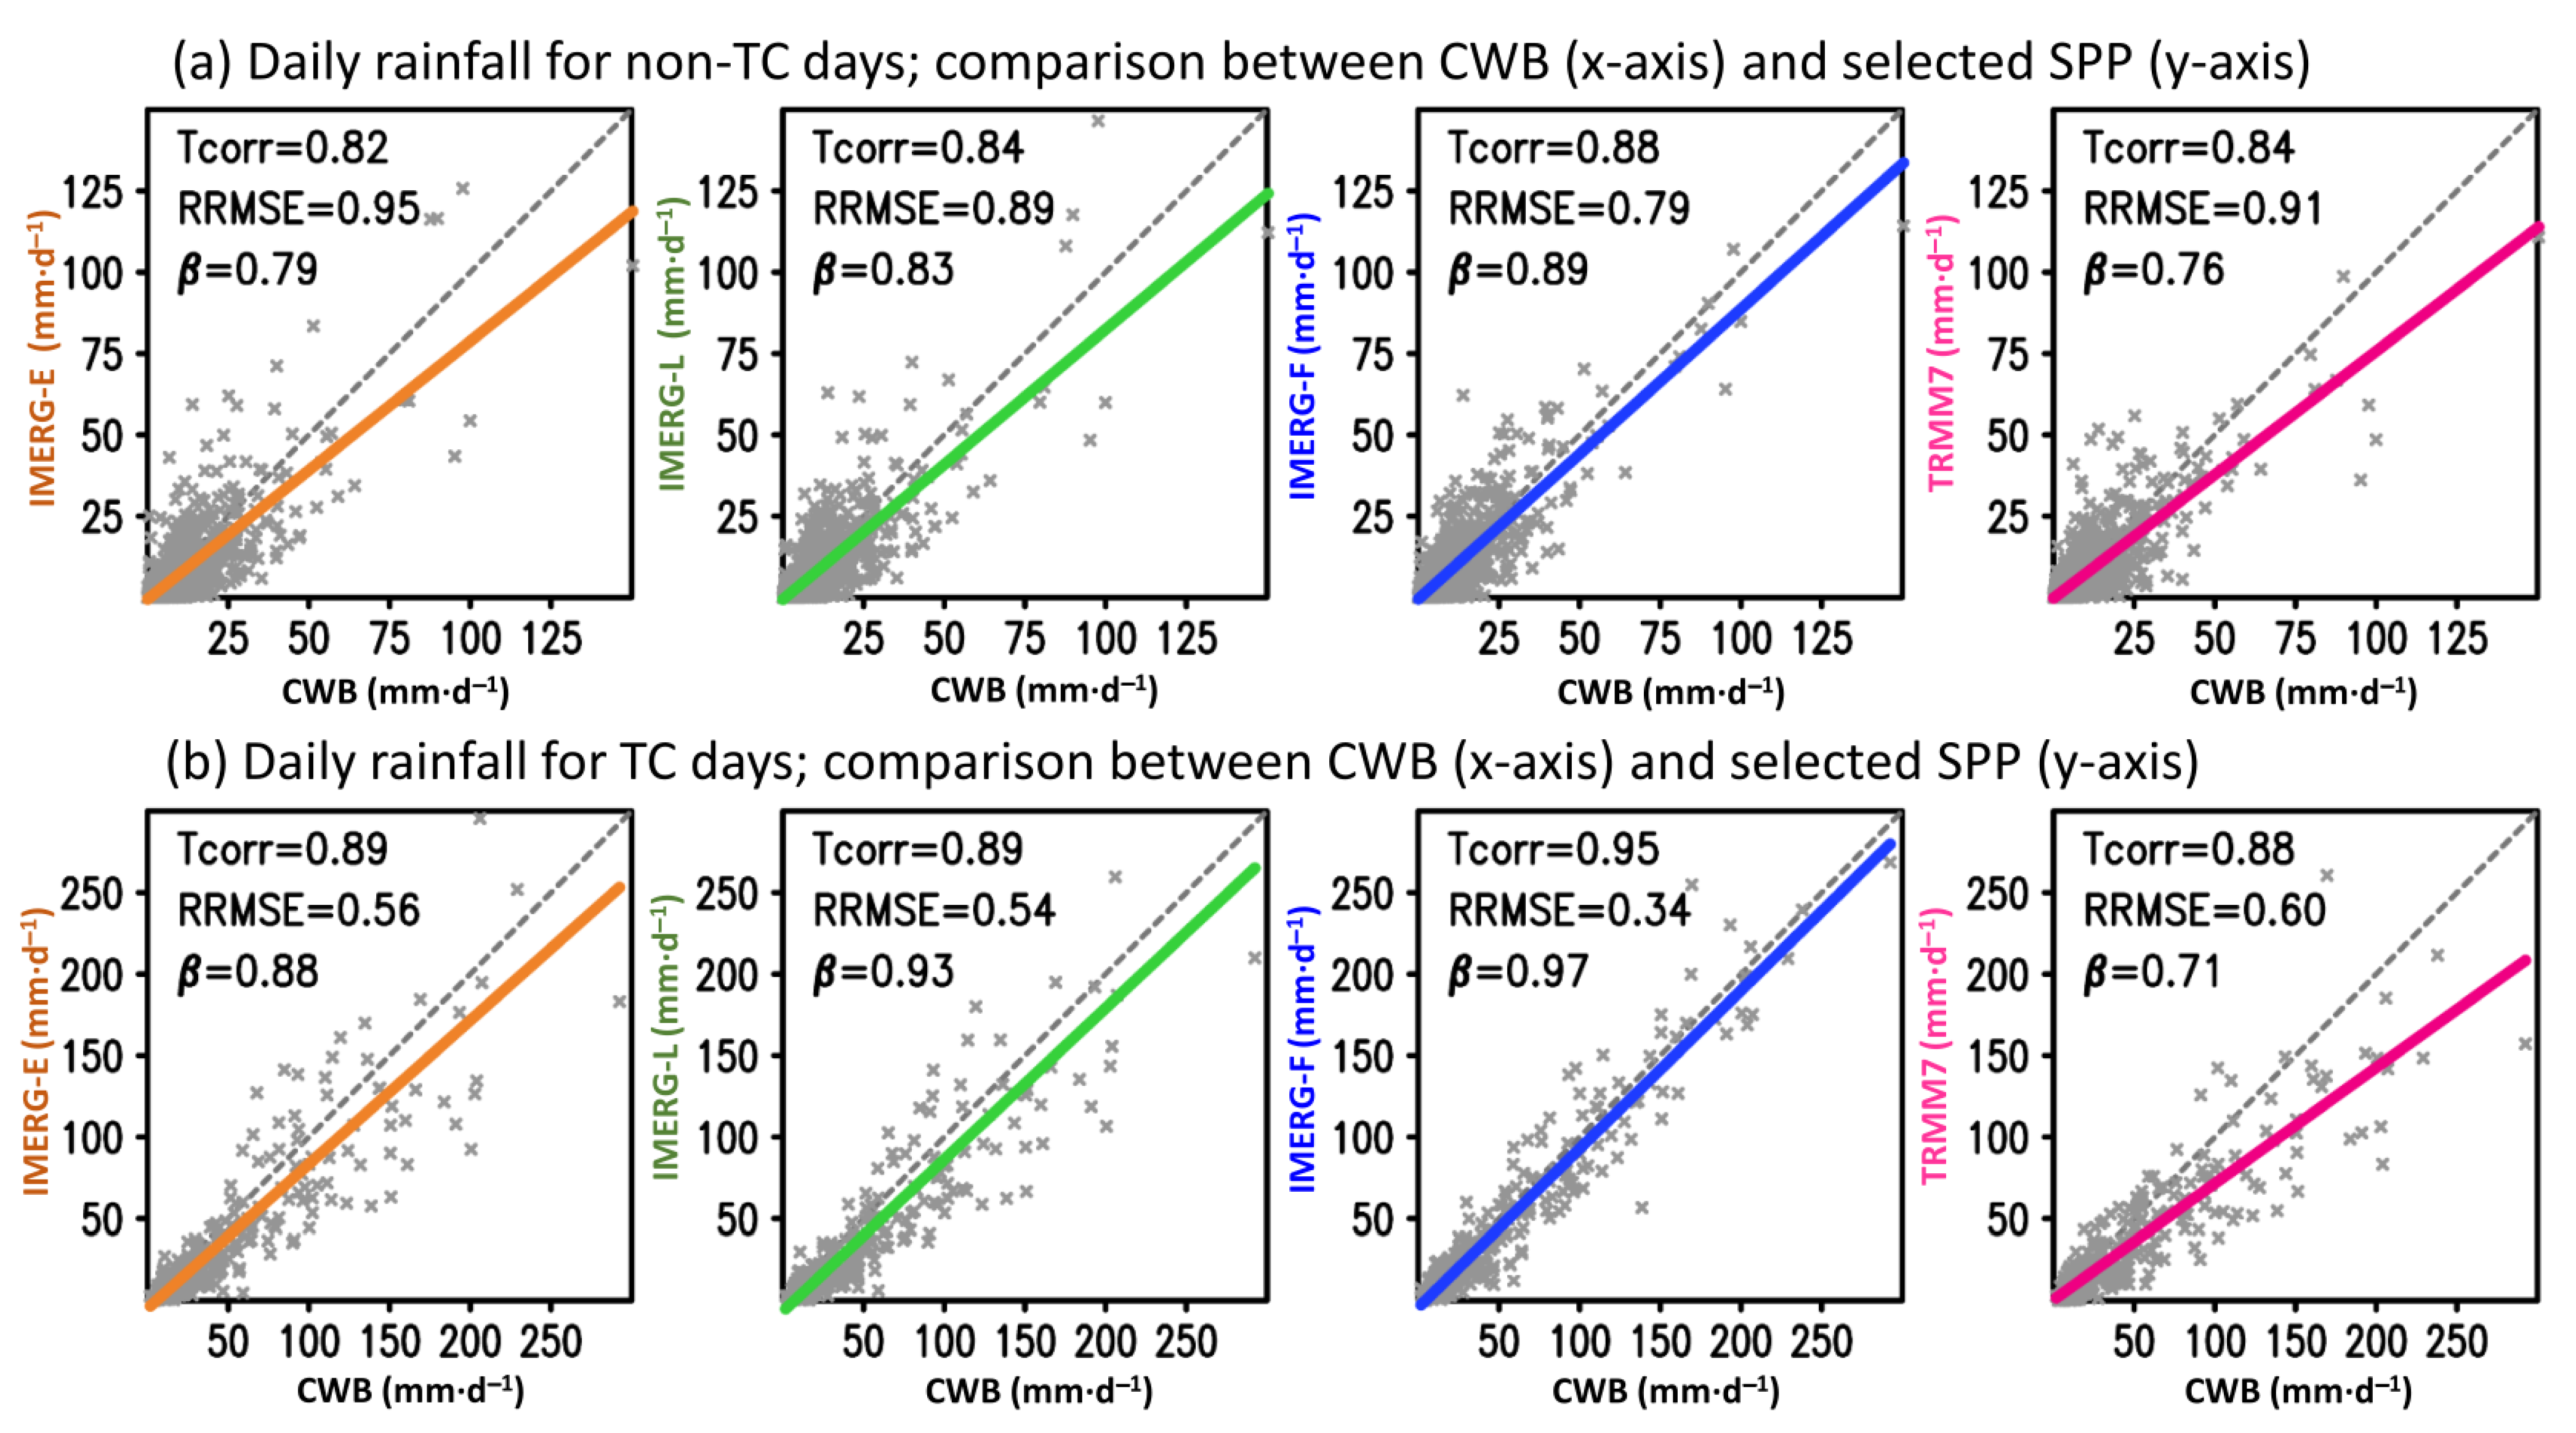
3.2. Daily Variation
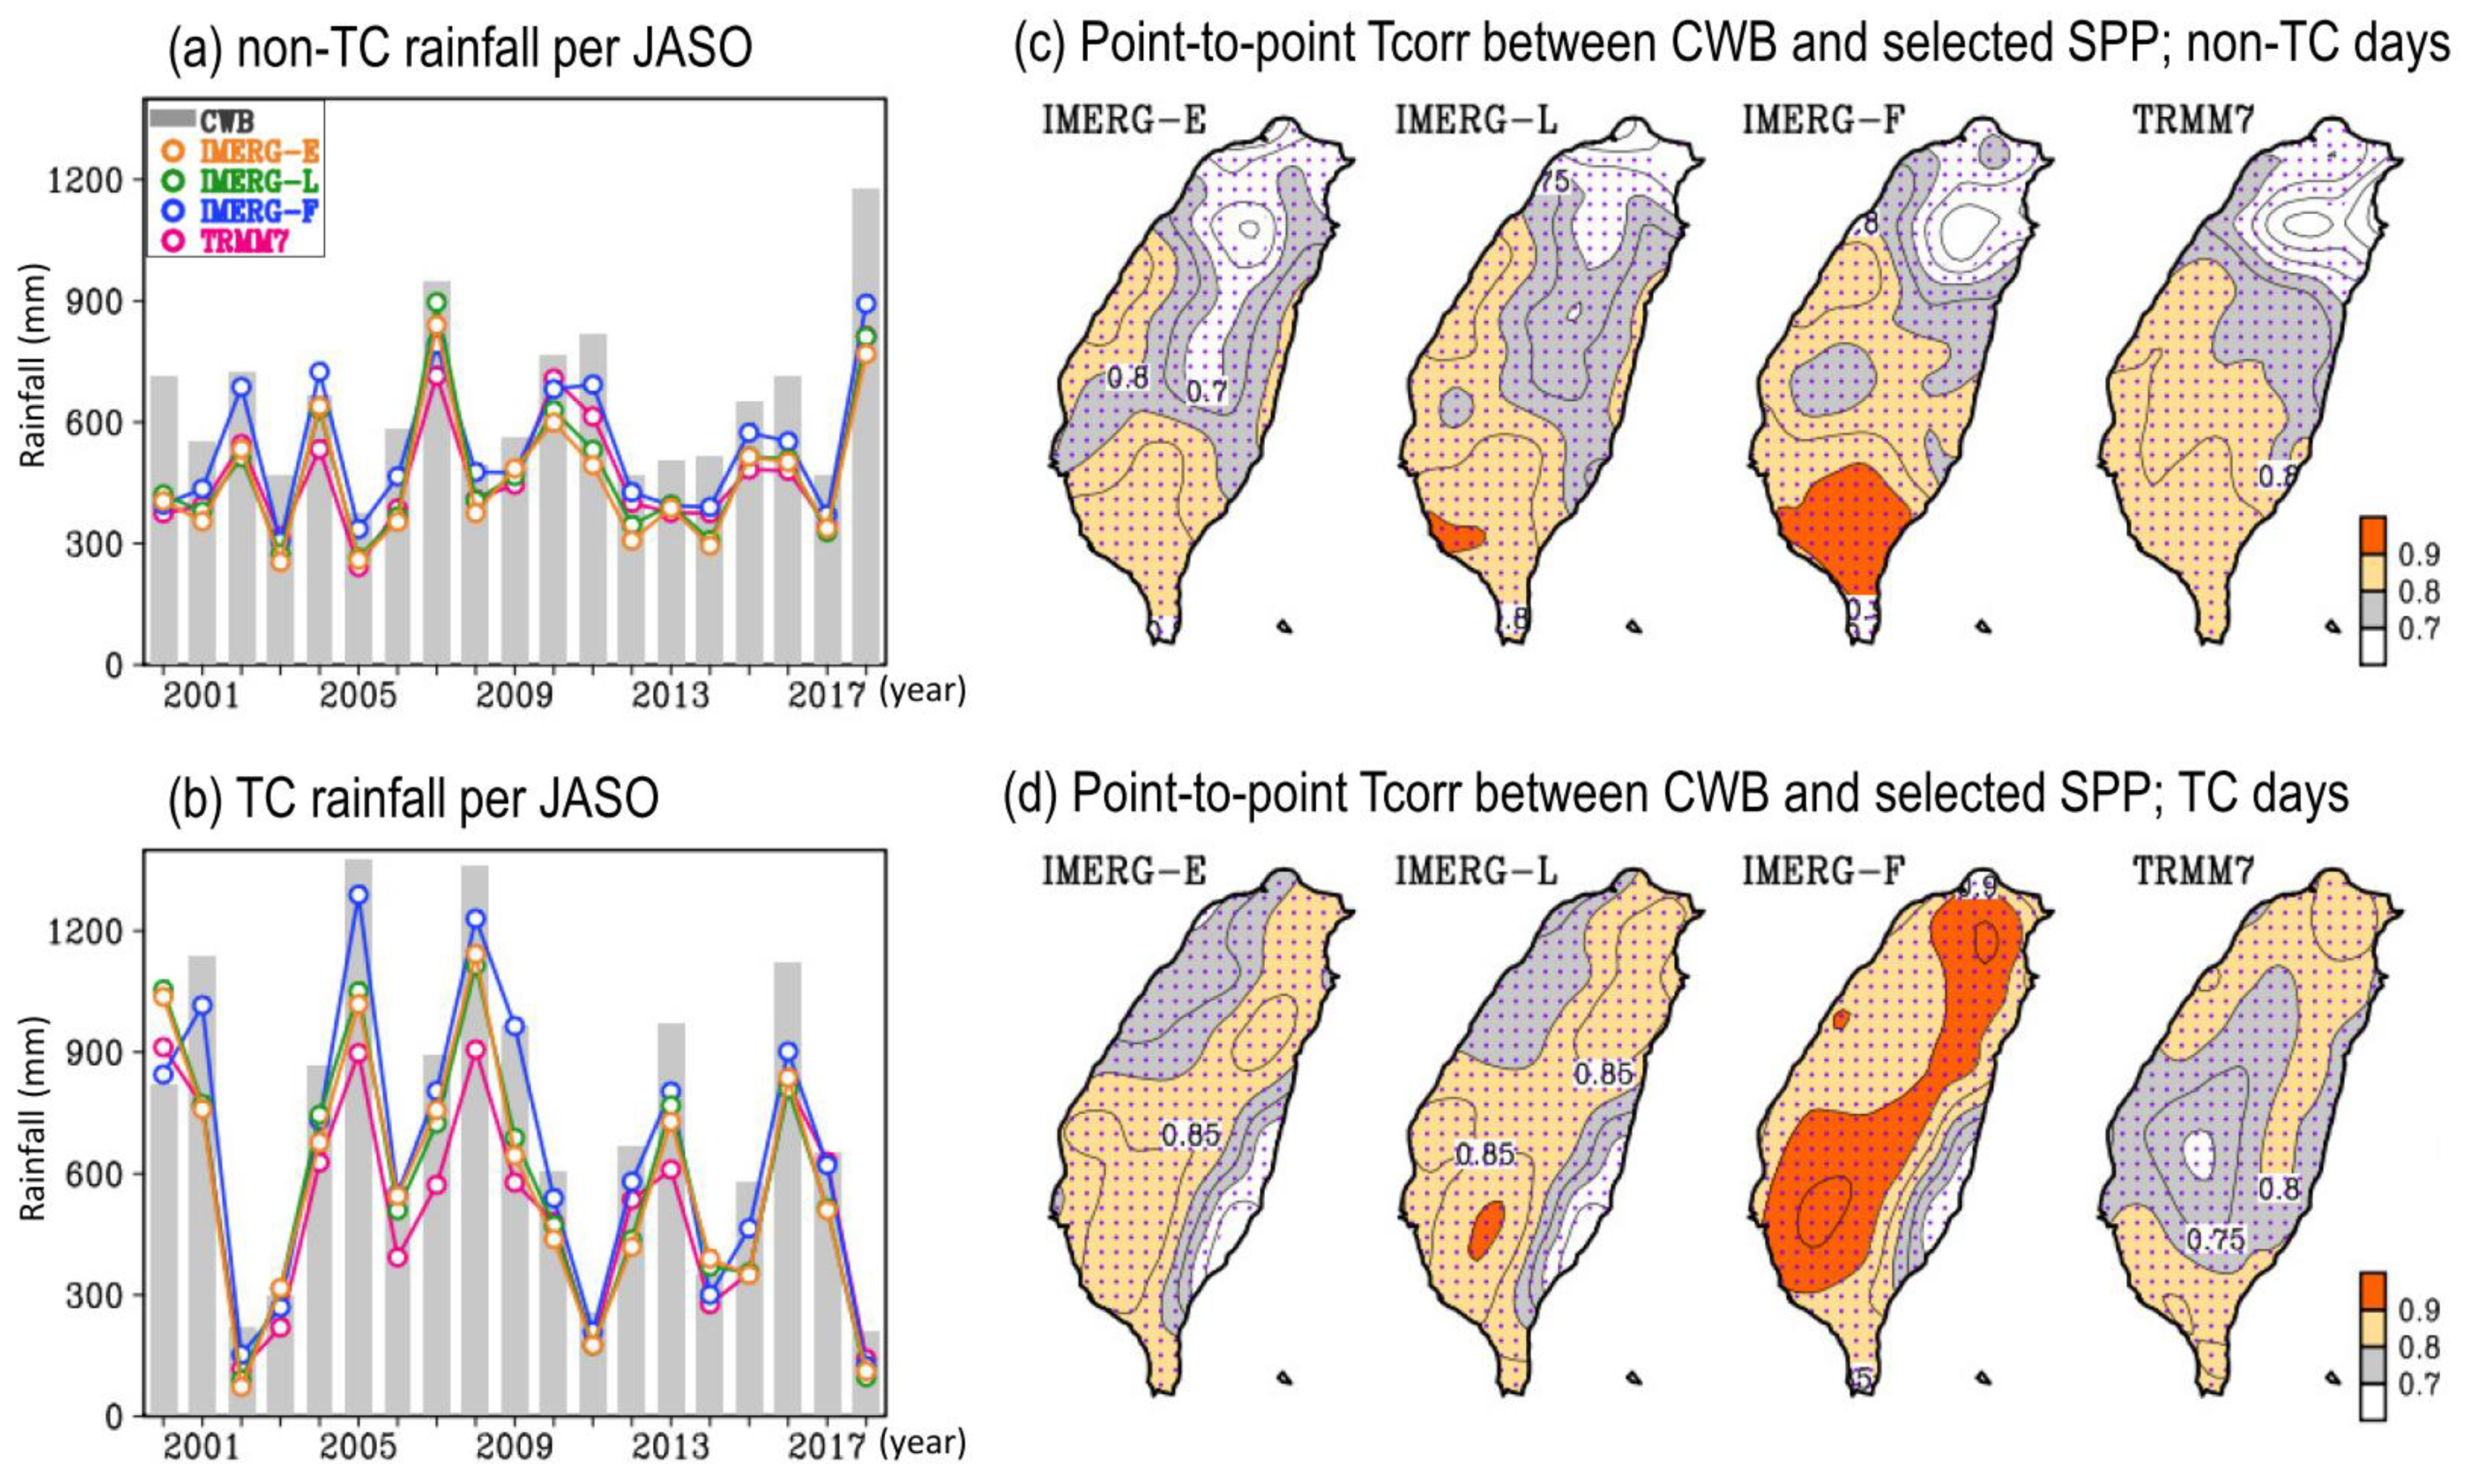
3.3. Interannual Variation
4. Discussions
5. Conclusions
Author Contributions
Funding
Institutional Review Board Statement
Informed Consent Statement
Data Availability Statement
Acknowledgments
Conflicts of Interest
References
- Chen, C.; Chen, Y.; Liu, C.; Lin, P.; Chen, W. Statistics of Heavy Rainfall Occurrences in Taiwan. Weather Forecast. 2007, 22, 981–1002. [Google Scholar] [CrossRef]
- Chen, J.; Li, T.; Shih, C. Tropical Cyclone–and Monsoon-Induced Rainfall Variability in Taiwan. J. Clim. 2010, 23, 4107–4120. [Google Scholar] [CrossRef]
- Wu, C.; Kuo, Y. Typhoons Affecting Taiwan: Current Understanding and Future Challenges. Bull. Am. Meteorol. Soc. 1999, 80, 67–80. [Google Scholar] [CrossRef]
- Hung, C.W.; Shih, M.F.; Lin, T.Y. The Climatological Analysis of Typhoon Tracks, Steering Flow, and the Pacific Subtropical High in the Vicinity of Taiwan and the Western North Pacific. Atmosphere 2020, 11, 543. [Google Scholar] [CrossRef]
- Wang, S.Y.; Chen, T.C. Measuring East Asian Summer Monsoon Rainfall Contributions by Different Weather Systems over Taiwan. J. Appl. Meteorol. Climatol. 2008, 47, 2068–2080. [Google Scholar] [CrossRef] [Green Version]
- Chen, T.C.; Huang, W.R.; Yen, M.C. Interannual variation of the late spring–early summer monsoon rainfall in the northern part of the South China Sea. J. Clim. 2011, 24, 4295–4313. [Google Scholar] [CrossRef]
- Tsou, C.Y.; Feng, Z.Y.; Chigira, M. Catastrophic landslide induced by typhoon Morakot, Shiaolin, Taiwan. Geomorphology 2011, 127, 166–178. [Google Scholar] [CrossRef] [Green Version]
- Xie, B.; Zhang, F. Impacts of typhoon track and island topography on the heavy rainfalls in Taiwan associated with Morakot (2009). Mon. Weather Rev. 2012, 140, 3379–3394. [Google Scholar] [CrossRef]
- Su, S.H.; Kuo, H.C.; Hsu, L.H.; Yang, Y.T. Temporal and spatial characteristics of typhoon extreme rainfall in Taiwan. J. Meteorol. Soc. Jpn. 2012, 90, 721–736. [Google Scholar] [CrossRef] [Green Version]
- Tu, J.Y.; Chou, C. Changes in precipitation frequency and intensity in the vicinity of Taiwan: Typhoon versus non-typhoon events. Environ. Res. Lett. 2013, 8, 014023. [Google Scholar] [CrossRef]
- Wu, C.; Yen, T.; Huang, Y.; Yu, C.; Chen, S. Statistical Characteristic of Heavy Rainfall Associated with Typhoons near Taiwan Based on High-Density Automatic Rain Gauge Data. Bull. Am. Meteorol. Soc. 2016, 97, 1363–1375. [Google Scholar] [CrossRef]
- Cheung, K.K.W.; Huang, L.R.; Lee, C.S. Characteristics of rainfall during tropical cyclone periods in Taiwan. Nat. Hazards Earth Syst. Sci. 2008, 8, 1463–1474. [Google Scholar] [CrossRef]
- Chang, P.; Zhang, J.; Tang, Y.; Tang, L.; Lin, P.; Langston, C.; Kaney, B.; Chen, C.; Howard, K. An Operational Multi-Radar Multi-Sensor QPE System in Taiwan. Bull. Am. Meteorol. Soc. 2020, 1–56. [Google Scholar] [CrossRef]
- Chen, S.; Hong, Y.; Cao, Q.; Kirstetter, P.E.; Gourley, J.J.; Qi, Y.; Zhang, J.; Howard, K.; Hu, J.; Wang, J. Performance evaluation of radar and satellite rainfalls for Typhoon Morakot over Taiwan: Are remote-sensing products ready for gauge denial scenario of extreme events? J. Hydrometeorol. 2013, 506, 4–13. [Google Scholar] [CrossRef]
- Wang, Y.; Zhang, J.; Ryzhkov, A.V.; Tang, L. C-Band Polarimetric Radar QPE Based on Specific Differential Propagation Phase for Extreme Typhoon Rainfall. J. Atmos. Ocean. Technol. 2013, 30, 1354–1370. [Google Scholar] [CrossRef]
- Wang, Y.; Zhang, J.; Chang, P.L.; Langston, C.; Kaney, B.; Tang, L. Operational C-Band Dual-Polarization Radar QPE for the Subtropical Complex Terrain of Taiwan. Adv. Meteorol. 2016, 4294271. [Google Scholar] [CrossRef]
- Zhang, J.; Howard, K.; Chang, P.L.; Chiu, P.T.K.; Chen, C.R.; Langston, C.; Xia, W.; Kaney, B.; Lin, P.F. High-Resolution QPE System for Taiwan. In Data Assimilation for Atmospheric, Oceanic and Hydrologic Applications, 1st ed.; Park, S.K., Xu, L., Eds.; Springer: Berlin/Heidelberg, Germany, 2009; pp. 147–162. [Google Scholar]
- Li, X.; Chen, Y.; Wang, H.; Zhang, Y. Assessment of GPM IMERG and radar quantitative precipitation estimation (QPE) products using dense rain gauge observations in the Guangdong-Hong Kong-Macao Greater Bay Area, China. Atmos. Res. 2020, 236, 104834. [Google Scholar] [CrossRef]
- Yu, Z.; Yu, H.; Chen, P.; Qian, C.; Yue, C. Verification of Tropical Cyclone–Related Satellite Precipitation Estimates in Mainland China. J. Appl. Meteorol. Climatol. 2009, 48, 2227–2241. [Google Scholar] [CrossRef] [Green Version]
- Chen, Y.; Ebert, E.E.; Walsh, K.J.E.; Davidson, N.E. Evaluation of TRMM 3B42 precipitation estimates of tropical cyclone rainfall using PACRAIN data. J. Geophys. Res. Atmos. 2013, 118, 2184–2196. [Google Scholar] [CrossRef]
- Chen, F.; Huang, H. Comparisons of Gauge, TMPA and IMERG Products for Monsoon and Tropical Cyclone Precipitation in Southern China. Pure Appl. Geophys. 2018, 176, 1767–1784. [Google Scholar] [CrossRef]
- Omranian, E.; Sharif, H.O.; Tavakoly, A.A. How Well Can Global Precipitation Measurement (GPM) Capture Hurricanes? Case Study: Hurricane Harvey. Remote Sens. 2018, 10, 1150. [Google Scholar] [CrossRef] [Green Version]
- Xu, W. Precipitation and Convective Characteristics of Summer Deep Convection over East Asia Observed by TRMM. Mon. Weather Rev. 2013, 141, 1577–1592. [Google Scholar] [CrossRef]
- Hsu, H.H.; Zhou, T.; Matsumoto, J. East Asian, Indochina and Western North Pacific Summer Monsoon—An update. Asia-Pacific. J. Atmos. Sci. 2014, 50, 45–68. [Google Scholar]
- Fu, Y.F.; Pan, X.; Yang, Y.J.; Chen, F.J.; Liu, P. Climatological characteristics of summer precipitation over East Asia measured by TRMM PR: A review. J. Meteorol. Res. 2017, 31, 142–159. [Google Scholar] [CrossRef]
- Huang, W.R.; Wang, S.Y. Impact of land–sea breezes at different scales on the diurnal rainfall in Taiwan. Clim. Dyna. 2014, 43, 1951–1963. [Google Scholar] [CrossRef]
- Huffman, G.J.; Bolvin, D.T.; Braithwaite, D.; Hsu, K.; Joyce, R.; Xie, P.; Yoo, S.H. Algorithm Theoretical Basis Document (ATBD) Version 4.5: NASA Global Precipitation Measurement (GPM) Integrated Multi-Satellite Retrievals for GPM (IMERG); NASA/GSFC: Greenbelt, MD, USA, 2015. [Google Scholar]
- Huffman, G.J.; Bolvin, D.T.; Nelkin, E.J.; Stocker, E.F.; Tan, J. V06 IMERG Release Notes; NASA/GSFC: Greenbelt, MD, USA, 2019. [Google Scholar]
- Wang, R.; Chen, J.; Wang, X. Comparison of IMERG Level-3 and TMPA 3B42V7 in Estimating Typhoon-Related Heavy Rain. Water 2017, 9, 276. [Google Scholar] [CrossRef] [Green Version]
- Huang, W.R.; Chang, Y.H.; Liu, P.Y. Assessment of IMERG precipitation over Taiwan at multiple timescales. Atmos. Res. 2018, 214, 239–249. [Google Scholar] [CrossRef]
- Satgé, F.; Hussain, Y.; Bonnet, M.P.; Hussain, B.M.; Martinez-Carvajal, H.; Akhter, G.; Uagoda, R. Benefits of the Successive GPM Based Satellite Precipitation Estimates IMERG–V03, –V04, –V05 and GSMaP–V06,–V07 Over Diverse Geomorphic and Meteorological Regions of Pakistan. Remote Sens. 2018, 10, 1373. [Google Scholar] [CrossRef] [Green Version]
- Cui, W.; Dong, X.; Xi, B.; Feng, Z.; Fan, J. Can the GPM IMERG Final Product Accurately Represent MCSs’ Precipitation Characteristics over the Central and Eastern United States? J. Hydrometeorol. 2020, 21, 39–57. [Google Scholar] [CrossRef]
- Huang, W.R.; Liu, P.Y.; Chang, Y.H.; Liu, C.Y. Evaluation and Application of Satellite Precipitation Products in Studying the Summer Precipitation Variations over Taiwan. Remote Sens. 2020, 12, 347. [Google Scholar] [CrossRef] [Green Version]
- Huffman, G.J.; Bolvin, D.T.; Neklin, E.J.; Wolff, D.B.; Adler, R.F.; Gu, G.J.; Hong, Y.; Bowman, K.P.; Stocker, E.F. The TRMM Multisatellite Precipitation Analysis (TMPA): Quasi-global, multiyear, combined-sensor precipitation estimates at fine scales. J. Hydrometeorol. 2007, 8, 38–55. [Google Scholar] [CrossRef]
- Hersbach, H.; Bell, B.; Berrisford, P.; Hirahara, S.; Horányi, A.; Munoz-Sabater, J.; Nicolas, J.; Peubey, C.; Radu, R.; Schepers, D.; et al. The ERA5 Global Reanalysis. Quart. J. Roy. Met. Soc. 2020. [Google Scholar] [CrossRef]
- Schneider, U.; Finger, P.; Meyer-Christoffer, A.; Ziese, M.; Becker, A. Global Precipitation Analysis Products of the GPCC. Global Precipitation Climatology Centre (GPCC); Deutscher Wetterdienst: Offenbach, Germany, 2018; Available online: http://gpcc.dwd.de (accessed on 31 December 2020).
- Wilks, D.S. Statistical Methods in the Atmospheric Sciences, 1st ed.; Academic Press: Cambridge, MA, USA, 1995; p. 467. [Google Scholar]
- Yen, M.C.; Chen, T.C. Seasonal variation of the rainfall over Taiwan. Int. J. Climatol. 2000, 20, 803–809. [Google Scholar] [CrossRef]
- Chen, C.; Chen, Y. The Rainfall Characteristics of Taiwan. Mon. Weather Rev. 2003, 131, 1323–1341. [Google Scholar] [CrossRef]
- Huang, W.R.; Chang, Y.H.; Hsu, H.H.; Cheng, C.T.; Tu, C.Y. Dynamical Downscaling Simulation and Future Projection of Summer Rainfall in Taiwan: Contributions from Different Types of Rain Events. J. Geophys. Res. Atmos. 2016, 121, 13973–13988. [Google Scholar] [CrossRef]
- Huang, W.R.; Chan, C.L. Dynamical Downscaling Forecasts of Western North Pacific Tropical Cyclone Genesis and Landfall. Clim. Dyna. 2014, 42, 2227–2237. [Google Scholar] [CrossRef]
- Kusumastuti, C.; Weesakul, S. Extreme rainfall indices for tropical monsoon countries in Southeast Asia. Civ. Eng. Dimens. 2014, 16, 112–116. [Google Scholar]
- Ebert, E. Methods for verifying satellite precipitation estimates. In Measuring Precipitation from Space; Levizzani, V., Bauer, P., Turk, F.J., Eds.; Springer: Dordrecht, The Netherlands, 2007; Volume 28, pp. 345–356. [Google Scholar]
- Wei, G.; Lü, H.; Crow, W.T.; Zhu, Y.; Wang, J.; Su, J. Comprehensive Evaluation of GPM-IMERG, CMORPH, and TMPA Precipitation Products with Gauged Rainfall over Mainland China. Adv. Meteorol. 2018, 1–18. [Google Scholar] [CrossRef] [Green Version]
- Su, J.; Lü, H.; Zhu, Y.; Cui, Y.; Wang, X. Evaluating the hydrological utility of latest IMERG products over the Upper Huaihe River Basin, China. Atmos. Res. 2019, 225, 17–29. [Google Scholar] [CrossRef]
- Wu, Y.; Zhang, Z.; Huang, Y.; Jin, Q.; Chen, X.; Chang, J. Evaluation of the GPM IMERG v5 and TRMM 3B42 v7 Precipitation Products in the Yangtze River Basin, China. Water 2019, 11, 1459. [Google Scholar] [CrossRef] [Green Version]
- Foelsche, U.; Kirchengast, G.; Fuchsberger, J.; Tan, J.; Petersen, W.A. Evaluation of GPM IMERG Early, Late, and Final rainfall estimates using WegenerNet gauge data in southeastern Austria. Hydrol. Earth Syst. Sci. 2017, 21, 6559–6572. [Google Scholar]
- Taghizadeh, E.; Ahmadi-Givi, F. Evaluation of GPM precipitation products and mapping soil moisture using SMAP data in the northwest of Iran. Iran. J. Geophys. 2018, 12, 70–86. [Google Scholar]
- Tang, S.; Li, R.; He, J.; Wang, H.; Fan, X.; Yao, S. Comparative Evaluation of the GPM IMERG Early, Late, and Final Hourly Precipitation Products Using the CMPA Data over Sichuan Basin of China. Water 2020, 12, 554. [Google Scholar] [CrossRef] [Green Version]
- Tian, Y.D.; Peters-Lidard, C.D. A global map of uncertainties in satellite-based precipitation measurements. Geophys. Res. Lett. 2010, 37, L24407. [Google Scholar] [CrossRef]
- Tan, M.L.; Ibrahim, A.L.; Duan, Z.; Cracknell, A.P.; Chaplot, V. Evaluation of Six High-Resolution Satellite and Ground-Based Precipitation Products over Malaysia. Remote Sens. 2015, 7, 1504–1528. [Google Scholar] [CrossRef] [Green Version]


| Satellite Product | Upload Delay Time | Spatial Resolution | Time Resolution | Morphing Algorithm |
|---|---|---|---|---|
| IMERG-E | 4 h | 0.1° × 0.1° | 30 min | forward |
| IMERG-L | 14 h | 0.1° × 0.1° | 30 min | forward and backward |
| IMERG-F | 3.5 month | 0.1° × 0.1° | 30 min | forward and backward |
| TRMM7 | 2.5 month | 0.25° × 0.25° | 3 h | - |
| CWB ≥ Rainfall Threshold | CWB < Rainfall Threshold | |
|---|---|---|
| SPP≥rainfall threshold | hits | false alarms |
| SPP <rainfall threshold | misses | correct rejections |
| CWB | IMERG-E | IMERG-L | IMERG-F | TRMM7 | |
|---|---|---|---|---|---|
| Total rainfall | 11.76 | 8.81 | 9.00 | 10.01 | 8.52 |
| Non-TC rainfall | 6.31 | 4.47 | 4.62 | 5.16 | 4.56 |
| TC rainfall | 49.29 | 38.66 | 39.13 | 43.57 | 35.48 |
| Non-TC Rainfall | TC Rainfall | |||
|---|---|---|---|---|
| SPP | Days | % | Days | % |
| IMERG-E | 1004 | 51.7 | 203 | 72.0 |
| IMERG-L | 1013 | 52.2 | 210 | 74.5 |
| IMERG-F | 993 | 51.1 | 202 | 71.6 |
| TRMM7 | 916 | 47.2 | 191 | 67.7 |
| Non-TC Rainfall | TC Rainfall | |||
|---|---|---|---|---|
| SPP | Tcorr | RRMSE | Tcorr | RRMSE |
| IMERG-E | 0.88 | 0.32 | 0.92 | 0.29 |
| IMERG-L | 0.90 | 0.29 | 0.93 | 0.28 |
| IMERG-F | 0.91 | 0.23 | 0.99 | 0.14 |
| TRMM7 | 0.90 | 0.30 | 0.91 | 0.35 |
Publisher’s Note: MDPI stays neutral with regard to jurisdictional claims in published maps and institutional affiliations. |
© 2021 by the authors. Licensee MDPI, Basel, Switzerland. This article is an open access article distributed under the terms and conditions of the Creative Commons Attribution (CC BY) license (http://creativecommons.org/licenses/by/4.0/).
Share and Cite
Huang, W.-R.; Liu, P.-Y.; Chang, Y.-H.; Lee, C.-A. Evaluation of IMERG Level-3 Products in Depicting the July to October Rainfall over Taiwan: Typhoon Versus Non-Typhoon. Remote Sens. 2021, 13, 622. https://0-doi-org.brum.beds.ac.uk/10.3390/rs13040622
Huang W-R, Liu P-Y, Chang Y-H, Lee C-A. Evaluation of IMERG Level-3 Products in Depicting the July to October Rainfall over Taiwan: Typhoon Versus Non-Typhoon. Remote Sensing. 2021; 13(4):622. https://0-doi-org.brum.beds.ac.uk/10.3390/rs13040622
Chicago/Turabian StyleHuang, Wan-Ru, Pin-Yi Liu, Ya-Hui Chang, and Cheng-An Lee. 2021. "Evaluation of IMERG Level-3 Products in Depicting the July to October Rainfall over Taiwan: Typhoon Versus Non-Typhoon" Remote Sensing 13, no. 4: 622. https://0-doi-org.brum.beds.ac.uk/10.3390/rs13040622