
Processing Framework for Landslide Detection Based on Synthetic Aperture Radar (SAR) Intensity-Image Analysis


1
Department of Land Economics, National Chengchi University, Taipei 11605 Taiwan
2
Sinotech Engineering Consultants, Geotechnical Engineering Research Center, Taipei 11494, Taiwan
*
Author to whom correspondence should be addressed.
†
Work was conducted at Department of Land Economics, National Chengchi University, Taipei 11605, Taiwan.
Remote Sens. 2021, 13(4), 644; https://0-doi-org.brum.beds.ac.uk/10.3390/rs13040644
Submission received: 25 December 2020
/
Revised: 1 February 2021
/
Accepted: 3 February 2021
/
Published: 10 February 2021
(This article belongs to the Special Issue SAR Imagery for Landslide Detection and Prediction)
Abstract
:We present an object-based image analysis (OBIA) approach to identify temporal changes in radar-intensity images and to locate land-cover changes caused by mass-wasting processes at small to large scales, such as landslides. Our approach is based upon change detection in SAR intensity images that remain in their original imaging coordinate system rather than being georeferenced and map-projected, in order to reduce accumulation of filtering artifacts and other unwanted effects that would deteriorate the detection efficiency. Intensity images in their native slant-range coordinate frame allow for a consistent level of detection of land-cover changes. By analyzing intensity images, a much faster response can be achieved and images can be processed as soon as they are made publicly available. In this study, OBIA was introduced to systematically and semiautomatically detect landslides in image pairs with an overall accuracy of at least 60% when compared to in-situ landslide inventory data. In this process, the OBIA feature extraction component was supported by derived data from a polarimetric decomposition as well as by texture indices derived from the original image data. The results shown here indicate that most of the landslide events could be detected when compared to a closer visual inspection and to established inventories, and that the method could therefore be considered as a robust detection tool. Significant deviations are caused by the limited geometric resolution when compared to field data and by an additional detection of stream-related sediment redeposition in our approach. This overdetection, however, turns out to be potentially beneficial for assessing the risk situation after landslide events.
1. Introduction
Taiwan is part of an island arc located on an orogenic belt at the junction of the Eurasian, the Philippine and the Okinawa Plate, residing on a highly dynamic and complex arrangement of convergent plates. The result of this is a high-relief geomorphology with associated pronounced morphodynamics and related high-energy processes [1,2,3,4]. The young tectonic framework is dominated by active fault zones, both extensional and compressional, leading to frequent earthquakes with an average of 28 events of magnitude 5 or higher occurring each year. Consequently, oversteepened hillslopes might become destabilized and may ultimately result in large-scale mass movements [5,6].
In addition to frequent earthquakes, Taiwan is known for its extreme weather events. The Tropic of Cancer crosses the island of Taiwan, leading to a complex seasonally shifting Monsoon-dominated weather system that brings an abundance of rain with up to 1000 to 3000 mm of yearly rainfall on average, and seasonally pronounced typhoons. According to the Central Weather Bureau of Taiwan, an average of 3.4 typhoons hit Taiwan each year, with 2.7 typhoons between July and September during the main season [7]. Due to the impact of extreme weather in recent years and the scale and frequency of rainfall, the number of rainfall-related landslides and injuries have significantly increased [6].
To a relatively lower degree, anthropogenic activity exacerbates the already complex situation and causes local hillslope destabilization through interference with the natural environment by construction work, deforestation, agriculture, or other forms of human development [8]. However, frequent earthquakes in a morphologically dynamic setting and pronounced weather events remain the major constituents to cause destabilization of slopes and develop mass movements posing a significant threat to people’s lives and property [9,10].
In August 2009, typhoon Morakot caused severe landslides and damage, with 673 fatalities and financial damage of over 6 billion USD in Taiwan [11,12]. The transformation rate of intact to collapsed bare land was 3.5 times higher than in the following two years [13]. Since then, fresh source areas of landslides and mass movement bodies have been frequently reactivated over the following years during subsequent rainfalls events [14]. Until an area finally stabilizes, new mass-wasting occurs continuously, posing further threats. During this period, a large-scale and long-term detection and monitoring could be performed, in order to be able to react and issue warnings of slope changes. Such a warning system would potentially help to mitigate the risk and save lives, property, as well as the infrastructure in affected areas. In order to achieve this, tracking of fresh, reactivated, and fossil landslides as well as monitoring of exposed slopes are necessary. Much of this work is commonly being done in field investigation and systematic fault monitoring, including geophysical measurements, laser scanning, and other forms of tracking differential movement of landslide bodies [15,16]. While effective, this method has a comparably low efficiency due to the often inaccessible terrain, small area coverage, as well as high data analysis and interpretation demands.
A feasible approach to support field investigations are regular and long-term remote-sensing observations in order to track the development of landslide areas. In particular, optical and multispectral imaging from spaceborne sensors have become popular and are employed in landslide monitoring [17]. However, as landslides are frequently triggered by typhoons in Taiwan, atmospheric conditions around that time period are less favorable, making it difficult to obtain effective cloudless optical images for further analysis [14,18,19].
At this point, Synthetic Aperture Radar (SAR) becomes a feasible alternative for establishing a long-term monitoring scheme, as it can effectively overcome limitations of optical images and is able to obtain signals reflected from the ground in environments with poor weather and light conditions. For this purpose, Interferometric SAR (InSAR) techniques in particular, including Differential InSAR (DInSAR) processing for detecting event-based surface deformation or time-series DInSAR analysis for monitoring long-term displacement trends, are frequently employed for slope monitoring [17,20,21,22,23,24,25].
While interferometric radar processing techniques have been proved to be applicable in such a scenario, previous studies also demonstrated that radar-intensity change detection has the potential to detect landslide areas [26,27]. In such a case, only two radar images are required. The location of potential landslides can then be extracted through the changes in intensity recorded in the radar images.
Considering the types of hazards that exist in Taiwan as mentioned above, an early detection of potential risks plays a critical role in avoiding subsequent hazards and problems. The aim of this study is therefore to develop a processing framework that allows the analysis of SAR intensity images and to extract landslide feature sites. Since efficiency is the main objective we expect to achieve, the system was conceptualized in a way that allows for a systematic approach as soon as new SAR image data becomes publicly available. Consequently, continuous pairs can be formed as the data basis for SAR intensity change detection. Meanwhile, a semiautomated processing was designed within the system. Object-based image analysis (OBIA) has been proposed to upgrade the level of automation. Based on the proposed framework, it is expected that potential landslide sites can be extracted efficiently. However, considering the resolution and inherent geometry errors of SAR images, it is worthwhile noting that we are limited to extract the location and boundary of the landslide sites. That is, the accuracy might be a limitation of the proposed framework.
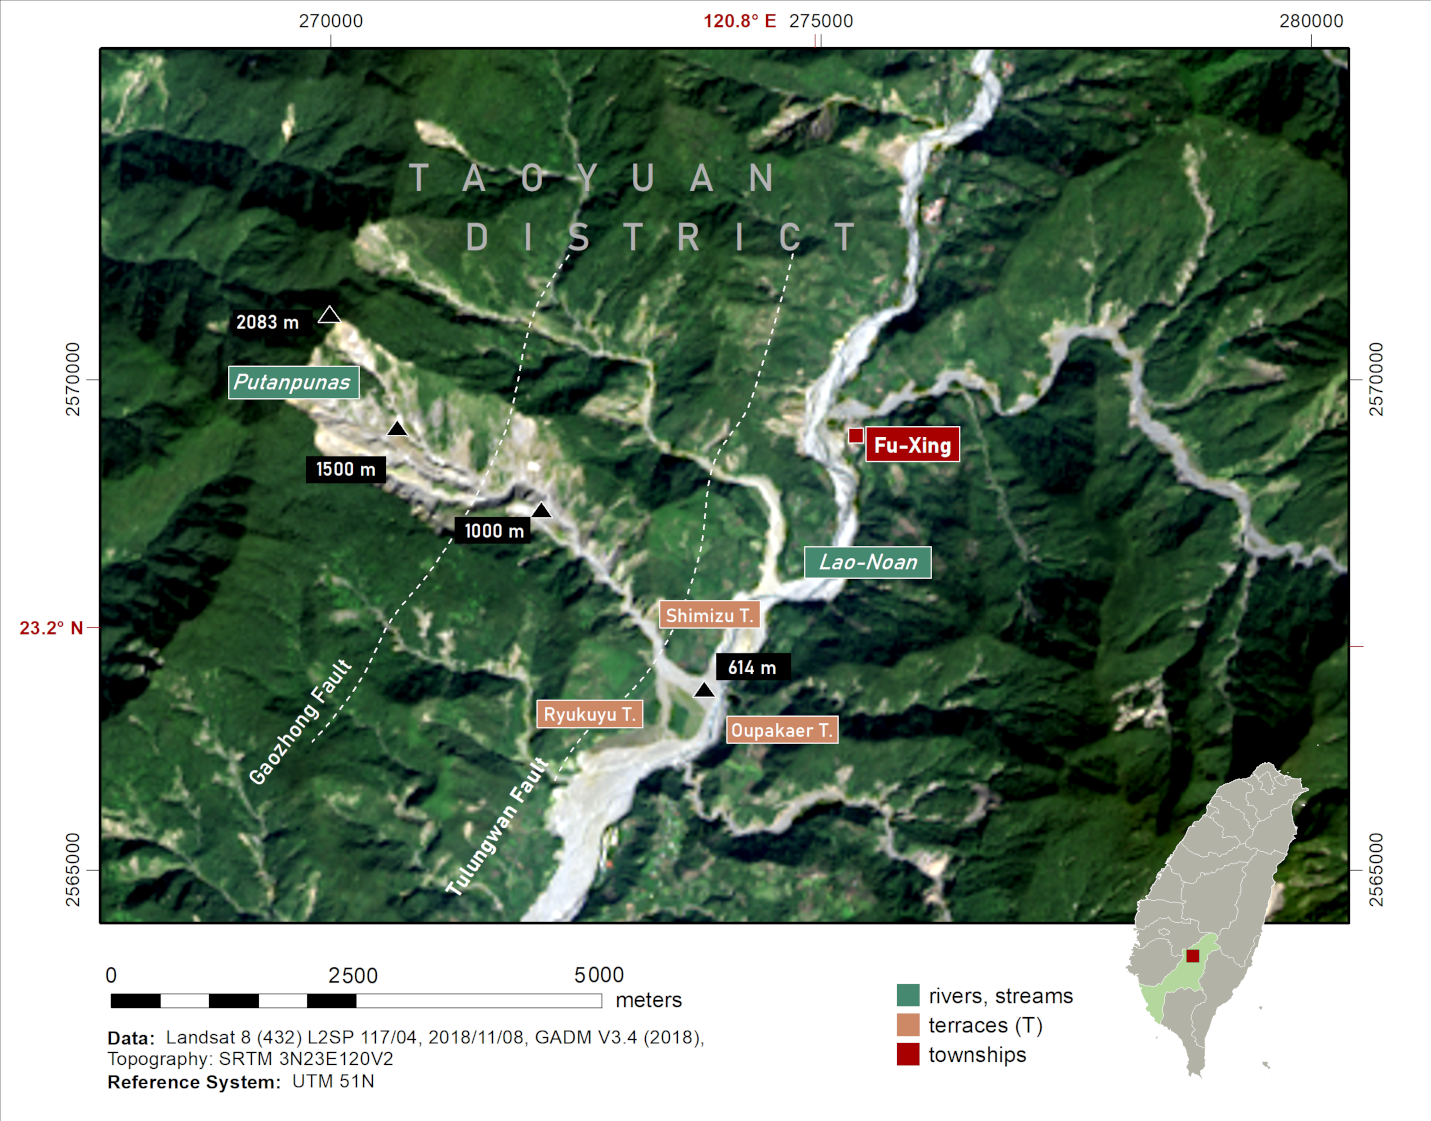
In this paper, we will briefly visit the major characteristics of radar-intensity images, highlight image-processing methods, and then focus on the methodology and application using Advanced SAR (ASAR) images. The practical approach will be established through observations of major landslide occurrences at the Putanpunas stream located in the Lao-Noan River Basin in Southern Taiwan, which were caused by the Morakot typhoon event (see Figure 1). Lastly, we will discuss and evaluate the results against ground-truth data and examine a number of measures to potentially improve the performance of our approach.
2. Background
Remote-sensing data are attractive and commonly used for landslide monitoring, be it for primary observations or as support for field-monitoring [28,29,30,31]. In particular, Synthetic Aperture Radar (SAR) images are frequently employed for detecting and monitoring landslides as the sensors have the ability to penetrate clouds and to return results during the day and night [19,32], which makes them a perfect assembly for observations over cloudy, higher mountain areas. As a landslide event alters the ground surface resulting in changes of image intensity and texture, this change can be recorded by a sensor and stored on a spaceborne platform. Consequently, landslides can be located in time and space through change-detection recordings based on a sequence of images [29,33].
While SAR images can provide detailed information about the intensity of surface reflections, there are a number of factors that affect the intensity, which can be divided into two types: sensor-based and object (landform)-based factors. Factors inherently related to the employed sensors and observation approach are, e.g., wavelength, polarization, and the incidence angle. Regarding factors related to landforms, signal reception is also affected by the relationship between direction of exposition and slope of the terrain, and mainly the orbit direction. Foreshortening or layover could occur on facing slopes, while there can be shadows on slopes facing away [34]. The sensor is less sensitive to slopes facing towards the north and south, which, in turn, limits the ability to detect landslides [34,35,36]. In addition to topographic characteristics, land-cover types also affect the visibility and reliability of radar images [35,37,38,39]. For example, dense vegetation cover is likely to cause low coherence and greatly affects SAR images [40].
In previous research, when using intensity information to detect changes, authors mostly focused on the relationship between landform factors and changes in intensity, and applied that information to change detection. Terrain effects such as ground-surface changes may cause variations in backscatter intensity and coherence, and this relationship can be used to distinguish the type of surface cover [38]. Therefore, the intensity change detection of SAR images has mainly been used to observe changes in surface coverage [23,41,42]. Those approaches also assumed that landslide disasters would cause changes in the type of surface cover. Normally, one would assume that vegetation turns into bare land, which, in turn, changes the intensity of backscattering and leads to increased reflection intensity [23,43]. In addition, some literature suggests that changes in humidity and roughness caused by landslides were also responsible for intensity changes [44,45]. Intensity changes in SAR images can therefore be used quite efficiently to detect landslide events [23,43,44].
In order to detect the change through intensity information of a SAR image, it is necessary to first fix multiple influencing factors and observe the relationship between a small number of variables and the intensity change.
Shadows caused by terrain occlusion can be compensated using images acquired from different tracks. The geometric deformation of the image is normally addressed in two ways according to previous studies. The first solution is to reconstruct the correct geometry through terrain correction [43]. Alternatively, a mask is generated to directly block areas with geometric deformation and shadows, and to produce a visibility map [23,44].
Based on the slope, aspect, incidence angle, and orbit direction, refs [46,47,48,49] estimated an R-index representing the reliability of each pixel position of the radar image: the larger the R-index value, the higher the visibility. Additionally, land use was further considered in combination with the R-index to reveal reliable areas in SAR images. Although it was largely feasible to implement in order to cope with geometric distortions, it was found that the distortion cannot be completely corrected, even when a high-quality DEM was applied for the first method. This shortcoming was particularly obvious in mountainous terrain. In the SAR visibility map, reliable and geometric distorted areas were clearly outlined. However, the reliable observable areas might be largely reduced due to poor geometric relationship between the SAR sensor and the terrain.
Mondini et al. (2019) [44] proposed another method to process SAR intensity images for landslide detection. As geometric distortion becomes more pronounced in SAR images referenced to a geographic coordinate system, misjudgments of landslides in foreshortening areas can occur. They hence proposed to use a SAR image while using the original SAR coordinate system as the source image for landslide detection. Moreover, in order to retain as many signals as possible, no masking was applied in the SAR images. This method basically avoids the limitations encountered in the two geometric correction approaches, and more importantly, it successfully extracts signals representing surface changes.
Together with the capabilities of SAR intensity information and the concepts of SAR image preparations reported in [44], the basis for our framework was established. Moreover, instead of manual interaction as applied in [44], we further proposed employing OBIA to improve the degree of automation, which is in line with the objectives highlighted in this study.
3. Methods
Our aim is to perform a landslide detection using SAR intensity images in the original SAR coordinate system, i.e., slant-range coordinates. The approach we followed in this work established a processing and analysis chain composed of building blocks and data characteristics as outlined above and as detailed in the following paragraphs.
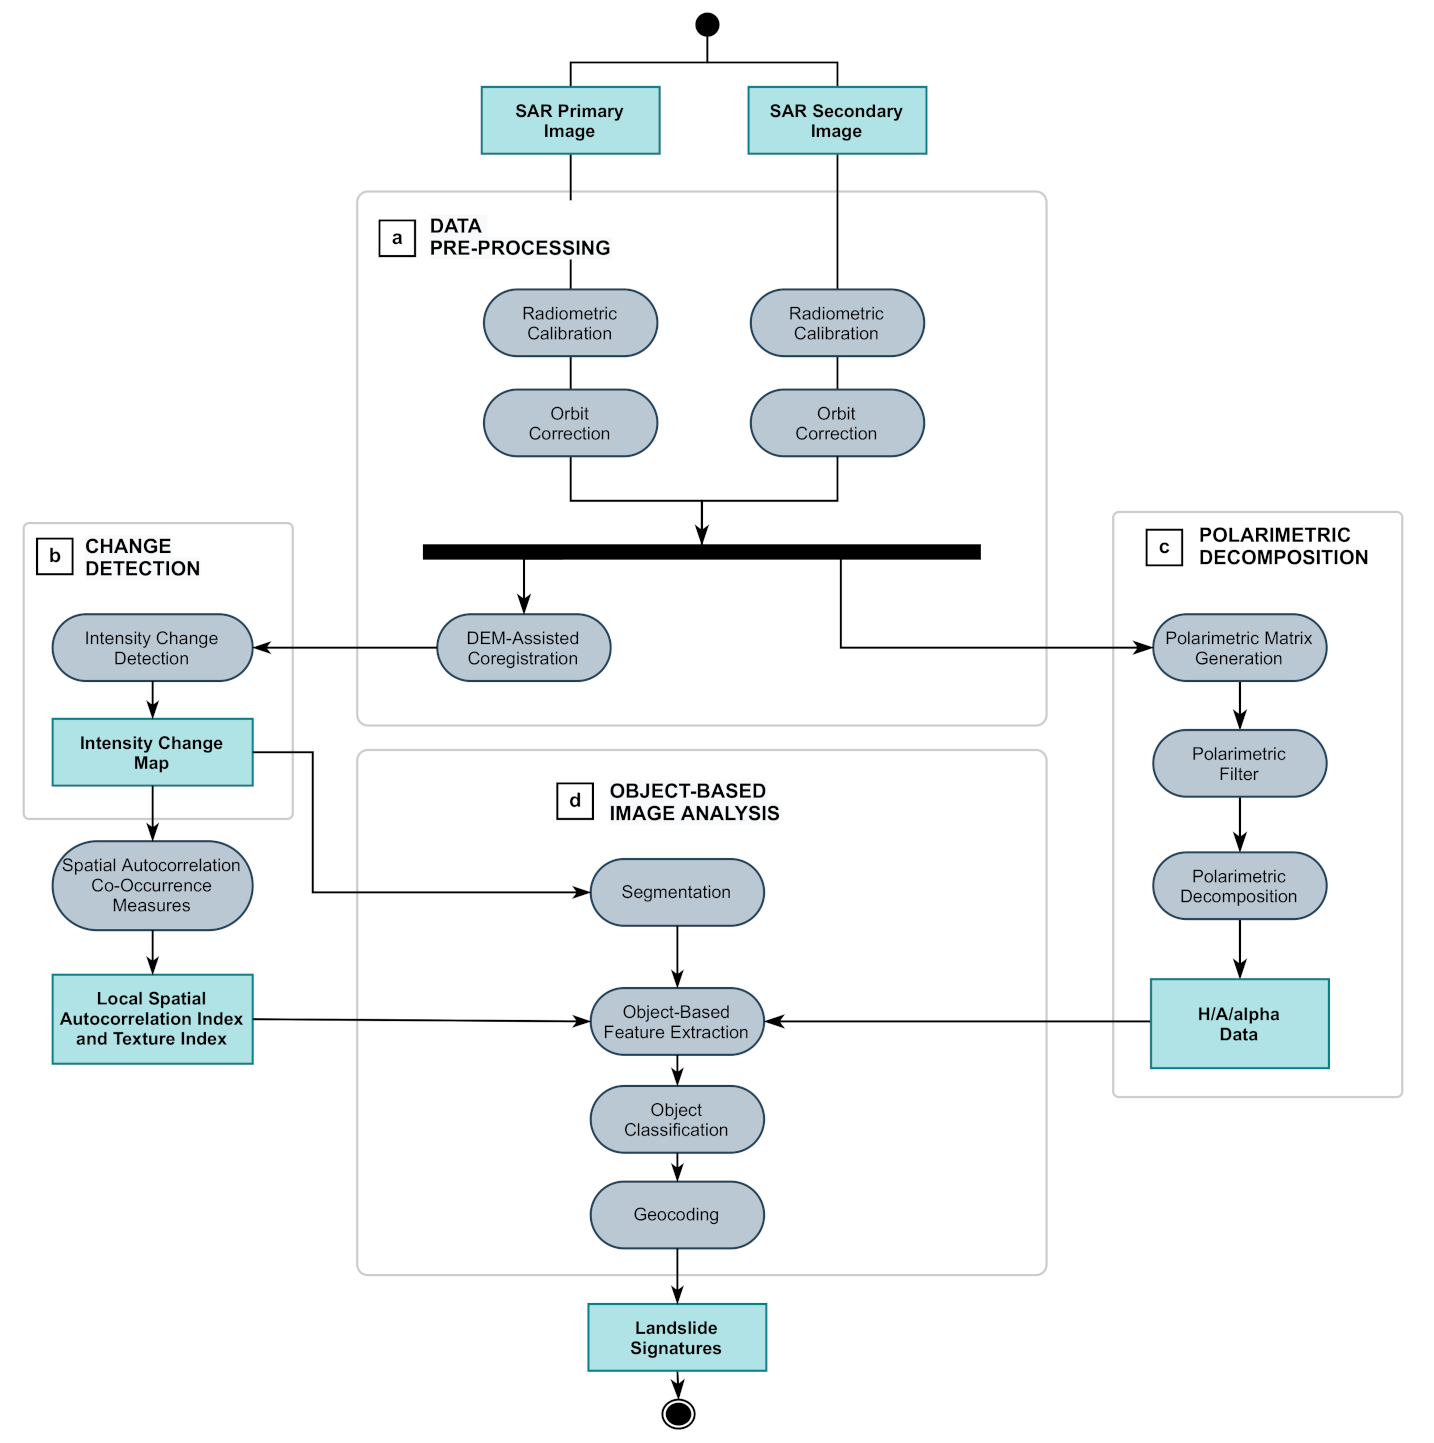
The general workflow proposed for detecting land-cover change is depicted in Figure 2 and consists of the following steps:
- (1)
- Data ingestion and preprocessing (Figure 2a), and change detection (Figure 2b), discussed in Section 3.1;
- (2)
- Object-based image analysis, including object feature extraction, as well as image segmentation and object classification (Figure 2d), by making use of polarimetric decomposition (Figure 2c), discussed in Section 3.2.
3.1. Preprocessing of Intensity Image and Change Detection
Image preprocessing, including orbital correction, radiometric correction, and coregistration, were performed using the European Space Agency’s (ESA) Sentinel Application Platform (SNAP) software package. After initial preprocessing, residual topographic effects and noise still remained in the coregistered images limiting the performance of intensity change detection. These effects need to be addressed subsequently. Influenced by the relationship between topography and incident angle of the acquired SAR image, topographic effects including layover and foreshortening occured, causing geometric distortion of the SAR image [34]. A topographic correction, as proposed by [43], or the invisible masking method reported in [35,36] are common solutions to account for these errors (Figure 2a).
SAR intensity change detection (Figure 2b) refers to the detection of changes in pixel-by-pixel intensity of radar intensity images in the same area and at different times, commonly calculated by image subtraction or by building image ratios. Once the preprocessing of a pair of slant-range intensity images was accomplished, the pixel-based image computation proposed by [50] was performed, dividing the intensity of the reference image (master) by the intensity of the secondary image (slave). Subsequently, a Log-Ratio (LR) index image was calculated (Equation (1)) [23], which was then employed for subsequent change detection analysis. Considering its statistical characteristics, image division outperforms subtraction [44,50]. Authors also noted that the Log-Ratio (LR) intensity detection method performs better due to its capability to reduce noise [41,42,50].
3.2. Object-Based Image Analysis
The clusters of similar tones or textures in a Log-Ratio index image represent areas where ground surface has changed [44]. In order to understand surface changes seen after specific events, these clusters are the targets to be extracted. To this end, Object-Based Image Analysis (OBIA), an advanced image classification method considering spectral and shape conditions [52], was proposed. Moreover, based on studies reported by [18,53,54,55], SAR imagery are considered to be a suitable product to be applied in OBIA for successful landslide detection, thus, we made use of the OBIA implemented in the eCognition software package to extract clusters that occurred in LR index images.
Implementation of OBIA is normally divided into three stages [56], including (1) image segmentation, (2) object feature calculation, and (3) object classification (cf. steps in Figure 2d). After performing an image segmentation, each object is used as a spatial unit for classification. Finally, each object is classified into different categories based on the spectral, texture, and/or shape characteristics. As OBIA will pass through two stages of the segmentation algorithm and object classification, it is noted that the approach in this work is to retain more objects based on looser conditions during the first stage to avoid missing any positive landslide features. Additional irrelevant object would then be screened and removed during subsequent processing.
3.2.1. Object-Based Feature Extraction
In our workflow, the Object Feature Extraction (see Figure 2d) required input from two processes, namely, the change detection described above (see Figure 2b) and a polarimetric decomposition (see Figure 2c). Additionally, based on the change detection, results from the spatial autocorrelation analysis and Gray-Level Co-occurrence Matrix (GLCM) were employed.
Polarimetric Decomposition. SAR polarimetric decomposition is an effective method to detect surface changes [32,57,58,59] (see Figure 2c). When a SAR image has multiple polarizations, a scatter matrix S (see Equation (2)) can be formed by combining , , , and polarization, describing the interaction between the SAR polarization signals and the surface.
The scatter matrix can be rearranged to form a covariance matrix and coherence matrix. Through the target decomposition (TD) [60], the coherence matrix is further transformed to several independent matrices to represent independent scattering mechanisms. As shown in Equation (3), T indicates the coherence matrix; and are the eigenvalue and eigenvector, respectively; and with form the matrices of single bounce, double bounce, and volume scattering.
Decomposed parameters such as eigenvalues are used to constitute entropy (H), alpha (), and anisotropy (A) parameters. They have been recognized as useful values to determine the state of surface objects or to classify land-cover types [32,58,59,61,62]. Considering the success, the entropy, alpha, and anisotropy values derived from polarimetric decomposition are utilized to perform landslide monitoring.
Spatial Autocorrelation. In our workflow, spatial autocorrelation was used to define spatial cluster locations of specific attributes within a spatial range. Popular indicators include Geary’s C [63], Getis-Ord Gi [64], and Moran’s I [65], which are widely used to identify clusters, though with a different focus on the regional effect. As areas where landslides occur are displayed as clusters in SAR amplitude images, spatial autocorrelation is a feasible approach to extract location of landslides [23]. Additionally, [66] applied Moran’s I to identify clustered permanent scattering (PS) points and then distinguish various landslide activities. Accordingly, in this study, spatial autocorrelation was applied on the LR index images to extract spatial clusters of intensity change, where were the candidates of landslides.
Texture Indicator. Through the Gray-Level Co-occurrence Matrix (GLCM) processing, texture index, including entropy, homogeneity, contrast, and dissimilarity, can be extracted [54]. The quantified texture information can then be used as indicators to identify surface changes. It has been shown that landslide detection using GLCM is indeed a feasible approach [67,68]. Based on such successful cases, this study extracted texture indicators from LR index images and calculated the values of the four texture indicators over the sample areas.
3.2.2. Image Segmentation and Object Classification
The resulting image was suitable of highlighting areas with significant changes in intensity, and image products were used as input data for image segmentation. First, a preliminary segmentation was carried out through Multiresolution Segmentation (MRS) to obtain objects in the LR index image. As successfully demonstrated in other work, both spectral and shape heterogeneity were introduced to improve the performance of image segmentation [53,69]. Subsequently, based on the MRS processed image, Spectral Difference Segmentation (SDS) was applied to combine objects with similar spectral values to improve segmentation performance [70]. When the difference between the band spectral values of adjacent objects was lower than the set threshold, the objects were merged and final segmentation was accomplished.
After image segmentation, the extracted objects needed to be classified into areas showing landslides and areas devoid of landslides. Supervised classification methods, including Nearest Neighbor (NN), Support Vector Machine (SVM) and Random Forest (RF), employing the commercial data classification eCognition, were applied in this study to assess performance.
Moreover, object features, including two statistical indicators, three polarimetric decomposition indicators, three spatial autocorrelation indicators, and two texture indicators (contrast and dissimilarity), that have been proven to have classification capability were used as general classification criteria.
Finally, in order to assess change detection results, polygons indicating positive landslide detections were transformed to a geographic coordinate system and compared against reviewed landslide inventory data.
3.3. Study Area
Taiwan’s high-relief mountain ranges and tectonic activity, along with a pronounced influence by seasonal weather extremes, have been causing not only a large number of landslides but also a large range of different mass-wasting phenomena [71,72,73,74,75]. For our study, we selected a landslide area that is large enough to be detected by medium-resolution satellite imaging sensors and that is known to show high-frequency dynamics related to typhoons and earthquakes. Among all options, we chose to test our approach in the Putanpunas stream catchment area, which is located in the Kaohsiung county of southern Taiwan. Its current shape and extent were largely defined through the Morakot typhoon event of 2009 (see Figure 1). The high dynamics in the region also prevent vegetation from growing to a significant extent so that optical observations can be used for the main stream area as visual aid. For the larger catchment area, however, visual inspection is only possible to a minor degree due to the vegetation overprint.
The larger Putanpunas stream area (see Figure 1) stands out due to its large size of about 6.9 km, its known dynamics, and its sensitivity to typhoon events, which happen to bring the highest amounts of typhoon-induced rainfall of up to 4000 mm to Taiwan [76,77,78,79]. It also stands out in its potential impact on surrounding townships and villages due to (a) mass wasting and the associated disruption of services and infrastructure, such as road blocks, or due to (b) flooding or flood erosion caused by blocking water flow from the main Lao-Noan river to which the Putanpunas stream contributes. Except for local dwellings and private farms, there seems to be limited risk to surrounding townships to be affected by substantial mass wasting processes directly, however, those secondary effects could cause considerable hazards, which puts this landslide region on the list of local observation activity.
The Putanpunas stream is centered at about 23.22N and 120.76E and is located in the northern mountainous region of Kaosiung County. The local relief ranges from approximately 2140 m upstream to 600 m downstream. The stream cuts perpendicularly into the NE–SW oriented mountain ranges and slopes gently towards the SE (see Figure 1). The downstream area at the junction between the Putanpunas stream and the Lao-Noan river which drains towards the SW is characterized by two marginal terrace complexes—the Ryukyu Terrace in the South and the Shimizu Terrace in the North [76,77]. The terraces are cut by the Putanpunas stream, which develops an alluvial fan that extends into Lao-Noan riverbed where it is eroded with material being redeposited during heavy rainfall events.
Geologically, the Putanpunas stream and landslide area are composed primarily of sediments and lower-degree metasediments, ranging from sandstones upstream (Pliocene Tangenshan Sandstone), sandstones and shales (Miocene Changchihkeng Formation), and slates (Chaochow Formation) downstream. To a larger extent, the Changchihkeng Formation is delineated by the Gaozhong Fault located upstream, and the Tulungwan Fault downstream [76,80]. Both faults are oriented subparallel to the orientation of the mountain range. Due to the varying lithology and local relief, a range of different landslide types form in the catchment area that all contribute to the larger Putanpunas landslide assembly [71,76].
Mechanically, the Putanpunas-stream landslide is a deep-seated gravitational slope deformation embedded into the rock slope [76]. According to investigations by [76], the landslide area has been formed as an interplay between mass-wasting processes caused by translational slides on cataclinal slopes and predominantly rotational slides on anaclinal slopes [76].
As a target date, the typhoon Morakot event in August 2009 was selected due to its impact on the landscape. During that event, a major landslide was triggered and the landslide area has been constantly reactivated ever since.
4. Results and Discussion
In order to introduce the processing workflow and to demonstrate the feasibility of the proposed method, two C-band Envisat Advanced SAR (ASAR) images acquired before and after the typhoon Morakot over the Putanpunas river catchment were processed according to the workflow described above (Figure 2). The results were verified using the archived landslide inventory database to prove the reliability of this approach (see Table 1). The interplay between topography and incident angles of acquired SAR images caused topographic effects, i.e., geometric distortion of SAR images. Based on the experiment conducted in this study, the topography-corrected results were still geometrically distorted and even more pronounced in some areas, which matches the findings observed by [44].
The SAR invisible-masking method could remove the area of geometric distortion, but it largely reduced the area with genuine intensity change (Figure 3). Due to the difficulty of addressing the topographic effect on the one hand, and due to the fact that intensity variation characteristics were completely reserved in the slant-range radar image on the other (Figure 4 and Figure 5), it must be noted that we performed intensity change detection based on slant-range images.
The two ASAR images were used to generate the LR index image covering the larger Putanpunas stream catchment area (Figure 6). Blue and orange clusters appearing in the image represent areas with significant intensity change, which are completely highlighted and considered as landslide areas. We collected and visually inspected optical images acquired before and after the typhoon event over the four sites in order to confirm that they qualify as landslide areas characterized by clusters of significant intensity change, with the aim to identify those clusters in an LR index image through a semiautomatic processing approach.
In order to select the characteristics of each object in the image that represents surface changes caused by a disaster event, this study selected 18 landslide areas and 15 nonlandslide areas before and after the occurrence of typhoon Morakot as test areas (Figure 7). Along with statistical indicators based on the LR index image, three categories of indicators were tested in order to assess suitability to distinguish between areas with landslide and areas without landslide occurrences. The indicator categories are (1) polarimetric decomposition indicators, (2) spatial clustering indicators, and (3) texture indicators.
In order to assess results quantitatively, we derive statistical indicators. These indicators include the standard deviation and skewness calculated from the pixel intensity changes in the LR index image. The standard deviation of the intensity change values of the pixels in landslide areas is larger (see Table 2), showing that the landslide area shows a different signature than areas devoid of landslides. Skewness revealed the same trend. Basically, the two statistical indicators have different numerical distributions in landslide areas and in areas without landslides, which make them potentially useful for distinguishing landslide areas.
For landslide extraction and subsequent segmentation, we furthermore calculated polarimetric decomposition indicators, including entropy (P, polarimetric entropy), alpha, and anisotropy, for the selected sample areas. Based on the values listed in Table 2 and Figure 8, it is seen that the three indicators can be used to assess and distinguish landslide areas from areas devoid of landslides. However, the three indicators are limited to the identification of the boundary of landslide areas (cf. Figure 8). Therefore, the polarimetric decomposition indicators were introduced to detect object features in the OBIA procedure.
We calculated values for spatial autocorrelation indicators that operate on a local level (Geary’s C), on a global level (Moran’s I), and on cluster effects (Getis-Ord Gi) in order to extract information about spatial clustering effects. As seen in Table 2, the values for landslide areas are clearly distinguishable from other areas. The spatial distributions of the three indicators are shown in Figure 9. The bright areas of the Moran’s I autocorrelation analysis (Figure 9c) correspond to areas with significant intensity changes. Although it is less intuitive to detect clusters in the resulting image of Geary’s C analysis (Figure 9d), it is feasible for illustrating boundaries of the cluster pixels. Based on these observations, the three spatial autocorrelation indicators were employed as object feature identification indicators. More importantly, it needs to be noted that the cold and hot areas shown in the Gi result (Figure 9b) are clearly more pronounced than in the original LR image (Figure 9a), which qualifies the result for being used as an input image for segmentation in the next stage. The visual impression is confirmed by the quantitative results, as seen in Table 2.
The results of the texture index extraction are shown in Table 2 and Figure 9e–h. Index ranges vary considerably over areas with landslides and areas devoid of landslides. In contrast to (texture) entropy (T) (Figure 9f) and homogeneity (Figure 9h), we noted that contrast (Figure 9g) and dissimilarity (Figure 9e) indices are appropriate indicators to distinguish landslide and nonlandslide areas. Moreover, in Figure 9a, it is shown that areas with significant changes in intensity have a high contrast and dissimilarity. However, texture features are not observed in the homogeneity and entropy (T) images. Therefore, in this study, contrast and dissimilarity were selected as object features, while homogeneity and entropy (T) with less classification capability were discarded.
Based on the approaches outlined above, it was found that statistical indicators, polarimetric decomposition indicators, spatial autocorrelation indicators, and texture indicators, excluding homogeneity and entropy, were of great potential to facilitate the identification of landslides. We therefore utilized these indicators as features for subsequent object-based image classification.
Due to the large-scale variations of landslides, it is difficult to determine their appearance and magnitude within LR index images. To address this issue, the strategy used in this work is to produce a large number of small image objects at the preliminary segmentation stage. By doing so, small landslides are not ignored while large-area landslides might be segmented into small neighboring objects. In the latter cases, small objects can be merged into one single object according to the spatial proximity and features of the small objects. We implemented the segmentation strategy on the Gi image, as discussed above (Figure 9b).
The preliminary segmented image after MRS processing and the modified result after SDS are shown in Figure 10. It is observed that most of the clusters were successfully recognized as objects.
For object classification, supervised classification methods, NN, SVM with linear kernel, SVM with Radial Basis Function (RBF) kernel, and RF were applied in this study to assess the performance. The classification results are shown in Figure 11. Upon visual comparison, it is found that SVM with RBF kernel extracted fewer potential landslide sites among the four results, while the Random Forest is superior to other methods for classifying potential landslide areas. Together with the advantages of light computation, capability to determine variable importance, and high classification accuracy [81,82,83,84], Random Forest was therefore applied as the image classifier.
In order to assess the change detection results, we transformed the detected landslide polygons to a geographic coordinate system and compared them against the certified landslide inventory data. The superimposed map is shown in Figure 12. It is found that the extracted potential landslide locations correspond to river courses as well as actual landslides, especially as they correspond well with large-scale landslides recorded in the inventory, thus indicating that the proposed method was able to effectively detect large-area landslides.
In order to assess the results quantitatively further, we generated a buffer zone for each detected landslide object and then calculated (1) the area of intersection between the buffered objects and the actual landslide site based on the inventory data, as well as (2) the number of landslides where both intersected. As a result, the area of intersection between buffered objects and the actual landslide area accounted for 59.43% of the latter, and the number of buffered objects where both intersected accounted for 56.56% of the total number of landslides. Overall, the detection accuracy rate is about 60%.
For small landslides that could not be detected, i.e., false negatives, it is conceivable that this is mainly caused by the limited resolution of SAR images leading to an under-representation of landslides. This is a problem that cannot be overcome unless higher-resolution data are available. On the other hand, many detected objects are located within gullies and within the riverbed where sediment redeposition occurs frequently. As locations in rivers and streams are not recorded in the landslide inventory data, some detected areas were in fact not misjudged and should not be considered as false positive objects. The detection accuracies provided above are therefore considered to represent conservative numbers.
5. Conclusions and Outlook
The aim of this study was to demonstrate the feasibility of establishing a detection and monitoring approach based on radar-intensity changes in the slant-range coordinate system, in order to find an efficient solution for data processing and analysis as soon new data arrive.
While studies are commonly conducted using ground coordinates, and image analyses are often based on pixel units, this study employs slant-range coordinates and makes use of object-based image analysis (OBIA) to identify landslide locations and their development. Although a number of studies on landslide detection use slant-range information, the relationship between intensity change and landslide occurrences has only been explored using manual identification thus far. In this study, however, OBIA was introduced for slant-range images to systematically and semiautomatically detect landslides in image pairs.
Under the condition that the intensity change information is complete and the classification method is effective, the performance of extraction of landslides is considered to be satisfactory. In addition, for previous studies that used image pixels as the unit, multiple image filtering was required in order to reduce the problem of SAR image speckle which had the potential to break object detection if not removed. During the filtering process, however, the originally recorded information was altered, which again had a negative impact on the image-detection quality. Through the OBIA applied in this study, we avoided the use of filtering and at the same time reduced the influence of speckle noise, which kept the original information unaltered and reduced the algorithm complexity.
The results demonstrated that most of the landslide events could be detected when compared to a visual inspection and when compared to established inventories, the method could therefore be considered as a robust detection tool. In addition, by comparison with optical images, it is seen that this method can also detect accumulation and (re-)distribution of sediment bodies in the riverbed, which could potentially be used for assessing postlandslide hazards. The problem of a comparably weaker detection of small-area landslide is expected to be solved when high-resolution SAR images become available in the future.
Based on the above tests, it can be confirmed that the method proposed in this paper can detect occurrences of surface variations such as landslides or sediment movements by using SAR intensity images.
To compensate the current detection accuracy, one solution would be to continuously produce time-series SAR intensity change images and establish a long-term monitoring scheme. In a future step, through the OBIA strategy described in this work, time-series landslide objects could then potentially be extracted and tracked. With our approach, a change detection over large areas could potentially be employed as a reference for an early warning system, indicating even subtle slope changes due to the performance of SAR sensors. The nature of this approach would allow for long-term monitoring using satellite image time series (SITS) as they can be analyzed in an automated way.
Author Contributions
Conceptualization: S.-Y.L., C.-W.L.; formal analysis: S.-Y.L., C.-W.L.; investigation: S.-Y.L., C.-W.L.; methodology: S.-Y.L., C.-W.L.; supervision: S.-Y.L.; validation: C.-W.L.; visualization: C.-W.L., S.v.G.; writing—original draft: S.-Y.L., C.-W.L.; writing—review and editing: S.-Y.L., S.v.G. All authors have read and agreed to the published version of the manuscript.
Funding
The authors acknowledge support by the Ministry of Science and Technology (MOST) in Taiwan. This research received partial funding for SYL under grant number MOST 109-2625-M-004-002, and for SVG under grant number MOST 109-2410-H-004-193.
Data Availability Statement
Not applicable.
Acknowledgments
The authors acknowledge comments from anonymous reviewers who helped to improve clarity and presentation of the original manuscript.
Conflicts of Interest
The authors declare no conflict of interest.
References
- Juan, V.; Lo, H.; Chen, C.H. Geotectonics of Taiwan—An Overview. In Geodynamics of the Western Pacific Indonesian Region; Hilde, T.W.C., Uyeda, S., Eds.; American Geophysical Union: Washington, DC, USA, 1983; pp. 379–386. [Google Scholar]
- Chingchang, B.; Shyu, C.T.; Chen, J.C.; Boggs, S. Taiwan: Geology, Geophysics, and Marine Sediments. In The Ocean Basins and Margins; Nairn, A.E.M., Stehli, F.G., Uyeda, S., Eds.; Springer: Boston, MA, USA, 1985. [Google Scholar] [CrossRef]
- Ho, T.S. A Synthesis of the Geologic Evolution of Taiwan. Tectonophysics 1986, 125. [Google Scholar] [CrossRef]
- Byrne, T.; Liu, C. Introduction to the Geology and Geophysics of Taiwan. In Geology and Geophysics of an Arc-Continent Collision, Taiwan; The Geological Society of America: Boulder, CO, USA, 2002; Volume 358. [Google Scholar] [CrossRef]
- Malavieille, J.; Lallemand, S.E.; Dominguez, S.; Deschamps, A.; Lu, C.Y.; Liu, C.S.; Schnurle, P. The ACT (Active Collision in Taiwan) Scientific Crew. Arccontinent collision in Taiwan: New marine observations and tectonic evolution. In Geology and Geophysics of an Arc-Continent collision, Taiwan; Byrne, T.B., Liu, C.S., Eds.; Geological Society of America: Boulder, CO, USA, 2002; Volume 358, pp. 187–211. [Google Scholar] [CrossRef] [Green Version]
- Chen, S.C.; Huang, B.T. Non-structural mitigation programs for sediment-related disasters after the Chichi Earthquake in Taiwan. J. Mt. Sci. 2010, 7, 291–300. [Google Scholar] [CrossRef] [Green Version]
- Central Weather Bureau. FAQ for Typhoon. 2020. Available online: http://www.cwb.gov.tw/eng (accessed on 1 November 2020).
- Aleotti, P.; Chowdhury, R. Landslide hazard assessment: Summary review and new perspectives. Bull. Eng. Geol. Environ. 1999, 58, 21–44. [Google Scholar] [CrossRef]
- Ho, C.S. An Introduction to the Geology of Taiwan: Explanatory Text of the Geologic Map of Taiwan; Central Geological Survey, Ministry of Economic Affairs: Taipei City, Taiwan, 1988. [Google Scholar]
- Nikolakopoulos, K.; Kavoura, K.; Depountis, N.; Kyriou, A.; Argyropoulos, N.; Koukouvelas, I.; Sabatakakis, N. Preliminary results from active landslide monitoring using multidisciplinary surveys. Eur. J. Remote Sens. 2017, 50, 280–299. [Google Scholar] [CrossRef] [Green Version]
- Wu, C.C. Typhoon Morakot: Key Findings from the Journal for Improving Prediction of Extreme Rains at Landfall. Bull. Am. Meteor. Soc. 2013, 94, 155–160. [Google Scholar] [CrossRef]
- Lie, H.; Hsieh, L.S.; Chen, L.C.; Lin, L.Y.; Li, W.S. Disaster investigation and analysis of Typhoon Morakot. J. Chin. Inst. Eng. 2014, 37, 558–569. [Google Scholar] [CrossRef]
- Xie, H.; Zhong, Z.X.; Huang, J.Y. Application of NDVI and average value adjustment image segmentation method for the extraction of collapsed bare land using multi-level Formosat-2 images in the Liugui forest area (in Chinese). Taiwan For. Sci. 2017, 32, 203–222. [Google Scholar]
- Bell, F.G. Geological Hazards: Their Assessment, Avoidance and Mitigation; CRC Press: Boca Raton, FL, USA, 2003. [Google Scholar]
- Barbarella, M.; Fiani, M. Monitoring of large landslides by Terrestrial Laser Scanning techniques: Field data collection and processing. Eur. J. Remote Sens. 2013, 46, 126–151. [Google Scholar] [CrossRef]
- Corominas, J.; Moya, J.; Lloret, A.; Gili, J.; Angeli, M.G.; Pasuto, A.; Silvano, S. Measurement of landslide displacements using a wire extensometer. Eng. Geol. 2000, 55, 149–166. [Google Scholar] [CrossRef]
- Zhao, C.; Lu, Z. Remote Sensing of Landslides—A Review. Remote Sens. 2018, 10, 279. [Google Scholar] [CrossRef] [Green Version]
- Plank, S.; Hölbling, D.; Eisank, C.; Friedl, B.; Martinis, S.; Twele, A. Comparing object-based landslide detection methods based on polarimetric SAR and optical satellite imagery—A case study in Taiwan. In Proceedings of the 7th International Workshop on Science and Applications of SAR Polarimetry and Polarimetric Interferometry, Frascati, Italy, 26–30 January 2015. [Google Scholar]
- Wang, C.; Mao, X.; Wang, Q. Landslide displacement monitoring by a fully polarimetric SAR offset tracking method. Remote Sens. 2016, 8, 624. [Google Scholar] [CrossRef] [Green Version]
- Kang, Y.; Zhao, C.; Zhang, Q.; Lu, Z.; Li, B. Application of InSAR Techniques to an Analysis of the Guanling Landslide. Remote Sens. 2017, 9, 1046. [Google Scholar] [CrossRef] [Green Version]
- Schlögel, R.; Thiebes, B.; Mulas, M.; Cuozzo, G.; Notarnicola, C.; Schneiderbauer, S.; Crespi, M.; Mazzoni, A.; Mair, V.; Corsini, A. Multi-Temporal X-Band Radar Interferometry Using Corner Reflectors: Application and Validation at the Corvara Landslide (Dolomites, Italy). Remote Sens. 2017, 9, 739. [Google Scholar] [CrossRef] [Green Version]
- Du, Y.; Xu, Q.; Zhang, L.; Feng, G.; Li, Z.; Chen, R.; Lin, C. Recent landslide movement in Tsaoling, Taiwan tracked by TerraSAR-X/TanDEM-X DEM time series. Remote Sens. 2017, 9, 353. [Google Scholar] [CrossRef] [Green Version]
- Mondini, A. Measures of Spatial Autocorrelation Changes in Multitemporal SAR Images for Event Landslides Detection. Remote Sens. 2017, 9, 554. [Google Scholar] [CrossRef] [Green Version]
- Bru, G.; González, P.J.; Mateos, R.M.; Roldán, F.; Herrera, G.; Béjar-Pizarro, M.; Fernández, J.A. Monitoring of Landslide and Subsidence Activity: A Case of Urban Damage in Arcos de la Frontera. Remote Sens. 2017, 9, 787. [Google Scholar] [CrossRef] [Green Version]
- Bardi, F.; Raspini, F.; Frodella, W.; Lombardi, L.; Nocentini, M.; Gigli, G.; Morelli, S.; Corsini, A.; Casagli, N. Monitoring the Rapid-Moving Reactivation of Earth Flows by Means of GB-InSAR: The April 2013 Capriglio Landslide (Northern Appennines, Italy). Remote Sens. 2017, 9, 165. [Google Scholar] [CrossRef] [Green Version]
- Konishi, T.; Suga, Y. Landslide detection using COSMO-SkyMed images: A case study of a landslide event on Kii Peninsula, Japan. Eur. J. Remote Sens. 2018, 51, 205–221. [Google Scholar] [CrossRef] [Green Version]
- Lin, K.F.; Perissin, D. Hybrid analysis for SAR change detection based on time series data. In Proceedings of the IEEE International Geoscience and Remote Sensing Symposium (IGARSS), Fort Worth, TX, USA, 23–28 July 2017; pp. 1079–1082. [Google Scholar] [CrossRef]
- Chen, G.; Hay, G.J.; Carvalho, L.M.; Wulder, M.A. Object-based change detection. Int. J. Remote Sens. 2012, 33, 4434–4457. [Google Scholar] [CrossRef]
- Hussain, M.; Chen, D.; Cheng, A.; Wei, H.; Stanley, D. Change detection from remotely sensed images: From pixel-based to object-based approaches. ISPRS J. Photogramm. Remote Sens. 2013, 80, 91–106. [Google Scholar] [CrossRef]
- Lu, D.; Mausel, P.; Brondizio, E.; Moran, E. Change detection techniques. Int. J. Remote Sens. 2004, 25, 2365–2401. [Google Scholar] [CrossRef]
- Lunetta, R.S.; Johnson, D.M.; Lyon, J.G.; Crotwell, J. Impacts of imagery temporal frequency on land-cover change detection monitoring. Remote Sens. Environ. 2004, 89, 444–454. [Google Scholar] [CrossRef]
- Czuchlewski, K.R.; Weissel, J.K.; Kim, Y. Polarimetric synthetic aperture radar study of the Tsaoling landslide generated by the 1999 Chi-Chi earthquake, Taiwan. J. Geophys. Res. Earth Surf. 2003, 108. [Google Scholar] [CrossRef]
- Green, K.; Kempka, D.; Lackey, L. Using remote sensing to detect and monitor land-cover and land-use change. Photogramm. Eng. Remote Sens. 1994, 60, 331–337. [Google Scholar]
- Colesanti, C.; Wasowski, J. Investigating landslides with space-borne Synthetic Aperture Radar (SAR) interferometry. Eng. Geol. 2006, 88, 173–199. [Google Scholar] [CrossRef]
- Cascini, L.; Fornaro, G.; Peduto, D. Analysis at medium scale of low-resolution DInSAR data in slow-moving landslide-affected areas. ISPRS J. Photogramm. Remote Sens. 2009, 64, 598–611. [Google Scholar] [CrossRef]
- Cascini, L.; Fornaro, G.; Peduto, D. Advanced low-and full-resolution DInSAR map generation for slow-moving landslide analysis at different scales. Eng. Geol. 2010, 112, 29–42. [Google Scholar] [CrossRef]
- Bianchini, S.; Herrera, G.; Mateos, R.M.; Notti, D.; Garcia, I.; Mora, O.; Moretti, S. Landslide activity maps generation by means of persistent scatterer interferometry. Remote Sens. 2013, 5, 6198–6222. [Google Scholar] [CrossRef] [Green Version]
- Nico, G.; Oliveira, S.; Catalão, J.; Zêzere, J. Generation of Persistent Scatterers in Non-Urban Areas: The Role of Microwave Scattering Parameters. Geosciences 2018, 8, 269. [Google Scholar] [CrossRef] [Green Version]
- Notti, D.; Herrera, G.; Bianchini, S.; Meisina, C.; García-Davalillo, J.C.; Zucca, F. A methodology for improving landslide PSI data analysis. Int. J. Remote Sens. 2014, 35, 2186–2221. [Google Scholar] [CrossRef]
- García-Davalillo, J.C.; Herrera, G.; Notti, D.; Strozzi, T.; Álvarez Fernández, I. DInSAR analysis of ALOS PALSAR images for the assessment of very slow landslides: The Tena Valley case study. Landslides 2014, 11, 225–246. [Google Scholar] [CrossRef]
- Bazi, Y.; Bruzzone, L.; Melgani, F. An unsupervised approach based on the generalized Gaussian model to automatic change detection in multitemporal SAR images. IEEE Trans. Geosci. Remote Sens. 2005, 43, 874–887. [Google Scholar] [CrossRef] [Green Version]
- Bovolo, F.; Bruzzone, L. A detail-preserving scale-driven approach to change detection in multitemporal SAR images. IEEE Trans. Geosci. Remote Sens. 2005, 43, 2963–2972. [Google Scholar] [CrossRef]
- Hemasinghe, H.; Rangali, R.; Deshapriya, N.; Samarakoon, L. Landslide susceptibility mapping using logistic regression model (a case study in Badulla District, Sri Lanka). Procedia Eng. 2015, 212, 1046–1053. [Google Scholar] [CrossRef]
- Mondini, A.C.; Santangelo, M.; Rocchetti, M.; Rossetto, E.; Manconi, A.; Monserrat, O. Sentinel-1 SAR amplitude imagery for rapid landslide detection. Remote Sens. 2019, 11, 760. [Google Scholar] [CrossRef] [Green Version]
- Oliver, C.; Quegan, S. Understanding Synthetic Aperture Radar Images; SciTech Publishing: Chennai, India, 2004. [Google Scholar]
- Bru, G.; Escayo, J.; Fernández, J.; Mallorqui, J.; Iglesias, R.; Sansosti, E.; Morales, A. Suitability Assessment of X-Band Satellite SAR Data for Geotechnical Monitoring of Site Scale Slow Moving Landslides. Remote Sens. 2018, 10, 936. [Google Scholar] [CrossRef] [Green Version]
- Cigna, F.; Bateson, L.B.; Jordan, C.J.; Dashwood, C. Simulating SAR geometric distortions and predicting Persistent Scatterer densities for ERS-1/2 and ENVISAT C-band SAR and InSAR applications: Nationwide feasibility assessment to monitor the landmass of Great Britain with SAR imagery. Remote Sens. Environ. 2014, 152, 441–466. [Google Scholar] [CrossRef] [Green Version]
- Notti, D.; Meisina, C.; Zucca, F.; Colombo, A. Models to predict Persistent Scatterers data distribution and their capacity to register movement along the slope. In Proceedings of the Fringe 2011 Workshop, Frascati, Italy, 19–23 September 2011. [Google Scholar]
- Novellino, A.; Cigna, F.; Brahmi, M.; Sowter, A.; Bateson, L.; Marsh, S. Assessing the feasibility of a national InSAR ground deformation map of Great Britain with Sentinel-1. Geosciences 2017, 7, 19. [Google Scholar] [CrossRef] [Green Version]
- Rignot, E.J.; Van Zyl, J.J. Change detection techniques for ERS-1 SAR data. IEEE Trans. Geosci. Remote Sens. 1993, 31, 896–906. [Google Scholar] [CrossRef] [Green Version]
- Mansourpour, M.; Rajabi, M.; Blais, J. Effects and performance of speckle noise reduction filters on active radar and SAR images. In Proceedings of the International Society for Photogrammetry and Remote Sensing (ISPRS) Archives, Volume XXXVI-1/W41, Ankara, Turkey, 14–16 February 2006. [Google Scholar]
- Lu, P.; Stumpf, A.; Kerle, N.; Casagli, N. Object-oriented change detection for landslide rapid mapping. IEEE Geosci. Remote Sens. Lett. 2011, 8, 701–705. [Google Scholar] [CrossRef]
- Friedl, B.; Hölbling, D. Using SAR Interferograms and Coherence Images for Object-Based Delineation of Unstable Slopes. In Proceedings of the FRINGE 2015 Workshop: Advances in the Science and Applications of SAR Interferometry and Sentinel-1 InSAR Workshop, Frascati, Italy, 23–27 March 2015; European Space Agency: Frascati, Italy, 2015. [Google Scholar]
- Kunwar, S. Segmentation and Classification of Nepal Earthquake Induced Landslides Using SENTINEL-1 Product. Int. Arch. Photogramm. Remote Sens. Spat. Inf. Sci. 2016, 41, 769. [Google Scholar] [CrossRef]
- Esposito, G.; Mondini, A.C.; Marchesini, I.; Reichenbach, P.; Salvati, P.; Rossi, M. An example of SAR-derived image segmentation for landslides detection. In Proceedings of the Open Source Geospatial Research and Education Symposium (OGRS2018), Lugano, Switzerland, 9–11 October 2018. [Google Scholar]
- Martha, T.R.; Kerle, N.; van Westen, C.J.; Jetten, V.; Kumar, K.V. Segment optimization and data-driven thresholding for knowledge-based landslide detection by object-based image analysis. IEEE Trans. Geosci. Remote Sens. 2011, 49, 4928–4943. [Google Scholar] [CrossRef]
- Cloude, S.R.; Pottier, E. A review of target decomposition theorems in radar polarimetry. IEEE Trans. Geosci. Remote Sens. 1996, 34, 498–518. [Google Scholar] [CrossRef]
- Ferro-Famil, L.; Pottier, E.; Lee, J. Unsupervised classification of natural scenes from polarimetric interferometric SAR data. Front. Remote. Sens. Inf. Process. 2003, 105–137. [Google Scholar] [CrossRef]
- Yonezawa, C.; Watanabe, M.; Saito, G. Polarimetric decomposition analysis of ALOS PALSAR observation data before and after a landslide event. Remote Sens. 2012, 4, 2314–2328. [Google Scholar] [CrossRef] [Green Version]
- Huynen, J.R. Phenomenological Theory of Radar Targets. Ph.D. Thesis, Electrical Engineering, Mathematics and Computer Science, TU Delft, Delft, The Netherlands, 1970. [Google Scholar]
- Cloude, S.R.; Pottier, E. An entropy based classification scheme for land applications of polarimetric SAR. IEEE Trans. Geosci. Remote Sens. 1997, 35, 68–78. [Google Scholar] [CrossRef]
- Lee, J.S.; Grunes, M.R.; Ainsworth, T.L.; Du, L.J.; Schuler, D.L.; Cloude, S.R. Unsupervised classification using polarimetric decomposition and the complex Wishart classifier. IEEE Trans. Geosci. Remote Sens. 1999, 37, 2249–2258. [Google Scholar] [CrossRef]
- Geary, R.C. The contiguity ratio and statistical mapping. Inc. Stat. 1954, 5, 115–146. [Google Scholar] [CrossRef]
- Getis, A.; Ord, J.K. The Analysis of Spatial Association by Use of Distance Statistics. Geogr. Anal. 1992, 24, 189–207. [Google Scholar] [CrossRef]
- Anselin, L. Local Indicators of Spatial Association—LISA. Geogr. Anal. 1995, 27, 93–115. [Google Scholar] [CrossRef]
- Kalia, A. Classification of Landslide Activity on a Regional Scale Using Persistent Scatterer Interferometry at the Moselle Valley (Germany). Remote Sens. 2018, 10, 1880. [Google Scholar] [CrossRef] [Green Version]
- Mahrooghy, M.; Aanstoos, J.V.; Nobrega, R.A.; Hasan, K.; Prasad, S.; Younan, N.H. A machine learning framework for detecting landslides on earthen levees using spaceborne SAR imagery. IEEE J. Sel. Top. Appl. Earth Obs. Remote Sens. 2015, 8, 3791–3801. [Google Scholar] [CrossRef]
- Hölbling, D.; Friedl, B.; Dittrich, J.; Cigna, F.; Pedersen, G. Combined interpretation of optical and SAR data for landslide mapping. In Advances in Landslide Research, Proceedings of the 3rd Regional Symposium on Landslides the Adriatic-Balkan Region, Ljubljana, Slovenia, 11–13 October 2017; Geological Survey of Slovenia: Ljubljana, Slovenia, 2018; pp. 11–13. [Google Scholar]
- Dou, J.; Chang, K.T.; Chen, S.; Yunus, A.; Liu, J.K.; Xia, H.; Zhu, Z. Automatic case-based reasoning approach for landslide detection: integration of object-oriented image analysis and a genetic algorithm. Remote Sens. 2015, 7, 4318–4342. [Google Scholar] [CrossRef] [Green Version]
- Oruc, M.; Marangoz, A.; Buyuksalih, G. Comparison of pixel-based and object-oriented classification approaches using Landsat-7 ETM spectral bands. Int. Arch. Photogramm. Remote Sens. 2004, 35, 1118–1123. [Google Scholar]
- Lin, C.H.; Lin, M.L. Evolution of the large landslide induced by Typhoon Morakot: A case study in the Butangbunasi River, southern Taiwan using the discrete element method. Eng. Geol. 2015, 197, 172–187. [Google Scholar] [CrossRef]
- Yang, C.M.; Kang, K.H.; Yang, S.H.; Li, K.W.; Wang, H.J.; Lee, Y.T.; Lin, K.K.; Pan, Y.W.; Liao, J.J. Large paleo-rockslide induced by buckling failure at Jiasian in Southern Taiwan. Landslides 2020, 17, 1319–1335. [Google Scholar] [CrossRef]
- Chung, M.; Chen, C.H.; Lee, C.F.; Huang, W.K.; Tan, C.H. Failure Impact Assessment for Large-Scale Landslides Located Near Human Settlement: Case Study in Southern Taiwan. Sustainability 2018, 10, 1491. [Google Scholar] [CrossRef] [Green Version]
- Kuo, H.L.; Lin, G.W.; Chen, C.W.; Saito, H.; Lin, C.W.; Chen, H.; Chao, W.A. Evaluating critical rainfall conditions for large-scale landslides by detecting event times from seismic records. Nat. Hazards Earth Syst. Sci. 2018, 18, 2877–2891. [Google Scholar] [CrossRef] [Green Version]
- Weng, M.C.; Lin, M.L.; Lo, C.M.; Lin, H.H.; Lin, C.H.; Lu, J.H.; Tsai, S.J. Evaluating failure mechanisms of dip slope using a multiscale investigation and discrete element modelling. Eng. Geol. 2019, 263, 105303. [Google Scholar] [CrossRef]
- Lo, C.M. Evolution of deep-seated landslide at Putanpunas stream, Taiwan. Geomat. Nat. Hazards Risk 2017, 8, 1204–1224. [Google Scholar] [CrossRef] [Green Version]
- Lo, C.M.; Weng, M.C.; Lin, M.L.; Lee, S.M.; Lee, K.C. Landscape evolution characteristics of large-scale erosion and landslides at the Putanpunas Stream, Taiwan. Geomat. Nat. Hazards Risk 2018, 9, 175–195. [Google Scholar] [CrossRef]
- Giletycz, S.J.; Chang, C.P.; Huang, C.C. An assessment of tropical cyclones rainfall erosivity for Taiwan. Sci. Rep. 2019, 9, 21–38. [Google Scholar] [CrossRef] [Green Version]
- Hölbling, D.; Abad, L.; Dabiri, Z.; Prasicek, G.; Tsai, T.T.; Argentin, A.L. Mapping and Analyzing the Evolution of the Butangbunasi Landslide Using Landsat Time Series with Respect to Heavy Rainfall Events during Typhoons. Appl. Sci. 2020, 10, 630. [Google Scholar] [CrossRef] [Green Version]
- Giletycz, S.J.; Chang, C.P.; Huang, C.C. Geological Structure as a Crucial Factor Facilitating the Occurrence of Typhoon-Triggered Landslides: Case from Hsiaolin Village, 2009 Typhoon Morakot. West. Pac. Earth Sci. 2012, 12, 21–38. [Google Scholar]
- Rodriguez-Galiano, V.; Ghimire, B.; Rogan, J.; Chica-Olmo, M.; Rigol-Sanchez, J. An assessment of the effectiveness of a random forest classifier for land-cover classification. ISPRS J. Photogramm. Remote Sens. 2012, 67, 93–104. [Google Scholar] [CrossRef]
- Corcoran, J.; Knight, J.; Gallant, A. Influence of Multi-Source and Multi–Temporal Remotely Sensed and Ancillary Data on the Accuracy of Random Forest Classification of Wetlands in Northern Minnesota. Remote Sens. 2013, 5, 3212–3238. [Google Scholar] [CrossRef] [Green Version]
- Taalab, K.; Cheng, T.; Zhang, Y. Mapping landslide susceptibility and types using Random Forest. Big Earth Data 2018, 2, 159–178. [Google Scholar] [CrossRef]
- Shirvani, Z. A Holistic Analysis for Landslide Susceptibility Mapping Applying Geographic Object-Based Random Forest: A Comparison between Protected and Non-Protected Forests. Remote Sens. 2020, 12, 434–456. [Google Scholar] [CrossRef] [Green Version]
Figure 1.
Location of the larger Putanpunas stream area in the northern part of Kaohsiung City county in southern Taiwan.
Figure 1.
Location of the larger Putanpunas stream area in the northern part of Kaohsiung City county in southern Taiwan.

Figure 2.
Workflow for detecting land-cover change based on Synthetic Aperture Radar (SAR) intensity change for the identification of landslides.
Figure 2.
Workflow for detecting land-cover change based on Synthetic Aperture Radar (SAR) intensity change for the identification of landslides.

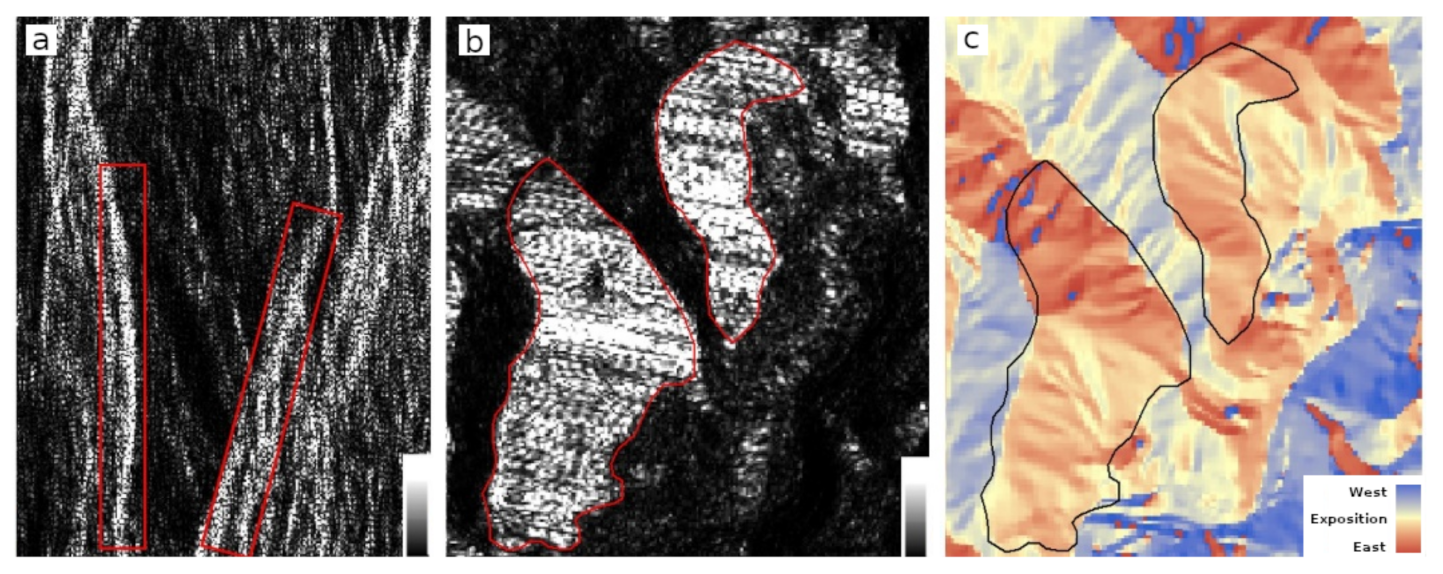
Figure 3.
SAR intensity images in slant-range (a) and in ground-range (b). The associated topographic aspect map is shown in (c). Two marked areas indicate identical slopes (red polygons in (a,b), black polygons in (c)). Based on the pattern shown on east-facing slopes in (b), it is clear that the foreshortening effect is not fully addressed, which may cause misjudgment in the following change detection.

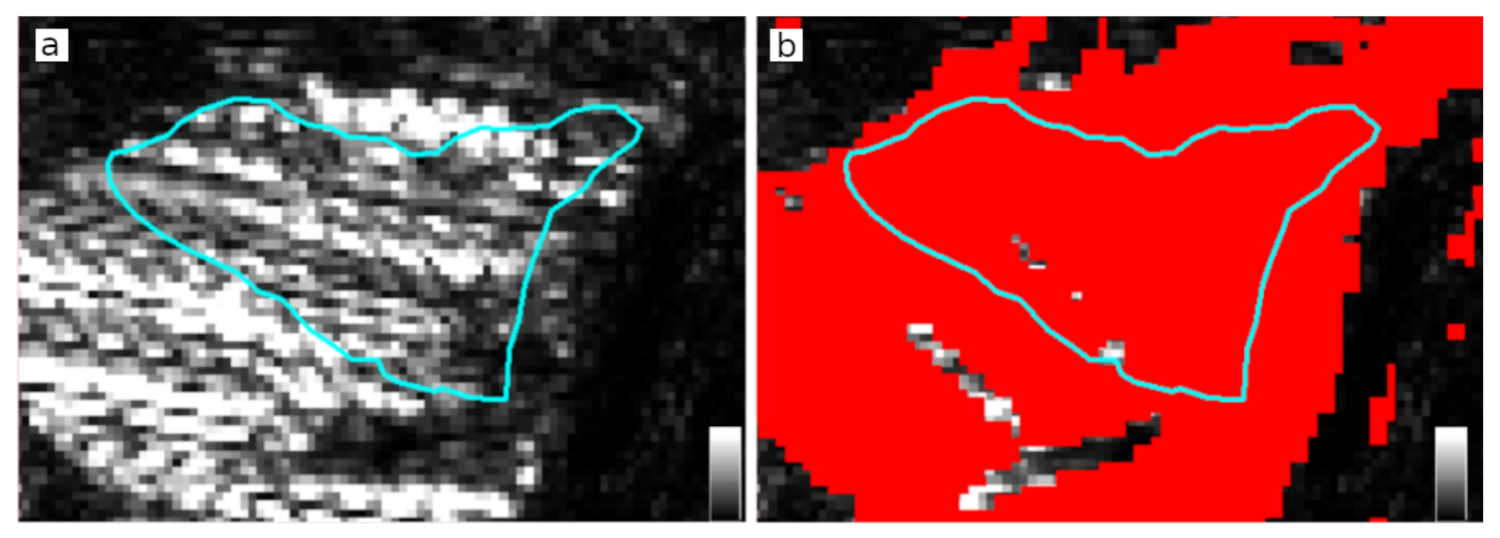
Figure 4.
Panels (a,b) show ground-range intensity images covering the same geographic extent. The blue polygon indicates a landslide area in (a), while the red pixels shown in (b) represent a masked area. It can be seen that although the intensity distortion pattern in (a) is masked out, the landslide seen on this slope cannot be detected (see also Figure 5).

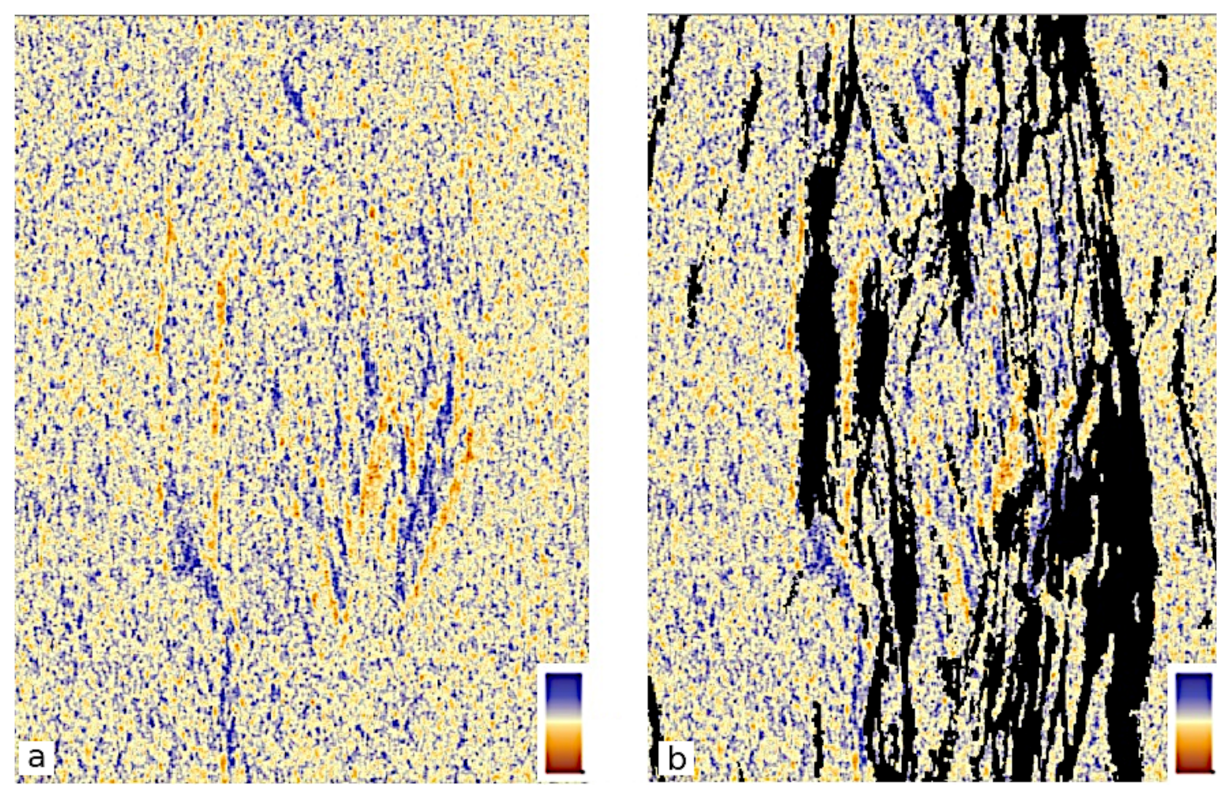
Figure 5.
Panels (a,b) are slant-range Log-Ratio (LR) index images covering the same area. Pixels shown in the blue area represent a location with reduced intensity, while pixels in orange indicate a location with increased intensity values. The invisible-masking method is performed in (b), in which black pixels represent areas characterized by topographic distortion. From the comparison of (a,b), it can be seen that intensity change features can be obtained in the image without invisible masking.

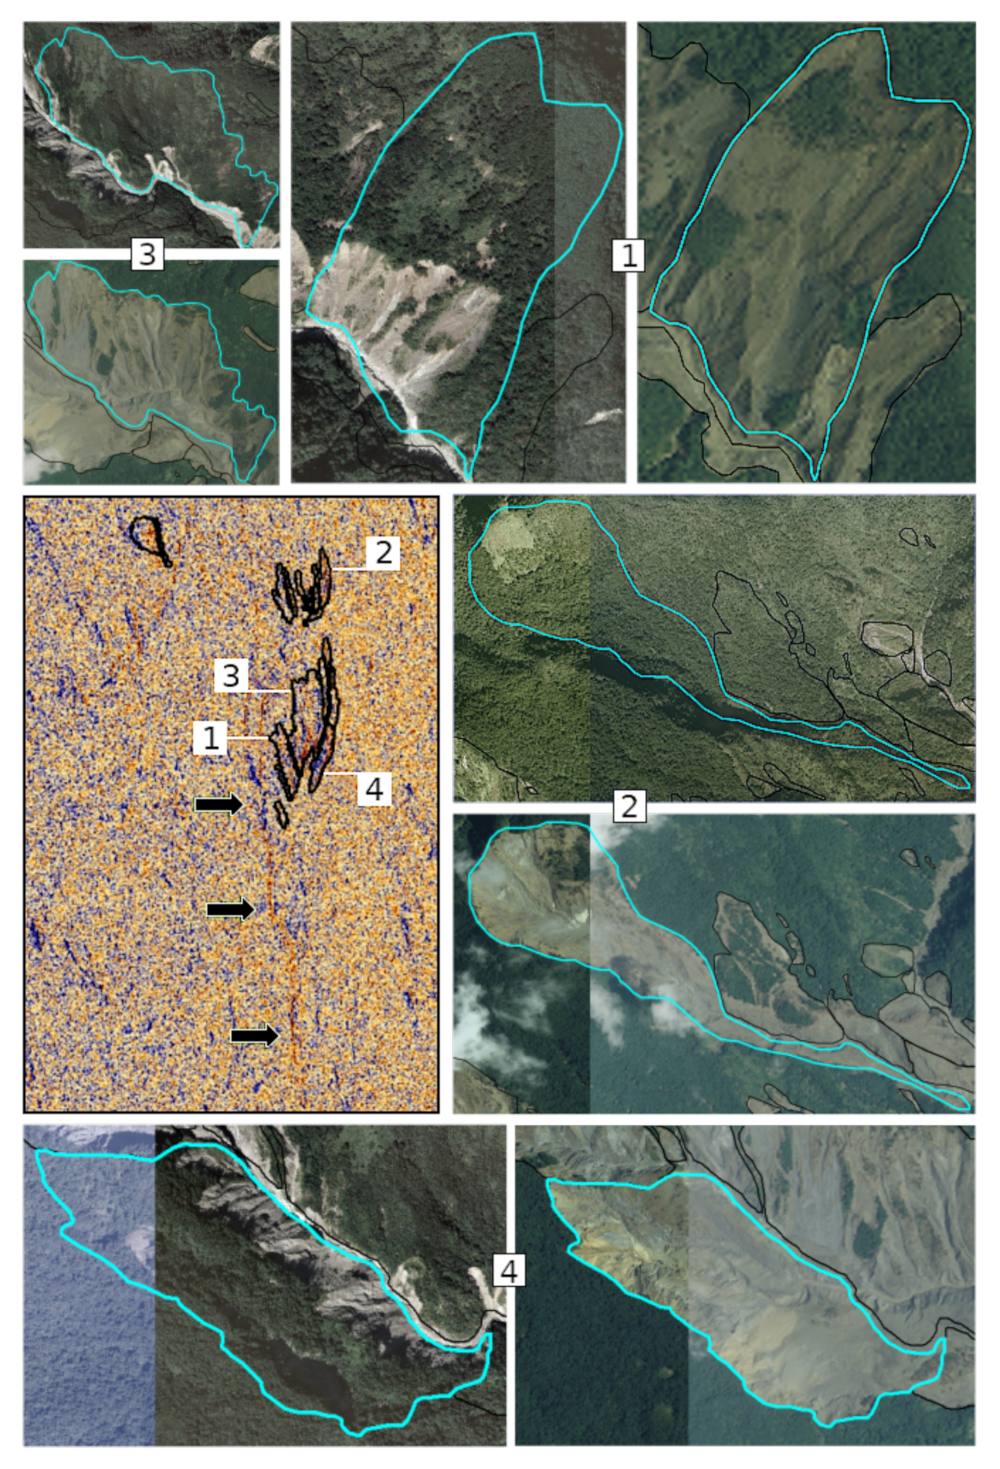
Figure 6.
The slant-range LR index image covering the larger Putanpunas river catchment, where areas outlined by thin black boundaries indicate historical landslide areas. The linear cluster indicated by black arrows refers to the Lao-Noan river. The optical images acquired before and after the typhoon over the four sites are indicated by labels (1–4), showing that landslides occurred after the typhoon event.

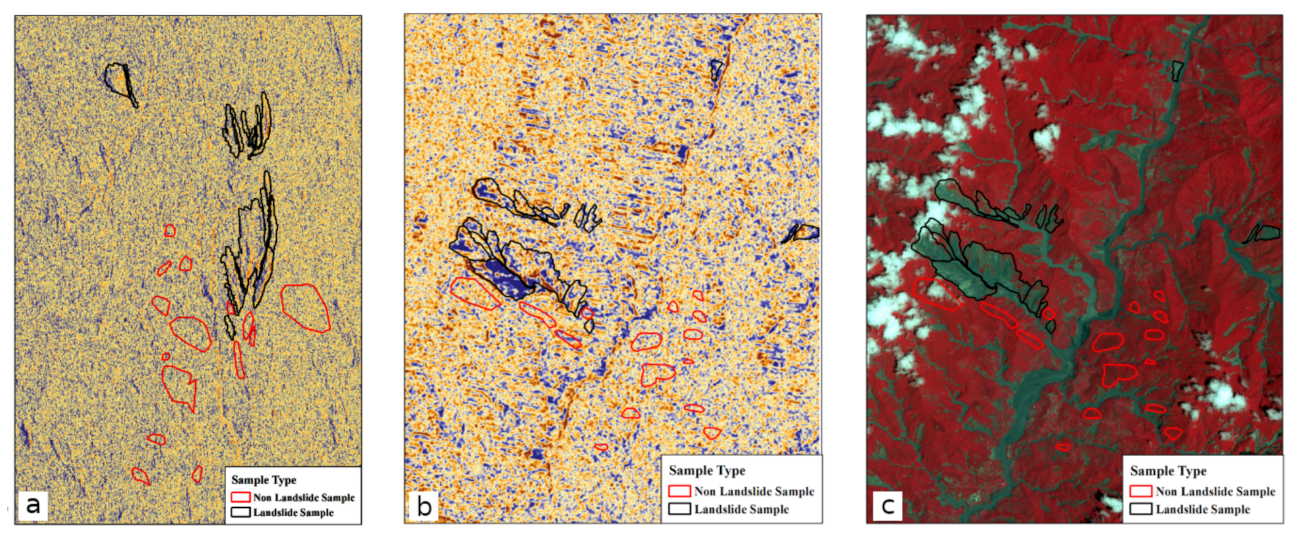
Figure 7.
LR index images with pixel sample areas for identifying a feasible index to distinguish objects that were collected from 18 landslide regions (black outlines) and 15 nonlandslide regions (red outlines). Base images are the LR index image in slant-range (a), LR index image in ground-range (b), and a SPOT-5 image acquired during the same period (c).

Figure 8.
Results after polarimetric decomposition; (a) entropy (P, polarimetric), (b) anisotropy, and (c) alpha image.
Figure 8.
Results after polarimetric decomposition; (a) entropy (P, polarimetric), (b) anisotropy, and (c) alpha image.

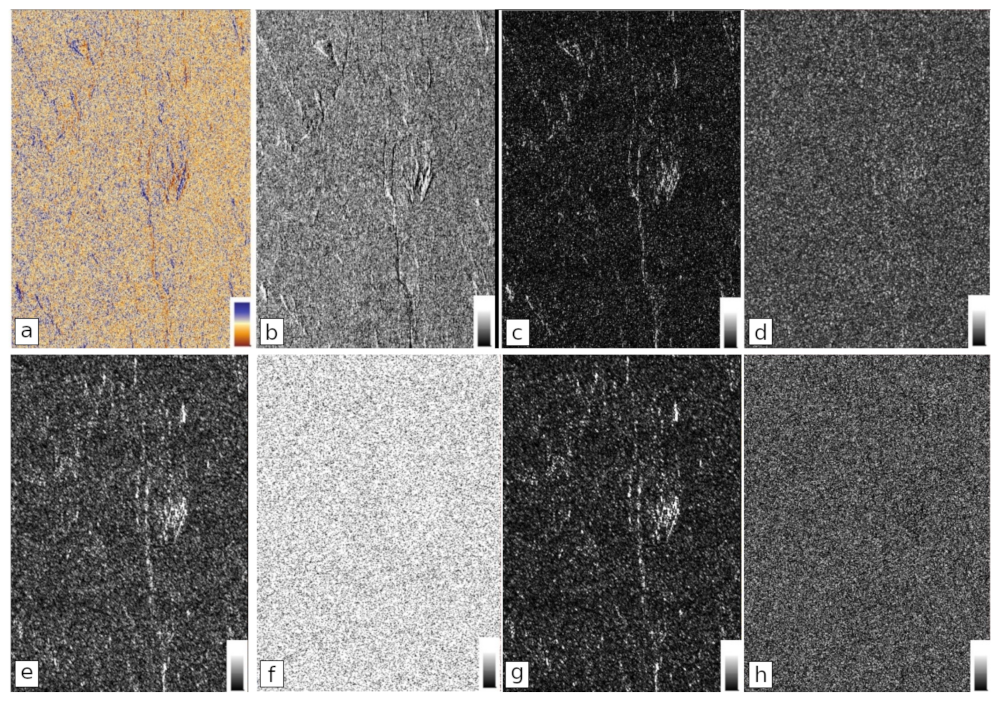
Figure 9.
Results from the calculation of autocorrelation and texture indices. (a) original ASAR LR index image, and the spatial autocorrelation images generated based on (b) Getis-Ord’s Gi, (c) Moran’s I, and (d) Geary’s C. Texture indices are shown in (e) dissimilarity, (f) entropy (T, texture), (g) contrast, and (h) homogeneity images extracted from the original ASAR LR index image.

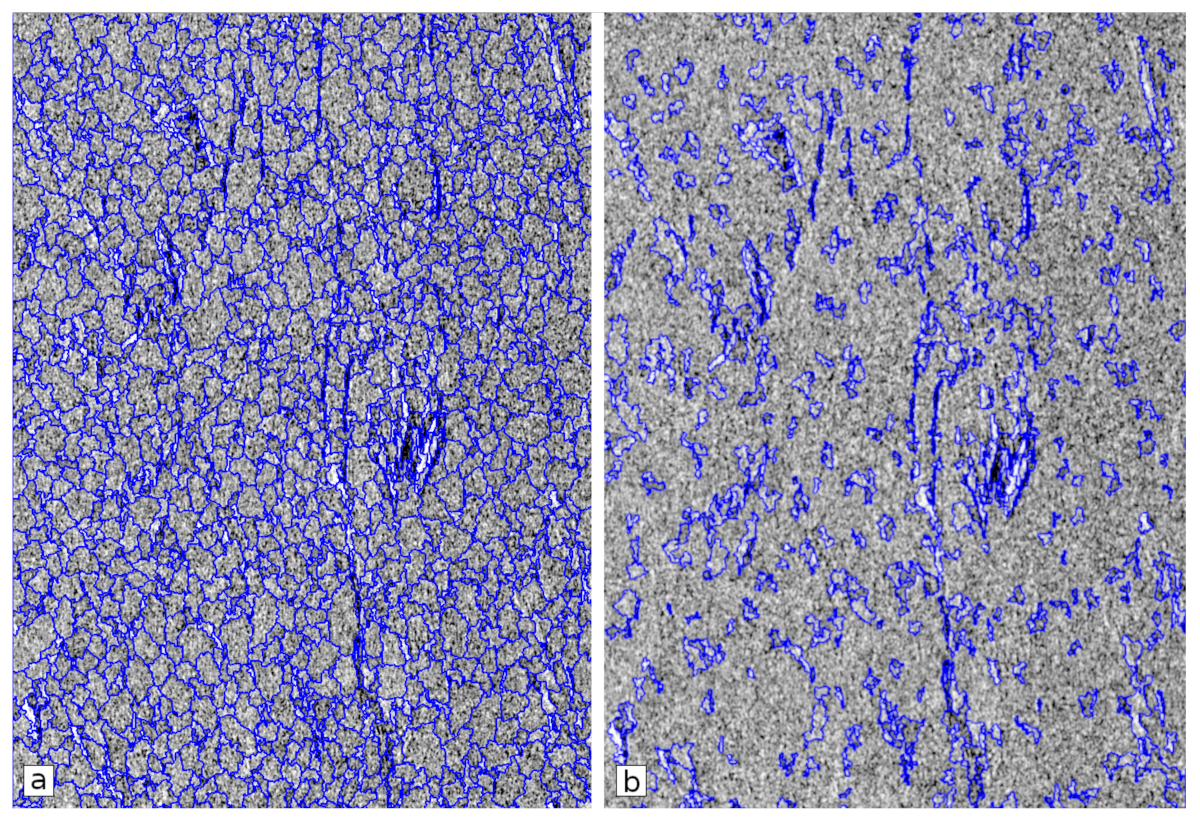
Figure 10.
(a) Preliminary segmented image after Multiresolution Segmentation (MRS) processing; (b) modified result after Spectral Difference Segmentation (SDS).
Figure 10.
(a) Preliminary segmented image after Multiresolution Segmentation (MRS) processing; (b) modified result after Spectral Difference Segmentation (SDS).

Figure 11.
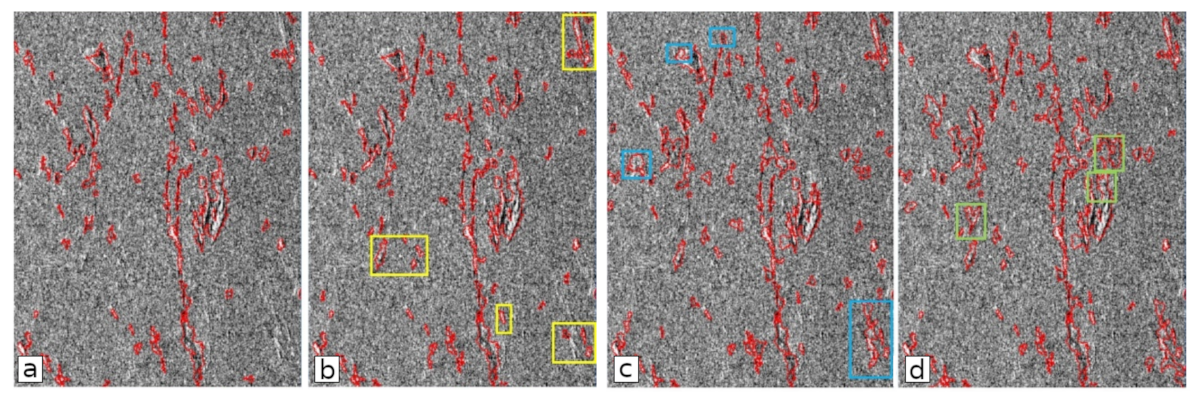
Comparison of supervised classification results, including (a) Support Vector Machine (SVM) (Radial Basis Function (RBF)); (b) SVM (linear); (c) Nearest Neighbor (NN); and (d) Random Forest (RF). Upon visual comparison, it is firstly observed that SVM (RBF) extracted fewer potential landslide sites among the four results. SVM (linear) outperforms SVM (RBF) by extracting more potential landslide sites, outlined in yellow boxes. Compared with SVM (linear), additional landslides extracted by NN are outlined in blue boxes. Landslides detected by RF but not NN are outlined in green boxes in (d). Although it is found that there are a few red polygons detected by NN but not by RF, it is realized that most of them are noise clusters. Therefore, it is determined that the Random Forest is superior to other methods and is selected as the image classifier in the processing scheme.
Figure 11.
Comparison of supervised classification results, including (a) Support Vector Machine (SVM) (Radial Basis Function (RBF)); (b) SVM (linear); (c) Nearest Neighbor (NN); and (d) Random Forest (RF). Upon visual comparison, it is firstly observed that SVM (RBF) extracted fewer potential landslide sites among the four results. SVM (linear) outperforms SVM (RBF) by extracting more potential landslide sites, outlined in yellow boxes. Compared with SVM (linear), additional landslides extracted by NN are outlined in blue boxes. Landslides detected by RF but not NN are outlined in green boxes in (d). Although it is found that there are a few red polygons detected by NN but not by RF, it is realized that most of them are noise clusters. Therefore, it is determined that the Random Forest is superior to other methods and is selected as the image classifier in the processing scheme.

Figure 12.
Detected landslides (yellow polygons) superimposed on confirmed landslide inventory data (blue polygons) based on the processing workflow presented and discussed in this contribution. The base map is a SPOT-5 image acquired after the typhoon. Image center located at 12048E / 2313N.
Figure 12.
Detected landslides (yellow polygons) superimposed on confirmed landslide inventory data (blue polygons) based on the processing workflow presented and discussed in this contribution. The base map is a SPOT-5 image acquired after the typhoon. Image center located at 12048E / 2313N.


Table 1.
Specifications of SAR image used for detection. ASAR—Advanced SAR.
| Event and Date | SAR Data | Acquisition Date | Mode | Image Polarization | Resolution |
|---|---|---|---|---|---|
| Typhoon Morakot | ASAR | 2009/07/15 | Descending | VV, HH | 22 m |
| August 2009 | (AP mode) | 2009/08/19 | Descending | VV, VH |
Table 2.
Statistical indices for landslide areas and areas devoid of landslides in sample regions derived from ASAR LR index images, mean values for polarimetric decomposition indicators, mean values for spatial autocorrelation indicators, and mean values for texture indicators.
Table 2.
Statistical indices for landslide areas and areas devoid of landslides in sample regions derived from ASAR LR index images, mean values for polarimetric decomposition indicators, mean values for spatial autocorrelation indicators, and mean values for texture indicators.
| Areas with Landslides | Areas Devoid of Landslides | |
|---|---|---|
| Statistical Indices | ||
| Standard Deviation | 0.78–1.25 | 0.64–0.74 |
| Skewness | 0.56–1.54 | 1.57–1.86 |
| Polarimetric Decomposition | ||
| Entropy (P) | 0.52–0.71 | 0.74–0.84 |
| Anisotropy | 0.59–0.76 | 0.45–0.56 |
| Alpha | 12.76–20.98 | 22.23–28.04 |
| Spatial Autocorrelation | ||
| Getis-Ord Gi | 0.47–1.34 | 0.00–0.44 |
| Moran’s I | 0.77–2.39 | 0.49–0.71 |
| Geary’s C | 0.68–0.82 | 0.50–0.66 |
| Texture Indicators | ||
| Contrast | 55.56–113.44 | 37.56–52.69 |
| Dissimilarity | 5.81–8.51 | 4.81–5.77 |
| Homogeneity | 0.11–0.16 | 0.16–0.19 |
| Entropy (T) | 3.74–3.77 | 3.72–3.75 |
Publisher’s Note: MDPI stays neutral with regard to jurisdictional claims in published maps and institutional affiliations. |
© 2021 by the authors. Licensee MDPI, Basel, Switzerland. This article is an open access article distributed under the terms and conditions of the Creative Commons Attribution (CC BY) license (http://creativecommons.org/licenses/by/4.0/).
Share and Cite
MDPI and ACS Style
Lin, S.-Y.; Lin, C.-W.; van Gasselt, S. Processing Framework for Landslide Detection Based on Synthetic Aperture Radar (SAR) Intensity-Image Analysis. Remote Sens. 2021, 13, 644. https://0-doi-org.brum.beds.ac.uk/10.3390/rs13040644
AMA Style
Lin S-Y, Lin C-W, van Gasselt S. Processing Framework for Landslide Detection Based on Synthetic Aperture Radar (SAR) Intensity-Image Analysis. Remote Sensing. 2021; 13(4):644. https://0-doi-org.brum.beds.ac.uk/10.3390/rs13040644
Chicago/Turabian StyleLin, Shih-Yuan, Cheng-Wei Lin, and Stephan van Gasselt. 2021. "Processing Framework for Landslide Detection Based on Synthetic Aperture Radar (SAR) Intensity-Image Analysis" Remote Sensing 13, no. 4: 644. https://0-doi-org.brum.beds.ac.uk/10.3390/rs13040644
Note that from the first issue of 2016, this journal uses article numbers instead of page numbers. See further details here.