
Landslide-Induced Mass Transport of Radionuclides along Transboundary Mailuu-Suu River Networks in Central Asia

 ,
,  ,
, 
Abstract
:1. Introduction
2. Materials and Methods
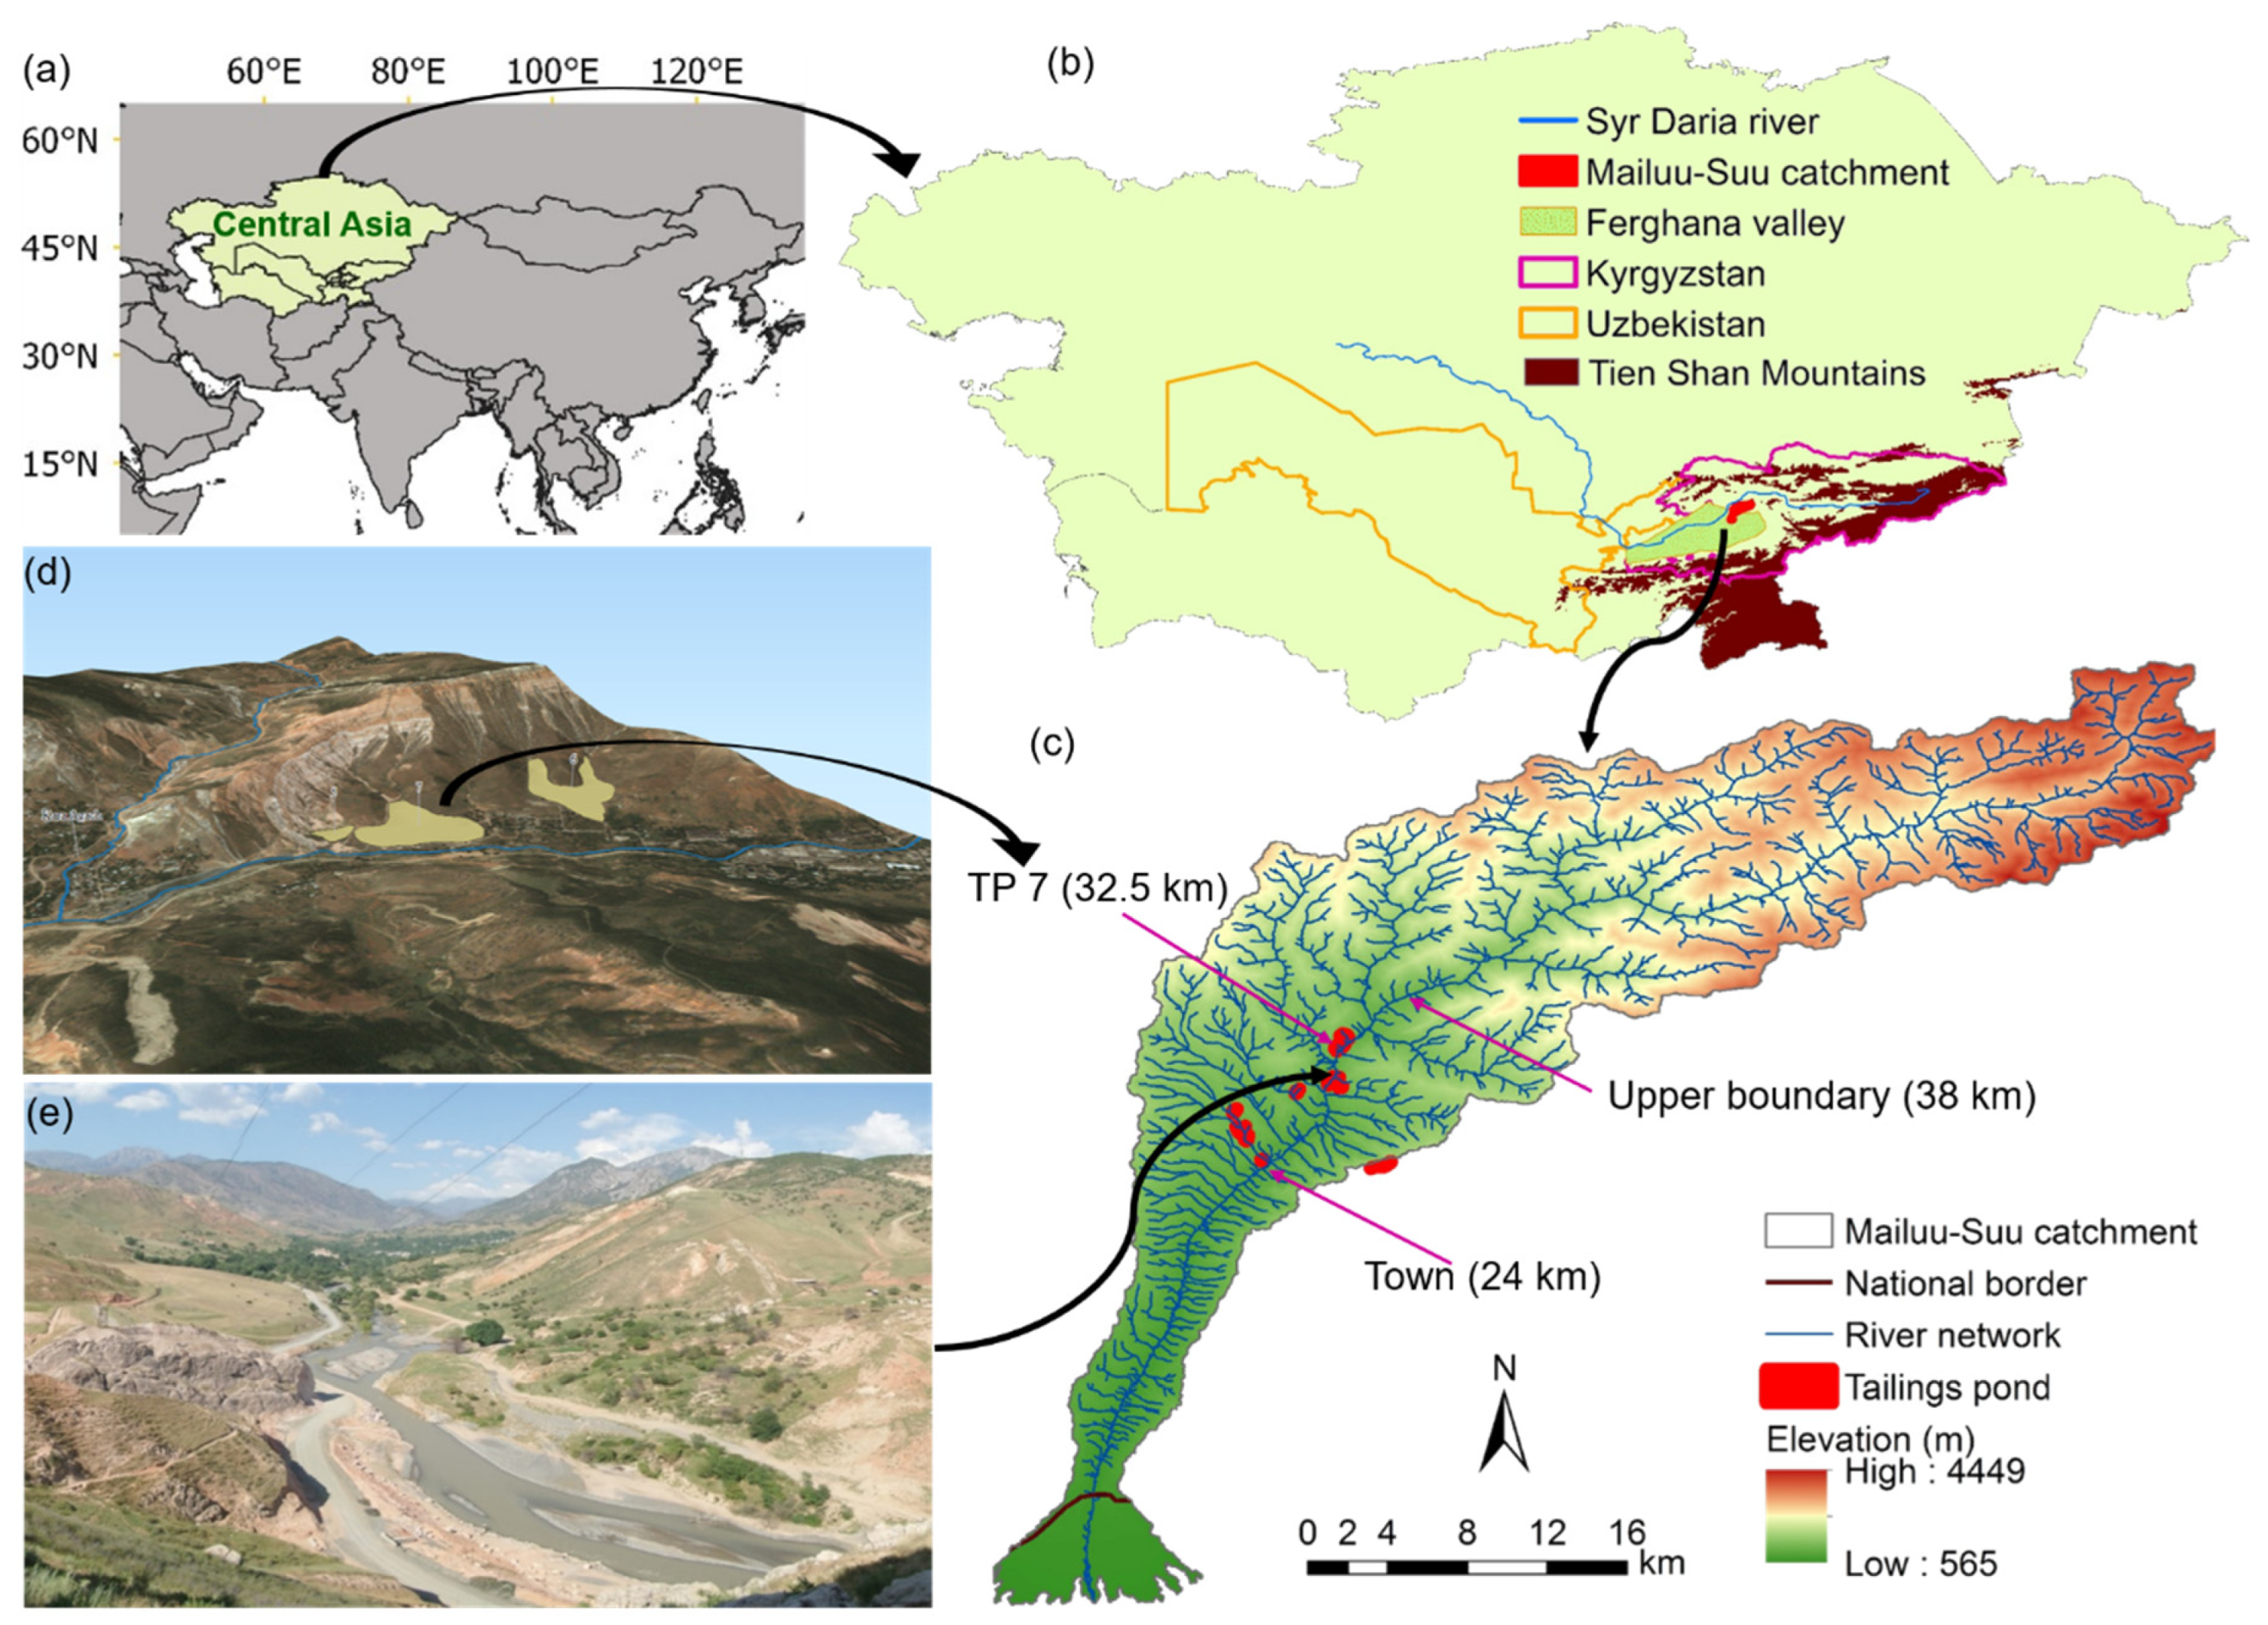
2.1. Study Area
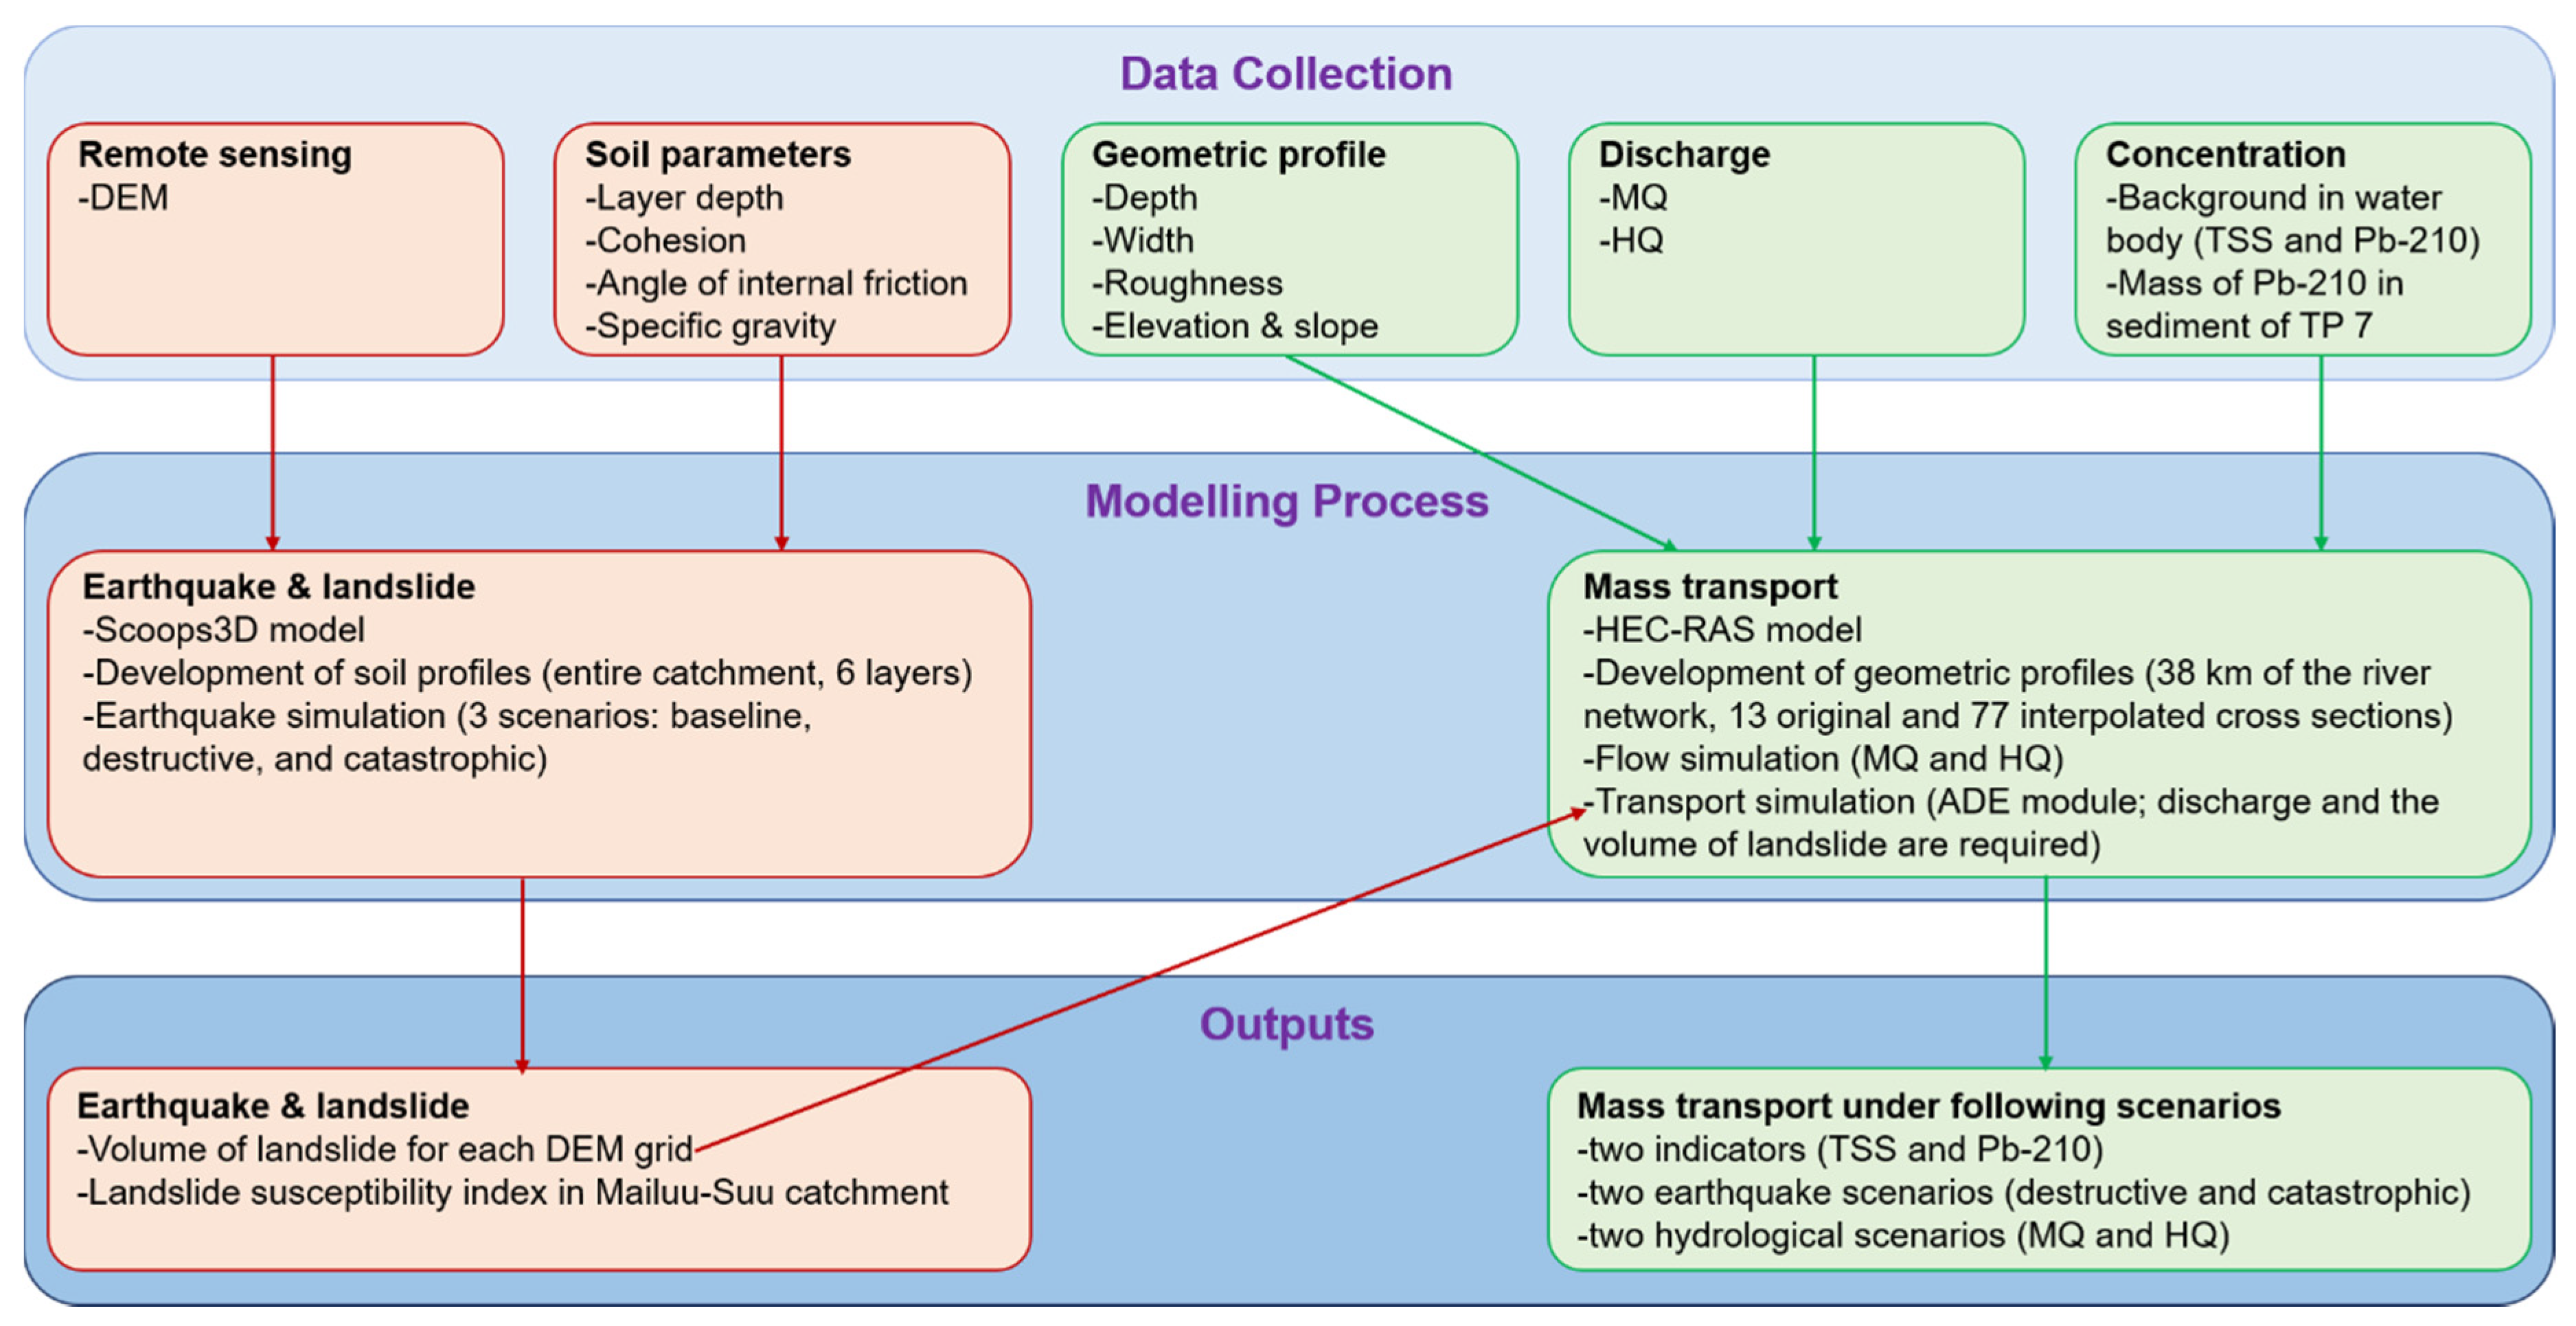
2.2. Data Collection
2.3. Scoops3D Model
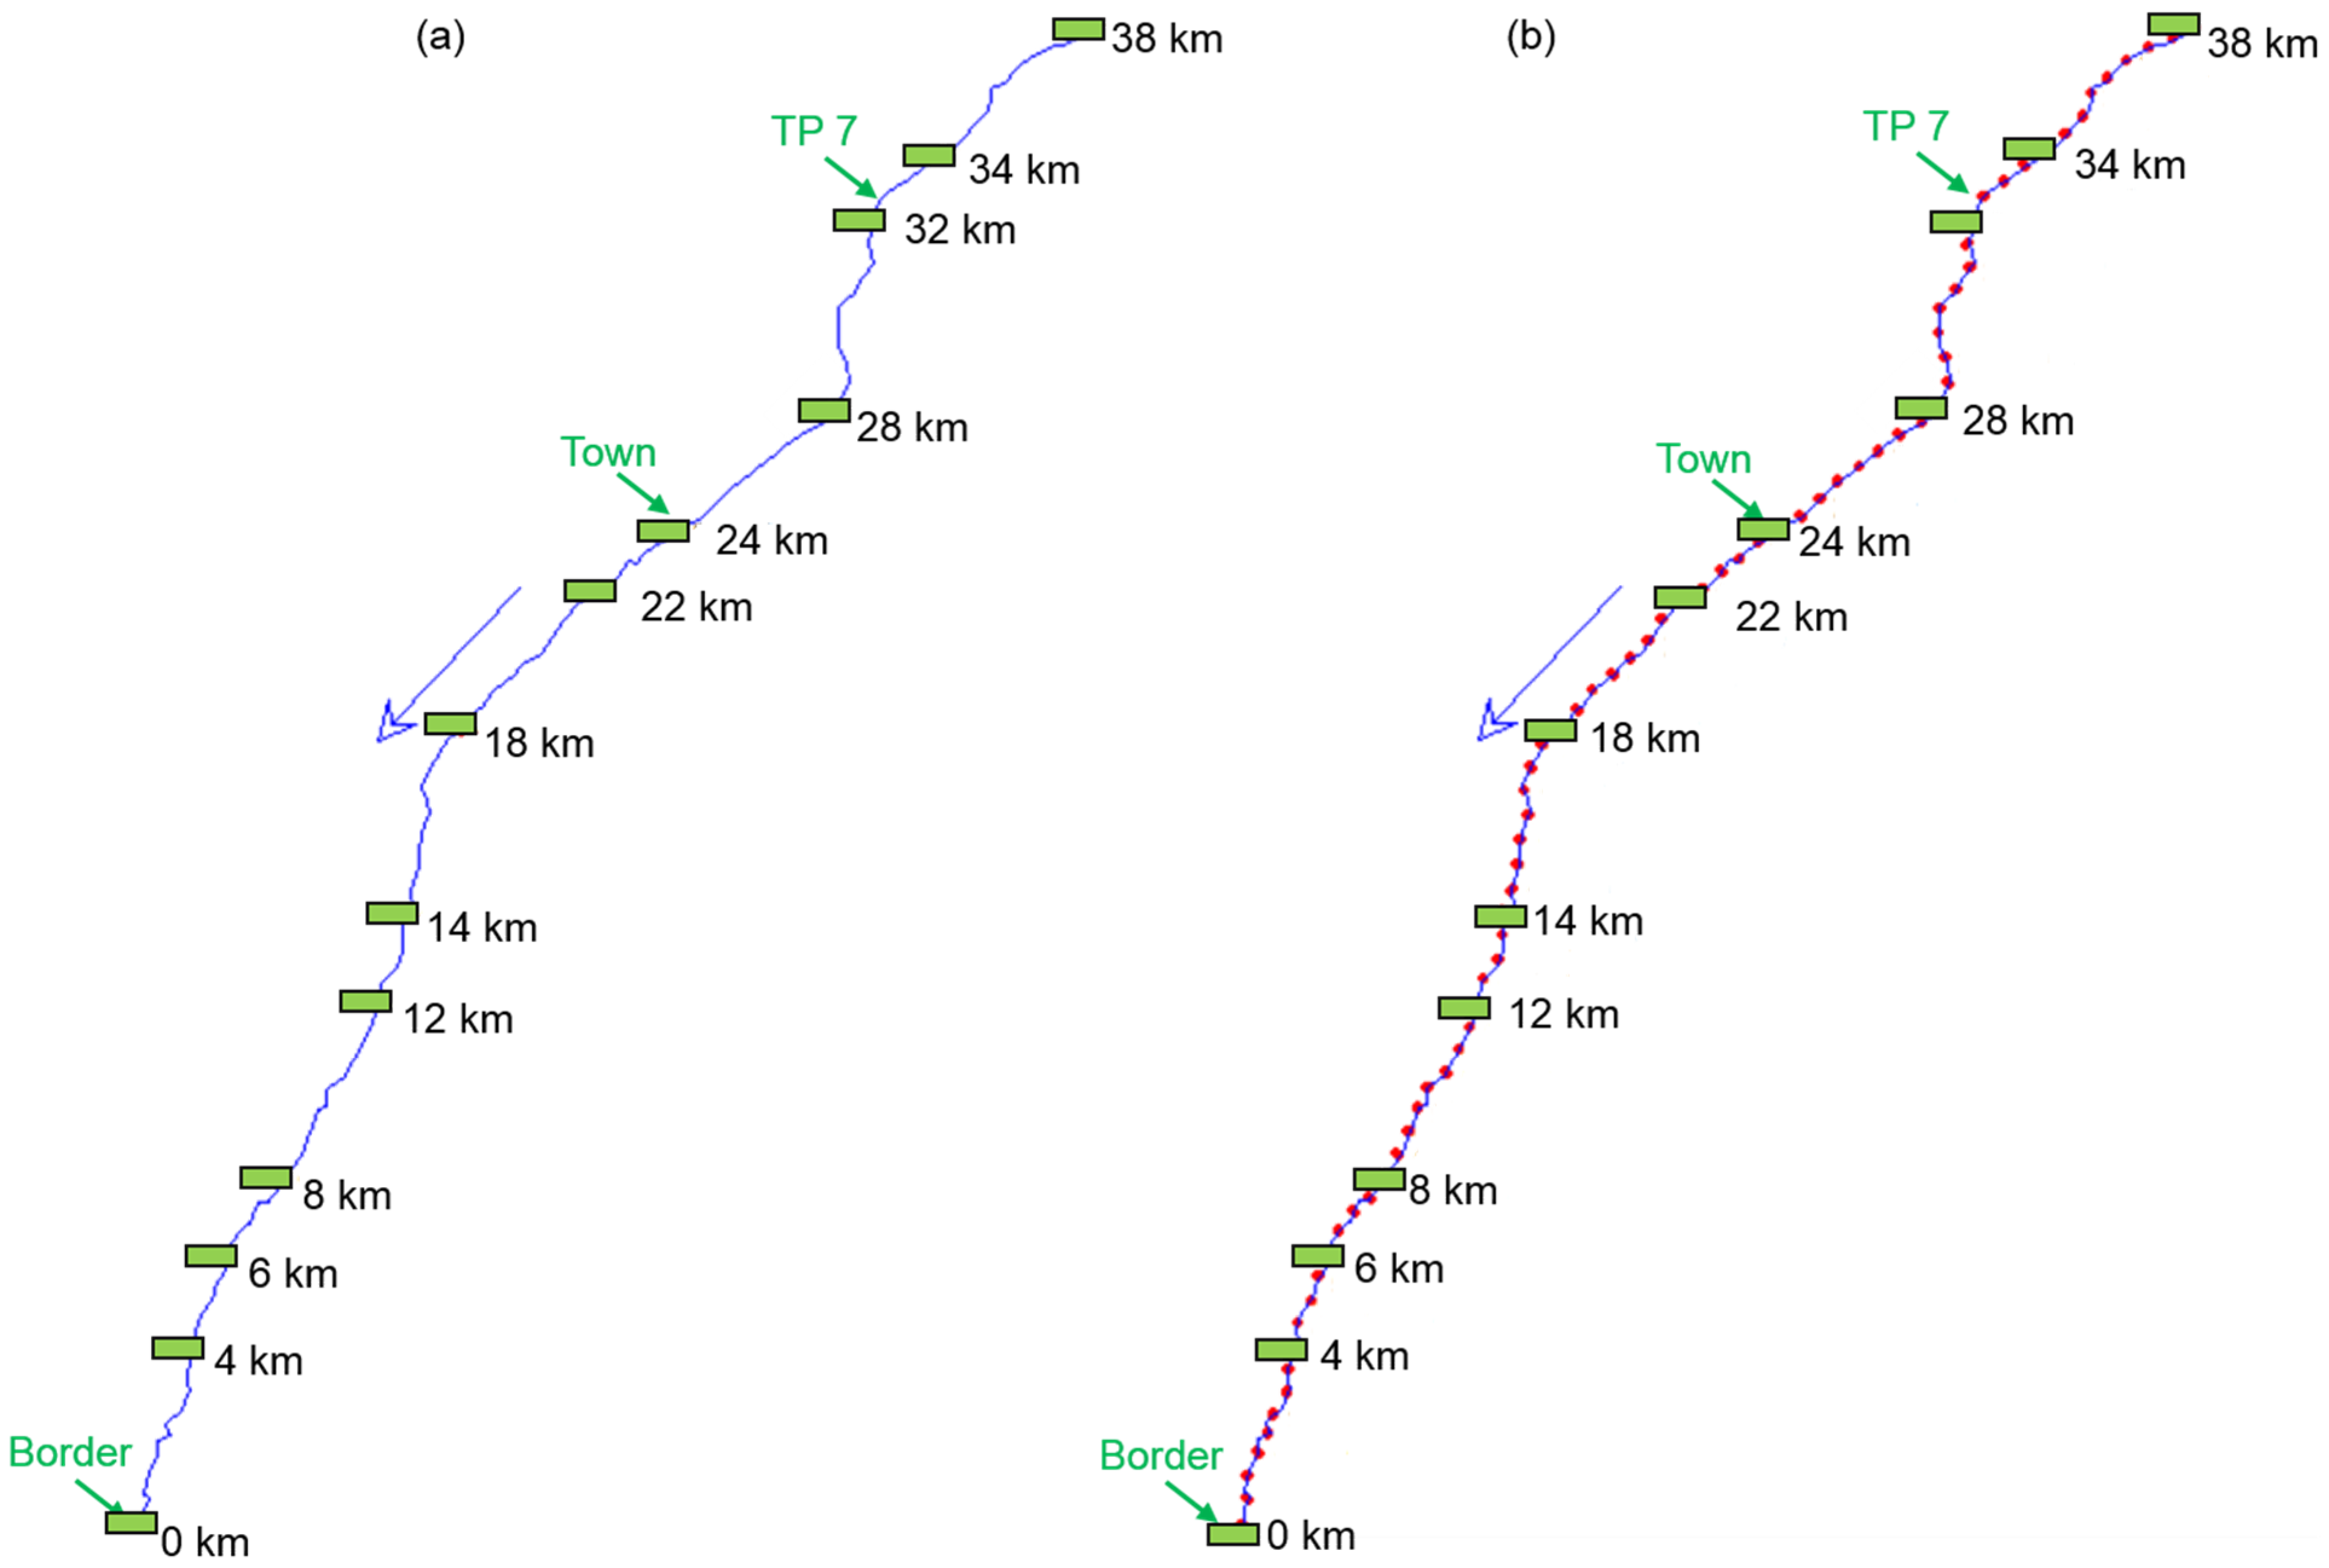
2.4. HEC-RAS Model
3. Results
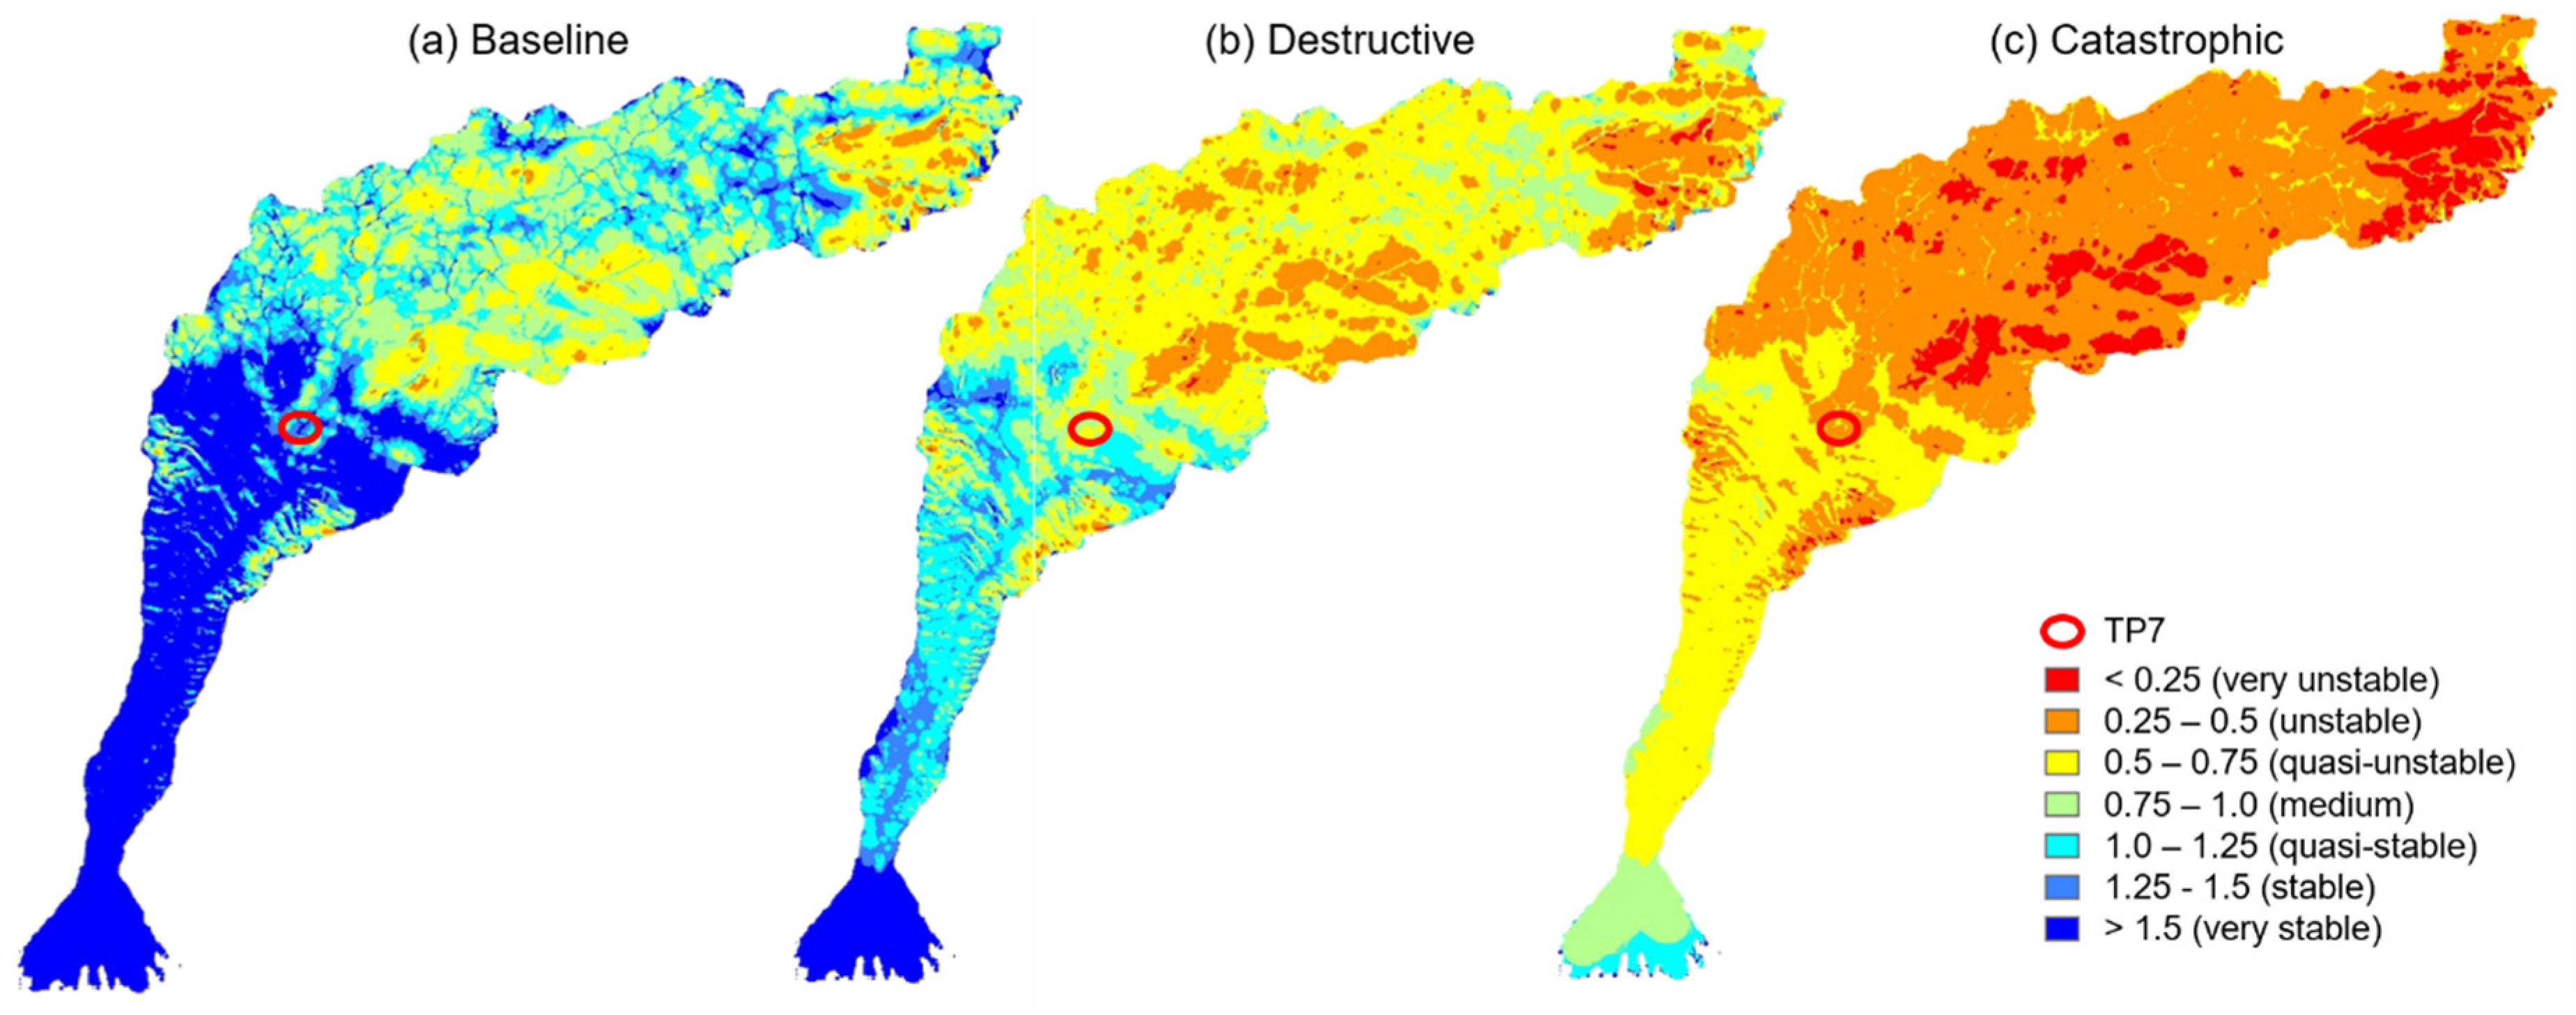
3.1. Maps of Landslide Susceptibility Index
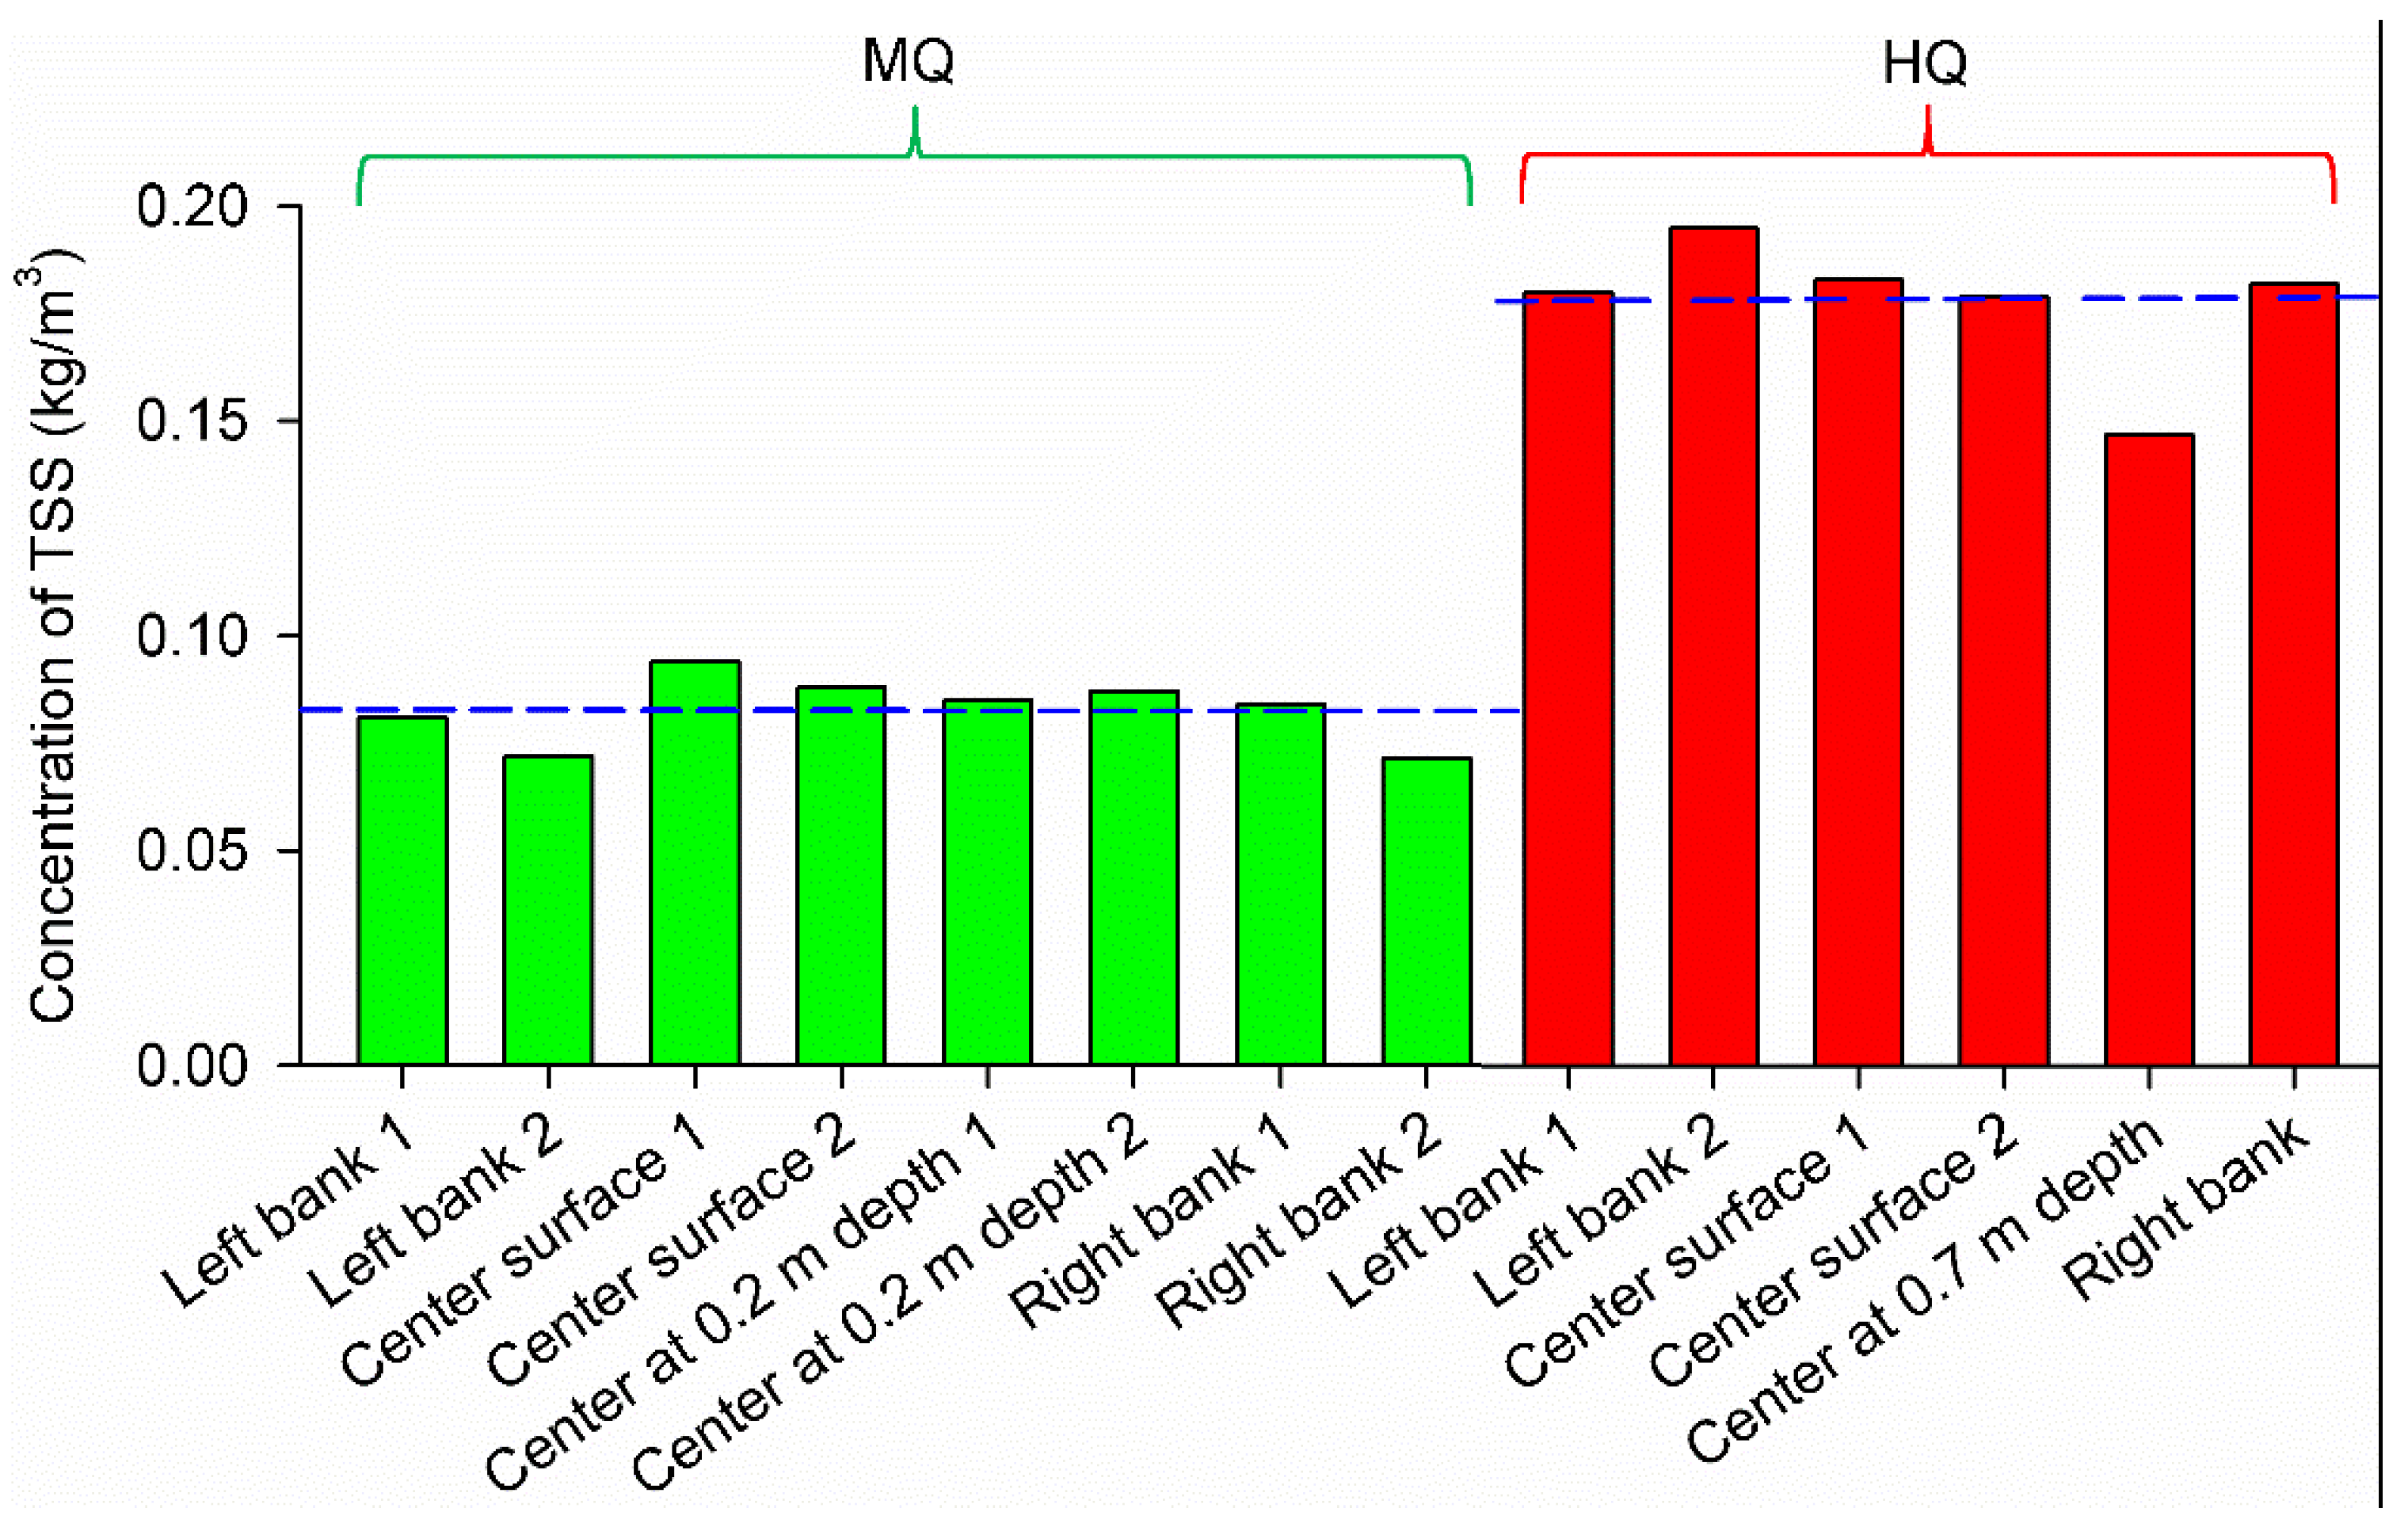
3.2. Background Concentrations of TSS and Pb-210
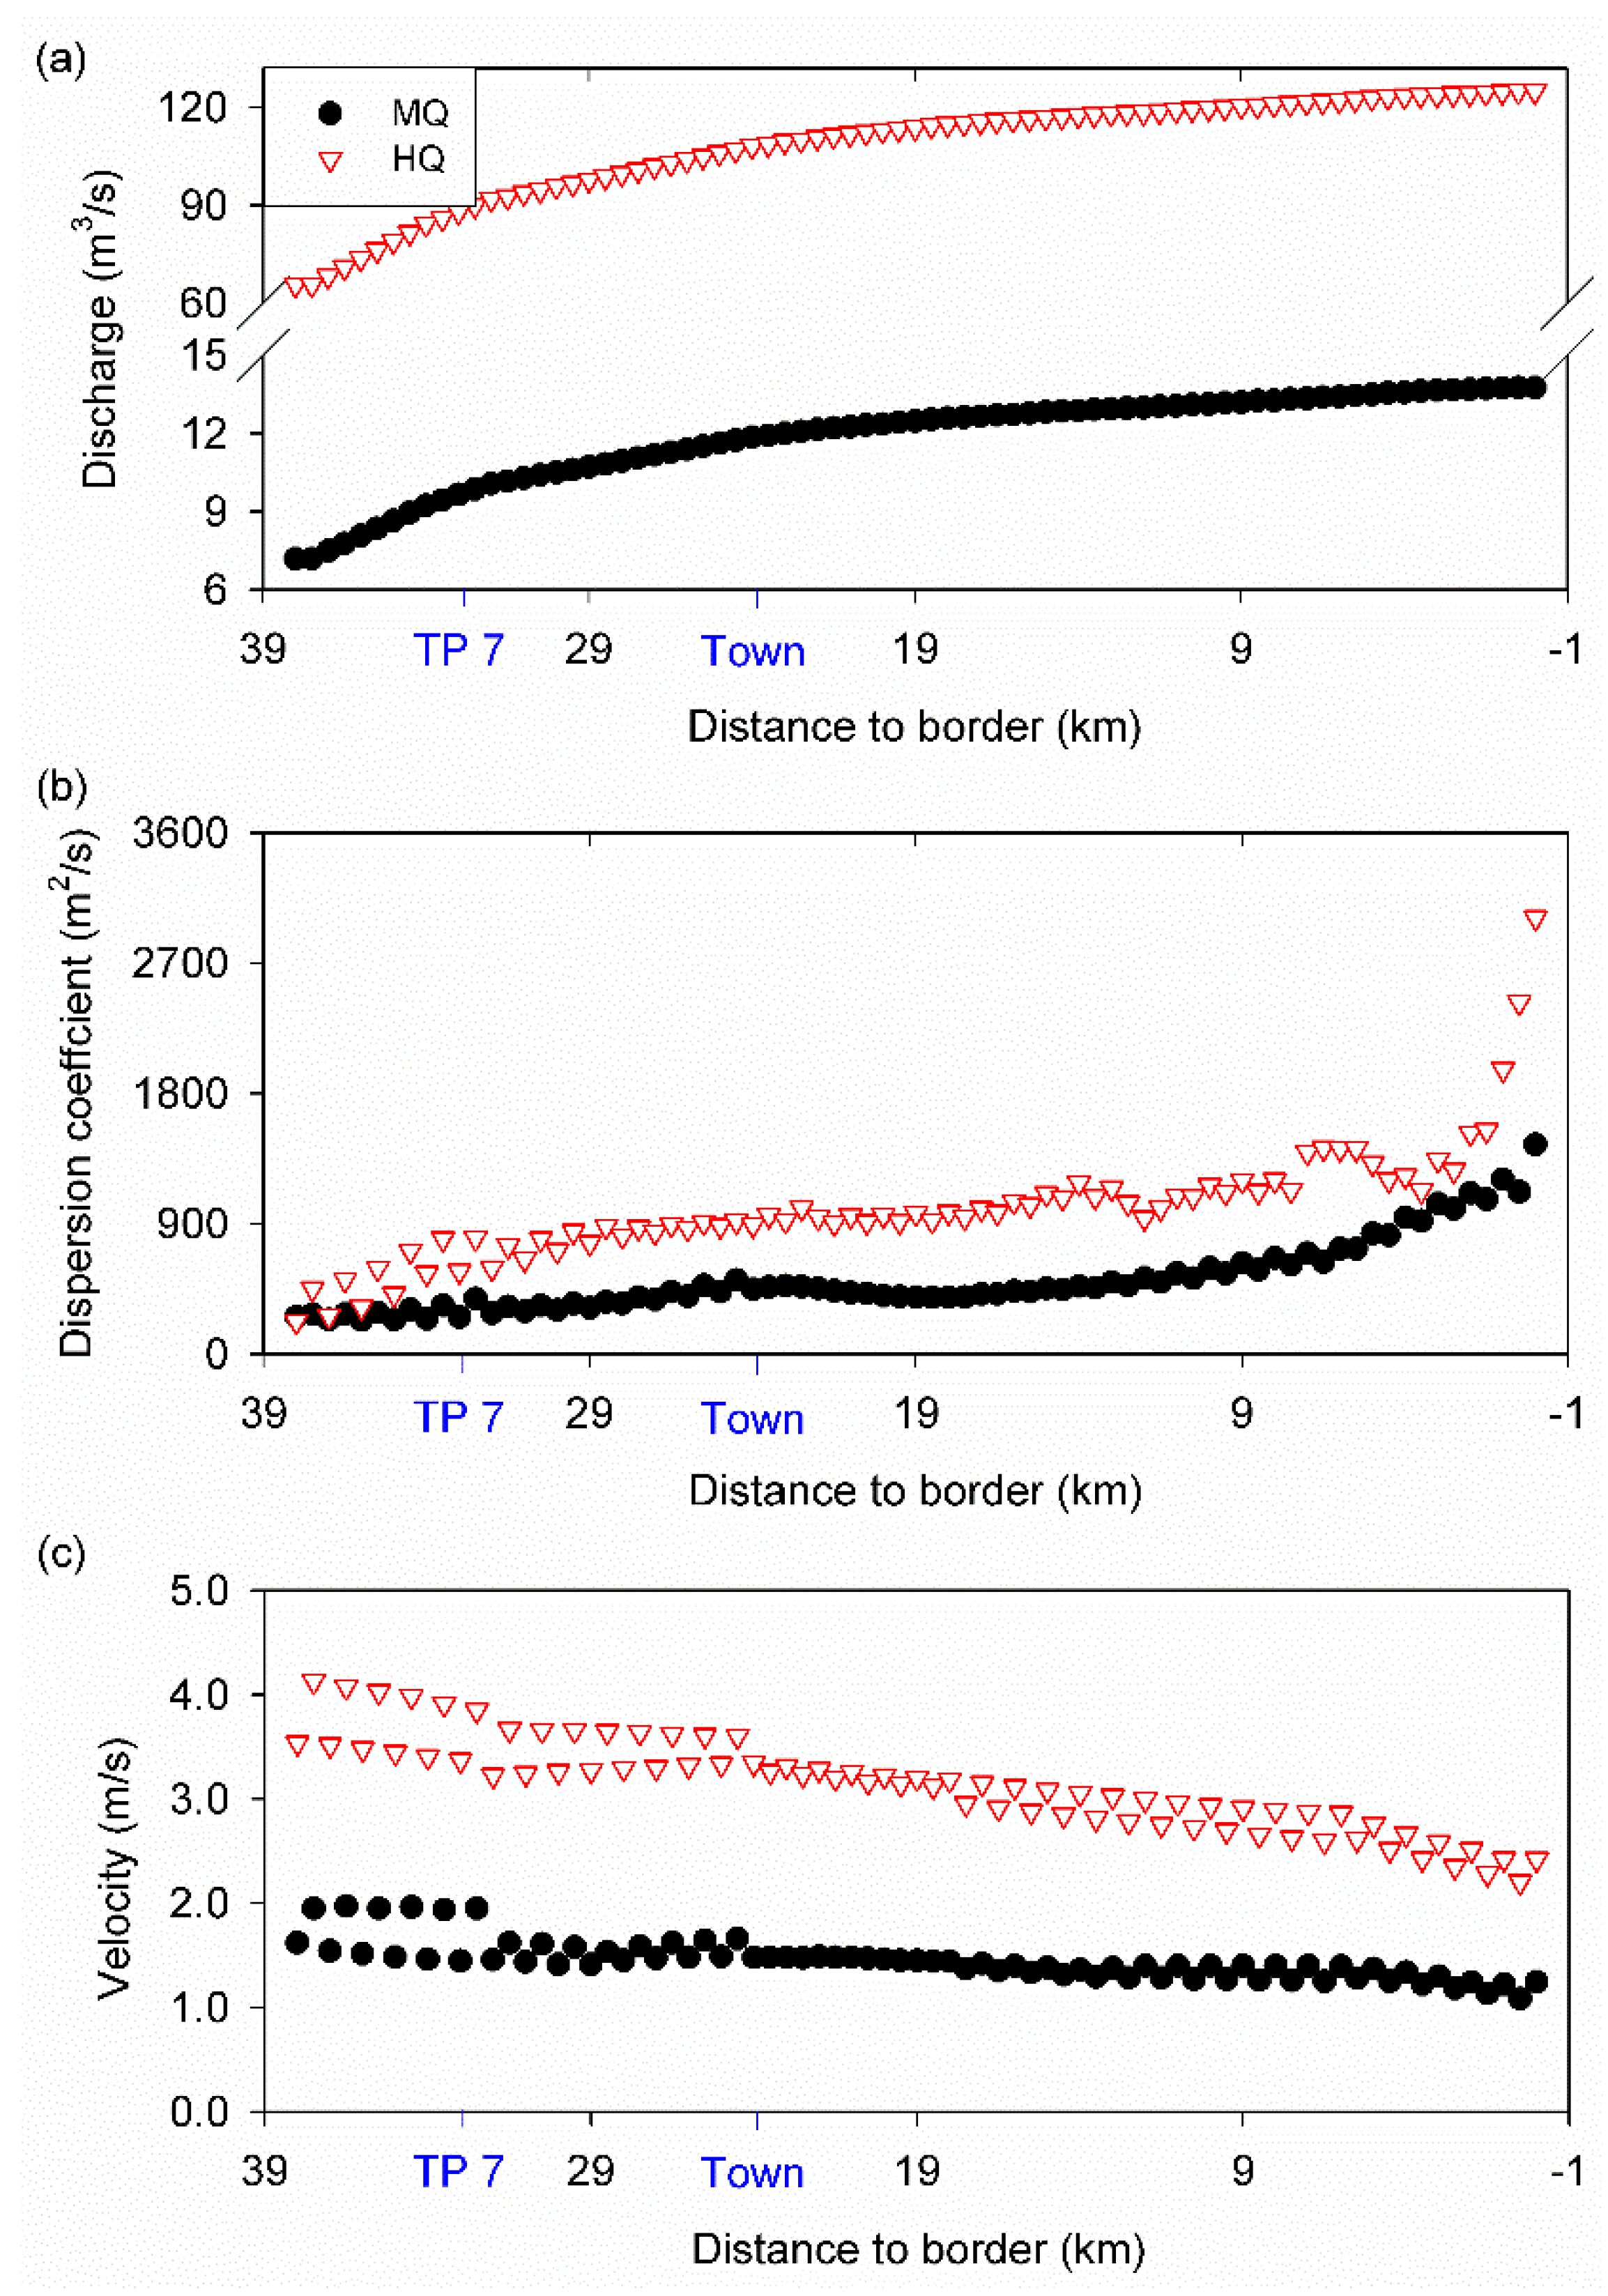
3.3. Hydrological Outputs of HEC-RAS Models
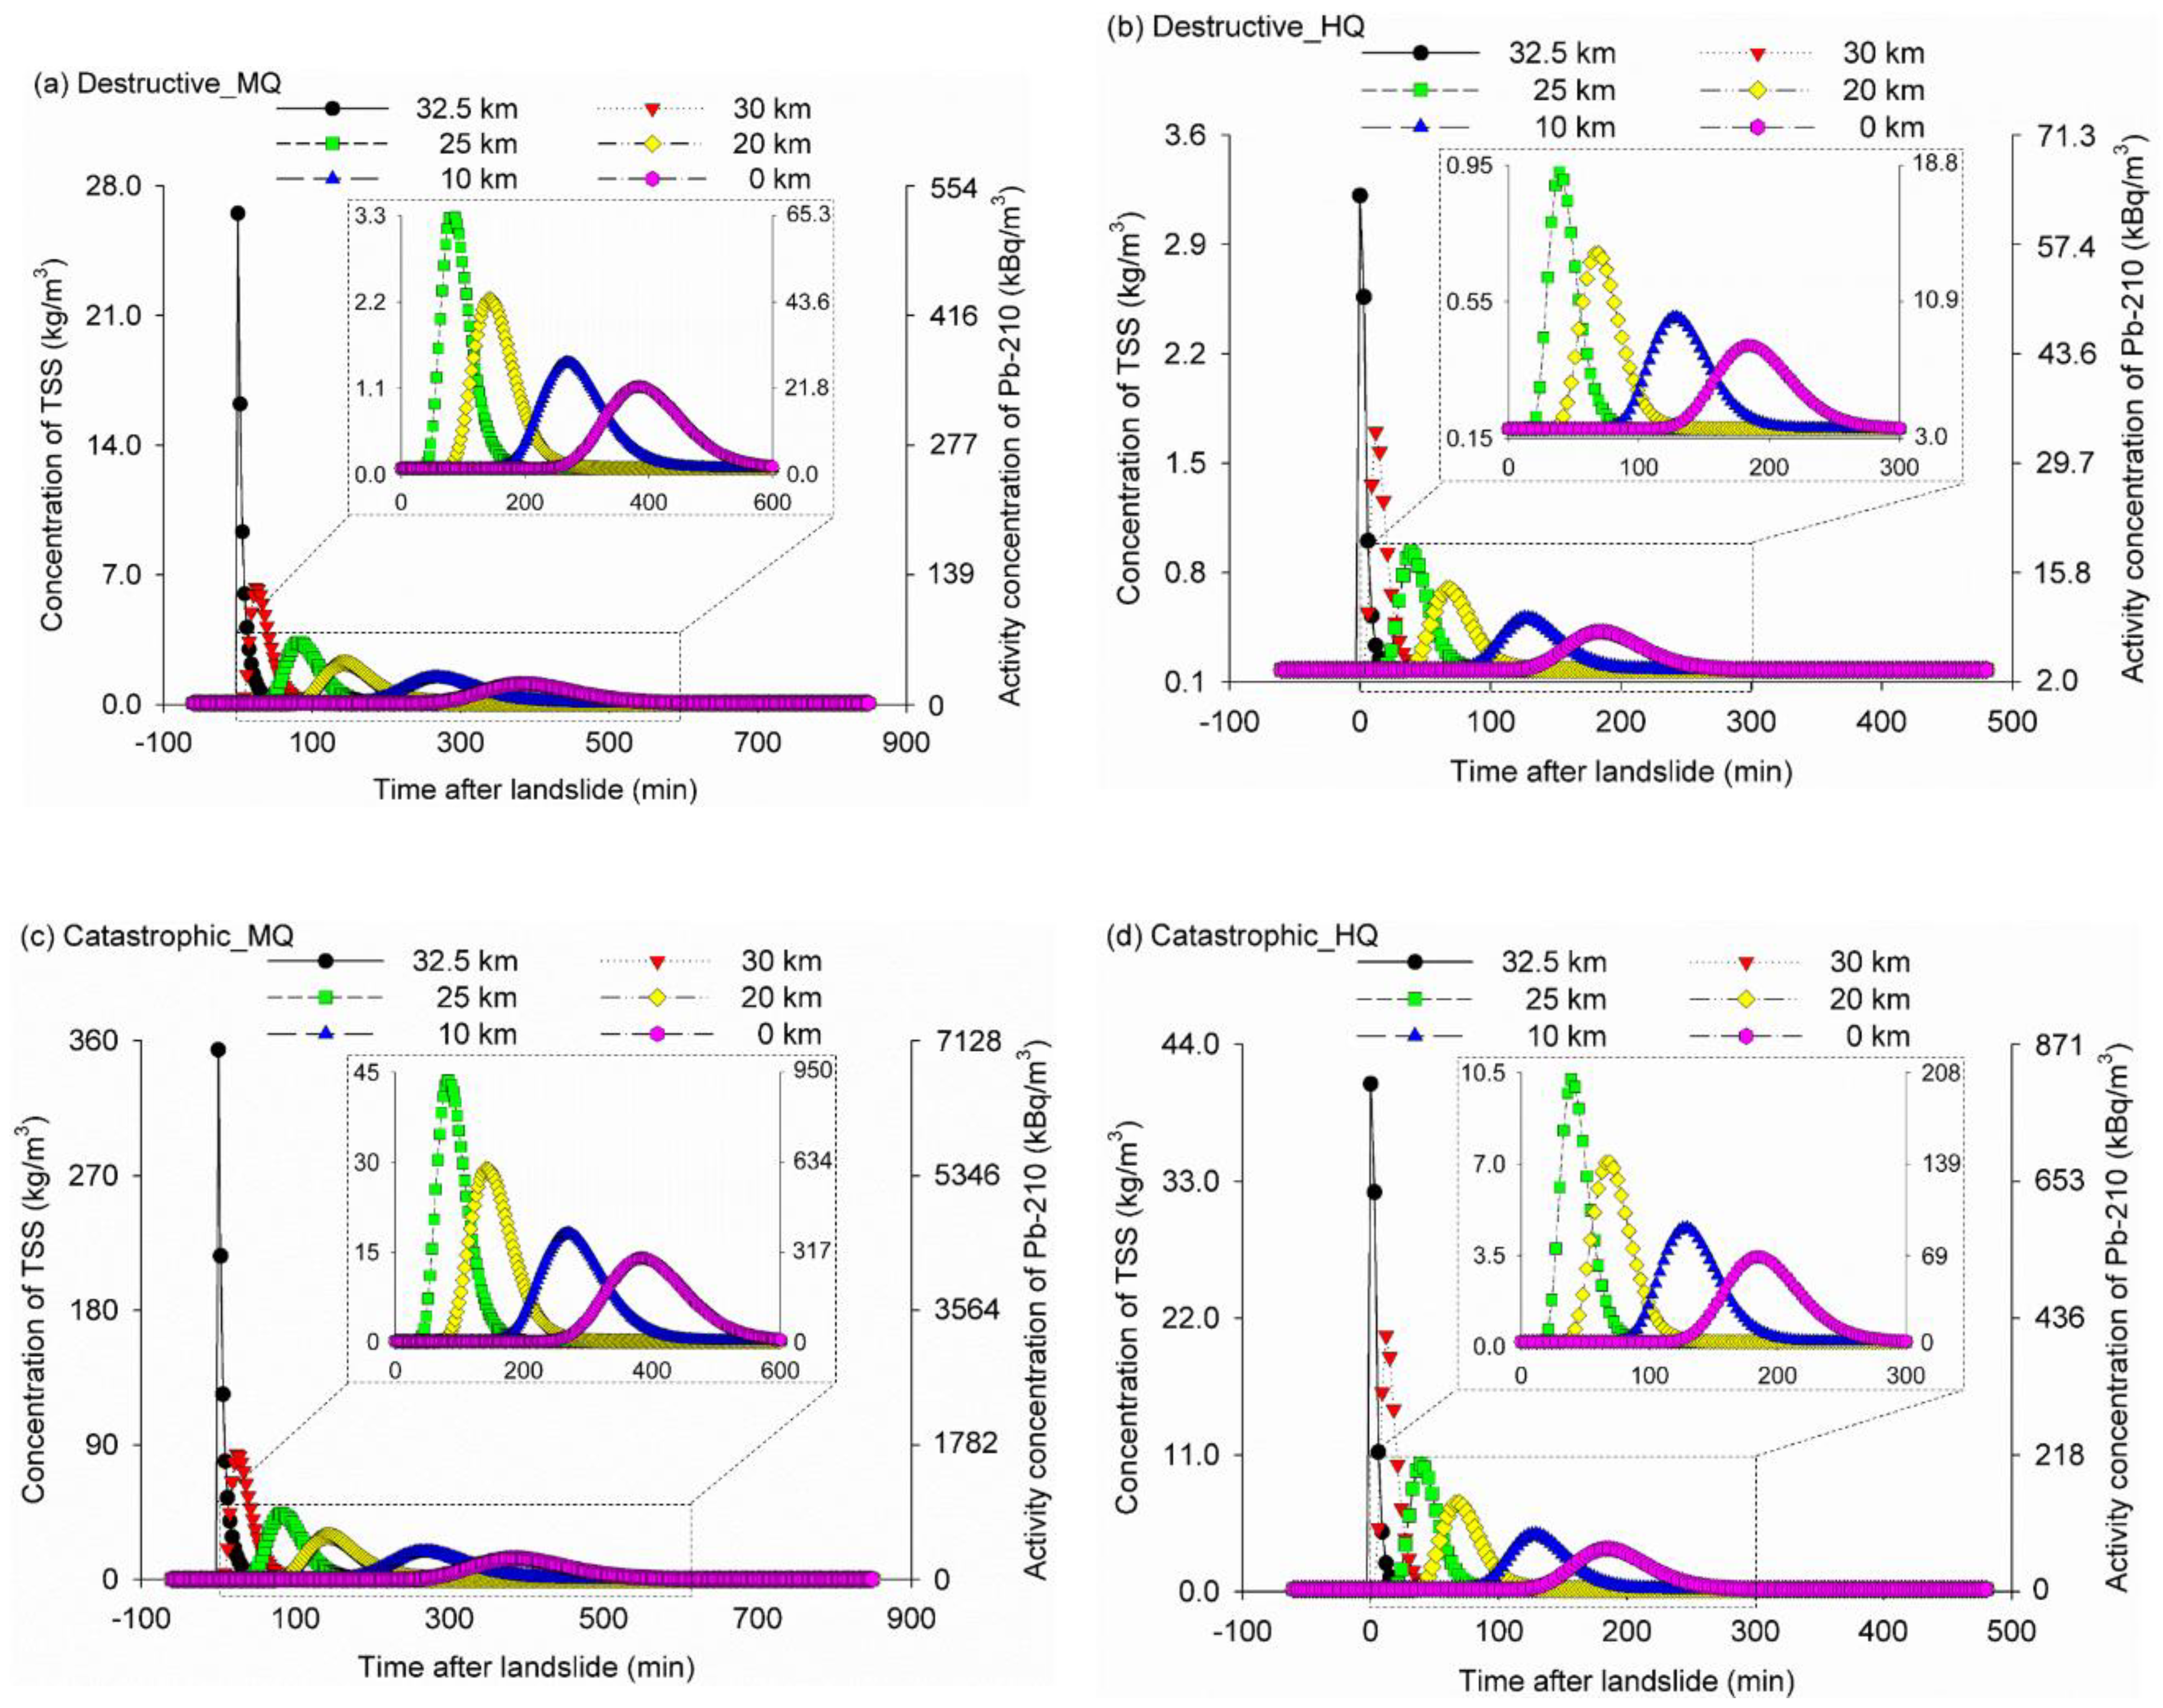
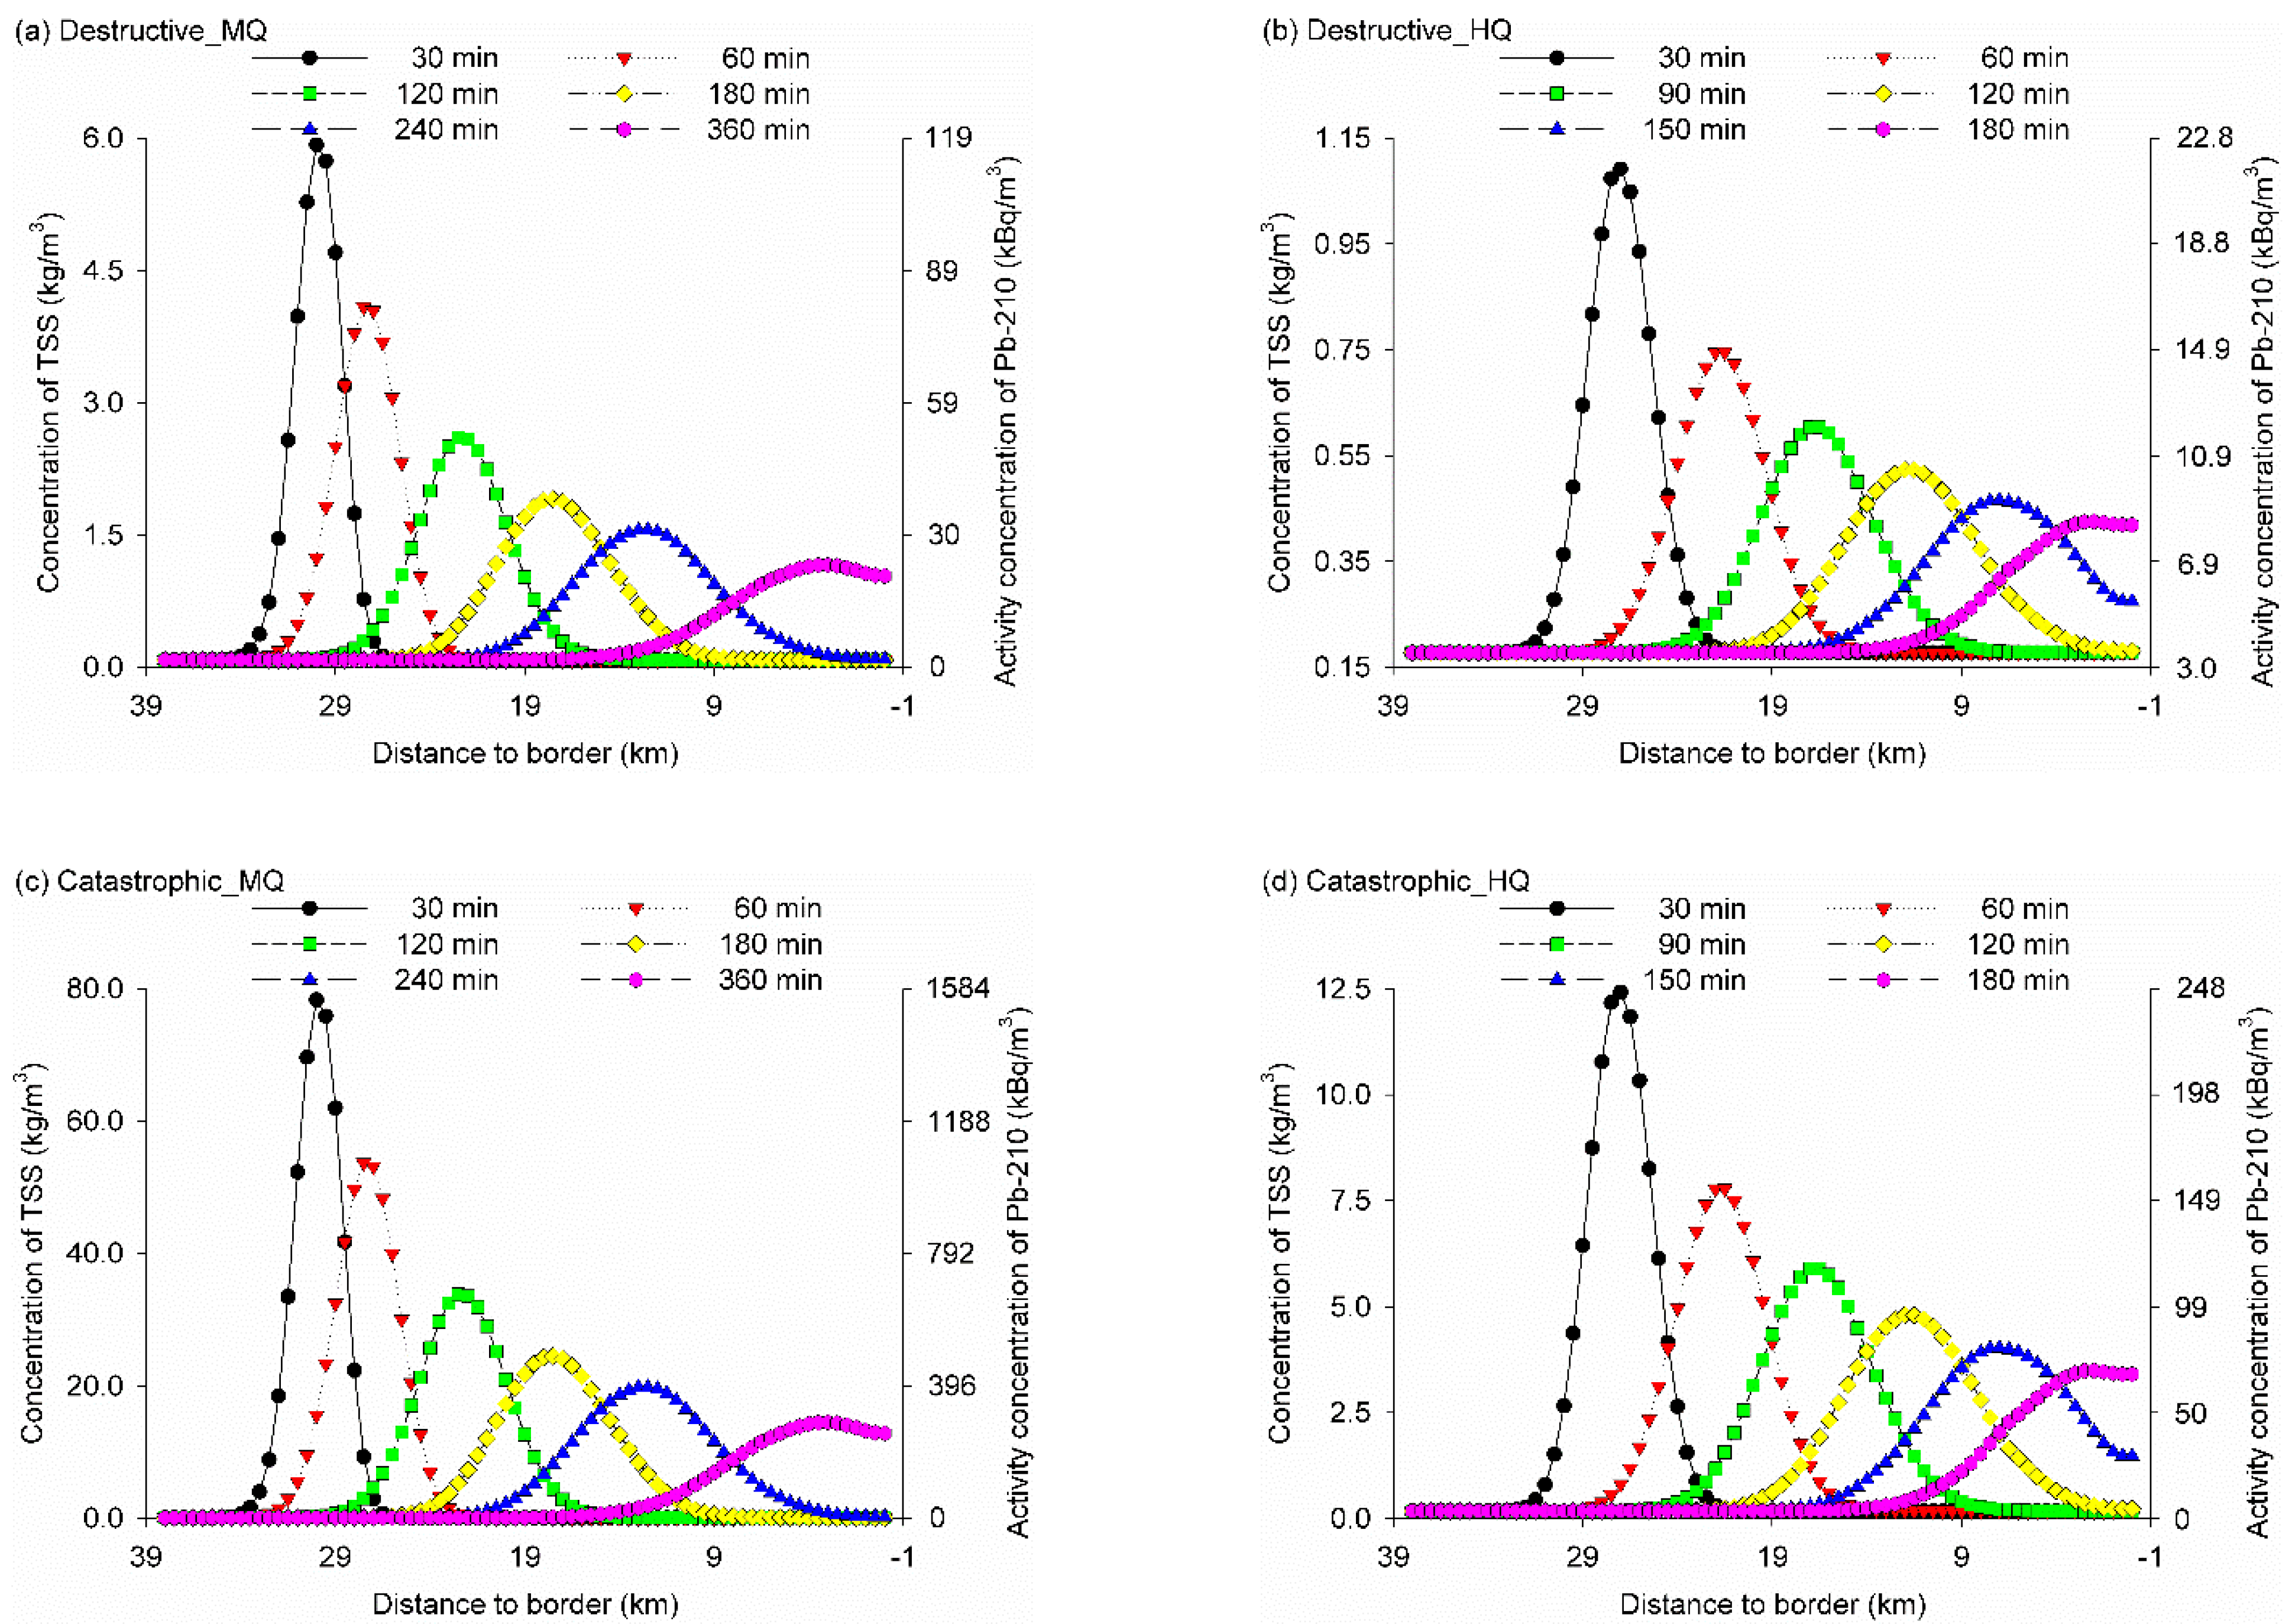
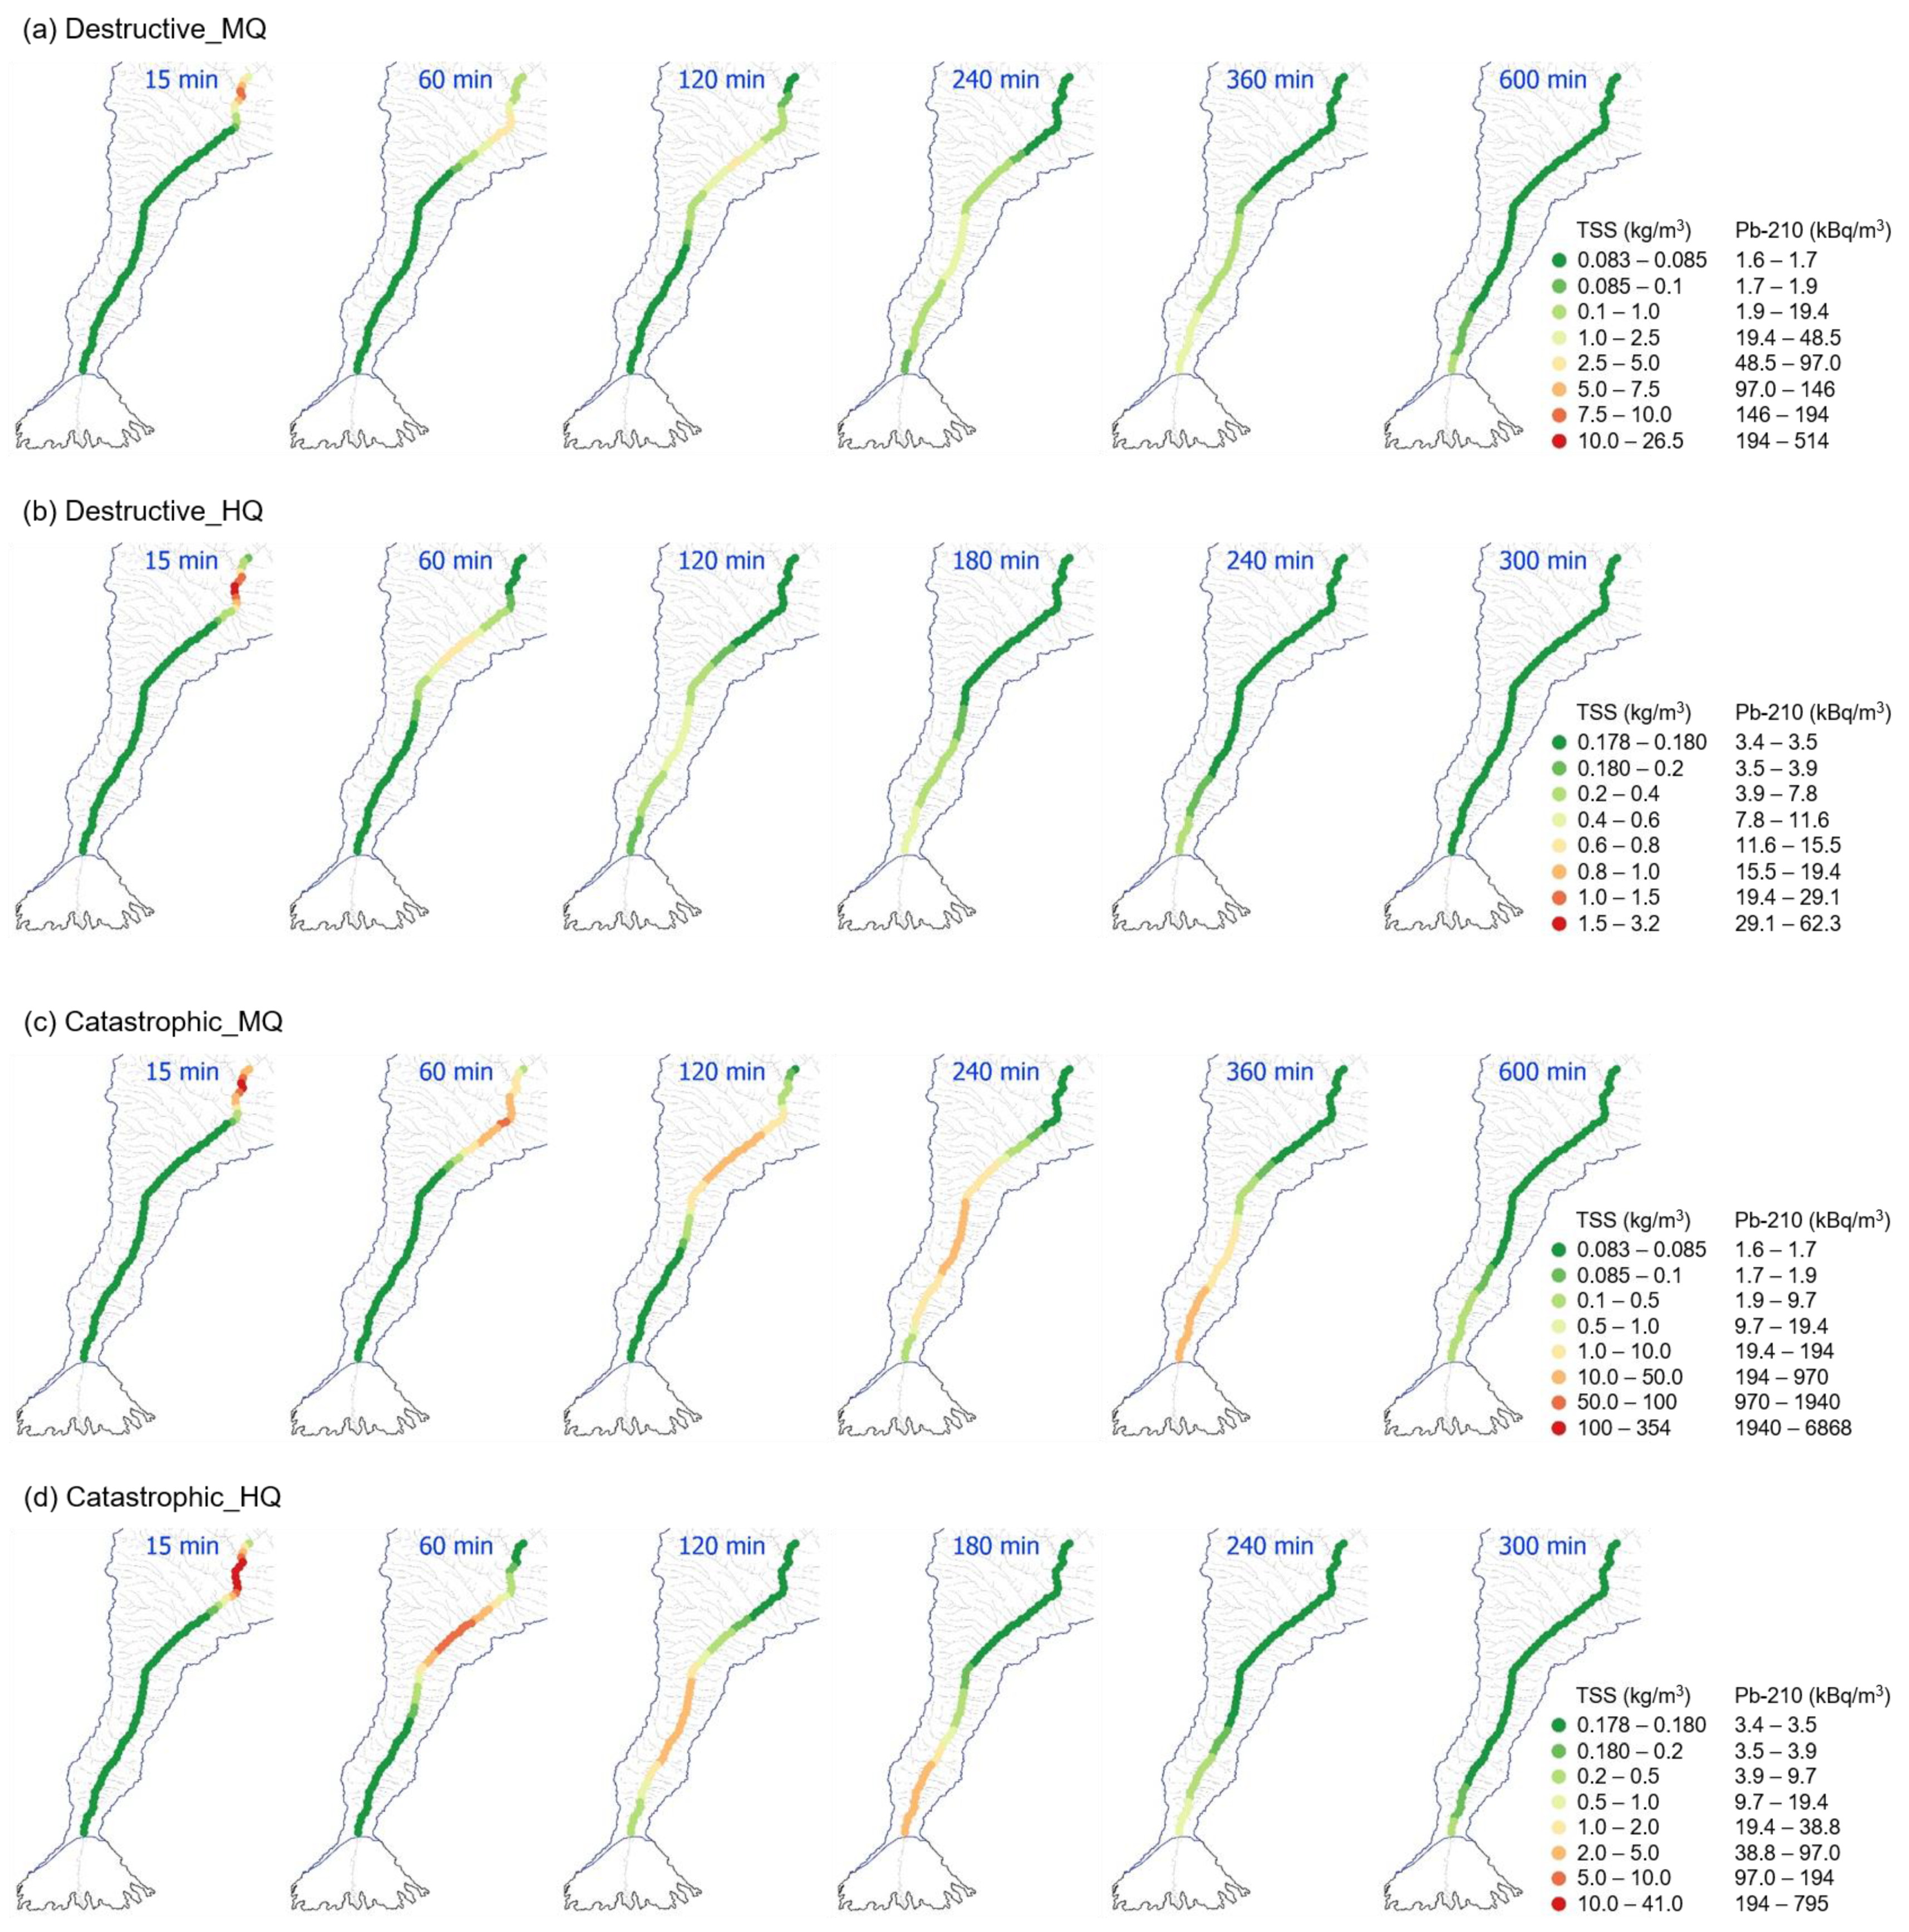
3.4. Spatial and Temporal Patterns of Mass Transport
4. Discussion
4.1. Landslide Susceptibility
4.2. Mass Transport of Radionuclides
4.3. Shortcomings of the Simulations
5. Conclusions
Author Contributions
Funding
Data Availability Statement
Acknowledgments
Conflicts of Interest
References
- Salbu, B. Assessment of the radiological impact of gamma and radon dose rates at former U mining sites in Central Asia. J. Environ. Radioact. 2013, 123, 3–13. [Google Scholar]
- Torgoev, I.A.; Aleshin, Y.G.; Ashirov, G.E. Environmental Effects of Possible Landslide Catastrophes in the Areas of Radioactive Waste Warehousing in Kyrgyzstan (Central Asia). 2008, pp. 320–323. Available online: http://www.un-spider.org/sites/default/files/2-Landslide_Impacts_%28Institute%20of%20Physics%20of%20Kyrgyzstan%29.pdf (accessed on 24 November 2019).
- Kunze, C.; Walter, U.; Wagner, F.; Schmidt, P.; Barnekow, U.; Gruber, A. Environmental impact and remediation of uranium tailings and waste rock dumps at Mailuu Suu (Kyrgyzstan). In Proceedings of the International Conference on Mine Closure and Environmental Remediation, Gera, Germany, 10–12 September 2007; pp. 10–12. [Google Scholar]
- Torgoev, I.A.; Aleshin, Y.G.; Meleshko, A.V.; Havenith, H.B. Hazard mitigation for landslide dams in Mailuu-Suu valley (Kyrgyzstan). Ital. J. Eng. Geol. Environ. 2006, 99–102. [Google Scholar]
- Saponaro, A.; Pilz, M.; Bindi, D.; Parolai, S. The contribution of EMCA to landslide susceptibility mapping in Central Asia. Ann. Geophys. 2015, 58, S0113. [Google Scholar]
- Havenith, H.B.; Torgoev, I.; Meleshko, A.; Alioshin, Y.; Torgoev, A.; Danneels, G. Landslides in the Mailuu-Suu Valley, Kyrgyzstan-hazards and impacts. Landslides 2006, 3, 137–147. [Google Scholar] [CrossRef]
- Havenith, H.-B.; Umaraliev, R.; Schlögel, R.; Torgoev, I. Past and Potential Future Socioeconomic Impacts of Environmental Hazards in Kyrgyzstan. In Kyrgyzstan: Political, Economic and Social Issues Edition: Central Asia: Economic and Political Issues; Perry, O.A., Ed.; NOVA Science Publishers: New York, NY, USA, 2017; pp. 63–113. [Google Scholar]
- Saponaro, A.; Pilz, M.; Wieland, M.; Bindi, D.; Moldobekov, B.; Parolai, S. Landslide susceptibility analysis in data-scarce regions: The case of Kyrgyzstan. Bull. Eng. Geol. Environ. 2014, 74, 1117–1136. [Google Scholar] [CrossRef] [Green Version]
- Piroton, V.; Schlögel, R.; Barbier, C.; Havenith, H.-B. Monitoring the recent activity of landslides in the Mailuu-Suu Valley (Kyrgyzstan) using radar and optical remote sensing techniques. Geoscience 2020, 10, 164. [Google Scholar] [CrossRef]
- Marc, O.; Hovius, N.; Meunier, P.; Gorum, T.; Uchida, T. A seismologically consistent expression for the total area and volume of earthquake-triggered landsliding. J. Geophys. Res. Earth Surf. 2016, 121, 640–663. [Google Scholar] [CrossRef] [Green Version]
- Xiong, P.; Long, C.; Zhou, H.; Battiston, R.; Zhang, X.; Shen, X. Identification of electromagnetic pre-earthquake perturbations from the DEMETER data by machine learning. Remote Sens. 2020, 12, 3643. [Google Scholar] [CrossRef]
- Göransson, G.; Larson, M.; Bendz, D.; Åkesson, M. Mass transport of contaminated soil released into surface water by landslides (Göta River, SW Sweden). Hydrol. Earth Syst. Sci. 2012, 16, 1879–1893. [Google Scholar] [CrossRef] [Green Version]
- Chowdhuri, I.; Pal, S.C.; Arabameri, A.; Saha, A.; Chakrabortty, R.; Blaschke, T.; Pradhan, B.; Band, S.S. Implementation of artificial intelligence based ensemble models for gully erosion susceptibility assessment. Remote Sens. 2020, 12, 3620. [Google Scholar] [CrossRef]
- Hakim, W.L.; Achmad, A.R.; Lee, C.-W. Land subsidence susceptibility mapping in jakarta using functional and meta-ensemble machine learning algorithm based on time-series InSAR data. Remote Sens. 2020, 12, 3627. [Google Scholar] [CrossRef]
- Guerriero, L.; Di Martire, D.; Calcaterra, D.; Francioni, M. Digital image correlation of google earth images for earth’s surface displacement estimation. Remote Sens. 2020, 12, 3518. [Google Scholar] [CrossRef]
- Kalantar, B.; Ueda, N.; Al-Najjar, H.A.H.; Halin, A.A. Assessment of convolutional neural network architectures for earthquake-induced building damage detection based on pre- and post-event orthophoto images. Remote Sens. 2020, 12, 3529. [Google Scholar] [CrossRef]
- Tang, C.; Tanyas, H.; van Westen, C.J.; Tang, C.; Fan, X.; Jetten, V.G. Analysing post-earthquake mass movement volume dynamics with multi-source DEMs. Eng. Geol. 2019, 248, 89–101. [Google Scholar] [CrossRef]
- Ma, C. Comparing and evaluating two physically-based models: OpenLISEM and Scoops3d, for landslide volume prediction. Doctoral Thesis, University of Twente, Enschede, The Netherlands, 2018. [Google Scholar]
- Marchesini, I.; Cencetti, C.; De Rosa, P. A preliminary method for the evaluation of the landslides volume at a regional scale. Geoinformatica 2009, 13, 277–289. [Google Scholar] [CrossRef]
- Van den Bout, B.; van Asch, T.W.J.; Hu, W.; Tang, C.; Mavrouli, O.; Jetten, V.G.; van Westen, C.J. Towards a model for structured mass movements: The OpenLISEM Hazard model 2.0a. Geosci. Model. Dev. Discuss. 2020, 2020, 1–31. [Google Scholar]
- Mergili, M.; Marchesini, I.; Rossi, M.; Guzzetti, F.; Fellin, W. Spatially distributed three-dimensional slope stability modelling in a raster GIS. Geomorphology 2014, 206, 178–195. [Google Scholar] [CrossRef]
- Reid, M.E.; Christian, S.B.; Brien, D.L.; Henderson, S.T. Scoops3D—Software to Analyze 3D Slope Stability throughout A Digital Landscape; U.S. Geological Survey: Reston, VA, USA, 2015.
- Martin, P.G.; Connor, D.T.; Estrada, N.; El-Turke, A.; Megson-Smith, D.; Jones, C.P.; Kreamer, D.K.; Scott, T.B. Radiological identification of near-surface mineralogical deposits using low-altitude unmanned aerial vehicle. Remote Sens. 2020, 12, 3562. [Google Scholar] [CrossRef]
- Hyatt, N.C.; Ojovan, M.I. Special issue: Materials for nuclear waste immobilization. Materials 2019, 12, 3611. [Google Scholar] [CrossRef] [Green Version]
- UNECE. UNECE Committee on Environmental Policy: Second Environmental Performance Review of Kyrgyzstan; United Nations Economic Commission for Europe: Geneva, Switzerland, 2009. [Google Scholar]
- UNECE. UNECE Committee on Environmental Policy: Second Environmental Performance Review of Uzbekistan; United Nations Economic Commission for Europe: Geneva, Switzerland, 2010. [Google Scholar]
- Humphrey, P.; Sevcik, M. Uranium tailings in Central Asia: The case of the Kyrgyz Republic. 2009. Available online: https://www.nti.org/analysis/articles/uranium-tailings-kyrgyz-republic/ (accessed on 18 January 2021).
- Zhunussova, T.; Sneve, M.; Liland, A. Radioactive waste management in Central Asia-12034. In Proceedings of the Waste Management 2012 Conference, Phoenix, AZ, USA, 26 February–1 March 2012. [Google Scholar]
- Waggitt, P.W. Safe Management of Residues from Former Uranium Mining and Milling Activities in Central Asian IAEA Regional Technical Cooperation Project. In Nuclear Risks in Central Asia; Salbu, B., Skipperud, L., Eds.; Springer: Dordrecht, The Netherlands, 2008; pp. 61–68. [Google Scholar]
- UNECE. UNECE Water-Food-Energy-Ecosystem Nexus, Reconciling Different Uses of Water-Work on the Nexus in Transboundary Basins; United Nations Economic Commission for Europe: Geneva, Switzerland, 2014. [Google Scholar]
- Sevcik, M. Uranium Tailings in Kyrgyzstan: Catalyst for cooperation and confidence building? Nonprolif. Rev. 2003, 10, 147–154. [Google Scholar] [CrossRef]
- Veenema, T.G. Disaster Nursing and Emergency Preparedness for Chemical, Biological, and Radiological Terrorism and Other Hazards; Springer Publishing Company: Berlin, Germany, 2018. [Google Scholar]
- Knightes, C.D.; Ambrose, R.B., Jr.; Avant, B.; Han, Y.; Acrey, B.; Bouchard, D.C.; Zepp, R.; Wool, T. Modeling framework for simulating concentrations of solute chemicals, nanoparticles, and solids in surface waters and sediments: WASP8 advanced toxicant module. Environ. Model. Softw. 2019, 111, 444–458. [Google Scholar] [CrossRef]
- Halaj, P.; Velísková, Y.; Sokáč, M.; Bárek, V.; Fuska, J. Modeling of contaminant dispersion in streams-1d versus 2d model use comparison: Case study on the Ondava river. J. Int. Sci. Publ. Ecol. Saf. 2014, 8, 393–399. [Google Scholar]
- Nistoran, D.G.; Ionescu, C.; Pătru, G.; Armaş, I.; Omrani, Ş.G. One dimensional sediment transport model to assess channel changes along Olteniţa-Călăraşi reach of Danube River, Romania. Energy Procedia 2017, 112, 67–74. [Google Scholar] [CrossRef]
- Dasallas, L.; Kim, Y.; An, H. Case study of HEC-RAS 1D–2D coupling simulation: 2002 Baeksan flood event in Korea. Water 2019, 11, 2048. [Google Scholar] [CrossRef] [Green Version]
- Brunner, G.W. HEC-RAS River Analysis System (Version 5.0.7); US Army Corps of Engineers, Institute of Water Resources, Hydrologic Engineering Center: Davis, CA, USA, 2016. [Google Scholar]
- Mirauda, D.; Vincenzo, A.D.; Pannone, M. Simplified entropic model for the evaluation of suspended load concentration. Water 2018, 10, 378. [Google Scholar] [CrossRef] [Green Version]
- Rinas, M.; Fricke, A.; Tränckner, J.; Frischmuth, K.; Koegst, T. Sediment transport in sewage pressure pipes, part ii: 1 D numerical simulation. Water 2020, 12, 282. [Google Scholar] [CrossRef] [Green Version]
- Vandenhove, H.; Quarch, H.; Clerc, J.J.; Lejeune, J.M.; Sweeck, L.; Sillen, X.; Mallants, D.; Zeevaert, T. Remediation of Uranium Mining and Milling Tailing in Mailuu-Suu District of Kyrgyzstan. In Final Report in Frame of EC-TACIS Project N° SCRE1/N°38; Belgian Nuclear Research Centre, SCK-CEN: Mol, Belgium, 2003; pp. 1–25. [Google Scholar]
- Kunze, C.; Hummrich, H. Final Report of Project No. 03G0879A; Leibniz Information Centre for Science and Technology and University Library: Hanover, Germany, 2020. [Google Scholar]
- Kalka, H.; Krause, J.; Richter, C. Radionuclide Transport in Mailuu-Suu River (Kyrgyzstan); UIT GmbH: Dresden, Germany, 2017. [Google Scholar]
- Torgoev, A.; Havenith, H.-B. 2D dynamic studies combined with the surface curvature analysis to predict Arias Intensity amplification. J. Seism. 2016, 20, 711–731. [Google Scholar] [CrossRef] [Green Version]
- Sherman, S.I.; Jin, M.; Gorbunova, E.A. Recent strong earthquakes and seismotectonics in Central Asia. Geodyn. Tectonophys. 2015, 6, 409–436. [Google Scholar] [CrossRef] [Green Version]
- Vandenhove, H.; Sweeck, L.; Mallants, D.; Vanmarcke, H.; Aitkulov, A.; Sadyrov, O.; Savosin, M.; Tolongutov, B.; Mirzachev, M.; Clerc, J.J.; et al. Assessment of radiation exposure in the uranium mining and milling area of Mailuu Suu, Kyrgyzstan. J. Environ. Radioact. 2006, 88, 118–139. [Google Scholar] [CrossRef]
- Aleshin, Y.; Torgoev, I. Slope Dynamic Geomorphology of the Mailuu-Suu Area, Aspects of Long-Term Prediction. In Landslide Science for a Safer Geo-Environment; Sassa, K., Ed.; Springer International Publishing: Cham, Switzerland, 2014; pp. 339–343. [Google Scholar]
- Torgoev, A. Assessment of landslide hazard in the environmental hotspot areas of the Kyrgyz Tien-Shan: Spatial analysis and Numeric modelling. Ph.D. Thesis, University of Liège, Liège, Belgium, 2016. [Google Scholar]
- SAEPBW. Hydraulics of Near-Natural Flowing Waters; Part 1-Fundamentals and empirical hydraulic calculation methods; State Authority for Environmental Protection of Baden-Württemberg, Germany: Karlsruhe, Germany, 2002. [Google Scholar]
- Vandenhove, H.; Quarch, H.; Clerc, J.J.; Lejeune, J.M.; Sweeck, L.; Sillen, X.; Mallants, D.; Zeevaert, T. Final Report in Frame of EC-TACIS Project No. SCRE1/No. 38 Remediation of Uranium Mining and Milling Tailing in Mailuu Suu District Kyrgyzstan, R-3721; SCK CEN: Mol, Belgium, 2004. [Google Scholar]
- Kunze, C.; Hummrich, H. Mission Report EVT1903640 Agency Mission to Conduct Joint Environmental Sampling Campaigns near Izboskan Uranium Legacy Site in Uzbekistan and Lab Analyses in Tashkent; International Atomic Engery Agency (IAEA): Vienna, Austria, 2020. [Google Scholar]
- Passell, H.; Barber, D.; Betsill, D.; Littlefield, A.; Matthews, R.; Mohagheghi, A.; Shanks, S.; Yuldashev, B.; Salikhbaev, U.; Radyuk, R.; et al. The Navruz Project: Transboundary Monitoring for Radionuclides and Metals in Central Asian Rivers Data Report. Available online: https://www.osti.gov/biblio/1342771 (accessed on 13 February 2021).
- Velísková, Y.; Halaj, P.; Sokáč, M.; Bárek, V. Pollution spread analysis in the Malá Nitra river by using of 1-D model. Acta Hortic. Reg. 2014, 17, 38–42. [Google Scholar] [CrossRef] [Green Version]
- Guzzetti, F.; Reichenbach, P.; Ardizzone, F.; Cardinali, M.; Galli, M. Estimating the quality of landslide susceptibility models. Geomorphology 2006, 81, 166–184. [Google Scholar] [CrossRef]
- Reichenbach, P.; Rossi, M.; Malamud, B.D.; Mihir, M.; Guzzetti, F. A review of statistically-based landslide susceptibility models. Earth-Sci. Rev. 2018, 180, 60–91. [Google Scholar] [CrossRef]
- Schwab, M.; Rieke-Zapp, D.; Schneider, H.; Liniger, M.; Schlunegger, F. Landsliding and sediment flux in the Central Swiss Alps: A photogrammetric study of the Schimbrig landslide, Entlebuch. Geomorphology 2008, 97, 392–406. [Google Scholar] [CrossRef]
- Aristizábal, E.; Martínez-Carvajal, H.; García-Aristizábal, E. Modelling Shallow Landslides Triggered by Rainfall in Tropical and Mountainous Basins. In Advancing Culture of Living with Landslides; Mikoš, M., Casagli, N., Yin, Y., Sassa, K., Eds.; Springer International Publishing: New York, NY, USA, 2017; pp. 207–212. [Google Scholar]
- Gariano, S.L.; Guzzetti, F. Landslides in a changing climate. Earth-Sci. Rev. 2016, 162, 227–252. [Google Scholar] [CrossRef] [Green Version]
- Conesa-García, C.; Puig-Mengual, C.; Riquelme, A.; Tomás, R.; Martínez-Capel, F.; García-Lorenzo, R.; Pastor, J.L.; Pérez-Cutillas, P.; Cano Gonzalez, M. Combining SfM photogrammetry and terrestrial laser scanning to assess event-scale sediment budgets along a gravel-bed ephemeral stream. Remote Sens. 2020, 12, 3624. [Google Scholar] [CrossRef]
- Khaled, G.; Bourouina-Bacha, S.; Sabiri, N.-E.; Tighzert, H.; Kechroud, N.; Bourouina, M. Simplified correlations of axial dispersion coefficient and porosity in a solid-liquid fluidized bed adsorber. Exp. Therm. Fluid Sci. 2017, 88, 317–325. [Google Scholar] [CrossRef]
- Peng, H.; Fok, H.S.; Gong, J.; Wang, L. Improving stage–discharge relation in the Mekong River Estuary by remotely sensed long-period ocean tides. Remote Sens. 2020, 12, 3648. [Google Scholar] [CrossRef]
- Paul, M.J.; Hall, R.O. Particle transport and transient storage along a stream-size gradient in the Hubbard Brook Experimental Forest. J. N. Am. Benthol. Soc. 2002, 21, 195–205. [Google Scholar] [CrossRef]
- Kirsch, C.K.S. Quantitative Hydraulic Dam Failure Analysis and Flood Risk Maps in Mailuu-Suu Catchment Area. Master’s Thesis, Magdeburg-Stendal University of Applied Sciences, Magdeburg, Germany, 2020. [Google Scholar]
- Ries, J.B. The landslide in the Surma Khola Valley, high mountain region of the Central Himalaya in Nepal. Phys. Chem. Earth Part B 2000, 25, 51–57. [Google Scholar] [CrossRef]
- Ochiere, H.O.; Onyando, J.O.; Kamau, D.N. Simulation of sediment transport in the canal using the Hec-Ras (Hydrologic Engineering Centre-River Analysis System) in an underground canal in Southwest Kano irrigation scheme-Kenya. Int. J. Eng. Sci. Invent. 2015, 4, 15–31. [Google Scholar]
- Rosenbaum, L. An Autonomous Wireless Turbidity Sensor Network with On-Site Data Transmission Developed for Distributed Measurements along Rivers. Master’s Thesis, Chemnitz University of Technology, Chemnitz, Germany, 2021. [Google Scholar]


| Layer | Depth (m) | Cohesion (kPa) | Angle of Internal Friction (°) | Specific Gravity (kN/m3) | Ru Coefficient |
|---|---|---|---|---|---|
| L01 | 4.0 | 11.6 | 36.0 | 19.2 | 0.13 |
| L02 | 5.2 | 11.3 | 32.3 | 19.2 | 0.10 |
| L03 | 4.0 | 8.8 | 31.0 | 20.0 | 0.12 |
| L04 | 2.0 | 40.0 | 23.0 | 19.1 | 0.26 |
| L05 | 2.5 | - | - | 21.0 | 0.19 |
| L06 | 4.3 | 16.7 | 29.0 | 19.6 | 0.12 |
| Average | 3.7 | 17.7 | 30.3 | 19.7 | 0.15 |
| River Section | Distance (m) | Catchment Area (km2) | Elevation (m) | Slope (m/m) | Water Depth (m) | Water Width (m) | Channel Width (m) | Roughness (s/m1/3) | ||
|---|---|---|---|---|---|---|---|---|---|---|
| Left Bank | River Bed | Right Bank | ||||||||
| 38 km | 4000 | 379.5 | 1108.4 | 0.017 | 0.3 | 23.8 | 52.3 | 0.100 | 0.033 | 0.050 |
| 34 km | 2000 | 486.9 | 1039.4 | 0.017 | 0.3 | 27.5 | 60.5 | 0.063 | 0.033 | 0.062 |
| 32 km | 4000 | 530.0 | 1005.2 | 0.013 | 0.4 | 29.0 | 63.8 | 0.045 | 0.033 | 0.068 |
| 28 km | 4000 | 576.6 | 951.5 | 0.012 | 0.4 | 32.5 | 71.5 | 0.048 | 0.033 | 0.071 |
| 24 km | 2000 | 624.7 | 903.5 | 0.012 | 0.4 | 34.3 | 75.4 | 0.064 | 0.033 | 0.071 |
| 22 km | 4000 | 640.2 | 879.1 | 0.010 | 0.4 | 37.5 | 82.5 | 0.071 | 0.033 | 0.071 |
| 18 km | 4000 | 663.3 | 839.3 | 0.010 | 0.4 | 42.0 | 91.0 | 0.067 | 0.033 | 0.071 |
| 14 km | 2000 | 678.7 | 798.8 | 0.010 | 0.4 | 45.0 | 105.0 | 0.063 | 0.033 | 0.071 |
| 12 km | 4000 | 684.3 | 779.2 | 0.010 | 0.5 | 45.0 | 112.0 | 0.061 | 0.033 | 0.071 |
| 8 km | 2000 | 697.9 | 738.3 | 0.010 | 0.5 | 47.0 | 126.0 | 0.056 | 0.033 | 0.071 |
| 6 km | 2000 | 705.7 | 719.2 | 0.011 | 0.5 | 48.0 | 133.0 | 0.054 | 0.033 | 0.071 |
| 4 km | 4000 | 713.5 | 697.2 | 0.010 | 0.5 | 50.0 | 140.0 | 0.052 | 0.033 | 0.071 |
| 0 km | 0 | 721.9 | 656.9 | 0.000 | 0.5 | 51.0 | 156.4 | 0.071 | 0.033 | 0.071 |
| Year | Jan | Feb | Mar | Apr | May | Jun | Jul | Aug | Sep | Oct | Nov | Dec |
|---|---|---|---|---|---|---|---|---|---|---|---|---|
| 1965 | 2.5 | 2.5 | 3.5 | 8.4 | 10.8 | 6.4 | 4.2 | 3.3 | 3.2 | 5.0 | 10.9 | 5.5 |
| 1969 | 2.7 | 2.7 | 17.3 | 34.8 | 60.1 | 47.5 | 23.9 | 11.2 | 6.4 | 8.9 | 8.4 | 4.3 |
| 1980 | 2.5 | 2.5 | 4.8 | 24.7 | 24.7 | 16.7 | 8.0 | 4.5 | 3.6 | 3.2 | 3.3 | 3.4 |
| 1985 | 2.9 | 3.8 | 7.0 | 31.1 | 31.5 | 21.3 | 10.7 | 5.1 | 4.1 | 4.0 | 3.8 | 3.7 |
| 1986 | 2.5 | 2.5 | 2.8 | 9.2 | 14.2 | 11.7 | 8.0 | 4.9 | 3.6 | 4.6 | 3.6 | 4.3 |
| 1987 | 3.9 | 4.7 | 12.2 | 34.2 | 42.0 | 32.1 | 22.5 | 13.8 | 7.5 | 8.2 | 9.6 | 5.9 |
| 1988 | 6.2 | 5.0 | 8.1 | 24.7 | 47.2 | 37.5 | 17.5 | 7.4 | 5.3 | 4.8 | 4.5 | 3.5 |
| 1989 | 3.3 | 2.2 | 5.1 | 11.5 | 18.9 | 14.3 | 9.2 | 4.9 | 3.2 | 3.4 | 3.0 | 3.0 |
| 2009 | - | - | - | - | 37.6 | 30.0 | 16.5 | 9.2 | 6.4 | 4.8 | 4.9 | 4.0 |
| 2010 | 3.7 | 4.7 | 16.0 | 38.8 | 37.2 | 43.7 | 22.0 | 11.7 | 7.2 | 4.9 | 4.3 | 3.9 |
| 2011 | 3.4 | 3.5 | 6.0 | 17.0 | 21.9 | 12.5 | 6.4 | 4.4 | 3.8 | 4.5 | 8.6 | 8.0 |
| 2012 | 4.2 | 4.8 | 10.0 | 37.5 | 35.5 | 41.5 | 15.5 | 8.3 | 4.8 | 4.4 | 4.3 | 4.3 |
| 2013 | 4.6 | 5.4 | 18.5 | 25.0 | 29.7 | 26.0 | 8.0 | 3.8 | 6.2 | 5.3 | 4.5 | 4.4 |
| 2014 | 3.2 | 3.9 | 12.5 | 31.5 | 33.2 | 16.0 | 8.5 | 3.2 | 2.9 | 3.6 | 4.5 | 5.1 |
| 2015 | 5.0 | 8.0 | 16.5 | 38.5 | 44.1 | 23.0 | 11.2 | 5.6 | 5.0 | 7.2 | 9.3 | 7.7 |
| Average | 3.6 | 4.0 | 10.0 | 26.2 | 32.6 | 25.3 | 12.8 | 6.8 | 4.9 | 5.1 | 5.8 | 4.7 |
| Earthquake Scenario | Hydrological Scenario | Arriving at the Border (min) | Peak Value (min) | Complete Pass (min) |
|---|---|---|---|---|
| Destructive | MQ | 165 | 384 | 1044 |
| HQ | 87 | 183 | 438 | |
| Catastrophic | MQ | 159 | 384 | 1116 |
| HQ | 84 | 183 | 471 | |
| Difference | MQ | 6 | 0 | 72 |
| HQ | 3 | 0 | 33 |
Publisher’s Note: MDPI stays neutral with regard to jurisdictional claims in published maps and institutional affiliations. |
© 2021 by the authors. Licensee MDPI, Basel, Switzerland. This article is an open access article distributed under the terms and conditions of the Creative Commons Attribution (CC BY) license (http://creativecommons.org/licenses/by/4.0/).
Share and Cite
Li, F.; Torgoev, I.; Zaredinov, D.; Li, M.; Talipov, B.; Belousova, A.; Kunze, C.; Schneider, P. Landslide-Induced Mass Transport of Radionuclides along Transboundary Mailuu-Suu River Networks in Central Asia. Remote Sens. 2021, 13, 698. https://0-doi-org.brum.beds.ac.uk/10.3390/rs13040698
Li F, Torgoev I, Zaredinov D, Li M, Talipov B, Belousova A, Kunze C, Schneider P. Landslide-Induced Mass Transport of Radionuclides along Transboundary Mailuu-Suu River Networks in Central Asia. Remote Sensing. 2021; 13(4):698. https://0-doi-org.brum.beds.ac.uk/10.3390/rs13040698
Chicago/Turabian StyleLi, Fengqing, Isakbek Torgoev, Damir Zaredinov, Marina Li, Bekhzod Talipov, Anna Belousova, Christian Kunze, and Petra Schneider. 2021. "Landslide-Induced Mass Transport of Radionuclides along Transboundary Mailuu-Suu River Networks in Central Asia" Remote Sensing 13, no. 4: 698. https://0-doi-org.brum.beds.ac.uk/10.3390/rs13040698