Technical Note

Comparison of a Smartfin with an Infrared Sea Surface Temperature Radiometer in the Atlantic Ocean

by
Robert J. W. Brewin
1,2,*,
Werenfrid Wimmer
3,
Philip J. Bresnahan
4,5,
Tyler Cyronak
4,6,
Andreas J. Andersson
4 and
Giorgio Dall’Olmo
2,7
1
Centre for Geography and Environmental Science, College of Life and Environmental Sciences, Penryn Campus, University of Exeter, Cornwall TR10 9FE, UK
2
Plymouth Marine Laboratory, Plymouth, Devon PL1 3DH, UK
3
Ocean and Earth Science, Faculty of Environmental and Life Sciences, Waterfront Campus, University of Southampton, Southampton, Hampshire SO14 3ZH, UK
4
Scripps Institution of Oceanography, University of California, San Diego, CA 92037, USA
5
Department of Earth and Ocean Sciences, University of North Carolina Wilmington, Wilmington, NC 28403-5944, USA
6
Department of Marine and Environmental Sciences, Nova Southeastern University, Fort Lauderdale, FL 33314, USA
7
National Centre for Earth Observation, Plymouth Marine Laboratory, Plymouth, Devon PL1 3DH, UK
*
Author to whom correspondence should be addressed.
Submission received: 2 February 2021 / Revised: 16 February 2021 / Accepted: 18 February 2021 / Published: 24 February 2021
(This article belongs to the Special Issue Feature Paper Special Issue on Ocean Remote Sensing)

Abstract

:
The accuracy and precision of satellite sea surface temperature (SST) products in nearshore coastal waters are not well known, owing to a lack of in-situ data available for validation. It has been suggested that recreational watersports enthusiasts, who immerse themselves in nearshore coastal waters, be used as a platform to improve sampling and fill this gap. One tool that has been used worldwide by surfers is the Smartfin, which contains a temperature sensor integrated into a surfboard fin. If tools such as the Smartfin are to be considered for satellite validation work, they must be carefully evaluated against state-of-the-art techniques to quantify data quality. In this study, we developed a Simple Oceanographic floating Device (SOD), designed to float on the ocean surface, and deployed it during the 28th Atlantic Meridional Transect (AMT28) research cruise (September and October 2018). We attached a Smartfin to the underside of the SOD, which measured temperature at a depth of ∼0.1 m, in a manner consistent with how it collects data on a surfboard. Additional temperature sensors (an iButton and a TidbiT v2), shaded and positioned a depth of ∼1 m, were also attached to the SOD at some of the stations. Four laboratory comparisons of the SOD sensors (Smartfin, iButton and TidbiT v2) with an accurate temperature probe (±0.0043 K over a range of 273.15 to 323.15 K) were also conducted during the AMT28 voyage, over a temperature range of 290–309 K in a recirculating water bath. Mean differences ( δ ), referenced to the temperature probe, were removed from the iButton ( δ = 0.292 K) and a TidbiT v2 sensors ( δ = 0.089 K), but not from the Smartfin, as it was found to be in excellent agreement with the temperature probe ( δ = 0.005 K). The SOD was deployed for 20 min periods at 62 stations (predawn and noon) spanning 100 degrees latitude and a gradient in SST of 19 K. Simultaneous measurements of skin SST were collected using an Infrared Sea surface temperature Autonomous Radiometer (ISAR), a state-of-the-art instrument used for satellite validation. Additionally, we extracted simultaneous SST measurements, collected at slightly different depths, from an underway conductivity, temperature and depth (CTD) system. Over all 62 stations, the mean difference ( δ ) and mean absolute difference ( ϵ ) between Smartfin and the underway CTD were −0.01 and 0.06 K respectively (similar results obtained from comparisons between Smartfin and iButton and Smartfin and TidbiT v2), and the δ and ϵ between Smartfin and ISAR were 0.09 and 0.12 K respectively. In both comparisons, statistics varied between noon and predawn stations, with differences related to environmental variability (wind speed and sea-air temperature differences) and depth of sampling. Our results add confidence to the use of Smartfin as a citizen science tool for evaluating satellite SST data, and data collected using the SOD and ISAR were shown to be useful for quantifying near-surface temperature gradients.

Graphical Abstract

1. Introduction

The Global Climate Observing System classifies sea surface temperature (SST) as an Essential Climate Variable [1,2]. Temperature is a central property in oceanography and biogeochemistry [3], modulating the physical environment, through changes in water density [4], the biological environment, through its control of metabolic processes [5], and the chemical environment, influencing the reaction rates of elements and compounds [6,7]. SST plays an important role in the exchanges of heat and gases between the ocean and atmosphere [8,9], influencing regional and global weather and climate [10,11,12,13], and the ocean carbon cycle [14].
SST can be monitored operationally using thermal and microwave radiometers mounted on satellite platforms [15,16]. In fact, SST was one of the first ocean variables to be studied from Earth Observation satellites. The SST satellite data record is now over 50 years in length, and has been used in a wide range of applications [17]. To evaluate if satellite SST products are suitable for an application one needs to understand the accuracy and precision of the data. This is often determined by direct comparison of satellite data with concomitant and co-located in-situ data. Various in-situ measurements are used for SST validation, including drifting buoys, moored buoys, ships and Argo floats [17]. However, many of these systems measure SST in depths below the skin layer that is seen by satellite radiometers. Temperature gradients in the very upper ocean are known to occur [18,19] and need to be corrected for when comparing SST measurements collected at slightly different depths. To avoid these issues, well-calibrated ship-based infrared radiometers have been developed specifically for satellite validation purposes, and are considered the standard tools for collecting Fiducial Reference Measurements (FRM) of SST [20], with SI traceability that follow the guidelines outlined by the Quality Assurance framework for Earth Observation. Three operational shipboard radiometers, used for the validation of satellite derived skin SST, are the Marine-Atmospheric Emitted Radiance Interferometer (M-AERI) [21], the Scanning Infrared Sea surface Temperature Radiometer (SISTeR) [22], and the Infrared SST Autonomous Radiometer (ISAR) [23], with the ISAR being used most commonly for operational purposes (18 currently in use).
Owing to a large network of in-situ instruments, there are considerable numbers of co-incident in-situ and satellite SST measurements in the open ocean [24,25]. Consequently, we have a good understanding of the accuracy and precision in SST retrievals in open ocean environments. In nearshore coastal regions, however, the story is different. Impeded by a lack of in-situ data, owing partly to challenges deploying oceanographic kit in dynamic, energetic nearshore regions, few validation studies have been conducted [26,27]. Validation in nearshore regions is made more difficult by complexities inherent in the retrieval of satellite SST data, such as: land contamination; complex coastal aerosol composition; the heterogeneity of SST at the coastline in space and time; and nearshore ocean turbulence [27,28,29]. New solutions are required to improve in-situ sampling coverage of SST measurements in nearshore regions, to help quantify the accuracy and precision of current satellite SST products, and if necessary, develop new algorithms.
Citizen science involves mobilizing citizens to help collect scientific data. It can promote public understanding of science and can address costly and laborious research, providing it is appropriately constructed and managed [30]. When considering the costs of oceanographic sampling, citizen science has latent capacity in coastal oceanography [31]. Recently, it has been demonstrated that there is potential to use recreational watersports enthusiasts, who regularly immerse themselves or their sports equipment in nearshore coastal waters, to improve the spatial resolution, distribution and frequency of sampling [32]. One example of this, has been through the use of surfers [27,33,34]. A surfboard fin (Smartfin) has recently been developed capable of recording temperature, motion, and geo-location, with wireless data transfer and charging capabilities [34]. The Smartfin is now being used worldwide by surfers, with the potential to drastically increase the spatial and temporal coverage of nearshore SST data collected in situ, which could be useful for satellite SST validation [27]. To motivate the remote-sensing community to use data collected by Smartfin surfers, Smartfin data needs to be carefully evaluated against state-of-the-art sensors, so that uncertainties in measurements can be quantified. Initial comparison work in the laboratory [34] and nearshore [35] has indicated the Smartfin can collect high-quality measurements, with uncertainties in temperature readings around 0.05 K, well below target accuracy requirements for satellite thermal sensors in coastal waters (<0.5 K; [36]). However, to date the Smartfin has not been compared with shipboard radiometers, the gold standard (FRM) for the validation of satellite derived SST, or other state-of-the art temperature instruments used on oceanography research vessels.
In this study, we exploited an opportunity on the 28th Atlantic Meridional Transect cruise to compare Smartfin data with continuous SST measurements collected using an ISAR and underway conductivity, temperature and depth (CTD) system, over 100 degrees of latitude (∼11,000 km) and a 19 K range in SST, as part of the European Space Agency (ESA) AMT4OceanSatFlux project. Differences between sensors were quantified, and analyzed in the context of environmental variability and depth of sampling, to assess the Smartfin as a tool for satellite SST validation, acknowledging the need to repeat this type of work in the future in nearshore coastal waters.

2. Materials and Methods

2.1. Research Cruise

Experiments were conducted on board the RRS James Clark Ross on the 28th Atlantic Meridional Transect (AMT28). The cruise departed from the UK on the 23rd of September 2018 and arrived in the Falklands on the 30th of October 2018, covering a meridional transect from approximately 50 N to 50 S, and an SST range from 283 to 302 K (Figure 1c).

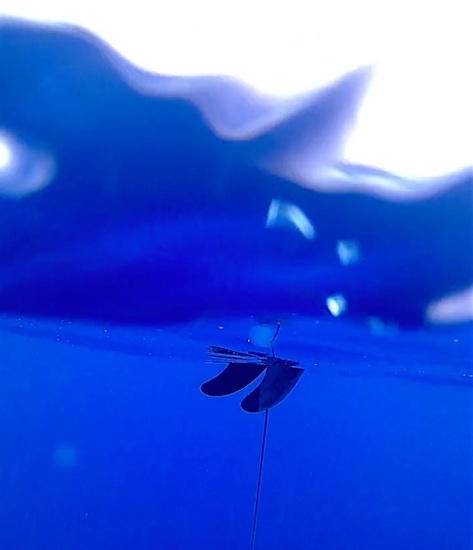
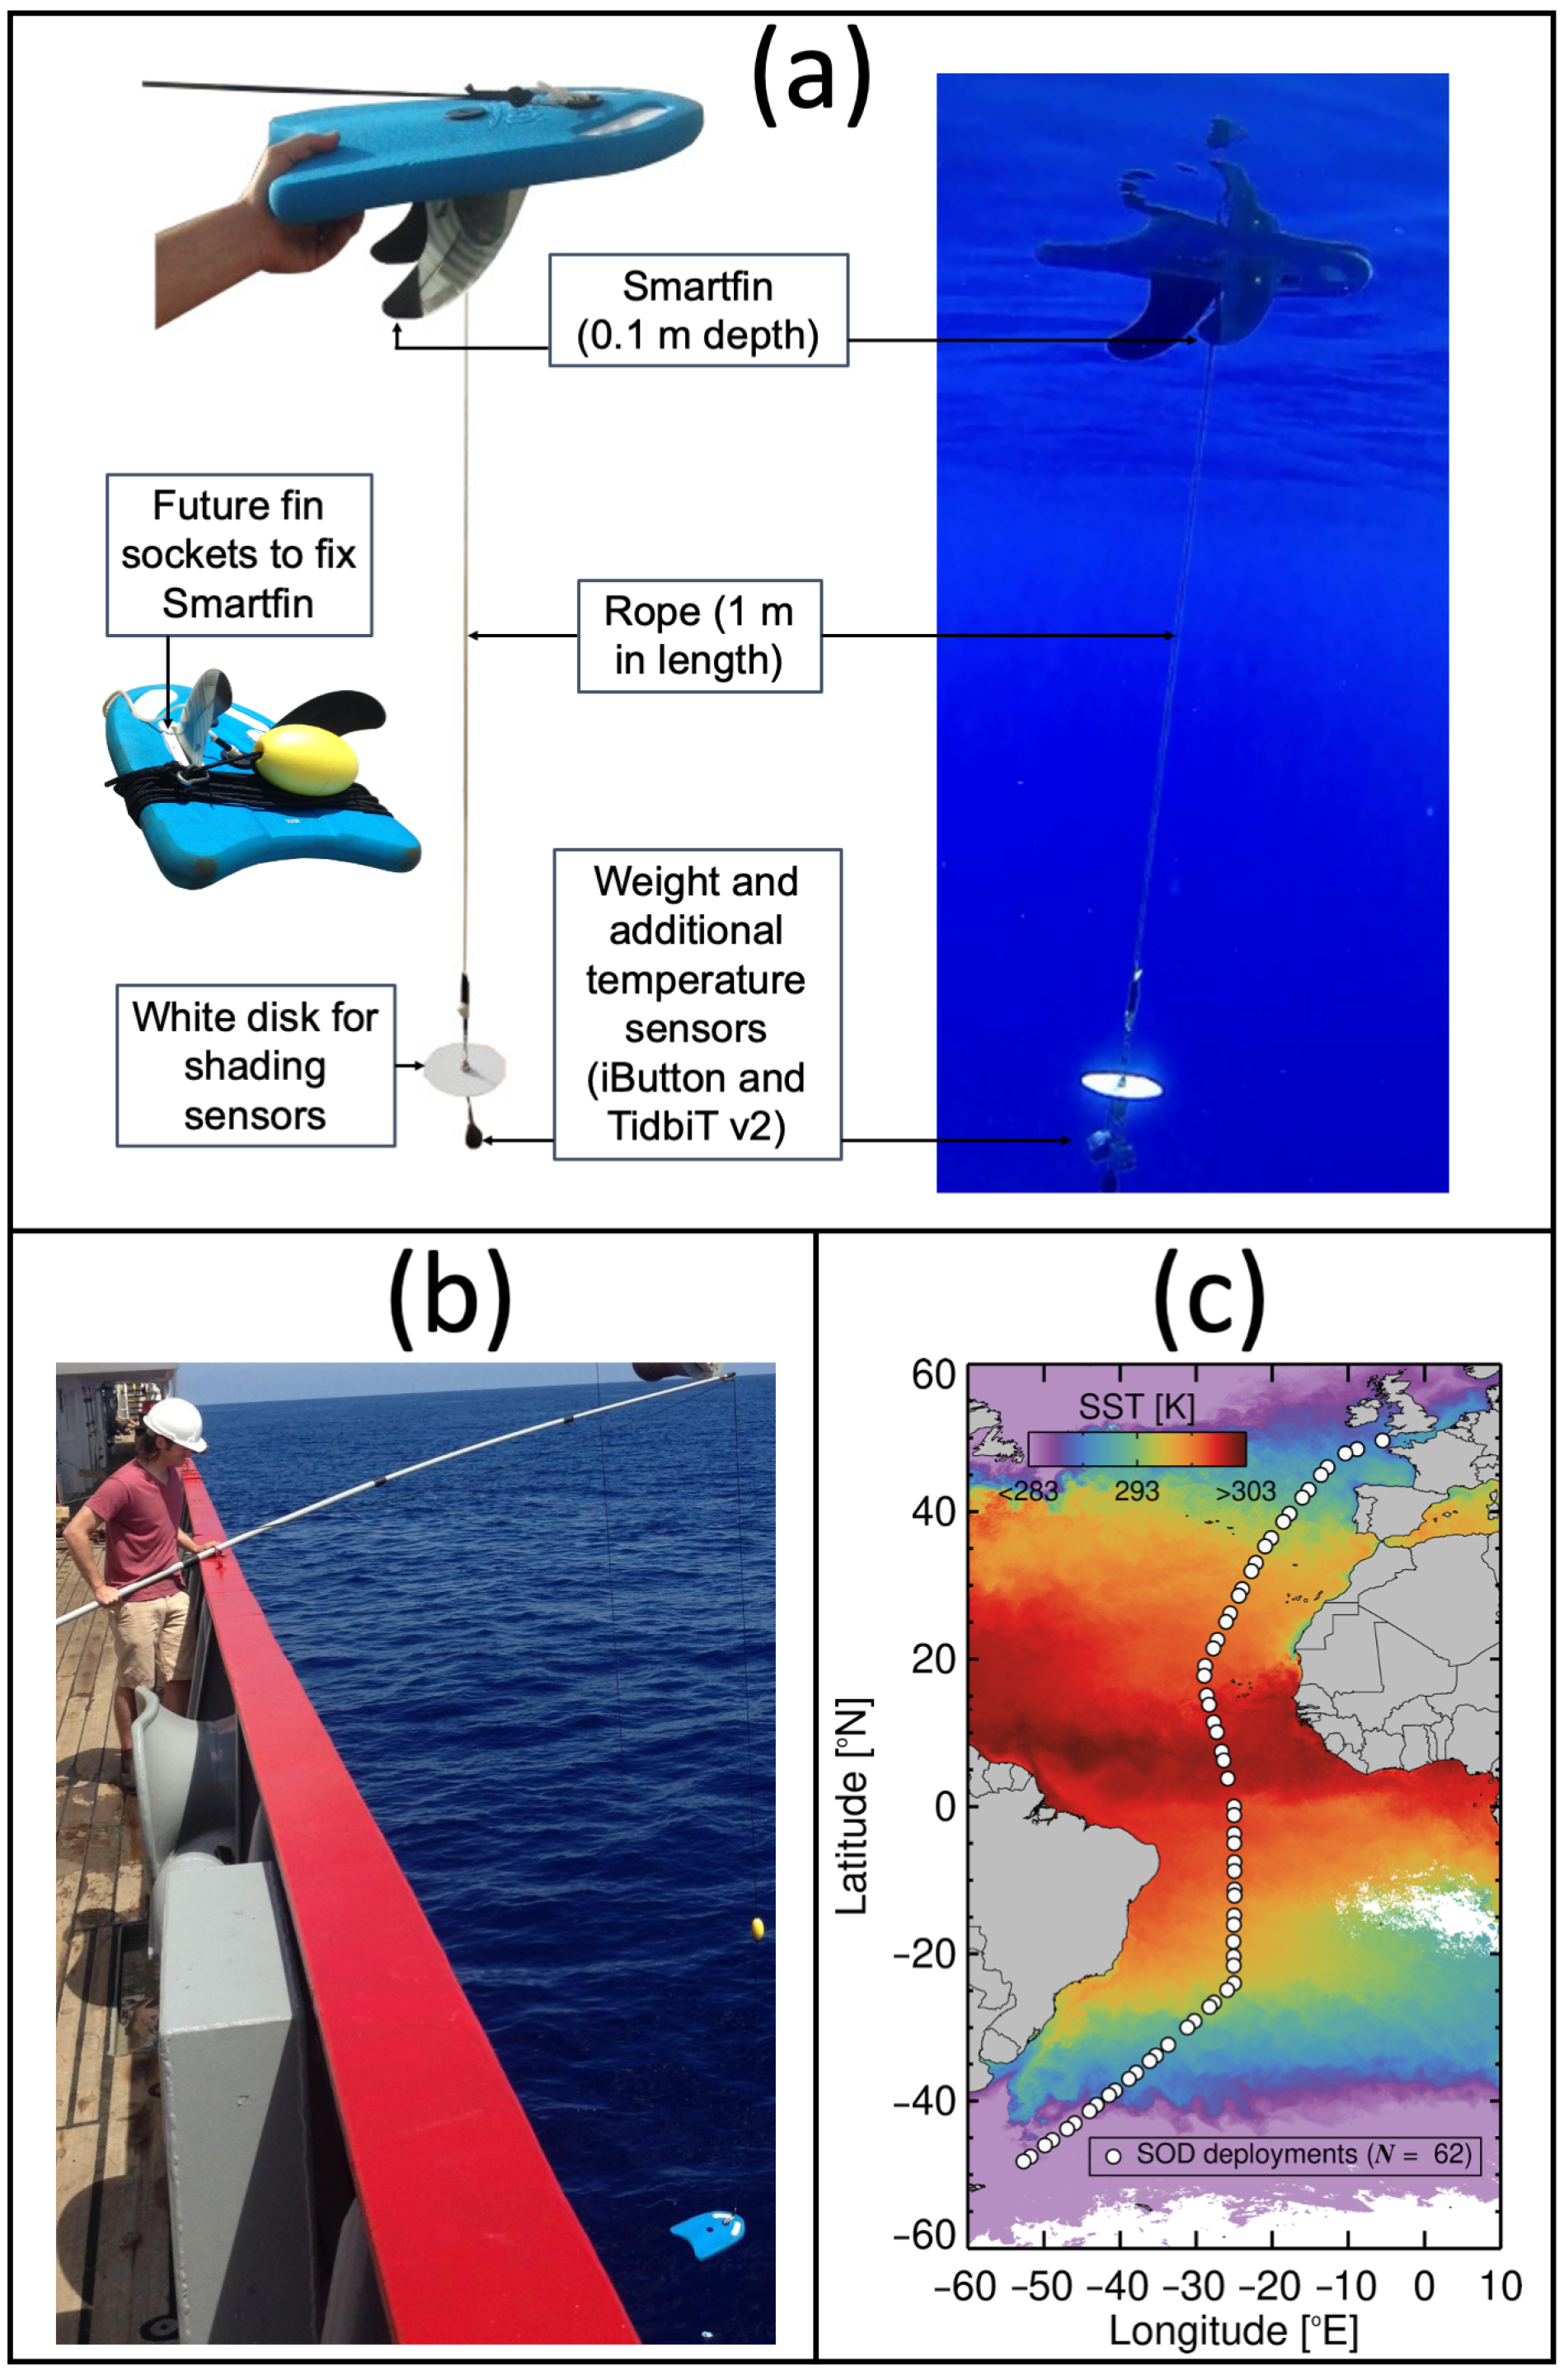
2.2. The Simple Oceanographic Floating Device (SOD)

The Simple Oceanographic floating Device (SOD) is a swimming float that has been modified to incorporate Future Fin sockets (for attaching surfboard fins), positioned in a similar manner to how they are on a surfboard, and two bodyboard plugs for attaching rope to either side of the float (see Figure 1a). On the underside of the SOD, a 1 m rope was attached to a bodyboard plug. Weights were placed to steady the device when in use at the end of the 1 m rope (Figure 1a). On the topside of the SOD, a 10 m rope was attached for lowering the float into the water.
Two surfboard fins were attached to the Future Fin sockets on the underside of the SOD. One of the fins was a Smartfin (https://smartfin.org/ accessed on 1 February 2021; [34]), designed to record water temperature (at 0.1 m depth), GPS and motion, the other an ordinary surfboard fin. The Smartfin is the size of a standard surfboard fin (∼0.11 m at its widest point, ∼0.13 m height and ∼0.005 m thick). The Smartfin records temperature continuously at 1/6 Hz using two different sensors, one within the body (motherboard) of the Smartfin (internal), the other placed on the tip of the fin (external). The external temperature sensor is a MAX31725 temperature circuit (see [34] for technical details) and was used in the study, as it has a quicker response and a higher precision and resolution than the internal sensor (e.g., see [35]). When submerged, the sensible part of the external temperature sensor is located at 0.1 m depth. Before being distributed to surfers, Smartfins were calibrated to a Seabird MicroCAT (with an accuracy of 0.002 K in the range 268.15 to 308.15 K). The calibration bath used was a 75 L insulated cooler filled with seawater, the temperature of which was controlled by a Thermo Scientific NESLAB RTE7 circulating bath/chiller with freshwater running countercurrent to the seawater in a corrugated plate heat exchanger. During the period of calibration—that is, when the Smartfin and MicroCAT are simultaneously recording temperatures (a 5-min period)—the bath was stable to 0.005 K across the full temperature range. The calibration used linear regression of data at 5 K intervals over a 283.5 to 303.15 K temperature range, and was carried out on the 12th of April 2017. The calibration resulted in an adjustment of −0.009 K to the external Smartfin sensor at 293.15 K. The Smartfin used in this study had been surfed 74 times after this calibration and before AMT28, and the version had Bluetooth capabilities allowing the transfer of data onto a mobile phone equipped with the Smartfin app. Data can then be transferred onto the Smartfin data server.
For the first half of the cruise, two miniature temperature sensors were attached to the end of the 1 m rope (to the weights) to measure water temperature at ∼1 m, with a white disk used to shelter the sensors from sunlight. Sensors were placed at ∼1 m, so as to collect temperature data at an intermediate depth (on a log-scale) between the Smartfin (at ∼0.1 m) and the ships underway CTD (at ∼5.0 m). One sensor was an iButton temperature logger (DS1922L Thermochron D/logger), housed in a Thermochron waterproof capsule (DS9107) and the other a TidbiT v2 temperature logger. On very hot sunny days, these sensors were also covered with aluminum foil to minimize any additional heating from sunlight. Unfortunately, just south of the equator, the aluminum foil attracted a pelagic fish (possibly a shark) and the TidbiT v2 and iButton sensors were lost and not recovered. Subsequent SOD deployments were made without these sensors.
The Smartfin was charged and all sensors were launched prior to each deployment. The SOD was lowered into the water from the starboard side of the RRS James Clark Ross using a 10 m rope. At stations where the currents were pushing the SOD into the side of the ship, a telescopic rod was used to extend the rope further away from the ship (see Figure 1b). The SOD was operated for approximately 20 min at each station, for both predawn and noon stations. Once recovered, the data were downloaded onto a laptop and backed-up on the ships hard drive. 1-Wire iButton software was used to launch and to upload temperature data from the iButton, and HOBOware software and a HOBO USB Optic Base Station (BASE-U-4) were used to launch and to upload temperature data from the TidbiT v2 logger. Thanks to help from both the RRS James Clark Ross IT technician and the AME technician, the Smartfin data were transferred daily from the mobile phone onto the Smartfin server, through use of a dongle (Ethernet port in the phone) that allowed access to the Internet from the phone and subsequent use of the Smartfin app. All temperature data were converted to Kelvin (K), an SI unit for temperature.
All stations were sampled, with only one station that yielded unsatisfactory data (data removed), owing to high gusting winds (∼15 m s 1 ) lifting the SOD into the air. For subsequent deployments in high winds, increased weight was added to the 1 m rope and the SOD found to operate reasonably. In total, data from 62 stations were used (Figure 1c). A video of a SOD deployment is provided as Supplementary data.

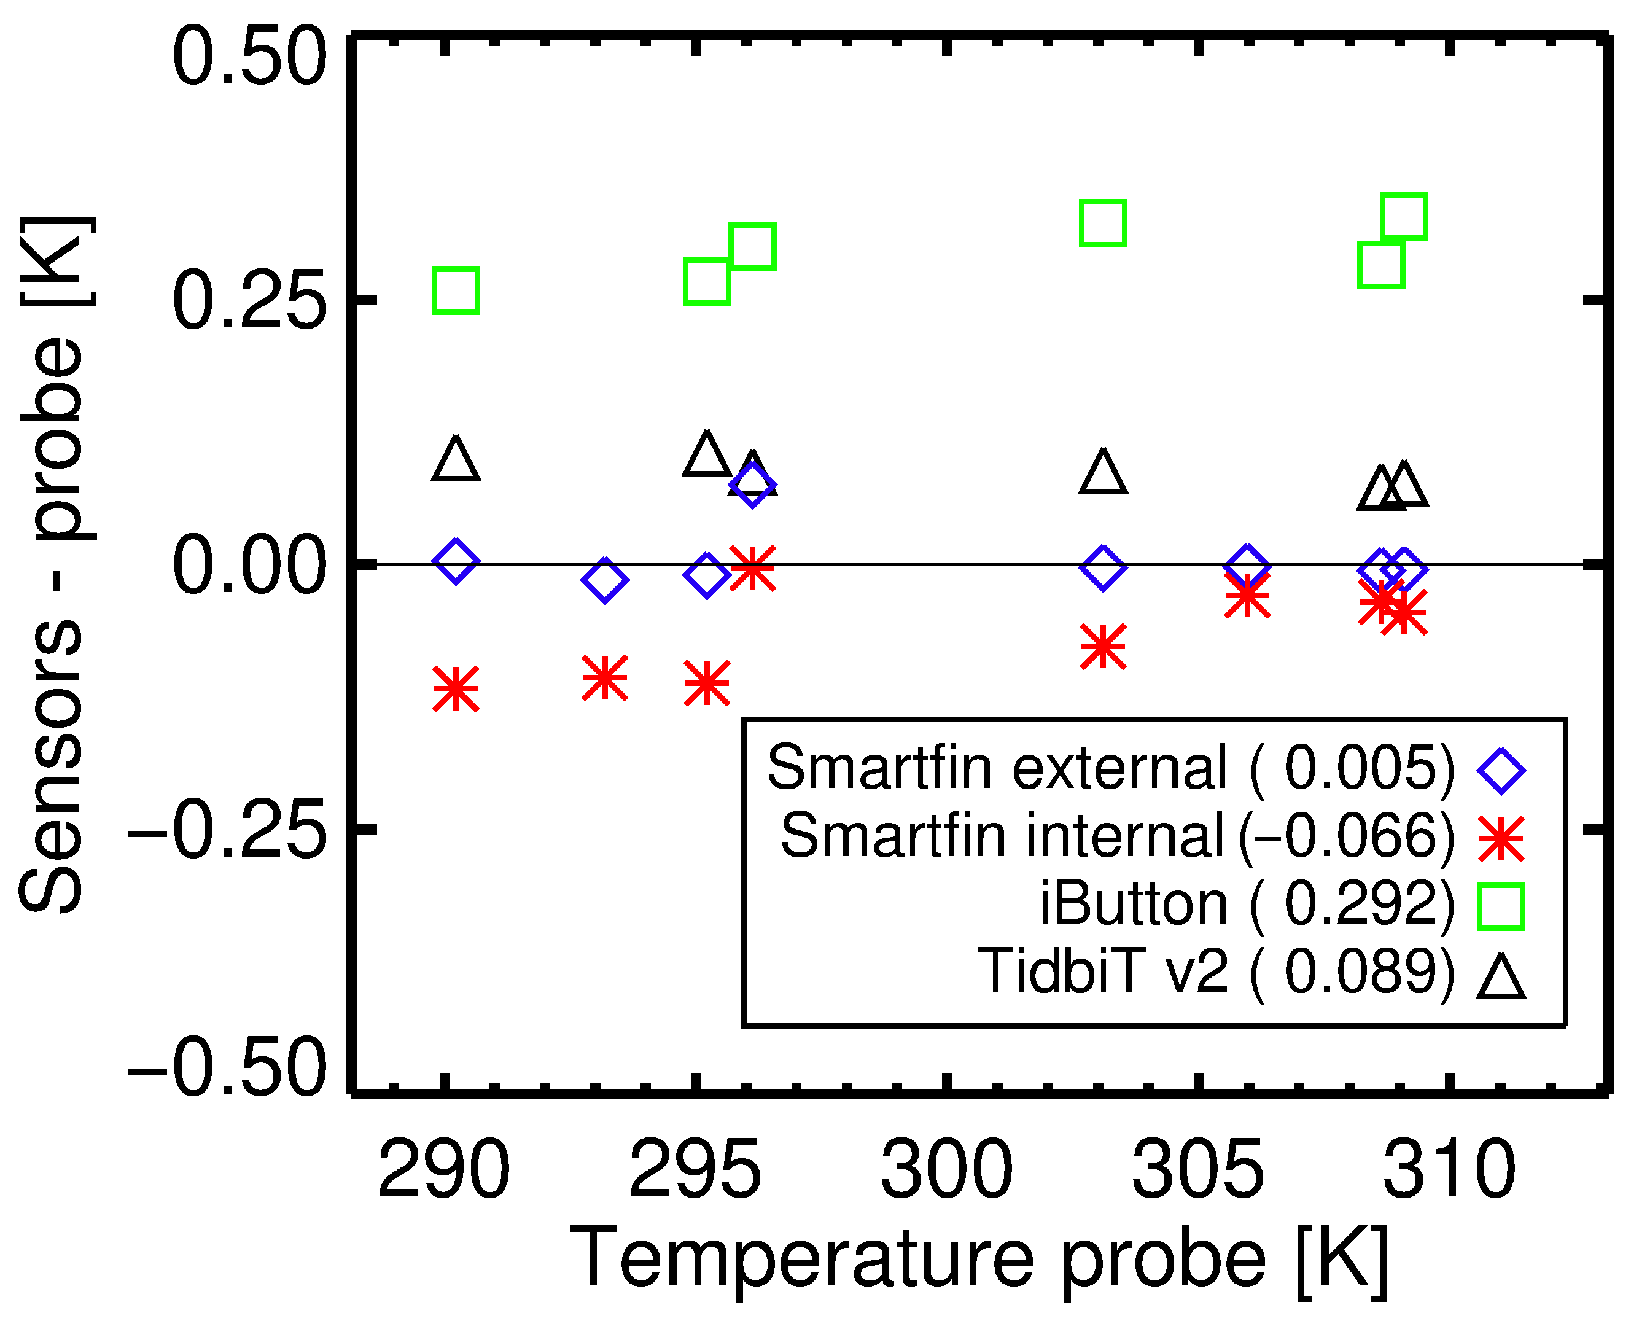
2.3. SOD Sensors Calibrations

The sensors used on the SOD (Smartfin, iButton and TidbiT v2) were compared in the laboratory on AMT28 against a NIST-traceable (and NPL-traceable) Hart Scientific 1504 temperature bridge and Themometrics ES 225 temperature probe (accurate to ±0.0043 K over a range of 273.15 to 323.15 K) at two contrasting temperatures (a two-point calibration) in a recirculating water bath [38,39,40], with one at ambient temperature and one ∼10 K above ambient. These comparisons were conducted three times for the iButton and TidbiT v2 sensors (before they were lost, on the 29th of September, 3rd of October and 11th of October) and four times for the Smartfin (additional calibration on the 14th October), over a temperature range of 290–309 K. Once all sensors had stabilized, mean temperature values were extracted from each of the sensors and the probe, at each of the temperature ranges.

2.4. Infrared SST Autonomous Radiometer (ISAR)

An Infrared SST Autonomous Radiometer (ISAR, version 003) [23] was mounted on the port side of the ship’s foremast at a 45-degree angle relative to the ship’s center line, continuously measuring SST skin data. The data were logged using a data logger connected to the ship’s network. Calibrated post-cruise SST skin data, following standard ISAR processing and calibration methods [23], were extracted over the duration of each 20 min SOD deployment. Though the ISAR operated well during the cruise, it did suffer from intermittent reboot errors towards the end of the cruise due to an issue with the on-board flash card. Also, at some stations, the ISAR shutter was closed because of sea spray and rain. ISAR data were available for 57 of the 62 SOD stations.

2.5. Ship SST and Auxiliary Underway Datasets

Continuous underway SST data, at a nominal depth of around 5 m, were collected with a Seabird SBE38 over the duration of the AMT28 cruise. Continuous wind speed measurements were collected using a Gill Windmaster mounted on the foremast of the ship to be free of obstruction. The wind speed data were logged with the same logger as the ISAR data. Continuous measurements of air temperature (using a Rotronic Hygroclip 2 located on the ship’s foremast) and Photosynthetically Available Radiation (PAR, using a Kipp & Zonen PQS-1 located on the ship’s foremast) were also extracted from the ship’s data logger. At two stations (15 and 16), to illustrate vertical gradients in temperature in the upper 200 m, we also extracted temperature measurements from the ships vertical profiling conductivity, temperature and depth (CTD) system that housed a Seabirds SBE3plus sensor.

2.6. Data Processing

At each station, data were extracted for all sensors over the time periods when the SOD was deployed (start) and recovered (end). As the Smartfin, iButton and TidbiT v2 sensors have different temperature response times, data were extracted only after the sensors had responded to the sea temperature and having removed the last minute of the data collection (to avoid any issues that may have occurred when recovering the SOD). The response times were determined to be at 2 min after deployment for the Smartfin, 7.5 min for the housed iButton, and 9 min for the TidbiT v2. These were determined from analyzing the time-series of data during each deployment, and were on the conservative side (to ensure the sensors had stabilized), and therefore longer than the true response times of the sensors. Having extracted the data, median values and robust standard deviations (not sensitive to outliers) were computed for all measurements collected during the SOD deployments, providing a single value for each station. This dataset is freely available through the British Oceanographic Data Centre [41].

2.7. Statistical Tests

Temperature data were compared using the mean difference (bias) ( δ ) and the mean absolute difference ( ϵ ). The mean difference ( δ ) was computed as
δ = 1 N i = 1 N X i M 1 X i M 2 ,
where X is the variable (SST) and N is the number of stations. The superscript M 1 denotes one measured variable (e.g., SST from Smartfin) and M 2 another measured variable (e.g., SST from the ISAR). Similarly, the mean absolute deviation was computed as
ϵ = 1 N i = 1 N X i M 1 X i M 2 .

3. Results and Discussion

3.1. Laboratory Comparisons

Figure 2 shows the results from the laboratory comparison of the temperature sensors (Smartfin, iButton and TidbiT v2) used on the SOD with an NPL-traceable Hart Scientific 1504 temperature bridge and Themometrics ES 225 temperature probe in a recirculating water bath [38]. The Themometrics ES 225 temperature probe is accurate to ±0.0043 K over a range of 273.15 to 323.15 K. Systematic differences between the probe and the TidbiT v2 and iButton sensors were observed ( δ = 0.089 and δ = 0.292 , respectively). Note for the iButton, Brewin et al. [40] previously reported a median (not mean as used here) difference of 0.283 K for these experiments. These differences were within the accuracies stated by the sensor manufacturers, with the TidbiT v2 sensors accurate to 0.2 K over a range of 273.15 to 323.15 K, and the iButton 0.5 K over a range of 263.15 to 333.15 K. The differences between the TidbiT v2 sensor and the Themometrics ES 225 temperature probe ( δ = 0.089 ) were also consistent with similar laboratory tests of the TidbiT v2 sensors in other studies [27,35], for example, Brewin et al. [27] reported differences ( δ ) of 0.04 to 0.15 K for five TidbiT v2 sensors. The differences between the probe and the TidbiT v2 and iButton sensors ( δ = 0.089 and δ = 0.292 , Figure 2) were relatively systematic over the temperature range tested (Figure 2), and consequently, were removed from all data collected using these sensors in subsequent analysis.
The Smartfin external sensor was found to be in excellent agreement with the Themometrics ES 225 temperature probe ( δ = 0.005 ), with differences close to the accuracy of the probe itself (±0.0043 K). Differences were relatively constant over the temperature range tested (Figure 2). Considering the initial calibration of the Smartfin was 18 months prior to AMT28 (and the Smartfin had been surfed 74 times), this close agreement with the Themometrics ES 225 temperature probe demonstrates the calibrated MAX31725 temperature circuit used on the Smartfin is stable and accurate. As differences between probe and external Smartfin sensor were so small, no subsequent corrections were made to the Smartfin data collected by the SOD. By comparison, we also evaluated the data from the internal temperature sensor on the Smartfin (not used in subsequent analysis), and observed larger systematic differences ( δ = 0.066 ) when compared with the external sensor, comparable in magnitude with the TidbiT v2 but negative (Figure 2). This further supported our selection of the external temperature sensor on the Smartfin.
Despite the excellent agreement with the Smartfin and Themometrics ES temperature probe, a question remains on whether the results from one Smartfin can be generalized to all Smartfins. Additional tests are needed to fully address this question. Nonetheless, some confidence can be gained from independent comparisons of multiple Smartfins in laboratory, which has suggested biases between fins of less than 0.05 K [35]. The Smartfin used in this study was one of a batch that were calibrated consistently, as described in Section 2.2. The continuity in calibration method is likely pivotal to maintaining high accuracy in Smartfin data.

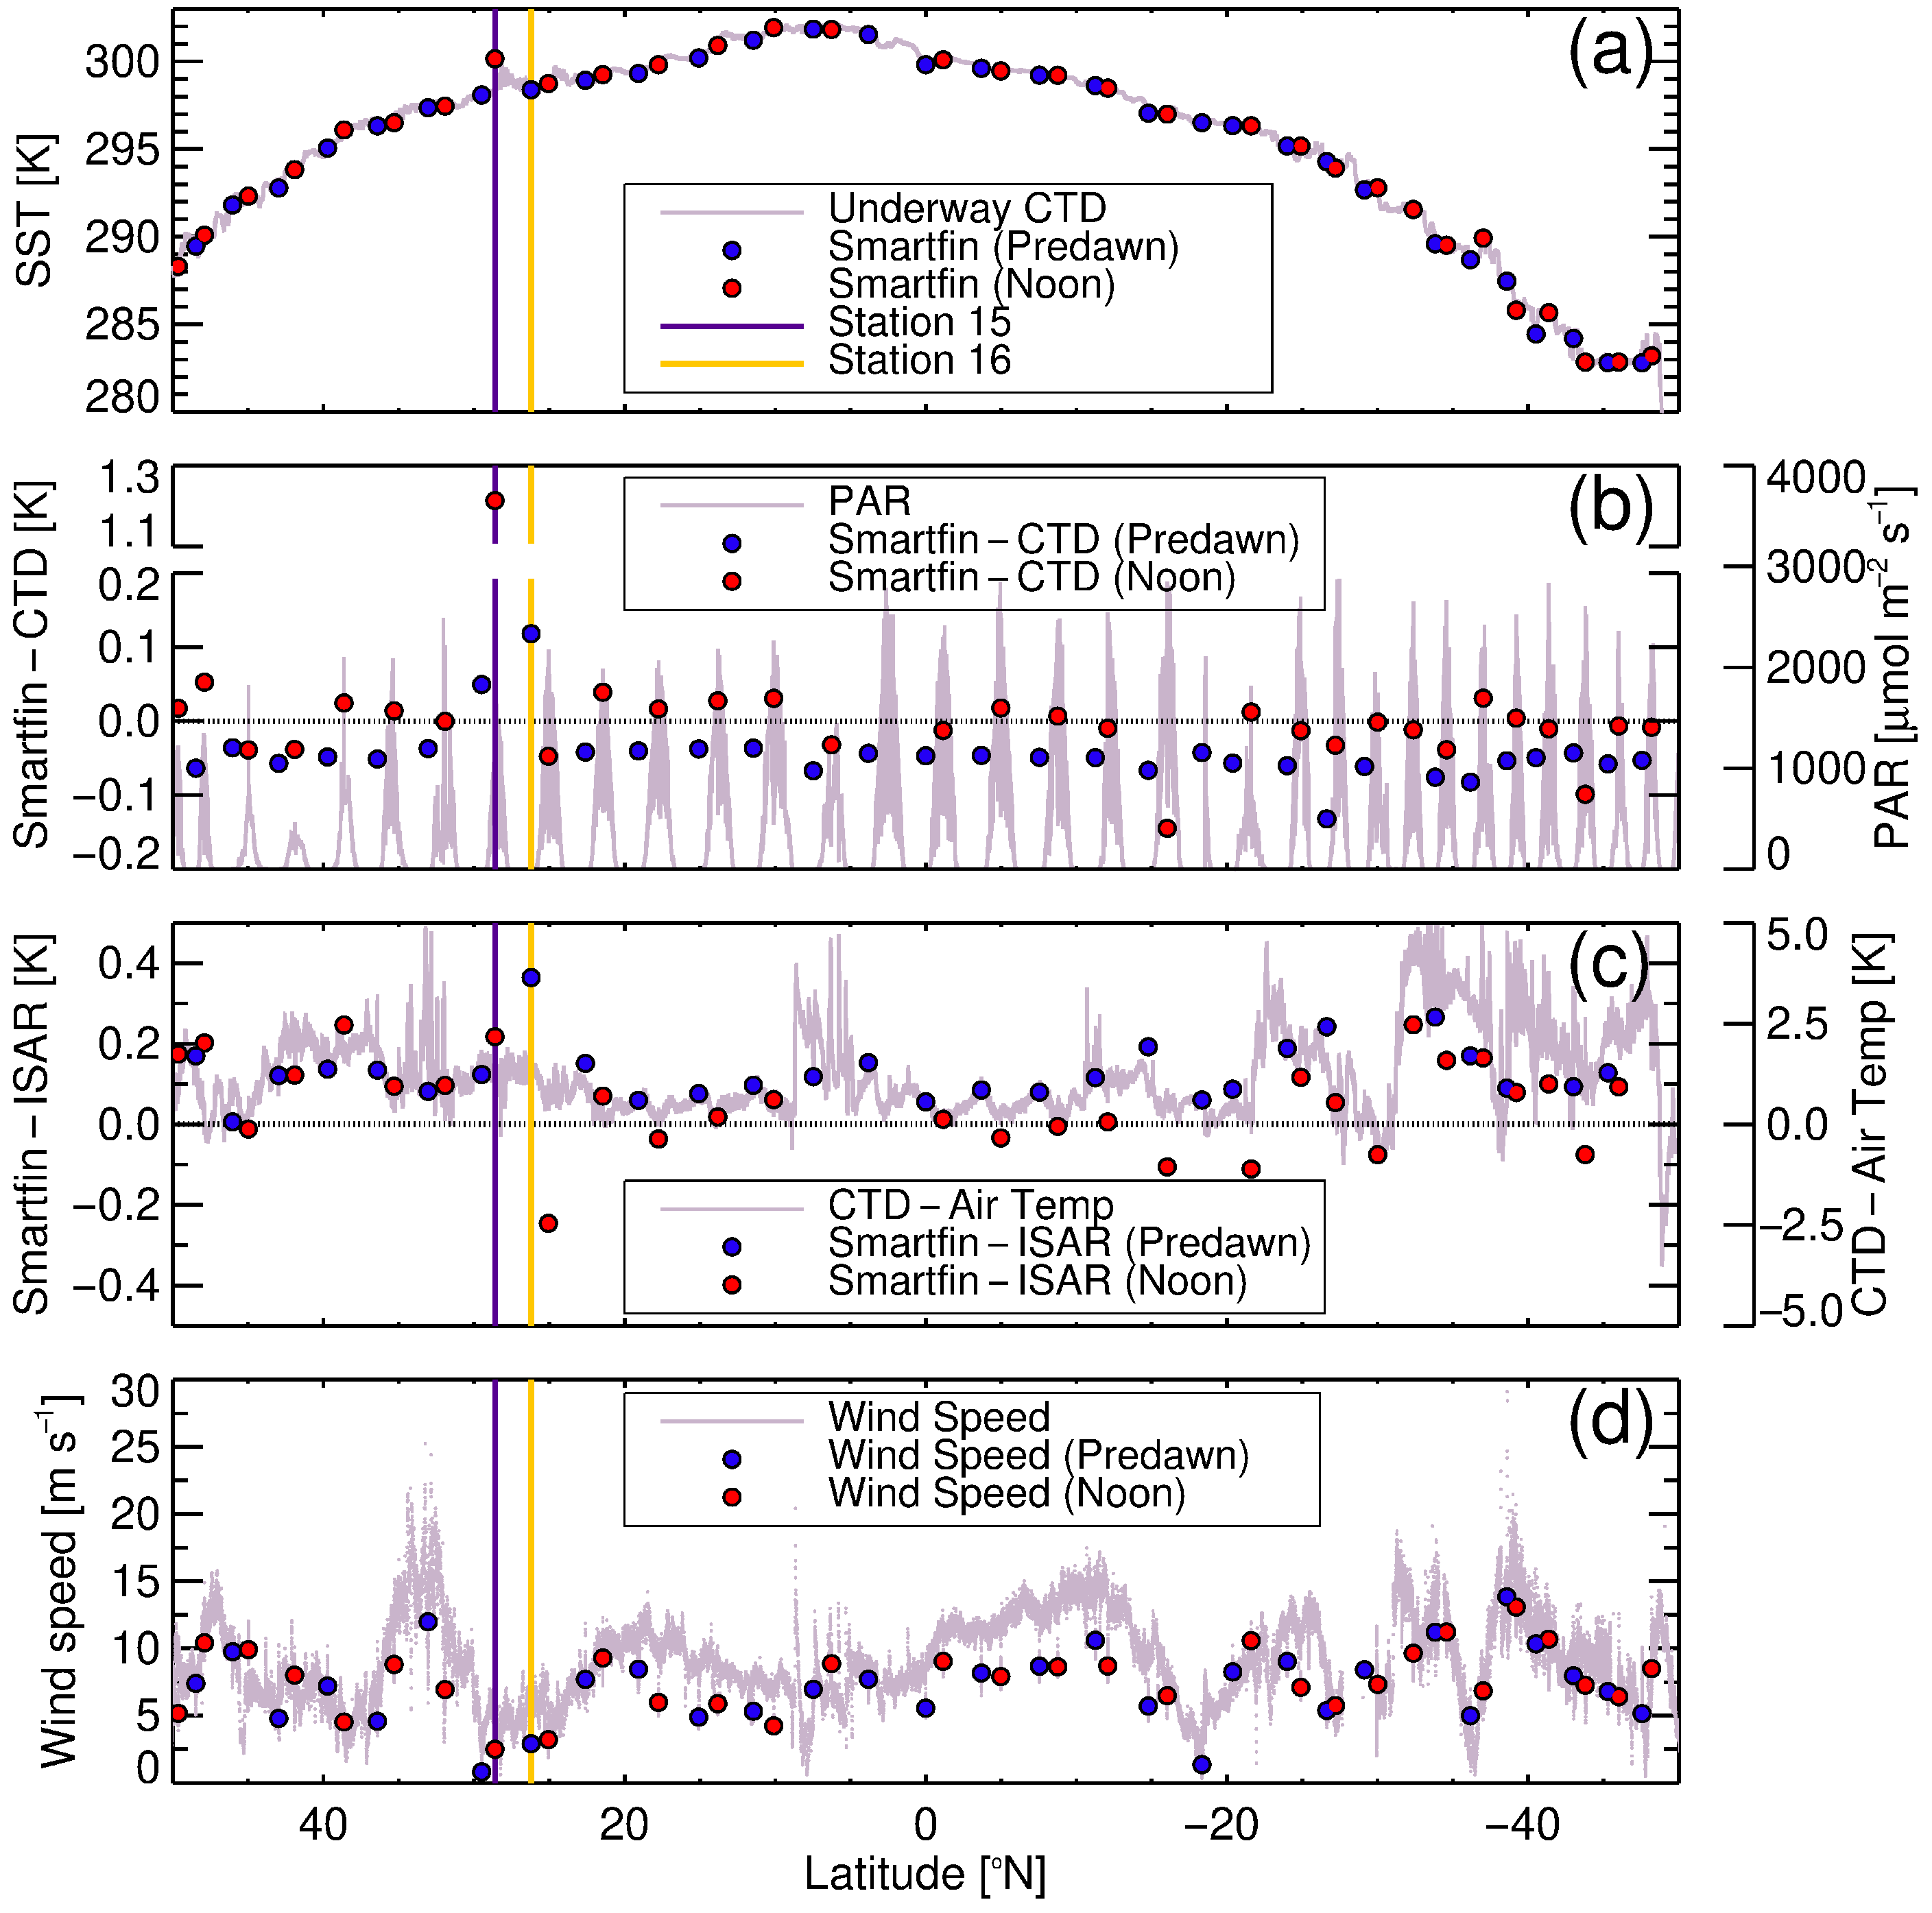
3.2. Field Comparisons

The Smartfin data is seen to track fluctuations in SST from the underway CTD over the entire latitudinal transect (Figure 3a). Over all 62 stations, the mean difference ( δ ) and mean absolute difference ( ϵ ) between Smartfin and the underway CTD were −0.01 and 0.06 K respectively (Figure 4a, Table 1). These differences are in good agreement to those found when comparing Smartfin data collected in the surf zone with that from a shaded TidviT v2 sensor attached to a surfboard leash ( δ = 0.04 , ϵ = 0.06 , N = 141 ) [35]. Differences in SST between the Smartfin and underway CTD showed no relationship with latitude or SST (Figure 3a,b). For noon stations, where PAR was highest (Figure 3b), differences are slightly positive ( δ = 0.03 K) with a Gaussian distribution centered around zero (Figure 4e). For predawn stations, there was a small negative bias ( δ = 0.05 , Figure 4c, Table 1). Mean differences ( δ ) and mean absolute differences ( ϵ ) between Smartfin and underway CTD were found to be very consistent to those between Smartfin and TidbiT v2 and those between Smartfin and iButton, for both predawn and noon stations (Table 1). Considering the Smartfin samples at a depth of ∼0.1 m, whereas the TidbiT v2, iButton and underway CTD are sampling SST at deeper depths (1 to 5 m), the differences reflect the depths of sampling, with the shallower Smartfin showing cooler temperatures at night (more convective night-time cooling of ocean surface at 0.1 m than at >1 m depths) and warmer temperatures by day (greater diurnal warming of ocean surface at 0.1 m than at >1 m depths).
The mean difference ( δ ) and mean absolute difference ( ϵ ) between Smartfin and the ISAR were 0.09 and 0.12 K respectively (Figure 4b, Table 1). Overall, the Smartfin data were slightly warmer than the ISAR data ( δ = 0.09 ), though predawn stations more so ( δ = 0.13 ) than noon stations ( δ = 0.06 ) (Figure 3c, Figure 4d,f, and Table 1). Again, these differences can be explained by the depth of sampling. Along the majority of the transect, the SST (derived from the underway CTD) was warmer than the air temperature (Figure 3c), which causes heat to flow from the ocean to atmosphere. This upward flow of heat occurs in the top hundred micrometers [17,42] by molecular conduction [17,42,43] and causes a vertical temperature gradient just beneath the interface, which decreases the temperature close to the interface (referred to as the thermal skin layer [17]). The temperature measured by an infrared radiometer is therefore nearly always lower than that measured by an in-situ thermometer [18,19]. This is typically thought to be around 0.17 K, but is dependent on environmental conditions (e.g., wind speed [17]). Differences in SST measured by the Smartfin (at ∼0.1 m depth) and by the ISAR (in the thermal skin layer) are seen to track variations in the gradient of temperature between the ocean and atmosphere (Figure 3c, r = 0.52 , p < 0.001 ) derived from the ship’s underway CTD and air temperature sensor. Similar results were also obtained when assessing the differences in SST measured by the Smartfin and ISAR and differences between the Smartfin and air temperature ( r = 0.55 , p < 0.001 ) and differences in SST measured by the Smartfin and ISAR and differences between the ISAR and air temperature ( r = 0.47 , p < 0.001 ). When the gradient in temperature between ocean and atmosphere is stronger, the ISAR data is cooler than the Smartfin (Figure 3c).

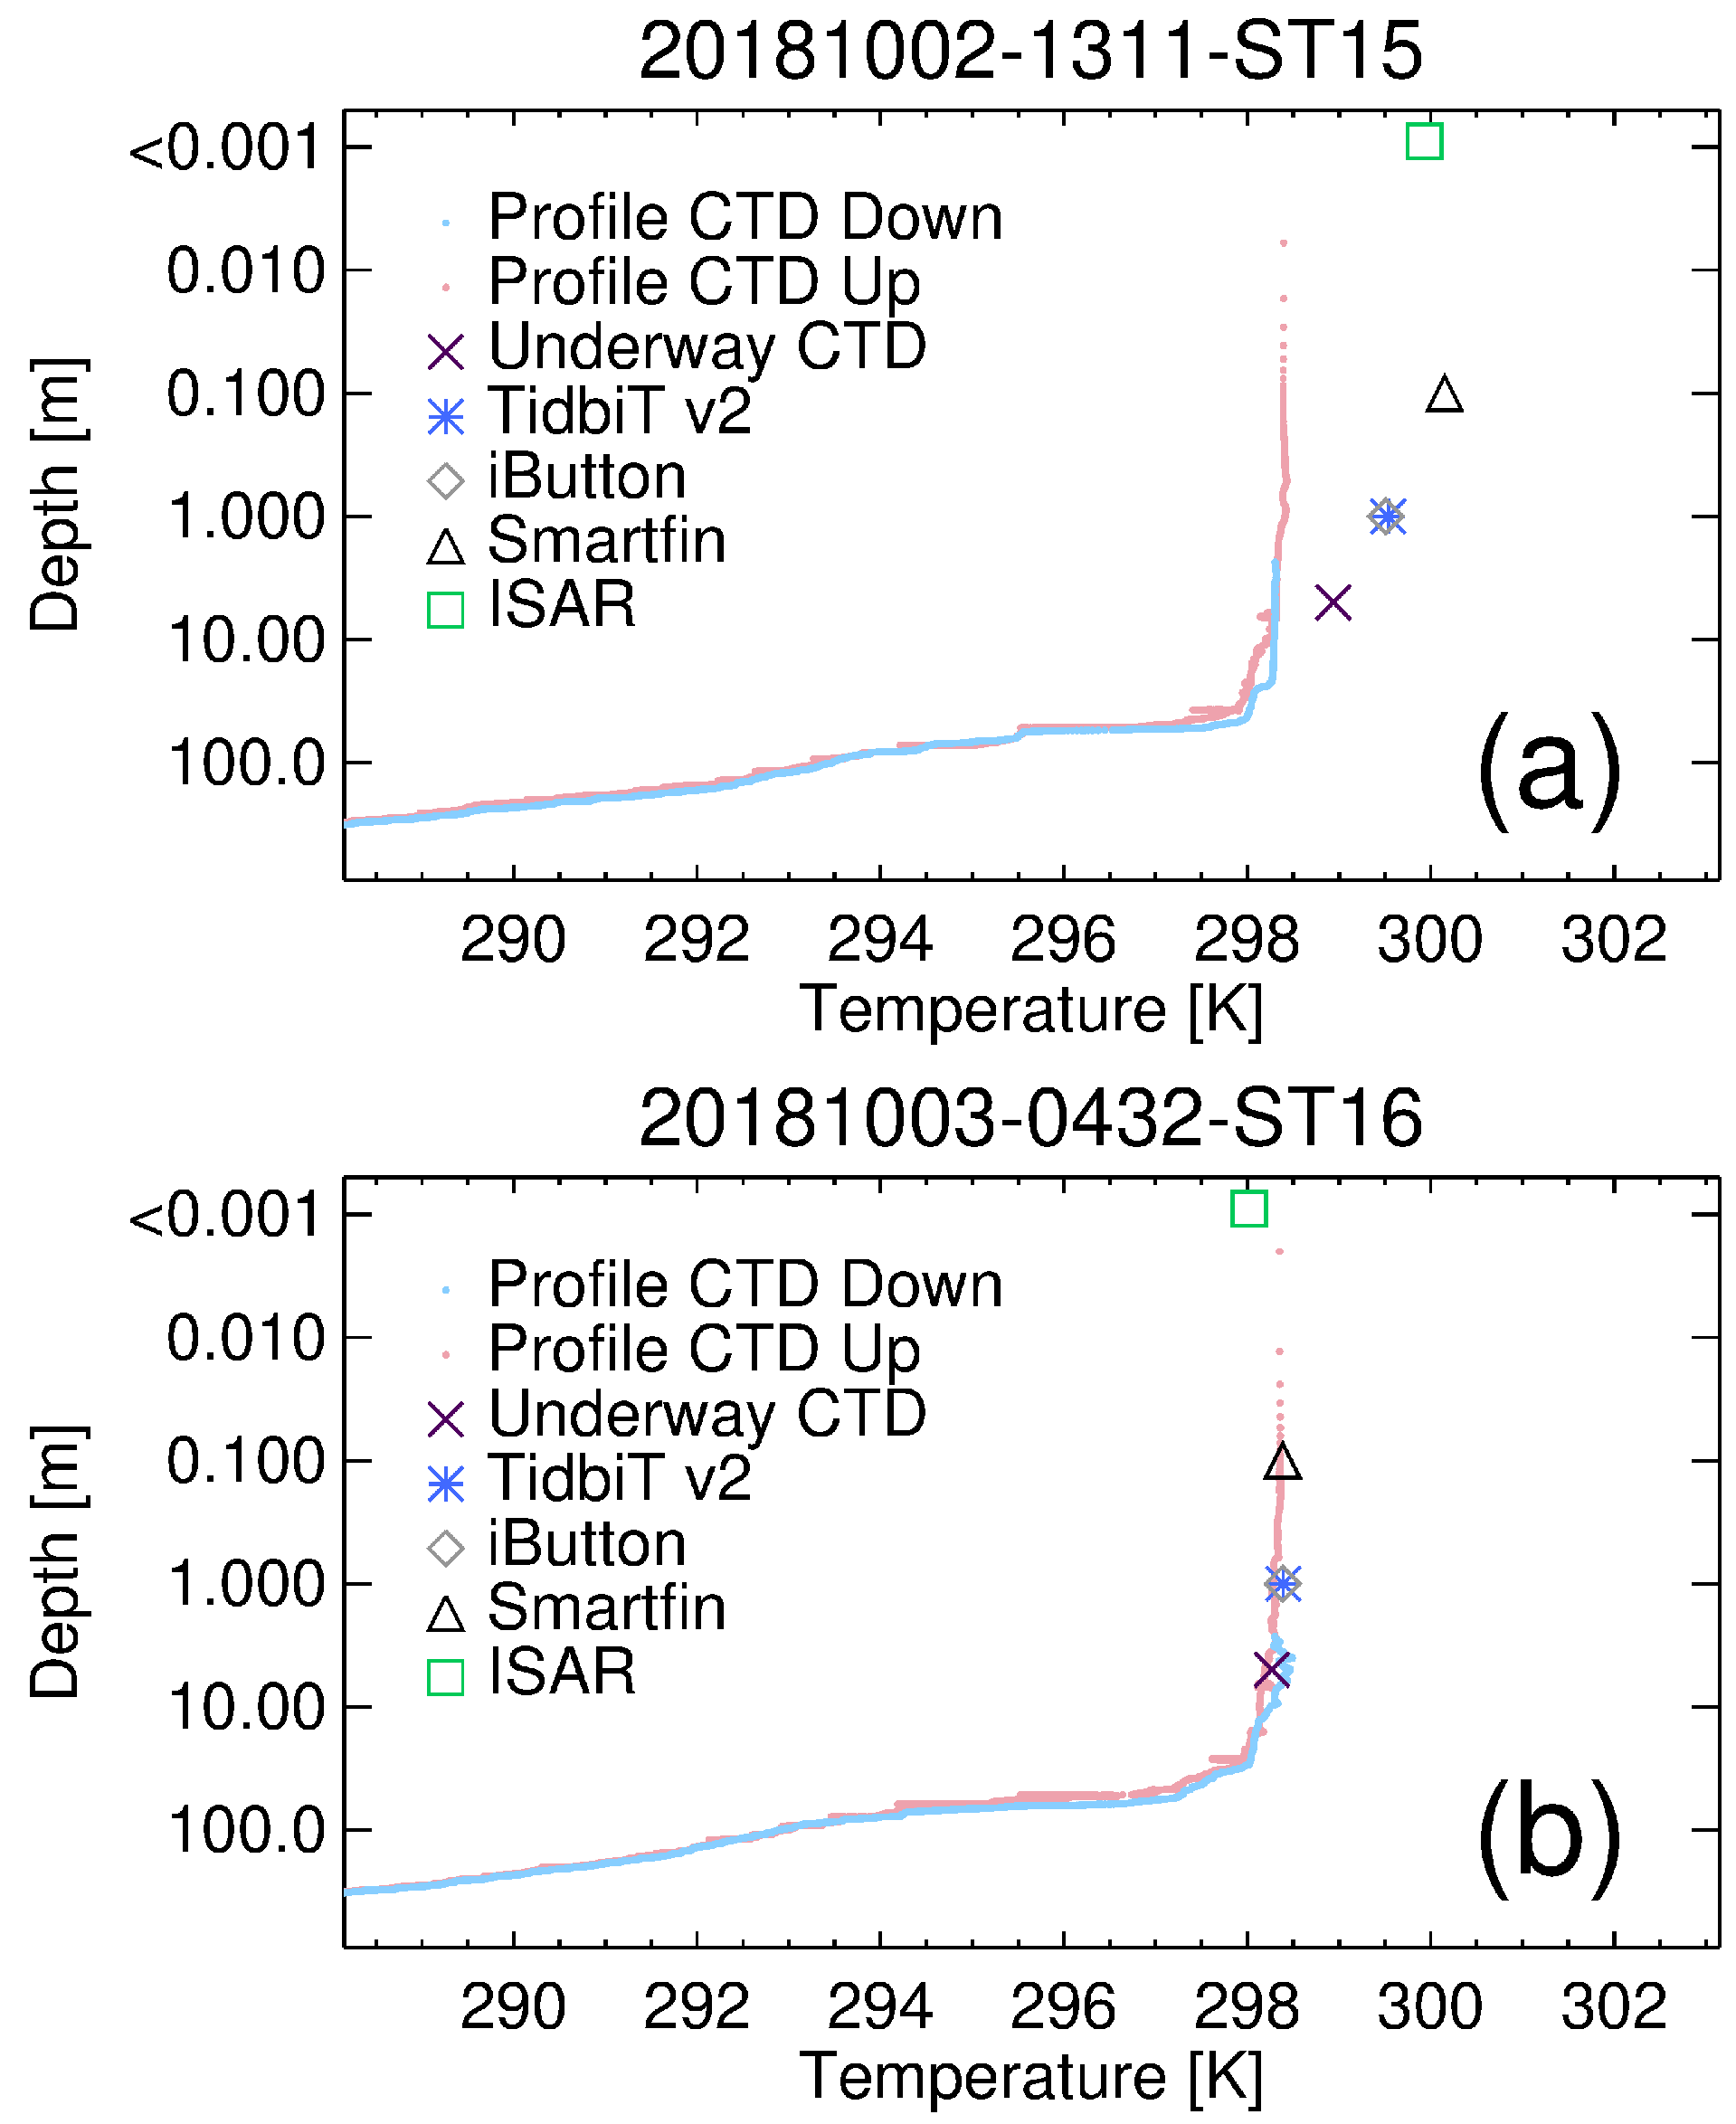
3.3. Near-Surface Temperature Gradients

Wind speed at the 62 stations sampled varied between 0.8 and 13.8 m s 1 (Figure 3d), though higher wind speeds were seen occasionally as the ship moved between stations. The largest differences between the Smartfin and underway CTD (Noon Station 15, δ = 1.21 ), and Smartfin and ISAR (Predawn Station 16, δ = 0.36 ), were observed at very low wind speeds (2.5 and 2.9 m s 1 , respectively). It is well known that low wind speeds can cause large thermal gradients between skin and sub-skin SST, with SST in the thermal layer typically cooler than that in the sub-skin [18,19].
Figure 5a,b show vertical temperature gradients at Station 15 and 16 respectively, through combining data collected from the ISAR, the SOD (Smartfin, iButton and TidbiT v2), underway CTD and profiling CTD. At both stations Smartfin was found to be warmer than the ISAR (Station 15 the δ = 0.22 , Station 16 the δ = 0.36 ), consistent with expectations at such low wind speeds [18,19], i.e., that the cool skin is still there even with the diurnal warming. Interestingly, Station 15 shows a large gradient in near-surface temperature between 5 m depth and 0.1 m depth (Figure 5a), not observed at the subsequent predawn station (Figure 5b). The strong gradient in SST seen in Figure 5a, and not captured with a profiling CTD (possibly related to the speed of the profiling, and/or disturbances caused in the upper layer during the profiling), reflects high diurnal warming caused by a combination of low wind speeds and high solar radiation (PAR = 1986 μ mol m 2 s 1 ). Figure 5 demonstrates the potential of using the SOD, in combination with ISAR and standard ship-based sampling, as a platform for exploring the near-surface temperature gradients in the ocean, that are so important for quantifying air-sea gas transfer [44].

3.4. Implications for Validating Satellite Data in Nearshore Coastal Waters Using Smartfin

The opportunity on AMT28 allowed a comparison of Smartfin temperature data with SST data collected using an ISAR. Consistent with previous comparisons of the Smartfin with other temperature datasets in nearshore waters [35], the fin was found to compare well with the ISAR (Figure 4). Notwithstanding these findings, it is important to acknowledge these tests were conducted in open ocean waters, not nearshore coastal waters that the Smartfin has been designed for. Gradients in temperature across the thermal skin and sub-skin layers observed on AMT28 are possibly less prominent in nearshore coastal waters and perhaps more spatially variable, given surface turbulence (e.g., from wave breaking, and tidal and coastal currents). This will have implications for how SST skin observed from satellite thermal radiometry is related to sub-skin SST, and consequently for nearshore validation studies using the Smartfin.
The next logical progression would be to repeat these experiments in nearshore coastal waters. Though it is likely to be more challenging, one could use structural platforms for mounting radiometers (e.g., piers and harbour walls) that have been used in the past [45,46], combined with SOD/surfer Smartfin deployments [35] and benthic temperature loggers [29]. With several surfers regularly collecting Smartfin data around Scripps pier in La Jolla, US [34], coupled with the routine temperature sampling that takes place on the pier e.g., see [35], and previous success mounting radiometers to the pier [46], this could be an excellent site for such experiments.

4. Summary

In this study, we exploited an opportunity on the 28th Atlantic Meridional Transect (AMT28) research cruise to compare SST data collected from a Smartfin (at 0.1 m depth) with an Infrared Sea surface temperature Autonomous Radiometer (ISAR) measuring SST skin, and state-of-the-art oceanographic instrumentation used on research cruises for measuring SST at ∼5 m depth. A Simple Oceanographic floating Device (SOD) was developed that housed a Smartfin, and other (TidbiT v2 and iButton) sensors that measured SST at a depth of ∼1.0 m. These sensors were evaluated in the laboratory, using a recirculating water bath, against an NPL-traceable Hart Scientific 1504 temperature bridge and Themometrics ES 225 temperature probe (accurate to ±0.0043 K over a range of 273.15 to 323.15 K). Systematic differences between the iButton and probe ( δ = 0.292 K) and the TidbiT v2 and probe ( δ = 0.089 K) were observed (and removed from subsequent data collected from the SOD), but not from the Smartfin, which was found to be in excellent agreement with the probe ( δ = 0.005 K).
The SOD was deployed at 62 stations (predawn and noon) for 20 min periods along the cruise track, spanning 100 degrees latitude and a gradient in SST of 19 K. We extracted simultaneous measurements of skin SST from the ISAR, SST at 5 m depth from the underway CTD, and used along-track data on air temperature, wind and PAR, over the period of SOD deployments. We found the mean difference ( δ ) and mean absolute difference ( ϵ ) between Smartfin and the underway CTD to be −0.01 K and 0.06 K respectively, and between Smartfin and ISAR to be 0.09 and 0.12 K respectively. In both comparisons, these values varied between noon and predawn stations, with SST at 0.1 m cooler at predawn than SST at depths >1 m, and SST in the skin layer cooler at predawn and noon when compared with SST at 0.1 m. Differences between Smartfin and ISAR SST were correlated with sea-air temperature gradients, derived from independent measurements. At stations with very low wind speeds, differences among sensors were greatest. Our results support the use of Smartfin as a citizen science tool for evaluating satellite SST data.

Supplementary Materials

The following are available online at https://0-www-mdpi-com.brum.beds.ac.uk/2072-4292/13/5/841/s1. A supporting video is available at the link.

Author Contributions

Conceptualization, R.J.W.B.; Methodology, R.J.W.B., W.W., P.J.B., T.C., A.J.A. and G.D.; Software, R.J.W.B., W.W., P.J.B., T.C. and A.J.A.; Validation, R.J.W.B. and W.W.; Formal Analysis, R.J.W.B. and W.W.; Investigation, R.J.W.B.; Resources, R.J.W.B., W.W., P.J.B., T.C. and A.J.A.; Data Curation, R.J.W.B., W.W. and G.D.; Writing—Original Draft Preparation, R.J.W.B.; Writing—Review & Editing, R.J.W.B., W.W., P.J.B., T.C., A.J.A. and G.D. All authors have read and agreed to the published version of the manuscript.

Funding

R.J.W.B., W.W. and G.D. were supported by the European Space Agency AMT4OceanSatFlux project. P.J.B., T.C. and A.J.A. received financial support from the non-profit Lost Bird project.

Data Availability Statement

The data used in this study is freely available [41] through the British Oceanographic Data Centre (https://www.bodc.ac.uk/data/published_data_library/catalogue/10.5285/ba853af2-6ecb-38b1-e053-6c86abc05eec/ accessed on 23 February 2021). The European Space Agency is acknowledged for their funding and contributions to the collection of the ISAR data on AMT28.

Acknowledgments

We thank the officers, scientists and crew of RRS James Clark Ross who helped in the acquisition of AMT28 data and all those involved with data collection. We thank in particular the Principal Scientific Officer Glen Tarran, and the RRS James Clark Ross IT technician Sean Vincent and the AME technician Sean Quirk, for their support during the deployments of scientific equipment. The Atlantic Meridional Transect is funded by the UK Natural Environment Research Council through its National Capability Long-term Single Centre Science Programme, Climate Linked Atlantic Sector Science (grant number NE/R015953/1). This study contributes to the international IMBeR project and is contribution number 361 of the AMT programme.

Conflicts of Interest

P.J.B., T.C. and A.J.A. received financial support from the non-profit Lost Bird project. All other authors declare the absence of any commercial or financial relationships that could be construed as a potential conflict of interest.

References

  1. GCOS. Systematic Observation Requirements from Satellite-Based Data Products for Climate; Technical Report; World Meteorological Organisation (WMO): Geneva, Switzerland, 2011. [Google Scholar]
  2. Bojinski, S.; Verstraete, M.; Peterson, T.; Richter, C.; Simmons, A.; Zemp, M. The concept of essential climate variables in support of climate research, applications, and policy. Bull. Am. Meteorol. Soc. 2014, 95, 1431–1443. [Google Scholar] [CrossRef]
  3. Archer, D.; Martin, P.; Buffett, B.; Brovkin, V.; Rahmstorf, S.; Ganopolski, A. The importance of ocean temperature to global biogeochemistry. Earth Planet. Sci. Lett. 2004, 222, 333–348. [Google Scholar] [CrossRef]
  4. Brown, E.; Colling, A.; Park, D.; Phillips, J.; Rothery, D.; Wright, J. Seawater: Its Composition, Properties and Behaviour; Butterworth-Heinemann: Oxford, UK, 1995. [Google Scholar]
  5. Eppley, R.W. Temperature and phytoplankton growth in the sea. Fish. Bull. 1972, 70, 1063–1085. [Google Scholar]
  6. Weiss, R.F. The solubility of nitrogen, oxygen and argon in water and seawater. Deep Sea Res. 1970, 17, 721–735. [Google Scholar] [CrossRef]
  7. Lee, K.; Tong, L.; Millero, F.J.; Sabine, C.L.; Dickson, A.G.; Goyet, C.; Park, G.H.; Wanninkhof, R.; Feely, R.A.; Key, R.M. Global relationships of total alkalinity with salinity and temperature in surface waters of the world’s oceans. Geophys. Res. Lett. 2006, 33, L19605. [Google Scholar] [CrossRef] [Green Version]
  8. Land, P.E.; Shutler, J.D.; Cowling, R.D.; Woolf, D.K.; Walker, P.; Findlay, H.S.; Upstill-Goddard, R.C.; Donlon, C.J. Climate change impacts on sea-air fluxes of CO2 in three Arctic seas: A sensitivity study using Earth observation. Biogeosciences 2013, 10, 8109–8128. [Google Scholar] [CrossRef] [Green Version]
  9. Takahashi, T.; Sutherland, S.C.; Sweeney, C.; Poisson, A.; Metzl, N.; Tilbrook, B.; Bates, N.; Wanninkhof, R.; Feely, R.A.; Sabine, C.; et al. Global sea–air CO2 flux based on climatological surface ocean pCO2, and seasonal biological and temperature effects. Deep Sea Res. Part II Top. Stud. Oceanogr. 2002, 49, 1601–1622. [Google Scholar] [CrossRef]
  10. Sutton, R.T.; Allen, M.R. Decadal predictability of North Atlantic sea surface temperature and climate. Nature 1997, 388, 563–567. [Google Scholar] [CrossRef]
  11. Lea, D.W.; Pak, D.K.; Spero, H.J. Climate Impact of Late Quaternary Equatorial Pacific Sea Surface Temperature Variations. Science 2000, 289, 1719–1724. [Google Scholar] [CrossRef] [Green Version]
  12. Bader, J.; Latif, M. The impact of decadal-scale Indian Ocean sea surface temperature anomalies on Sahelian rainfall and the North Atlantic Oscillation. Geophys. Res. Lett. 2003, 30, 2169. [Google Scholar] [CrossRef] [Green Version]
  13. Raitsos, D.E.; Hoteit, I.; Prihartato, P.K.; Chronis, T.; Triantafyllou, G.; Abualnaja, Y. Abrupt warming of the Red Sea. Geophys. Res. Lett. 2011, 38, L14601. [Google Scholar] [CrossRef] [Green Version]
  14. González-Dávila, M.; Santana-Casiano, J.M.; González-Dávila, E.F. Interannual variability of the upper ocean carbon cycle in the northeast Atlantic Ocean. Geophys. Res. Lett. 2007, 34, L07608. [Google Scholar] [CrossRef]
  15. Llewellyn-Jones, D.T.; Minnett, P.J.; Saunders, R.W.; Zavody, A.M. Satellite multichannel infrared measurements of sea surface temperature of the NE Atlantic Ocean using AVHRR/2. Q. J. R. Meteorol. Soc. 1984, 110, 613–631. [Google Scholar] [CrossRef]
  16. Wentz, F.J.; Gentemann, C.; Smith, D.; Chelton, D. Satellite measurements of sea surface temperature through clouds. Science 2000, 288, 847–850. [Google Scholar] [CrossRef] [Green Version]
  17. Minnett, P.J.; Alvera-Azcárate, A.; Chin, T.; Corlett, G.K.; Gentemann, C.L.; Karagali, I.; Li, X.; Marsouin, A.; Marullo, S.; Maturi, E.; et al. Half a century of satellite remote sensing of sea-surface temperature. Remote Sens. Environ. 2019, 233, 111366. [Google Scholar] [CrossRef]
  18. Donlon, C.J.; Minnett, P.J.; Gentemann, C.; Nightingale, T.J.; Barton, I.J.; Ward, B.; Murray, J. Toward improved validation of satellite sea surface skin temperature measurements for climate research. J. Clim. 2002, 15, 353–369. [Google Scholar] [CrossRef] [Green Version]
  19. Minnett, P.J.; Smith, M.; Ward, B. Measurements of the oceanic thermal skin effect. Deep Sea Res. Part II Top. Stud. Oceanogr. 2011, 58, 861–868. [Google Scholar] [CrossRef]
  20. Donlon, C.J.; Minnett, P.J.; Jessup, A.; Barton, I.; Emery, W.; Hook, S.; Wimmer, W.; Nightingale, T.J.; Zappa, C. Chapter 3.2—Ship-Borne Thermal Infrared Radiometer Systems. In Optical Radiometry for Ocean Climate Measurements; Experimental Methods in the Physical Sciences; Zibordi, G., Donlon, C.J., Parr, A.C., Eds.; Academic Press: Cambridge, MA, USA, 2014; Volume 47, pp. 305–404. [Google Scholar] [CrossRef]
  21. Minnett, P.J.; Knuteson, R.O.; Best, F.A.; Osborne, B.J.; Hanafin, J.A.; Brown, O.B. The Marine-Atmospheric Emitted Radiance Interferometer: A High-Accuracy, Seagoing Infrared Spectroradiometer. J. Atmos. Ocean. Technol. 2001, 18, 994–1013. [Google Scholar] [CrossRef]
  22. Nightingale, T.J. Autonomous deployment of SISTeR for AATSR validation. In Proceedings of the Second Working Meeting on MERIS and AATSR Calibration and Geophysical Validation (MAVT-2006), Frascati, Italy, 20–24 March 2006; ESA SP-615 (CD-ROM). Danesy, D., Ed.; ESA Publications: Noordwijk, The Netherlands, 2006. [Google Scholar]
  23. Donlon, C.; Robinson, I.S.; Wimmer, W.; Fisher, G.; Reynolds, M.; Edwards, R.; Nightingale, T.J. An Infrared Sea Surface Temperature Autonomous Radiometer (ISAR) for deployment aboard Volunteer Observing Ships (VOS). J. Atmos. Ocean. Technol. 2008, 25, 93–113. [Google Scholar] [CrossRef]
  24. Merchant, C.J.; Embury, O.; Roberts-Jones, J.; Fiedler, E.; Bulgin, C.E.; Corlett, G.K.; Good, S.; McLaren, A.; Rayner, N.; Morak-Bozzo, S.; et al. Sea surface temperature datasets for climate applications from Phase 1 of the European Space Agency Climate Change Initiative (SST CCI). Geosci. Data J. 2014, 1, 179–191. [Google Scholar] [CrossRef] [Green Version]
  25. Saux Picart, S.; Marsouin, A.; Legendre, G.; Roquet, H.; Péré, S.; Nano-Ascione, N.; Gianelli, T. A Sea Surface Temperature data record (2004-2012) from Meteosat Second Generation satellites. Remote Sens. Environ. 2020, 240, 111687. [Google Scholar] [CrossRef]
  26. Smit, A.J.; Roberts, M.; Anderson, R.J.; Dufois, F.; Dudley, S.F.; Bornman, T.G.; Olbers, J.; Bolton, J.J. A coastal seawater temperature dataset for biogeographical studies: Large biases between in situ and remotely-sensed data sets around the coast of South Africa. PLoS ONE 2013, 8, e81944. [Google Scholar] [CrossRef] [Green Version]
  27. Brewin, R.J.W.; de Mora, L.; Billson, O.; Jackson, T.; Russell, P.; Brewin, T.G.; Shutler, J.; Miller, P.I.; Taylor, B.H.; Smyth, T.; et al. Evaluating operational AVHRR sea surface temperature data at the coastline using surfers. Estuarine Coast. Shelf Sci. 2017, 196, 276–289. [Google Scholar] [CrossRef]
  28. Thomas, A.; Byrne, D.; Weatherbee, R. Coastal sea surface temperature variability from Landsat infrared data. Remote Sens. Environ. 2002, 81, 262–272. [Google Scholar] [CrossRef]
  29. Brewin, R.J.W.; Smale, D.A.; Moore, P.J.; Dall’Olmo, G.; Miller, P.I.; Taylor, B.; Smyth, T.J.; Fishwick, J.R.; Yang, M. Evaluating operational AVHRR sea surface temperature data at the coastline using benthic temperature loggers. Remote Sens. 2018, 10, 925. [Google Scholar] [CrossRef] [Green Version]
  30. Gura, T. Citizen science: Amateur experts. Nature 2013, 496, 256–261. [Google Scholar] [CrossRef] [Green Version]
  31. Garcia-Soto, C.; van der Meeren, G.I.; Busch, J.A.; Delany, J.; Domegan, C.; Dubsky, K.; Fauville, G.; Gorsky, G.; von Juterzenka, K.; Malfatti, F.; et al. Advancing Citizen Science for Coastal and Ocean Research; Technical Report; French, V., Kellett, P., Delany, J., McDonough, N., Eds.; European Marine Board: Ostend, Belgium, 2017; 112p, ISBN 978-94-92043-30-6. [Google Scholar]
  32. Brewin, R.J.W.; Hyder, K.; Andersson, A.J.; Billson, O.; Bresnahan, P.J.; Brewin, T.G.; Cyronak, T.; Dall’Olmo, G.; de Mora, L.; Graham, G.; et al. Expanding aquatic observations through recreation. Front. Mar. Sci. 2017, 4, 351. [Google Scholar] [CrossRef] [Green Version]
  33. Brewin, R.J.W.; de Mora, L.; Jackson, T.; Brewin, T.G.; Shutler, J. On the potential of surfers to monitor environmental indicators in the coastal zone. PLoS ONE 2015, 10, e0127706. [Google Scholar] [CrossRef]
  34. Bresnahan, P.J.; Cyronak, T.; Martz, T.; Andersson, A.; Waters, S.; Stern, A.; Richard, J.; Hammond, K.; Griffin, J.; Thompson, B. Engineering a Smartfin for surf-zone oceanography. In Proceedings of the OCEANS 2017, Anchorage, AK, USA, 18–21 September 2017; pp. 1–4. [Google Scholar]
  35. Brewin, R.J.W.; Cyronak, T.; Bresnahan, P.J.; Andersson, A.J.; Richard, J.; Hammond, K.; Billson, O.; de Mora, L.; Jackson, T.; Smale, D.; et al. Comparison of two methods for measuring sea surface temperature when surfing. Oceans 2020, 1, 6–26. [Google Scholar] [CrossRef] [Green Version]
  36. Donlon, C. Sentinel-3 Mission Requirements Traceability Document (MRTD). Technical Report. 2011. Available online: https://sentinel.esa.int/documents/247904/1848151/Sentinel-3-Mission-Requirements-Traceability (accessed on 17 December 2020).
  37. NASA. MODIS-Aqua Ocean Color Data; NASA Goddard Space Flight Center, Ocean Ecology Laboratory, Ocean Biology Processing Group. 2014. Available online: http://0-dx-doi-org.brum.beds.ac.uk/10.5067/AQUA/MODIS_OC.2014.0 (accessed on 18 July 2020).
  38. Donlon, C.J.; Wimmer, W.; Robinson, I.; Fisher, G.; Ferlet, M.; Nightingale, T.; Bras, B. A second-generation blackbody system for the calibration and verification of seagoing infrared radiometers. J. Atmos. Ocean. Technol. 2014, 31, 1104–1127. [Google Scholar] [CrossRef]
  39. Theocharous, E.; Barker Snook, I.; Fox, N.P. 2016 Comparison of IR Brightness Temperature Measurements in Support of Satellite Validation. Part 1: Blackbody Laboratory Comparison; Technical Report; NPL Report ENV 12; NPL: Nashville, TN, USA, 2017. [Google Scholar]
  40. Brewin, R.J.W.; Brewin, T.G.; Phillips, J.; Rose, S.; Abdulaziz, A.; Wimmer, W.; Sathyendranath, S.; Platt, T. A printable device for measuring clarity and colour in lake and nearshore waters. Sensors 2019, 19, 936. [Google Scholar] [CrossRef] [PubMed] [Green Version]
  41. Brewin, R.J.W.; Wimmer, W.; Bresnahan, P.J.; Cyronak, T.; Andersson, A.J.; Dall’Olmo, G. Sea Surface Temperature (SST) Measurements at Different Depths and Auxiliary Environmental Data Collected at 62 Stations on AMT28 (JR18001) Using the Simple Oceanographic Floating Device (SOD) and Infrared SST Autonomous Radiometer; British Oceanographic Data Centre—Natural Environment Research Council, NERC: Swindon, UK, 2021. [Google Scholar]
  42. Wong, E.W.; Minnett, P.J. The response of the ocean thermal skin layer to variations in incident infrared radiation. J. Geophys. Res. Oceans 2018, 123, 2475–2493. [Google Scholar] [CrossRef]
  43. Soloviev, A.; Lukas, R. The Near-Surface Layer of the Ocean: Structure, Dynamics and Applications; Springer: Dordrecht, The Netherlands, 2014. [Google Scholar] [CrossRef]
  44. Watson, A.J.; Schuster, U.; Shutler, J.D.; Holding, T.; Ashton, I.G.C.; Landschützer, P.; Woolf, D.K.; Goddijn-Murphy, L. Revised estimates of ocean-atmosphere CO2 flux are consistent with ocean carbon inventory. Nat. Commun. 2020, 11, 4422. [Google Scholar] [CrossRef]
  45. McAlister, E.D. Infrared-optical techniques applied to oceanography I. Measurement of total heat flow from the sea surface. Appl. Opt. 1964, 3, 609–612. [Google Scholar] [CrossRef]
  46. Sinnett, G.; Feddersen, F. Observations and parameterizations of surfzone albedo. Methods Oceanogr. 2016, 17, 319–334. [Google Scholar] [CrossRef] [Green Version]
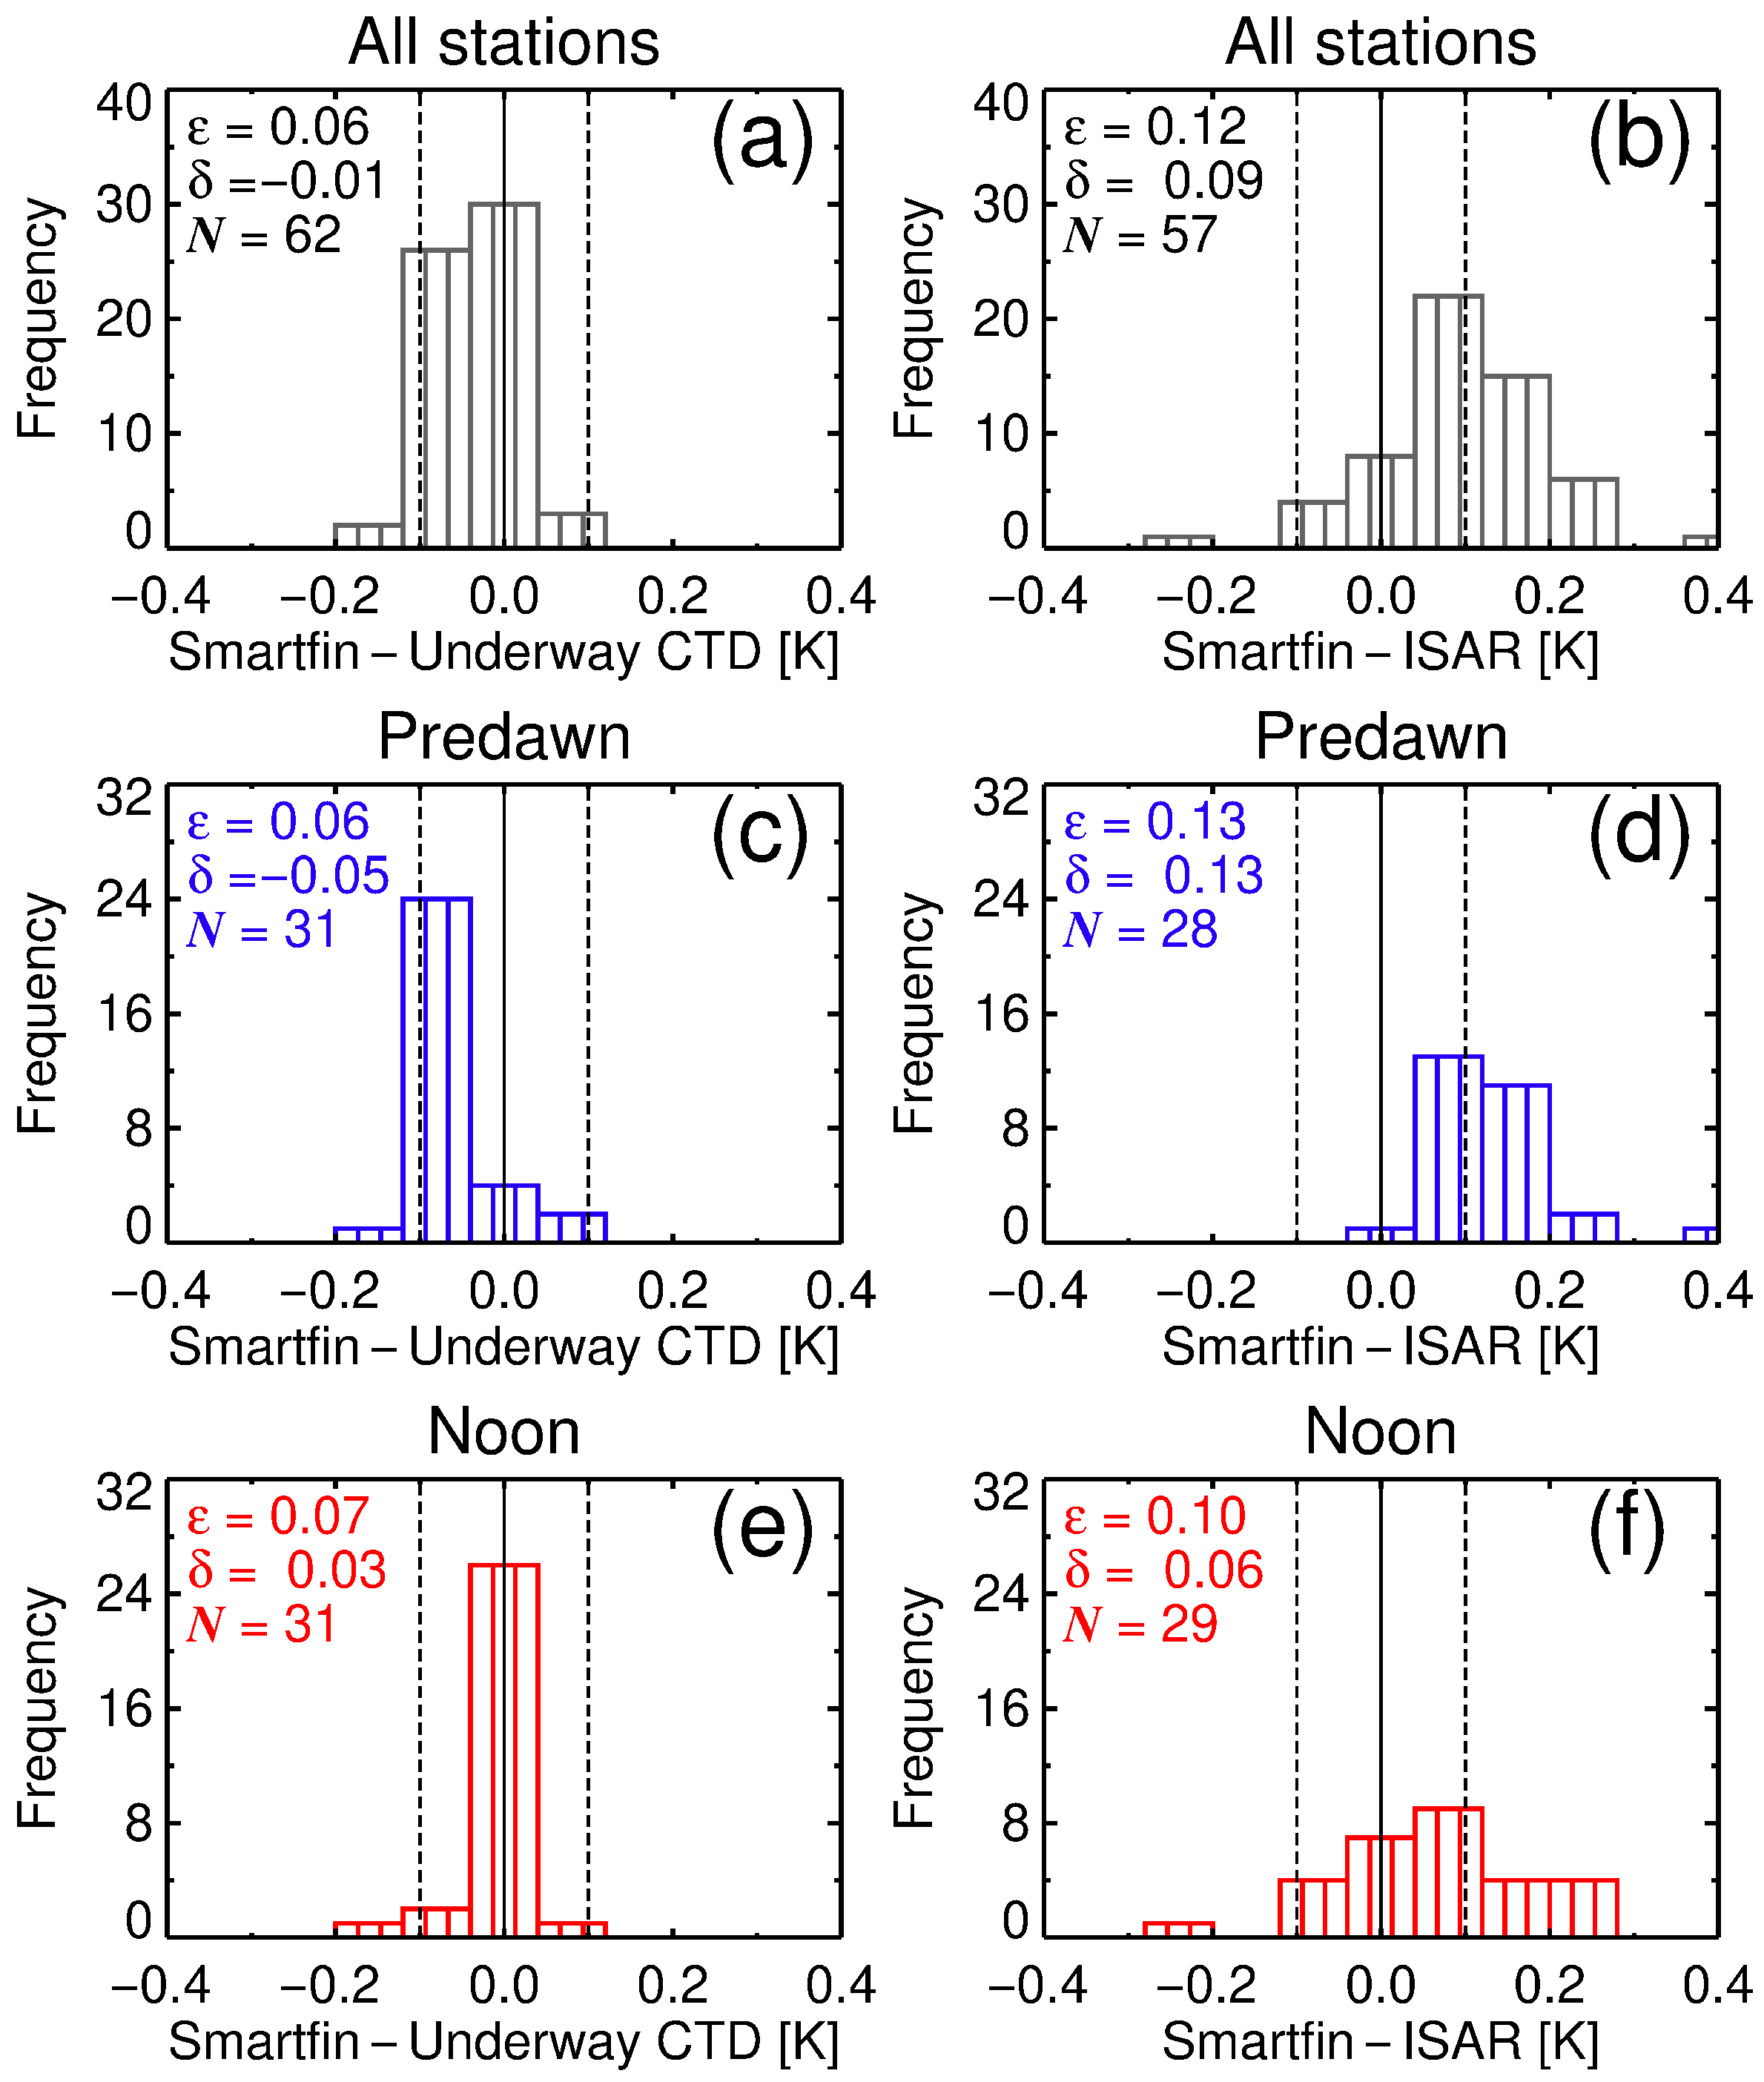
Figure 1. Experimental set-up and station locations. (a) The Simple Oceanographic floating Device (SOD) with Smartfin integrated, 1 m rope with iButton and TidbiT v2 sensors and white disk. Underwater image of the SOD at a station in the North Atlantic. (b) At stations where the currents were pushing the SOD into the side of the RRS James Clark Ross, a telescopic rod was used to extend the rope further away from the ship. (c) Location of SOD deployments on AMT28, overlain onto a SST4 monthly composite of October 2018 from the MODIS-Aqua satellite [37].
Remotesensing 13 00841 g001
Figure 2. Comparison of the temperature sensors (Smartfin, iButton and TidbiT v2) used on the Simple Oceanographic floating Device (SOD) with an NPL-traceable Hart Scientific 1504 temperature bridge and Themometrics ES 225 temperature probe in a recirculating water bath [38].
Remotesensing 13 00841 g002
Figure 3. Latitudinal data collected from the Simple Oceanographic floating Device (SOD), ISAR and underway systems on the Atlantic Meridional Transect cruise 28. (a) Latitudinal transect of SST from the underway CTD and Smartfin. (b) Differences in SST between the Smartfin and underway CTD at stations along the latitudinal transect, with underway Photosynthetically Available Radiation (PAR) plotted in the background. (c) Differences in SST between the Smartfin and ISAR at the stations along the latitudinal transect, with the sea-air temperature gradient (computed independently from the underway CTD and air temperature sensors) in the background. (d) Wind speed at each of the 62 stations, with the along-track wind speed plotted in the background. Station 15 and 16, used in subsequent analysis (see Figure 5), are shown by the dark purple and yellow vertical lines. Dotted lines in (b,c) represent zero.
Remotesensing 13 00841 g003
Figure 4. Histrograms of the differences in SST between sensors on the Atlantic Meridional Transect cruise 28. (a) Differences between the Smartfin and underway CTD. (b) Differences between the Smartfin and ISAR. (c) Differences between the Smartfin and underway CTD for predawn stations only. (d) Differences between the Smartfin and ISAR for predawn stations only. (e) Differences between the Smartfin and underway CTD for noon stations only. (f) Differences between the Smartfin and ISAR for noon stations only. Note for (a,e) one station is not shown (off the scale) where a difference between the Smartfin and underway CTD of 1.21 K was observed (see Figure 3b and Figure 5a).
Remotesensing 13 00841 g004
Figure 5. Near-surface temperature gradients determined from combining data collected on the Atlantic Meridional Transect cruise 28 from the ISAR, the Simple Oceanographic floating Device (SOD, Smartfin, iButton and TidbiT v2), underway CTD and profiling CTD. (a) Data from Station 15 and (b) data from Station 16 (titles are YearMonthDay-HourMinute–StationNumber, where Hour and Minute refer to the start time of the SOD experiment).
Remotesensing 13 00841 g005
Table 1. Mean absolute differences ( ϵ ) and mean differences ( δ ) between SST datasets collected on the Atlantic Meridional Transect cruise 28, using the Simple Oceanographic floating Device (SOD), ISAR and underway systems ( N = number of stations).
Sensors ComparedAll StationsPredawn StationsNoon Stations
ϵ [K] δ [K]N ϵ [K] δ [K]N ϵ [K] δ [K]N
Smartfin − Underway CTD0.06−0.01620.06−0.05310.070.0331
Smartfin − ISAR0.120.09570.130.13280.100.0629
Smartfin − TidbiT v2 *0.05−0.01300.04−0.04160.070.0314
Smartfin − iButton *0.06−0.01310.05−0.05160.070.0415
* For TidbiT v2 and iButton systematic differences with Themometrics ES 225 temperature probe were removed before analysis (see Figure 2).
Publisher’s Note: MDPI stays neutral with regard to jurisdictional claims in published maps and institutional affiliations.

