
Experimental Study on the Thermal Infrared Spectral Variation of Fractured Rock
by
 , ,
, ,
Jianwei Huang
1 ,
,
Shanjun Liu
2,*,
Wenfang Liu
2,
Chunju Zhang
1,
Shuiping Li
1,
Min Yu
1 and
Lixin Wu
3 1
School of Civil Engineering, Hefei University of Technology, Hefei 230009, China
2
College of Resource and Civil Engineering, Northeastern University, Shenyang 110819, China
3
School of Geoscience and Info-Physics, Central South University, Changsha 410083, China
*
Author to whom correspondence should be addressed.
Remote Sens. 2021, 13(6), 1191; https://0-doi-org.brum.beds.ac.uk/10.3390/rs13061191
Submission received: 24 January 2021
/
Revised: 11 March 2021
/
Accepted: 18 March 2021
/
Published: 20 March 2021
(This article belongs to the Special Issue Remote Sensing of Natural and Man-Made Disaster)
Abstract
:Previous studies have shown that thermal infrared radiation (TIR) anomalies occur in the vicinity of fractures that form when a rock is loaded to failure. Different types of fracturing modes correspond to different TIR anomaly trends. However, the spectral features and the mechanisms responsible for the TIR changes in the fracturing stage remain poorly understood. In this paper, experiments involving observations of the thermal infrared spectrum (8.0–13.0 μm) of loaded sandstone during the fracturing stage were conducted under outdoor conditions. The experiment yielded the following results: (1) Different fracturing modes can lead to different trends in the spectral radiance variation; (2) when an extensional fissure appeared on the rock surface, the radiance increased with a local peak in the 8.0–9.7 μm range; (3) when local bulging formed at the surface, the radiance decreased, with a local valley in the 8.0–9.7 μm range. The radiance variation caused by morphologic changes is the combined result of changes in both the temperature and the emissivity. The characteristic waveband corresponding to the reststrahlen features (RF) of quartz was mainly related to the emissivity change. This study provides a preliminary experimental foundation for the detection of crustal surface fractures via satellite-based remote sensing technology.

1. Introduction
Rocks are the main constituent of the crust, and surface rocks experience dynamic crustal stress. The increase and accumulation of crustal stress can lead to deformation and fracturing of rocks, resulting in rock failure and geological disasters, such as earthquakes, landslides, rock bursts, and crustal ruptures. Rock failure can result in different types of surface fracturing modes, including extensional fissures, local bulging, and subsidence, along active faults [1,2,3]. Hence, basic information on crustal activity, including the deformation mode, motion state of a fault and the fracture process, can be reflected by the movement characteristics of surface rupture [4,5,6].
Presently, studies on the correlation between crustal movement and fault activity have rapidly progressed with the development of satellite-based remote sensing technology, such as GPS [7], InSAR, and gravimetry systems [8,9]. Furthermore, satellites have detected thermal infrared radiation (TIR) anomalies in faulted regions before and after strong earthquakes [10,11,12]. Studies have shown that the analysis of the correlation between the TIR features and the seismic activity in an active fault area is helpful for improving the accuracy of seismic TIR recognition [13,14].
To determine the internal mechanisms of the TIR anomalies related to earthquakes, a series of experiments involving TIR imaging observations of loaded rock was performed [15,16,17]. The results showed that the TIR intensity increases as the stress increases [18,19] and that anomalies occur in the fracturing stage [20]. Tensile fracture and shear failure can lead to different trends of TIR change. The frictional heating effect is the main factor leading to TIR anomalies on the rock surface [21,22,23,24]. Thus, the temporal-spatial features of the TIR anomalies can indicate the fracture properties of the rock [25,26] and identify the instability of active faults [27].
However, according to TIR theory, the radiation received by the satellite sensor is influenced by multiple factors, and the radiative transfer is complex. Compared to satellite observations, the radiance is related to not only the physical temperature but also the surface emissivity and background radiation under lab conditions [28,29,30]. Previous studies have focused on the variation in the total radiation energy in a certain wavelength range based on thermal infrared thermography, without considering the spectral radiance and the emissivity. The wavelength features of the TIR change were not considered.
Therefore, further studies can be divided into two aspects. First, to investigate the emissivity regulation of different types of rocks and minerals, thermal infrared spectrum observation experiments in different lithologies [31,32,33], incline angles [34,35], and roughnesses [36,37] were performed and analyzed. Because of the relatively strong background radiation, emissivity under indoor conditions is easily submerged by the relatively strong background radiation [38,39]. The change in the roughness and observation angle can lead to a change in emissivity by observing the heated rock samples under lab conditions, thereby leading to radiance variation [40]. The morphology of the rock surface changed significantly when the fracturing behavior appeared and developed in the loading process. Therefore, we can infer that the radiance variation in fractured rock is related to not only the change in temperature but also the change in emissivity caused by morphological changes.
Additionally, experiments on the spectral radiance variation in loaded rock were conducted to reveal the wavelength features. The results showed that the radiance increases as the stress increases and that there are wavelength differences associated with the spectral radiance variation [41,42]. The quantitative analysis results under laboratory conditions showed that there are stress-sensitive wavebands of the radiance variation for loaded rock and that the sensitive waveband corresponds to the reststrahlen features (RF) waveband of the mineral components of the rock [43,44]. To reveal the mechanism of the sensitive waveband of the thermal infrared radiance change in the rock loading process, a series of meaningful work on TIR observation experiments for loaded rock was performed by Freund and some scholars. The infrared radiation of the anorthosite exhibits clear changes because of excitation of the Si-O stretching modes before failure with the “P-hole” hypothesis [45]. The broad emission bands at 1170 cm−1 and 1030 cm−1 (8.7 and 9.7 µm) also increase slightly in intensity before failure [46]. The mechanism of the energy deposited into the surface through p-hole recombination was explained in further studies [47,48]. Additionally, it has been proven that the radiance variation is easily counteracted under indoor conditions [49]. A thermal infrared spectrum observation experiment under outdoor conditions was performed, and it can be confirmed that the stress change could lead to not only a temperature change but also a spectral emissivity change. The thermal infrared spectral radiance change in the elastic stage was the comprehensive result caused by both the temperature and spectral emissivity change [50]. However, there remains a lack of studies focused on the waveband features and the mechanisms responsible for the spectral radiance variation of rock in the fracturing stage.
Therefore, analysis of differences in the spectral radiance caused by different types of fracturing modes and the correlation between the radiance variation features and the fracturing mode will be helpful in exploring the mechanism responsible for the TIR changes in the fracturing stage. To reduce the influence of indoor background radiation and to be consistent with satellite-based observation conditions, observations of the TIR spectrum focusing on spectral radiance changes during the fracturing stage of a horizontally loaded sandstone sample were conducted under cold-sky background conditions [51,52]. The waveband features of the spectral radiance variation related to different fracturing modes and the correlation between the waveband features and the fracturing mode were analyzed. Then, the mechanism linking the radiance variation and the surface fracturing is explored. The results could provide a preliminary experimental foundation and advantageous wavebands for monitoring the surface fracturing modes of earthquakes via remote sensing technology.
2. Materials and Methods
2.1. Experimental System
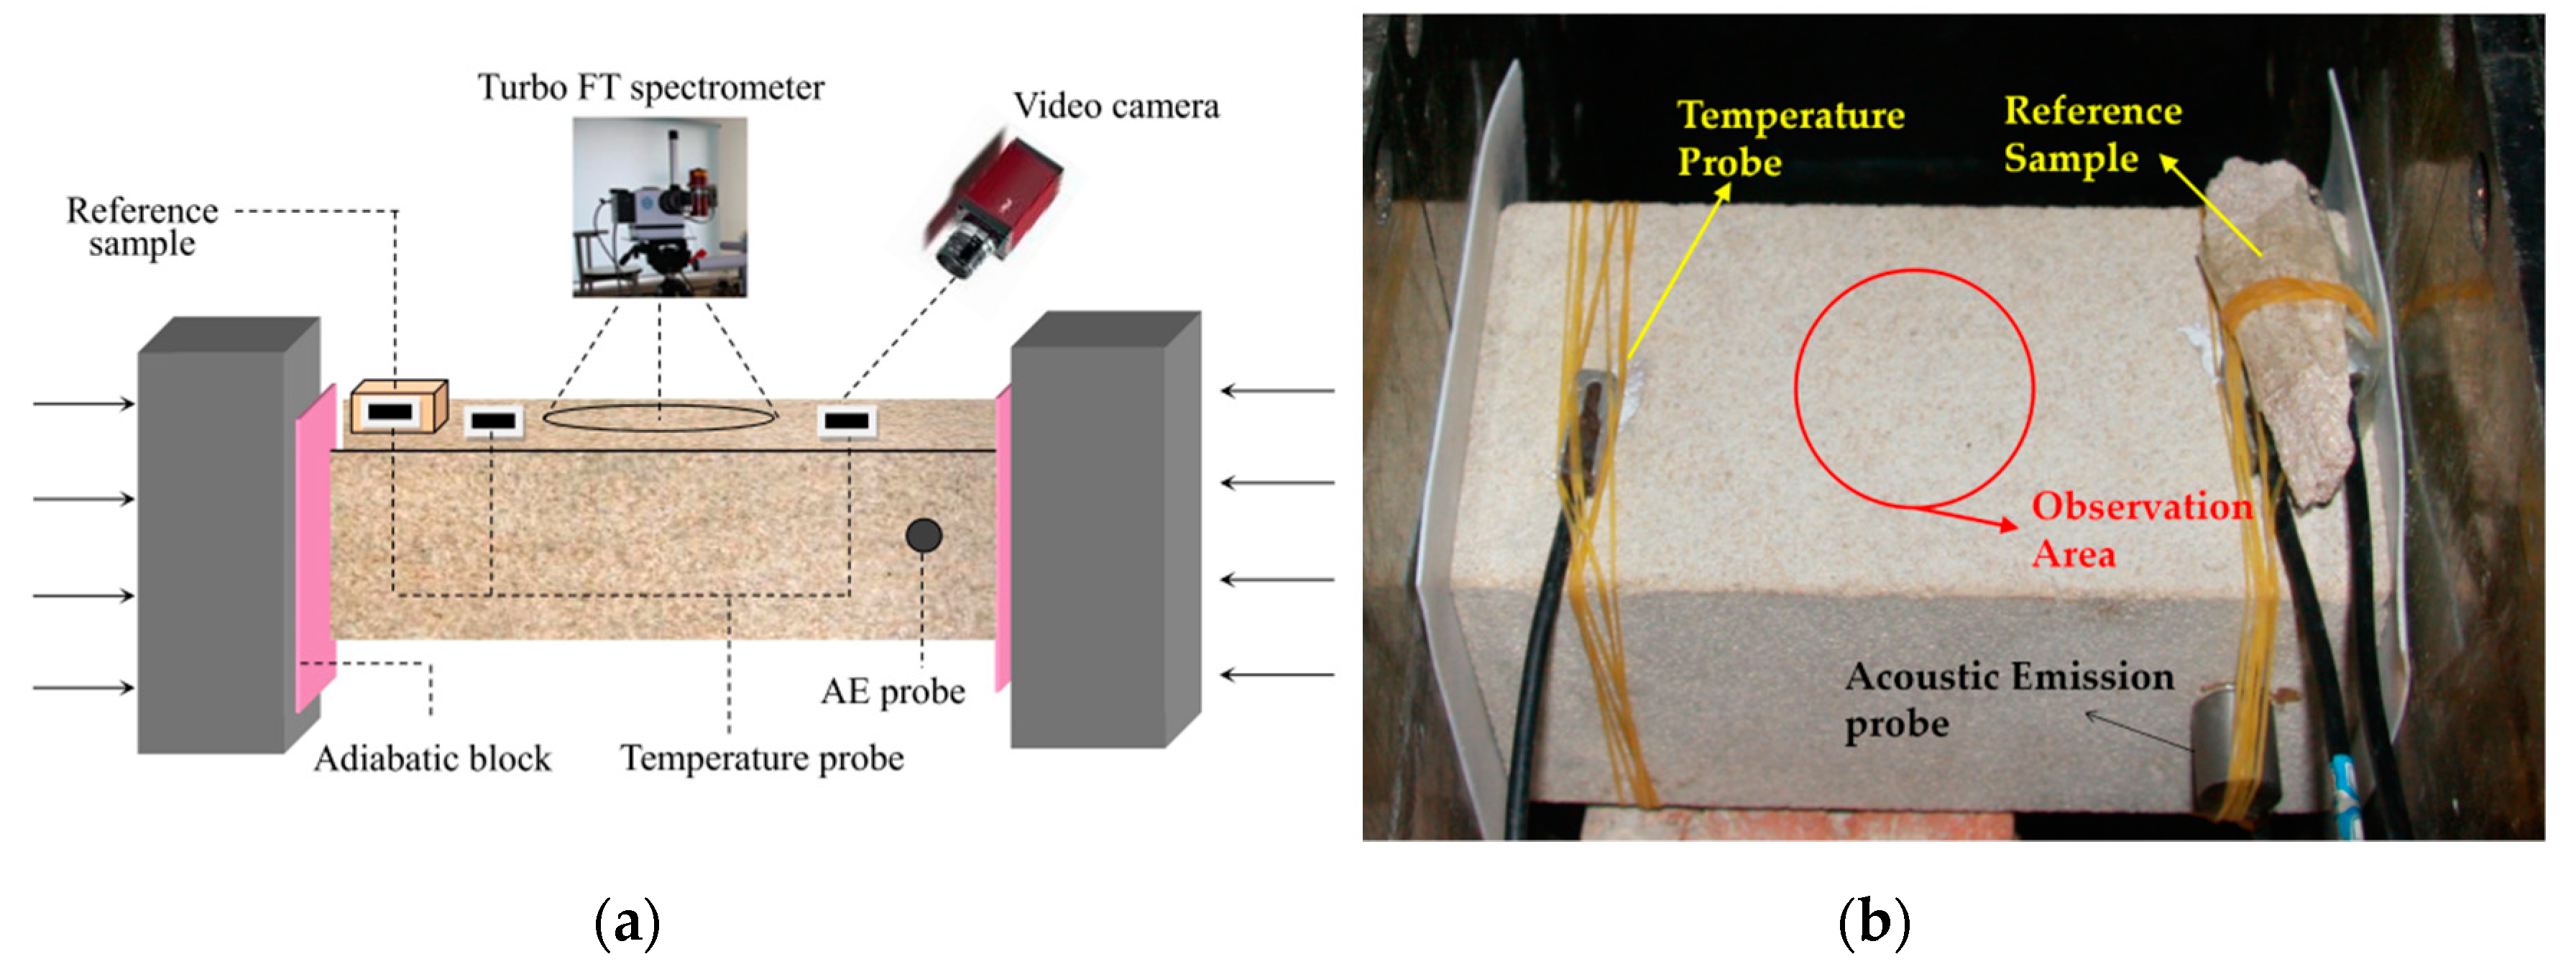
The experimental measuring system comprised a horizontal load-testing machine, a Fourier transform infrared (FT-IR) thermal infrared spectrometer, a temperature-testing system, and a small video camera. The establishment of the experimental system, the parameters of the instrument, and the calibration of the environment and instrument have been described in detail in [50]. The experiment was conducted at night from 18:00 to 21:00 in September to avoid the influence of solar radiation. Additionally, two sheets of 1-mm-thick polytetrafluoroethylene (PTFE) pads were placed between both of the loading ends and the sample. The ambient temperature change was less than 0.1 °C during the designed 10 min, indicating that the environment was stable and that the heat conduction could be ignored.
Apart from the aforementioned instruments, to detect the generation and development of fractures in the rock loading process accurately, the AE (acoustic emission) monitoring system of PCI-2 with the R6α sensor was used [40]. Its detection frequency range was from 1 kHz to 3 MHz. The gain value of the preamplifier was 40 dB, and the threshold value of the AE sampling signal was 45 dB. To record the rock surface morphology changes during the loading process, one small visible-light video camera with a 960 × 600-pixel resolution was positioned near the sample.
2.2. Experimental Method
Eight quartz sandstone samples were selected for the experiment. All the samples were cut into rectangles with dimensions of 10 cm × 10 cm × 20 cm. The top and bottom faces of each sample were parallel within an error of 0.1 mm. The sandstone samples were labeled “sy20–1” to “sy20–8”, where “sy” represents quartz sandstone [50].
Each sample was loaded to failure at a constant rate of 1.5 kN/s. The spectrometer with an observation view angle of 2.4° was placed perpendicular to the sample at a distance of 80 cm, and this distance produced a circular observation area, 4.0 cm in diameter, on the sample surface (the red circle in Figure 1b). The radiance data from the center of the sample surface were recorded by the spectrometer. The measured radiance under outdoor conditions is influenced by instrumental noise and water vapor, which could lead to fluctuations in the radiance data. According to the calibration results [50], radiance data in the wavelength range of 8.0–13.0 μm (corresponding to the atmospheric window of TIR and the RF waveband in the emissivity spectrum of sandstone) were selected and analyzed [53,54].
With adhesive material, the temperature probes were attached to the rock surface outside of the spectrometer observation area to record temperature data during the loading process. The sampling rates of both the spectrometer and the temperature tester were set to 1 fps. The acoustic emission probe was placed on the side of the sample. A photo of the temperature probe and the AE probe arrangement is shown in Figure 1b. A period of static observation before the formal experiment (more than 5 min) was conducted to ensure that all the instruments were working consistently and that the environment was stable. The outdoor experimental scene and a schematic diagram of the instrument arrangement are shown in Figure 1.
3. Results
3.1. Fracturing Mode
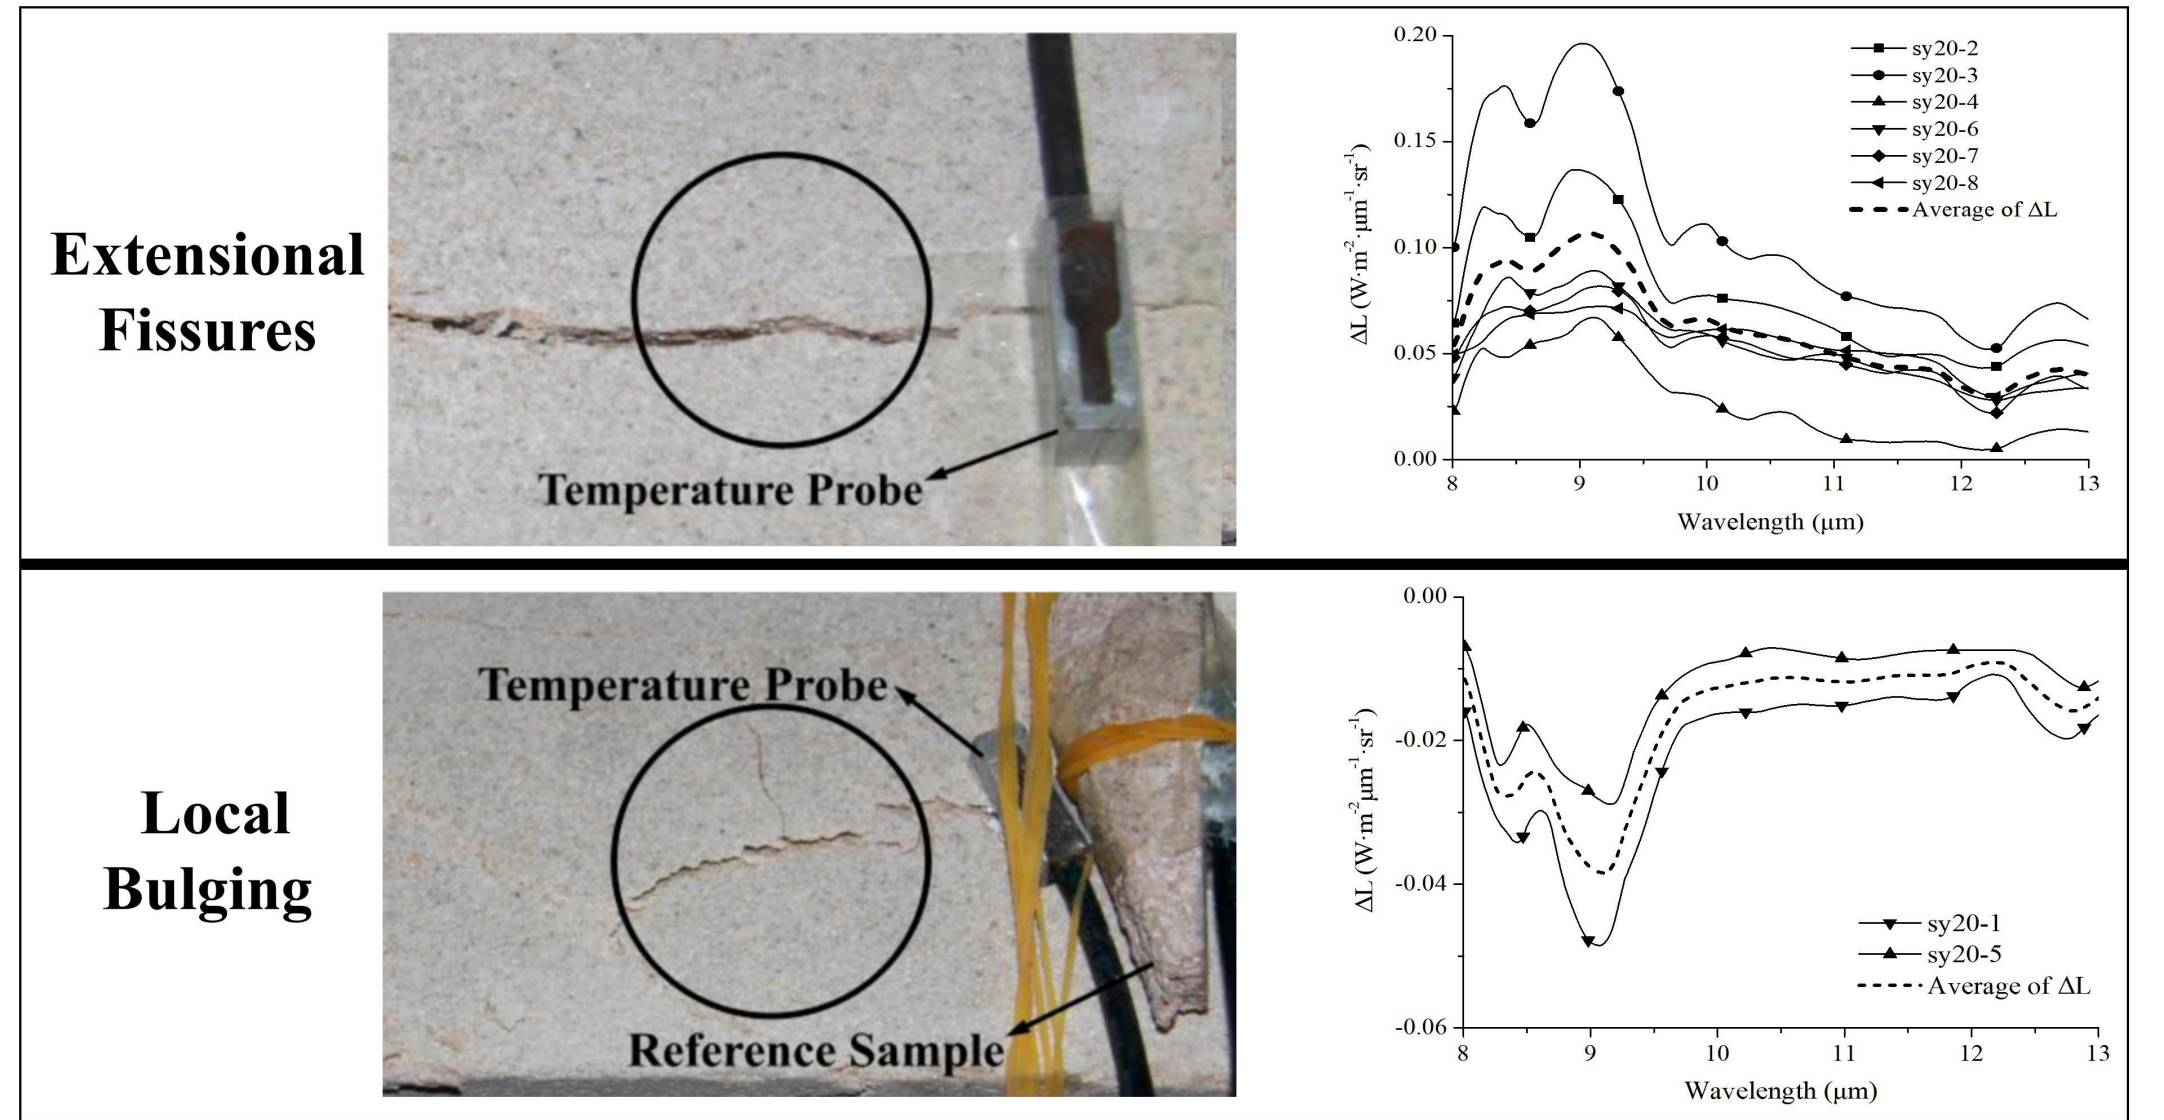
The features of earthquake-induced surface ruptures mainly include extensional fissures, local uplift, bulging, and subsidence [4,5,6,51]. In this experiment, there are two macroscopic fracturing modes: extensional fissures and local bulging.
3.1.1. Extensional Fissures
The direction of the rupture surface is parallel to the loading direction and forms a “V” shape in the cross section. This rupture feature represents a tensile fracture in terms of mechanical properties. Six samples exhibited this type of fracturing, and Figure 2a shows a photograph of a typical sample (sy20–3). The black circle in Figure 2 represents the observation area of the spectrometer.
3.1.2. Local Bulging
The second fracturing mode is local bulging of the observation surface. One side of the crack bulges upward, blocking the spectrometer’s view of the other side because of the different heights of the two sides and the resulting shadow effect and shelter effect. This fracturing mode was similar to the layered fracture in [51]. Two samples exhibited this type of fracturing, and a photograph of sy20–1 is shown in Figure 2b.
3.2. Preprocessing Method for Radiance
To reduce the impact of noise and to extract information related to the variation in radiance more accurately, a wavelet denoising method was performed. The sym5 wavelet basis function was selected to reduce the noise in the original radiance curve. If the standard deviation between the original radiance and the denoised radiance is less than 0.01 W·m−2·μm−1·sr−1. Then, the difference in data processing method was performed [43,44,50]. The initial radiance in the loading process, L(t0,λ), was selected as the reference and subtracted from the measured radiance at moment ti in the fracturing stage, L(ti,λ). The relative radiance difference between moments t0 and ti, ΔL(ti,λ), can be defined as follows:
where λ is the wavelength. ΔL(ti,λ) can be calculated and used to analyze the characteristics of the radiance variation at different wavelengths.
3.3. Stages Division
Figure 3a shows both the sample temperature curve and the stress curve during the loading process. Figure 3b shows the spectral radiance variation curve at 9.1 μm and the AE energy curve. The whole loading process can be divided into three stages, i.e., initial stage I, elastic loading stage II and fracture development stage III.
The sample temperature increases as the stress increases during stages I and II, resulting in an overall increase of approximately 0.2 K. The increase is related to the thermoelastic effect and is in keeping with the results of previous studies [23,24,25,26]. The experimental results for the loading sandstone in the elastic stage were analyzed in [50]. The increase in thermal infrared radiation in stage II was the comprehensive result of both the temperature and emissivity changes. The change in emissivity was the main reason leading to the waveband features of the spectral radiance change.
However, when the stress reaches the peak value, there is an obvious peak on the AE curve at 429 s and rock fractures in the observation area. The extensional fissures result in stress relaxation and increases the contact area between rock surface and air, leading to a temperature decrease, as shown in Figure 3a. A large area of decreasing temperatures in wall rocks and increasing temperatures in sporadic sections of the fault indicate entrance into the meta-instability stage [20]. However, there is a significant increase in the spectral radiance curve in Figure 3b at 429 s. There are opposite trends on the temperature variation curves and the spectral radiance variation curve. Then, with the development of rock fractures, the fissure expanded, and the spectral radiance increased slightly.
According to the previous results, the friction effect can result in a significant temperature change in the microfracture development stage and fracture stage. Additionally, morphologic changes can lead to changes in surface roughness, inclined angle, radiation propagation and so on [34,35,36,37,40]. Combined with the results in the elastic stage, we can infer that the thermal infrared radiance change in the fracture stage is the combined result of both the temperature and emissivity change as well. The emissivity change with morphological changes on the sample surface could be the main factor leading to spectral radiance variation.
3.4. Analysis of the Spectral Radiance Variation
The experimental results show that the two fracturing modes result in different radiance variation patterns. These two radiance variation patterns are analyzed below.
3.4.1. Extensional Fissures
Six samples exhibited extensional fissures, and the six curves of the radiance changes with wavelength are plotted in Figure 4. Figure 4 shows that the amplitudes and the local trends of these six curves are discrete. However, the overall trends of all the curves are similar, with upward trends in the range of 8.0–9.7 μm and downward trends in the range of 9.7–13.0 μm.
To quantitatively assess the similarity of these six radiance increment spectra, the average radiance spectrum for these six samples, which is defined as ΔLz(λ), was calculated first. Then, the similarity coefficients between the six spectra and the ΔLz(λ) spectrum were calculated. The similarity coefficient results are listed in Table 1, and all the coefficients are larger than 0.9. The shape and wavelength features of these six spectra is almost in accordance with ΔLz(λ). Therefore, the ΔLz(λ) spectrum (the dashed curve in Figure 4) can be used to analyze the radiance variation characteristics of the sandstone samples with extensional fissures.
Figure 4 shows that the amplitude of ΔLz(λ) is relatively large in the 8.0–9.7 μm range with an “M” shape. And the curve exhibits a decreasing–increasing–decreasing trend in the 9.7–13.0 μm range. There are three local peaks at 8.4 μm, 9.1 μm, and 12.7 μm and two local valleys at 8.6 μm and 12.2 μm in the ΔLz(λ) curve. The curve reaches a global maximum value at 9.1 μm.
Then, a comparative analysis of ΔLz(λ) and the ε(λ) curve of for sandstone was conducted. ε(λ) is the emissivity spectrum of sandstone surface in the static condition. Figure 5 shows that the trends of these two curves are opposite throughout the entire wavelength range. The two local valleys at 8.0–9.7 μm and 12.2–13.0 μm on the ε(λ) curve correspond to two peaks on the ΔLz(λ) curve. Based on the spectral emissivity features of the sandstone samples, these two wavelength ranges correspond to the RF waveband of ε(λ). It can be inferred that a correlation exists between the radiance variation and emissivity.
3.4.2. Local Bulging
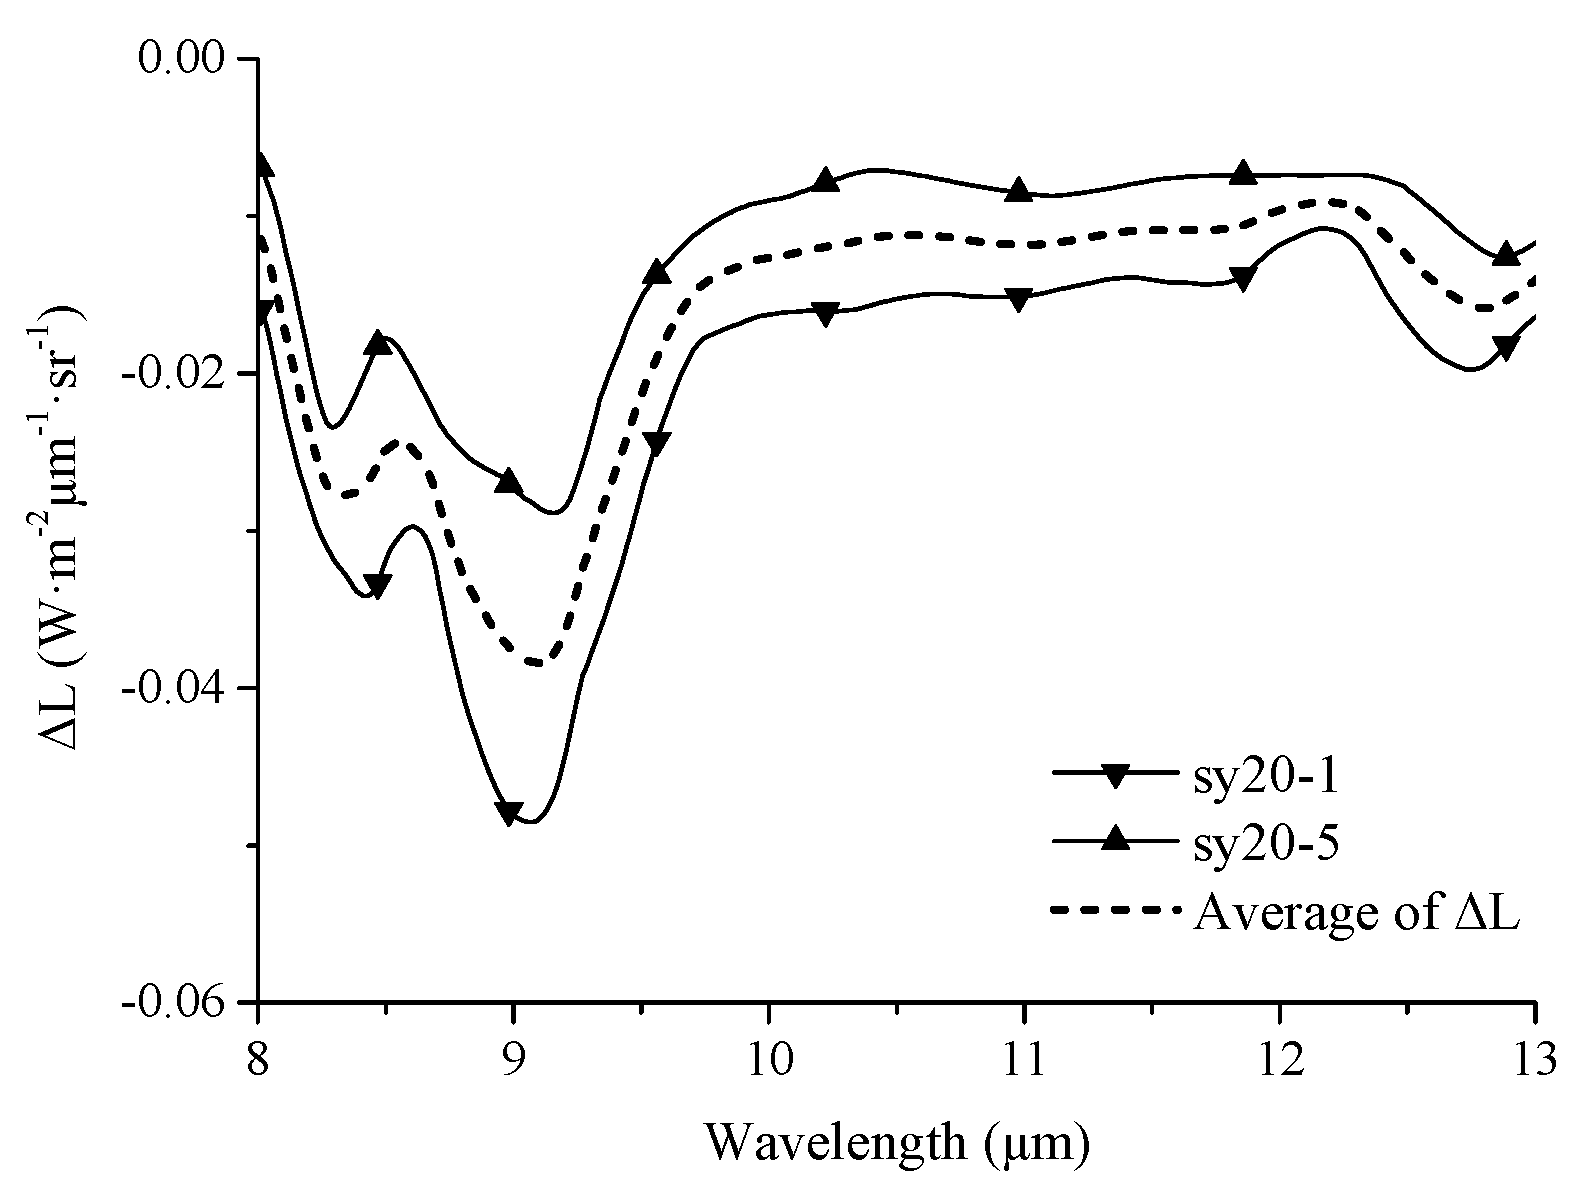
When local bulging appears at the sample surface, the radiance decreases compared to that of the previous moment prior to fracturing (the end of the elastic stage). The changes in radiance between the moments after and before the rupture for these two samples were calculated, and the curves are plotted in Figure 6 as the solid line. The trends of the curves are similar, and the average curve, ΔLF(λ), is also plotted in Figure 6 as a dashed line.
Figure 6 shows that (1) the ΔLF(λ) curve is negative over the entire wavelength range, indicating that the radiance decreases when local bulging appears; (2) there are two local valleys at 8.0–9.7 μm and 12.2–13.0 μm, with the former featuring a greater depth that reaches a minimum at 9.1 μm; and (3) the trend of ΔLF(λ) is similar to that of ε(λ) in Figure 5. The radiance variation caused by local bulging is therefore also related to the emissivity.
4. Discussion
The experimental results of these two fracture modes indicated that there is an effective temporal–spatial corresponding relationship between the spectral radiance variation and the fracture mode. Compared to the results of the radiance variation and temperature change, it can be inferred that the radiance variation patterns caused by different fracturing modes are both related to ε(λ) in addition to the temperature change. Therefore, the radiance components received by the sensor are analyzed first. Then, the factors and the mechanism responsible for the radiance variations associated with the two fracturing modes are analyzed.
4.1. Theoretical Analysis of the Energy Components Reaching the Spectrometer
According to the working principle of the spectrometer, the atmospheric effects can be minimized by taking measurements close to the target surface. The spectral radiance field reaching the sensor in the static condition, L0(h,θ,λ), can be defined as follows [29,30]:
where Ts is the temperature of the sample surface (K), λ is the wavelength (μm); h is the height of the instrument above the sample (m); θ is the zenith angle of the sensor with respect to the earth normal; θt is the zenith angle of the sensor with respect to the target normal; ε(θt,λ) is the static spectral emissivity at a zenith angle of θt. Ldwr(λ) is the downwelling radiance under the experimental conditions (W·m−2·μm−1·sr−1), which was measured with an InfraGold standard reflecting plate; and Lbb(Ts,λ) is the spectral blackbody radiance at a temperature of Ts (W·m−2·μm−1·sr−1), which can be calculated via Planck’s law. The observation angles θ and θt and the height h can be regarded as constants during the loading process. Based on these assumptions, Equation (2) reduces to the following:
Equation (3) shows that the static radiance reaching the sensor is related to three factors: the temperature of the target surface, Ts; the surface emissivity, ε(λ); and the downwelling radiance, Ldwr(λ), which can be regarded as constant during the relatively short loading period (which is less than 10 min). The temperature of the sample changes because of the frictional heating effect and the stress relaxation in the fracturing stage [22,23]. Additionally, changes in the surface morphology can lead to changes in emissivity. Hence, the radiance variation is mainly caused by the temperature variation, ΔTs, and emissivity variation, Δε(λ). The radiance in the fracturing stage can be expressed as follows:
The change in the radiance during the fracturing stage compared to the radiance at the initial moment, ΔL1(λ), can be expressed as follows:
Equation (5) shows that the radiance variation is affected by both the temperature and the emissivity variation. The first part is the radiance variation related only to temperature change, ΔLT(λ) = ε(λ)[Lbb(Ts + ΔTs,λ) − Lbb(Ts,λ)]. The waveband feature of ΔLT(λ) have been discussed in [50]; the second part is the radiance variation related to both the temperature and emissivity changes, ΔLε(λ) = Δε(λ)[Lbb(Ts + ΔTs,λ) − Ldwr(λ)]. The trends of ΔTs and Δε(λ) differ between the two fracturing modes, leading to different trends in the radiance variation. Therefore, the mechanisms of the radiance variation for the two fracturing modes are analyzed separately in the followings paragraphs.
4.2. The Mechanism of Radiance Variation for Extensional Fissures
When extensional fissures appear on the surface, the fracture region can be regarded as a cavity with a “V”-shaped cross section. Osterloo classified the cavity effect into high reflection cavities (HRCs) and low reflection cavities (LRCs), and the multiple reflections of HRCs can result in shallowing of spectral features [37]. The schematic for the radiation transmission is plotted in Figure 7, which is similar to the HRC. More than one reflection of the radiation occurs before it exits the cavity. Hence, the radiance received by the spectrometer can be divided into two parts: (1) the radiation in the intact region that travels directly to the sensor, labeled ① in Figure 7, and (2) the radiation in the fractured region repeatedly reflected by the interior of the fracture before traveling to the sensor, labeled ② and ③ in Figure 7. Because of the complex directionality of multiple reflections, the radiation at a relative large zenith angle cannot be received by the radiometer. The radiation in the certain angle range received by the instrument represents a comprehensive product from the cavity’s surface.
Therefore, an extensional fissure will lead to a radiance change. Farden showed that the cavity effect will change the effective emissivity, which can be defined as follows [55]:
where εe(λ) is the effective emissivity, n is the number of reflections, and ε(λ) is the emissivity of the intact region and the interior walls. The difference in emissivity values between the fractured region and the original intact surface, Δε(λ), can be defined as follows:
Equation (7) shows that (1) the values of ε(λ) are different at different wavelengths in the range of 0–1 (plotted in Figure 5), leading to different positive values on the Δε(λ) curve. Thus, εe(λ) increases when a tensile fissure appears, and Δε(λ) is a function of the wavelength. (2) Because n is affected by the depth and width of the cavity, an increase in n could lead to a larger variation in emissivity. Hence, different types of extensional fissures could result in different changes in emissivity.
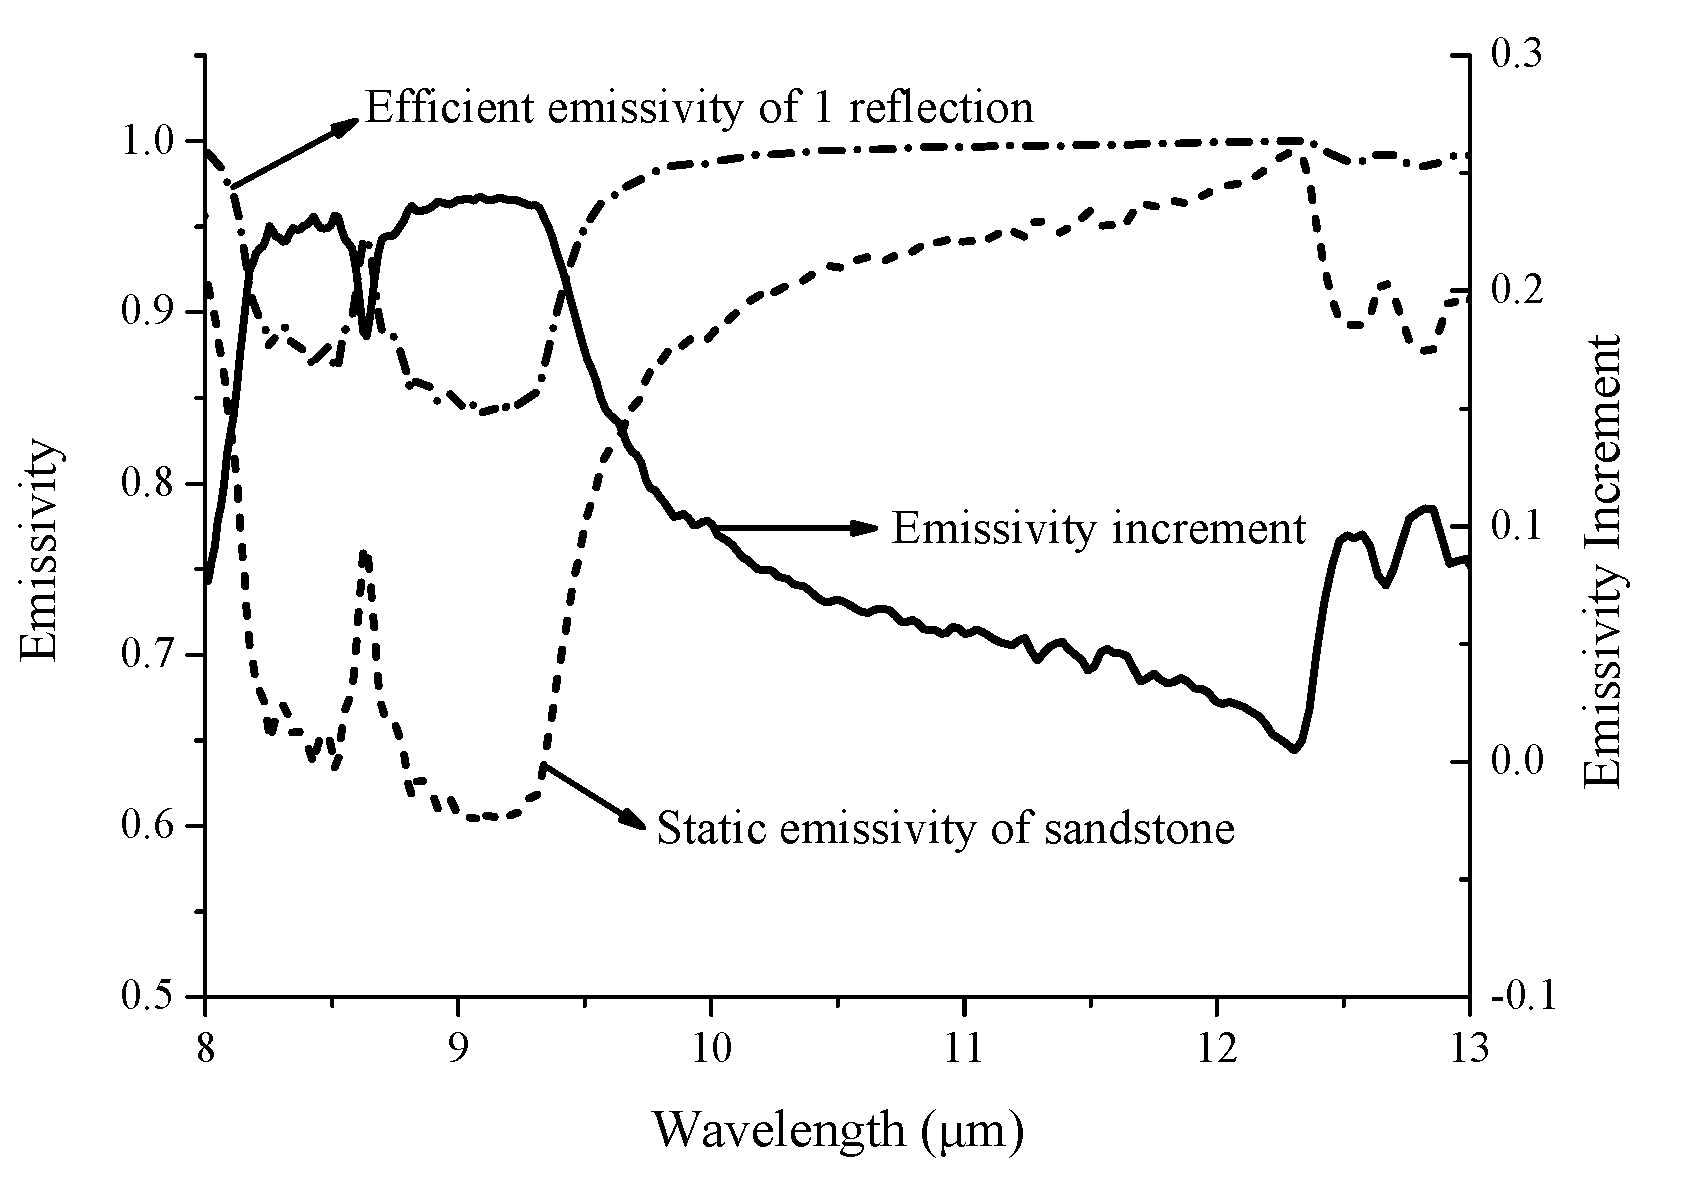
To verify that Δε(λ) is caused by the cavity effect, this study assumed n = 1 and then calculated the ε(λ), εe(λ) and Δε(λ) curves, which are plotted as the dot-dashed line, the solid line and the dashed line, respectively, in Figure 8. The following conclusions were reached. (1) There are still local valleys at 8.0–9.7 μm and 12.2–13.0 μm in the εe(λ) curve after 1 reflection, but the depths of the valleys are significantly less than those of ε(λ). (2) There are two peaks on the Δε(λ) curve, which indicates that Δε(λ) is relatively large in the RF wavelength range. (3) The magnitude of Δε(λ) caused by the cavity effect is 10−1.
Considering that the Δε(λ) curve cannot be measured directly in the experiment, the variation in the emissivity should be analyzed based on the radiance variation data. Figure 2 shows that the observation area is composed of intact and fractured regions. As the Δε(λ) and ΔTs values are different in these two regions, the measured radiance is the weighted average value of the radiance from both the intact region, LW(λ), and the fractured region, LP(λ). The radiance in these two regions can be calculated as follows:
where ΔεP(λ) is the emissivity variation in the fractured region caused by the cavity effect, which is calculated with Equation (7); ΔεW(λ) is the emissivity variation in the intact region, which is equal to the emissivity variation related to the stress variation at the end of the elastic stage [50]; ΔTP and ΔTW are the temperature variations in the fractured and intact regions, respectively; and Ldwr(λ) was considered stable during the loading process. Figure 2 shows that the gray information of the two regions is different, and the areas of the two regions and the observation area can be calculated by the image binarization process based on the photograph. Therefore, the total radiance received by the sensor after an extensional fissure appeared, L2(λ), can be expressed as follows:
where p is the ratio of the fractured region to the whole circular observation region. The radiance variation compared to the initial moment, ΔL2(λ), can be expressed as follows:
Based on the measured data and the photograph of sample sy20–3, the results show that the ratio of the fractured region p = 0.1. The ΔTW decreases by −0.13 K from 288.81 K to 288.68 K in stage III. LP(λ) is the combined result of the reflections in the cavity region, while ΔεP(λ) and ΔTP cannot be measured directly. Both the reflections and ΔTP are adjusted step-by-step to obtain a result that closely matches the measured radiance spectra (the solid line in Figure 9). The best fitting calculated radiance spectra, where n = 2.2 and ΔTP = 0.52 °C, is plotted in Figure 9 as the dashed line. The comparison shows that the trends of these two curves are similar, with a relatively large local peak at 8.0–9.7 μm and a smaller local peak at 12.3–13.0 μm.
Additionally, irregularities in the cross sections and fissures could lead to differences between the calculated and measured results for each sample. Furthermore, differences in the aspects of the fissures, such as the length, depth, width, and path, among the six samples could lead to differences in amplitude among the six curves. However, the similarity between the overall trend of the six measured radiance curves and the simulated results shows that the radiance variation associated with extensional fissures is caused by the combined effects of temperature and emissivity changes. The increase in εe(λ) caused by the cavity effect is the main factor leading to an increase in radiance and peaks in the RF wavelength range.
4.3. The Mechanism of Radiance Variation for Local Bulging
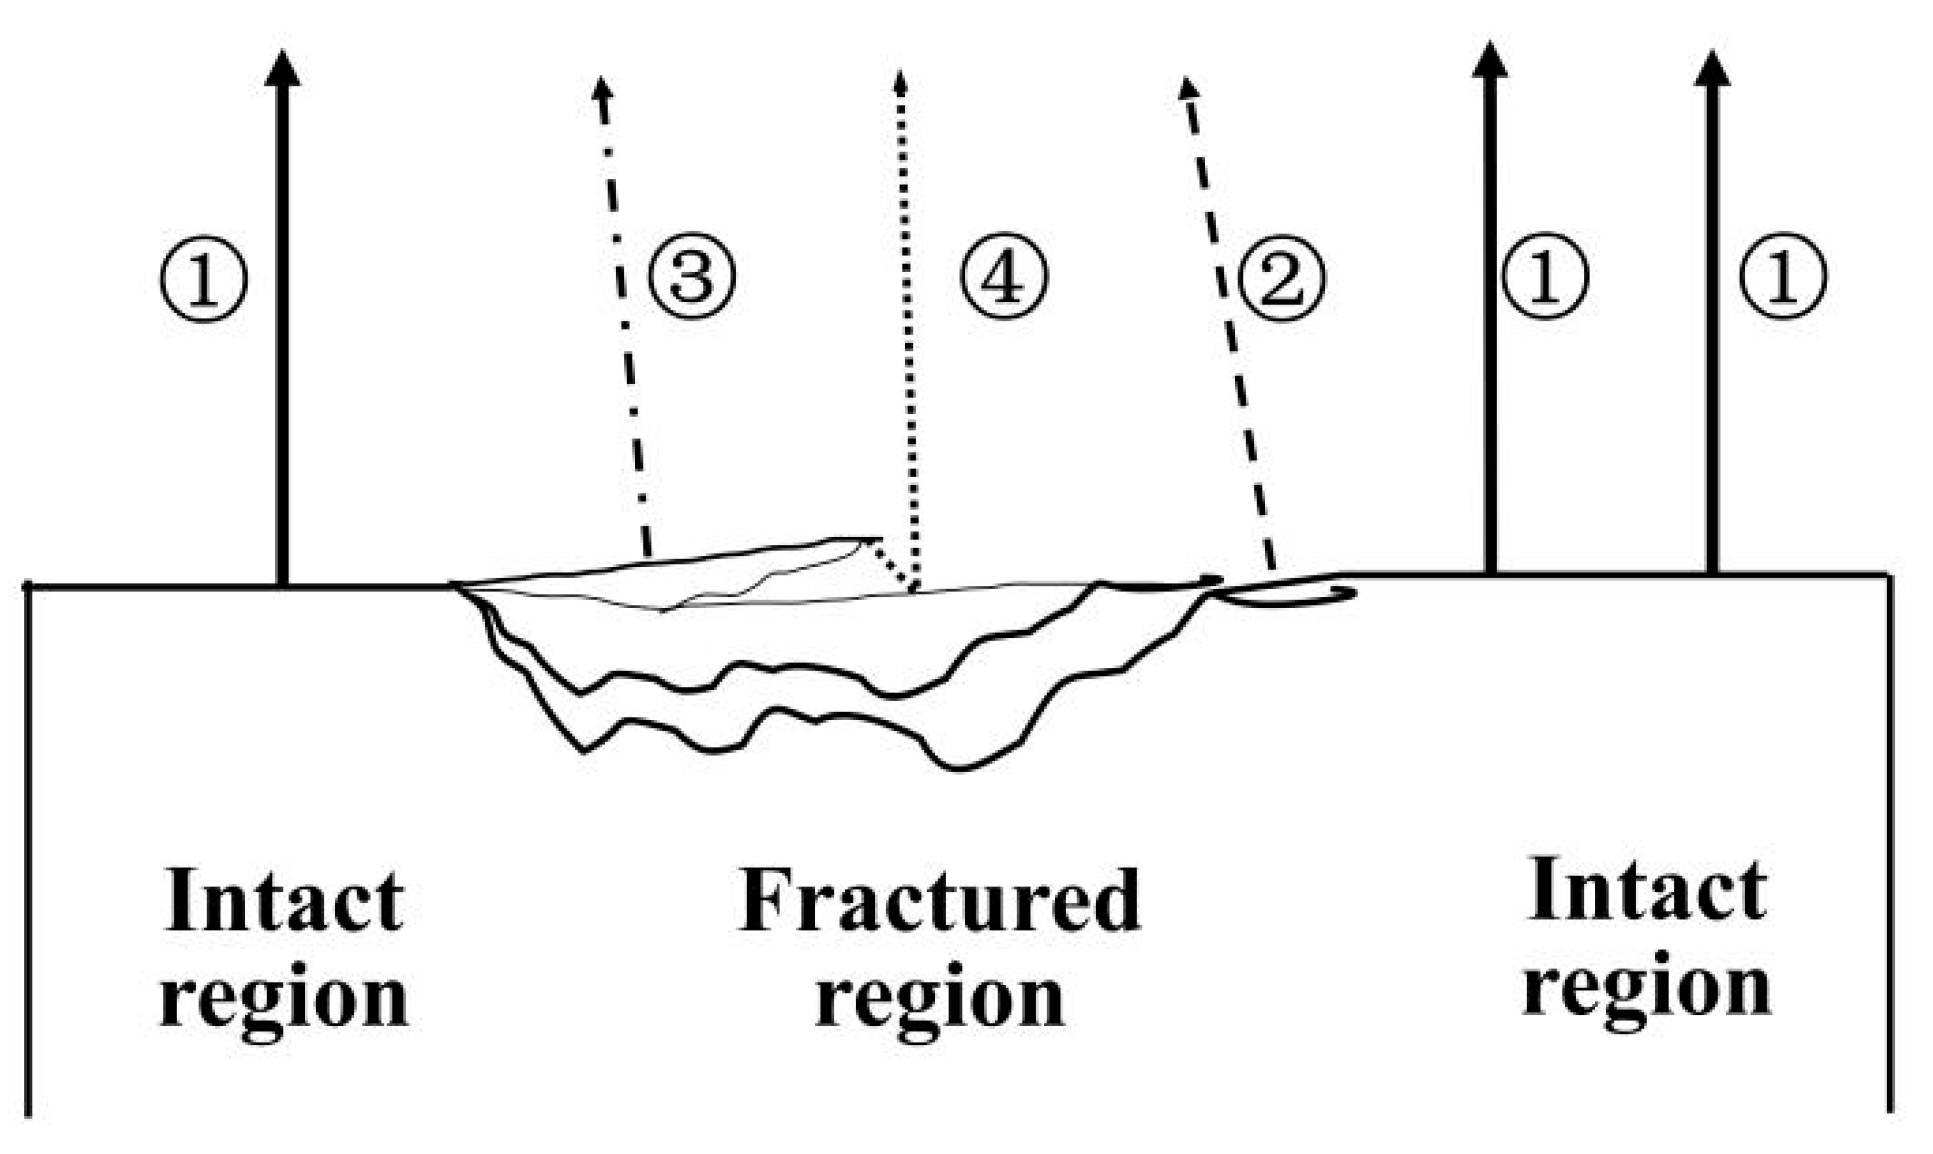
Figure 6 shows that the radiance following the formation of local bulging on the observation surface is less than that prior to the formation of local bulging. The trend of the ΔLF(λ) curve is similar to that of the ε(λ) curve. Compared to the spectral radiance decrease result in this paper, the microwave brightness temperature decreases when layered fractures appear on the observation surface with a similar layered fracturing mode in [51]. According to the fracturing mode and the surface morphology of local bulging, the schematic for the radiation transmission was plotted in Figure 10. Based on the theoretical analysis, the emissivity and temperature variation can be analyzed as follows:
- The radiance received at the initial moment travels perpendicularly to the sample surface, which is labeled ① in Figure 10.
- Compared to the perpendicular radiation, the local bulging could lead to a change in the observation angle θt on the flat inclined surface and raised surface, which is labeled ② and ③ in Figure 10, respectively. The raised surface can be regarded as multiple continuous smooth facets with different inclined angles. The change in θt lead to a decrease in ε(λ) [34,35], resulting in a decrease in radiance.
- There could be multiple fracture layers leading to different heights, resulting in the interaction. The change in radiance propagation can decrease the received radiance. The shadow and shelter effect [55] by the interaction between the fractured and intact regions can affect the received radiance, which is labeled ④ in Figure 10. It is noted that the cavity effect can also result by the interaction of multiple inclined surfaces. The enhanced radiance emitted at a large angle cannot be received by the sensor.
- According to the thermoelastic effect, the stress relaxation in the fractured region causes a decrease in temperature. The contact area between the sample and the environment increased when local bulging appeared. The improvement of the heat dissipation area can lead to a decrease in the temperature as well.
Therefore, the radiance variation for local bulging exhibits complex relationships with the changes in the temperature and emissivity. An analysis was performed to simulate the radiance variation. The radiance variation caused by local bulging, ΔL3(λ), can be defined as follows:
where ε3(λ) and Ts3 are the emissivity and the temperature of the sample surface at the end of the elastic stage, which are equal to εW(λ) + ΔεW(λ) and TS + ΔTW in Equation (9), respectively, and Δε3(λ) and ΔTs3 are the effective emissivity and temperature variations of the entire observation area, respectively, in the fracturing stage. Δε3(λ) can be calculated based on the radiance variation results as follows:
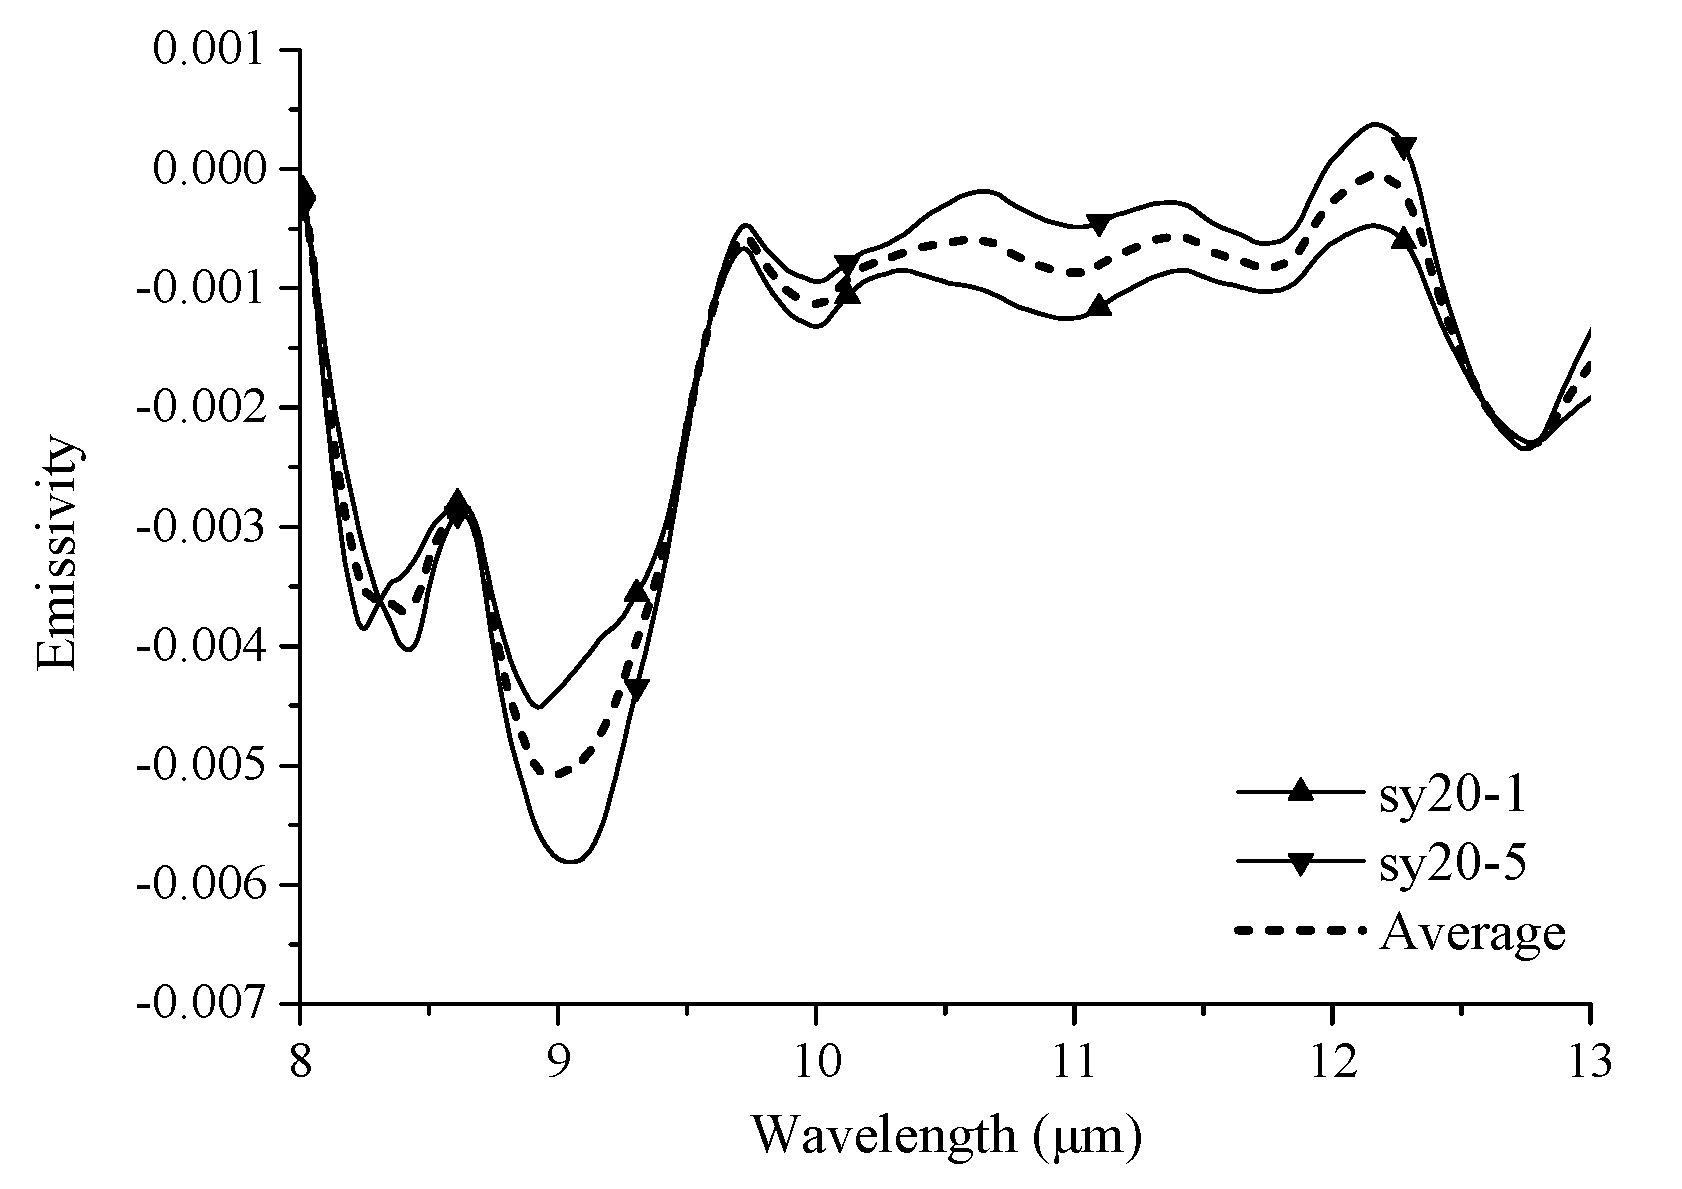
ε3(λ) and Ldwr(λ) can be measured under static conditions, and ΔL3(λ) and ΔTs3 were measured in the fracturing stage. The Δε3(λ) curves of the two samples (the solid lines) and the average curve (the dashed line) are plotted in Figure 10.
Figure 11 reveals the following points. (1) The Δε3(λ) curve is negative for the entire wavelength range, and there is a local valley in the RF wavelength range. Therefore, the effective emissivity decreases for this fracturing mode. (2) The magnitude of Δε3(λ) is 10−3, which is much lower than that of the extensional fissures. (3) The Δε3(λ) curve fluctuates in the 9.7–12.0 μm range.
The complexity of the morphology changes could result in the diversity of the radiance changes associated with the local bulging mode because of the following reasons: (a) the diversity of the changes in the morphology, angle, and temperature decrease; (b) the area and the angle of the bulging could lead to diverse changes in the interaction and shadow effects; and (c) some particles appeared on the fractured surface, and the change in surface roughness can result in surface scattering and volume scattering [36,37], thereby affecting the emissivity in the 9.7–12.0 μm range (corresponding to the transparency feature (TF) waveband of sandstone).
4.4. The Potential Significance of Emissivity Changes in the Fracturing Stage For the Experimental Condition
4.4.1. The Contribution of the Emissivity Change
This work confirms that the radiance variation is related to not only the temperature change but also the emissivity change after rock fracture in the outdoor condition. However, the radiance variation in the fracturing stage was not further analyzed in the previous studies under lab conditions [42,43,44,45]. Based on the theoretical analysis in this manuscript, the radiance variation can be discussed as follows. First, the lab (indoor) condition can be regarded as enclosed, and the downwelling radiance in the indoor condition, Ldwrin(λ), can be confirmed as the radiance of the blackbody [38,39]. Then, the ambient temperature in the indoor condition is close to the sample temperature; therefore, Ldwrin(λ) ≈ Lbb(TS,λ), so Equation (3) can be transformed as:
Equation (14) indicates that the radiance change caused by Δε(λ) related to the fracturing mode is offset by the reflection from Ldwrin(λ). The significant variation in Δε(λ) caused by the cavity effect and the roughness change in stage III is ignored, and Δε(λ) cannot be extracted by the radiance variation.
Compared to the results during the elastic stage, the stress change of 35 MPa can result in a change in the magnitude of the instantaneous dipole moment of the molecules in the mineral at the microscale, thereby leading to a change in emissivity with a magnitude of 10−3 [50]. However, the morphological changes on the sample surface could change the emissivity on the macroscale, which is much more significant than that in the elastic stage. The contribution of the emissivity change to the radiance change can be discussed as follows:
Figure 8 and Figure 9 show that differences in the emissivity change can lead to differences in the radiance variation. ε(12.3) ≈ 1 and ΔεP(12.3) can be neglected. Therefore, the ΔL2(12.3), with a value of 0.05 W·m−2·μm−1·sr−1, is mainly caused by the temperature change. In contrast, ΔεP(9.1) ≈ 0.23, which indicates that ΔL2(9.1), with a value of 0.19 W·m−2·μm−1·sr−1, is related to changes in both the temperature and the emissivity. The theoretical results according to Planck’s law show that the value of the radiance variation related only to a slight temperature change at 9.1 μm is approximately equal to the radiance value at 12.3 μm [50]. Thus, ΔLT(12.3) ≈ ΔLT(9.1) = 0.05 W·m−2·μm−1·sr−1. Therefore, the radiance variation related to the emissivity change is ΔLε(9.1) = 0.14 W·m−2·μm−1·sr−1. Considering the ratio of the fractured region p = 0.1, the true value of the radiance variation related to the emissivity change in the fractured region is much larger than that of the temperature change. Additionally, Figure 11 shows that a change in the effective emissivity (representing the whole circular observation region) with a magnitude of 10−3 could lead to a change in radiance with a magnitude of 10−2. Hence, a slight change in emissivity can result in a relatively large change in radiance in a certain waveband.
4.4.2. Sensitive Waveband Selection for Satellite Observation Conditions
To date, most researchers studying TIR anomalies have focused on those occurring before earthquakes. However, positive thermal anomalies have also been observed after earthquakes in some cases. The case of the Kunlun earthquake (Ms 8.1, 2001) was analyzed on the basis of NOAA satellite TIR data. The image of the anomaly belt clearly shows the 450-km-long seismogenic fault one day after the earthquake, which is consistent with the surface rupture area identified by the field investigation [56]. Additionally, the brightness temperatures before and after the Yushu earthquake (Ms 7.1, 2010) were analyzed using MODIS data to obtain TIR variation information for the active fault related to the earthquake. The results show that a TIR anomaly appeared not only before the earthquake but also after the earthquake [57]. An obvious increase in brightness temperature was observed during the 7–16 days after the earthquake, and surface rupture was found in the anomaly area during the field investigation [58]. The mechanism responsible for the TIR anomalies was inferred to be some relationship between the frictional heating effect and the degassing of vapor and CO2 along the faults during the earthquake. Spatial relationships exist between TIR anomalies and surface fractures after earthquakes [13].
Because of the diversity of mineral composition, the RF wavebands of the static emissivity spectrum for the different rocks are different. Apart from sandstone, more types of rocks can be selected as experimental samples. If it can be confirmed that the feature waveband of spectral radiance variation for different loading rocks corresponds to the RF waveband of the static emissivity spectrum, the experimental result can be used as an indication for waveband selection for rock stress conditions and fracturing behavior monitoring via thermal infrared spectrum technology [59]. Combined with the waveband features, the temporal-spatial characteristics of thermal infrared anomalies before middle-strong earthquakes can be extracted more accurately.
Therefore, in addition to the temperature changes and the degassing of underground gas, the emissivity changes caused by surface rupture should also be taken into account in the analysis of TIR anomalies after earthquakes. Although the changes related to surface ruptures are relatively small at the satellite observation scale, the changes in radiance related to changes in emissivity cannot be ignored.
4.5. The Difficulty for Further Application
However, it remains difficult to extend the experimental results for remote sensing observations, and the following aspects should be considered.
First, there is no significant precursor on the spectral radiance curve for fracture monitoring. The spectral radiance changed obviously when macroscale fracture appeared in the observation area with obvious AE energy. The radiance change could not be sensitive to micro-fractures in this study. Therefore, the samples with different lithology and fault structures can be selected for further studies to reveal the relationship between the thermal infrared spectrum results and the identification of the fracturing mode.
Second, the observation distance in the experimental condition is at the level of meters, and the diameter of the observation area is at the level of centimeters. However, the orbit height of satellite observations is approximately several hundred kilometers, leading to a large spatial resolution. The spatial resolution of TIRS for Landsat 8 is 100 m. The inhomogeneity in geological structure and lithology can result in the complexity of the fracturing mode. And changes in the morphology, roughness, angular effect [60,61], and coverage [62] have an important effect on the thermal infrared radiance as well as the emissivity. Additionally, the spectral radiance variation could be counteracted when these two fracturing modes exist simultaneously in the fracturing stage because of the opposite spectral radiance variation trend.
5. Conclusions
Previous studies have shown that TIR anomalies are mainly related to temperature changes caused by the frictional heating effect and stress relaxation in the fracturing stage. However, the influence of the morphology change during the fracturing stage was taken into consideration in this study, and observations of the thermal infrared spectrum for loaded rock were conducted under outdoor conditions. The variation patterns in the spectral radiance associated with different fracturing modes were analyzed, and the following conclusions were reached:
- Different fracturing modes can lead to different patterns of radiance change. The fracturing mode has an important influence on the characteristics of the radiance variation.
- The radiance increased considerably, with peaks in the range of 8.0–9.7 μm on the radiance variation curve, when extensional fissures appeared on the sample surface. The emissivity change caused by the cavity effect is the main factor leading to the radiance variation.
- When local bulging appeared on the sample surface, the radiance decreased, with local valleys in the range of 8.0–9.7 μm. The diverse morphological changes related to bulging can lead to complex radiance variation.
- The radiance variation is the combined effect of changes in both temperature and emissivity. The different types of emissivity changes during the fracturing stage are the main causes of the differences in the radiance change.
Note that these experimental results can provide a foundation for monitoring surface ruptures at the satellite observation scale via TIR data. Considering the diversity of lithology and the complexity of geological structure, the rock samples with different mineral compositions should be concerned to confirm the wavelength features firstly for the further studies. Then, the rock samples with fault structures can be designed to simulate geological structure. However, the TIR information for rocks on the ground is affected by multiple factors, and the fracturing forms are much more complex in actual geological disasters. Hence, detecting the surface rupture and fracturing from via satellite-based TIR remote sensing methods remains challenging.
Author Contributions
All of the authors contributed extensively to the present paper. S.L. (Shanjun Liu) and L.W. conceived and designed the experiments; J.H., W.L. and S.L. (Shuiping Li) helped perform the experiments; J.H., C.Z. and M.Y. processed and analyzed the data; J.H. wrote the original draft and revised the manuscript extensively. All authors have read and agreed to the published version of the manuscript.
Funding
This work was funded by the National Key Research and Development Program of China under Grant number [2019YFC1509202], and National Natural Science Foundation of China under Grant number [42004001], in part by the Key Program of National Nature Science Foundation of China under Grant number [41930108], and the Fundamental Research Funds for the Central Universities [JZ2020HGQA0139].
Data Availability Statement
The data that we used in this study can be requested by contacting the corresponding author.
Acknowledgments
The authors thank W. Wadsworth for his assistance with the spectrometric analysis and experimental design. We also thank the anonymous reviewers for their constructive comments and advice.
Conflicts of Interest
The authors declare no conflict of interest.
References
- Caponier, P.; Molnar, P. Active faulting and tectonics in China. J. Geophys. Res. 1977, 82, 2905–2930. [Google Scholar] [CrossRef]
- Wesnousky, S.G. Displacement and Geometrical Characteristics of Earthquake Surface Ruptures: Issues and Implications for Seismic-Hazard Analysis and the Process of Earthquake Rupture. Bull. Seismol. Soc. Am. 2008, 98, 1609–1632. [Google Scholar] [CrossRef]
- Ren, Z.; Lin, A. Deformation characteristics of co-seismic surface ruptures produced by the 1850 M 7.5 Xichang earthquake on the eastern margin of the Tibetan Plateau. J. Asian Earth Sci. 2010, 38, 1–13. [Google Scholar] [CrossRef]
- Pan, J.W.; Li, H.B.; Wu, F.Y.; Li, N.; Guo, R.Q.; Zhang, W. Surface rupture characteristics, rupture mechanics, and rupture process of the Yushu earthquake (Ms7.1), 14/04/2010. Acta Petrol. Sin. 2011, 27, 3449–3459. (In Chinese) [Google Scholar] [CrossRef]
- Lin, A. Structural features and seismotectonic implications of coseismic surface ruptures produced by the 2016 Mw 7.1 Kumamoto earthquake. J. Seismol. 2017, 21, 1079–1100. [Google Scholar] [CrossRef] [Green Version]
- Sugito, N.; Goto, H.; Yasuhiro, K. Surface fault ruptures associated with the 14 april foreshock (mj 6.5) of the 2016 kumamoto earthquake sequence, southwest japan. Earth Planets Space 2016, 68, 170–178. [Google Scholar] [CrossRef] [Green Version]
- Li, S.P.; Tao, T.Y.; Gao, F.; Qu, X.C.; Zhu, Y.C.; Huang, J.W.; Wang, Q. Interseismic Coupling beneath the Sikkim-Bhutan Himalaya Constrained by GPS Measurements and Its Implication for Strain Segmentation and Seismic Activity. Remote Sens. 2020, 12, 2202. [Google Scholar] [CrossRef]
- Feng, W.; Samsonov, S.; Qiu, Q.; Wang, Y.; Zhang, P.; Li, T.; Zheng, W. Orthogonal fault rupture and rapid postseismic deformation following 2019 Ridgecrest, California, earthquake sequence revealed from geodetic observations. Geophys. Res. Lett. 2020, 47, e2019GL086888. [Google Scholar] [CrossRef]
- Shen, X.H.; Zhang, X.M.; Cui, J.; Zhou, X.; Jiang, W.L.; Gong, L.X.; Li, Y.S.; Liu, Q.Q. Remote sensing application in earthquake science research and geophysical fields exploration satellite mission in China. J. Remote Sens. 2018, 22, 1–16. (In Chinese) [Google Scholar] [CrossRef]
- Gorny, V.I.; Sal’Man, A.G.; Tronin, A.A.; Shilin, B.V. Outgoing infrared radiation of the earth as an indicator of seismic activity. Proc. Acad. Sci. USSR 1988, 301, 67–69. [Google Scholar]
- Qiang, Z.J.; Xu, X.D.; Ning, C.G. Abnormal infrared thermal of satellite-forewarning of earthquakes. Chin. Sci. Bull. 1990, 35, 1324–1327. (In Chinese) [Google Scholar]
- Ouzounov, D.; Liu, D.F.; Kang, C.L.; Cervone, G.; Kafatos, M.; Taylor, P. Outgoing long wave radiation variability from IR satellite data prior to major earthquakes. Tectonophysics 2007, 431, 211–220. [Google Scholar] [CrossRef]
- Wu, L.X.; Qin, K.; Liu, S.J. GEOSS-based thermal parameters analysis for earthquake anomaly recognition. Proc. IEEE 2012, 100, 2891–2907. [Google Scholar] [CrossRef]
- Wu, L.X.; Qin, K.; Liu, S.J. Progress in analysis to remote sensed thermal abnormity with fault activity and seismogenic process. Acta Geod. Cartogr. Sin. 2017, 46, 1470–1481. (In Chinese) [Google Scholar] [CrossRef]
- Luong, M.P. Infrared observations of failure processes in plain concrete. Durab. Build. Mater. Compon. 1987, 4, 870–878. [Google Scholar] [CrossRef]
- Luong, M.P. Infrared thermovision of damage processes in concrete and rock. Eng. Fract. Mech. 1990, 35, 291–301. [Google Scholar] [CrossRef]
- Geng, N.G.; Cui, C.Y.; Deng, M.D. Remote sensing detection in rock fracture experiment and the beginning of remote sensing rock mechanics. Acta Seismol. Sin. 1992, 14, 645–652. (In Chinese) [Google Scholar]
- Wu, L.X.; Cui, C.Y.; Geng, N.G.; Wang, J.Z. Remote sensing rock mechanics (RSRM) and associated experimental studies. Int. J. Rock Mech. Min. Sci. 2000, 37, 879–888. [Google Scholar] [CrossRef]
- Wu, L.X. Remote sensing rock mechanics and its recent achievements and future development. Chin. J. Rock Mech. Eng. 2001, 20, 139–146. (In Chinese) [Google Scholar] [CrossRef]
- Ren, Y.Q.; Ma, J.; Liu, P.X.; Chen, S.Y. Experimental study of thermal field evolution in the short-impending stage before earthquakes. Pure Appl. Geophys. 2017, 175, 2527–2539. [Google Scholar] [CrossRef]
- Salami, Y.; Dano, C.; Hicher, P.Y. Infrared thermography of rock fracture. Géotechnique Lett. 2017, 7, 36–40. [Google Scholar] [CrossRef] [Green Version]
- Wu, L.X.; Liu, S.J.; Wu, Y.H.; Wang, C.Y. Precursors for rock fracturing and failure-part I: IRR image abnormalities. Int. J. Rock Mech. Min. Sci. 2006, 43, 473–482. [Google Scholar] [CrossRef]
- Wu, L.X.; Liu, S.J.; Wu, Y.H.; Wang, C.Y. Precursors for rock fracturing and failure-part II: IRRT-curve abnormalities. Int. J. Rock Mech. Min. Sci. 2006, 43, 483–493. [Google Scholar] [CrossRef]
- Liu, S.J.; Wu, L.X.; Wu, Y.H. Infrared radiation of rock at failure. J. Rock Mech. Min. Sci. 2006, 43, 972–979. [Google Scholar] [CrossRef]
- Ma, L.Q.; Sun, H. Spatial-temporal infrared radiation precursors of coal failure under uniaxial compressive loading. Infrared Phys. Technol. 2018, 93, 144–153. [Google Scholar] [CrossRef]
- Wang, C.L.; Lu, Z.J.; Liu, L.; Chuai, X.S.; Lu, H. Predicting points of the infrared precursor for limestone failure under uniaxial compression. Int. J. Rock Mech. Min. Sci. 2016, 88, 34–43. [Google Scholar] [CrossRef]
- Ma, J.; Ma, S.P.; Liu, P.X.; Liu, L.Q. Thermal field indicators for identifying active fault and its instability from laboratory experiments. Seismol. Geol. 2008, 30, 363–382. (In Chinese) [Google Scholar]
- Lyon, R.J.P. Analysis of rocks by spectral infrared emission (8 to 25 microns). Econ Geol. 1965, 60, 715–736. [Google Scholar] [CrossRef]
- Ruff, S.W.; Christensen, P.R.; Barbera, P.W.; Anderson, D.L. Quantitative thermal emission spectroscopy of minerals: A laboratory technique for measurement and calibration. J. Geophys. Res. 1997, 102, 14899–14913. [Google Scholar] [CrossRef]
- Salvaggio, C.; Miller, C.J. Methodologies and protocols for the collection of midwave and longwave infrared emissivity spectral using a portable field spectrometer. Proc. SPIE Int. Soc. Opt. Eng. 2001, 4381, 539–548. [Google Scholar] [CrossRef]
- Christensen, P.R.; Bandfield, J.L.; Hamilton, V.E.; Howard, D.A.; Lane, M.D.; Piatek, J.L.; Ruff, S.W.; Stefanov, W.L. A thermal emission spectral library of rock-forming minerals. J. Geophys. Res. 2000, 105, 9735–9739. [Google Scholar] [CrossRef] [Green Version]
- Walter, L.S.; Salisbury, J.W. Spectral characterization of igneous rocks in the 8 to 12 μm region. J. Geophys. Res. 1989, 94, 9203–9212. [Google Scholar] [CrossRef]
- Kerekes, J.P.; Strackerjan, K.E.; Salvaggio, C. Spectral reflectance and emissivity of man-made surfaces contaminated with environmental effects. Opt. Eng. 2008, 47, 1065–1074. [Google Scholar] [CrossRef] [Green Version]
- Labed, J.; Stoll, M.P. Angular variation of land surface spectral emissivity in the thermal infrared: Laboratory investigations on bare soils. Int. J. Remote Sens. 1991, 12, 2299–2310. [Google Scholar] [CrossRef]
- Laurel, K.; Kenneth, H.; Eric, K.; Paul, A.; John, S.; John, H.; Allan, T. First use of an airborne thermal infrared hyperspectral scanner for compositional mapping. Remote Sens. Environ. 2002, 80, 447–459. [Google Scholar] [CrossRef] [Green Version]
- Bandfield, J.L. Effects of surface roughness and graybody emissivity on Martian thermal infrared spectra. Icarus 2009, 202, 414–428. [Google Scholar] [CrossRef]
- Osterloo, M.M.; Hamilton, V.E.; Anderson, F.S. A laboratory study of the effects of roughness on the thermal infrared spectra of rock surfaces. Icarus 2012, 220, 404–426. [Google Scholar] [CrossRef]
- Araújo, A. Analysis of multi-band pyrometry for emissivity and temperature measurements of gray surfaces at ambient temperature. Infrared Phys. Technol. 2016, 76, 365–374. [Google Scholar] [CrossRef]
- Araújo, A. Dual-band pyrometry for emissivity and temperature measurements of gray surfaces at ambient temperature: The effect of pyrometer and background temperature uncertainties. Measurement 2016, 94, 316–325. [Google Scholar] [CrossRef]
- Li, T.Z.; Liu, S.J. A Study on the Effects of Roughness on Thermal Infrared Spectral Unmixing of Rock. Spectrosc. Spectr. Anal. 2017, 37, 3051–3057. (In Chinese) [Google Scholar] [CrossRef]
- Cui, C.Y.; Deng, M.D.; Geng, N.G. Rock spectral radiation signatures under different pressures. Sci. Bull. 1993, 38, 1377–1382. (In Chinese) [Google Scholar]
- Yin, J.Y.; Fang, Z.F.; Qian, J.D.; Deng, M.D.; Geng, N.G.; Hao, J.S.; Wang, Z.; Ji, Q.Q. Research on the application of infrared remote sensing in earthquake prediction and its physical mechanism. Earthq. Res. China 2000, 16, 140–148. (In Chinese) [Google Scholar]
- Liu, S.J.; Wu, L.X.; Feng, Z.; Xu, Z.Y. Thermal infrared spectral variation and sensitive waveband of quartzy sandstone under pressure. Spectrosc. Spectr. Anal. 2012, 32, 78–82. (In Chinese) [Google Scholar] [CrossRef]
- Xu, Z.Y.; Liu, S.J.; Wu, L.X.; Feng, Z. Stress-related thermal infrared spectral variation and sensitive waveband of granite. J. Infrared Millim. Waves 2013, 32, 44–49. (In Chinese) [Google Scholar] [CrossRef]
- Freund, F.T.; Takeuchi, A.; Lau, B.W.S.; Al-Manaseer, A.; Fu, C.C.; Bryant, N.A.; Ouzounov, D. Stimulated infrared emission from rocks: Assessing a stress indicator. eEarth 2007, 2, 7–16. [Google Scholar] [CrossRef] [Green Version]
- Freund, F.T. Pre-earthquake signals: Underlying physical processes. J. Asian Earth Sci. 2011, 41, 383–400. [Google Scholar] [CrossRef]
- Freund, F.T.; Freund, M.M. Paradox of Peroxy Defects and Positive Holes in RocksPart I: Effect of Temperature. J. Asian Earth Sci. 2015, 114, 373–383. [Google Scholar] [CrossRef] [Green Version]
- Scoville, J.; Freund, F.T.; Bobrovskiy, V. Stress-Activated Infrared Emission from Rock Surfaces in the Thermal Infrared (TIR) Window. In Proceedings of the AGU Fall Meeting 2016, San Francisco, CA, USA, 12–16 December 2016. [Google Scholar]
- Huang, J.W.; Liu, S.J.; Xu, Z.Y.; Ma, C.Y.; Wu, L.X. Experimental study on the influence of the radiation background on the variation in thermal infrared radiance of loaded rock. Spectrosc. Spectr. Anal. 2018, 38, 4222–4225. (In Chinese) [Google Scholar] [CrossRef]
- Huang, J.W.; Liu, S.J.; Gao, X.; Yang, Z.C.; Qiang, N.; Wu, L.X. Experimental study of the thermal infrared emissivity variation of loaded rock and its significance. Remote Sens. 2018, 10, 818. [Google Scholar] [CrossRef] [Green Version]
- Liu, S.J.; Xu, Z.Y.; Wei, J.L.; Huang, J.W.; Wu, L.X. Experimental study on microwave radiation from deforming and fracturing rock under loading outdoor. IEEE Trans. Geosci. Remote Sens. 2016, 54, 5578–5587. [Google Scholar] [CrossRef]
- Huang, J.W.; Liu, S.J.; Qiang, N.; Mao, W.F.; Gao, X. Experimental Study of Extracting Weak Infrared Signals of Rock Induced by Cyclic Loading under the Strong Interference Background. Appl. Sci. 2018, 8, 1458. [Google Scholar] [CrossRef] [Green Version]
- Salisbury, J.W.; D’Aria, D.M. Emissivity of terrestrial materials in the 8-14 μm atmospheric window. Remote Sens. Environ. 1992, 42, 83–106. [Google Scholar] [CrossRef]
- Feng, J.; Rivard, B.; Rogge, D.; Sánchez-Azofeifa, A. The longwave infrared (3–14 μm) spectral properties of rock encrusting lichens based on laboratory spectra and airborne SEBASS imagery. Remote Sens. Environ. 2013, 131, 173–181. [Google Scholar] [CrossRef]
- Fraden, J. AIP Handbook of Modern Sensors; American Institute of Physics, Advanced Monitors Corporation: San Diego, CA, USA, 1994; pp. 136–138. [Google Scholar] [CrossRef]
- Shan, X.J.; Qu, C.Y.; Ma, J. Satellite thermal infrared observation and analysis on alternate activity of different segments of seismogenic fault. J. Geod. Geodyn. 2005, 25, 58–62. (In Chinese) [Google Scholar] [CrossRef]
- Bhardwaj, A.; Singh, S.; Sam, L.; Bhardwaj, A.; Martín-Torres, F.J.; Singh, A.; Kumar, R. MODIS-based estimates of strong snow surface temperature anomaly related to high altitude earthquakes of 2015. Remote Sens. Environ. 2017, 188, 1–8. [Google Scholar] [CrossRef]
- Jing, F.; Shen, X.H.; Zhang, T.B.; Pan, X.; Sun, K. Variation characteristics in infrared radiation of active fault zone related to earthquakes. Remote Sens. Land Resour. 2013, 25, 56–60. (In Chinese) [Google Scholar] [CrossRef]
- Wu, L.X.; Mao, W.F.; Liu, S.J.; Xu, Z.Y.; Li, Z.W.; Qi, Y.; Miao, Z.L. Mechanisms of Altering Infrared-Microwave Radiation from Stressed Rock and Key Issues on Crust Stress Remote Sensing. J. Remote Sens. 2018, 22, 146–161. (In Chinese) [Google Scholar] [CrossRef]
- Ren, H.Z.; Yan, G.J.; Chen, L.; Li, Z. Angular effect of MODIS emissivity products and its application to the split-window algorithm. ISPRS J. Photogramm. Remote Sens. 2011, 66, 498–507. [Google Scholar] [CrossRef]
- Ren, H.; Liu, R.; Yan, G.; Mu, X.; Li, Z.L.; Nerry, F.; Qiang, N. Angular normalization of land surface temperature and emissivity using multiangular middle and thermal infrared data. IEEE Trans. Geosci. Remote Sens. 2014, 52, 4913–4931. [Google Scholar] [CrossRef]
- Mao, W.F.; Wu, L.X.; Liu, S.J.; Gao, X.; Huang, J.W.; Xu, Z.Y.; Qi, Y. Additional Microwave Radiation From Experimentally Loaded Granite Covered With Sand Layers: Features and Mechanisms. IEEE Trans. Geosci. Remote Sens. 2020, 58, 5008–5022. [Google Scholar] [CrossRef]
Figure 1.
(a) Schematic diagram of the experimental system; (b) arrangement of the probes on the loading sandstone sample in the outdoor conditions.
Figure 1.
(a) Schematic diagram of the experimental system; (b) arrangement of the probes on the loading sandstone sample in the outdoor conditions.

Figure 2.
(a) Photographs of sample sy20–3 with fracturing mode of extensional fissures; (b) photographs of sample sy20–1 with fracturing mode of local bulging.
Figure 2.
(a) Photographs of sample sy20–3 with fracturing mode of extensional fissures; (b) photographs of sample sy20–1 with fracturing mode of local bulging.

Figure 3.
(a) Temperature variation curve and stress curve of sample sy20–3; (b) spectral radiance variation curve at 9.1 μm and AE energy curve of sample sy20–3 with the fracture mode of extensional fissures.
Figure 3.
(a) Temperature variation curve and stress curve of sample sy20–3; (b) spectral radiance variation curve at 9.1 μm and AE energy curve of sample sy20–3 with the fracture mode of extensional fissures.

Figure 4.
Six radiance increment spectra of sandstone samples and the average spectrum with the extensional fissure mode.
Figure 4.
Six radiance increment spectra of sandstone samples and the average spectrum with the extensional fissure mode.

Figure 5.
Comparison results between the average spectrum of radiance increment with the extensional fissure mode and the static emissivity spectrum of sandstone.
Figure 5.
Comparison results between the average spectrum of radiance increment with the extensional fissure mode and the static emissivity spectrum of sandstone.

Figure 6.
The radiance difference spectra after and before for the sandstone samples of local bulging.
Figure 6.
The radiance difference spectra after and before for the sandstone samples of local bulging.

Figure 7.
Schematic for the entire observation area with the radiation transmission model of the cavity effect.
Figure 7.
Schematic for the entire observation area with the radiation transmission model of the cavity effect.

Figure 8.
Simulation of the effective emissivity spectra caused by the cavity effect for quartz sandstone.
Figure 8.
Simulation of the effective emissivity spectra caused by the cavity effect for quartz sandstone.

Figure 9.
Measured and calculated ΔL spectrum of the cavity effect for sample sy20–3.

Figure 10.
Schematic for the radiation transmission of local bulging.

Figure 11.
The emissivity variation spectrum of sandstone samples after and before bulging outwards.
Figure 11.
The emissivity variation spectrum of sandstone samples after and before bulging outwards.


Table 1.
The similarity coefficients of the radiance increment spectra of six sandstone samples and the average spectrum with extensional fissures.
Table 1.
The similarity coefficients of the radiance increment spectra of six sandstone samples and the average spectrum with extensional fissures.
| Specimen | Similarity Coefficient |
|---|---|
| sy20–2 | 0.99 |
| sy20–3 | 0.91 |
| sy20–4 | 0.96 |
| sy20–6 | 0.99 |
| sy20–7 | 0.98 |
| sy20–8 | 0.96 |
Publisher’s Note: MDPI stays neutral with regard to jurisdictional claims in published maps and institutional affiliations. |
© 2021 by the authors. Licensee MDPI, Basel, Switzerland. This article is an open access article distributed under the terms and conditions of the Creative Commons Attribution (CC BY) license (http://creativecommons.org/licenses/by/4.0/).
Share and Cite
MDPI and ACS Style
Huang, J.; Liu, S.; Liu, W.; Zhang, C.; Li, S.; Yu, M.; Wu, L. Experimental Study on the Thermal Infrared Spectral Variation of Fractured Rock. Remote Sens. 2021, 13, 1191. https://0-doi-org.brum.beds.ac.uk/10.3390/rs13061191
AMA Style
Huang J, Liu S, Liu W, Zhang C, Li S, Yu M, Wu L. Experimental Study on the Thermal Infrared Spectral Variation of Fractured Rock. Remote Sensing. 2021; 13(6):1191. https://0-doi-org.brum.beds.ac.uk/10.3390/rs13061191
Chicago/Turabian StyleHuang, Jianwei, Shanjun Liu, Wenfang Liu, Chunju Zhang, Shuiping Li, Min Yu, and Lixin Wu. 2021. "Experimental Study on the Thermal Infrared Spectral Variation of Fractured Rock" Remote Sensing 13, no. 6: 1191. https://0-doi-org.brum.beds.ac.uk/10.3390/rs13061191
Note that from the first issue of 2016, this journal uses article numbers instead of page numbers. See further details here.