1. Introduction
Synthetic Aperture Radar (SAR) has become nowadays one of the most important fields of remote sensing. Due to the penetration of the radar waves, it becomes a versatile technique for acquisition of information, weather independence, and it delivers complementary data to optical systems. As an active radar sensor with its own target illumination, it allows day and night operational capability.
SAR provides high-resolution imaging whose geometric resolution can be independent of the acquisition distance. By means of exploiting the information given by the physical properties of the electromagnetic waves such as frequency, polarization, amplitude or phase, SAR systems offer high quality imaging data, covering a wide range of remote sensing applications. It is used for terrain topography, providing urban mapping and digital elevation models [
1], oceanography, agriculture, traffic control [
2] and ship detection [
3], as well as for environment studies including deforestation [
4], glacier and disasters monitoring, among many others. Its broad scope of research has greatly aroused the interest of the scientific community, and it has expanded its use for defense and commercial purposes.
Especially advantageous are the applications of SAR for lower frequencies [
5,
6] such as P-Band (216–450 MHz) or L-Band (1–2 GHz) [
7]. Due to the penetrating nature of electromagnetic waves at higher wavelengths and by means of interferometry, SAR becomes an interesting way to monitor forest density and estimate forest height by using tomography [
8], as well as to perform geology and glaciology studies for the measurement of snow, ice layer thicknesses and soil moisture. Furthermore, SAR polarimetry allows the use of polarization diversity in order to identify different scattering mechanisms, enhancing this way the retrieval of information [
9].
As a remote sensing system, SAR sensors are typically on board flying platforms like satellites or aircraft depending on the application itself, which leads to different coverage areas and image resolutions. Well-known SAR spaceborne missions are BIOMASS, Sentinel, TerraSAR-X and TanDEM-X, which is an add-on of the TerraSAR-X system that allows the generation of global digital elevation model data of the Earth with an unprecedent accuracy [
10]. The Microwaves and Radar Institute of the German Aerospace Center (DLR) has led the development and implementation of these two spaceborne missions, TerraSAR-X and TanDEM-X. Its research work in the field of remote sensing by means of Synthetic Aperture Radar is widely known.
For the increasing demand of SAR applications and in order to support future spaceborne systems, airborne SAR provides an essential scope of research [
11]. As a more flexible system, it is employed by the DLR in order to study signal processing concepts, to experiment with innovative techniques and methods, and to develop and test new components and hardware.
The German Aerospace Center operates the so-called F-SAR, an enhanced airborne multi-frequency SAR system [
12]. In order to take advantage of the aforementioned capabilities of SAR imaging at lower frequency bands, a new dual-polarized phased array antenna system in L-Band for the next generation DLR airborne SAR sensor is required, which becomes also relevant for upcoming spaceborne SAR missions [
13].
Due to the space limitations on the aircraft, not only a solution that fulfills the electrical and airworthiness requirements is needed, but also a high degree of compaction has to be achieved, in order to exploit the restricted available area on the airplane [
14,
15]. This leads to a careful selection of the implementation technology and innovative configurations for the antenna design [
16,
17]. As a phased array system and in order to enhance its radiation properties, some design considerations have to be made to reduce the spacing between the array elements, and at the same time minimize the antenna interactions.
Typically, the reduction of such antenna interactions involves methods to mitigate the coupling between array elements or to improve the cross-polarization level. The last one plays a key role in the performance of SAR systems that makes use of the polarization diversity to take advantage of the retrieved information of the scattered signals. Some previous research has been made and different techniques have been proposed in order to reduce the cross-polarization level. An extended approach is splitting a planar array into subarrays of 2 × 2 elements according to a rotation pattern based on the image theory arrangement, which also minimizes the side lobe level [
18]. This method has been widely used in a broad range of applications [
19,
20,
21]. A further analysis extends this approach by considering the inter-element coupling [
22]. Some other techniques improve the cross-polarization level by rotating the antenna elements in reflectarray applications [
23], or combining the 180° rotation of the antenna structure along with a 180° alternate feeding based on the overlapping of different multipolar moments [
24]. Further rotation topologies such as the sequential rotation is typically used for arrays of circular polarized antennas, as it leads to an improvement of the axial ratio bandwidth or the polarization purity [
25,
26,
27,
28,
29]. Generally, the majority of cross-polarization suppression techniques start from the decomposition of planar arrays into subarrays, and a very few applications consider linear arrays. In [
30], a 90° sequential rotation technique is implemented in a circularly polarized linear array of circular patches. Later, this analysis is extended by considering the scanning properties of linear phased arrays [
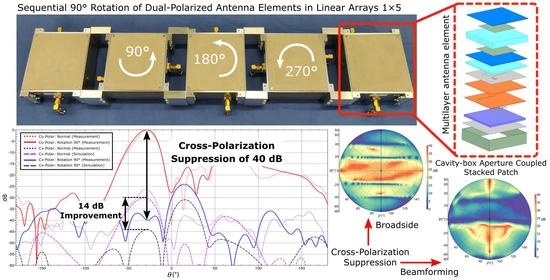
31]. However, this approach is simplified as the radiation effect of higher order modes is neglected and no real geometrical 90° sequential rotation is applied. To the best of the authors’ knowledge, no similar 90° sequential rotation approach, as presented in this work, was applied before, not only by performing the presented rotation topology in linear array applications, but also by considering identical fed dual polarized antenna elements. In this manuscript, a novel approach to perform a 90° sequential rotation of the same identical dual polarized cavity backed aperture coupled patch antenna elements of a linear array, for airborne SAR applications, is presented. This technique improves the cross-polarization level within the main antenna beam of up to 14 dB in comparison with the standard array arrangement, providing cross-polarization suppression values above 40 dB.
This work is structured as follows. First of all, the scope of the antenna system according to the required airborne SAR sensor requirements is presented. Later, the design of a cavity backed dual-polarized antenna element is introduced, whose compaction allows for achieving a high degree of integration and thus to maximize the number of the antenna elements. This design will be validated by means of measurements of a manufactured prototype. Later, three different configurations of a linear array composed of five identical antenna elements are constructed and measured. Each configuration that corresponds to a different rotation pattern of the array elements is analyzed when applying a uniform phase and amplitude distribution, and beamforming case with triangular amplitude tapering. Finally, these results are examined and the improvement of the cross-polarization level within the antenna main beam when performing a 90° sequential rotation is discussed.
3. Antenna Single Element
Due to its conformability, integration and low cost, the antenna unit is implemented in planar technology by means of a microstrip patch as a radiating element [
32]. The dual-polarization characteristic of the antenna leads to the use of a quadratic patch.
Due to the resonant nature of the microstrip patch and its narrow-band nature, a bandwidth enhancement technique by using a stacked dual patch configuration is applied, in order to achieve the required antenna bandwidth of 150 MHz specified by the SAR sensor requirements. The aperture coupling feeding technique [
33] allows an independent implementation of the radiation and feeding part of the antenna, becoming a versatile method to accomplish the dual polarization excitation.
The aforementioned design considerations lead to a multi-layer structure as it can be seen in
Figure 2. The design steps of the antenna element are explained in detail next. The electromagnetic analysis and optimization process of the structure were performed using HFSS, a High Frequency Simulation software tool, part of the Ansys Electromagnetics Desktop environment.
3.1. Bandwidth Enhancement: Dual Stacked Patch Configuration
As a resonant structure, microstrip patch antennas typically provide a narrow bandwidth (3–4%). In order to overcome this issue and to fulfill the desired system bandwidth of 150 MHz (15%), a bandwidth enhancement technique has to be applied. It is well-known that the use of substrates with a lower dielectric permittivities, such as foam layers, provides greater antenna bandwidths. In addition, the use of electrically thick substrates along with the aperture coupled feeding allows for increasing the bandwidth. However, this may also lead to a reduction of the electromagnetic coupling between the feeding slot and the microstrip patch. Thus, further methods to attain a greater broadband performance are considered [
34]. The dual stacked patch configuration involves the use of two patches with different sizes, thus resonating at slightly different frequencies. This way, and together with the use of foam layers, antenna bandwidths of up to 20–30% can be achieved [
35].
This stacked patch arrangement leads to a geometrical structure composed of four layers that becomes the radiating part of the antenna. Two microstrip patches (top and bottom) are implemented on a substrate Rogers RT/Duroid 6006 (, ) and thicknesses , to reduce the patch size. The top patch is placed below the superstrate as it serves as a protective top layer or antenna radome. Two additional foam layers (Rohacell HF 51) with thicknesses and are used respectively to enhance the bandwidth and to assure a good coupling between the feeding slot and the lower patch.
The multi-layer structure of the antenna is depicted in
Figure 2. The geometrical and electrical parameters of each layer are displayed in
Table 1. The overall height of the antenna is 32.1 mm.
3.2. Aperture Coupling Feeding
The antenna feeding is performed by means of a coupling aperture or slot that is etched on the ground plane. The bottom patch is electromagnetically coupled by this aperture slot, which at the same time is fed by a microstrip line that is placed below the ground plane. A side view of this feeding topology can be seen in
Figure 2. This excitation technique allows for an independent design of the radiation and the feeding parts of the antenna. The electrical properties of each feeding layer are shown in
Table 1.
The desired dual-polarization operation of the antenna requires the use of two orthogonal slots in order to excite the corresponding polarization. The H-shape smooths the field distribution at the slot edges, thus improving the coupling between the slot and the bottom patch [
36]. Each slot is shifted with a small offset in order to maximize the port isolation (
), and it is fed by its respective microstrip line. Each line is placed on different FR4 substrate heights to reduce the coupling between both polarizations. The width of both lines is set to yield an impedance of 50
.
Figure 3 shows the spatial disposition of the slots and the feeding lines. The corresponding geometrical values are displayed in
Table 2.
From now and on, the horizontal polarization (H) is excited by the slot 1 and its corresponding line 1. The same assumption is made with the vertical polarization (V) fed by the slot 2 and line 2. According to this reference, the electrical field of the horizontal polarization is along the x-axis and along y for the vertical polarization. The bending of the line 2 is done in order to place the two antenna connectors on opposite sides for further mechanical purposes.
3.3. Cavity-Box
The multi-layer antenna structure is enclosed within four electric walls in a cavity-box configuration. The inclusion of these walls interrupts the propagation of surface waves, which become relevant in structures composed of several layers with different dielectric permittivities. This way, the coupling between antenna elements is reduced and a higher degree of integration can be achieved, thus maximizing the density of antenna elements.
The resonant nature of the cavity leads to a bandwidth reduction due to its high quality factor. Considering this cavity-box configuration, the proposed antenna design provides a bandwidth of 150 MHz (around 15%), which still fulfills the bandwidth requirements according to the desired SAR sensor specifications.
3.4. Manufactured Prototype
The presented antenna was manufactured and measured. A picture of the fabricated prototype can be seen in
Figure 3. The antenna construction requires a correct assembly in order to assure the electrical continuity between the ground plane and the walls. This construction model also allows an easy interconnection of several antennas by means of intermediate blocks in order to build the later array.
The measured S-Parameters are depicted in
Figure 4. Port 1 and 2 excite the horizontal and vertical polarization, respectively. The measurement shows an excellent agreement with the simulation. It can be seen that both polarizations achieve a return loss level below –10 dB within the bandwidth of 150 MHz. The center frequency of operation is slightly shifted (around 3%) towards lower frequencies, due to fabrication and construction tolerances. The port isolation
between both polarizations is greater than 30 dB at the center frequency of operation.
The radiation pattern of the antenna is measured at the Compact Test Range facilities of the German Aerospace Center [
37]. The measured pattern meets the predicted results very well. A comparison between simulation and measurement for the two polarizations is shown in
Figure 5. The measured antenna gain, 6.1 dB and 6 dB for the horizontal and vertical polarization, respectively, differs approximately 0.3 dB from the simulation. The simulated efficiency of the antenna is 90%.
4. Antenna Array
The proposed design is extended to build a linear antenna array of five elements. The electrical performance of such configuration plays a key role in the operation of the antenna system, since it shapes the antenna radiation pattern in elevation by means of beamforming and amplitude tapering. Thus, this design stage not only allows for studying the feasibility of the proposed solution, but it also paves the way for the implementation of the final planar array of 5 × 8 elements.
According to the airborne SAR sensor requirements, a side-looking configuration of the anterna radiation pattern in elevation is desired. Due to the strong power echoes of the reflected signals in nadir, the projection of the aircraft flight path, a minimum of the antenna pattern in such angular direction, is required. In addition, a sidelobe level better than 20 dB is mandatory.
Since SAR polarimetry applications make use of the polarization diversity in order to exploit the information of the scattered signals, the cross-polarization level of the antenna determines an important parameter of the system performance and its reduction becomes a relevant design aspect. Some examples to improve the cross-polarization by means of different rotation schemes are found in [
19,
20,
21,
22]. However, these techniques are based on the composition of planar arrays out of 2 × 2 subarrays and using the image theory arrangement. In this work, a novel approach of a sequential 90° rotation of the antenna elements in linear array applications is presented.
Next, three array configurations of five elements are built and measured. Each geometrical arrangement corresponds to a different rotation topology of the antenna elements: non-rotation, sequential rotation of 180° and 90°. The performance of each configuration, in terms of co-polar and cross-polarization level, will be compared and discussed. An accurate analysis of the cross-polarization performance of the array leads to consider scenarios with antenna beam steering. Therefore, the scope of this study covers two cases for each configuration: broadside radiation and beamforming along with amplitude tapering, which can be considered as a potential SAR application.
Array design considerations
The spacing between the antenna elements is chosen to be 0.6
, calculated at the center frequency of operation
. Due to its compact implementation, an inter-element spacing of up to 0.48
can be also considered if a higher degree of integration is desired [
6]. However, for this work, a greater distance between antenna elements has to be used due to mechanical reasons, since the geometrical 90° rotation of the elements limits the access of the antenna feeding connectors.
Each antenna is manufactured separately, and it disposes its own independent feeding; therefore, no integrated feeding network for the array is required. This allows a more flexible control of the array feeding, since two measurement scenarios with different amplitude and phase distribution are analyzed.
The array is built along the
y-axis. The same coordinate system for the array as shown in
Figure 3 is considered.
The antenna feeding ports (–, –) correspond to the antenna element numeration (1–5), starting from the left.
The measurement setup is performed using a 1:6 power divider, model ZB6PD-17-S of Mini-Circuits [
38], in order to feed the array elements. In addition, the triangular amplitude tapering is implemented by means of 3 dB and 10 dB attenuators, namely models 18AH-03 and 18AH-10, respectively, from API Inmet. Both power splitters and attenuators are not considered within the calibration.
The phase control of each antenna element is adjusted with self-manufactured cables with the corresponding electrical length. All the cables dispose of comparable lengths in order to assure a similar phase variation within the desired frequency range.
All the measurements are carried out with a rectangular aluminum plate (50.1 × 104.2 cm) that is attached to the array, as it is shown in
Figure 6. This allows for fixing the structure under testing on top of the positioner tower of the Compact Test Range.
The simulated and measured results are presented for the center frequency of operation 1.325 GHz.
4.1. Normal Array
The first configuration to be analyzed corresponds to the standard case of the linear array arrangement, where all the antennas are identically aligned. This standard configuration will be identified as a normal array, and it is considered as a reference case for later comparisons. The geometrical arrangement of this configuration is depicted in
Figure 7. Each antenna is interconnected by means of intermediate aluminum blocks that provide an interelement spacing of 0.6
. The element numeration starts from the left. All the connectors that feed each polarization (
,
) are placed along the same side of the array.
4.1.1. Uniform Amplitude and Phase Distribution
For this case, each element is fed with equal power level and phase, thus achieving a broadside radiation. The same phase value is guaranteed by means of self-manufactured cables with identical electrical length.
Figure 8 shows a comparison between simulation and measurement of the co-polar patterns for both polarizations. Co-polar and cross-polar patterns for
are depicted in
Figure 9. The measured gain is 11.1 dB and 11.7 dB for the horizontal and vertical polarization, respectively. It differs 1.7 dB from the simulated values, since the power divider used to obtain a uniform amplitude distribution for each antenna element and the cable losses are not considered within the calibration process. This includes the insertion losses related to the power divider and the inherent power losses given by the unused output of the power divider that is matched with a 50
load. Precisely, due to the slight phase and amplitude unbalance at the outputs of the power divider [
38], the pattern at
is marginally assymetric, being more visible for the vertical polarization. However, it can be seen that the measurements agree very well with the simulated values.
The co-polar and cross-polar patterns for
are depicted in
Figure 9. The measured cross-polarization suppression, 23 dB and 28 dB for the horizontal and vertical polarization, respectively, is lower than the simulated data. This difference can be certainly due to different reasons, especially the accuracy of the measurement, since the cross-polarization values are mainly below −20 dB, which leads to an extremely sensitive measurement. Other aspects such as the fabrication and manufacturing tolerances should also be considered. Nevertheless, it can be seen that the measured patterns meet the expected results very well.
4.1.2. Beamforming
In this case, a potential application for SAR side-looking configuration is considered. In order to achieve an antenna main beam pointing at
, a phase difference of 120° among the antenna elements is applied. In addition, a triangular amplitude distribution is used to reduce the side lobe level and to yield a minimum at nadir (
), a direction that corresponds to the flight path projection.
Table 3 shows the amplitude and phase values of each feeding port.
The desired symmetrical triangular amplitude tapering is implemented by means of 3 dB and 10 dB attenuators. The phase distribution is achieved with self-manufactured cables with the required electrical length. The simulated gain values are 10.6 dB and 11.9 dB for the horizontal and vertical polarization, respectively, which does not entirely meet the measured gain, since the amplitude tapering by means of the power divider and the attenuators are not considered in the calibration. The normalized co-polar and cross-polar patters for both polarizations are shown in
Figure 10. As experienced in the measurements of the broadside array, the measured cross-polarization level is higher than the predicted values. The measured cross-polar suppression at the antenna main beam for the horizontal and vertical polarization is 23 dB and 26 dB, respectively.
4.2. Array with 180° Rotation of the Antenna Elements
In this configuration, a 180° sequential rotation of the array elements that involves the rotation of antennas 2 and 4 is performed, as it can be seen in
Figure 11. This approach involves the out-of-phase feeding of the rotated elements. This feeding arrangement can lead to a suppression or reduction of the cross-polarized fields due to the phase inversion, while maintaining the same co-polarization pattern [
20]. It can be noted in
Figure 11 that, despite the 180° rotation of the array elements 2 and 4, the same geometrical slots as the previous configuration are involved in order to excite each polarization.
4.2.1. Uniform Amplitude and Phase Distribution
The geometrical arrangement of the linear array with the 180° rotation of the antenna elements 2 and 4 is depicted in
Figure 11. The amplitude and phase values of each antenna feeding port in order to achieve a broadside radiation are listed in
Table 4. It can be noticed that the ports of the rotated elements
,
,
,
are fed out-of-phase. In order to provide the inversion feeding, these elements are fed by means of cables with a length of half the guided wavelength regarding the cable lengths that feed the other antenna ports.
A comparison of this configuration with the normal array in terms of co-polar and cross-polar patterns is shown in
Figure 12. The measured co-polar patterns of the array with the 180° rotation are really similar to the measured patterns of the normal array. The measured cross-polarization, especially for the horizontal polarization, is higher than the simulated value. The overall cross-polarization performance of this configuration is comparable to the normal array, but it presents a higher sidelobe level. The cross-polarization suppression for both configurations are alike.
4.2.2. Beamforming
For this case, the same triangular amplitude tapering and phase values are used as in the previous configuration but considering the inversion phase feeding for the elements 2 and 4. The measured results and a comparison with the configuration of the normal array are shown in
Figure 13.
As the uniform case, the measurement of the co-polar patterns for both configurations and polarizations agree very well. The measured cross-polarization values is again comparable for both configurations with a slight deterioration when the elements are rotated 180°, providing an increase of the sidelobe level. The measured cross-polarization levels are higher than the simulated values. This difference is again more visible for the horizontal polarization. However, it can be seen that the overall measurements fit very well the simulated data.
In the view of the measurements results, it can be stated that the 180° rotation of the antenna elements 2 and 4 do not lead to any improvement in the cross-polarization level in comparison with the configuration of the normal array, since it provides similar cross-polarization suppression values.
4.3. Array with Sequential 90° Rotation of the Antenna Elements
In this third configuration, a novel sequential 90° rotation approach of the array elements is performed. This leads to an element rotation topology where the antenna elements 2, 3 and 4 are respectively 90°, 180° and 270° rotated, while the elements 1 and 5 remain unchanged. The manufactured array is shown in
Figure 14.
The geometrical 90° rotation involves an exchange of the polarization excitation of the antenna elements 2 and 4. This has to be considered, since, for a given array polarization, different slot arrangements of the antenna elements are used. Electrically, this leads to a different feeding phase from which each antenna is fed, since the coupling slot involved in the antenna elements 1, 3, 5 and 2, 4 is not the same, with each slot being excited by means of microstrip lines with unequal electrical lengths, since they are placed on different substrate heights (
Figure 2). Thus, a phase addition has to be applied in order to compensate such electrical length variation of the microstrip lines that feed the slots. The resulting geometrical arrangement of the feeding slots can be seen in
Figure 14.
According to the values of
Table 2, lines 1 and lines 2 have a length
and
of 25.95 mm and 52.3 mm, respectively. As each microstrip line is placed on different FR4 substrate heights
and
, its guided wavelengths are
mm and
mm. Each slot is fed with a phase given by the electrical length of the line from which it is coupled. The electrical lengths
and
lead to a phase shifting at slot 1 and slot 2, respectively
and
, given by:
That leads to a feeding phase difference between both lines of:
The exact phase value is rounded several degrees as simulations show that the precise phase value from which each slot is fed is slightly influenced by the offset of the slot 1, and the position of the slot 2 that is placed above the end of the line 1. This phase difference has to be compensated when exciting the same polarization by means of different feeding slot arrangements.
In addition, this sequential rotation approach leads to a 180° rotation of the antenna element 3, as it can be seen in
Figure 14, just like it was presented in the previous configuration. This requires an inversion phase feeding of the ports
,
, since they have to be fed out of phase.
4.3.1. Uniform Amplitude and Phase Distribution
The aforementioned design considerations lead to the amplitude and phase values for each antenna feeding port listed in
Table 5.
A comparison between the normal array and the array with the sequential 90° rotation of the antenna elements, when applying uniform amplitude and phase, is depicted in
Figure 15. It can be seen that both configurations provide the same co-polar pattern with broadside radiation, with slight differences regarding the side lobe level of the vertical polarization. The measured cross-polarization is again higher than the simulation, as it is experienced in the previous measurements. However, it can be stated that the cross-polarization performance of the array with the sequential 90° rotation is considerably enhanced within the main beam with the penalty of increasing it in the ranges
but far beyond the antenna main beam. The measured improvement at
is almost 10 dB and 8 dB for the horizontal and vertical polarization, thus achieving a measured cross-polarization suppressions of 32 dB and 36 dB, respectively, which still remain below the simulated values. This slightly difference can be expected, since the measured range of the cross-polarization values are relatively low in the logarithmic scale, leading to an extremely sensitive measurement. It has to be also considered that the antenna elements are not exactly identically constructed due to fabrication tolerances and manufacturing processes. It can be also seen that the measured cross-polarization patterns agree with the predicted simulation data.
A comparison in terms of cross-polarization suppression of the normal array and the array with the sequential 90° rotation of the antenna elements is shown in
Table 6. A polar representation of the cross-polarization suppression values is depicted in
Figure 16. It can be seen that with the sequential 90° rotation, a great improvement regarding the cross-polar suppression within the antenna main beam is achieved.
4.3.2. Beamforming
For the case of side-looking, the amplitude tapering and phase distribution values are given by
Table 7.
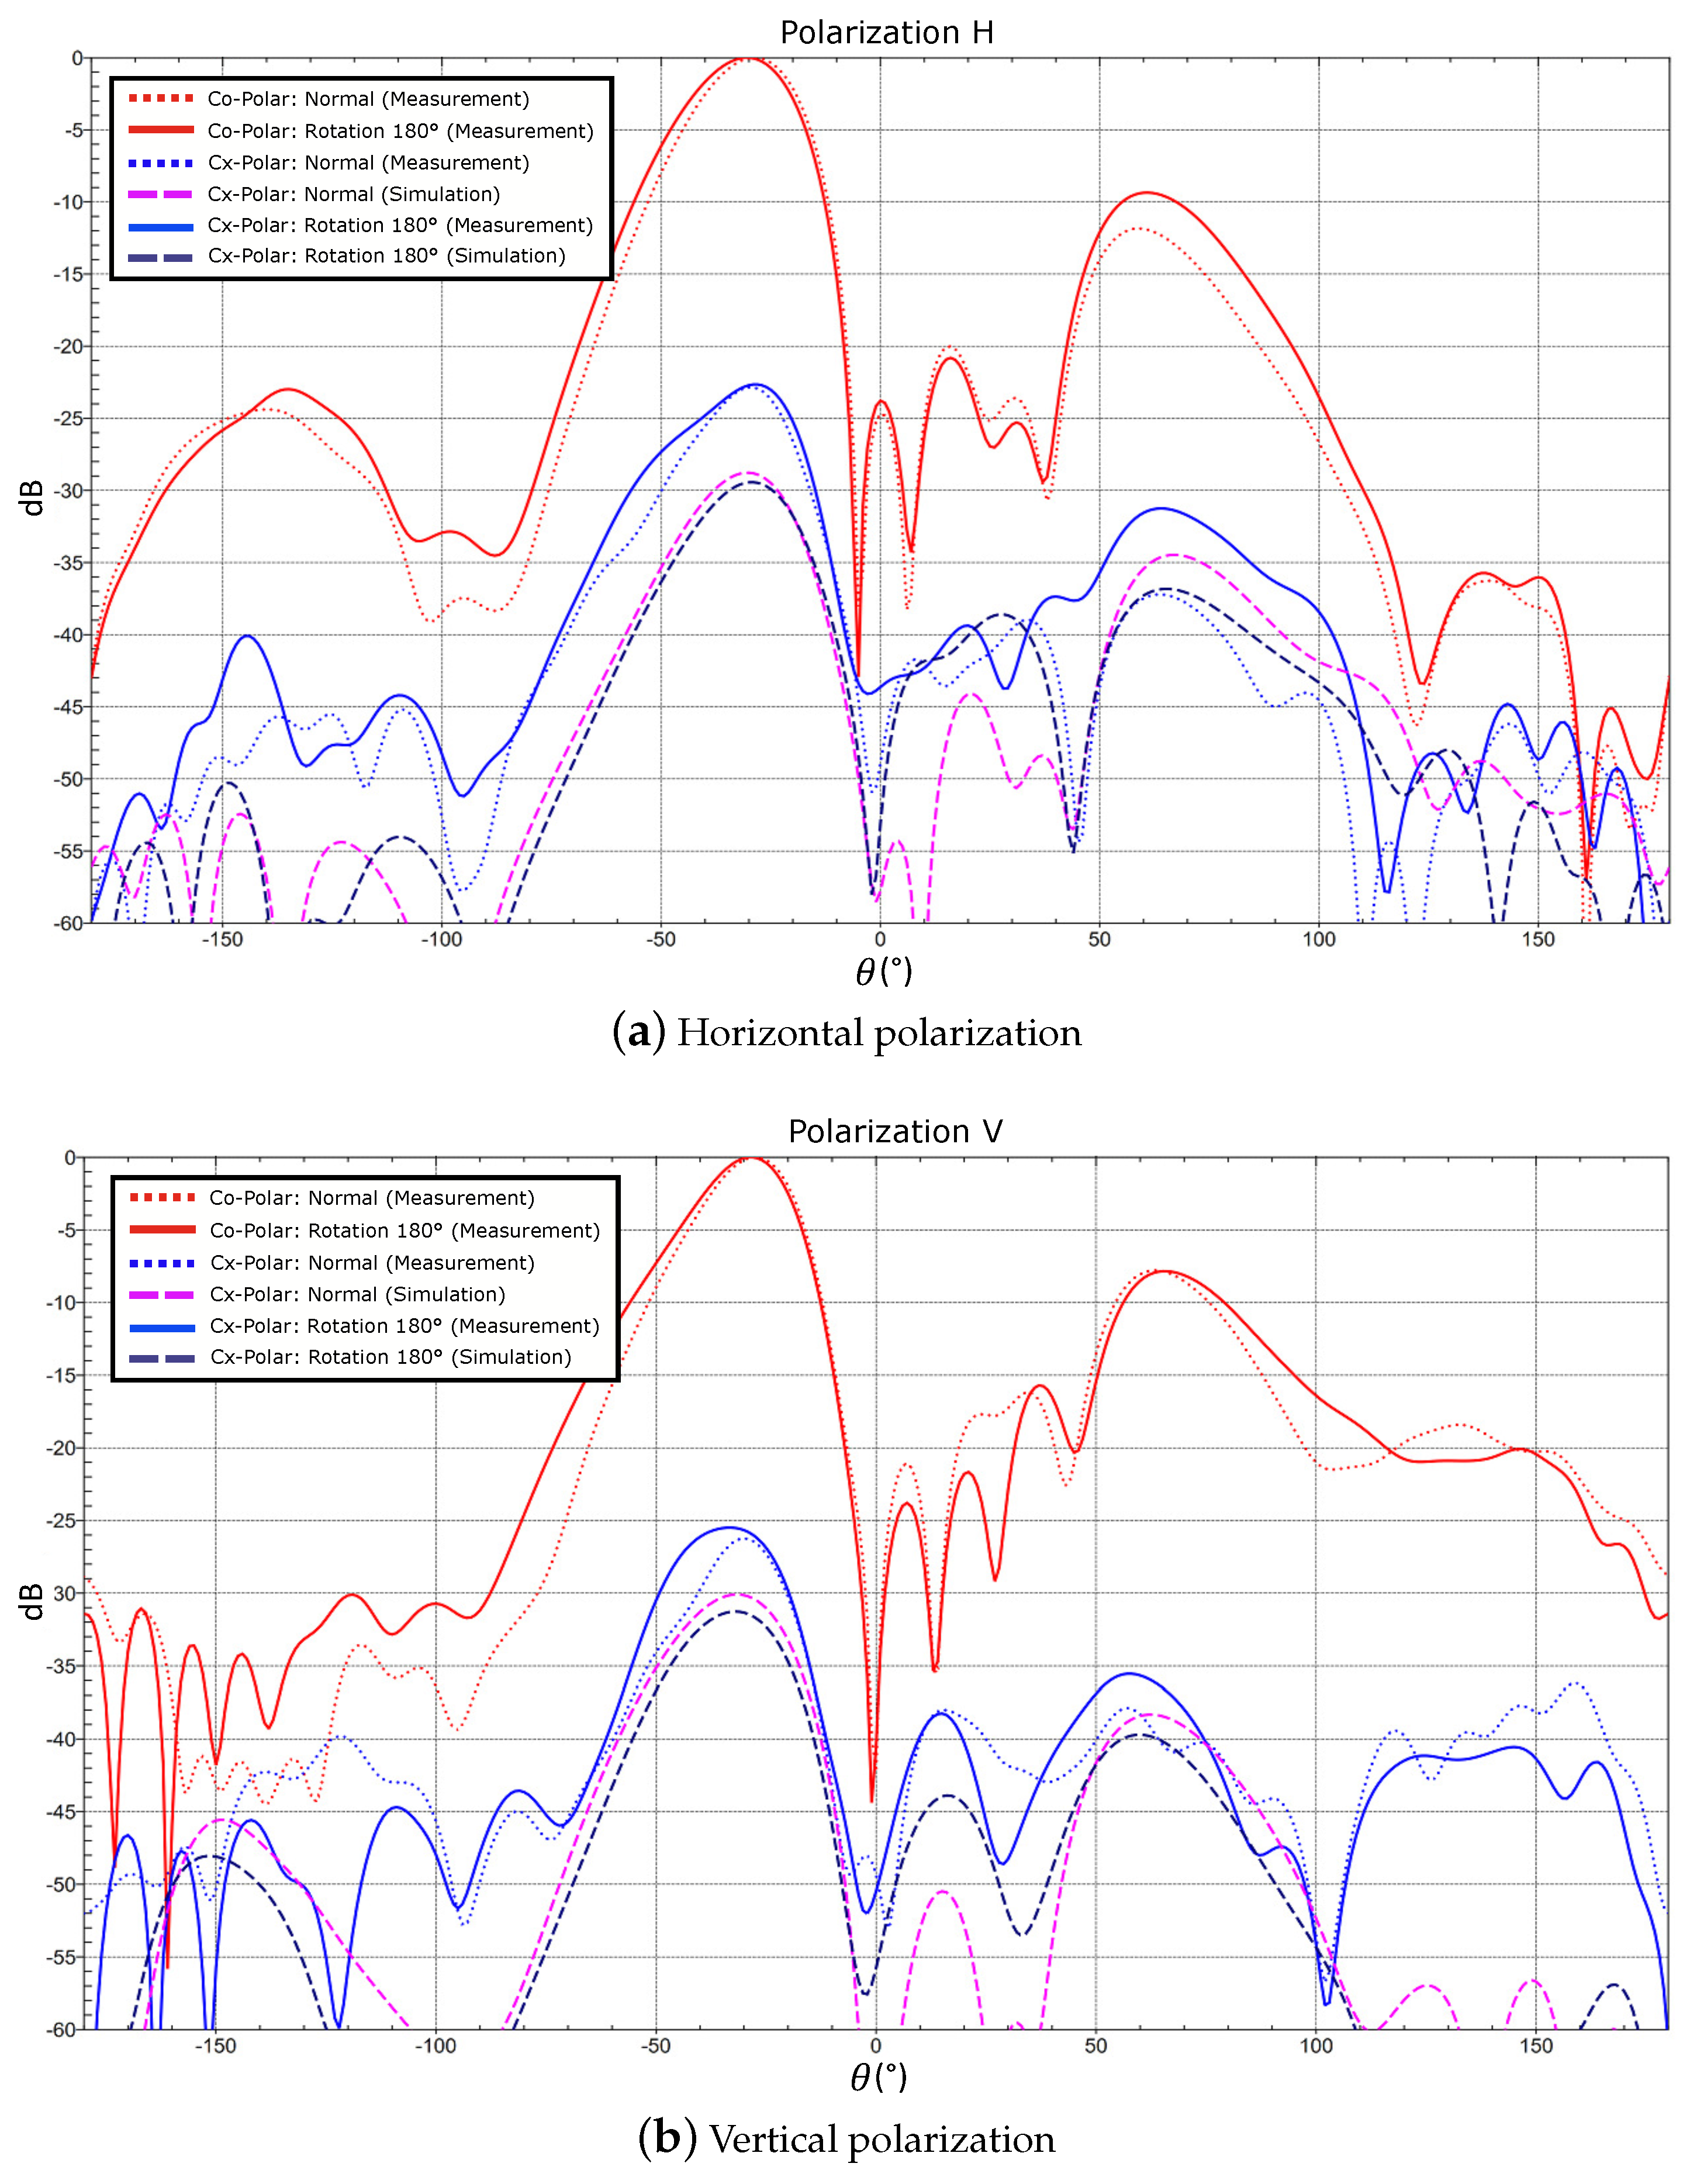
The performance of this configuration is compared with the normal array in
Figure 17 when beamforming is applied. Both array configurations provide a similar co-polar patterns, as expected. Despite the fact that the measured cross-polar level for the horizontal polarization at the antenna main beam direction
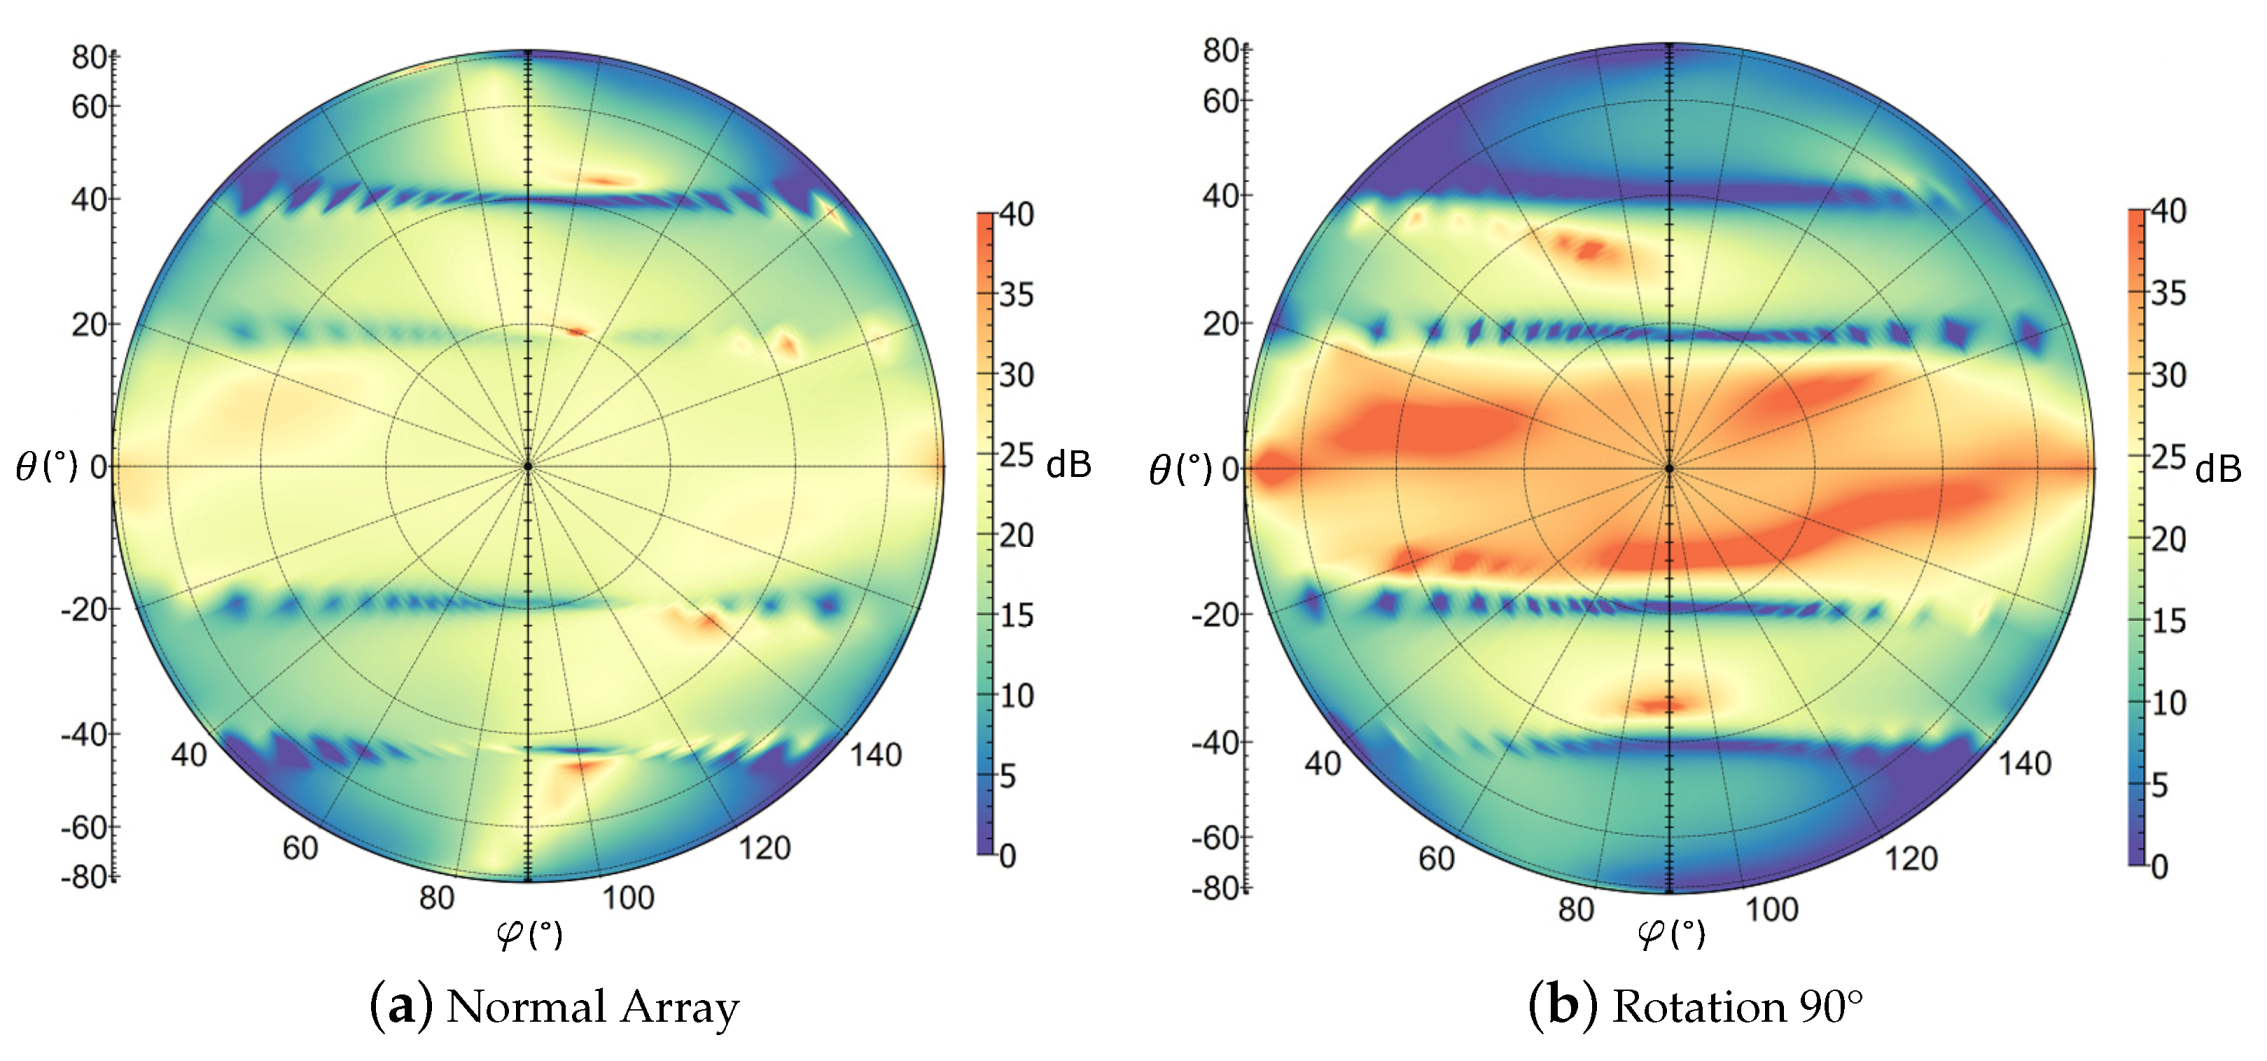
is higher than the simulated value, it remains 10 dB below the measured value for the normal array. The measurement of the vertical polarization shows an improvement of almost 14 dB in comparison with the normal array, achieving a cross-polarization suppression of 40 dB. The sequential 90° rotation of the antenna elements also provides a shift of the cross-polarization maximum beyond the antenna main beam. The overall measured cross-pol pattern meets the simulated data, which demonstrates the improvement of the cross-polarization performance by means of the presented 90° rotation approach. An overview in terms of the cross-polarization suppression values of this configuration and the normal array, when applying beamforming, is shown in
Table 8 and
Figure 18. The polar plot provides an additional angular representation, where the improvement achieved in the antenna main beam direction is clearly seen, especially all over the direction
. A more symmetric cross-polarization pattern is also achieved, with a deterioration in the angular range
, far beyond the direction of the main radiation.


