
Validation of Satellite-Based Precipitation Products from TRMM to GPM


1
Science System and Applications, Inc., Lanham, MD 20706, USA
2
NASA Goddard Space Flight Center, Greenbelt, MD 20771, USA
3
NASA Marshall Space Flight Center, Huntsville, AL 35805, USA
4
NASA Wallops Flight Facility, Wallops Island, VA 23337, USA
*
Author to whom correspondence should be addressed.
Remote Sens. 2021, 13(9), 1745; https://0-doi-org.brum.beds.ac.uk/10.3390/rs13091745
Submission received: 6 April 2021
/
Revised: 23 April 2021
/
Accepted: 28 April 2021
/
Published: 30 April 2021
(This article belongs to the Special Issue Remote Sensing of Precipitation at the Mid- to High-Latitudes)
Abstract
:The global precipitation measurement mission (GPM) has been in operation for seven years and continues to provide a vast quantity of global precipitation data at finer temporospatial resolutions with improved accuracy and coverage. GPM’s signature algorithm, the integrated multisatellite retrievals for GPM (IMERG) is a next-generation of precipitation product expected for wide variety of research and operational applications. This study evaluates the latest version (V06B) of IMERG and its predecessor, the tropical rainfall measuring mission (TRMM) multisatellite precipitation (TMPA) 3B42 (V7) using ground-based and gauge-corrected multiradar multisensor system (MRMS) precipitation products over the conterminous United States (CONUS). The spatial distributions of all products are analyzed. The error characteristics are further examined for 3B42 and IMERG in winter and summer by an error decomposition approach, which partitions total bias into hit bias, biases due to missed precipitation and false precipitation. The volumetric and categorical statistical metrics are used to quantitatively evaluate the performance of the two satellite-based products. All products show a similar precipitation climatology with some regional differences. The two satellite-based products perform better in the eastern CONUS than in the mountainous Western CONUS. The evaluation demonstrates the clear improvement in IMERG precipitation product in comparison with its predecessor 3B42, especially in reducing missed precipitation in winter and summer, and hit bias in winter, resulting in better performance in capturing lighter and heavier precipitation.
1. Introduction
Reliable precipitation data are critical for a wide variety of applications such as water budget studies and prevention or mitigation of natural hazards caused by extreme precipitation events. Precise precipitation measurements are always a challenge because of its large spatiotemporal variability and inherent errors of various measuring instruments. Traditional rain gauges provide direct rainwater measurements, and often serve as the reference for validation of radar- and satellite-based precipitation products [1,2,3,4,5]. However, gauges can only make what are essentially point-measurements at a specific site. The areal distribution of rain gauge networks is usually sparse, irregular, incomplete, and therefore insufficient for accurately describing the spatial variability of precipitation [1,3]. Ground-based weather radars estimate precipitation from reflectivity measurements over relatively large areas. The implementation and retrofitting of dual-polarization to many new weather radars leads to a more accurate precipitation estimation [6,7]. However, the radar networks are mostly deployed over continents only, not dense enough over most parts of the world over land and provide little coverage over oceans. In addition, the radars suffer from various sources of problems, such as beam blockage in mountainous regions [1,5]. In contrast, remote sensors from Earth observation satellites have been utilized to address the problem of comprehensive precipitation coverage because of their wide and continuous coverage of regional and global precipitation [1,8].
Since the launch of the tropical rainfall measuring mission (TRMM) satellite, satellite remote sensing-based precipitation products have matured [8]. Among them, TRMM multisatellite precipitation analysis products (TMPA) [9], and its global successor, the integrated multisatellite retrievals for global precipitation measurement (GPM; IMERG) [10], have been widely used due to their relatively high accuracy and applicability [9,10,11,12,13]. However, satellite-based products are not immune from various sources of systematic biases and random errors [12,13,14,15]. The evaluation of satellite precipitation products is vital to identify the strength, as well as weakness, improve the accuracy, and ultimately advance their use for a variety of applications.
NASA GPM ground validation (GV) routinely conducts verification for various satellite-based products. Petersen et al. [12] provided an overview of the structure and activities associated with the NASA GV efforts, and examples of IMERG verification. As a spin up to full GPM GV efforts, Wang et al (2014) compared Version-7 TMPA 3B42 and nearly one-month prelaunch “test-version” IMERG rain estimates with ground radar product and found three products were generally in good agreement [16]. Gebregiorgis et al. [17] evaluated the Version 3 (Day 1) Late Run IMERG product and highlighted the improvements of IMERG upon the real-time TMPA product with reduced missed-rain and false-rain bias, and increased hit rate. A number of these evaluations have found the overall improved performance of GPM IMERG products over the TMPA 3B42 predecessor [13,18,19,20,21]. Importantly, the IMERG performance has also been noted to vary significantly spatially and seasonally [19,20,21,22,23,24,25,26]. For example, Chen and Li [22] found that the IMERG performance was poor in winter, especially over North China. Murali Krishna et al. [23] showed that both IMERG and 3B42 products underestimated the observed rainfall over the Indian subcontinent. More recently, Moazami and Najafi [25] demonstrated that IMERG performed better over most parts of interior plains across Canada but overestimated the moderate to heavy precipitation events. More comprehensive validation is still necessary to better understand regional and seasonal uncertainties in satellite-based precipitation products.
The TMPA products ended on 31 December 2019 after its successor product IMERG is retrospectively processed to the start of TRMM [27]. The time overlap for both products provides an opportunity to investigate the performance of the new IMERG products compared to the TMPA. Since the IMERG V06B were newly released recently, few studies have used it to conduct the research for the transition in multisatellite products from TMPA to IMERG, especially in the long-term and in different seasons.
This study describes one of the NASA GPM GV efforts. The final version of TRMM 3B42 (V7) and latest version of GPM IMERG (V06B) are evaluated using the ground-based and gauge-corrected multiradar multisensor system (MRMS) precipitation products filtered with radar quality index (RQI) over the conterminous United States (CONUS). Due to its diverse physiographic and meteorological features, and relatively dense and well-maintained gauge and weather radar networks, CONUS is one of the best regions in the world for the satellite precipitation product validation.
The paper is structured as follows. Section 2 describes the study domain, and satellite-based and ground-based products. Section 3 presents the methodology and statistical metrics. In Section 4, comparisons are presented through four subsections. The discussion and conclusions are provided in Section 5.
2. Data
2.1. Study Domain
Figure 1a shows the study domain with land and ocean mask. We limited the study domain to land only because of a lack of rain gauges and radar coverages over the ocean, dwindlement of radar data utility with range along the coastal oceans (Figure 2), and the significant errors in satellite retrievals due to beam filling effects of part land and part water. A land/ocean mask (Figure 1a) at 0.25° resolution is constructed from the GPM Microwave Imager footprint surface type data over the latitude/longitude box region enclosed by (125–65°W, 25–50°N). Here we define “land” as lands, lakes, rivers and other inland waters. All others are defined as “Ocean” and excluded in the analysis.
Climatologically, precipitation features in CONUS vary with latitude and topography. Generally, it is wetter in the southeast and along the West Coast, but drier in the north and west. Based on Köppen–Geither climate classification, CONUS is typically classified into five main climate regions: A—tropical climates, B—dry climates, C—moist subtropical mid-latitude climates, D—moist continental mid-latitude climates, and H—highlands (Figure 1b).
2.2. TRMM 3B42
TMPA is a 3-hourly precipitation product with a spatial resolution of 0.25° in latitude and longitude, covering from 50°S to 50°N [9]. The product record started from 1 January 1998 when TRMM data became available, and for continuity, continued into the GPM era even after TRMM terminated, and ended on 31 December 2019 when IMERG product was regarded as its substitute [27].
TRMM 3B42 combines measurements from different platforms onboard multiple satellites. The passive microwave precipitation estimates are intercalibrated to the TRMM combined instrument (TCI) product, and finally adjusted with rain gauge data on a monthly basis. The intercalibration was changed from TCI to a climatological calibration starting with the data from October 2014 because of the end of the TRMM satellite mission. This created at least a slight inhomogeneity, primarily over the oceans [27]. The inhomogeneity over land should be minimized by the gauge adjustment [28].
2.3. GPM IMERG
As a global successor to TMPA, the newly released version 06B IMERG is a multisatellite precipitation product at fine spatial (0.1°) and temporal (0.5-h) resolution with global coverage. The National Aeronautics and Space Administration (NASA) precipitation processing system (PPS) generates IMERG by combining passive microwave (PMW) and infrared (IR) observations from the GPM constellation satellites and calibrated with gauge analysis of the Global Precipitation Climatology Centre (GPCC) [29]. IMERG is a unified U.S. national algorithm [10], which combines the strengths of several products including: (1) NASA TMPA for intersatellite calibration and gauge adjustment [9], (2) the National Oceanic and Atmospheric Administration (NOAA) Climate Prediction Center (CPC) morphing technique with Kalman filter (CMORPH-KF) for time interpolation of PMW-based estimates [30], and (3) the University of California (Irvine) precipitation estimation from remotely sensed information using artificial neural networks–cloud classification system (PERSIANN-CCS) for retrieval of microwave calibrated IR estimates [31]. One key difference between 3B42 and IMERG is that CMORPH-KF is applied in IMERG to minimize the use of low quality IR estimates.
Three types of IMERG products are provided for different user requirements and applications: near-real time “Early” run (IMERG-E), “Late” run (IMERG-L), and post-real time “Final” run (IMERG-F) with approximate latency of 4 h, 12 h, and 4 months, respectively. The monthly gauge adjustment is used in IMERG-F to reduce bias. IMERG-F is a research quality product and generally considered to be more accurate than IMERG-E and L. Here the latest version (V06B) IMERG-F is evaluated. The details of the algorithm are described by Huffman et al. [10], and the latest changes to the morphing algorithm in V06B are further provided by Tan et al. [32]. IMERG data files can be accessed from https://gpm.nasa.gov/data/directory (accessed on 29 April 2021).
2.4. Ground MRMS
To evaluate the quality of IMERG and 3B42 products, the “Level 3” MRMS is selected as a ground-based reference. Level 3 denotes a gridded product in the GPM project. The NOAA’s National Severe Storms Laboratory (NSSL) integrates information from about 180 ground-based operational radars and generates a 3D radar mosaic across the CONUS and Southern Canada (130–60°W, 20–55°N) [33]. The Level 3 MRMS products used in this study were at half-hourly and 0.01° resolutions, generated through significant MRMS data postprocessing, which involves gauge-based bias adjustments, resampling, and quality controls, specifically for support of GPM GV [34]. A radar quality index (RQI) is also produced along with precipitation estimates in the MRMS suite. RQI ranging from 0 (worst) to 100 (best) indicates sampling and estimation uncertainty, depending on the height of the lowest radar elevation angle relative to the bright band and percentage of beam blockage by topography [35]. Figure 2 shows mean RQI maps averaged from half-hourly data for three winters and five summers, respectively, during the 55-month period (June 2014 to December 2015, June 2016 to July 2017, and March 2018 to December 2019). Data from January to May 2016 and August 2017 to February 2018 were excluded, which will be discussed in Section 4.1. Figure 2 clearly indicates that the MRMS data quality in summer (JJA) was better than in winter (DJF). In addition, the gaps of radar coverages did exist in western CONUS even in summer. Further, compared to eastern CONUS, the MRMS quality was evidently lower in the Intermountain West because of severe blockages caused by the complex terrain. RQIs in coastal oceanic areas were generally very low due to large distances between neighboring radars and sharp topographic transition. The coastal oceanic areas were masked out from the study (Figure 1).
2.5. Montly GPCC
The Global Precipitation Climatology Centre (GPCC) provides gridded precipitation analyses derived from quality-controlled gauges worldwide via the Global Telecommunication System of the World Meteorological Organization [29]. One of the GPCC products is the full data monthly analysis version 2020, which is developed from up to 54,000 gauges using the new GPCC precipitation climatology version 2020 as the analysis background. The GPCC monthly gauge analysis is one of the contributing data sources for TMPA [9] and IMERG [10]. The full data monthly analysis version 2020 at 0.25° spatial resolution is used in this study to confirm the consistency of satellite-based precipitation products and check the MRMS reliability at the monthly scale.
3. Methodology and Evaluation Metrics
Due to the difference in spatial and temporal resolutions among the above-described products, the validation is conducted using an approach that matches and temporally resamples MRMS, 3B42, and IMERG data to a common spatiotemporal resolution of 0.25° and 3 h. Note that, for each day, the 3-h cutoff times for 3B42 files are 0130, 0430, ..., 2230UTC. The first 3 h of a day have a starting time of 2230UTC on the day before, and the last 3 h have the ending time of 2230UTC on the data day. Accordingly, we accumulated 30-min data for MRMS and IMERG to the same 3-h interval as 3B42.
Probability density function (PDF) for precipitation occurrence and volume, scatter density plots, time series of daily and instantaneous 3-hourly precipitation maps are routinely produced (https://wallops-prf.gsfc.nasa.gov/NMQ/IMERG_3B42_MRMS_30m/index.php (accessed on 29 April 2021)). The statistical metrics such as relative bias (bias), Pearson correlation coefficient (Corr), and normalized mean absolute error (NMAE), normalized root-mean-square error (NRMSE) are utilized to quantify the performance of satellite products.
Relative bias shows an overestimation (positive) or underestimation (negative) of total precipitation. Corr ranging from −1 to 1, is an indicator of an a priori assumed linear relationship between two products. NRMSE is normalized root-mean-square-error (RMSE), denoting the relative mean error magnitude. By using NRMSE, the issue that RMSE values increase with the precipitation intensities can be mitigated. The equations of these metrics are not listed in this manuscript. Readers are referred to statistics books, e.g., [36] and peer-reviewed papers, e.g., [15].
In order to further examine precipitation detection capability of satellite-based products (IMERG and 3B42) against ground-based reference product (MRMS), a contingency table is constructed for each product. The contingency table, also called two-way frequency table, consists of occurrences of hit (h), miss (m), false alarm (f), and correct negative (c). For the satellite product to be evaluated, “hit” means that precipitation is correctly detected when it occurs, and “miss” means that precipitation is not detected when it occurs. “False alarm” means that precipitation is mistakenly detected, and “correct negative” means that zero-precipitation is correctly flagged as such.
From the hits, misses, false alarms, and correct negatives, three widely applied categorical statistical skill metrices: probability of detection (POD), false alarm ratio (FAR), and Heidke skill score (HSS) can be calculated. POD is the fraction of actual precipitation occurrences that are correctly detected; a perfect score is 1 and the worst is 0. The FAR measures the fraction of falsely detected precipitation occurrences, ranging from 0 (the perfect) to 1 (all detected precipitation rates are fake). HSS, a generalized skill score ranging from −∞ to 1, quantifies whether the estimate is equal to (0), worse (negative value), or better (positive value) than random chance relative to the reference; the perfect value is 1.
The categorical statistical skill metrics provide categorical measures of performance based on precipitation occurrences, but do not provide any information as to what fraction of the precipitation volume is detected. Therefore, a volumetric error decomposition approach developed by Tian et al. [37] and Habib et al. [38] is adapted to completely decompose the total error (E) of precipitation volume into three independent components: (1) hit bias (H)—precipitation is detected, but the precipitation volume is biased either positively or negatively; (2) bias due to missed precipitation (−M)—precipitation is not detected, which obviously leads to a negative bias; and (3) bias due to false precipitation detection (F)—precipitation is mistakenly detected while there is no precipitation, which apparently causes a positive bias. These three components are related by Equation (4)
It is possible that H, −M, or F is larger than E simply because they could cancel one another, which results in a smaller E. Therefore, this approach can reveal much more information on error characteristics by looking at individual components, instead of merely the total error.
In the calculation of the above categorical metrics, and in the error decomposition approach, the precipitation and no-precipitation threshold are assumed to be 0.1 mm h−1. This threshold has been applied in many previous studies (e.g., [13]). If the precipitation rate is below 0.1 mm h−1, it is considered not precipitating. The selection of this threshold is rather subjective, but the results were relatively robust, which is demonstrated when other thresholds (0.0, 0.2, 0.5, and 1.0 mm h−1) were also selected for the test. The trace precipitation below the threshold of 0.1 mm h−1 was not very important in meteorological and hydrological applications. It only accounted for 1.5%, 0.3%, and 3.1% of total precipitation for MRMS, 3B42, and IMERG, respectively, which will be discussed in Section 4.4. The threshold of 0.1 mm h−1 was below the minimum detectable precipitation rates of remote sensors on ground radars and satellites. It is common to consider a threshold to eliminate spurious light precipitation caused by different instruments and retrieval algorithms [12,15].
4. Results and Analysis
4.1. Time Series of Spatially Averaged Monthly Precipitation
Figure 3 is the time series of monthly precipitation spatially averaged over the study domain for GPCC, MRMS, 3B42, and IMERG, respectively, from June 2014 to December 2019. MRMS data are missing from January to May 2016. Precipitation from MRMS during July to November 2017 was evidently abnormally lower than all other products. Daily and 3-hourly precipitation maps (https://wallops-prf.gsfc.nasa.gov/NMQ/IMERG_3B42_MRMS_30m/index.php (accessed on 29 April 2021)) revealed that MRMS failed to capture major rain events due to some unknown issues during this period. After the period, there were large amounts of missing data in MRMS from December 2017 to February 2018. Hence, we only used the data in the common time span of 55 months from June 2014 to December 2015, June 2016 to July 2017, and March 2018 to December 2019 in this study. The data from January to May 2016 and from August 2017 to February 2018 were excluded. From the commonly available 55-month datasets for all products, there were three winters (December 2014 to February 2015, December 2016 to February 2017, and December 2018 to February 2019) and five summers (June to August in 2014, 2015, 2016, 2018, and 2019), which will be studied in a winter/summer contrast.
Figure 3 illustrates that the satellite-based monthly precipitation from TRMM 3B42 and GPM IMERG had a pattern similar to the observations from ground-based MRMS and GPCC products. All products were able to reasonably reproduce the precipitation seasonal variation. IMERG and 3B42 appeared to overestimate the winter precipitation. The overestimation is likely because IR precipitation estimation in satellite products was indirectly inferred from cloud top temperature, which limited the accuracy for the cold precipitation detection and quantification [17]. Product characteristics will be further analyzed in the next section.
Figure 4 is the time series of ratios and correlations for IMERG (3B42) relative to MRMS, calculated from 3-hourly precipitation at 0.25° resolution for each month. GPCC is not available for the comparison because it is a monthly product. Only pixels associated with the perfect MRMS RQI value (100) and precipitation at least 0.1 mm h−1 for both IMERG (3B42) and MRMS were used in the calculation. This qualitatively filtering procedure can effectively remove noise from MRMS data [39]. Figure 4 clearly demonstrates that IMERG constantly outperformed 3B42 in terms of ratio and correlation. Relative to MRMS, both products overestimated precipitation in winter whereas underestimated precipitation in summer. The correlation between IMERG (3B42) and MRMS was higher in winter than in summer.
Figure 4 is just one of the plots for the time series of monthly ratios and correlations from all combinations of RQIs (≥0, 25, 50, 75, and 100) and precipitation thresholds (≥0.0, 0.1, 0.2, and 0.5 mm/h) for 3B42 and IMERG. The complete distribution of the ratios and correlations can be displayed on boxplots with emphasis on the directions of bias (i.e., positive or negative) and outliers. In Figure 5 and Figure 6, one boxplot corresponded to the 55 months from each of the 80 time series plots. For example, the data in the boxplot (last column in Figure 6f) for the correlation between IMERG and MRMS with RQI of 100 and precipitation threshold of 0.1 mm h−1 was from the solid line in Figure 4b.
From Figure 5b–d, the large positive bias in 3B42 was evident, with the interquartile range and mean all are well above 1. Large outliers contribute to considerable overestimation of precipitation rates.
All boxplots, except for Figure 5a and Figure 6a, share a common featured that the ratio decreased towards 1 with increasing RQI. It is worth noting that the ratio for 3B42 relative to MRMS with a threshold of 0.0 mm h−1 (Figure 5a) was lower than all other ratios with larger precipitation thresholds (Figure 5b–d and Figure 6b–d). This implies that 3B42 missed a considerable amount of total rain volume due to light precipitation. This will be shown in probability distribution of 3-hourly precipitation rates (Figure 11). On the other end, 3B42 overestimated precipitation with intensities greater than 0.1 mm h−1 (Figure 5b–d). This issue was largely mitigated in Figure 6b–d for IMERG.
The correlation coefficient was relatively stable with respect to the change of RQI. This is expected because the correlation quantified the covariability between two products. The best correlation was for the cases with a threshold of 0.0 mm h−1 (Figure 5e and Figure 6e) because of large concurrences of zero-precipitation rates included.
4.2. Spatial Distribution of Mean Monthly Precipitation and Error Decomposition Analysis
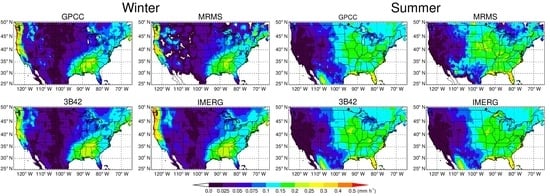
The spatial distributions of mean monthly precipitation averaged from 55 months, three winters, and five summers for ground (GPCC and MRMS ) and satellite (3B42 and IMERG) derived products are shown in Figure 7. For the 55-month average, all products display a high degree of consistency in spatial distribution patterns with copious precipitation in the southeast and Pacific northwest, with relatively less precipitation in the large area of western CONUS. However, differences were still visually discernable among the four products. There were missing data over the Great Lakes in GPCC because of the lack of floating rain gauges. A gradual precipitation gradient descent from south and southeast to north and northwest in IMERG, 3B42 and GPCC was spatially smoother than that in MRMS. That is the smoothing effect in GPCC gauge interpolation [29] reflected in 3B42 and IMERG through the gauge adjustment. IMERG best reproduces the spatial variation of GPCC, which appears to be benefited from the IMERG’s monthly calibration against GPCC gauges. IMERG has the best pattern correlation (0.963) with GPCC, followed by 3B42 (0.947) and MRMS (0.81).
In winter, precipitation along the northwest coastal area is considerably underestimated by 3B42, mainly because of the difficulty in detecting warm, coastal rainfall.
This is also reported by Tang et al. [40]. The underestimation is well corrected in IMERG.
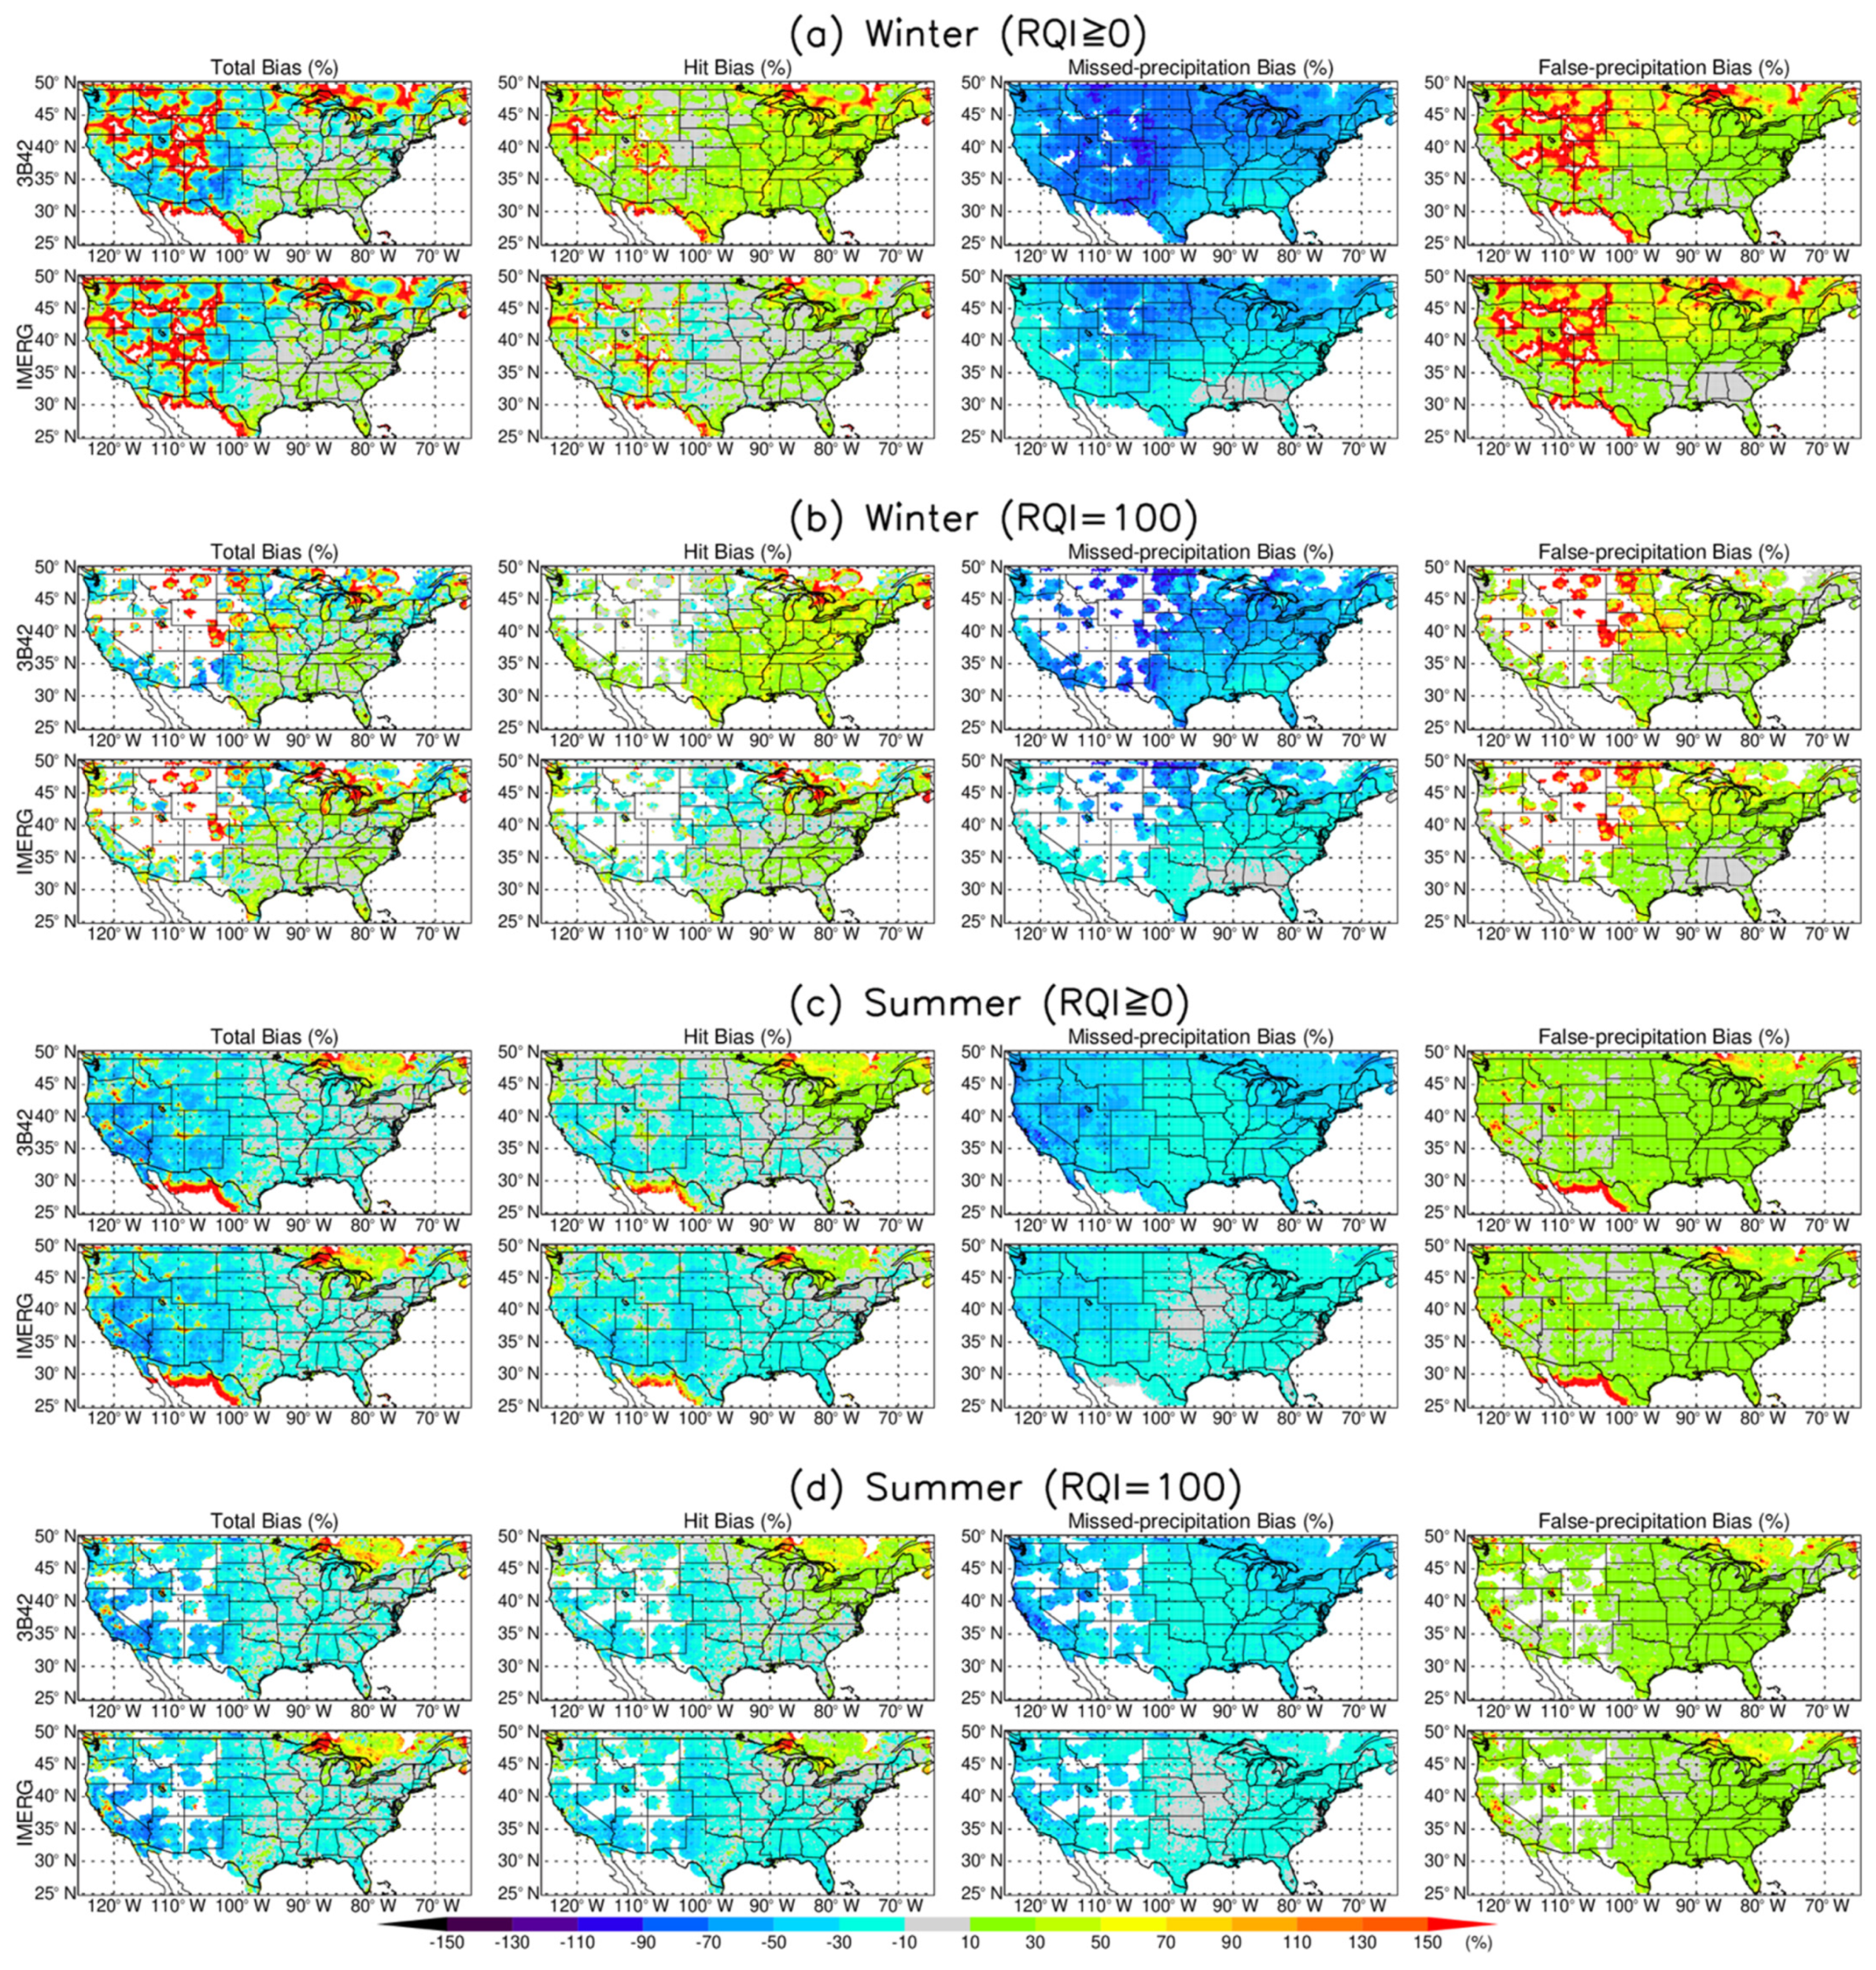
Both IMERG and 3B42 show different levels of overestimation near the Great Lakes area, especially in summer, due to the lack of gauge calibration. The spatial characteristics of the error components for 3B42 and IMERG in winter and summer seasons can be further analyzed using the error decomposition approach [37,38].
As described in Section 3, we decomposed the total bias into hit, missed-precipitation, and false-precipitation biases for each product during each month at each 0.25° grid in the study domain (Figure 1), and then accumulated monthly total biases and bias components as percentages of total MRMS precipitation into seasonal scales, particularly for winter and summer seasons. In this analysis, 3-winter-average and 5-summer-average are presented (Figure 8). The spatial characteristics of the error components for the 55-month average is not shown here as it basically represents the summation of winter and summer in Figure 8a–d, the spatial distributions of the total bias and three error components with RQI filtering. Both 3B42 and IMERG shared considerable similarity in their spatial bias patterns, but with different levels of biases. One obvious feature in the total bias is that the superior performance of satellite products in the central and southern Plains. This may be resultant of the gauge calibration in 3B42 and IMERG algorithms. Both IMERG and 3B42 appear to underestimate the orographically-forced precipitation over the large areas of mountainous western CONUS in summer and winter, whereas they overestimate the precipitation along the Rockies, Sierra Nevada, Mexican border and Great Lakes areas where MRMS quality is questionable (Figure 2). The overestimation is mostly dominated by the enhanced false precipitation detection in these areas. The positive hit bias also contributed to the overestimation over some of these areas. However, after the RQI filter (RQI = 100) was applied, these biases were largely removed (Figure 8b,d).
For winter season, the missed-precipitation bias had the largest amplitude (Figure 9a) among all three components, especially for 3B42 at higher latitudes and mountainous areas (Figure 8a,b). Missed precipitation might be mostly due to the inability of multisatellite PMW sensors for snowfall measurements or rainfall observations over icy land surface [40,41]. Substantial improvements can be seen in the IMERG product where the magnitude of missed precipitation error was dramatically decreased. This can be the result of the use of morphing and PERSIANN-CSS in IMERG. Compared to 3B42, the hit and missed-precipitation biases in IMERG were greatly reduced, whereas the false-precipitation bias was slightly reduced, which was more clearly summarized in Figure 9. The missed-precipitation bias had the largest amplitude among all three components. These three components cancelled one another, which resulted in a smaller total bias. IMERG displays obvious improvement to 3B42 in missed-precipitation and hit bias reduction in winter. However, the hit bias in IMERG was over-reduced in summer, resulting in a large area of negative hit bias (Figure 8c,d).
For the summer season (Figure 8c,d), both products were noticeably similar with a slight underestimation in most of CONUS except for along the Mexican border and the Great Lakes region. The missed-precipitation bias is largely reduced compared to its winter counterpart. The total bias pattern appears similar to that of the hit bias (Figure 8c,d). The overall false precipitation and missed-precipitation biases were not as pronounced as in winter (Figure 8 and Figure 9). This can likely be traced to the more effective gauge correction in 3B42 and IMERG algorithms, which benefits from the fact that the gauge measurement is more reliable for summer rainwater than for winter solid precipitation.
Note that the selection of RQI = 100 is a very conservative approach, which only retains the MRMS data with the best quality; as a result, it significantly limits the data availability especially in the Intermountain West where the quality of radar measurements is lower than other CONUS areas because of radar beam blockage by terrain. Hence, MRMS is not a good GV reference over mountainous regions as it might not correctly represent the weather systems in the regions [42].
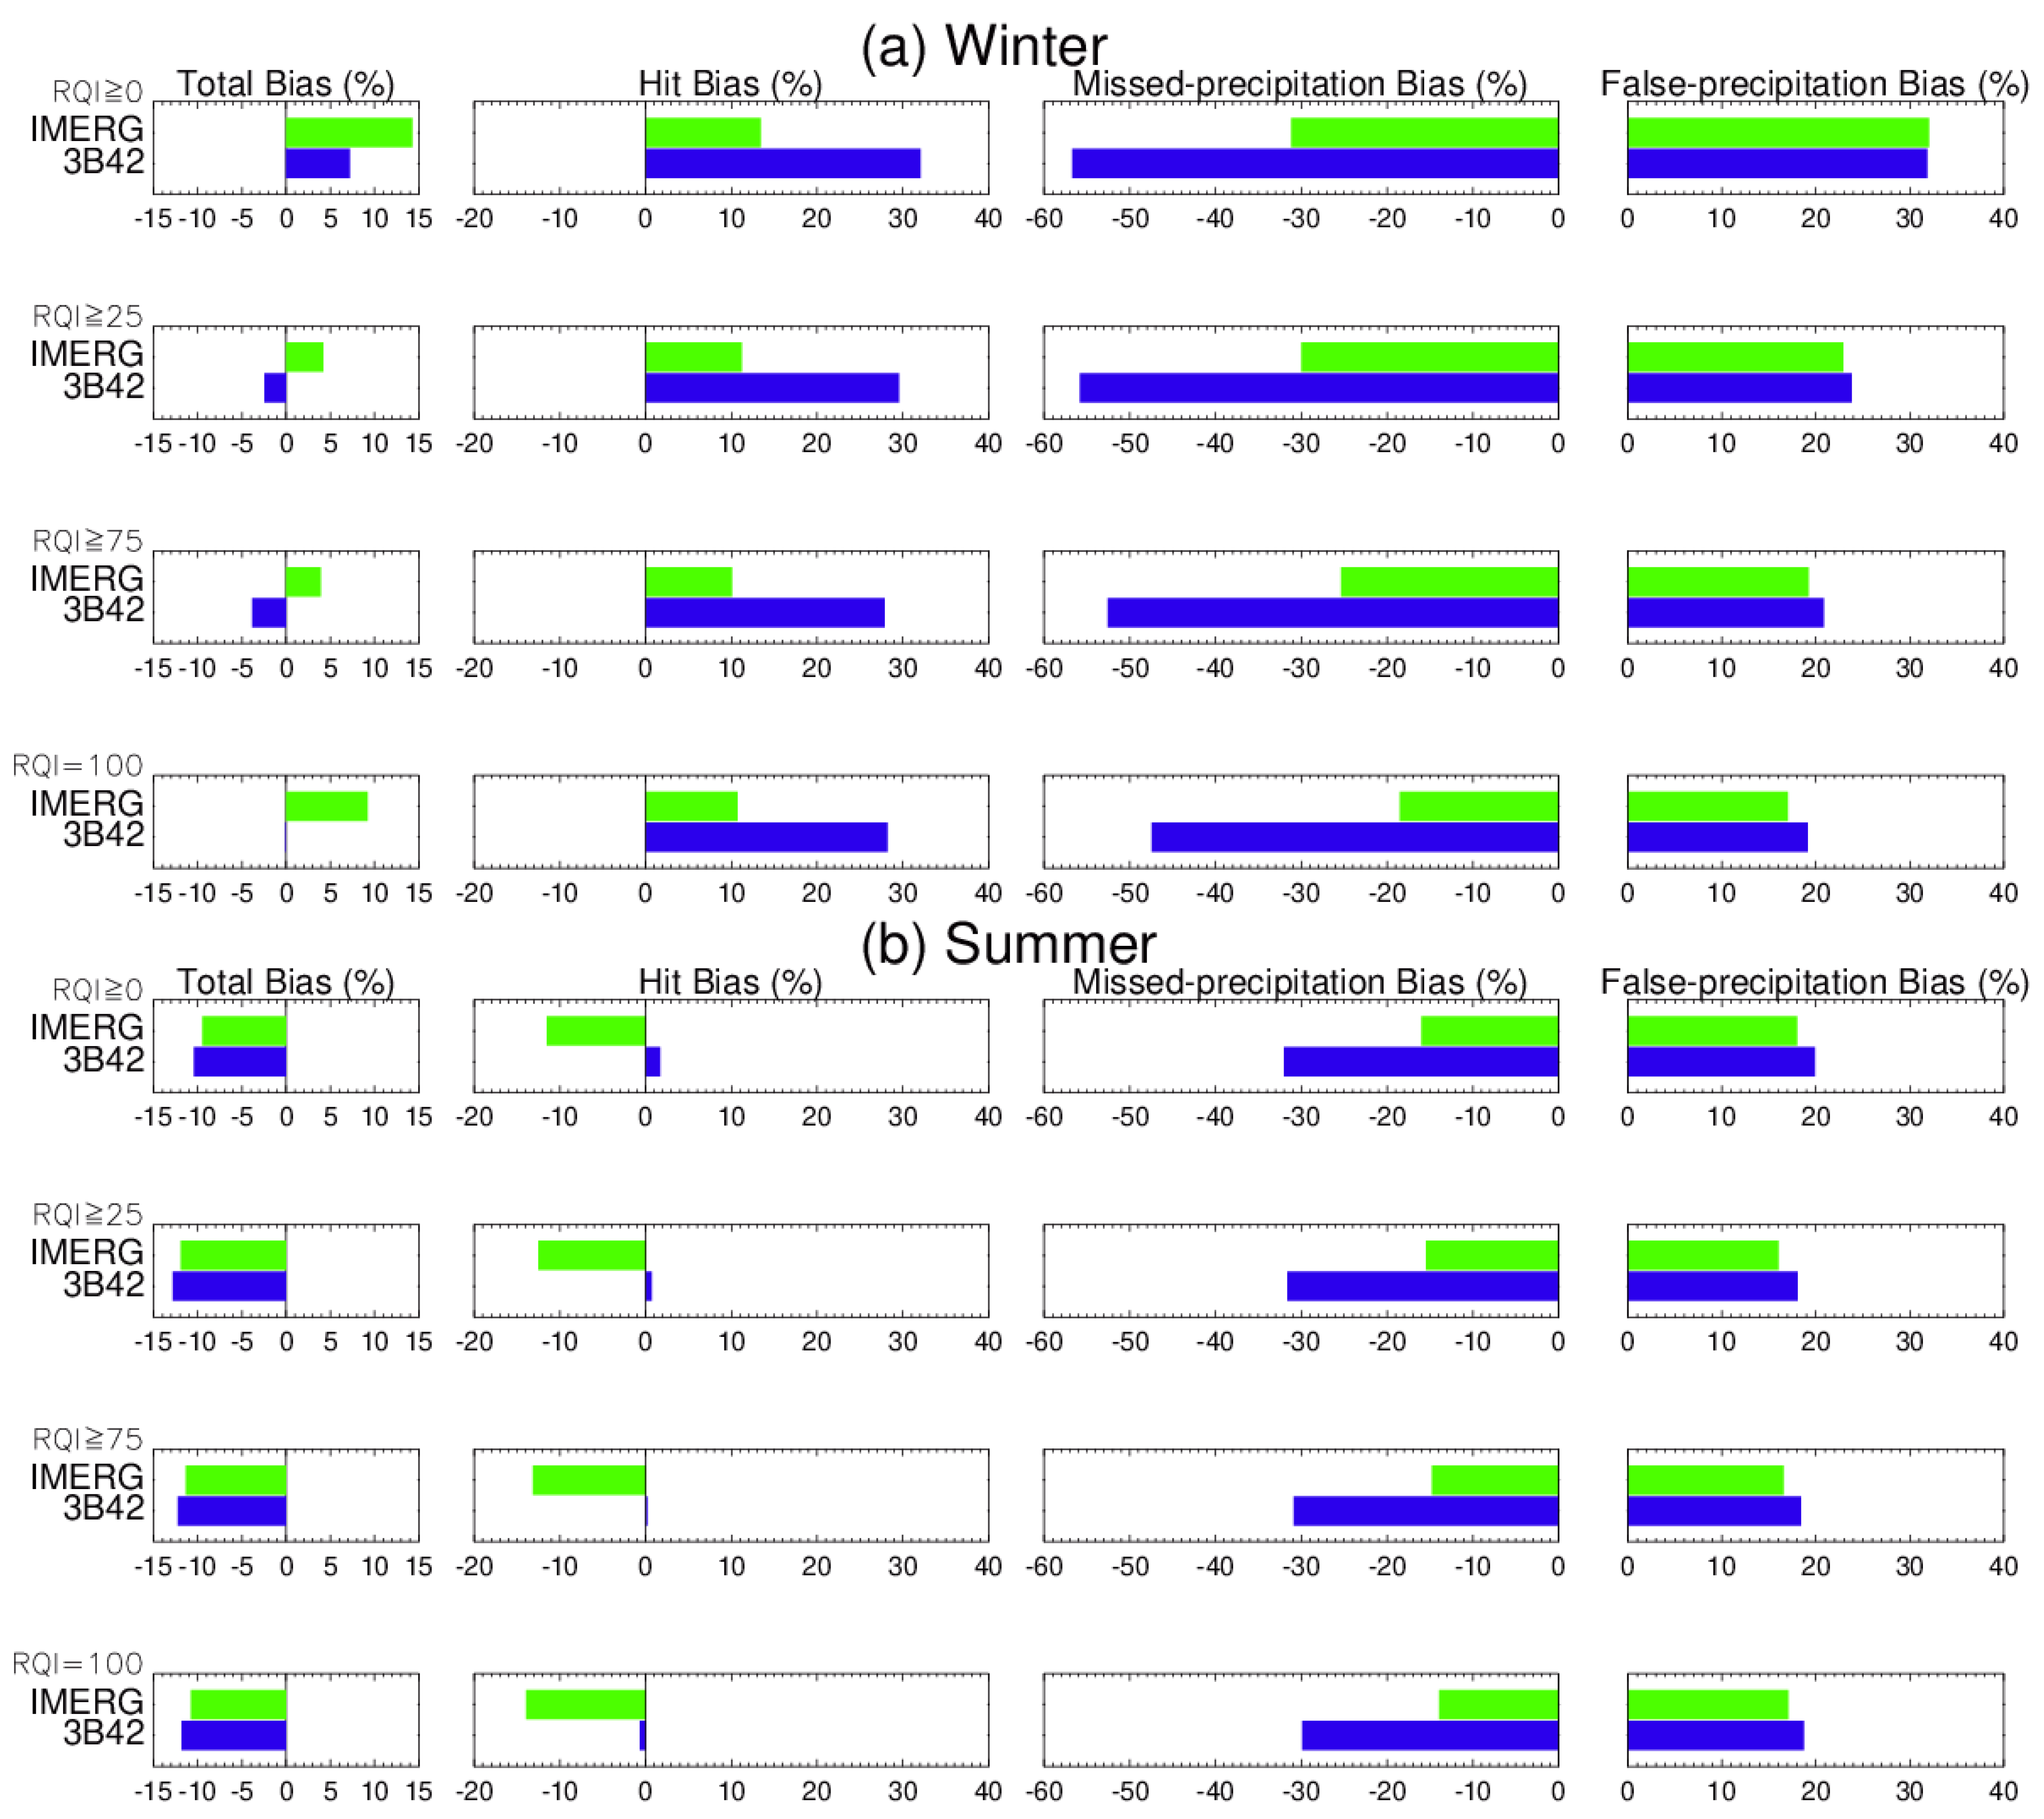
We also selected other RQI thresholds for comparisons (Figure 9). Figure 9 shows the averaged error components, and the total errors, as percentages of the total MRMS precipitation for all 3-hourly precipitation over 0.25° grids with different RQI filtering for winter and summer, respectively.
For winter, missed precipitation is the major source of error, accounting for about 50% of the total precipitation for 3B42 and 20–30% for IMERG, much larger than the total bias. The huge missed-precipitation was countered by the sum of positive hit bias and positive false bias, resulting in a very small total bias.
For summer, both missed and false precipitation biases were smaller compared to those in winter. Compared to winter, the positive hit bias in summer was greatly reduced for 3B42, but it turned out to be negative for IMERG.
One easily noticeable feature in Figure 9a was that the missed- and false-precipitation biases for both IMERG and 3B42 obviously decreased with the increasing RQI in winter season. In summer, this feature was not very salient. RQI filtered less area in summer than in winter because RQI was better in the warm season than in the cold season (Figure 2) due to the presence of stronger low-level temperature gradients during winter periods.
4.3. Statistical Metrics and Categorical Skill Score
Figure 10 shows statistical metrics for IMERG and 3B42 performances relative to MRMS with RQI filtering (zero or 100%) for winter and summer, respectively. IMERG clearly outperformed 3B42 in both winter and summer in terms of all metrics except for a slightly worse false rate, FAR, and relative bias in summer. The morphing algorithm improved the precipitation detection with better hit and miss rates, and increased POD and HSS scores in Figure 10a–d, but at the price of slightly increased false rate and FAR. The increased FAR might be an issue associated with PMW retrieval, which sometimes may erroneously treat the dynamic surface characteristics over land as precipitation signals [43].
Looking at Figure 10a, a striking feature is that the relative bias in the winter season is drastically reduced from 74.7% for 3B42 to 19.1% for IMERG without RQI filtering, and the bias was reduced from 54.1% to 12.8% when RQI=100 was applied. Another salient distinction between TRMM 3B42 and GPM IMERG was that there was a large increase in POD, and a marginal increase in FAR; as a result, a perceived increase in HSS. As discussed in Su et al. [14], the improved POD was mainly attributed to the enhanced sensitivity of sensors used in producing the precipitation products and increased sampling frequency of the GPM mission.
Considered over a continental scale, Figure 10c,d indicate that IMERG precipitation estimates were lower relative to MRMS during summer. A similar result is also found by comparing IMERG with radar-based Stage IV product [44]. This suggests that IMERG may underestimate precipitation from convective systems. In summer, strong convective precipitation events occur more frequently. Due to their short duration, localization, and spatial complexity, these events are generally more difficult to be captured by satellite remote sensors.
The hit bias in Figure 9 and relative bias in Figure 10 had the same direction (positive or negative) but different amplitudes. This behavior occurs because the relative bias represents a difference between satellite and MRMS precipitation as the percentage of MRMS precipitation, conditioned on the presence of a satellite and MRMS precipitation rate of at least 0.1 mm h−1, whereas the hit bias is the difference as the percentage of MRMS precipitation greater than 0.1 mm h−1.
To further measure the agreement between satellite-based and ground-based products, the Kling–Gupta efficiency (KGE) [45,46], a recently more widely used criterion for the predictive skill assessment of hydrological models, was also introduced as another statistic in this study. By taking into account correlation, bias, and variability in a more balanced way, KGE provides an additional interesting insight into the performance of satellite-based products. KGE ranges from −∞ (worst) to 1 (best). Table 1 lists the KGE values calculated from 3-hourly precipitation rates at 0.25° resolution for 3B42 and IMERG using MRMS as a reference during the periods of the three winters, five summers and 55 months, respectively. Table 1 further demonstrates the obvious performance improvement from 3B42 to IMERG in winter.
4.4. Probability Distribution Analysis
To further investigate the distribution of precipitation intensities, probability distribution functions are constructed as shown in Figure 11 for 3-hourly precipitation occurrences and volumes at 0.25° resolution without RQI filtering over the study domain during the 55-month period. The insets were for the data in the range between 0 and 0.1 mm h−1, representing either no precipitation or drizzle. In this range, 3B42 accounted for 96.1% of total data points but only 0.3% of precipitation volume, whereas the numbers were 93.0% and 3.1% for IMERG, 93.5% and 1.5% for MRMS. This also indicates the improved capability of IMERG in detecting no precipitation or drizzle occurrences compared to 3B42, which could be attributed to the GPM DPR with its higher sensitivity relative to TRMM PR [47,48]. For precipitation under 0.1 mm h−1, IMERG very well reproduced the precipitation occurrences but overestimated the volumes.
The distribution for the precipitation above 0.1 mm h−1 was separately constructed for each product. 3B42 product shows an obvious overestimation in occurrences for the precipitation with the intensity between 1 and 30 mm h−1, and underestimation for precipitation less than 1 mm h−1. IMERG shows an improved agreement with MRMS both in occurrence and volume distributions.
Similar features can be also seen in the joint distributions of 3-hourly precipitation rates at 0.25° resolution for 3B42 vs. MRMS, and IMERG vs. MRMS, respectively, conditional on both precipitation rates at least 0.1 mm h−1 (Figure 12). More importantly, the random error for IMERG was very low compared to 3B42, as seen by the tight scatter in the density plot. The distribution was more concentrated along 1:1 line for IMERG, consistent with NMSE and NMAE results in Figure 10. Figure 12 demonstrates that both higher and lower precipitation rates in IMERG were better represented than in 3B42, though IMERG slightly overestimated the higher precipitation rates and underestimated the lower precipitation rates. The improvement can be mainly attributed to the improved morphing scheme and enhanced sensitivity of sensors used in IMERG.
5. Discussion
From the launch of the TRMM satellite in November 1997 to the currently active GPM mission, satellite-based remotely sensed precipitation measurement has been advanced steadily. Built upon the success of TRMM, GPM was developed to provide not only measurement continuity, but also an improvement on the TRMM instruments, algorithms, and precipitation products. GPM IMERG, as a successor of TRMM 3B42, is a unified satellite algorithm developed to provide multisatellite precipitation products over the globe. All IMERG products were retrospectively processed back to the start of TRMM era (January 1998), and continued for the entire life of the GPM mission, currently expected to last to the mid-2030′s or beyond. The evaluation of a new version of IMERG is particularly important for the algorithm development and application.
It should be noted that the evaluation of GPM IMERG and TRMM 3B42 precipitation products in this study was carried out over the land area only (Figure 1). The results drawn from this land area would be different for oceanic sites because of challenging problem for the PMW retrievals over complex land surfaces. A validation study over the ocean (e.g., Kwajalein Atoll) is underway.
In addition, any ground-based products themselves are certainly not perfect, such as MRMS, especially in winter and over mountainous regions, although they have been often used as references in the satellite-based product validation. The validation results are likely unreliable if questionable products are used as references [49]. Satellite-based products in western CONUS appear to exhibit reduced performance in comparison to the eastern CONUS where RQI is high. This does not necessarily mean that the satellite products are the only problem, as there are also problems in the MRMS product as indicated in Figure 2. It is our conclusion that the MRMS product herein might not be suitable as a GV reference over the mountainous west CONUS regions. On the contrary, one may reasonably argue that the satellite products can be utilized to fill the gaps or even substitute the ground product where the ground observations are sparse, rare, poor, or completely missing, as considering that the satellite products perform well over many areas with adequate radar or gauge coverage.
6. Conclusions
This study evaluated two satellite-based precipitation products TRMM 3B42 V7 and GPM IMERG V06B using MRMS as the reference over CONUS for the 55-month period. GPCC was also used in the comparison with MRMS and satellite products. The spatial distributions of precipitation climatology from four products were analyzed. The error characteristics were further examined for 3B42 and IMERG in winter and summer by an error decomposition approach, which partitioned total bias into hit bias, biases due to missed precipitation, and those due to false precipitation. The continuous and categorical statistical metrics were used to quantitatively evaluate the performance of the two satellite-based products. The main findings are summarized as follows:
- (1)
- All products display a high degree of consistency in spatial distribution patterns though some differences are visually discernable.
- (2)
- The IMERG shows substantial improvements in terms of nearly all statistical metrics, compared to its predecessor 3B42.
- (3)
- For winter, the improvement in IMERG was primarily from significantly reduced missed-precipitation bias, and from largely reduced positive hit bias. For summer, the improvement was mainly from notably reduced missed-precipitation bias and marginally reduced false-precipitation bias but at the expense of worse hit bias.
- (4)
- The precipitation intensity distribution shows a significant improvement of IMERG algorithm in comparison with 3B42, which obviously overestimated heavy precipitation but underestimated light precipitation.
- (5)
- Missed-precipitation bias over mountainous regions, especially over frozen surfaces in winter, is still a challenging problem in satellite-based precipitation retrieval algorithms. The bias correction is of particular importance in mountainous regions such as Serra Nevada Mountains in California and Rocky Mountains in Colorado.
- (6)
- All the statistical metrics and the error decomposition approach work together were effective in evaluation of the performances for the satellite-based precipitation products.
Author Contributions
Conceptualization, J.W., W.A.P. and D.B.W.; methodology, J.W., W.A.P. and D.B.W.; software, J.W.; validation, J.W., W.A.P. and D.B.W.; formal analysis, J.W., W.A.P. and D.B.W.; investigation, J.W., W.A.P. and D.B.W.; resources, W.A.P. and D.B.W.; data curation, J.W.; writing—original draft preparation, J.W.; writing—review and editing, J.W., W.A.P. and D.B.W.; visualization, J.W.; supervision, W.A.P. and D.B.W.; project administration, W.A.P., D.B.W.; funding acquisition, W.A.P. and D.B.W. All authors have read and agreed to the published version of the manuscript.
Funding
This research received no external funding.
Data Availability Statement
TRMM 3B42 data are openly available at https://disc.gsfc.nasa.gov/datasets/TRMM_3B42_Daily_7/summary (accessed on 29 April 2021). GPM IMERG data (V06) can be accessed from https://gpm1.gesdisc.eosdis.nasa.gov/data/GPM_L3/GPM_3IMERGHH.06/MRMS (accessed on 29 April 2021) data are open for the NASA Precipitation Measurement Missions Science Team. Contact [email protected] for data request. GPCC Full Data Monthly Product can be accessed from https://opendata.dwd.de/climate_environment/GPCC/html/download_gate.html (accessed on 29 April 2021) (doi:10.5676/DWD_GPCC/FD_M_V2020_025).
Acknowledgments
This study represents an evolution of work begun during the Tropical Rainfall Measurement Mission era, with continuity into and funding by the NASA component of the NASA/JAXA Global Precipitation Measurement Mission. The authors thank Gail Skofronick-Jackson (NASA Headquarters GPM Program Scientist), Scott Braun (NASA GSFC GPM Project Scientist) for their support of this effort. We also greatly appreciate the efforts of George Huffman and his IMERG development team for routinely generating IMERG products. Thanks Pierre-Emmanuel Kirstetter of University of Oklahoma for processing the MRMS data specially for GPM ground validation. The IMERG and 3B42 data are distributed by the NASA GSFC’s PMM and Precipitation Processing System (PPS) team.
Conflicts of Interest
The authors declare no conflict of interest.
References
- Kidd, C.; Huffman, G.J. Global precipitation measurement. Meteorol. Appl. 2011, 18, 334–353. [Google Scholar] [CrossRef]
- Wang, J.; Wolff, D.B. Evaluation of TRMM Ground-Validation Radar-Rain Errors Using Rain Gauge Measurements. J. Appl. Meteorol. Clim. 2010, 49, 310–324. [Google Scholar] [CrossRef] [Green Version]
- Wang, J.; Wolff, D.B. Evaluation of TRMM Rain Estimates Using Ground Measurements over Central Florida. J. Appl. Meteorol. Clim. 2012, 51, 926–940. [Google Scholar] [CrossRef]
- Tan, J.; Petersen, W.A.; Kirchengast, G.; Goodrich, D.C.; Wolff, D.B. Evaluation of Global Precipitation Measurement Rainfall Estimates against Three Dense Gauge Networks. J. Hydrometeorol. 2018, 19, 517–532. [Google Scholar] [CrossRef]
- Wolff, D.B.; Marks, D.A.; Amitai, E.; Silberstein, D.S.; Fisher, B.L.; Tokay, A.; Wang, J.; Pippitt, J.L. Ground Validation for the Tropical Rainfall Measuring Mission (TRMM). J. Atmos. Ocean. Technol. 2005, 22, 365–380. [Google Scholar] [CrossRef]
- Bringi, V.N.; Chandrasekar, V. Polarimetric Doppler Weather Radar: Principles and Applications; Cambridge University Press: Cambridge, UK, 2001; p. 636. [Google Scholar] [CrossRef]
- Cifelli, R.; Chandrasekar, V.; Lim, S.; Kennedy, P.C.; Wang, Y.; Rutledge, S.A. A New Dual-Polarization Radar Rainfall Algorithm: Application in Colorado Precipitation Events. J. Atmos. Ocean. Technol. 2011, 28, 352–364. [Google Scholar] [CrossRef] [Green Version]
- Kidd, C.; Levizzani, V. Status of satellite precipitation retrievals. Hydrol. Earth Syst. Sci. 2011, 15, 1109–1116. [Google Scholar] [CrossRef] [Green Version]
- Huffman, G.J.; Bolvin, D.T.; Nelkin, E.J.; Wolff, D.B.; Adler, R.F.; Gu, G.; Hong, Y.; Bowman, K.P.; Stocker, E.F. The TRMM Multisatellite Precipitation Analysis (TMPA): Quasi-Global, Multiyear, Combined-Sensor Precipitation Estimates at Fine Scales. J. Hydrometeorol. 2007, 8, 38–55. [Google Scholar] [CrossRef]
- Huffman, G.J. NASA Global Precipitation Measurement (GPM) Integrated Multi-Satellite Retrievals for GPM (IMERG). NASA Algorithm Theoretical Basis Doc., Version 06; p. 39. Available online: https://gpm.nasa.gov/sites/default/files/2020-05/IMERG_ATBD_V06.3.pdf (accessed on 29 April 2021).
- Gebremichael, M.; Hossain, F. Satellite Rainfall Applications for Surface Hydrology; Springer: Dordrecht, The Netherlands, 2010; pp. 1–327. [Google Scholar]
- Petersen, W.A.; Kirstetter, P.E.; Wang, J.; Wolff, D.B.; Tokay, A. The GPM Ground Validation Program. In Satellite Precipitation Measurement, Chapter 26; Levizzani, V., Kidd, C., Kirschbaum, D.B., Kummerow, C., Nakamura, K., Turk, F.J., Eds.; Springer-Nature: Cham, Switzerland, 2020. [Google Scholar]
- Guo, H.; Chen, S.; Bao, A.; Behrangi, A.; Hong, Y.; Ndayisaba, F.; Hu, J.; Stepanian, P.M. Early assessment of Integrated Multi-satellite Retrievals for Global Precipitation Measurement over China. Atmos. Res. 2016, 176, 121–133. [Google Scholar] [CrossRef]
- Su, J.; Lü, H.; Ryu, D.; Zhu, Y. The Assessment and Comparison of TMPA and IMERG Products over the Major Basins of Mainland China. Earth Space Sci. 2019, 6, 2461–2479. [Google Scholar] [CrossRef]
- Tan, J.; Petersen, W.A.; Tokay, A. A Novel Approach to Identify Sources of Errors in IMERG for GPM Ground Validation. J. Hydrometeorol. 2016, 17, 2477–2491. [Google Scholar] [CrossRef]
- Wang, J.; Petersen, W.A.; Wolff, D.B.; Bolvin, D.T.; Kirstetter, P.-E. Validation of satellite precipitation products using NMQ over the CONUS. In Proceedings of the 8th European Conference on Radar in Meteorology and Hydrology, Garmisch-Partenkirchen, Germany, 1–5 September 2014. [Google Scholar]
- Gebregiorgis, A.S.; Kirstetter, P.; Hong, Y.E.; Gourley, J.J.; Huffman, G.J.; Petersen, W.A.; Xue, X.; Schwaller, M.R. To What Extent is the Day 1 GPM IMERG Satellite Precipitation Estimate Improved as Compared to TRMM TMPA-RT? J. Geophys. Res. Atmos. 2018, 123, 1694–1707. [Google Scholar] [CrossRef]
- Tang, G.; Ma, Y.; Long, D.; Zhong, L.; Hong, Y. Evaluation of GPM Day-1 IMERG and TMPA Version-7 legacy products over Mainland China at multiple spatiotemporal scales. J. Hydrol. 2016, 533, 152–167. [Google Scholar] [CrossRef]
- Xu, R.; Tian, F.; Yang, L.; Hu, H.; Lu, H.; Hou, A. Ground validation of GPM IMERG and TRMM 3B42V7 rainfall products over southern Tibetan Plateau based on a high-density rain gauge network. J. Geophys. Res. Atmos. 2017, 122, 910–924. [Google Scholar] [CrossRef]
- Wei, G.; Lü, H.; Crow, W.T.; Zhu, Y.; Wang, J.; Su, J. Evaluation of Satellite-Based Precipitation Products from IMERG V04A and V03D, CMORPH and TMPA with Gauged Rainfall in Three Climatologic Zones in China. Remote Sens. 2017, 10, 30. [Google Scholar] [CrossRef] [Green Version]
- Ma, Q.; Li, Y.; Feng, H.; Yu, Q.; Zou, Y.; Liu, F.; Pulatov, B. Performance evaluation and correction of precipitation data using the 20-year IMERG and TMPA precipitation products in diverse subregions of China. Atmos. Res. 2021, 249, 105304. [Google Scholar] [CrossRef]
- Chen, F.; Li, X. Evaluation of IMERG and TRMM 3B43 Monthly Precipitation Products over Mainland China. Remote Sens. 2016, 8, 472. [Google Scholar] [CrossRef] [Green Version]
- Krishna, U.V.M.; Das, S.K.; Deshpande, S.M.; Doiphode, S.L.; Pandithurai, G. The assessment of Global Precipitation Measurement estimates over the Indian subcontinent. Earth Space Sci. 2017, 4, 540–553. [Google Scholar] [CrossRef]
- Islam, A. Statistical comparison of satellite-retrieved precipitation products with rain gauge observations over Bangladesh. Int. J. Remote Sens. 2018, 39, 2906–2936. [Google Scholar] [CrossRef] [Green Version]
- Moazam, S.; Najafi, M.R. A comprehensive evaluation of GPM-IMERG V06 and MRMS with hourly ground-based precipitation observations across Canada. J. Hydrol. 2020, 549, 125929. [Google Scholar]
- Anjum, M.N.; Ahmad, I.; Ding, Y.; Shangguan, D.; Zaman, M.; Ijaz, M.W.; Sarwar, K.; Han, H.; Yang, M. Assessment of IMERG-V06 Precipitation Product over Different Hydro-Climatic Regimes in the Tianshan Mountains, North-Western China. Remote Sens. 2019, 11, 2314. [Google Scholar] [CrossRef] [Green Version]
- Huffman, G.J. The Transition in Multi-Satellite Products from TRMM to GPM (TMPA to IMERG). Available online: https://gpm.nasa.gov/sites/default/files/2020-10/TMPA-to-IMERG_transition_201002.pdf (accessed on 29 April 2021).
- Bolvin, D.T.; Huffman, G.J. Transition of 3B42/3B43 Research Product from Monthly to Climatological Calibra-Tion/Adjustment. 2015 NASA TRMM Doc.; p. 11. Available online: https://pmm.nasa.gov/sites/default/files/document_files/3B42_3B43_TMPA_restart.pdf (accessed on 29 April 2021).
- Schneider, U.; Becker, A.; Finger, P.; Rustemeier, E.; Ziese, M. GPCC Full Data Monthly Product Version 2020 at 0.25°: Monthly Land-Surface Precipitation from Rain-Gauges Built on GTS-based and Historical Data; Global Precipitation Climatology Centre at Deutscher Wetterdienst: Offenbach, Germany, 2020. [Google Scholar] [CrossRef]
- Joyce, R.J.; Xie, P. Kalman Filter–Based CMORPH. J. Hydrometeorol. 2011, 12, 1547–1563. [Google Scholar] [CrossRef]
- Hong, Y.; Hsu, K.-L.; Sorooshian, S.; Gao, X. Precipitation Estimation from Remotely Sensed Imagery Using an Artificial Neural Network Cloud Classification System. J. Appl. Meteorol. 2004, 43, 1834–1853. [Google Scholar] [CrossRef] [Green Version]
- Tan, J.; Huffman, G.J.; Bolvin, D.T.; Nelkin, E.J. IMERG V06: Changes to the Morphing Algorithm. J. Atmos. Ocean. Technol. 2019, 36, 2471–2482. [Google Scholar] [CrossRef]
- Zhang, J.; Howard, K.W.; Langston, C.; Kaney, B.; Qi, Y.; Tang, L.; Grams, H.M.; Wang, Y.; Cocks, S.; Martinaitis, S.M.; et al. Multi-Radar Multi-Sensor (MRMS) Quantitative Precipitation Estimation: Initial Operating Capabilities. Bull. Am. Meteorol. Soc. 2016, 97, 621–638. [Google Scholar] [CrossRef]
- Kirstetter, P.-E.; Hong, Y.; Gourley, J.J.; Chen, S.; Flamig, Z.; Zhang, J.; Schwaller, M.; Petersen, W.; Amitai, E. Toward a Framework for Systematic Error Modeling of Spaceborne Precipitation Radar with NOAA/NSSL Ground Radar–Based National Mosaic QPE. J. Hydrometeorol. 2012, 13, 1285–1300. [Google Scholar] [CrossRef]
- Zhang, J.; Qi, Y.; Langston, C.; Kaney, B. Radar quality index (RQI)—A combined measure for beam blockage and VPR effects in a national network. In Proceedings of the International Symposium on Weather Radar and Hydrology, Exeter, UK, 18–21 April 2011; IAHS Publ.: Paris, France, 2011; Volume 351, pp. 388–393. [Google Scholar]
- Wilks, D.S. Statistical Methods in the Atmospheric Sciences, 3rd ed.; International Geophysics Series; Academic Press: Waltham, MA, USA, 2011; Volume 100, p. 704. [Google Scholar]
- Tian, Y.; Peters-Lidard, C.D.; Eylander, J.B.; Joyce, R.J.; Huffman, G.J.; Adler, R.F.; Hsu, K.-L.; Turk, F.J.; Garcia, M.; Zeng, J. Component analysis of errors in satellite-based precipitation estimates. J. Geophys. Res. Space Phys. 2009, 114, 1–15. [Google Scholar] [CrossRef] [Green Version]
- Habib, E.; Larson, B.F.; Graschel, J. Validation of NEXRAD multisensor precipitation estimates using an experimental dense rain gauge network in south Louisiana. J. Hydrol. 2009, 373, 463–478. [Google Scholar] [CrossRef]
- Kirstetter, P.-E.; Gourley, J.J.; Hong, Y.; Zhang, J.; Moazamigoodarzi, S.; Langston, C.; Arthur, A. Probabilistic precipitation rate estimates with ground-based radar networks. Water Resour. Res. 2015, 51, 1422–1442. [Google Scholar] [CrossRef]
- Tang, L.; Tian, Y.; Yan, F.; Habib, E. An improved procedure for the validation of satellite-based precipitation estimates. Atmos. Res. 2015, 163, 61–73. [Google Scholar] [CrossRef]
- Shige, S.; Kida, S.; Ashiwake, H.; Kubota, T.; Aonashi, K. Improvement of TMI Rain Retrievals in Mountainous Areas. J. Appl. Meteorol. Clim. 2013, 52, 242–254. [Google Scholar] [CrossRef] [Green Version]
- Kummerow, C.; Brown, P. GPROF: Progress towards an improved orographic precipitation product. In Proceedings of the PMM Science Team Meeting 2020, Virtual (Microsoft Teams), 19–23 October 2020. [Google Scholar]
- Ringerud, S.; Peters-Lidard, C.; Munchak, J.; You, Y. Applications of Dynamic Land Surface Information for Passive Microwave Precipitation Retrieval. J. Atmos. Ocean. Technol. 2021, 38, 167–180. [Google Scholar] [CrossRef]
- Cui, W.; Dong, X.; Xi, B.; Feng, Z.; Fan, J. Can the GPM IMERG Final Product Accurately Represent MCSs’ Precipitation Characteristics over the Central and Eastern United States? J. Hydrometeorol. 2020, 21, 39–57. [Google Scholar] [CrossRef]
- Gupta, H.V.; Kling, H.; Yilmaz, K.K.; Martinez, G.F. Decomposition of the mean squared error and NSE performance criteria: Implications for improving hydrological modelling. J. Hydrol. 2009, 377, 80–91. [Google Scholar] [CrossRef] [Green Version]
- Kling, H.; Fuchs, M.; Paulin, M. Runoff conditions in the upper Danube basin under an ensemble of climate change scenarios. J. Hydrol. 2012, 424, 264–277. [Google Scholar] [CrossRef]
- Hou, A.Y.; Kakar, R.K.; Neeck, S.; Azarbarzin, A.A.; Kummerow, C.D.; Kojima, M.; Oki, R.; Nakamura, K.; Iguchi, T. The global precipitation measurement mission. Bull. Am. Meteorol. Soc. 2014, 95, 701–722. [Google Scholar] [CrossRef]
- Skofronick-Jackson, G.; Kirschbaum, D.; Petersen, W.; Huffman, G.; Kidd, C.; Stocker, E.; Kakar, R. The Global Precipitation Measurement (GPM) mission’s scientific achievements and societal contributions: Reviewing four years of advanced rain and snow observations. Q. J. R. Meteorol. Soc. 2018, 144, 27–48. [Google Scholar] [CrossRef] [Green Version]
- Chen, H.; Yong, B.; Qi, W.; Wu, H.; Ren, L.; Hong, Y. Investigating the Evaluation Uncertainty for Satellite Precipitation Estimates Based on Two Different Ground Precipitation Observation Products. J. Hydrometeorol. 2020, 21, 2595–2606. [Google Scholar] [CrossRef]
Figure 1.
(a) Study domain with the land/ocean mask. (b) Major Köppen–Geiger climate zones in CONUS (figure from https://www.weather.gov/jetstream/climates (accessed on 29 April 2021)).
Figure 1.
(a) Study domain with the land/ocean mask. (b) Major Köppen–Geiger climate zones in CONUS (figure from https://www.weather.gov/jetstream/climates (accessed on 29 April 2021)).

Figure 2.
Maps of mean RQIs from three winters (DJF) and five summers (JJA) during the 55-month period (June 2014 to December 2015, June 2016 to July 2017, and March 2018 to December 2019).
Figure 2.
Maps of mean RQIs from three winters (DJF) and five summers (JJA) during the 55-month period (June 2014 to December 2015, June 2016 to July 2017, and March 2018 to December 2019).

Figure 3.
Time series of monthly precipitation spatially averaged over the study domain for GPCC, MRMS, 3B42, and IMERG, respectively, from June 2014 to December 2019.
Figure 3.
Time series of monthly precipitation spatially averaged over the study domain for GPCC, MRMS, 3B42, and IMERG, respectively, from June 2014 to December 2019.

Figure 4.
Time series of monthly precipitation (a) ratios and (b) correlations for IMERG and 3B42 relative to MRMS, respectively calculated from 3-hourly precipitation at 0.25° resolution. Only pixels associated with MRMS RQI value of 100 and precipitation at least 0.1 mm h−1 for both IMERG (3B42) and MRMS are used.

Figure 5.
(a–h) Boxplots of ratios and correlations for 3B42 relative MRMS with respect to different RQI and precipitation thresholds. The RQI thresholds are 0, 25, 50, 75, and 100 listed at the bottom of each panel. The precipitation thresholds are 0.0 mm h−1 (a,e), 0.1 mm h−1 (b,f), 0.2 mm h−1 (c,g), and 0.5 mm h−1 (d,h). The black box is the interquartile range extending from the lower quartile (25th) to the upper quartile (75th). The white bar inside the black box is the median, and the blue asterisk is the mean. The vertical line represents whiskers extending from the minimum to maximum. The upper whisker is truncated and listed at the upper border of each boxplot if the maximum is out of the plot area.

Figure 6.
Same as Figure 5 but for IMERG.
Figure 6.
Same as Figure 5 but for IMERG.

Figure 7.
Mean monthly precipitation maps from GPCC, MRMS, 3B42, and IMERG over the period of 55 months, three winters and five summers, respectively. The precipitation unit is mm h−1.
Figure 7.
Mean monthly precipitation maps from GPCC, MRMS, 3B42, and IMERG over the period of 55 months, three winters and five summers, respectively. The precipitation unit is mm h−1.

Figure 8.
(a–d) The spatial distributions of error components for 3B42 and IMERG as percentages of total MRMS precipitation: total (E), hit (H), missed-precipitation (M), and false-precipitation (F) biases for three winters and five summers with RQI ≥ 0 and RQI = 100. The components are related by E = H − M + F.

Figure 9.
Averaged error components for IMERG and 3B42 relative to MRMS at 3-h and 0.25° resolution for (a) winter and (b) summer with RQI thresholds from 0 to 100.
Figure 9.
Averaged error components for IMERG and 3B42 relative to MRMS at 3-h and 0.25° resolution for (a) winter and (b) summer with RQI thresholds from 0 to 100.

Figure 10.
(a–d) Statistical metrics for IMERG and 3B42 performances relative to MRMS for (a,b) winter and (c,d) summer with (a,c) RQI ≥ 0 and (b,d) RQI = 100. Top panels: Pearson correlation coefficient (correlation), relative bias (bias), normalized mean absolute error (NMAE), and normalized root mean square error (NRMSE). Bottom: contingency table with hit (green), miss (aqua), false alarm (blue), and correct negative (black). Probability of detection (POD), False alarm ratio (FAR) and Heike skill score (HSS) are also displayed.

Figure 11.
Probability distributions of 3-hourly precipitation (a) occurrences and (b) volumes for MRMS, 3B42, and IMERG at 0.25° resolution without RQI filtering over the study domain. The insets are percentages of occurrences and volumes for precipitation less than 0.1 mm h−1, including zeros.
Figure 11.
Probability distributions of 3-hourly precipitation (a) occurrences and (b) volumes for MRMS, 3B42, and IMERG at 0.25° resolution without RQI filtering over the study domain. The insets are percentages of occurrences and volumes for precipitation less than 0.1 mm h−1, including zeros.

Figure 12.
Joint distributions of 3-hourly precipitation rates at 0.25° resolution for (a) 3B42 and (b) IMERG against MRMS, conditional on both precipitation rates at least 0.1 mm h−1.
Figure 12.
Joint distributions of 3-hourly precipitation rates at 0.25° resolution for (a) 3B42 and (b) IMERG against MRMS, conditional on both precipitation rates at least 0.1 mm h−1.


Table 1.
KGE calculated from 3-hourly precipitation rates at 0.25° resolution for 3B42 and IMERG using MRMS as a reference during three-winter, five-summer, and all 55-month periods, respectively.
Table 1.
KGE calculated from 3-hourly precipitation rates at 0.25° resolution for 3B42 and IMERG using MRMS as a reference during three-winter, five-summer, and all 55-month periods, respectively.
| Winter | Summer | 55 Months | ||||
|---|---|---|---|---|---|---|
| 3B42 | IMERG | 3B42 | IMERG | 3B42 | IMERG | |
| RQI ≥ 0 | −0.193 | 0.372 | 0.359 | 0.362 | 0.286 | 0.465 |
| RQI = 100 | 0.026 | 0.466 | 0.338 | 0.335 | 0.330 | 0.449 |
Publisher’s Note: MDPI stays neutral with regard to jurisdictional claims in published maps and institutional affiliations. |
© 2021 by the authors. Licensee MDPI, Basel, Switzerland. This article is an open access article distributed under the terms and conditions of the Creative Commons Attribution (CC BY) license (https://creativecommons.org/licenses/by/4.0/).
Share and Cite
MDPI and ACS Style
Wang, J.; Petersen, W.A.; Wolff, D.B. Validation of Satellite-Based Precipitation Products from TRMM to GPM. Remote Sens. 2021, 13, 1745. https://0-doi-org.brum.beds.ac.uk/10.3390/rs13091745
AMA Style
Wang J, Petersen WA, Wolff DB. Validation of Satellite-Based Precipitation Products from TRMM to GPM. Remote Sensing. 2021; 13(9):1745. https://0-doi-org.brum.beds.ac.uk/10.3390/rs13091745
Chicago/Turabian StyleWang, Jianxin, Walter A. Petersen, and David B. Wolff. 2021. "Validation of Satellite-Based Precipitation Products from TRMM to GPM" Remote Sensing 13, no. 9: 1745. https://0-doi-org.brum.beds.ac.uk/10.3390/rs13091745
Note that from the first issue of 2016, this journal uses article numbers instead of page numbers. See further details here.