Article

Long-Term Landsat-Based Monthly Burned Area Dataset for the Brazilian Biomes Using Deep Learning

by
Ane A. C. Alencar
1,*,
Vera L. S. Arruda
1,
Wallace Vieira da Silva
1,
Dhemerson E. Conciani
1,
Diego Pereira Costa
2,
Natalia Crusco
3,
Soltan Galano Duverger
2,
Nilson Clementino Ferreira
4,
Washington Franca-Rocha
2,
Heinrich Hasenack
5,
Luiz Felipe Morais Martenexen
1,
Valderli J. Piontekowski
1,
Noely Vicente Ribeiro
4,
Eduardo Reis Rosa
3,
Marcos Reis Rosa
2,3,
Sarah Moura B. dos Santos
2,
Julia Z. Shimbo
1 and
Eduardo Vélez-Martin
6
1
Instituto de Pesquisa Ambiental da Amazônia (IPAM), SCN 211, Bloco B, Sala 201, Brasília 70836-520, Brazil
2
Programa de Pós-Graduação em Modelagem em Ciência da Terra e do Ambiente (PPGM), Universidade Estadual de Feira de Santana, Feira de Santana 44036-900, Brazil
3
ArcPlan Sigga, São Paulo 04140-060, Brazil
4
Laboratório de Processamento de Imagens e Geoprocessamento (LAPIG), Instituto de Estudos Socioambientais, Universidade Federal de Goiás (UFG), Av. Esperança, s/n—Chácaras de Recreio Samambaia, Goiânia 74690-900, Brazil
5
Centro de Ecologia, Instituto de Biociências, Universidade Federal do Rio Grande do Sul, Porto Alegre 91501-970, Brazil
6
GeoKarten Consultoria em Tecnologia da Informação, Roca Sales 95735-000, Brazil
*
Author to whom correspondence should be addressed.
Remote Sens. 2022, 14(11), 2510; https://0-doi-org.brum.beds.ac.uk/10.3390/rs14112510
Submission received: 5 April 2022 / Revised: 11 May 2022 / Accepted: 16 May 2022 / Published: 24 May 2022
(This article belongs to the Special Issue State-of-the-Art Remote Sensing in South America)

Abstract

:
Fire is a significant agent of landscape transformation on Earth, and a dynamic and ephemeral process that is challenging to map. Difficulties include the seasonality of native vegetation in areas affected by fire, the high levels of spectral heterogeneity due to the spatial and temporal variability of the burned areas, distinct persistence of the fire signal, increase in cloud and smoke cover surrounding burned areas, and difficulty in detecting understory fire signals. To produce a large-scale time-series of burned area, a robust number of observations and a more efficient sampling strategy is needed. In order to overcome these challenges, we used a novel strategy based on a machine-learning algorithm to map monthly burned areas from 1985 to 2020 using Landsat-based annual quality mosaics retrieved from minimum NBR values. The annual mosaics integrated year-round observations of burned and unburned spectral data (i.e., RED, NIR, SWIR-1, and SWIR-2), and used them to train a Deep Neural Network model, which resulted in annual maps of areas burned by land use type for all six Brazilian biomes. The annual dataset was used to retrieve the frequency of the burned area, while the date on which the minimum NBR was captured in a year, was used to reconstruct 36 years of monthly burned area. Results of this effort indicated that 19.6% (1.6 million km2) of the Brazilian territory was burned from 1985 to 2020, with 61% of this area burned at least once. Most of the burning (83%) occurred between July and October. The Amazon and Cerrado, together, accounted for 85% of the area burned at least once in Brazil. Native vegetation was the land cover most affected by fire, representing 65% of the burned area, while the remaining 35% burned in areas dominated by anthropogenic land uses, mainly pasture. This novel dataset is crucial for understanding the spatial and long-term temporal dynamics of fire regimes that are fundamental for designing appropriate public policies for reducing and controlling fires in Brazil.

Graphical Abstract

1. Introduction

Human and natural fires are important agents for landscape transformation worldwide [1]. Depending on the level of human interference in natural fire regimes, fire can be very harmful and have severe implications for the resilience of such ecosystems [2,3,4]. Brazilian natural fire regimes are diverse. The six Brazilian biomes present distinct forms of dependency and sensitivity to fire [5]. The grasslands and open savannas that dominate the majority of Cerrado, Pantanal, and Pampa biomes are fire-dependent, where levels of ecological dependence and adaptation of native vegetation to fire help shape these biomes landscapes [6,7,8]. Conversely, forests in the Amazon and Atlantic Forest biomes are sensitive to fire, as these forests hold high levels of humidity natural forest fires are rare, and most species do not evolve with fire in these biomes [9,10]. Lastly, the semi-arid Caatinga biome is considered fire-independent due to its natural insufficient fuel to carry fire as an ecological driver of ecosystem evolution [11].
The effects of changing Brazilian fire regimes, including dependency or sensitivity to more or less frequent fire events, are numerous. Enhanced fire occurrence in forest areas of the Amazon can increase their susceptibility to future fires [12], while if fires are extinguished from grasslands and savannas in the Cerrado, it can represent higher risks for future mega wildfires [13] or changes in vegetation structure [14]. These scenarios of disturbed fire regimes impact biodiversity [15,16], harm human health with the increase in smoke-induced respiratory diseases [17,18], cause economic losses [19], and boost greenhouse gas emissions that affect climate change [20,21,22,23,24].
Although fire has long been an intrinsic component of Brazilian biomes, affecting political, economic, social, and even cultural forms of human and nature interactions, its long-term historical dynamics are still poorly understood. Due to the ephemeral and diverse characteristics of Brazilian fires, it has been difficult to address their real extent, as well as identify their historical paths and trends [25]. Remote sensing observations have provided important products, but several challenges remain for capturing the long-term multidecadal history of burned areas on a large scale and over such diverse ecosystems. These challenges encompass the high levels of spectral heterogeneity of the burned areas in response to seasonality and land use change [26]. The natural seasonality of native vegetation confounds the signals of unburned and burned areas, increasing their spectral similarity, and land cover and land use conversions sometimes also present signatures similar to those of burned areas (e.g., burned pasture fields with humid natural grasslands) [27].
Fire mapping also poses difficulties regarding the distinct persistence of the fire signal. Depending on the size of the area affected by fire, and the land use type burned, the fire scars left by the consumption of the fuel material and captured by the satellite imagery disappears fairly quickly [28]. In land cover and land use types dominated by grasslands (i.e., natural and planted), the fire signal is easy to detect, but can disappear in a few weeks [29]. Conversely, understory fires slowly burning fuel material on the forest floor, remain visible for longer periods but are also difficult to identify depending on the spatial and temporal resolution of the remote sensing product [30,31]. Additionally, mapping burned areas requires both a high temporal and spatial resolution imagery, so as to reduce the impact of smoke, cloud, and shadow cover on the probability of observing the burned scars before they disappear.
There are few global products that map large-scale burned areas at higher temporal resolution (e.g., twice a day), such as the Modis based product MCD64A1 Collection 6, at 500 m pixel resolution [32], and ESA FIRECCI51 with 250 m resolution [33]. However, they miss small-scale fires and understory fires, such as those in forests [34]. More recently, with the advances of cloud storage and computing, other initiatives to map large-scale burned areas at country level have begun to appear, such as GABAM product which mapped global burned area at 30 m resolution but only for the years of 2000, 2005, 2010, 2015, and 2018 [35]. These datasets also only go back two decades, and neither of them considered the long-term history of fire scars. There are few burned area products at higher temporal and spatial resolutions at country scale, but for other countries than Brazil [36,37]. These long-term annual time series are vital for identifying the main impacts of human-induced changes in fire regimes and address their synergies with climate change.
To produce a large-scale time-series of burned area, a robust number of observations, a more efficient sampling strategy and a robust processing power are needed. To overcome these challenges, we used a novel strategy based on a deep-learning algorithm to map monthly burned areas from 1985 to 2020 using Landsat-based annual minimum NBR (Normalized Burn Ratio) quality mosaics. This strategy was possible with the use of Google Earth Engine platform (GEE; https://earthengine.google.com, accessed on 4 April 2022), which is a free cloud based computational platform handling a vast catalog of satellite imagery using Google’s cloud and JavaScript-based language to access and process large global geospatial datasets [38]. GEE is a multi-disciplinary widely used tool for geospatial analyses, habit mapping, land use and land cover mapping [39,40], including for fire detection [41], generating new datasets from a combination of remote sensing data, including the imagery quality mosaics.
The annual minimum NBR quality mosaic, created from the GEE image collection function, was a product of a composition method that selected the lowest NBR value pixels in a year to compose a new annual mosaic (i.e., quality mosaic) based on the spectral information of the selected pixel and highlighting all the observed burned areas in one year. By using this strategy, we gained efficiency in identifying the burned areas and training the classification algorithm, reducing the sampling efforts of burned and unburned areas, at the same time safeguarding more frequent observation using all available pixel observations in the time-series. The result of this effort became MapBiomas Fire Collection 1, a publicly available dataset of burned areas for Brazil (1985–2020) (https://mapbiomas.org/, accessed on 27 August 2021). MapBiomas Fire is part of the MapBiomas initiative, which is a network of country based Academic, technology startups and private research institutions that use GEE to produce land use and land cover datasets at 30 m resolution and with local expertise for Countries in South America and Indonesia. The burned area maps from MapBiomas Fire are available in distinct temporal domains (annual, monthly, and accumulated periods) in addition to fire frequency, and are combined with annual land use and cover maps to indicate the areas most affected by fire over the last 36 years.

2. Materials and Methods
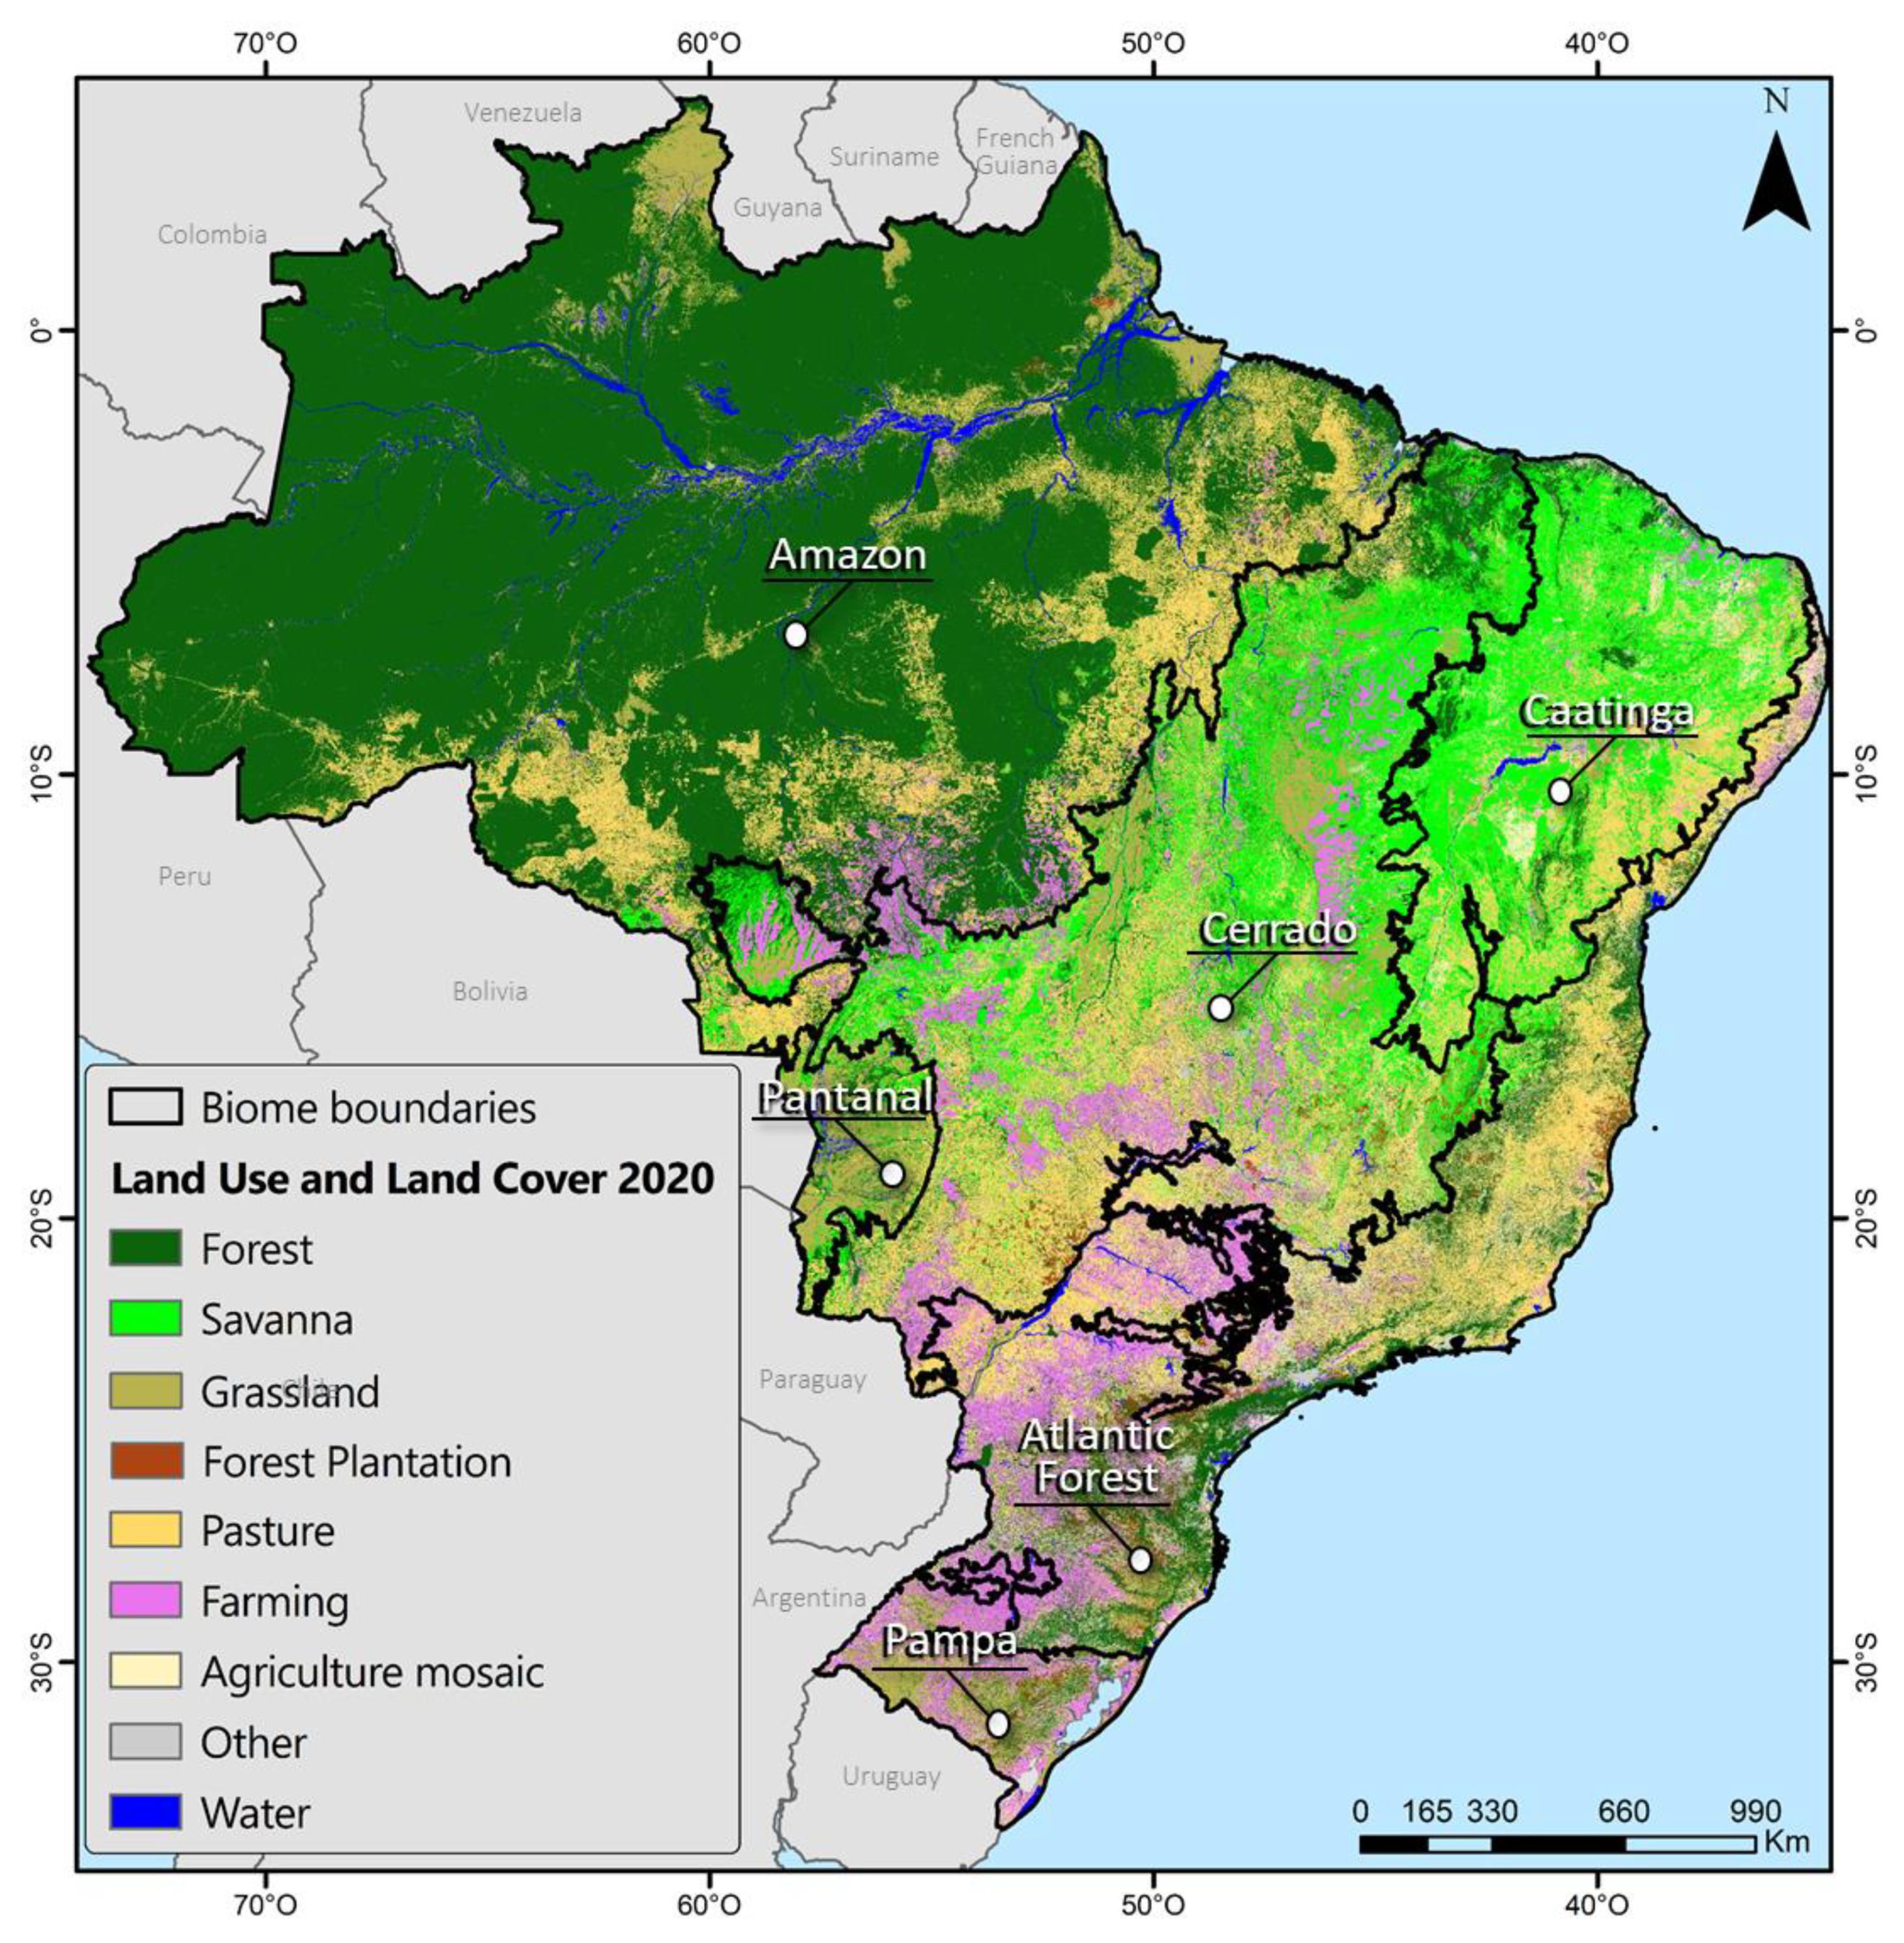
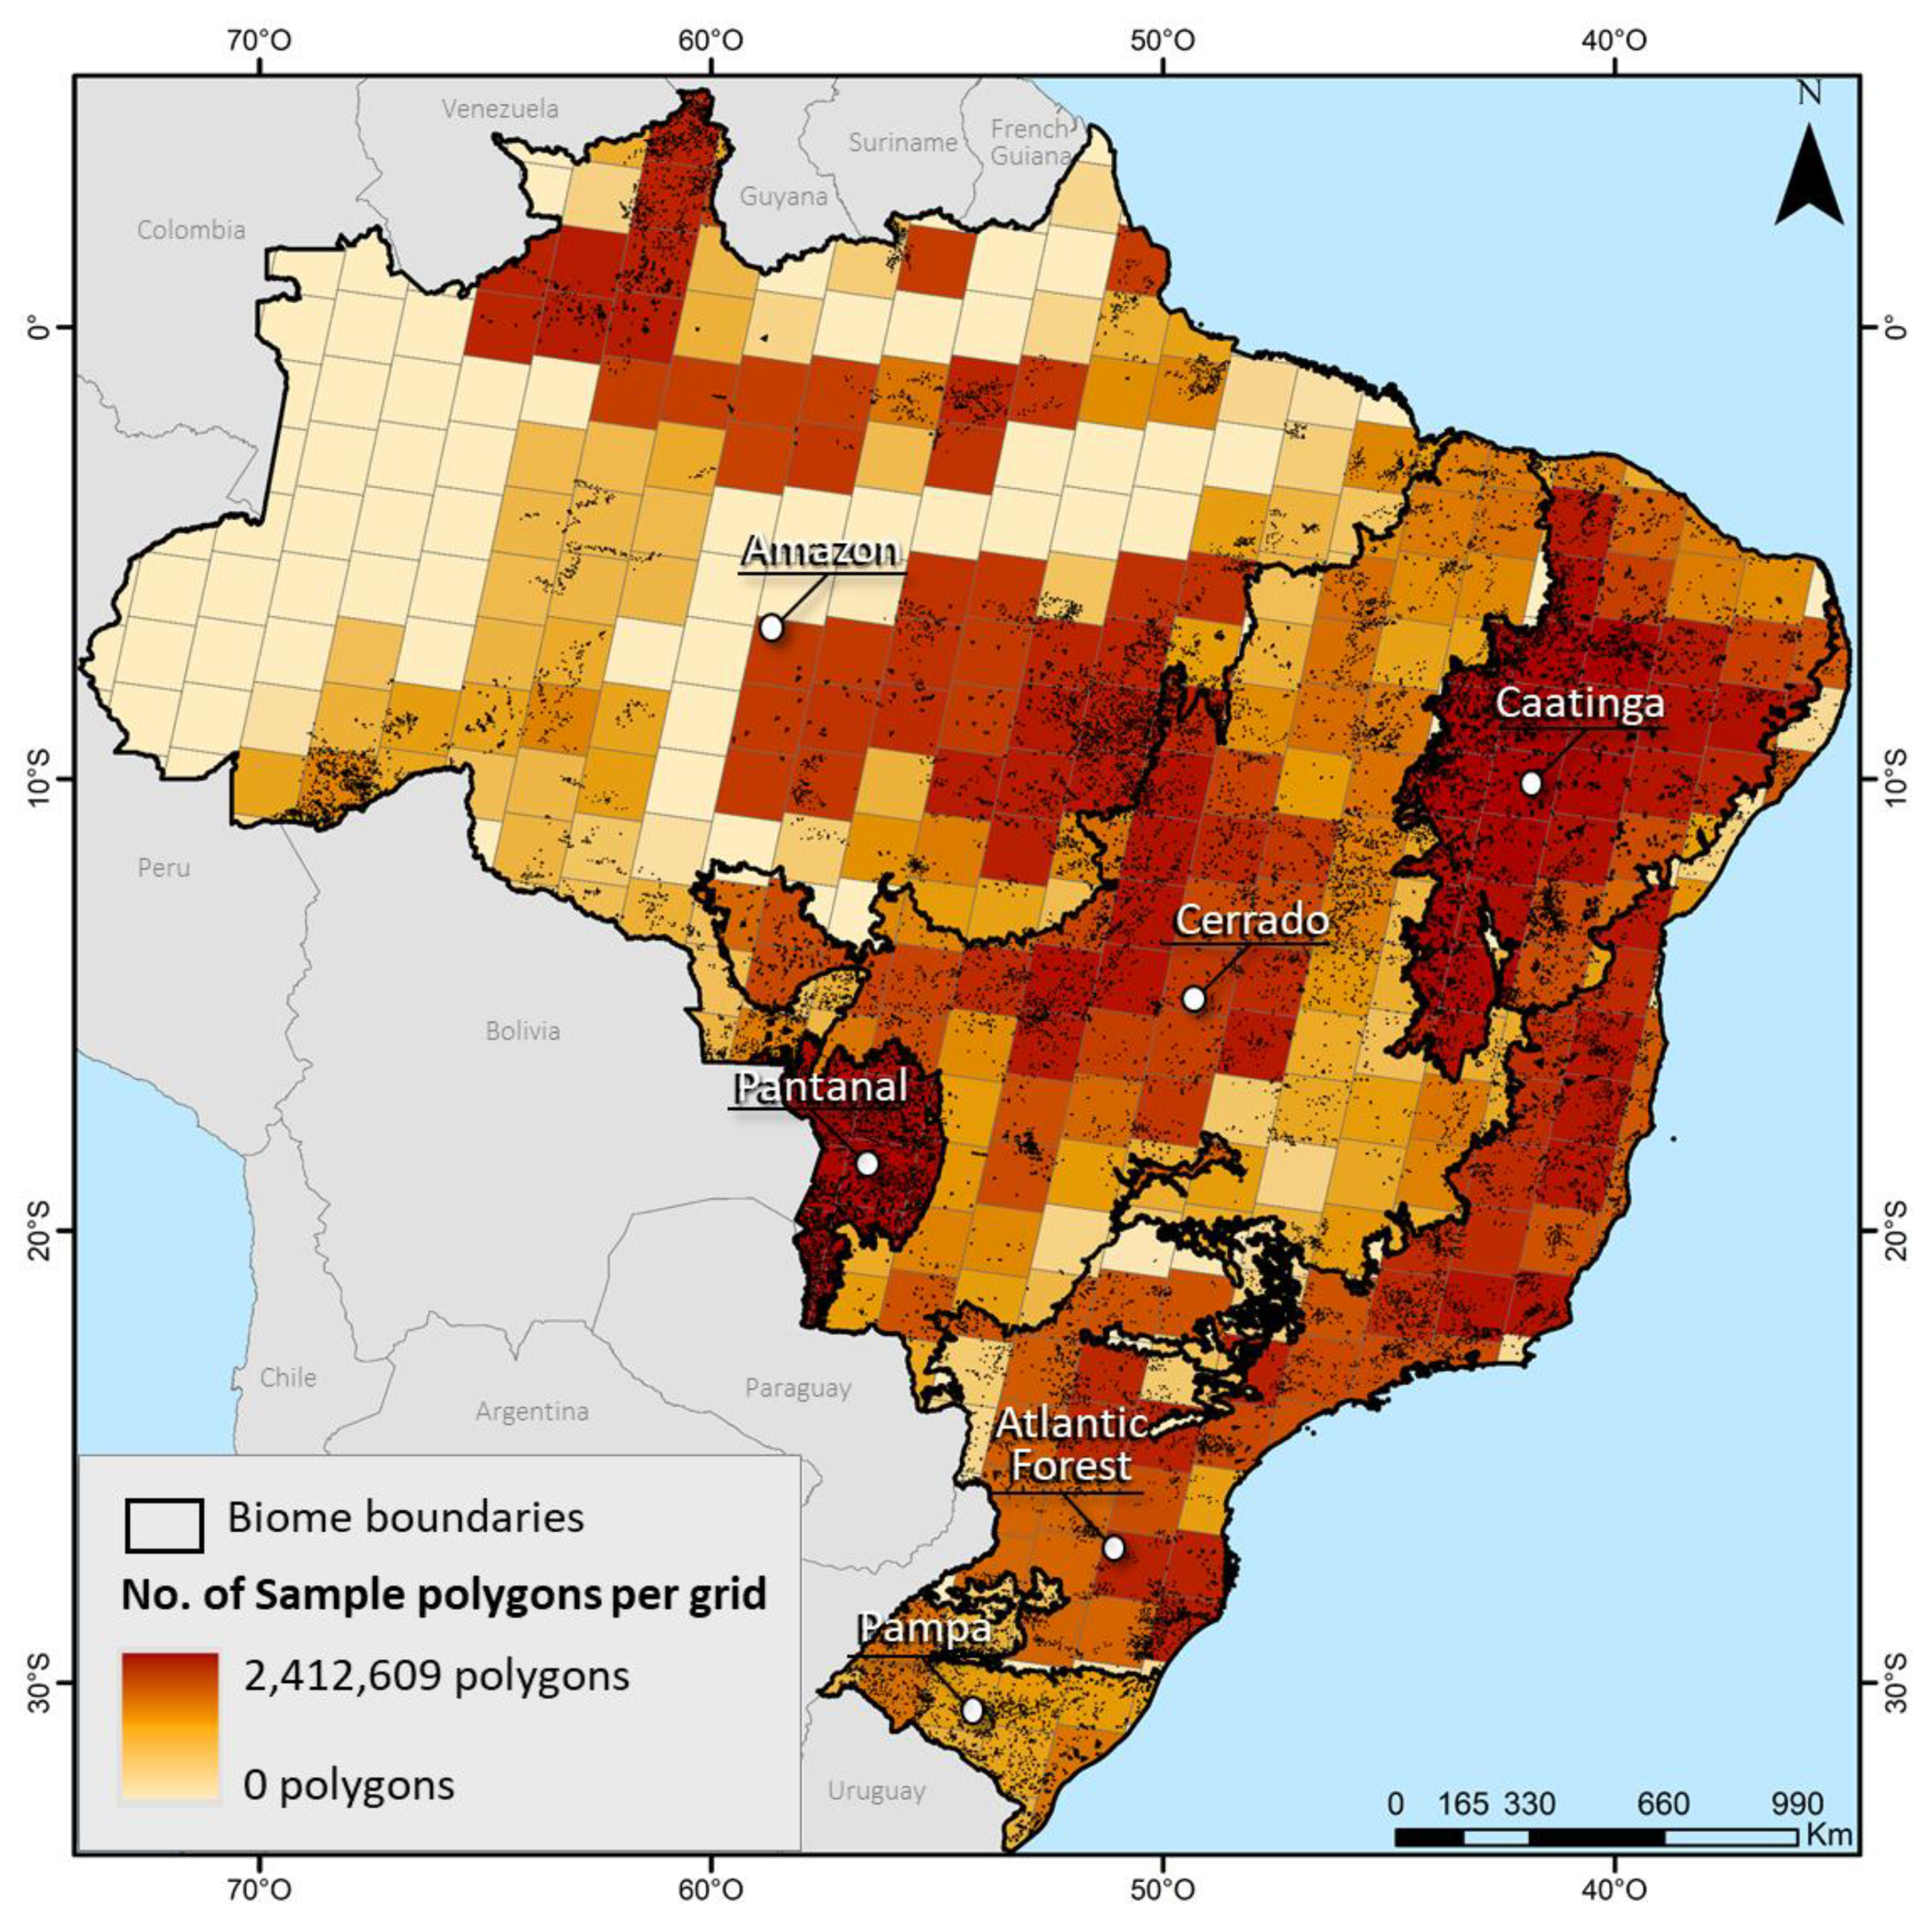
2.1. Study Area

Brazil is the largest country in South America, with a vast and megadiverse territory, ecologically divided into six biomes: Amazon, Cerrado, Caatinga, Pampa, Pantanal, and Atlantic Forest [42] (Figure 1). These biomes have distinct characteristics in terms of vegetation types, biodiversity, soil, climate conditions, and land use practices [43]. These characteristics result in distinct relationships between nature and human fire regimes affecting the Brazilian biomes [5]. The Cerrado, Pantanal, and Pampa biomes, are considered fire-dependent ecosystems because of their dominance by grasslands and savannas, and their plants and animals adapted to fire [5,44]. The opposite happens in the biomes with dominance of tropical forests, such as the Amazon and Atlantic Forest, where natural fire regimes have intervals of hundreds of years in response to their humid microclimatic conditions [45]. Fire in these forests can cause severe negative effects on their non-fire-adapted biodiversity [46,47], leading them to require longer intervals for recovery, and thus being considered fire-sensitive [3]. Following the same classification, the Caatinga biome is considered fire-independent, since natural fires in this region are rare [5,11] due to the low incidence of lightning events [48], and to the predominant vegetation type in the biome (xerophilic), which does not provide continuous and easily flammable fuel [49].
The natural fire regimes of the Brazilian biome’s interact with land use and land cover change practices, where fire is a central element due to its broad use as an agriculture and land management tool [51,52]. The main types of agriculture related to fires in Brazil include: those that are used to burn the felled trees of recently clear-cut forests or woodland-dominated vegetation (i.e., deforestation), converting them to ashes and soil nutrients; and the ones that are used to manage and invigorate pastures by clearing unwanted weeds [53,54,55]. These two types of fires are considered planned or intentional, and they are the major causes of uncontrolled and unplanned fires, such as wildfires [5]. These unexpected fires together with natural fires (i.e., caused by lightning) amplified by extreme climatic conditions, can cause damage to private properties and natural resources, and can develop into a mega wildfire that affects large extensions of land [17,21,56,57]. Distinct from the previously described fires are the prescribed fires, which are part of the integrated fire management strategies [4,13]. These fires are used to reduce the chances of mega fires in the biomes and vegetation types that are adapted to fire [58]. The integrated fire management (IFM) involves planning and managing prescribed fires to minimize fire damage and maximize benefits to the natural environment and local communities. In this study, we do not provide differences related to the use of fire (i.e., management or accidental); we only provide the area burned by land use and cover change.

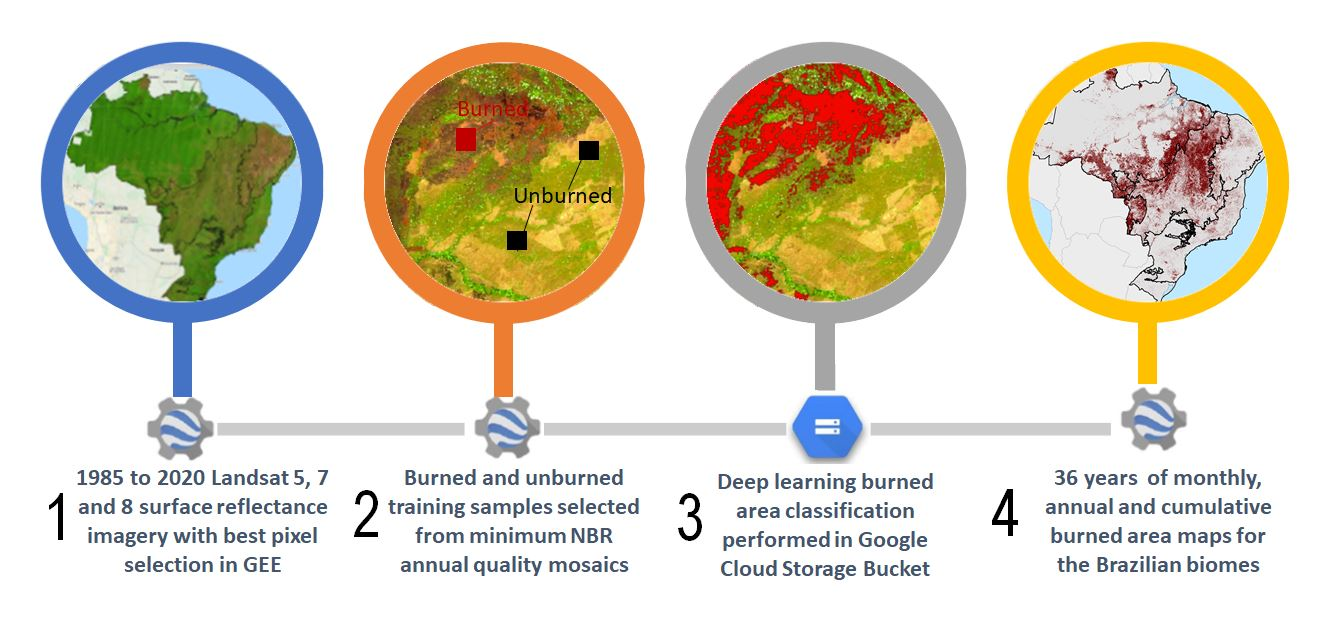
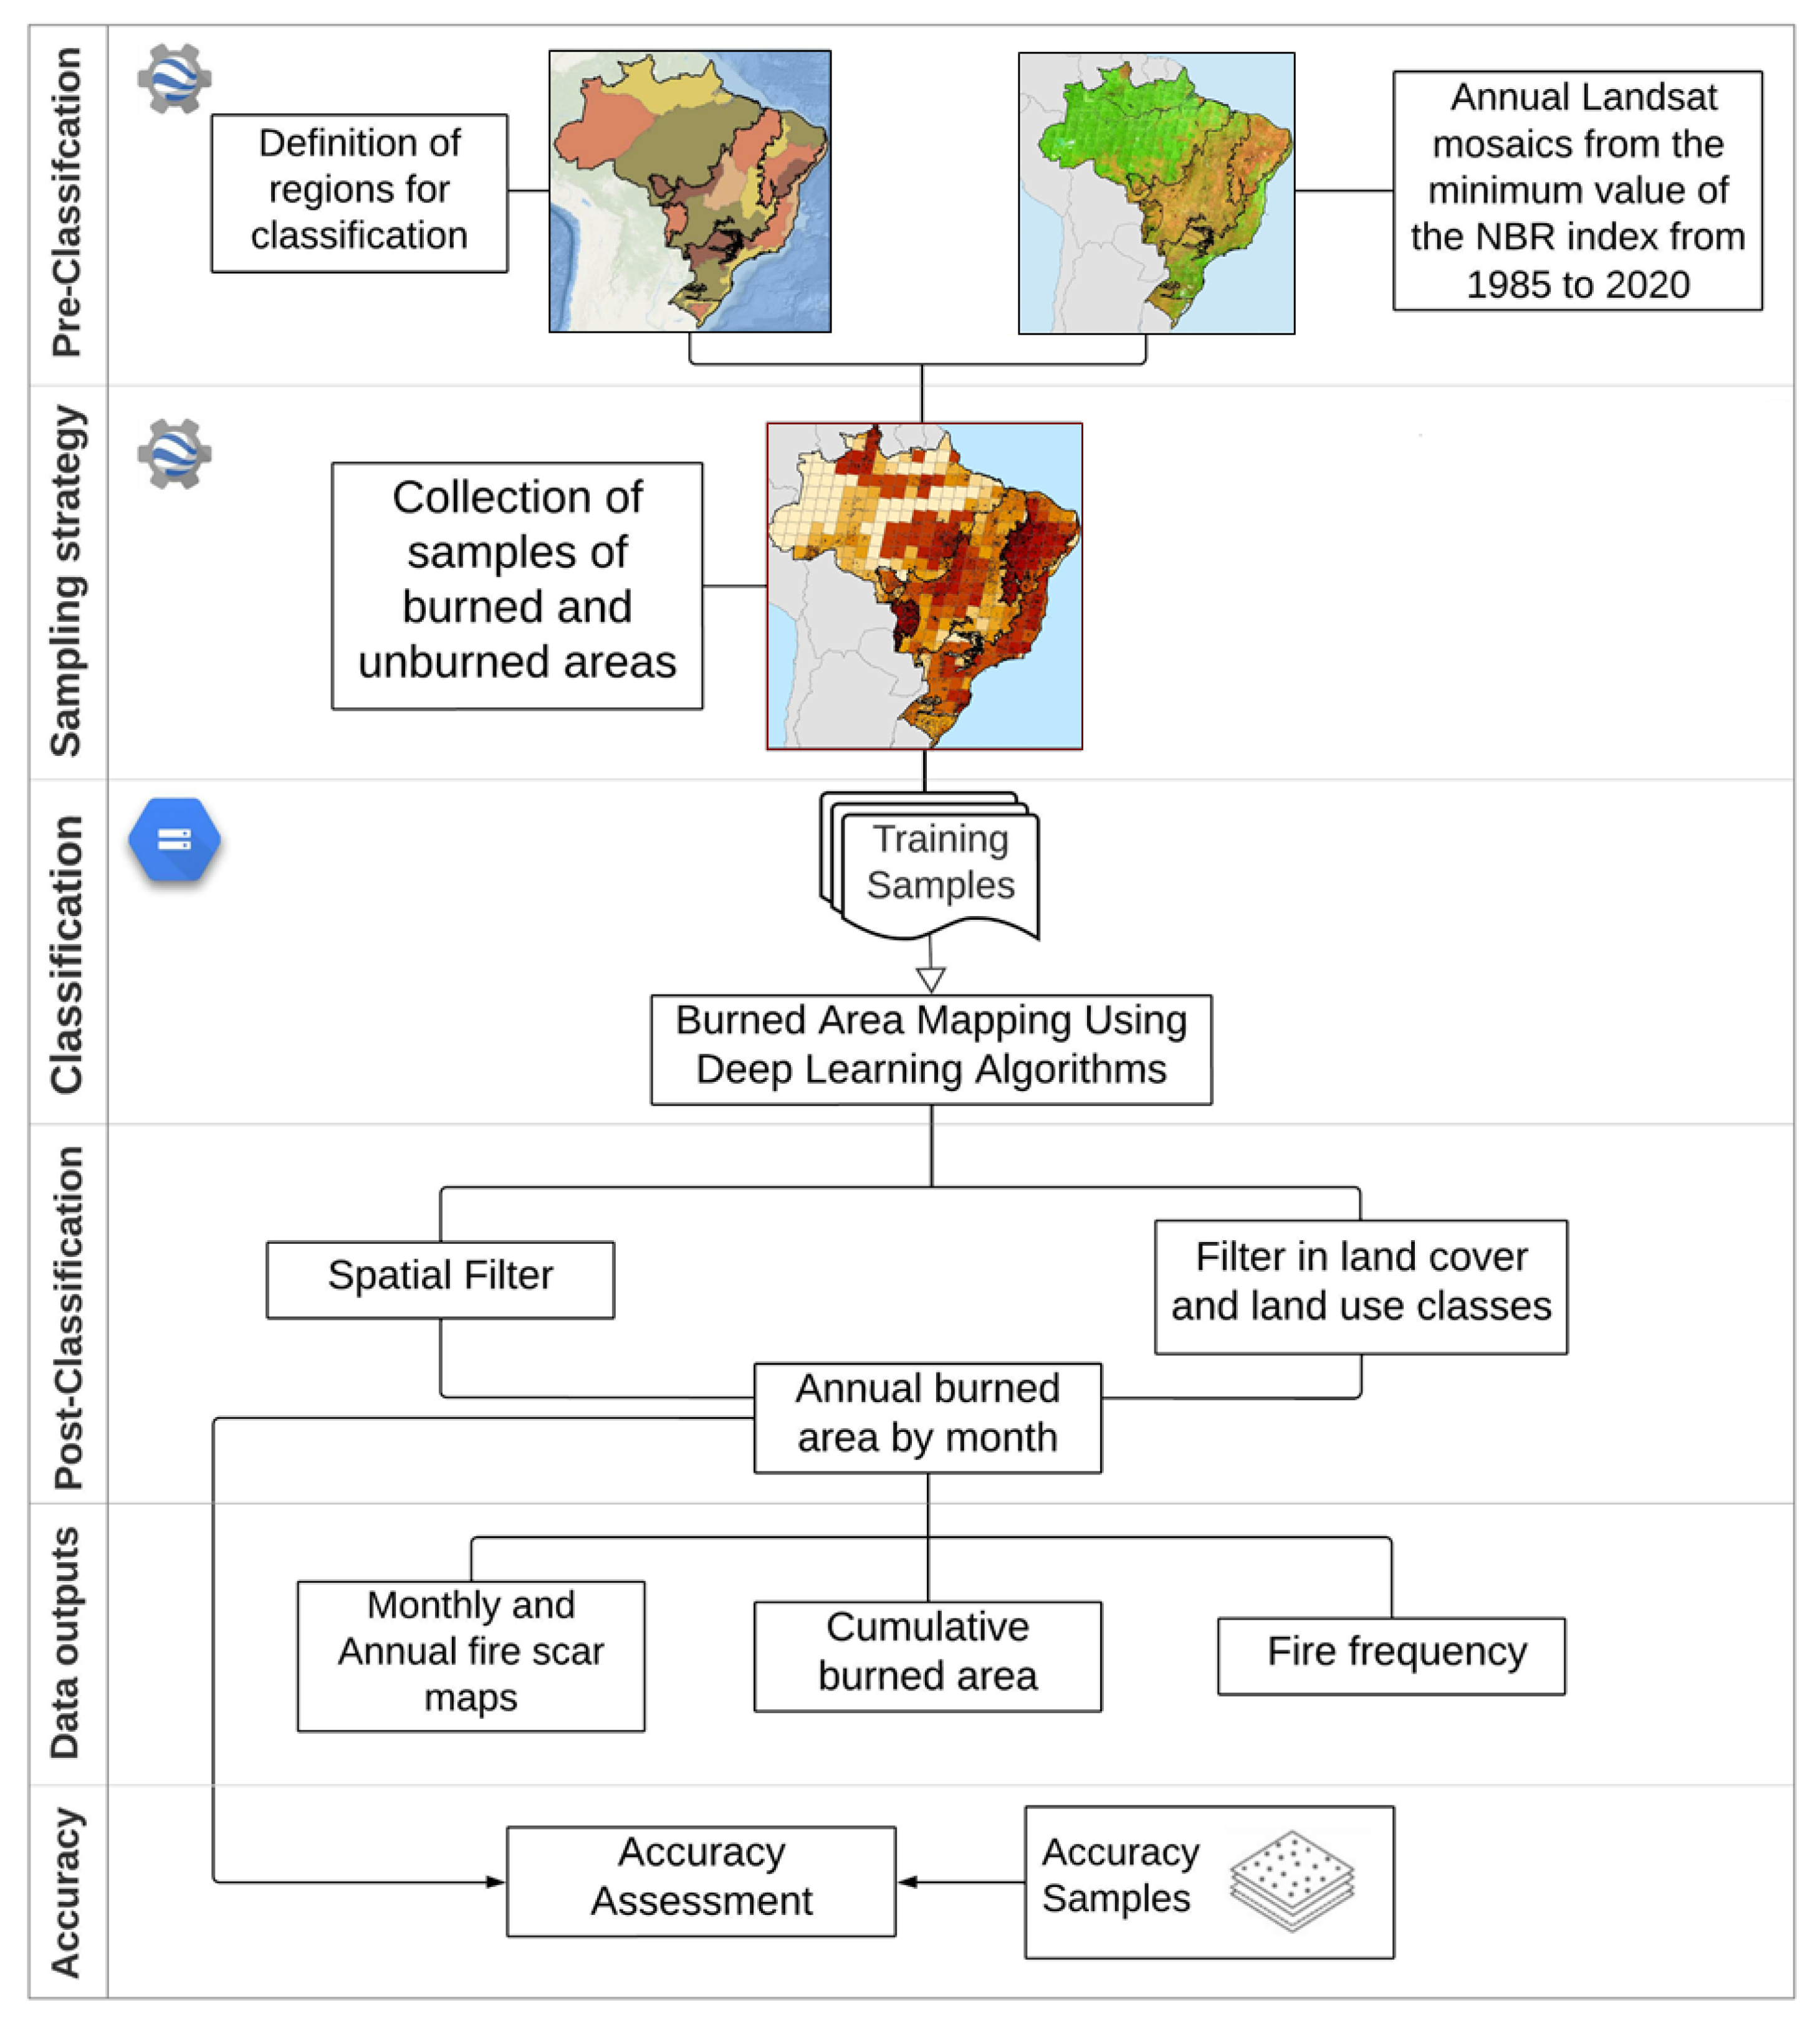
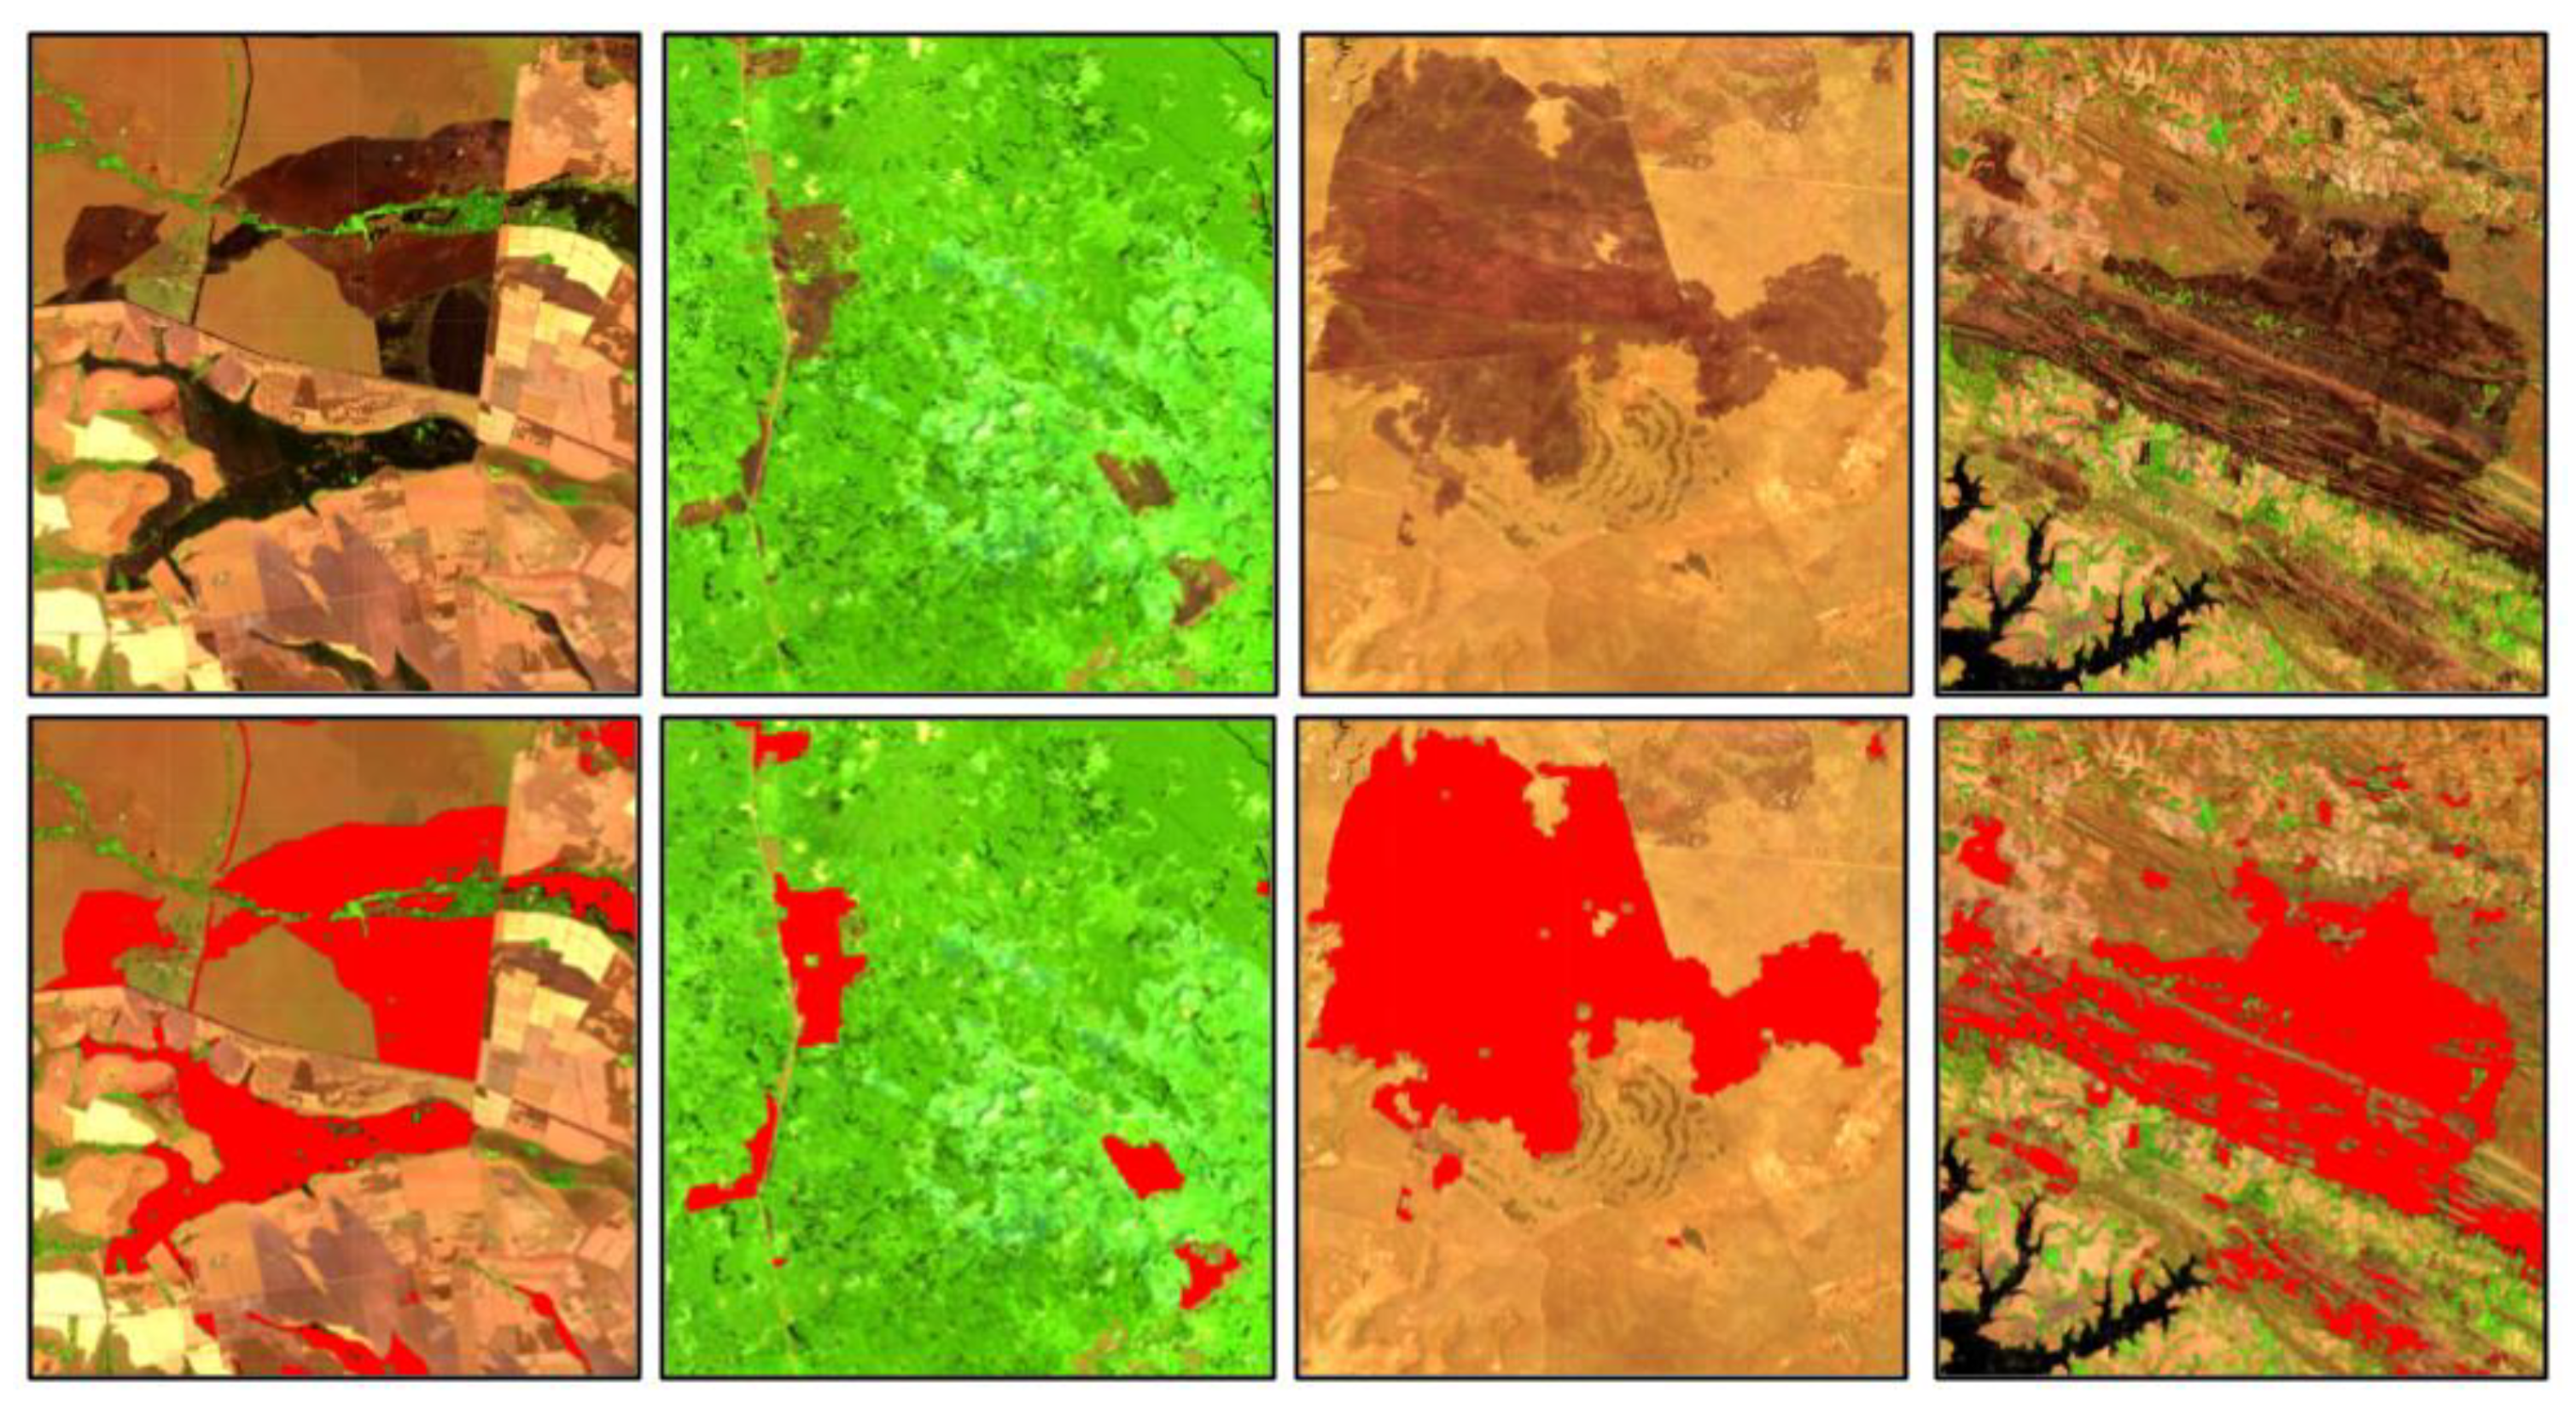
2.2. Burned Area Classification Approach

We used all available Landsat imagery (Landsat 5, 7, and 8) and Deep Neural Network (DNN) model to detect and map burned areas within the Brazilian biomes between January 1985 to December 2020. The DNN models use artificial intelligence and machine learning algorithms to perform deep learning classifications of complex phenomena generating higher performance results, including for fire mapping [59].
The images were treated in Google Earth Engine (GEE) to create annual Landsat quality mosaics, used to collect burned and unburned spectral signatures, to serve as training samples for the classification model. The training samples and the annual quality mosaics were exported to a Google Cloud Storage Bucket to be used as input in virtual machines to train the DNN models, process the burn scar mapping and produce a dataset of 36 years of monthly burned area for all of Brazil from 1985 to 2020.
The image processing and classification routines used to map the monthly burned areas in the Brazilian territory followed six steps including: (1) definition of the classification regions per biome, (2) construction of annual Landsat quality mosaics, (3) collection of training samples containing spectral signatures of burned and unburned areas on the annual quality mosaics, (4) training and development of the DNN prediction model, (5) use of post-classification routines with masks and spatial filters, and (6) accuracy assessment (validation). Figure 2 presents our methodological approach for detecting and mapping burned areas in the Brazilian biomes.

2.2.1. Definition of Classification Regions

Considering that the fire regimes and burned area spectral signatures are influenced by climatic conditions and the burned land cover and land use type, we combined edaphoclimatic and morphoclimatic data with annual maps of land cover and land use from MapBiomas Collection 6.0 [50], to segment each biome into classification regions (Figure S1). This process resulted in 21 classification regions, addressing regional patterns and conferring a more accurate classification of burned areas.

2.2.2. Annual Quality Mosaic

The classification was performed using surface reflectance (SR) Landsat mosaics (30 m × 30 m) constructed for each year from 1985 to 2020. We assessed all the available Landsat 5 (from 1985 to 1998, and from 2003 to 2011), Landsat 7 (1999 to 2002, and 2012), and Landsat 8 scenes (2013 to 2020), with a 16-day return interval. All together, we used 154,261 (or ~108 TB) of Landsat scenes distributed over 389 different WRS-2 path/row tiles that overlap the Brazilian territory (on average 4285 scenes per year).
Currently, Landsat Surface Reflectance is accompanied by a Bitwise Quality Assessment (BQA) band that indicates the pixels with radiometric and instrument related problems, including the ones with high levels of cloud contamination [60]. We used the Quality Assessment Band to avoid these pixels by selecting and masking the pixels with high confidence levels (67–100%) of ‘cloud’, ‘shadow’, and ‘radiometric saturation’ in order to compose the annual quality mosaic. We used a per year statistical approach to summarize this amount of data and optimize the classification without discarding spectral information on a pixel basis. This approach allowed us to create yearly mosaics by performing the composition of all the 16-day images into a single quality mosaic (QM), using the minimum NBR (Normalized Burn Ratio) spectral index [61] as a per-pixel ordering function, where the pixel with the lowest value of NBR was selected and all the spectral reflectance characteristics (Equation (1), Table S1), including the scene metadata with the date of that selected pixel, were used to create the annual quality mosaic (Figure 3 and Figure S2). The NBR index has been broadly used in several regions of the planet to detect fire activity and severity by integrating two spectral bands that respond most, but in opposite ways to burning [61,62].
λ Q M =   [ B l u e ,       G r e e n ,       R e d ,       N I R ,       S W I R 1 ,         S W I R 2 ] =   d a t e   i n   w h i c h   m i n ( λ N I R λ S W I R 1 λ N I R + λ S W I R 1 ) ,   [ x i j ]
where λ represents the reflectance values of the quality bands that compose the quality mosaic (QM), retrieved from the date in which each pixel reached their minimum (min) NBR value in a given year (x), considering the set of all available scenes, from first (i) to last (j); the λ NIR is the Near-Infrared surface reflectance and λ SWIR1 is the Short-Wave Infrared surface reflectance used to calculate the NBR spectral index. In other words, we computed the NBR for each one of pixels with valid observation within a specific year and stacked them into a multi-band image. The pixels with lowest NBR within the multi-band image were selected and their spectral information were used to compose the annual quality mosaic (QM). In addition to the spectral information, we retained the scene metadata information including the date in which each pixel showed its lowest NBR value. The NBR quality mosaic created with the spectral information from the minimum NBR performed well in differentiating burned and unburned land use and cover in the Brazilian biomes (Figure S3).

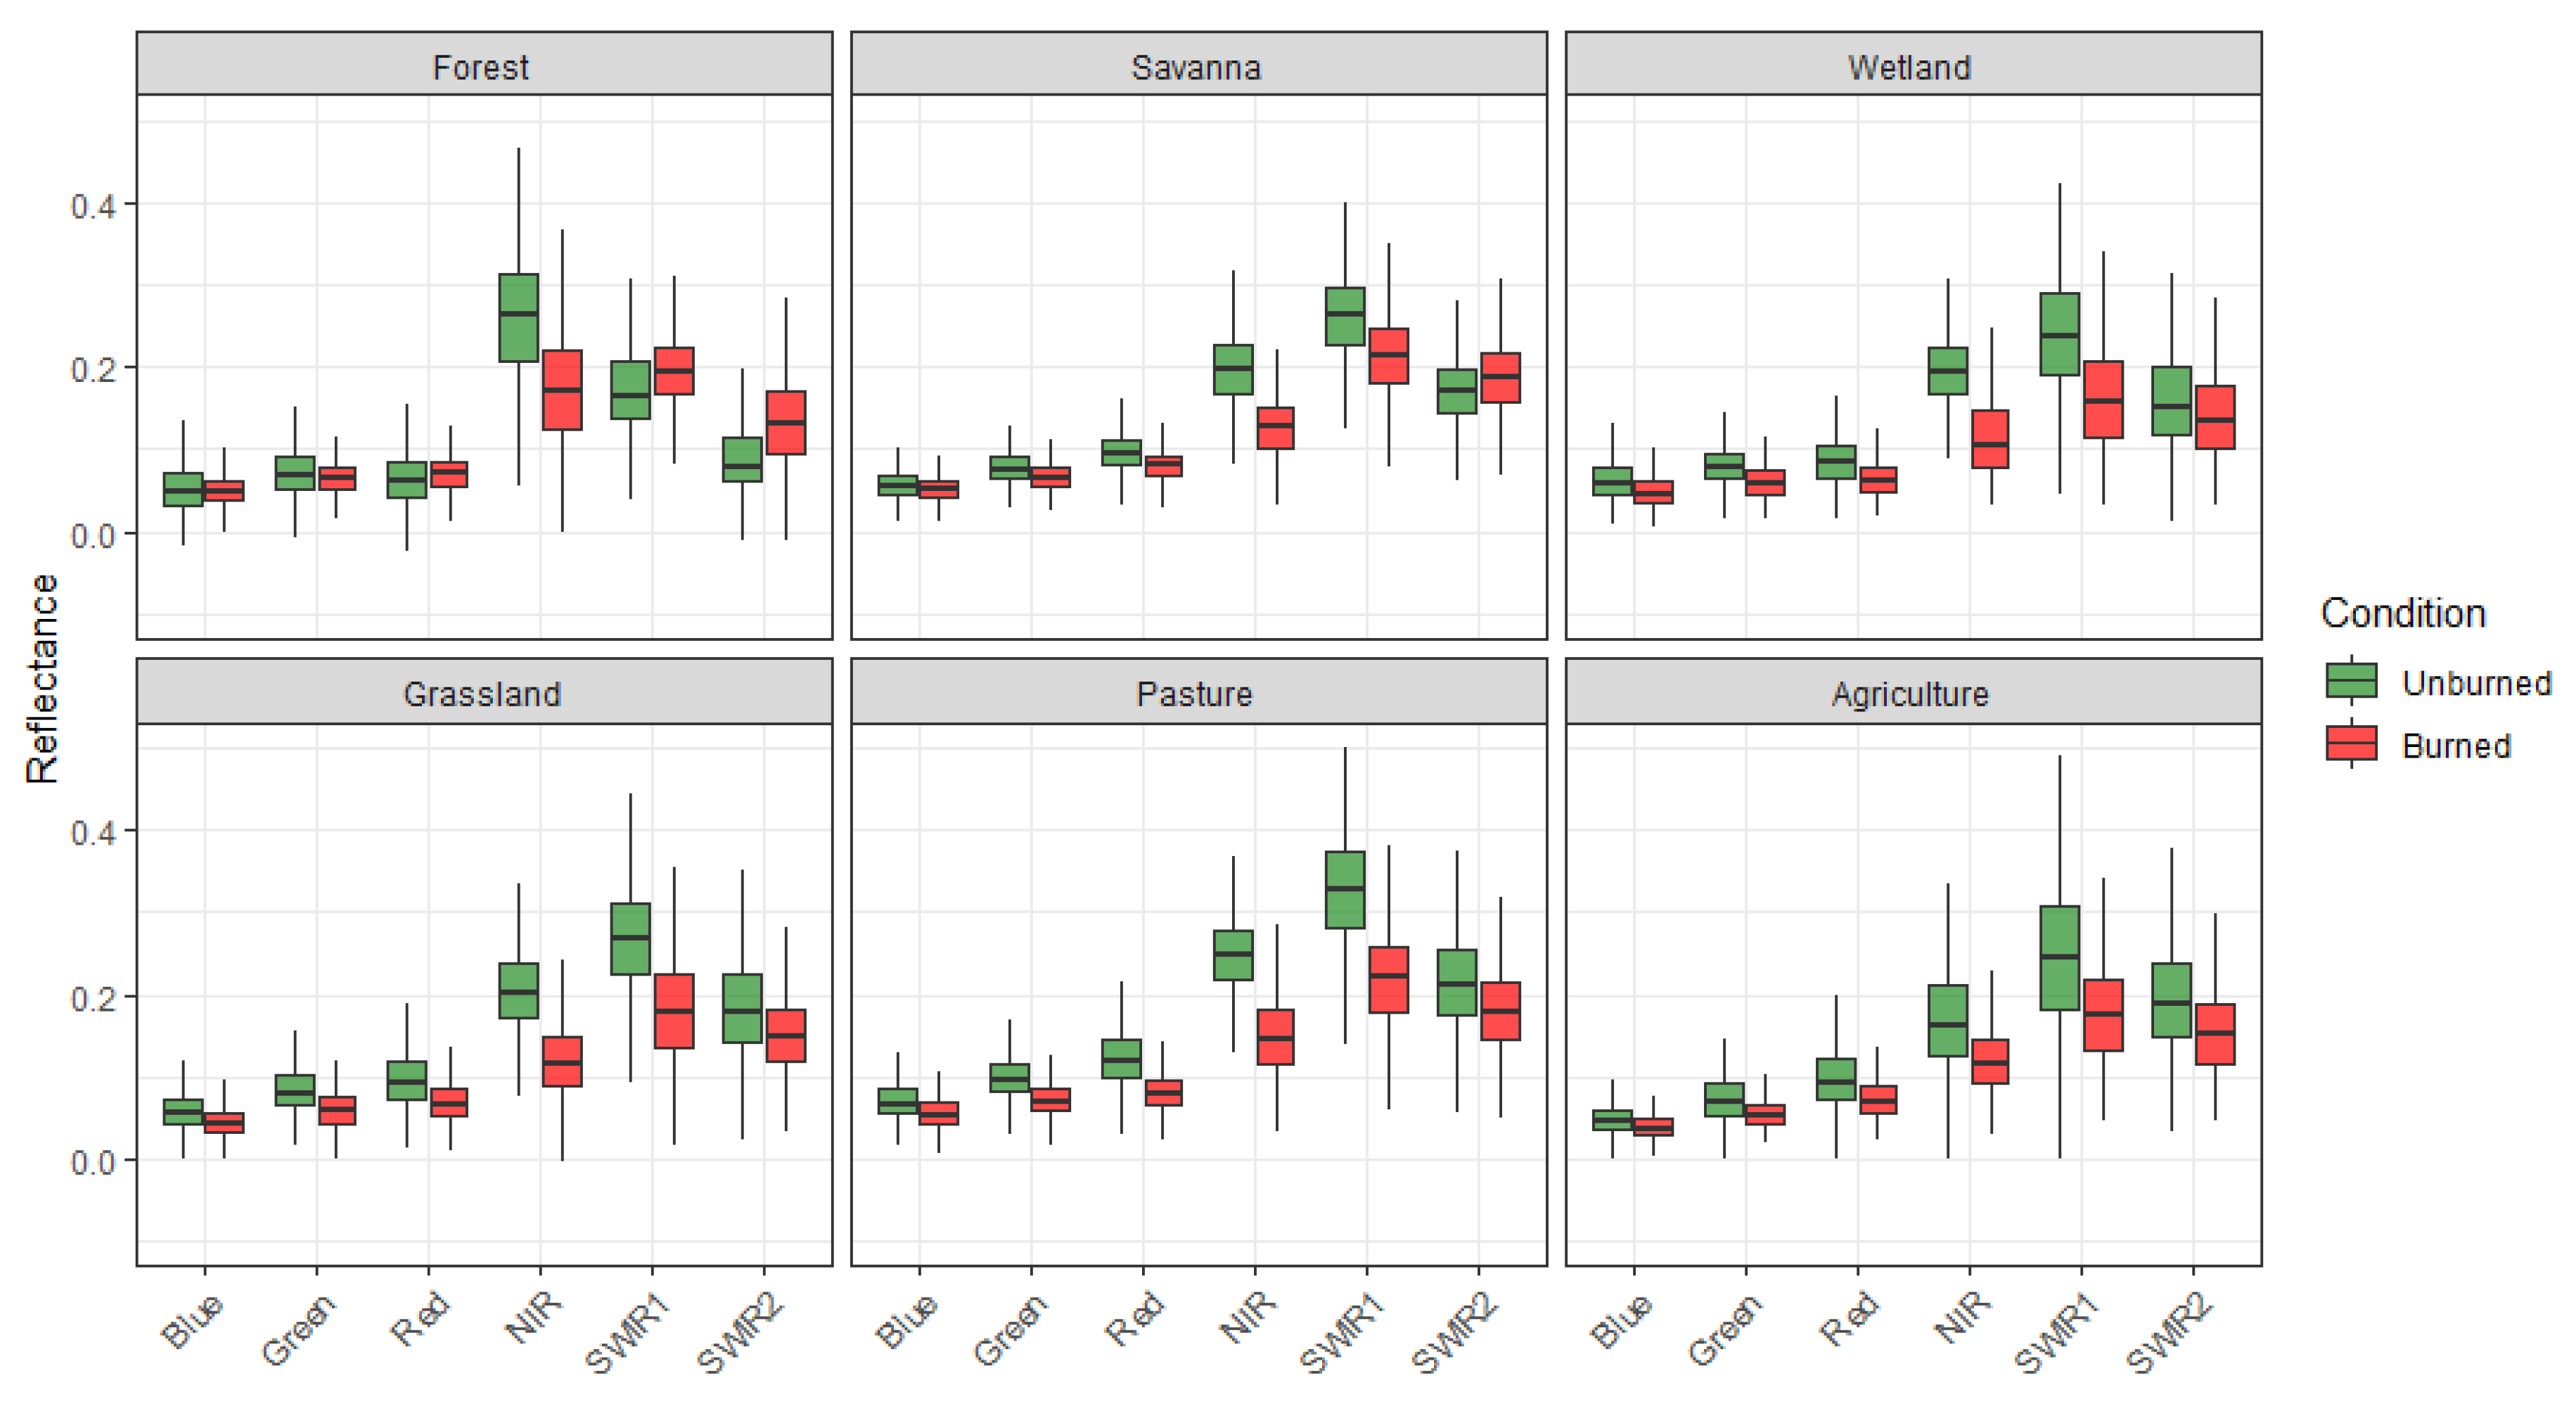
2.2.3. Sampling Strategy

Global burned area products from the Moderate Resolution Imaging Spectroradiometer (MODIS) sensor aboard the Terra and Aqua satellites, and provided by the National Aeronautics and Space Administration (NASA), have been globally used as a reliable source for area affected by fire. One of these products is called MCD64A1, has a coarse spatial resolution (500 m), and is available worldwide for download every 15 days as an integrated product [32]. To guide our sampling strategy, we used the MCD64A1 Burned Area Product as a reference data for burned areas from 2000 to 2020 (Figure S4). Additionally, we used the active fire products developed by the National Institute for Space Research (INPE) in Brazil. The INPE active fire product is based on an automatic mapping approach using 1 km × 1 km pixel size and thermal bands of nine satellites, and the AQUA_M-T (Sensor MODIS) as a reference satellite, providing daily data of fire activities for the same period (Figure S4), available at http://www.inpe.br/queimadas/bdqueimadas, accessed on 4 April 2022. For the years prior to 2000, we did not use any fire reference data due to the lack of spatial confidence with the available data existing at that time (e.g., NOAA and GOES with active fire registries since 1992 [63,64,65].
Using MCD64A1 and the INPE hotspots, we selected Landsat scenes quality mosaics containing more burned area and active fires, to focus on collecting the training samples spectral characteristics of burned and unburned areas. This effort resulted in a spectral library with 280,456,236 sampled pixels, collected manually as small polygons, of burned (89,845,700 sampled pixels; 32%) and unburned areas (190,610,536 sampled pixels; 68%) to be used as training samples. These samples, collected in different years (Figure S5A,B) and for each biome, were stratified by Landsat sensor, creating a group of training samples with spectral characteristics specific for Landsat 5, 7, and 8 images (Figure 4). Finally, we divided our spectral library into 21 stacks (one for each classification region), and used it as input for the classification.

2.2.4. Deep Learning Model

The classification model used was the Deep Neural Network (DNN), which consists of computational models based on mathematical calculations capable of performing deep learning and visual pattern recognition. The structure we used was the Multi-Layer Perceptron Network (MLPN), that incorporates several layers of interconnected computational units, where each node (neuron) in one layer is connected to a node in the next layer [66,67]. The layers are divided into: input, hidden, and output layers (Figure S6) [67]. For this DNN model the input layers were the spectral bands RED, NIR, SWIR1 and SWIR2, and the output layers were the classes burned and unburned (the scripts used to run the DNN model is available at Table S2).
The burned area mapping algorithm consisted of two steps: training and prediction. In the training phase, the following parameters were defined, based on prior tests: learning rate (0.001), batch size (1000), number of interactions (7000), and inputs for classification [68]. The classification inputs used in this model were the SR spectral data retrieved from the annual quality mosaics using the training samples of burned and unburned areas.
Based on the spectral library from the burned and unburned training samples, the following spectral bands were used as inputs for the burned area classification model: red (RED—0.65 µm), near infrared (NIR—0.86 µm), and short-wave infrared (SWIR 1–1.6 µm and SWIR 2–2.2 µm). These spectral Landsat bands were chosen based on their sensitivity to fire events among distinct land use and covers (Figure 5).
The training data input was divided into two datasets: 70% of the samples were used for training and 30% for testing, in order to estimate the ability of the DNN algorithm to map burned areas [68]. The classification was performed using the annual Landsat quality mosaics, for each one of the 21 regions, and for each sensor (Landsat 5, Landsat 7, and Landsat 8), resulting in 36 maps of burned and unburned areas for all of Brazil (Figure 6).
Because deep learning methods require powerful computational processing, we conducted our analysis using graphics processing units (GPUs) and specialized hardware components for running parallel arithmetic operations [69]. The computation infrastructure used was core 8vCPU, 32GB RAM with an additional 200 GB disk. Access to GPUs in a virtual machine environment was implemented on the Google Cloud Platform (https://console.cloud.google.com, accessed on 4 April 2022), a suite of cloud computing services provided by Google. The links for all the scripts used for sampling and classification are available in Table S2.

2.3. Post-Classification

A spatial filter was applied to remove noise and fill small empty gaps, where burned areas smaller than or equal to 1.4 ha (16 pixels) were removed, and empty gaps (inside and rounded by burned area) smaller than or equal to 5.8 ha (64 pixels) were filled as burned.
After evaluating the classification results, post-classification masks were also applied to reduce the commission from the land use, and cover with spectral signatures that are similar to those of recently burned areas, such as water, urban areas, and some crop types. We defined rules per biome to remove pixels that were classified as burned in the distinct land cover and land use classes of the MapBiomas Collection 6.0 (Table S3). The post classification reduced the original burned area by 1.72%.

2.4. Data Outputs

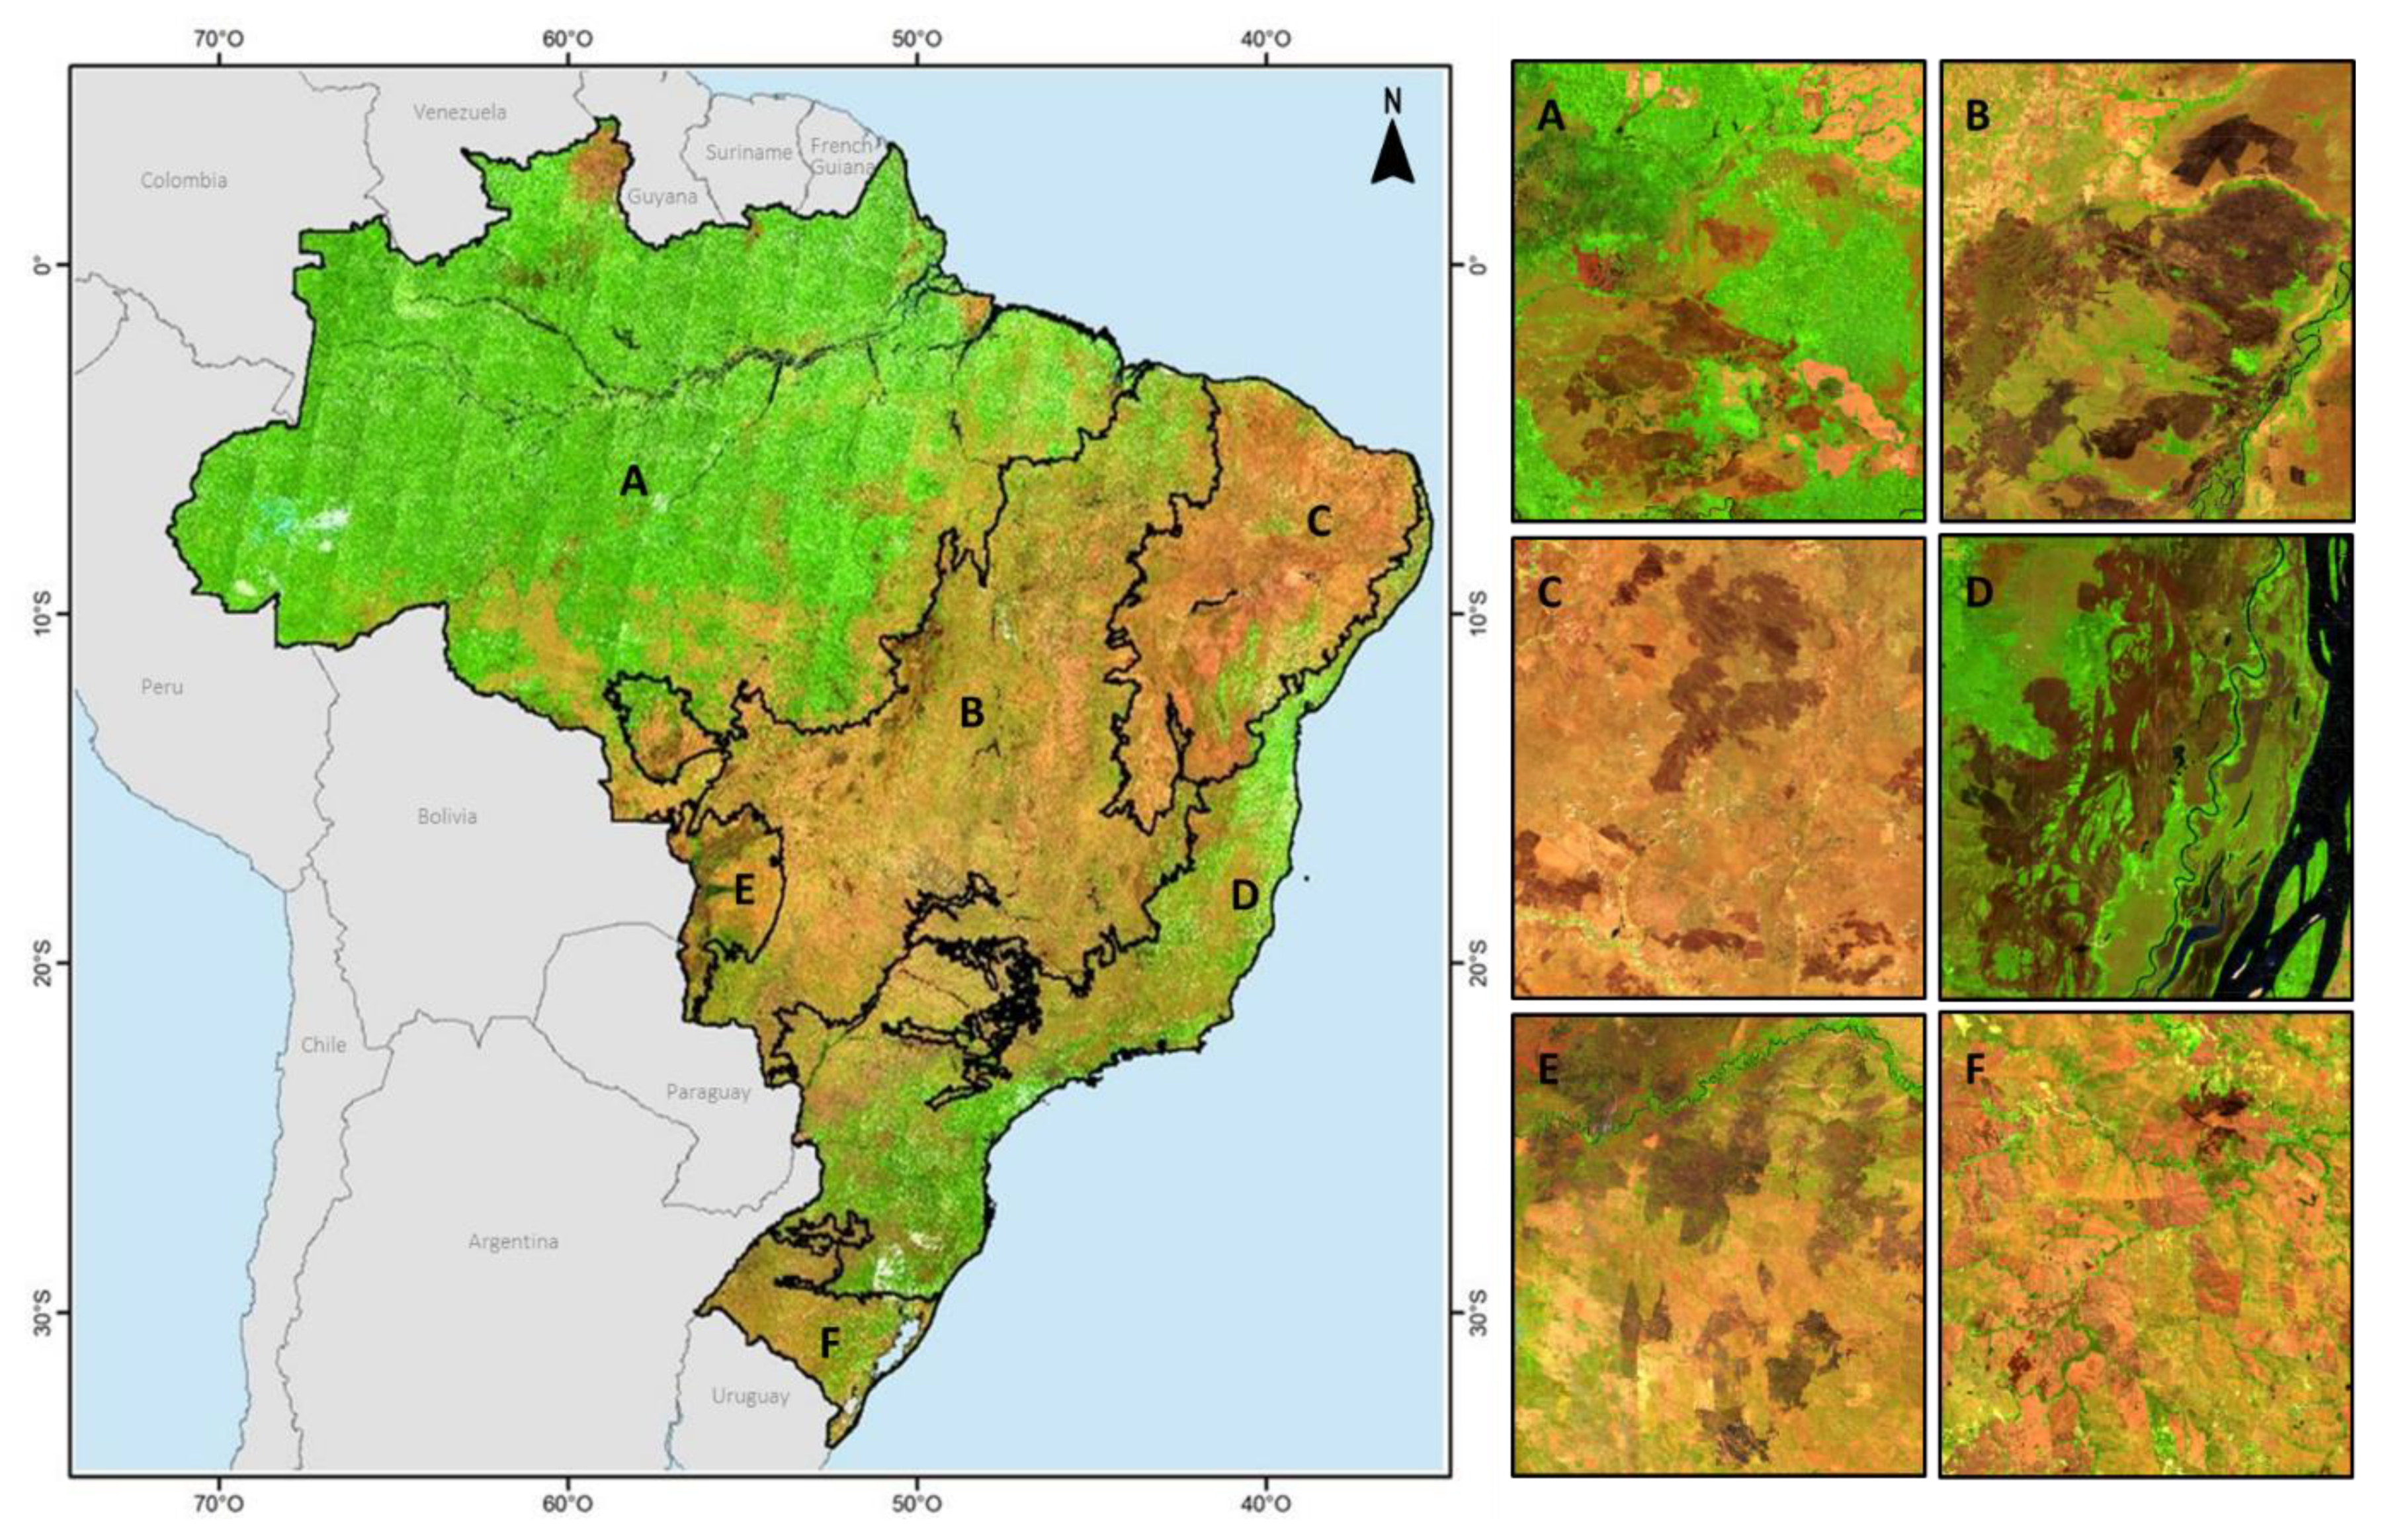
2.4.1. Monthly and Annual Fire Scar Maps

To obtain the information of the month in which the fire scar was first mapped, post-classification processing was performed to retrieve the date information of the pixel that was burned, from the date of the pixel in which the annual quality mosaic was built from the minimum NBR. The annual fire scar maps are the composition of all the burned areas of each month, in the respective year.

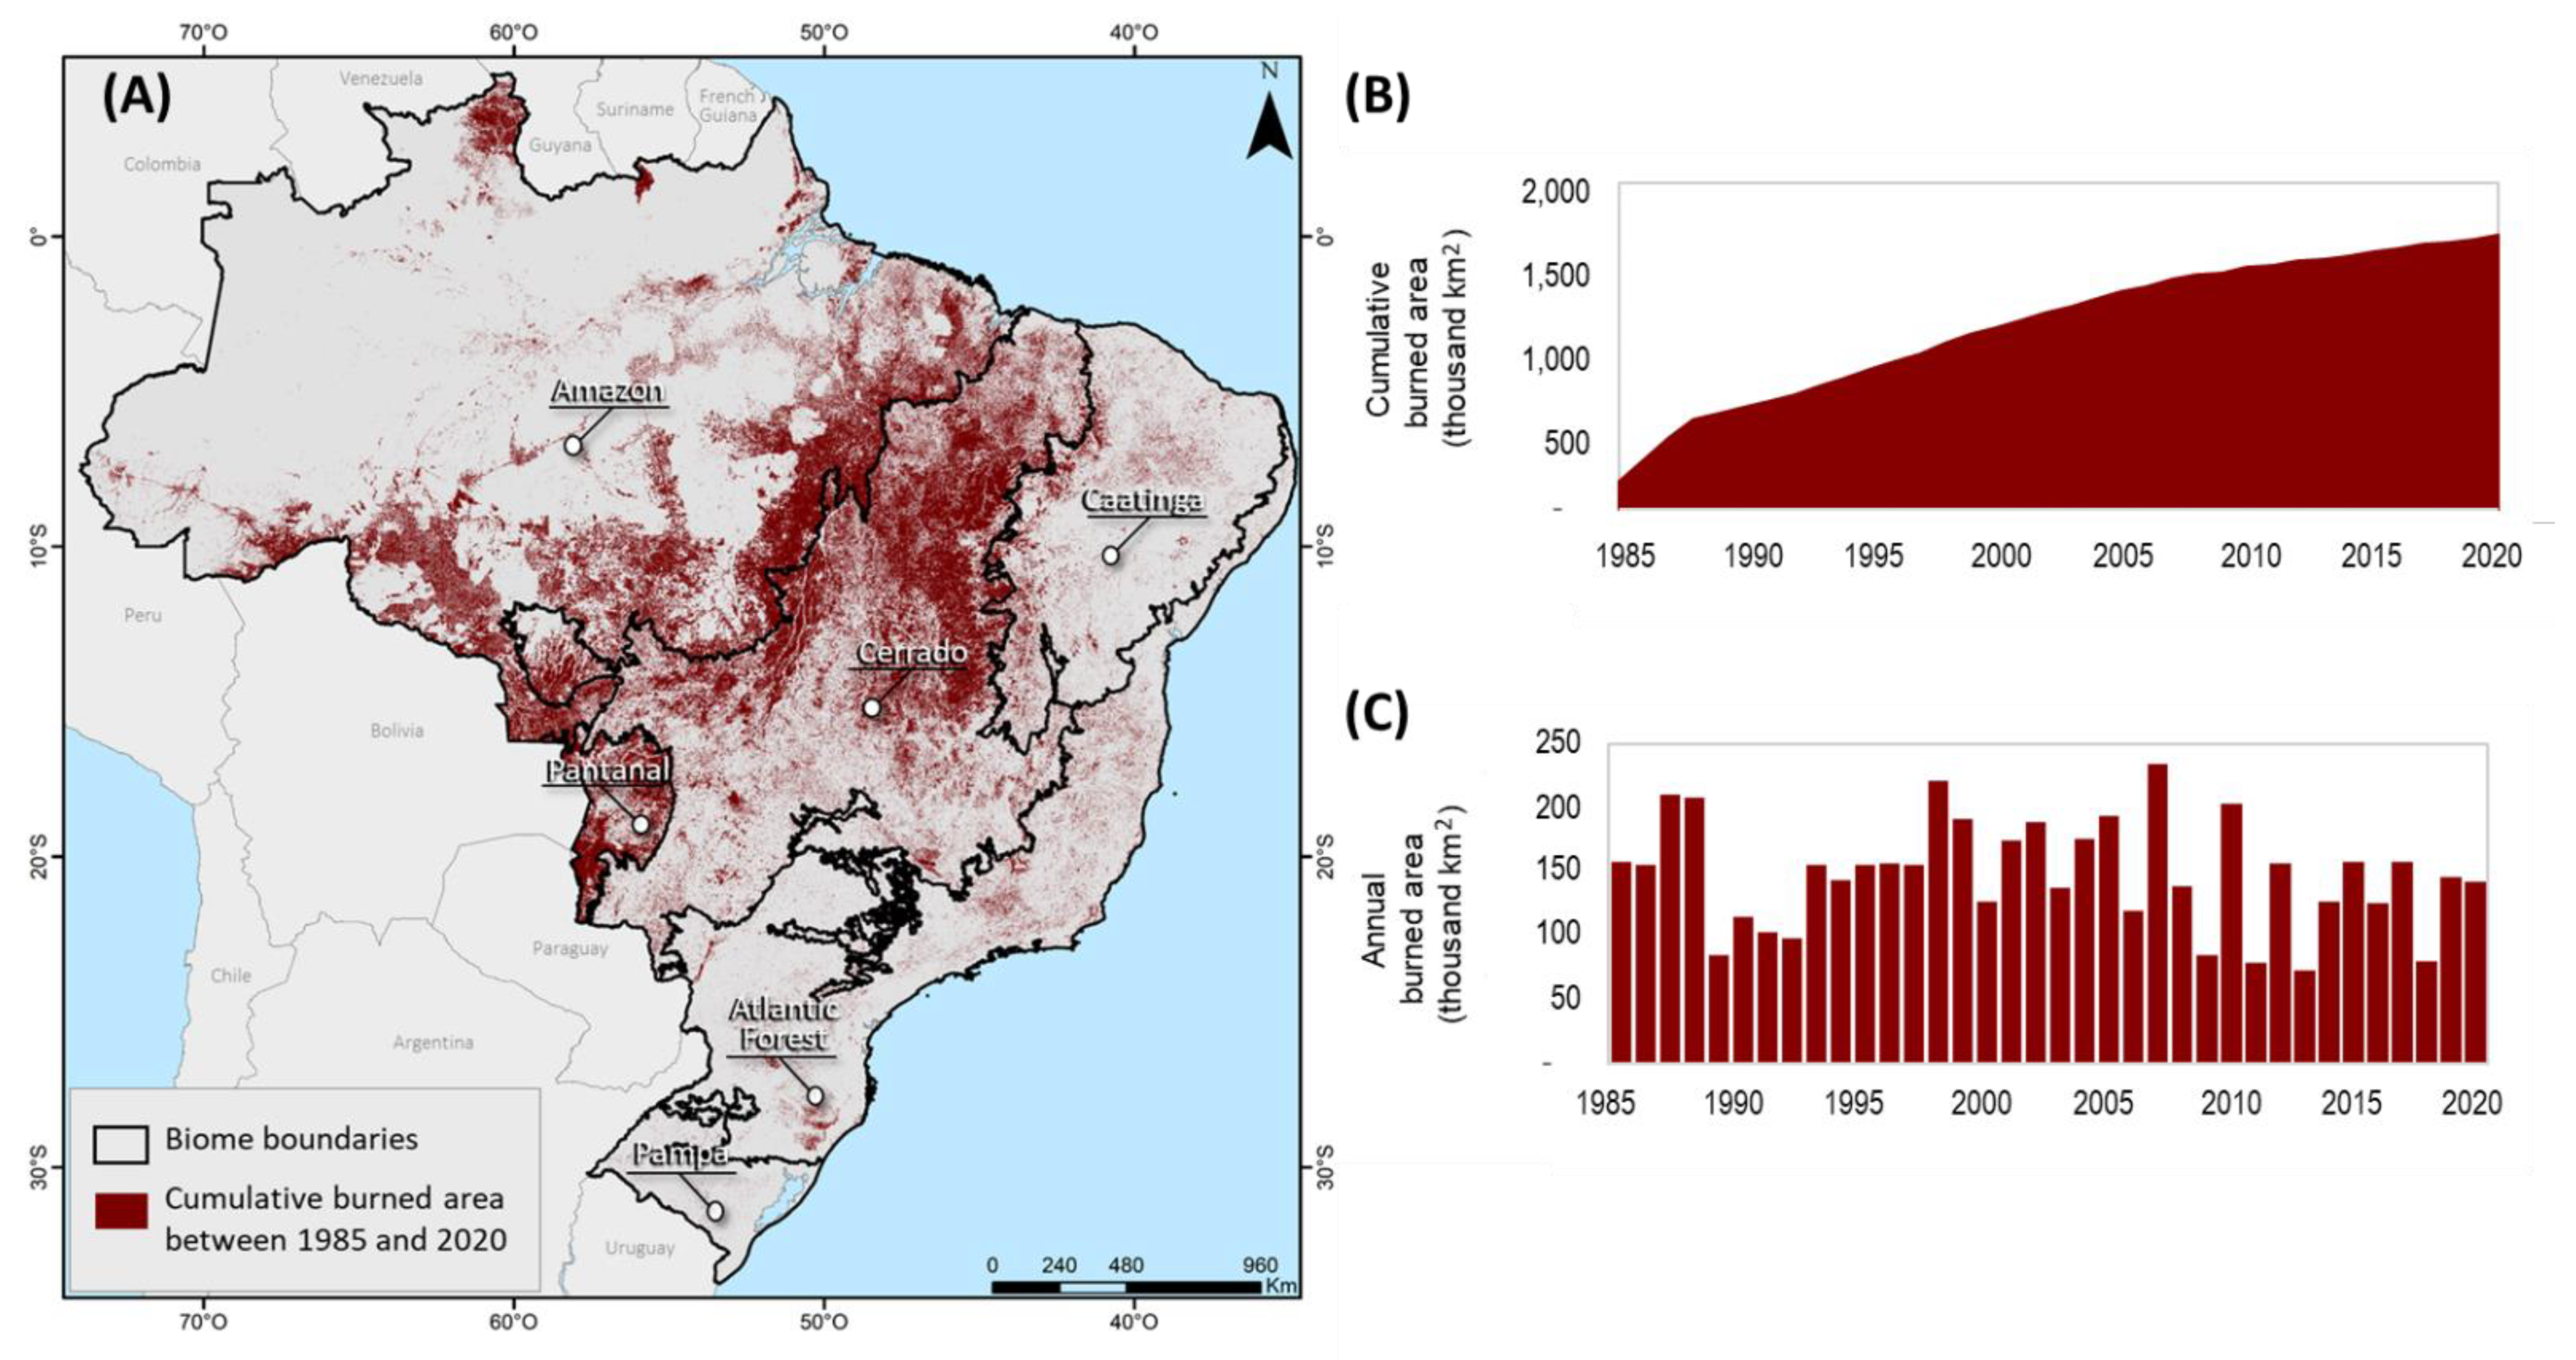
2.4.2. Cumulative Burned Area

The accumulated burned area data were built from the increment of the burned area of each year; meaning that the same pixel is only counted as fire once, regardless of whether there was more than one fire occurrence.
The accumulated burned area data by land cover and land use type were obtained by crossing the occurrence of fire with the land cover and land classes of MapBiomas Collection 6, considering the last year of the period.

2.4.3. Fire Frequency

The burning frequency or fire recurrence data were produced by grouping the annual burned area, integrating them on a single map with 36 classes, for the entire period (1985–2020), where class 1 represents the pixels that were burned once, class 2 the pixels that were burned twice, and so on.
The fire frequency data by land cover and land use type were retrieved by crossing the fire data with the MapBiomas Collection 6 land use and cover map of 2020, the last year of the data series.

2.5. Validation

Validation of the burned area was performed per biome, considering the years 2007, 2011, and 2019, selected to represent years with a larger and smaller extent of burned area and distinct sensors. Each of the biomes was divided into 2 km × 2 km grid cells, which were spatially integrated with the burned area maps from the Fire Information for Resource Management System (FIRMS) [70], for the same years. The grid cells were divided into four groups considering the proportion of the area burned within each cell: (1) without fire occurrence, (2) with up to 32% of fire occurrence (low fire occurrence), (3) with fire occurrence between 32% and 70% (medium fire occurrence), and (4) with fire occurrence above 70% (high occurrence).
The definition of the sample size for each group was based on Equation (2) and applied for each of the biomes and for the years 2007, 2011, and 2019, resulting in between 2196 and 2183 cells randomly selected for each year of the analysis (Table S4).
n = N × Z 2 × p × ( 1 p ) ( N 1 ) × e 2 + Z 2 × p × ( 1 p )
where: n is the sample size, N is the population size, Z is the standardized normal distribution score corresponding to the adjusted confidence level 1 − α = 0.95 (95%), e is the maximum margin of error expected (4.18%), and p (0.70) is the proportion for estimating eq = 1 − p.
Subsequently, the maps of sampling grid cells were inserted into the Google Earth Engine platform, so that the compositions of minimum NBR for each year were extracted for each cell. The images of the sampling cells were downloaded from Google Earth Engine, and segmented using QGIS software. The segments were stored as vectors and visually interpreted as with or without fire occurrence (Figure S7).
After the interpretation of all segments, the centroids with the respective attributes of the segments were extracted. These centroids were then spatially integrated with the burned area mappings, making it possible to count the locations mapped and interpreted as burned (Figure S7). Due to the significant difference between the number of centroids in areas mapped as burned and unburned, it was necessary to adopt weightings in the accuracy evaluations. With that, it was possible to assess the amount of commission and omission error, as well as the global accuracy, for each biome, as well as for Brazil, for the years 2007, 2011, and 2019.
In addition to the accuracy assessment, a comparison analysis between the burned area time series (named MapBiomas Fire Collection 1) with other existent burned area products MCD64A1 [32], and GABAM [35] was performed. Although MCD64A1 has a higher temporal resolution (daily observations) but lower spatial resolutions (500 m), the second is a Landsat based product with lower temporal resolution (16 days) and higher spatial resolution (30 m). The comparison was made from 10,000 randomly selected points used to extract information on the burned and unburned areas of three existing burned area products for the years 2005, 2010, and 2018. These years were chosen because they were the only ones that had data from burned area for all three products. From there, three confusion matrices were produced comparing the burned and unburned area data for MapBiomas Fire, MCD64A1 and GABAM. The comparison analysis consisted of identifying the average convergence and divergence proportions between the three products and for the three years of analysis.
An analysis to evaluate the difference between mapping burned area using the annual quality mosaic and the individual images within a year was also performed for 15 Landsat scenes of the Amazon and Cerrado bordering area. The classification of the individual monthly scenes was combined with the results of the annual quality mosaic classification by computing the burned areas of convergence. This analysis helped to evaluate the burned area possible omissions when using the integrated annual quality mosaic.

3. Results

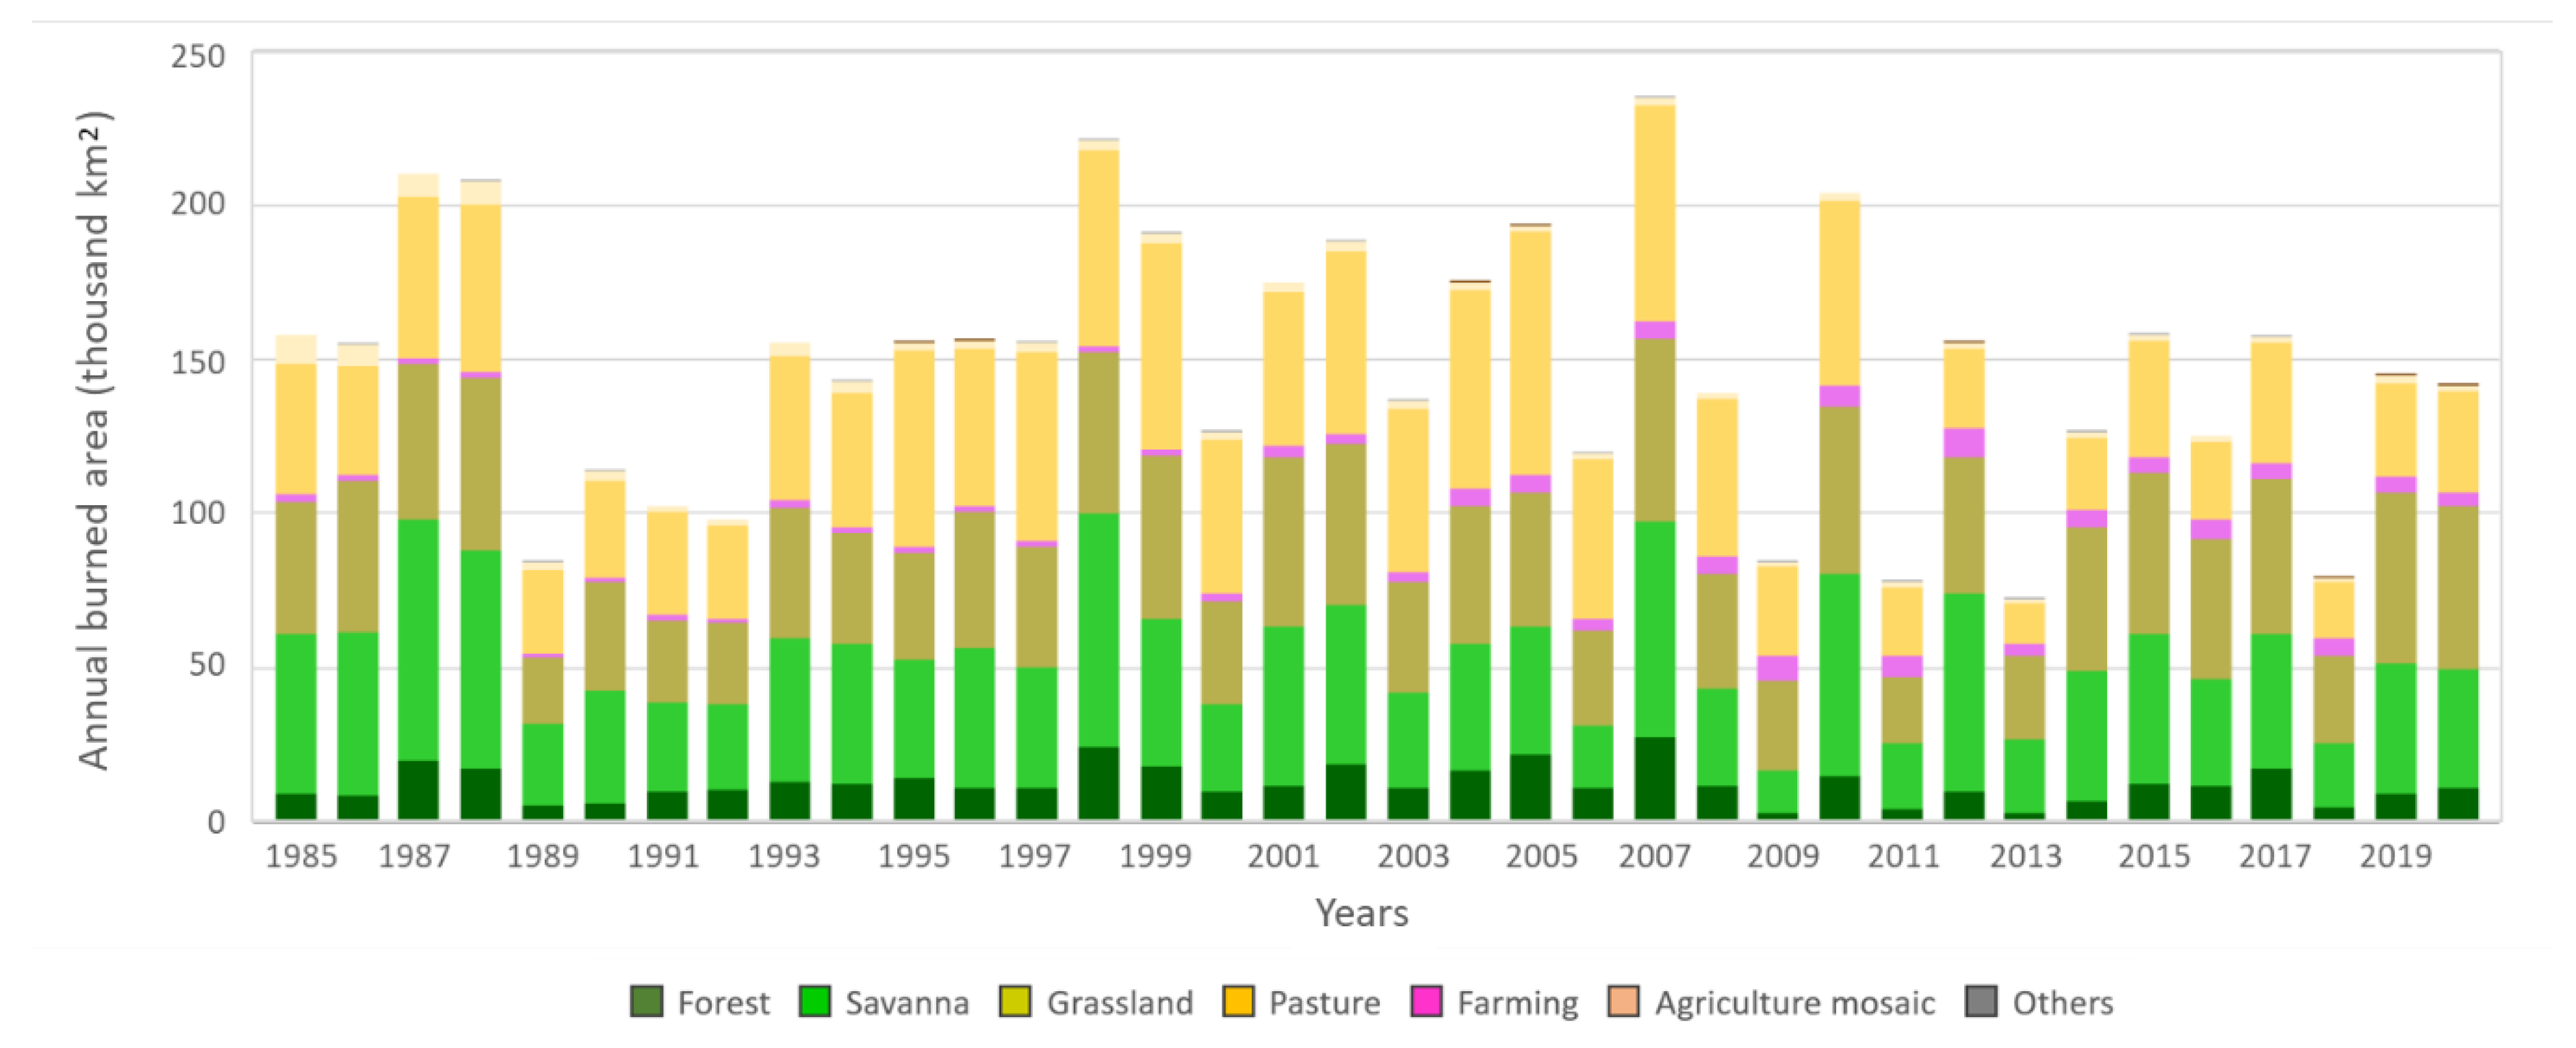
3.1. Annual Variability of Burned Area

A 36-year Landsat-based burned area dataset resulting from the DNN classification was created for the six Brazilian biomes (burned area dataset available at Table S2). The burned area maps revealed that 1,672,142 km2 or 19.6% of the Brazilian territory was burned at least once from 1985 to 2020 (Figure 7A,B; Table 1). The temporal variability of the area burned indicated an average area of 148,177 km2/years, or 2% of Brazil affected by fire every year. The annual burned area varied over time with the minimum annual area detected in 2013 (72,712 km2) and the maximum area mapped in 2007 (235,005 km2) (Figure 7C). Other years where fire occurrence peaked included 1998, 2007, and 2010, while years with less burned area include 1989, 2009, 2011, and 2013. Most of these years suffered from climate anomalies, which promoted extreme droughts (i.e., El Niño) or an increase in rainfall (i.e., La Niña) [21,57,71].
The annual burned area maps demonstrated an average overall accuracy of 89.35% (Tables S5–S7) with the highest overall accuracy in 2019 (92.25%) (Table S7). The validation analysis showed higher average user accuracy (93.2%) than producer accuracy (>85.13%), especially for the burned areas, for all the three years analyzed (2007, 2011, 2019) (Tables S5–S7). The producer accuracy for the 2007, 2011, and 2019 burned area was 81.93%, 84.14% and 89.31%, respectively, indicating that the maps in general were conservative for mapping burned areas, and presented more omission (14.87%) than commission errors (6.80%). These results suggest a high reliability of the burned area maps produced with Landsat 5, Landsat 7, and Landsat 8 quality mosaic classification (accuracy results in Tables S5–S7).
A comparison between the burned area mapped using the annual quality mosaic and individual scenes in a year demonstrated a small difference (1,2%) with a slightly more area mapped when completed individually, gained with the increase chance of observing burned areas in very dense cloudy conditions (Table S8). Comparisons between burned and unburned areas from MapBiomas Fire Collection 1, MCD64A1 and GABAM, revealed that about half of the burned area was coincidently mapped in the three products (Figure S8). On average, 23% of the burned area was only mapped by MapBiomas Fire product, while 26% was mapped only by MCD64A1 product (Figure S8A). The comparison between MapBiomas Fire and GABAM showed that 48% of the burned area was mapped exclusively by MapBiomas Fire, and 3% mapped only by GABAM (Figure S8C).

3.2. Burned Area by Brazilian Biome

The spatial distribution of the total area burned from 1985 to 2020 highlights the importance of the Cerrado and the Amazon as the Brazilian biomes most affected by fire. These two biomes, which together occupy three quarters of the country, concentrated 85% (1,432,879 km2) of the total area burned at least once (cumulative area burned) during the 36-yr period (Table 1). Even though the Cerrado is at least two times smaller than the Amazon, 44% of the entire Brazilian cumulative area burned was observed in the Cerrado, while the Amazon accounted for 41% of the area affected by fire at least once in the country during the same period (Table 1). These two biomes were followed by the Caatinga, Pantanal, Atlantic Forest, and Pampa, accounting for 5.3%, 5.2%, 4.3%, and 0.1%, respectively, of the cumulative area burned in Brazil (Table 1).
In terms of the proportion of the area burned per biome, the Pantanal, a wetland dominated by grasses, was the most affected biome in relative terms. From 1985 to 2020, more than half (57.3%) of the biome was mapped as having been burnt at least once in 36 years. The second biome most affected by fire was the Cerrado, with 37% of its territory burned in the period of analysis (Table 1; Figure S9). These two biomes, which are ecologically fire dependent [5], are followed by the fire sensitive biomes Amazon and Atlantic Forest with 16.4% and 6.5% of these biomes burnt, and the Caatinga, with 10.3% of the biome burnt. The Pampa is the second smallest biome, and even though fire dependent, it is the biome that registered the least amount of area burned and with the smallest proportion of burned area (Table 1). These results indicate, if the mean annual burned areas are used, shorter fire rotation for Pantanal (18 years), Cerrado (30 years), and Amazon (64 years), while the other three biomes presented longer fire rotation of 221 years, 356 years, and 874 years for Caatinga, Atlantic Forest, and Pampa, respectively. Fire rotation represents the period of time in which an area is expected to burn based on the mean burned area in the period [72].
The extent of burned area in the Brazilian biomes responded to climate, type of vegetation structure, pace of deforestation, and regional policies. The combination of these elements resulted in a distinct distribution of the annual burned area over time for these biomes (Table S9; Figure 8). Even though the area burned in the Amazon presented peaks related to years with climate anomalies, the temporal distribution of the area burned in the Amazon followed overall deforestation trends (Figure S10), with higher rates during the 1990s and the first five years of the 2000s [9,21]. In the Cerrado, the same trend was broken by the peaks caused by extremely dry years (e.g., 1987, 1998, 2007, 2010, 2015, 2016, 2017), most of them related to the El Niño Southern Oscillation [73]. Pantanal was the biome where the burned area best responded to drier climate conditions, where the extent of fire was associated with years of severe droughts, 1999 and 2020 being record years in burned area [57]. The annual distribution of the area burned in the Atlantic Forest, showed a decrease from 2003 onwards, possibly associated with the regulation of sugarcane burning for ethanol in the state of São Paulo (Law n°11.241/2002), which advocates for the gradual elimination of this practice in the plantation areas [74]. In the Caatinga and Pampa, the annual extent of fire responded to climate but also to the local context of fire use by small farmers.

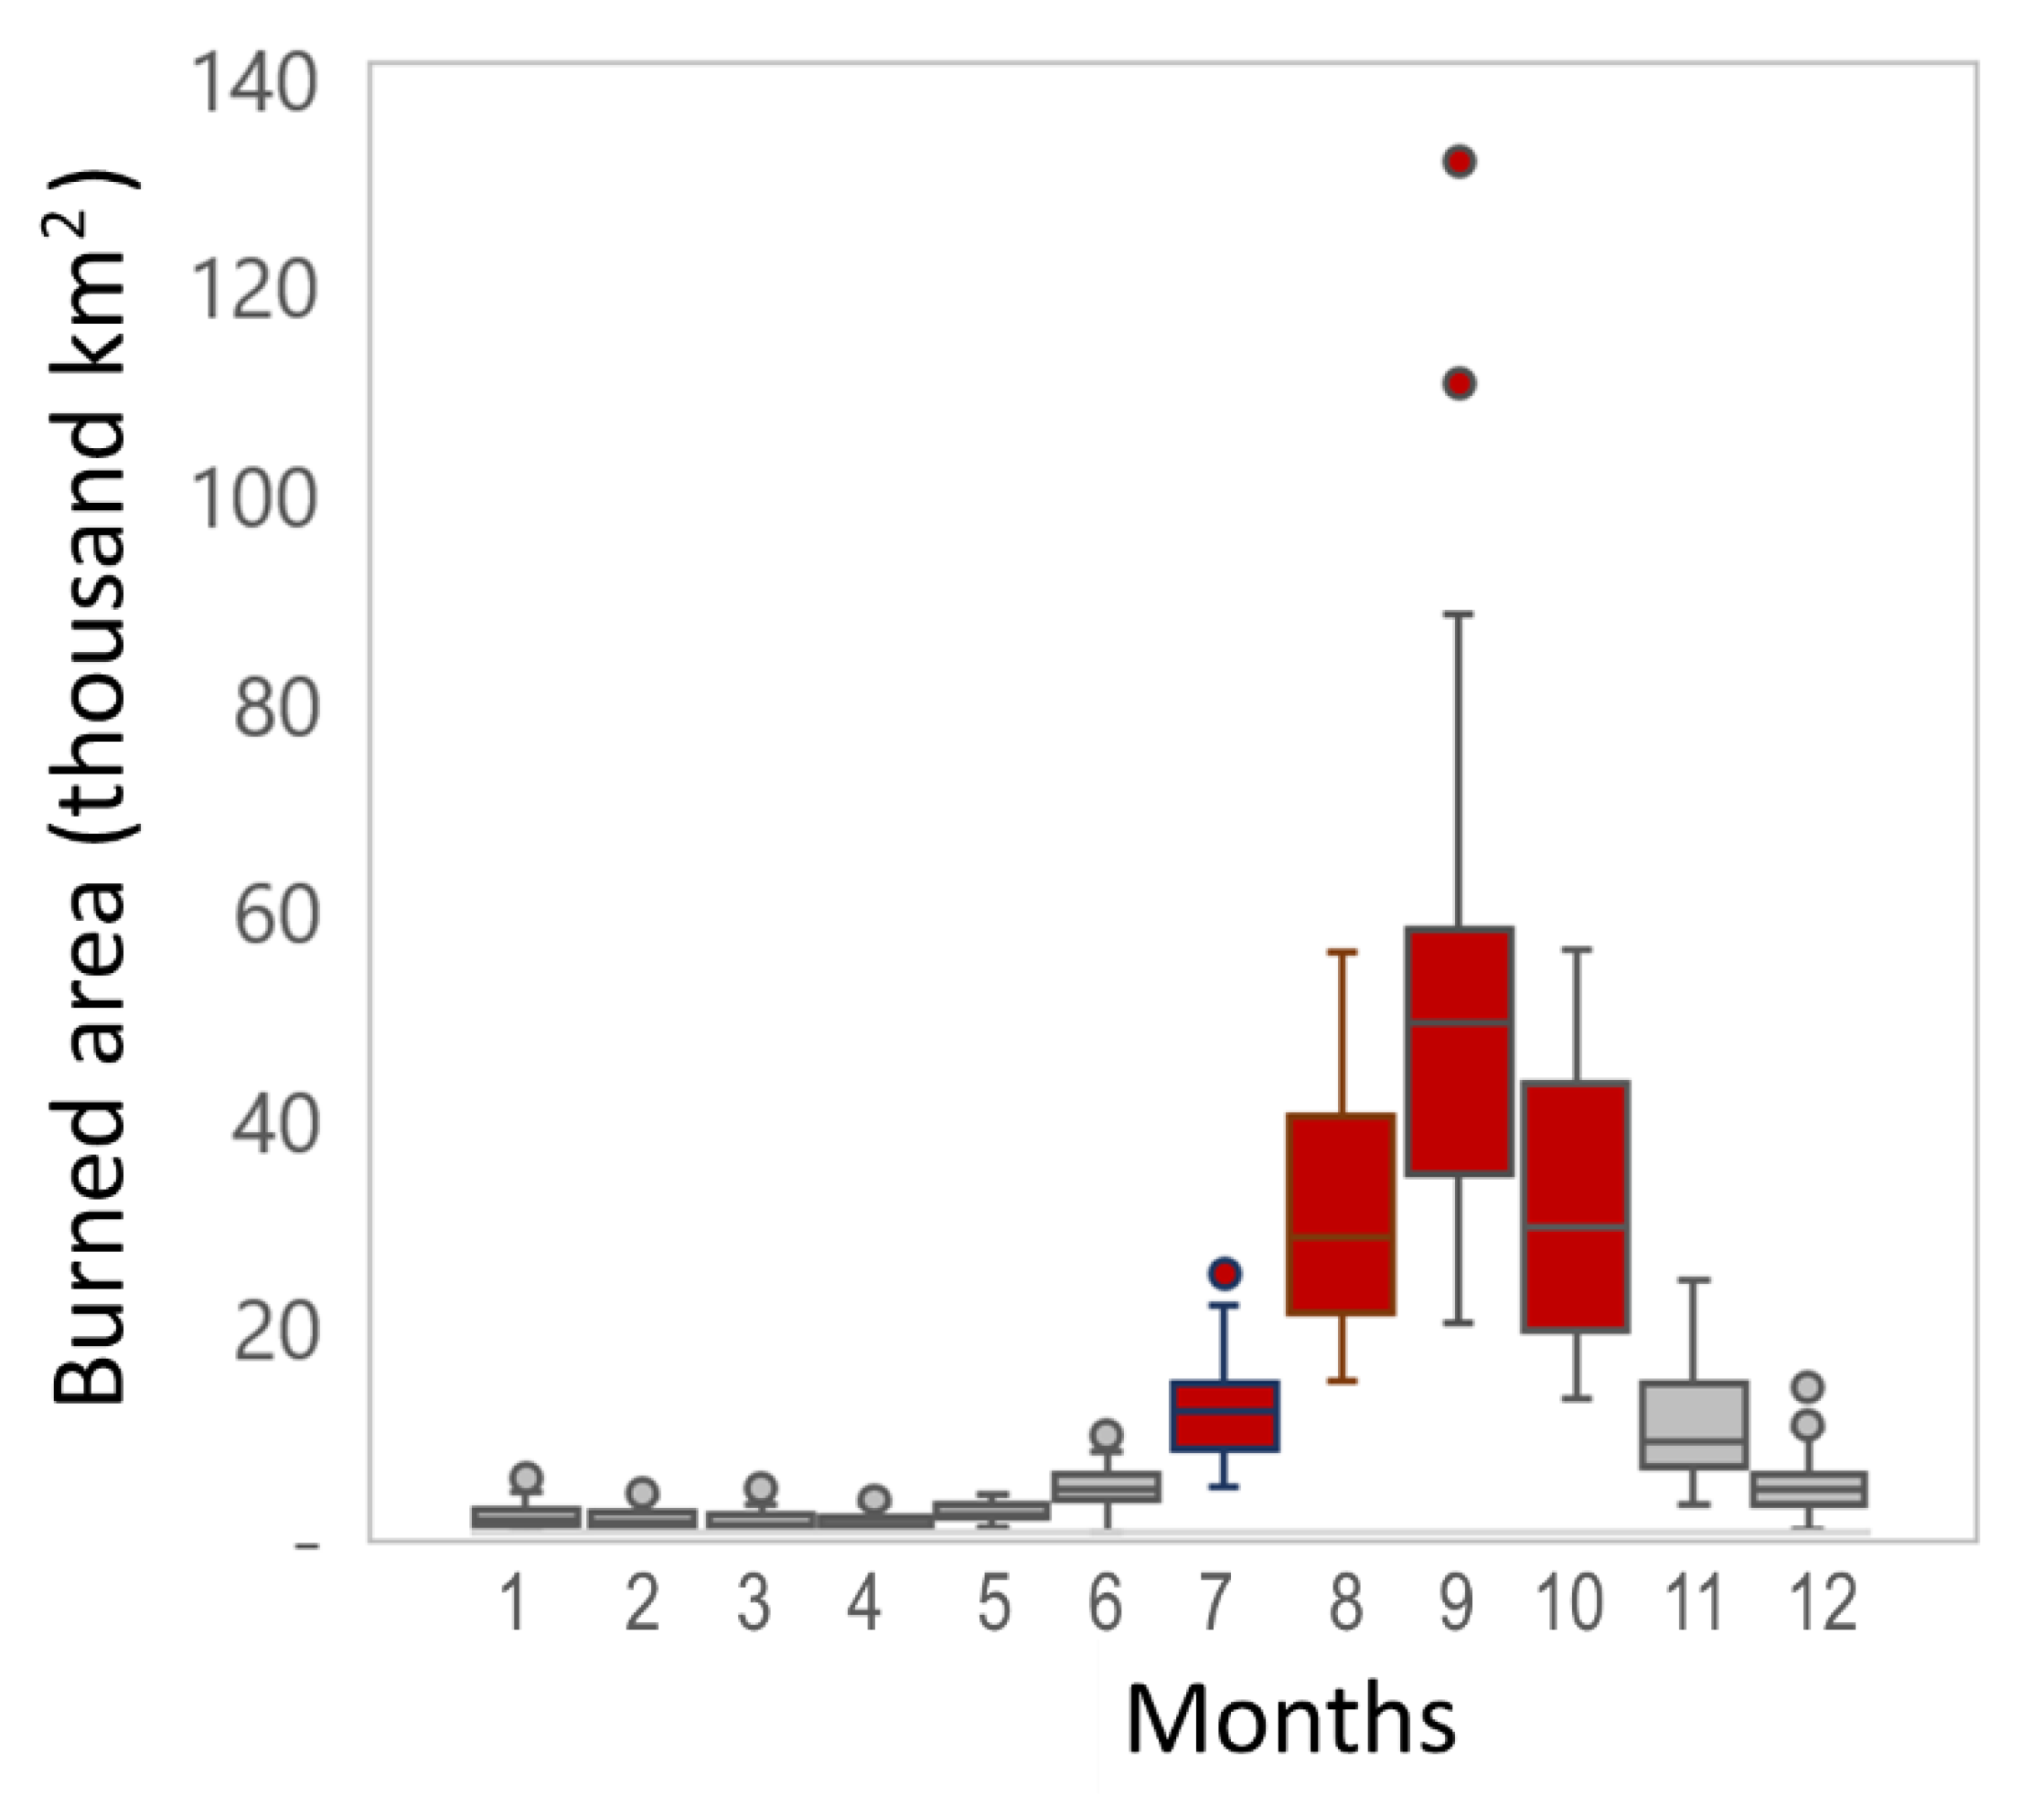
3.3. Monthly Burned Area
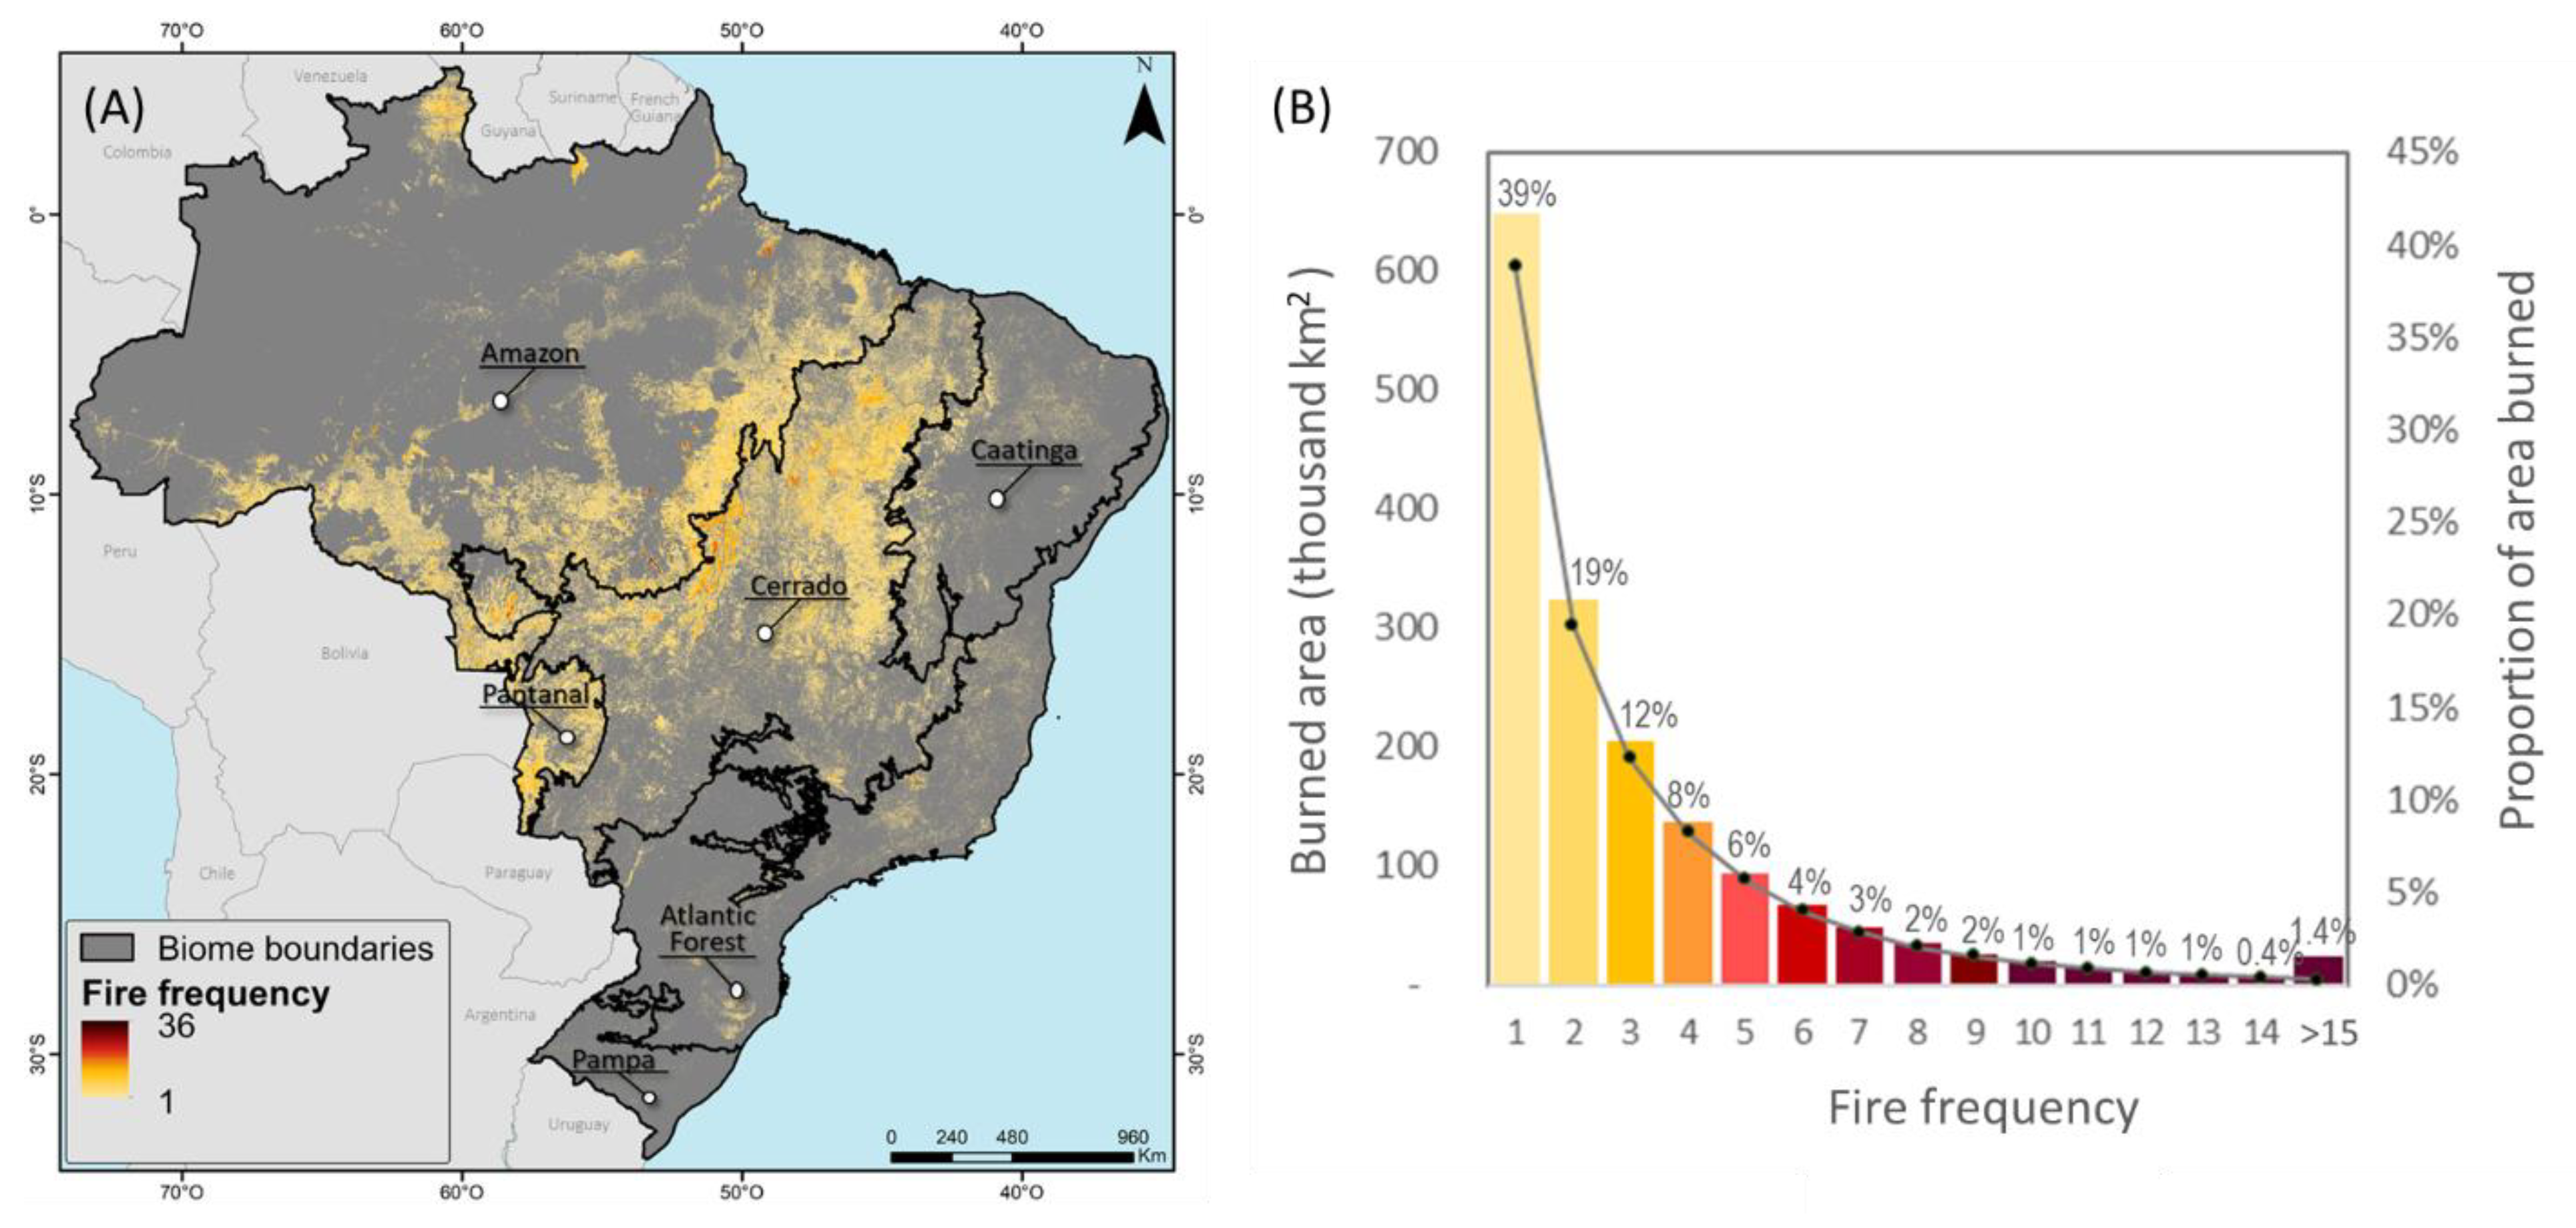
The extent of the area burned per month was retrieved from the date of the pixel used to compose the annual quality mosaic from which the minimum value of NBR was extracted. This dataset highlighted the months where the greatest part of the burned area was detected, helping determine the boundaries of the burning season in Brazil. The monthly burned area data revealed that 83% of the burns were detected from July to October, with the maximum extent of burns over the past 36 years of analysis occurring in September (Figure 9). That pattern is representative of most of the biomes, except the Amazon and the Atlantic Forest, where large areas were also burned in November, and the Caatinga, where the burning season extends to the months of November and December (Figure S11).

3.4. Fire Frequency

The annual burned area maps showed overlapping, revealing the areas in the Brazilian territory that suffered multiple burns, which would indicate higher occurrence or frequency of fire. The range in fire frequency varied from 1 to more than 15 times, in which fire was recorded in the same place over the years (Figure 10). The 36 years of fire frequency data showed that the majority (1,022,774 km2 or 61%) of the area burned in Brazil was affected by fire two or more times from 1985 to 2020 (Table 2). Almost half (42%) of the area burned over three times, suggesting fire return intervals of up to 12 years in this portion of the country. A small portion (1.4%) of the Brazilian territory presented a fire return interval shorter than 2.4 years, where the fire frequency was higher than 15 times (Table 2).
The areas where fire was observed at higher frequencies are located specially in the Cerrado and Pantanal, in some areas dominated by natural savannas and grasslands in the northern portion of the Amazon, and in areas along the arc of deforestation in the Amazon (Figure 10). The distribution of the relative fire frequencies of these biomes highlights a similarity between the Cerrado, Pantanal, and Amazon biomes in terms of the number of times which an area was burned (Figure S12). Of these three biomes, the Cerrado was the one presenting the largest area that burned only once (291,988 km2 or 40%) from 1985 to 2020, demonstrating a similar relative burn frequency distribution with Brazil as a whole. The Pantanal and Amazon biomes showed that 33% and 31% of their burned area, respectively, were affected by fire once in the period of analysis, implying that 67% and 69%, respectively, of the burned area was affected by fire more than two times in 36 years. The Atlantic Forest, Caatinga, and Pampa presented a different pattern in their fire frequency curve where most of the area (>than 67%) burned only once, and Pampa was the biome where the largest portion of the area burned (84%) by just one fire event. From all the biomes, the Amazon was the one that presented a return interval more than two times over 36 years for most of the area burned, suggesting an altered fire regime in the biome, which is dominated by forest and has an expected average natural fire return interval of from 200 to 1000 years [45].

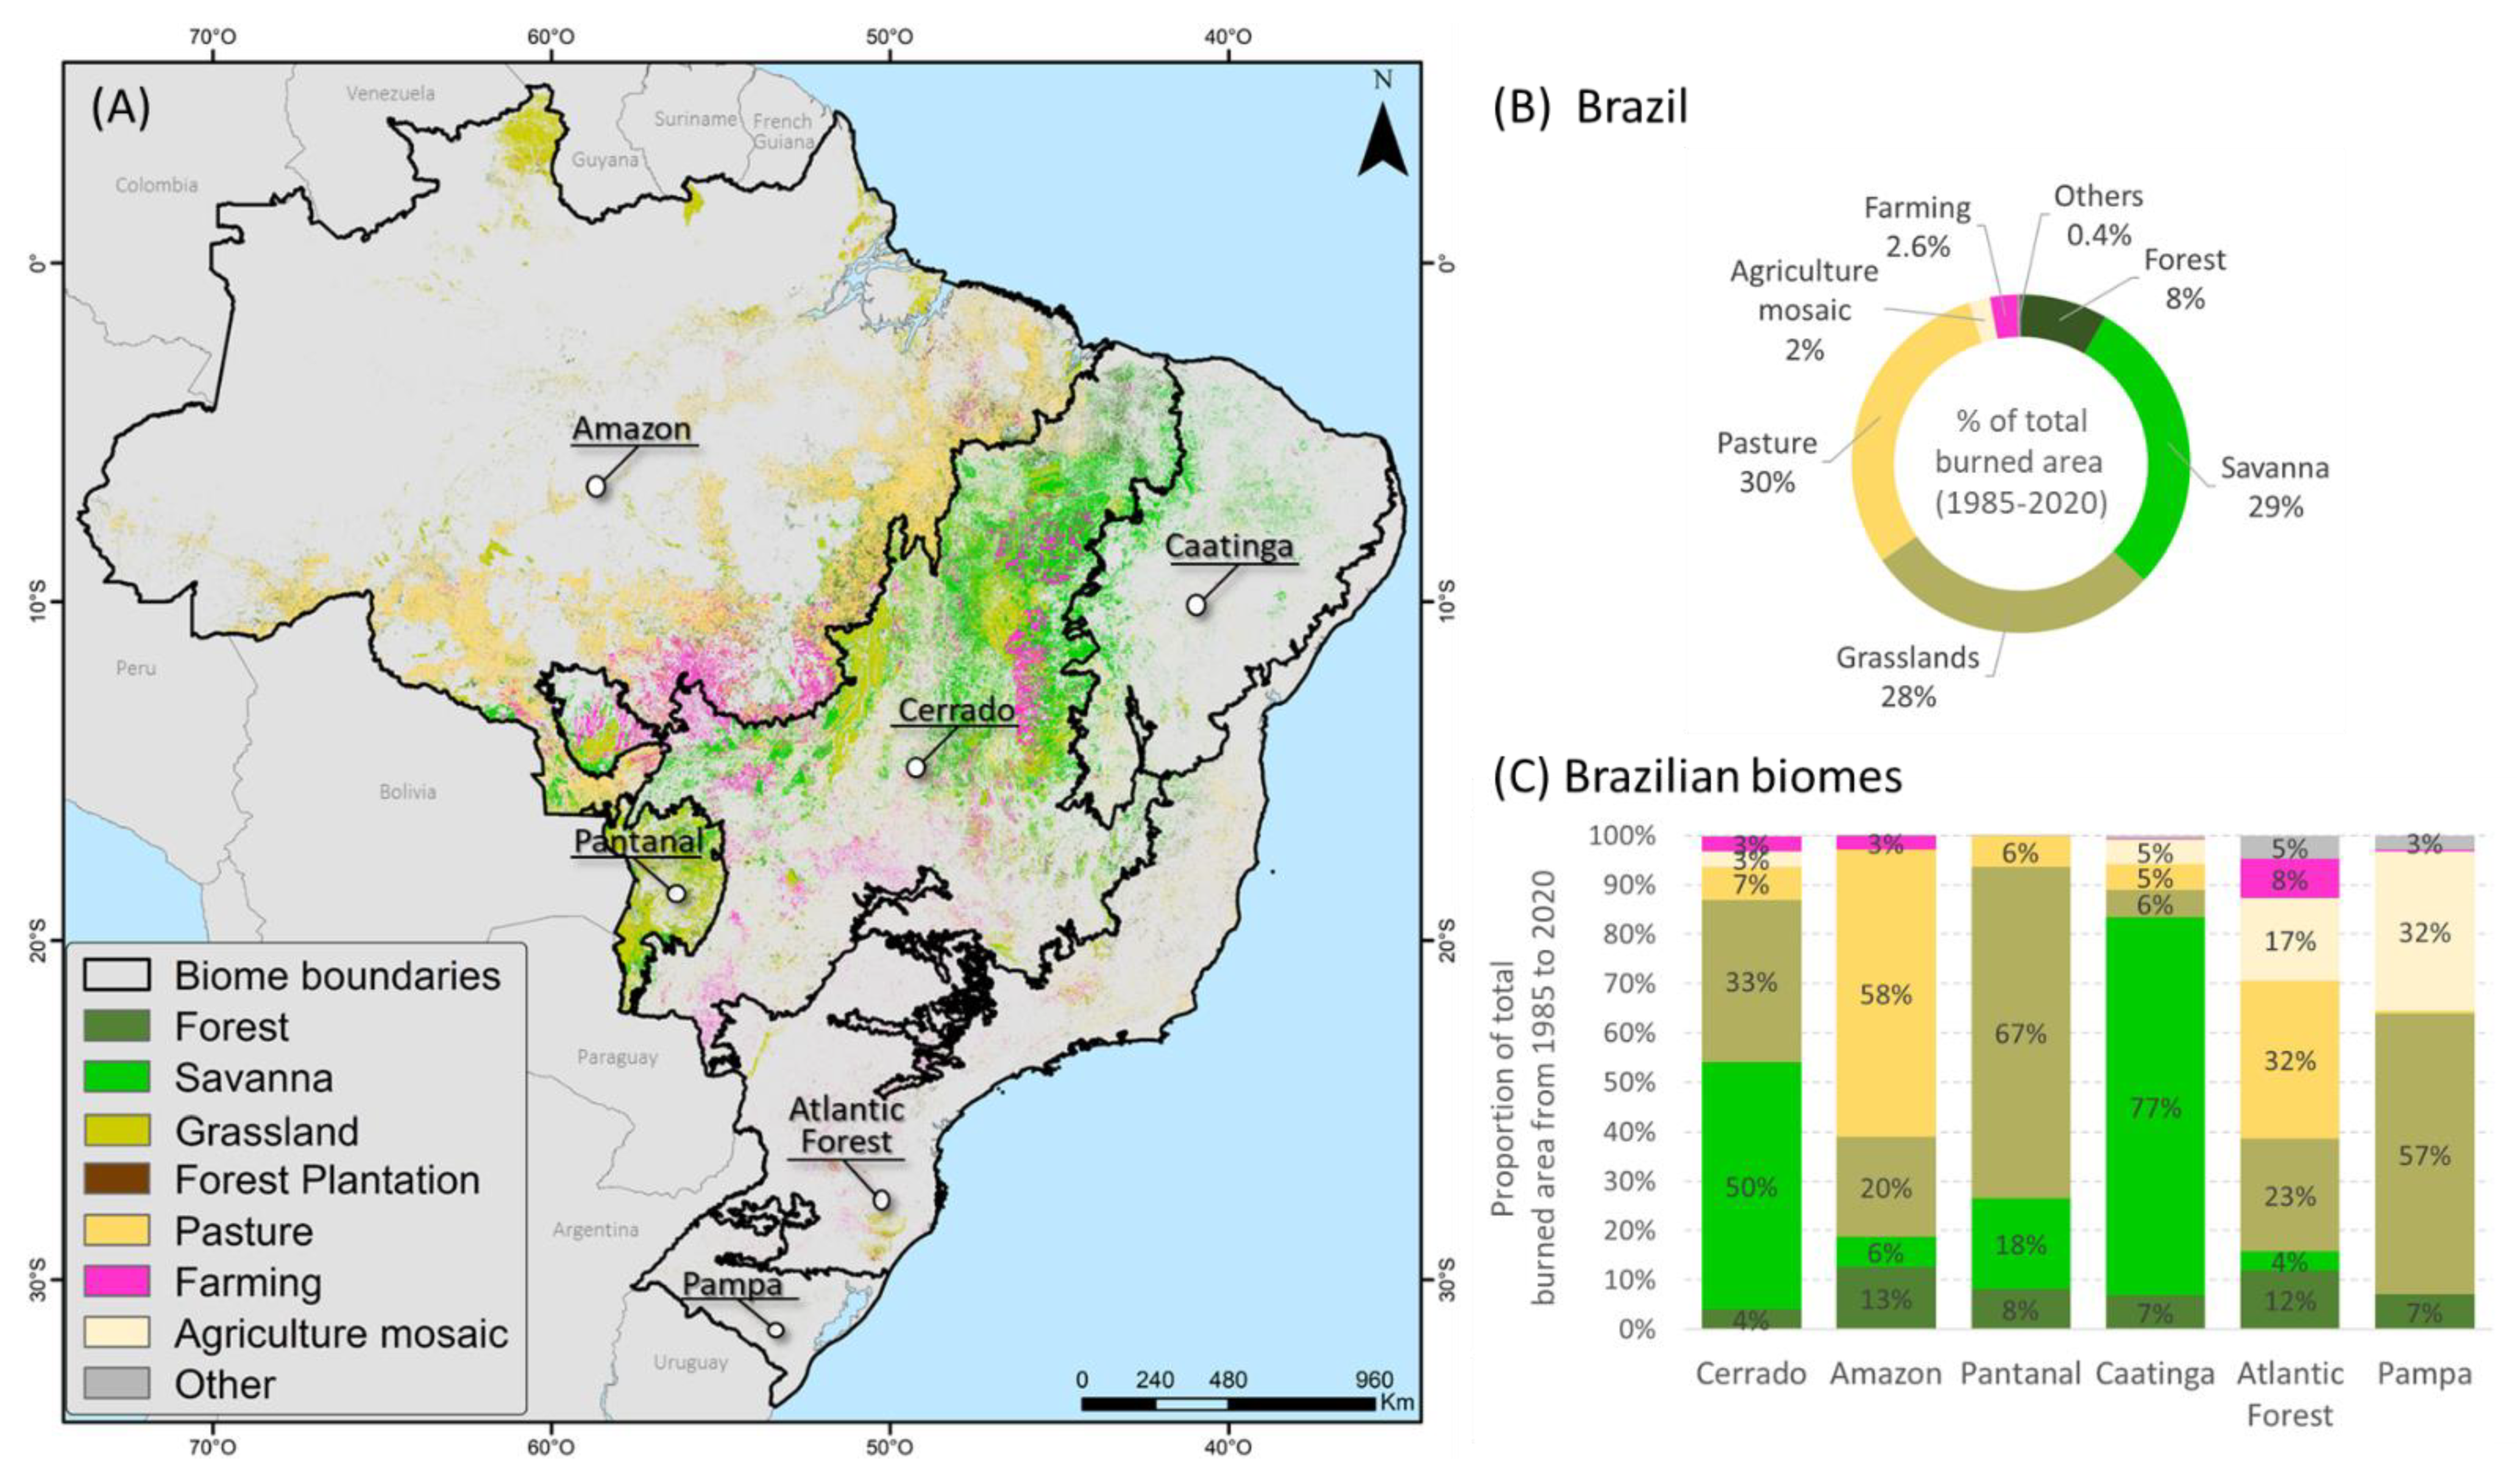
3.5. Burned Area by Land Cover and Land Use Type

The annual burned area maps were overlapped with land use and land cover maps provided by MapBiomas (Collection 6), for their respective years, resulting in the annual burned area for each land use and land cover class (Figure 11). Results demonstrate that the majority (65%) of the fires taking place in Brazil from 1985 to 2020 affected native vegetation classes (Forests, Savannas, and Grasslands). Out of these three native vegetation classes, the fires were detected mainly in Savannas (29%) and Grasslands (28%). Forests comprised 8% of all the area burned from 1985 to 2020 (Figure 11B). The remaining fires (35%) were registered on anthropogenic land use classes (i.e., pasture, croplands, mosaic of agriculture and pasture, and others). Considering anthropogenic land use, most of the burned areas occurred over planted pasture fields (30%), followed by croplands (2.6%), and mosaic of agriculture and pasture with 2%. Other land uses, such as forest plantations, urban areas, among others comprised only 0.4% of the total area burned over time. By 2020, 11% (181,301 km2) of the standing forests in Brazil were burned at least once, as well as 23% (388,201 km2) of savannas, and 16% (274,617 km2) of grasslands.
The distribution of the total area burned varied among biomes. Although most of the burned area took place in native vegetation in the Cerrado, Pantanal, Caatinga, and Pampa, the Amazon, and Atlantic Forest, which are forest-dominated biomes, had most of their total burned area detected in anthropogenic land use classes (Figure 11C). In the Cerrado and Caatinga, the savanna, which is the dominant vegetation type, was the class most frequently burned, with half of the fires happening in this vegetation type in the Cerrado biome, and 77% in Caatinga. The same pattern was observed in the Pantanal and Pampa, which are dominated by grasslands, and this was the land cover class most frequently burned over time, with 67% and 57%, respectively. Pastures burned more often in the Amazon and Atlantic Forest, representing 58% and 32% of the total area burned over 36 years in these biomes, respectively. Out of all biomes, the ones that showed the largest portions of their standing native vegetation affected by fire by 2020 were the Pantanal, Cerrado, and Caatinga. In the Cerrado, 44% (474,229 km2) of the standing native vegetation in 2020 burned at some point in the 36 years of analysis. In the Pantanal this estimate was 61% (73,331 km2), in Caatinga it was 12% (64,083 km2), 6% in the Amazon (211,070 km2), 6% in the Atlantic Forest (19,924 km2), and 2% in the Pampa (1482 km2).
The annual pattern of burned area by land use and cover type varied over time in Brazil. The classes in which the burned area varied the most over the period of analysis were savanna, pasture fields, and grasslands, followed by forest (Figure 12 and Figure S13). During the period of analysis, the mean area burned on a yearly basis for savanna was 42,952 km2 (±16,186 km2), for pasture it was 38,159 km2 (±13,824 km2), for grasslands it was 41,707 km2 (±10,762 km2), and for forest was 18,443 km2 (±8412 km2) (Table 3). In general, the native vegetation classes were the ones that faced a greater increase in area burned in peak years (e.g., 1987, 1998, 2007, 2010, 2012, 2017) (Figure 12).
The variability of fire among distinct land uses and cover classes over time followed a different pattern. In the Amazon, the burned area was relatively stable in the native vegetation classes, but highly variable in the pasture class (Figures S14 and S15). In the Cerrado, the highest variability in burned area was found in the savanna and grasslands native vegetation classes. Grassland was also the class with highest variation in the Pantanal and Pampa biomes, while savanna showed greater variation in Caatinga. Out of all the biomes, the Atlantic Forest was the one that presented the highest variability in annual burned area among almost all native vegetation and anthropogenic classes, with an emphasis on pasture (Figures S14 and S15).

4. Discussion

4.1. Novel Strategy for Mapping Temporal Dynamics of Burned Area in the Brazilian Biomes

Mapping the long-term temporal dynamics of burned areas is challenging, especially when performed on a semi-continental scale and considering ecosystems with different fire regimes and a diversity of land uses and landscape characteristics that are either more prone or sensitive to fire. The ephemeral characteristics of the fire scars left on satellite imagery are a complicator for burned area detection. Depending on the frequency of the observation, it is possible to miss the fire spectral signature on the landscape [25]. Examples include fire in pasture fields and grasslands whose burned area spectral signature disappear within a few weeks [75]. Additionally, seasonality plays an important role in temporally changing the spectral information of a burned scar, creating artificial signals that confound the dry signals of SWIR 1 and SWIR 2 channels in the arid areas during the dry season, with the spectral responses from ashes that also present lower reflectance signals in the water sensitive channels [76]. Seasonality also implies restrictions for mapping fire scars when dealing with intra-annual detection [27]. Thus, parameters for the classification detection models need to be readjusted for each region and over time, increasing the time effort dedicated for collecting training samples for the classification.
The strategy for creating an annual quality mosaic based on the spectral information retrieved from the pixels with minimum NBR extracted from all the available pixel observation in a year, helped to reduce the amount of data and time of processing, the cost of storage in the google cloud bucket, and the efforts of collecting training samples in several images for all the years. Moreover, since the date of each pixel with minimum NBR was registered in the quality mosaic, using that information to retrieve the monthly burned area dataset after the classification was found to be a more efficient strategy for generating intra-annual burned area data than classifying every single available image over the year. Finally, the creation of a reduced but robust spectral dataset capable of encompassing important spectral information to distinguish burned from unburned areas in contrasting vegetation covers and land uses was the asset needed for easy handling with artificial intelligence and a deep learning strategy. This facilitated the training and recognition of burned area patterns with less effort. In addition, the burn pattern easily identified in the false color composites annual quality mosaics, helped in the evaluation and validation of the burned area final maps. Although there is a small gain in mapping fire scars using single images (1,2%), it is less cost effective than mapping burned areas using the annual quality mosaic for longer time series and larger areas. These advantages suggest that using reduced temporal spectral data to generate annual quality mosaics represents a novel and useful strategy for mapping ephemeral and complex phenomena, such as burned area in distinct biomes with complex land use landscapes and overtime.

4.2. Classification Challenges and Comparisons with Other Burned Areas Products

The average overall accuracy of burned areas revealed satisfactory (89.35%) burned area maps, with more omission than commission errors, indicating a conservative extent of the area burned over time for this collection dataset. Part of the omission errors were associated with the difficulty in mapping lower intensity of understory fires, mainly in the Amazon biome, and the ability to close patches mapped as unburned within complex shape fire scars in these areas and in areas with more apparent exposed soils (e.g., grassland vegetation with exposed soils or rocky outcrop, mining). Most of the commission errors were associated with annual crop fields (e.g., soy, cotton, sugarcane) covered with the remaining dry material from the harvest, and the signal from wetlands and humid areas (e.g., dry lagoons). Strategies to improve the overall accuracy and reduce both omission and commission errors include, for example: increasing the number of classification subregions, mostly for the Amazon, to reduce the variability of the burned vs. unburned spectral sampling information to smaller areas that are more coincident on vegetation types, land use dynamics, and environmental characteristics. Additionally, distinct classifications and sampling collections for forest and non-forest areas, are also in the list of follow-up improvements for Collection 2 of this dataset.
Even though this method (named here as MapBiomas Fire Collection 1) presented an advance in burn scar mapping, there were limitations associated with the temporal availability of Landsat observations also causing omissions in mapping burn scars. A comparison with other burned area products, such as GABAM [35] and Modis MCD64A1 Collection 6 [32], revealed the limitations associated with the low availability of the Landsat data per month to map fire scars (i.e., offering new observations in a minimum of every 16 days). From all the products, GABAM was the one with less burned area mapped, followed by Modis MCD64A1, and the results from this work (MapBiomas Fire Collection 1). The MCD64A1 product had lower correspondence with MapBiomas Fire Collection 1 due to its higher frequency of observation (i.e., observations twice a day), in comparison with Landsat observation at least once or twice a month. The Modis product also captured extensive burned areas mainly in forests and pasture fields [77], while MapBiomas Fire Collection 1 performed better in mapping small burns in forest and pasture fields. In general, a portion of the omission identified in MapBiomas Fire Collection 1, was associated with the lack of spectral signal from the burned area in the Landsat images due to fewer observations. The comparison with GABAM, which has the same spatial and temporal resolution, revealed a much higher correspondence with MapBiomas Fire. GABAM omitted more area burned in comparison with MapBiomas Fire Collection 1, although there were some areas identified as burned in GABAM that did not appear in the MapBiomas Fire annual quality mosaic. This is possibly associated with GABAM using more than one Landsat sensor observation in a year (Landsat 5 and 7), while we used just one satellite at a time. All these comparisons indicate that even with fewer observations we mapped more fires than a similar product, and mapped fires that were omitted from products with higher temporal frequency of observation.

4.3. Dynamics of Fire in the Brazilian Biomes

The expansion of human activities has greatly impacted fire regimes in Brazilian biomes [5]. The spatial and temporal distribution of burned areas is directly associated with land use change dynamics and with anthropogenic climate change, both playing important synergic roles in altering fire regimes [78]. If, on one hand, fire is used as the human source of ignition for deforestation and for management (i.e., removing weeds and renewing forage) of planted or native grazing lands [1,8,54,55,79], on the other, fire also responds to climate extremes and vegetation flammability including its natural level of adaptation and sensitiveness to burn [21,30,57,80]. The interrelationship between land use change, fire ignition, and climate boosts the spread of fires to areas not intended to burn [47,81,82,83]. Examples include escaped fires from recently deforested area or managed pasture to bordering native vegetation, causing wildfires, with the extent and frequency of these fires being directly related with climatic conditions and the type of vegetation affected (e.g., forest, savanna or grassland) [55,84]. Although forests in Brazil are sensitive to fire, the extent and direction of fire spreading inside the forest depends on the level of degradation, frequency, and interval of previous disturbances [9,85]. In ecosystems dominated by savanna and grasslands fires can spread fairly quickly because they are more responsive to the type of available fuel material and climate conditions [80,86,87].
The extent of the area burned is a direct response to political and economic incentives to ignition from land use change (e.g., deforestation), and fire use (e.g., pasture management) and their interaction with favorable climatic conditions and the vegetation structure affecting the Brazilian biomes. Accelerated rates of land use change in the past four decades (36 years) have been responsible for the conversion of 0.82 million km2 of Brazilian native vegetation [50], which represent about half of the cumulative area burned in Brazil in the same period (1.67 million km2). Out of all land uses, pasture fields are dominant in Brazil [43,88], and an important source of ignition [75,79], constituting nearly one-third (30%) of the burned area. Another relevant proportion (57%) of the burned area affected fire-dependent native vegetations (savannas and grasslands), whose source of ignition was their natural responses to climate and the increase in escaped human ignition from land uses. The expansion of deforestation, pasture fields, and increased fire activities are largely concentrated in the Cerrado and the Amazon biomes [43,77,89], which, together, accounted for 85% of the area burned over 36 years. These and other biomes respond differently to increases in human ignition sources from deforestation and management, depending on their natural ability to cope with fire activity and respond to altered fire regimes.
The Cerrado is the biome with the largest extent of area burned in Brazil. Burning an area of 67,833 km2/year, which is nine times larger than the mean annual deforestation in the last decade, the biome faces altered fire regimes [86]. With the rapid replacement of natural vegetation and pasture fields by intensive and mechanized agriculture [89], the natural fire regime in the Cerrado has been changed to more frequent intervals (from 1 to 4 years). The size of fire scars is increasing over many regions of the biome [90]. The synergistic effects of fire with the hotter and drier climate already affecting the Cerrado [91], can increase the chances of more frequent catastrophic fire events. The altered fire regime results in consequences for the natural vegetation, such as high mortality rates of woody species, reduction in the number of seedlings under development and increase in herbaceous vegetation, which can also alter the functioning of the ecosystem, the flow of water and carbon [80]. Fire frequency affects the fuel content and promotes change in fire behavior in the biome [92]. High frequencies of fires also lead to impoverishment of the ecosystem, exclusion of sensitive species, reduction in the stock of nutrients and biomass in the tree and shrub layer [93]. Lower to zero-fire frequencies bring negative impacts to Cerrado fire adapted vegetation [14]. A balance between fire practices with Integrated Fire Management strategies in Cerrado is crucial for improving conservation of the biome and reducing the late dry season wildfires [58].
Of all the Brazilian biomes, the Amazon has had its fire regime altered the most. The Amazon rainforest has a rare natural fire return interval [45]. The humid microclimate and thinner tree barks are some of the characteristics that make the Amazon forest more sensitive to fire [46]. However, 41.3% of Brazilian fires burned in the Amazon over the past 36 years, affecting an area up to five times larger than deforestation each year. The fire frequency curve indicates return intervals in the region similar to those of biomes that are ecologically adapted to fire, such as Cerrado and Pantanal. Fire is also burning more, in larger patches and at high intensities [9]. This change in fire regime is a consequence of the higher rates of deforestation, forest fragmentation, and instances of fire being used mainly for pasture management [85]. The Brazilian Amazon holds the largest area (37%) of pasture fields in Brazil [50], a land use that has also been used in recent years as a land speculation strategy [94]. Results of increasing human ignition in the Amazon from deforestation and land management point to even more altered fire regimes in the region given that the probability of escaped fires from agriculture fields has also increased impacting the forest and leaving it more prone to recurrent fires [12]. An altered fire regime due to land-use and climate interactions in the Amazon impacts biodiversity [16], forest structure and carbon pools [23,95,96]. It also generates economic losses due to impacts on environmental services, agriculture and forestry production, and human health [19,97,98]. In extreme dry years, such as El Nino, wildfires burn a large area in the Amazon forests and become major sources of carbon emissions [20,99,100]. Climate change has already potentialized extreme droughts, where the Amazon is already facing longer, warmer, and dryer fire seasons [101], creating the perfect conditions for fire to be perpetuated in a landscape that is becoming more fire sensitive [12,102].
The Pantanal was the biome most affected by fire proportionally in the past 36 years. The biome has a history of fire associated with the flood pulses and the management of natural fields [7]. The increase in periods of drought and the decrease in water levels make the Pantanal more susceptible to fire occurrence [103]. Wet periods and high flooding favor the development of herbaceous, shrub, aquatic, and semi-aquatic plants that accumulate biomass [104]. When the dry period arrives, this dry vegetation becomes fuel for the fire. The combination of anthropogenic use of fire in a dry environment with the occurrence of strong winds, can enable any fire source to spread uncontrollably in large and intense human-caused fires [105]. The year 1999 had the largest burned area recorded, followed by 2020, when the last extensive burned area was mapped in the biome. The 2020 fires burned large forest areas that had not burned since the beginning of the time series. It is necessary to assess the conditions under which areas with a high incidence of fire are found, especially in relation to the conservation and preservation of the biodiversity of fauna and flora species [106]. The recurrence of fires in the Pantanal is a worrying factor even for a fire dependent ecosystem, since the drought periods have become longer and the flood cycles shorter [56]. Climate change, with extreme climate events between flood and drought, can potentially increase these catastrophic fires in Pantanal leading to an altered and more frequent fire regime [57].
The level of land use consolidation is also important for understanding how fires interact with the landscape. The Atlantic Forest was highly deforested and fragmented [10]. It is the biome with the smallest proportion of standing native vegetation and an old and consolidated agriculture frontier compared to other biomes [107]. It is a fire sensitive biome with dominant very low frequencies of fire affecting the same place, with fires covering small patches and burning more anthropogenic land uses, mostly in areas covered by pasture (58.4% of the fire scars burned non-native vegetation, of which 31.9% was pasture fields). Analyzing the history of these 36 years, a considerable decrease was observed in the total area burned for the Atlantic Forest from 2003 onwards. This reduction may be partly associated with regulations for burning of sugarcane in the state of SP (law n°11.241/2002), which advocates the gradual elimination of this practice in the plantation areas [74].
The Caatinga biome is dominated by arid climatic conditions where fires should be naturally rare [3]. However, the increasing use of fire by the local population has contributed to the degradation of Caatinga ecosystems, sometimes enhancing processes, such as desertification [11,108]. Fire is a technology used by small farmers, who follow traditional methods, where people depend on biomass as a primary source of energy [5]. Simulation studies estimate that natural regeneration after anthropogenic fires requires a time gap of at least 50 years in order to regenerate the Caatinga biomass stock to a level closer to that prior to cutting or fire disturbance [11]. Catastrophic fires can also affect forests in the Caatinga, with vegetation affected by a severe fire taking longer to regenerate and can transform the biome into a fire-sensitive system [5,49].
The occurrence or fire scars in the Pampa biome is a phenomenon of minor dimension when compared to other Brazilian biomes. In general, fires have a very small extension, which often makes their detection difficult, and their rate of recurrence at the same site is very low [8]. Several factors seem to contribute to this pattern, especially the fact that the climate in the biome is subtropical and lacks a dry season, which maintains the vegetation and soil moist most of the year. Additionally, the remaining grassland vegetation predominates in sites with shallow soils, under constant cattle use, which contributes to the lower accumulation of flammable biomass [109]. Burning is still used as a management practice in agriculture but on a small scale, either to stimulate the renewal of the aerial biomass of natural pastures at the end of winter, or as a method of preparing areas for agricultural crops [110]. In rainfed crops, burning no longer takes place since the cultivation system changed from the conventional system to a direct planting system, in which the dry biomass is incorporated into the soil. In paddy rice cultivation, because it takes place predominantly in humid floodplains, the risk of fire is accidental and active burning of crop residual matter is practically nonexistent. Although the use of fire to exclude shrub species to manage grassland vegetation is still used in the countryside, this is a less common practice nowadays, and has been progressively replaced by mechanical clearing, as current legislation limits the use of fire for this purpose. Small patches of forest, especially on the edges, are occasionally burned for small-scale farming.
Even though the extent of the burned area responds positively to the level of adaptation of a biome to fire and its interaction to extreme drought events caused by the climatic phenomena (e.g., El Nino, AMO, NAO) [21,57,111], the general trends of the area burned also responded to the political context, creating a stimulus for humans to start the fire [47,55,56,81]. Considering the negative effects of modified fire regimes over native vegetation and the increase in human ignition activities, policies that either controls fire use or regulates fire management activities are fundamental [58,112]. The law for Protection of Native Vegetation (Article 38 of Law 12,561) prohibits the use of fire applied to vegetation, except for fires conducted for research purposes and in the context of agriculture and silviculture management. Although the fire exclusion policy aims to protect the fire sensitive ecosystems, such as forest formations, this policy has been shown to be unsuitable for fire-dependent ecosystems, such as savanna and grassland formations [4,13,86,113]. Over the past decades, several modifications have been reported in the fire regimes of the Cerrado, including higher fuel-loads and wildfires due to midterm fire absence and woody encroachment in areas with long-term fire absence [114]. The Integrated Fire Management Law (Law 11,276/18), currently under discussion in the Brazilian Congress, aims to solve the problem of banning fire in biomes that need fire management. Even with these laws, policies to reduce deforestation and support better practices in agriculture are crucial for reducing fire ignition over the landscape. Without this reduction it will be difficult to control the ongoing changes in fire regimes of Brazilian biomes, which can be even exacerbated in the context of climate emergency.

5. Conclusions

This study is the first of its kind in combining remote sensing based annual quality mosaics and deep learning algorithm to create a long time series of annual and monthly burned areas for Brazilian biomes. To handle the large dataset of 36 years of Landsat observations we used Google Earth Engine Platform and Deep Neural Network algorithms to differentiate spectral signatures of burned and unburned areas and capture the ephemeral dynamics of fire scars in diversity landscapes. We used a novel approach to reduce annual spectral Landsat data into a single annual mosaic selecting spectral information of the pixels that presented minimum NBR within all available observation in a year. This strategy made the training and classification processes less costly in terms of processing time and storage, adequately capturing the extent of the area burned in Brazil, and even confronting all the challenges related to seasonality, confusion with spectrally similar targets (e.g., humid soils, wetlands, post-harvest crop areas, mining) and the size of the dataset. We acquired a conservative estimate of burned area but one with high overall accuracy, which was compatible with the type and frequency of the data available (e.g., higher spatial and lower temporal resolutions compared with the large-scale burned area datasets available). Other improvements for the upcoming MapBiomas Fire Collection 2.0 include increasing the number of classification regions, increasing the number of bands and spectral indices in the DNN model, and separating models to classify burned areas on native vegetation from burned areas on pasture and crop fields. These improvements are likely to reduce errors of omission from understory forest fires and commission errors from some of the crop fields and wetlands.
The burned area dataset created from this effort revealed that at least 19.6% of the Brazilian territory was burned at least once from 1985 to 2020. The majority of these areas (61%), burned more than two times in the period of analysis. Most fires in Brazil (83%) are active in the Cerrado and Amazon, but other biomes had important contribution and increases in fire activities and extent of burned area in the past decades. For some of the biomes the higher fire frequencies point to altered fire regimes that are a response to increase in human ignition and climate change. The Amazon is the most alarming of these biomes with a fire frequency distribution similar to that of biomes that are adapted to fire, such as Cerrado and Pantanal. The Cerrado is the biome with large area burned and is facing increasing in anthropogenic fires. The Pantanal is the biome with higher proportion of burned area, while the Caatinga is facing more fires than usual in relation to its semi-arid natural system and the Pampa has faced land use fire exclusion practices in natural grassland systems, which may impact the occurrence of future catastrophic fires.
Beyond indicating changes in fire regimes, the long timeseries of burned areas for Brazil can be useful for estimating the level of native vegetation degradation and its associated carbon emissions, for quantifying the extent of social and environmental impacts, including biodiversity, agriculture, human health, and ecosystem functions, and for indicating areas with a higher risk of being burned in the future. All these uses are fundamental for informing public policies and indicating the priority areas for fire management and planning fire control activities.

Supplementary Materials

The following are available online at https://0-www-mdpi-com.brum.beds.ac.uk/article/10.3390/rs14112510/s1, Figure S1. Regions defined for each biome in Brazil used to collect training samples and classify burned areas for MapBiomas Fire Collection 1; Table S1. Landsat satellites spectral bands used as predictors for burned area classification; Figure S2. (A) Example of the annual quality mosaic (RGB SWIR-1, NIR, RED) created with spectral information retrieved from the minimum NBR pixels in a year used to perform the burned area classification. Note that this image addresses all the burned areas detected in the monthly mosaics from (B) January to (M) December; Figure S3. Variation of NBR value extracted from the quality mosaic between burned and unburned areas by land use and cover by biome. Burned (red boxes) represents the immediately post-fire reflectance values, and unburned (green boxes) represents the reflectance value in a specific year; Figure S4. (A) Concentration of burned scar from the MCD64A1 Burned Area from 2000 to 2020 by Landsat path and row; and (B) concentration of active fire pixels from the AQUA_M-T (Sensor MODIS) from 2000 to 2020 by Landsat path and row; Figure S5. (A) Proportion of burned and unburned training pixels sampled by year; and (B) Number of burned and unburned training pixels sampled by year; Figure S6. Architecture of the Multi-Layer Perceptron Network, where the input layers are the spectral bands (RED, NIR, SWIR1 and SWIR2) and the output layers are the classes burn and unburn; Table S2. List of Google Earth Engine scripts used for the construction of annual quality mosaics, the collection of training samples, the classification of burned area, and the MapBiomas Collection 1 burned area dataset; Table S3. Classes of land use and cover used to mask and remove the committed errors of burned area mapping from the classification results by biome; Table S4. Total sampling units (grid cells of 2 km × 2 km) by biome and year used for validation; Figure S7. Strategy used to create the validation sampling dataset. (A) in a grid of 2 × 2 km we run a segmentation routine, (B) the burned segments were selected manually and classified as burned (yellow polygon) and unburned; and (C) a centroid of each polygon was created and used to generate the final validation dataset; Table S5. Confusion for the classification of burned area in Brazil for the year 2007 with user’s accuracy, producer’s accuracy, commission and omission errors; Table S6. Confusion for the classification of burned area in Brazil for the year 2011 with user’s accuracy, producer’s accuracy, commission and omission errors; Table S7. Confusion for the classification of burned area in Brazil for the year 2019 with user’s accuracy, producer’s accuracy, commission and omission errors; Table S8. Comparisons between mapping burned areas in individual scenes and the annual quality mosaic for 15 Landsat Path/Row sorted in the Amazon and border of Cerrado for the year 2015; Figure S8. Mean proportion of area burned retrieved from the spatial comparison between Modis MCD64A1 burned area product [32], MapBiomas Fire Collection 1 burned area (this dataset), and GABAM burned area [35] for the year 2005, 2010, 2018. (A) mean burned area mapped only in MCD64A, mean burned area coincident in both MCD64A1 and MapBiomas Fire, and mean burned area mapped only in MapBiomas Fire; (B) mean burned area mapped only with MCD64A1, mean burned area coincident in both MCD64A1 and GABAM, and mean burned area mapped only in GABAM; (C) mean burned area mapped only in GABAM, mean burned area coincident in both GABAM and MapBiomas Fire, and mean burned area mapped only in MapBiomas Fire; Table S9 Annual burned area (km2) by biome from 1985 to 2020; Figure S9. Cumulative burned area by biome from 1985 to 2020; Figure S10. Distribution of annual burned area from MapBiomas Fire Collection 1 and annual deforestation rate from Prodes-INPE [115] for the Amazon biome; Figure S11. Seasonal patterns of fire events occurred within Brazil’s biomes, considering variation in burned area per month, in the period (1985–2020). In red the fire season months from July to October; Figure S12. Frequency pattern of the burned area between the years 1985 to 2020 by Brazilian biome, and their respective proportion of burned area; Figure S13. Variance on burned area by land cover and use for Brazil between 1985 and 2020; Figure S14. Annual distribution of burned area by land use and land cover by biome from 1985 to 2020; Figure S15. Variance of annual burned area by land use and cover classes from 1985 to 2020 for the Brazilian biomes. References [32,35,50,66,67,107,115,116,117,118] are cited in the supplementary materials.

Author Contributions

Conceptualization, A.A.C.A. and V.L.S.A.; methodology, A.A.C.A., V.L.S.A., V.J.P., W.V.d.S., M.R.R. and W.F.-R.; validation, A.A.C.A., V.L.S.A., N.C.F., N.V.R. and L.F.M.M.; formal analysis, A.A.C.A.,V.L.S.A., W.V.d.S., D.E.C., D.P.C., L.F.M.M., S.G.D., S.M.B.d.S., N.C., N.C.F., M.R.R., E.R.R., H.H. and E.V.-M.; investigation, A.A.C.A., V.L.S.A., W.V.d.S., L.F.M.M., S.G.D., S.M.B.d.S., N.C., N.C.F., M.R.R., E.R.R., H.H. and E.V.-M.; writing—original draft preparation, A.A.C.A. and V.L.S.A.; writing—review and editing, A.A.C.A., V.L.S.A., D.E.C., L.F.M.M., J.Z.S., S.G.D., S.M.B.d.S., N.C., M.R.R., E.R.R., N.C.F., H.H. and E.V.-M.; visualization, A.A.C.A.,V.L.S.A., W.V.d.S. and D.E.C.; supervision, A.A.C.A.; project administration, A.A.C.A.; funding acquisition, A.A.C.A. All authors have read and agreed to the published version of the manuscript.

Funding

This research was conducted by the MapBiomas Initiative. It was financed by Instituto Clima e Sociedade (ICS) Grant Number 20-00740, and Norway’s International Climate and Forest Initiative- NICFI through Arapyau Institute Grant Number CT-615.

Data Availability Statement

The dataset supporting reported results can be found at https://mapbiomas.org/, accessed on 4 April 2022 and https://code.earthengine.google.com/b7acee0bff17a6bf2d1136695ed399bc, accessed on 4 April 2022.

Acknowledgments

The authors would like to thank the MapBiomas team and Google Earth Engine for providing access to the Landsat cloud processing. The authors are grateful to Arapyau Institute, Instituto Clima e Sociedade and NICFI for their support.

Conflicts of Interest

The authors declare no conflict of interest. The funders had no role in the design of the study, in the collection, analysis, or interpretation; in the writing of the manuscript, or in the decision to publish the results.

References

  1. Bowman, D.M.J.S.; Balch, J.; Artaxo, P.; Bond, W.J.; Cochrane, M.A.; D’Antonio, C.M.; Defries, R.; Johnston, F.H.; Keeley, J.E.; Krawchuk, M.A.; et al. The human dimension of fire regimes on Earth. J. Biogeogr. 2011, 38, 2223–2236. [Google Scholar] [CrossRef] [PubMed] [Green Version]
  2. Bowman, D.M.J.S.; Balch, J.K.; Artaxo, P.; Bond, W.J.; Jean, M.; Cochrane, M.A.; Antonio, C.M.D.; Defries, R.S.; Doyle, J.C.; Harrison, P.; et al. Fire in the Earth System. Science 2009, 324, 481–484. [Google Scholar] [CrossRef] [PubMed]
  3. Shlisky, A.; Alencar, A.; Manta, M.; Curran, L.M. Overview: Global fire regime conditions, threats, and opportunities for fire management in the Tropics. In Tropical Fire Ecology; Cochrane, M.A., Ed.; Springer: New York, NY, USA, 2009; pp. 65–83. ISBN 9783540773818. [Google Scholar]
  4. Berlinck, C.N.; Batista, E.K.L. Good fire, bad fire: It depends on who burns. Flora Morphol. Distrib. Funct. Ecol. Plants 2020, 268, 151610. [Google Scholar] [CrossRef]
  5. Pivello, V.R.; Vieira, I.; Christianini, A.V.; Ribeiro, D.B.; da Silva Menezes, L.; Berlinck, C.N.; Melo, F.P.L.; Marengo, J.A.; Tornquist, C.G.; Tomas, W.M.; et al. Understanding Brazil’s catastrophic fires: Causes, consequences and policy needed to prevent future tragedies. Perspect. Ecol. Conserv. 2021, 19, 233–255. [Google Scholar] [CrossRef]
  6. Behling, H.; Pillar, V.D.P.; Orlóci, L.; Bauermann, S.G. Late Quaternary Araucaria forest, grassland (Campos), fire and climate dynamics, studied by high-resolution pollen, charcoal and multivariate analysis of the Cambará do Sul core in southern Brazil. Palaeogeogr. Palaeoclimatol. Palaeoecol. 2004, 203, 277–297. [Google Scholar] [CrossRef]
  7. de Oliveira, M.T.; Damasceno-Junior, G.A.; Pott, A.; Paranhos Filho, A.C.; Suarez, Y.R.; Parolin, P. Regeneration of riparian forests of the Brazilian Pantanal under flood and fire influence. For. Ecol. Manag. 2014, 331, 256–263. [Google Scholar] [CrossRef]
  8. Overbeck, G.E.; Scasta, J.D.; Furquim, F.F.; Boldrini, I.I.; Weir, J.R. The South Brazilian grasslands—A South American tallgrass prairie? Parallels and implications of fire dependency. Perspect. Ecol. Conserv. 2018, 16, 24–30. [Google Scholar] [CrossRef]
  9. Alencar, A.A.; Brando, P.M.; Asner, G.P.; Putz, F.E. Landscape fragmentation, severe drought, and the new Amazon forest fire regime. Ecol. Appl. 2015, 25, 1493–1505. [Google Scholar] [CrossRef]
  10. Scarano, F.R.; Ceotto, P. Brazilian Atlantic forest: Impact, vulnerability, and adaptation to climate change. Biodivers. Conserv. 2015, 24, 2319–2331. [Google Scholar] [CrossRef]
  11. Althoff, T.D.; Menezes, R.S.C.; de Carvalho, A.L.; de Siqueira Pinto, A.; Santiago, G.A.C.F.; Ometto, J.P.H.B.; von Randow, C.; de Sá Barretto Sampaio, E.V. Climate change impacts on the sustainability of the firewood harvest and vegetation and soil carbon stocks in a tropical dry forest in Santa Teresinha Municipality, Northeast Brazil. For. Ecol. Manag. 2016, 360, 367–375. [Google Scholar] [CrossRef]
  12. Brando, P.M.; Soares-Filho, B.; Rodrigues, L.; Assunção, A.; Morton, D.; Tuchschneider, D.; Fernandes, E.C.M.; Macedo, M.N.; Oliveira, U.; Coe, M.T. The gathering firestorm in southern Amazonia. Sci. Adv. 2020, 6, eaay1632. [Google Scholar] [CrossRef] [PubMed] [Green Version]
  13. Fidelis, A. Is fire always the “bad guy”? Flora Morphol. Distrib. Funct. Ecol. Plants 2020, 268, 151611. [Google Scholar] [CrossRef]
  14. Durigan, G. Zero-fire: Not possible nor desirable in the Cerrado of Brazil. Flora Morphol. Distrib. Funct. Ecol. Plants 2020, 268, 151612. [Google Scholar] [CrossRef]
  15. de Arruda, F.V.; de Sousa, D.G.; Teresa, F.B.; Do Prado, V.H.M.; da Cunha, H.F.; Izzo, T.J. Trends and gaps of the scientific literature about the effects of fire on brazilian cerrado. Biota Neotrop. 2018, 18, 1–6. [Google Scholar] [CrossRef]
  16. Feng, X.; Merow, C.; Liu, Z.; Park, D.S.; Roehrdanz, P.R.; Maitner, B.; Newman, E.A.; Boyle, B.L.; Lien, A.; Burger, J.R.; et al. How deregulation, drought and increasing fire impact Amazonian biodiversity. Nature 2021, 597, 516–521. [Google Scholar] [CrossRef]
  17. De Mendonça, M.J.C.; Vera Diaz, M.D.C.; Nepstad, D.; Seroa Da Motta, R.; Alencar, A.; Gomes, J.C.; Ortiz, R.A. The economic cost of the use of fire in the Amazon. Ecol. Econ. 2004, 49, 89–105. [Google Scholar] [CrossRef]
  18. Morello, T.F. COVID-19 and agricultural fire pollution in the Amazon: Puzzles and solutions. World Dev. 2021, 138, 105276. [Google Scholar] [CrossRef]
  19. Campanharo, W.A.; Lopes, A.P.; Anderson, L.O.; da Silva, T.F.M.R.; Aragão, L.E.O.C. Translating fire impacts in Southwestern Amazonia into economic costs. Remote Sens. 2019, 11, 764. [Google Scholar] [CrossRef] [Green Version]
  20. Alencar, A.; Nepstad, D.; Del Carmen Vera Diaz, M. Forest understory fire in the Brazilian Amazon in ENSO and non-ENSO years: Area burned and committed carbon emissions. Earth Interact. 2006, 10, 1–17. [Google Scholar] [CrossRef]
  21. Aragão, L.E.O.C.; Anderson, L.O.; Fonseca, M.G.; Rosan, T.M.; Vedovato, L.B.; Wagner, F.H.; Silva, C.V.J.; Silva Junior, C.H.L.; Arai, E.; Aguiar, A.P.; et al. 21st Century drought-related fires counteract the decline of Amazon deforestation carbon emissions. Nat. Commun. 2018, 9, 536. [Google Scholar] [CrossRef]
  22. da Silva Junior, C.A.; Teodoro, P.E.; Delgado, R.C.; Teodoro, L.P.R.; Lima, M.; de Andréa Pantaleão, A.; Baio, F.H.R.; de Azevedo, G.B.; de Oliveira Sousa Azevedo, G.T.; Capristo-Silva, G.F.; et al. Persistent fire foci in all biomes undermine the Paris Agreement in Brazil. Sci. Rep. 2020, 10, 16246. [Google Scholar] [CrossRef] [PubMed]
  23. Silva, C.V.J.; Aragão, L.E.O.C.; Young, P.J.; Espirito-Santo, F.; Berenguer, E.; Anderson, L.O.; Brasil, I.; Pontes-Lopes, A.; Ferreira, J.; Withey, K.; et al. Estimating the multi-decadal carbon deficit of burned Amazonian forests. Environ. Res. Lett. 2020, 15, 114023. [Google Scholar] [CrossRef]
  24. Gatti, L.V.; Basso, L.S.; Miller, J.B.; Gloor, M.; Gatti Domingues, L.; Cassol, H.L.G.; Tejada, G.; Aragão, L.E.O.C.; Nobre, C.; Peters, W.; et al. Amazonia as a carbon source linked to deforestation and climate change. Nature 2021, 595, 388–393. [Google Scholar] [CrossRef] [PubMed]
  25. Melchiorre, A.; Boschetti, L. Global Analysis of Burned Area Persistence Time with MODIS Data. Remote Sens. 2018, 10, 750. [Google Scholar] [CrossRef] [Green Version]
  26. Miranda, C.S.; Gamarra, R.M.; Mioto, C.L.; Silva, N.M.; Conceição Filho, A.P.; Pott, A. Analysis of the landscape complexity and heterogeneity of the Pantanal wetland. Braz. J. Biol. 2018, 78, 318–327. [Google Scholar] [CrossRef] [PubMed] [Green Version]
  27. Nogueira, J.M.P.; Rambal, S.; Mouillot, F. Spatial Pattern of the Seasonal Drought / Burned Area Relationship across Brazilian Biomes: Sensitivity to Drought Metrics and Global Remote-Sensing Fire Products. Climate 2017, 5, 42. [Google Scholar] [CrossRef] [Green Version]
  28. Pereira, A.A.; Pereira, J.M.C.; Libonati, R.; Oom, D.; Setzer, A.W.; Morelli, F.; Machado-Silva, F.; de Carvalho, L.M.T. Burned area mapping in the Brazilian Savanna using a one-class support vector machine trained by active fires. Remote Sens. 2017, 9, 1161. [Google Scholar] [CrossRef] [Green Version]
  29. Rodrigues, J.A.; Libonati, R.; Pereira, A.A.; Nogueira, J.M.P.; Santos, F.L.M.; Peres, L.F.; Santa Rosa, A.; Schroeder, W.; Pereira, J.M.C.; Giglio, L.; et al. How well do global burned area products represent fire patterns in the Brazilian Savannas biome? An accuracy assessment of the MCD64 collections. Int. J. Appl. Earth Obs. Geoinf. 2019, 78, 318–331. [Google Scholar] [CrossRef]
  30. Alencar, A.; Asner, G.P.; Knapp, D.; Zarin, D. Temporal variability of forest fires in eastern Amazonia. Ecol. Appl. 2011, 21, 2397–2412. [Google Scholar] [CrossRef]
  31. Morton, D.C.; Le Page, Y.; DeFries, R.; Collatz, G.J.; Hurtt, G.C. Understorey fire frequency and the fate of burned forests in southern Amazonia. Philos. Trans. R. Soc. Lond. B Biol. Sci. 2013, 368, 20120163. [Google Scholar] [CrossRef]
  32. Giglio, L.; Boschetti, L.; Roy, D.P.; Humber, M.L.; Justice, C.O. The Collection 6 MODIS burned area mapping algorithm and product. Remote Sens. Environ. 2018, 217, 72–85. [Google Scholar] [CrossRef] [PubMed]
  33. Lizundia-Loiola, J.; Otón, G.; Ramo, R.; Chuvieco, E. A spatio-temporal active-fire clustering approach for global burned area mapping at 250 m from MODIS data. Remote Sens. Environ. 2020, 236, 111493. [Google Scholar] [CrossRef]
  34. Pessôa, A.C.M.; Anderson, L.O.; Carvalho, N.S.; Campanharo, W.A.; Silva Junior, C.H.L.; Rosan, T.M.; Reis, J.B.C.; Pereira, F.R.S.; Assis, M.; Jacon, A.D.; et al. Intercomparison of burned area products and its implication for carbon emission estimations in the amazon. Remote Sens. 2020, 12, 3864. [Google Scholar] [CrossRef]
  35. Long, T.; Zhang, Z.; He, G.; Jiao, W.; Tang, C.; Wu, B.; Zhang, X.; Wang, G.; Yin, R. 30m resolution global annual burned area mapping based on landsat images and Google Earth Engine. Remote Sens. 2019, 11, 489. [Google Scholar] [CrossRef] [Green Version]
  36. Hawbaker, T.J.; Vanderhoof, M.K.; Schmidt, G.L.; Beal, Y.J.; Picotte, J.J.; Takacs, J.D.; Falgout, J.T.; Dwyer, J.L. The Landsat Burned Area algorithm and products for the conterminous United States. Remote Sens. Environ. 2020, 244, 111801. [Google Scholar] [CrossRef]
  37. Hawbaker, T.J.; Vanderhoof, M.K.; Beal, Y.; Takacs, J.D.; Schmidt, G.L.; Falgout, J.T.; Williams, B.; Fairaux, N.M.; Caldwell, M.K.; Picotte, J.J.; et al. Remote Sensing of Environment Mapping burned areas using dense time-series of Landsat data. Remote Sens. Environ. 2017, 198, 504–522. [Google Scholar] [CrossRef]
  38. Gorelick, N.; Hancher, M.; Dixon, M.; Ilyushchenko, S.; Thau, D.; Moore, R. Google Earth Engine: Planetary-scale geospatial analysis for everyone. Remote Sens. Environ. 2017, 202, 18–27. [Google Scholar] [CrossRef]
  39. Tamiminia, H.; Salehi, B.; Mahdianpari, M.; Quackenbush, L.; Adeli, S.; Brisco, B. Google Earth Engine for geo-big data applications: A meta-analysis and systematic review. ISPRS J. Photogramm. Remote Sens. 2020, 164, 152–170. [Google Scholar] [CrossRef]
  40. Kumar, L.; Mutanga, O. Google Earth Engine Applications Since Inception: Usage, Trends and Potential. Remote Sens. 2018, 10, 1509. [Google Scholar] [CrossRef] [Green Version]
  41. Parks, S.A.; Holsinger, L.M.; Voss, M.A.; Loehman, R.A.; Robinson, N.P. Mean composite fire severity metrics computed with google earth engine offer improved accuracy and expanded mapping potential. Remote Sens. 2018, 10, 879. [Google Scholar] [CrossRef] [Green Version]
  42. Coutinho, L. Biomas Brasileiros; Oficina de Textos: São Paulo, SP, Brazil, 2016. [Google Scholar]
  43. Souza, C.M.; Shimbo, J.Z.; Rosa, M.R.; Parente, L.L.; Alencar, A.A.; Rudorff, B.F.T.; Hasenack, H.; Matsumoto, M.; Ferreira, L.G.; Souza-Filho, P.W.M.; et al. Reconstructing three decades of land use and land cover changes in brazilian biomes with landsat archive and earth engine. Remote Sens. 2020, 12, 2735. [Google Scholar] [CrossRef]
  44. Hardesty, J.; Myers, R.; Fulks, W. Fire, ecosystems, and people: A preliminary assessment of fire as a global conservation issue. Georg. Wright Forum 2005, 22, 78–87. [Google Scholar]
  45. Thonicke, K.; Venevsky, S.; Sitch, S.; Cramer, W. The role of fire disturbance for global vegetation dynamics: Coupling fire into a Dynamic Global Vegetation Model. Glob. Ecol. Biogeogr. 2001, 10, 661–677. [Google Scholar] [CrossRef] [Green Version]
  46. Staver, A.C.; Brando, P.M.; Barlow, J.; Morton, D.C.; Paine, C.E.T.; Malhi, Y.; Araujo Murakami, A.; del Aguila Pasquel, J. Thinner bark increases sensitivity of wetter Amazonian tropical forests to fire. Ecol. Lett. 2020, 23, 99–106. [Google Scholar] [CrossRef] [PubMed] [Green Version]
  47. Brando, P.; Macedo, M.; Silverio, D.; Rattis, L.; Paolucci, L.; Alencar, A.; Coe, M.; Amorim, C. Amazon wildfires: Scenes from a foreseeable disaster. Flora 2020, 268, 151609. [Google Scholar] [CrossRef]
  48. De Abreu, L.P.; Gonçalves, W.A.; Mattos, E.V.; Albrecht, R.I. Geoinformation Assessment of the total lightning flash rate density (FRD) in northeast Brazil (NEB) based on TRMM orbital data from 1998 to 2013. Int. J. Appl. Earth Obs. Geoinf. 2020, 93, 102195. [Google Scholar] [CrossRef]
  49. Dos Santos, S.M.B.; Bento-Gonçalves, A.; Franca-Rocha, W.; Baptista, G. Assessment of burned forest area severity and postfire regrowth in chapada diamantina national park (Bahia, brazil) using dnbr and rdnbr spectral indices. Geosciences 2020, 10, 106. [Google Scholar] [CrossRef] [Green Version]
  50. Mapbiomas Collection 6 of the Annual Series of Land Use and Land Cover Maps of Brazil. 2021. Available online: https://www.mapbiomas.org (accessed on 4 April 2022).
  51. Simmons, C.S.; Walker, R.T.; Wood, C.H.; Arima, E.; Cochrane, M.A. Wildfires in Amazonia: A pilot study examining the role of farming systems, social capital, and fire contagion. J. Lat. Am. Geogr. 2004, 3, 81–95. [Google Scholar] [CrossRef] [Green Version]
  52. Bowman, M.S.; Amacher, G.S.; Merry, F.D. Fire use and prevention by traditional households in the Brazilian Amazon ☆. Ecol. Econ. 2008, 67, 117–130. [Google Scholar] [CrossRef]
  53. Nepstad, D.C.; Moreira, A.G.; Alencar, A.A. Floresta em Chamas: Origens, Impactos e Prevenção do Fogo na Amazonia; Programa Piloto para a Proteção das Florestas: Brasília, Brazil, 1999; 202p.
  54. Eloy, L.; Schmidt, I.B.; Borges, S.L.; Ferreira, M.C.; dos Santos, T.A. Seasonal fire management by traditional cattle ranchers prevents the spread of wildfire in the Brazilian Cerrado. Ambio 2019, 48, 890–899. [Google Scholar] [CrossRef]
  55. Barlow, J.; Berenguer, E.; Carmenta, R.; França, F. Clarifying Amazonia’s burning crisis. Glob. Chang. Biol. 2020, 26, 319–321. [Google Scholar] [CrossRef] [PubMed] [Green Version]
  56. Libonati, R.; DaCamara, C.C.; Peres, L.F.; Sander de Carvalho, L.A.; Garcia, L.C. Rescue Brazil’s burning Pantanal wetlands. Nature 2020, 588, 217–219. [Google Scholar] [CrossRef] [PubMed]
  57. Marengo, J.A.; Cunha, A.P.; Cuartas, L.A.; Deusdará Leal, K.R.; Broedel, E.; Seluchi, M.E.; Michelin, C.M.; De Praga Baião, C.F.; Chuchón Ângulo, E.; Almeida, E.K.; et al. Extreme Drought in the Brazilian Pantanal in 2019–2020: Characterization, Causes, and Impacts. Front. Water 2021, 3, 13. [Google Scholar] [CrossRef]
  58. Schmidt, I.B.; Moura, L.C.; Ferreira, M.C.; Eloy, L.; Sampaio, A.B.; Dias, P.A.; Berlinck, C.N. Fire management in the Brazilian savanna: First steps and the way forward. J. Appl. Ecol. 2018, 55, 2094–2101. [Google Scholar] [CrossRef] [Green Version]
  59. Langford, Z.; Kumar, J.; Hoffman, F. Wildfire mapping in interior alaska using deep neural networks on imbalanced datasets. In Proceedings of the 2018 IEEE International Conference on Data Mining Workshops (ICDMW), Singapore, 17–20 November 2018; pp. 770–778. [Google Scholar] [CrossRef]
  60. USGS Landsat Collection 1 Level-1 Quality Assessment Band. Available online: https://www.usgs.gov/landsat-missions/landsat-collection-1-level-1-quality-assessment-band (accessed on 1 January 2022).
  61. Key, C.; Benson, N. Landscape assessment: Remote sensing measure of severity: The normalized burn Ratio. In FIREMON: Fire Effects Monitoring and Inventory System; General Technical Report; RMRS-GTR-164-CD:LA1-LA51; USDA Forest Service, Rocky Mountain Research Station: Ogden, UT, USA, 2006. [Google Scholar]
  62. Roy, D.P.; Boschetti, L.; Trigg, S.N. Remote Sensing of Fire Severity: Assessing the Performance of the Normalized Burn Ratio. IEEE Geosci. Remote Sens. Lett. 2006, 3, 112–116. [Google Scholar] [CrossRef] [Green Version]
  63. Pereira, M.C.; Setzer, A.W. Spectral characteristics of deforestation fires in NOAA/AVHRR images. Int. J. Remote Sens. 1993, 14, 583–597. [Google Scholar] [CrossRef]
  64. Prins, M.; Menzel, W.P. Trends in South American biomass burning detected with the GOES visible infrared spin scan radiometer atmospheric sounder from 1983 to 1991. J. Geophys. Res. 1994, 99, 16719–16735. [Google Scholar] [CrossRef]
  65. Stroppiana, D.; Pinnock, S. The Global Fire Product: Daily re occurrence from April 1992 to December 1993 derived from NOAA AVHRR data. Int. J. Remote Sens. 2000, 21, 1279–1288. [Google Scholar] [CrossRef]
  66. Safi, Y.; Bouroumi, A. Prediction of Forest Fires Using Artificial Neural Networks Description of the proposed method Artificial neural networks. Appl. Math. Sci. 2013, 7, 271–286. [Google Scholar]
  67. Hu, X.; Weng, Q. Remote Sensing of Environment Estimating impervious surfaces from medium spatial resolution imagery using the self-organizing map and multi-layer perceptron neural networks. Remote Sens. Environ. 2009, 113, 2089–2102. [Google Scholar] [CrossRef]
  68. Arruda, V.L.S.; Piontekowski, V.J.; Alencar, A.; Pereira, R.S.; Matricardi, E.A.T. An alternative approach for mapping burn scars using Landsat imagery, Google Earth Engine, and Deep Learning in the Brazilian Savanna. Remote Sens. Appl. Soc. Environ. 2021, 22, 100472. [Google Scholar] [CrossRef]
  69. Goodfellow, I.; Bengio, Y.; Courville, A. Deep Learning; MIT Press: Cambridge, MA, USA, 2016. [Google Scholar]
  70. Davies, D.K.; Ilavajhala, S.; Wong, M.M.; Justice, C.O. Fire Information for Resource Management System: Archiving and Distributing MODIS Active Fire Data. IEEE Trans. Geosci. Remote Sens. 2009, 47, 72–79. [Google Scholar] [CrossRef]
  71. Marengo, J.A.; Alves, L.M.; Soares, W.R.; Rodriguez, D.A.; Camargo, H.; Riveros, M.P.; Pabló, A.D. Two contrasting severe seasonal extremes in tropical South America in 2012: Flood in Amazonia and drought in Northeast Brazil. J. Clim. 2013, 26, 9137–9154. [Google Scholar] [CrossRef]
  72. Bond, W.J.; Keeley, J.E. Fire as a global “herbivore”: The ecology and evolution of flammable ecosystems. Trends Ecol. Evol. 2005, 20, 387–394. [Google Scholar] [CrossRef] [PubMed]
  73. Timmermann, A.; An, S.; Kug, J.; Jin, F.; Cai, W.; Capotondi, A.; Cobb, K.; Lengaigne, M.; Mcphaden, M.J.; Stuecker, M.F.; et al. El Niño—Southern Oscillation complexity. Nature 2018, 559, 535–545. [Google Scholar] [CrossRef]
  74. Perillo, L.I.; de Oliveira Bordonal, R.; de Figueiredo, E.B.; Moitinho, M.R.; Aguiar, D.A.; Rudorff, B.F.T.; Panosso, A.R.; La Scala, N. Avoiding burning practice and its consequences on the greenhouse gas emission in sugarcane areas southern Brazil. Environ. Sci. Pollut. Res. 2022, 29, 719–730. [Google Scholar] [CrossRef]
  75. Ferreira, L.G.; Sano, E.E.; Fernandez, L.E.; Araújo, F.M. Biophysical characteristics and fire occurrence of cultivated pastures in the brazilian savanna observed by moderate resolution satellite data. Int. J. Remote Sens. 2013, 34, 154–167. [Google Scholar] [CrossRef]
  76. Trigg, S.; Flasse, S. Characterizing the spectral- temporal response of burned savannah using in situ spectroradiometry and infrared thermometry. Int. J. Remote Sens. 2014, 21, 3161–3168. [Google Scholar] [CrossRef]
  77. de Araújo, F.M.; Ferreira, L.G.; Arantes, A.E. Distribution Patterns of Burned Areas in the Brazilian Biomes: An Analysis Based on Satellite Data for the 2002-2010 Period. Remote Sens. 2012, 4, 1929–1946. [Google Scholar] [CrossRef] [Green Version]
  78. Eva, H.D.; Lambin, E.F. Fires and land-cover change in the tropics: A remote sensing analysis at the landscape scale. J. Biogeogr. 2000, 27, 765–776. [Google Scholar] [CrossRef]
  79. Brunel, M.; Rammig, A.; Furquim, F.; Overbeck, G.; Barbosa, H.M.J.; Thonicke, K.; Rolinski, S. When do Farmers Burn Pasture in Brazil: A Model-Based Approach to Determine Burning Date. Rangel. Ecol. Manag. 2021, 79, 110–125. [Google Scholar] [CrossRef]
  80. Miranda, H.S.; Sato, M.N.; Neto, W.N.; Aires, F.S. Fires in the cerrado, the Brazilian savanna. In Tropical Fire Ecology; Springer: Berlin, Germany, 2009; pp. 427–450. [Google Scholar]
  81. Nepstad, D.; Carvalho, G.; Barros, A.C.; Alencar, A.; Capobianco, J.P.; Bishop, J.; Moutinho, P.; Lefebvre, P.; Silva, U.L.; Prins, E. Road paving, fire regime feedbacks, and the future of Amazon forests. For. Ecol. Manag. 2001, 154, 395–407. [Google Scholar] [CrossRef]
  82. Pivello, V.R. The use of fire in the cerrado and Amazonian rainforests of Brazil: Past and present. Fire Ecol. 2011, 7, 24–39. [Google Scholar] [CrossRef]
  83. Kumar, S.; Getirana, A.; Libonati, R.; Hain, C.; Mahanama, S.; Andela, N. Changes in land use enhance the sensitivity of tropical ecosystems to fire—Climate extremes. Sci. Rep. 2022, 12, 964. [Google Scholar] [CrossRef]
  84. Cano-Crespo, A.; Oliveira, P.J.C.; Boit, A.; Cardoso, M.; Thonicke, K. Forest edge burning in the Brazilian Amazon promoted by escaping fires from managed pastures. J. Geophys. Res. Biogeosci. 2015, 120, 2095–2107. [Google Scholar] [CrossRef] [Green Version]
  85. Cochrane, M.A. Fire science for rainforests. Nature 2003, 421, 913–919. [Google Scholar] [CrossRef]
  86. Schmidt, I.B. Fire regime in the Brazilian Savanna: Recent changes, policy and management. Flora 2020, 268, 151613. [Google Scholar] [CrossRef]
  87. Fidelis, A.; Alvarado, S.T.; Barradas, A.C.S.; Pivello, V.R. The Year 2017: Megafires and Management in the Cerrado. Fire 2018, 1, 49. [Google Scholar] [CrossRef] [Green Version]
  88. Oliveira-Santos, C.; Mesquita, V.V.; Parente, L.L.; Pinto, A.D.S.; Ferreira, L.G., Jr. Assessing the Wall-To-Wall Spatial and Qualitative Dynamics of the Brazilian Pasturelands, between 2010 and 2018, Based on the Analysis of the Landsat Data Archive. Remote Sens. 2022, 14, 1024. [Google Scholar] [CrossRef]
  89. Alencar, A.; Shimbo, J.Z.; Lenti, F.; Marques, C.B.; Zimbres, B.; Rosa, M.; Arruda, V.; Castro, I.; Fernandes, M.; Alencar, I.; et al. Mapping Three Decades of Changes in the Brazilian Savanna Native Vegetation Using Landsat Data Processed in the Google Earth Engine Platform. Remote Sens. 2020, 12, 924. [Google Scholar] [CrossRef] [Green Version]
  90. Silva, P.S.; Nogueira, J.; Rodrigues, J.A.; Santos, F.L.M.; Pereira, J.M.C.; DaCamara, C.C.; Daldegan, G.A.; Pereira, A.A.; Peres, L.F.; Schmidt, I.B.; et al. Putting fire on the map of Brazilian savanna ecoregions. J. Environ. Manag. 2021, 296, 113098. [Google Scholar] [CrossRef] [PubMed]
  91. Hofmann, G.S.; Cardoso, M.F.; Alves, R.J.V.; Weber, E.J.; Barbosa, A.A.; De Toledo, P.M.; Pontual, F.B.; Salles, L.D.O.; Hasenack, H.; Cordeiro, J.L.P.; et al. The Brazilian Cerrado is becoming hotter and drier. Glob. Chang. Biol. 2021, 27, 4060–4073. [Google Scholar] [CrossRef] [PubMed]
  92. Rodrigues, C.A.; Zirondi, H.L.; Fidelis, A. Fire frequency affects fire behavior in open savannas of the Cerrado. For. Ecol. Manag. 2021, 482, 118850. [Google Scholar] [CrossRef]
  93. Gomes, L.; Miranda, H.S.; Silvério, D.V.; Bustamante, M.M.C. Effects and behaviour of experimental fires in grasslands, savannas, and forests of the Brazilian Cerrado. For. Ecol. Manag. 2020, 458, 117804. [Google Scholar] [CrossRef]
  94. Brito, B.; Barreto, P.; Brandão, A., Jr.; Baima, S.; Gomes, P.H. Stimulus for land grabbing and deforestation in the Brazilian Amazon. Environ. Res. Lett. 2019, 14, 064018. [Google Scholar] [CrossRef]
  95. Silvério, D.V.; Brando, P.M.; Balch, J.K.; Putz, F.E.; Nepstad, D.C.; Oliveira-Santos, C.; Bustamante, M.M.C. Testing the Amazon savannization hypothesis: Fire effects on invasion of a neotropical forest by native cerrado and exotic pasture grasses. Philos. Trans. R. Soc. B 2013, 368, 20120427. [Google Scholar] [CrossRef]
  96. Pontes-lopes, A.; Silva, C.V.J.; Barlow, J.; Rincón, L.M.; Campanharo, W.A.; Nunes, C.A.; De Almeida, C.T.; Júnior, C.H.L.S.; Cassol, H.L.G.; Dalagnol, R.; et al. Drought-driven wildfire impacts on structure and dynamics in a wet Central Amazonian forest. Proc. R. Soc. B 2021, 288, 20210094. [Google Scholar] [CrossRef]
  97. de Oliveira, A.S.; Rajão, R.G.; Soares Filho, B.S.; Oliveira, U.; Santos, L.R.S.; Assunção, A.C.; van der Hoff, R.; Rodrigues, H.O.; Ribeiro, S.M.C.; Merry, F.; et al. Economic losses to sustainable timber production by fire in the Brazilian Amazon. Geogr. J. 2019, 185, 55–67. [Google Scholar] [CrossRef]
  98. Morello, T.; Martino, S.; Duarte, A.F.; Anderson, L.; Davis, K.J.; Silva, S.; Bateman, I.J. Fire, tractors, and health in the amazon: A cost-benefit analysis of fire policy. Land Econ. 2019, 95, 409–434. [Google Scholar] [CrossRef]
  99. Berenguer, E.; Lennox, G.D.; Ferreira, J.; Malhi, Y.; Aragão, L.E.O.C.; Maria, M.; De Seixas, M.; Smith, C.C.; Withey, K.; Barlow, J. Tracking the impacts of El Niño drought and fire in human-modified Amazonian forests. Proc. Natl. Acad. Sci. USA 2021, 118, e2019377118. [Google Scholar] [CrossRef]
  100. Withey, K.; Berenguer, E.; Palmeira, A.F.; Lennox, G.D.; Silva, C.V.J.; Espı, F.D.B.; Ferreira, J.; Franc, F.; Malhi, Y.; Rossi, L.C.; et al. Quantifying immediate carbon emissions from El Nino-mediated wildfires in humid tropical forests. Philos. Trans. B 2018, 373, 20170312. [Google Scholar] [CrossRef] [PubMed] [Green Version]
  101. Marengo, J.A.; Souza, C.A.; Thonicke, K.; Burton, C.; Halladay, K.; Betts, R.A.; Alves, L.M.; Soares, W.R. Changes in Climate and Land Use Over the Amazon Region: Current and Future Variability and Trends. Front. Earth Sci. 2018, 6, 228. [Google Scholar] [CrossRef]
  102. De Faria, B.L.; Brando, P.M.; Macedo, M.N.; Panday, P.K.; Soares-Filho, B.S.; Coe, M.T. Erratum: Current and future patterns of fire-induced forest degradation in Amazonia (2017 Environ. Res. Lett. 9 095005). Environ. Res. Lett. 2017, 12, 119601. [Google Scholar] [CrossRef]
  103. Schulz, C.; Whitney, B.S.; Carmem, O.; Neves, D.M.; Crabb, L.; Castro, E.; Oliveira, D.; Luiz, P.; Lima, T.; Afzal, M.; et al. Physical, ecological and human dimensions of environmental change in Brazil’s Pantanal wetland: Synthesis and research agenda. Sci. Total Environ. 2019, 687, 1011–1027. [Google Scholar] [CrossRef] [PubMed]
  104. Pettit, N.E.; Naiman, R.J. Fire in the Riparian Zone: Characteristics and Ecological Consequences. Ecosystems 2007, 10, 673–687. [Google Scholar] [CrossRef]
  105. Menezes, L.S.; De Oliveira, A.M.; Santos, F.L.M.; Russo, A.; De Souza, R.A.F.; Roque, F.O.; Libonati, R. Lightning patterns in the Pantanal: Untangling natural and anthropogenic-induced wild fires. Sci. Total Environ. 2022, 820, 153021. [Google Scholar] [CrossRef] [PubMed]
  106. Arruda, W.D.S.; Oldeland, J.; Conceiç, A.; Filho, P. Inundation and Fire Shape the Structure of Riparian Forests in the Pantanal, Brazil. PLoS ONE 2016, 11, e0156825. [Google Scholar] [CrossRef] [Green Version]
  107. Rosa, M.R.; Brancalion, P.H.S.; Crouzeilles, R.; Tambosi, L.R.; Piffer, P.R.; Lenti, F.E.B.; Hirota, M.; Santiami, E.; Metzger, J.P. Hidden destruction of older forests threatens Brazil’s Atlantic Forest and challenges restoration programs. Sci. Adv. 2021, 7, eabc4547. [Google Scholar] [CrossRef]
  108. Sampaio, E.V.S.B.; Salcedo, I.H.; Kauffman, J.B. Effect of Different Fire Severities on Coppicing of Caatinga Vegetation in Serra Talhada, PE, Brazil. Biotropica 1993, 25, 452. [Google Scholar] [CrossRef]
  109. Overbeck, G.E.; Pfadenhauer, J. Adaptive strategies in burned subtropical grassland in southern Brazil. Flora 2007, 202, 27–49. [Google Scholar] [CrossRef]
  110. Overbeck, G.; Muller, S.C.; Fidelis, A.; Pfadenhauer, J.; Pillar, V.D.; Blanco, C.C.; Boldrini, I.I.; Both, R.; Forneck, E.D. Brazil’s neglected biome: The South Brazilian Campos. Perspect. Plant Ecol. Evol. Syst. 2007, 9, 101–116. [Google Scholar] [CrossRef]
  111. Marengo, J.A. Interdecadal variability and trends of rainfall across the Amazon basin. Theor. Appl. Climatol. 2004, 78, 79–96. [Google Scholar] [CrossRef]
  112. Morello, T.F.; Parry, L.; Markusson, N.; Barlow, J. Policy instruments to control Amazon fires: A simulation approach. Ecol. Econ. 2017, 138, 199–222. [Google Scholar] [CrossRef] [Green Version]
  113. Durigan, G.; Ratter, J.A. The need for a consistent fire policy for Cerrado conservation. J. Appl. Ecol. 2016, 53, 11–15. [Google Scholar] [CrossRef]
  114. Conciani, D.E.; Pereira, L.; Sanna, T.; Silva, F.; Durigan, G.; Alvarado, S.T. Human-climate interactions shape fire regimes in the Cerrado of São Paulo state, Brazil. J. Nat. Conserv. 2021, 61, 126006. [Google Scholar] [CrossRef]
  115. INPE Monitoramento do Desmatamento da Floresta Amazônica Brasileira por Satélite. 2021. Available online: http://www.obt.inpe.br/OBT/assuntos/programas/amazonia/prodes (accessed on 4 April 2022).
  116. Dinerstein, E.; Olson, D.; Joshi, A.; Vynne, C.; Burgess, N.D.; Wikramanayake, E.; Hahn, N.; Palminteri, S.; Hedao, P.; Noss, R.; et al. An Ecoregion-Based Approach to Protecting Half the Terrestrial Realm. Bioscience 2017, 67, 534–545. [Google Scholar] [CrossRef]
  117. Sano, E.E.; Rodrigues, A.A.; Martins, E.S.; Bettiol, G.M.; Bustamante, M.M.C.; Bezerra, A.S.; Couto, A.F.; Vasconcelos, V.; Schüler, J.; Bolfe, E.L. Cerrado ecoregions: A spatial framework to assess and prioritize Brazilian savanna environmental diversity for conservation. J. Environ. Manag. 2019, 232, 818–828. [Google Scholar] [CrossRef]
  118. Brasil Plano de ação: Estratégia Nacional para o Gerenciamento dos Recursos Hídricos 2022–2040; Governo Federal: Brasilia, Brazil, 2022.
Figure 1. Study area with the six Brazilian biomes, and its corresponding land use and land cover classes according to the MapBiomas Collection 6 [50].
Remotesensing 14 02510 g001
Figure 2. Overview of the method for classifying burned areas in Brazil.
Remotesensing 14 02510 g002
Figure 3. The 2020 quality mosaic (QM) for Brazil (RGB SWIR-1, NIR, RED), created from spectral information retrieved from the minimum NBR pixels in a year, showing examples of the diversity of burn scars by biome: (A) Amazon, (B) Cerrado, (C) Caatinga, (D) Atlantic Forest, (E) Pantanal, and (F) Pampa.
Remotesensing 14 02510 g003
Figure 4. Density of training samples per Landsat WRS-2 path/row. Grid cells in darker orange represent the areas with more training samples, while grid cells in lighter yellow represent the areas with fewer training samples.
Remotesensing 14 02510 g004
Figure 5. Variation between burned and unburned areas by reflectance bands per land use and cover type. Red boxes (burned) represent the immediately post-fire reflectance values, and green boxes (unburned) represent the reflectance value in a specific year.
Remotesensing 14 02510 g005
Figure 6. Examples of the burned areas classification for different types of fire, with the Landsat mosaic used for classification, and the area classified as burned in red.
Remotesensing 14 02510 g006
Figure 7. (A) Spatial distribution of the total area burned between 1985 and 2020 in Brazil; (B) Cumulative burned area between 1985 and 2020; and (C) Annual area burned from 1985 to 2020.
Remotesensing 14 02510 g007
Figure 8. Temporal distribution of annual burned area by Brazilian biome between 1985 and 2020.
Remotesensing 14 02510 g008
Figure 9. Seasonal patterns of fire events occurred in Brazil, considering the variation of burned area per month in the period (1985–2020), where 1—January, 2—February, 3—March, 4—April, 5—May, 6—June, 7—July, 8—August, 9—September, 10—October, 11—November, 12—December.
Remotesensing 14 02510 g009
Figure 10. (A) Spatial distribution of fire frequency between 1985 and 2020 in Brazil, and (B) burned area and proportion of the burned area by frequency class.
Remotesensing 14 02510 g010
Figure 11. (A) Burned area by land use and cover class in Brazil from 1985 to 2020; (B) Proportion (%) of the total area burned from 1985 to 2020 by land use and cover class in Brazil; and (C) Proportion (%) of the total area burned from 1985 to 2020 by land use and cover class in the Brazilian biomes.
Remotesensing 14 02510 g011
Figure 12. Annual distribution of the burned area by land use and land cover type in Brazil from 1985 to 2020.
Remotesensing 14 02510 g012
Table 1. Cumulative burned area, mean annual burned area, proportion of the total burned area, proportion of the biome burned at least once, and proportion of the biome burned annually for the period of 1985 to 2020.
BiomesBiome Area (km2)Cumulative Burned Area (km2)Mean Annual Burned Area (km2)Proportion of the Total Brazil’s Burned AreaProportion of the Biome Burned at Least OnceProportion of the Biome Burned Annually
Cerrado1,983,017733,87867,06843.9%37.0%3.4%
Amazon4,212,743690,02565,78041.3%16.4%1.6%
Caatinga862,81888,54938285.3%10.3%0.4%
Pantanal150,90086,42583375.2%57.3%5.5%
Atlantic Forest1,107,41971,58731224.3%6.5%0.3%
Pampa193,83119302020.1%1.0%0.1%
Brazil8,514,8771,672,394148,336100%19.6%1.7%
Table 2. Burned area (in square kilometers) in each frequency class, for each biome and for Brazil.
Burned Area(km2)
Frequency Class CerradoAmazonPantanalCaatingaAtlantic ForestPampaBrazil
1291,988216,88328,49059,02851,5641666649,620
2137,435141,73717,16116,77511,392190324,690
381,640101,09411,6446267409444204,783
454,51470,38079342972186515137,680
538,91247,84355741562968694,867
629,08232,3584039823539366,844
722,18821,9262947448314247,824
817,15415,0342292253201134,935
913,34910,4841805154136125,928
1010,464744913969399119,501
118243538510745874014,834
12651639787723756011,361
1351693008519244508765
1441162318322163706810
>1513,10610,14845539204223,953
Total area burned (km2)733,877690,02486,42588,54971,58719301,672,394
Table 3. Mean burned area and standard deviation in the main land use and cover classes in Brazil and the Brazilian biomes.
Mean Burned Area and Standard Deviation (km2)
Land Use and CoverBrazilAmazonCerradoPantanalCaatingaAtlantic forestPampa
Forest18,443 (±8412)8237(±4553)2748(±1423)658(±742)275(±160)382(±332)7(±4)
Savanna42,952 (±16,186)3941(±1444)33,971(±14,356)1486(±1196)3103(±1175)122(±130)0(±)
Grassland41,707 (±10,762)13,160 (±3481)22,314(±7745)5392(±3644)229(±107)731(±371)53(±31)
Pasture38,159 (±13,824)37,727(±14,974)4530(±1877)513(±354)206(±172)1018(±719)0(±1)
Cropland3562(±1989)1713(±1576)1903(±719)2(±2)8(±11)256(±102)0(±)
Agric. Mosaic2798(±1918)86(±45)2151(±1564)2(±2)207(±147)534(±294)30(±20)
Other485(±274)89(±29)217(±53)1(±1)22(±9)152(±51)3(±2)
Total148,106(±42,325)64,952(±21,769)67,833(±25,295)8053(±5551)4051(±1479)3195(±1601)92(±50)
Publisher’s Note: MDPI stays neutral with regard to jurisdictional claims in published maps and institutional affiliations.

