Article

Evaluation of Sea Ice Radiative Forcing according to Surface Albedo and Skin Temperature over the Arctic from 1982–2015

1
Division of Earth Environmental System Science (Major of Spatial Information System Engineering), Pukyong National University, 45, Yongso-ro, Nam-gu, Busan 48513, Korea
2
Center of Remote Sensing & GIS, Korea Polar Research Institute, Incheon 21990, Korea
3
Korea Institute of Ocean Science and Technology, Korea Ocean Satellite Center, Busan 49111, Korea
*
Author to whom correspondence should be addressed.
Remote Sens. 2022, 14(11), 2512; https://0-doi-org.brum.beds.ac.uk/10.3390/rs14112512
Submission received: 30 April 2022 / Revised: 18 May 2022 / Accepted: 19 May 2022 / Published: 24 May 2022
(This article belongs to the Special Issue Remote Sensing in Sea Ice)

Abstract

:
Rapid warming of the Arctic has resulted in widespread sea ice loss. Sea ice radiative forcing (SIRF) is the instantaneous perturbation of Earth’s radiation at the top of the atmosphere (TOA) caused by sea ice. Previous studies focused only on the role of albedo on SIRF. Skin temperature is also closely related to sea ice changes and is one of the main factors in Arctic amplification. In this study, we estimated SIRF considering both surface albedo and skin temperature using radiative kernels. The annual average net-SIRF, which consists of the sum of albedo-SIRF and temperature-SIRF, was calculated as −54.57 ± 3.84 W/m2 for the period 1982–2015. In the net-SIRF calculation, albedo-SIRF and temperature-SIRF made similar contributions. However, the albedo-SIRF changed over the study period by 0.12 ± 0.07 W/m2 per year, while the temperature-SIRF changed by 0.22 ± 0.07 W/m2 per year. The SIRFs for each factor had different patterns depending on the season and region. In summer, rapid changes in the albedo-SIRF occurred in the Kara and Barents regions. In winter, only a temperature-SIRF was observed, and there was little difference between regions compared to the variations in albedo-SIRF. Based on the results of the study, it was concluded that the overall temperature-SIRF is changing more rapidly than the albedo-SIRF. This study indicates that skin temperatures may have a greater impact on the Arctic than albedo in terms of sea ice surface changes.

Graphical Abstract

1. Introduction

Sea ice is a key indicator of climate variability and changes in the Arctic region, and one of the essential climate variables (ECVs) in the Global Climate Observing System (GCOS) [1]. Arctic sea ice strongly influences surface energy balance at high latitudes, which in turn modulates the regional and global climate system [2]. In recent decades, the near-surface air temperature of the Arctic has increased twofold relative to the global average, which is called Arctic amplification [3,4,5,6]. Arctic amplification is directly or indirectly affecting Northern Hemisphere mid-latitude weather by causing changes in storm tracks, the jet stream, and planetary waves [7]. The rapid warming of the Arctic has been accompanied by extensive sea ice loss [5]. This is also evident in paleoclimatic records [8,9], observations [10,11,12], and model projections [13,14]. The polarimetric radar backscattering characteristics can be utilized to observe the sea ice feature, such as sea ice condition, sea ice extent, and overlying snow on sea ice [15,16,17]. According to the National Snow and Ice Data Center (NSIDC), the lowest minimum sea ice extent on record occurred in 2012, and the annual minimum arctic sea ice extent is declining at a rate of 13% per decade [18]. Many studies have predicted that this trend will continue in the future [19,20,21,22,23].
This phenomenon has mainly been explained from the perspective of surface albedo. Shrinking ice reduces surface albedo, resulting in more surface solar absorption and thus amplifying Arctic warming and driving further ice melting [24,25,26,27]. The instantaneous perturbation to Earth’s TOA energy balance induced by sea ice changes is known as sea ice radiative forcing (SIRF) [28] and is used to measure the feedback of surface cryospheric components to Earth’s radiation budget [28,29,30,31,32,33]. To estimate radiative forcing caused by sea ice changes, several studies applied SIRF using various materials at different spatiotemporal ranges [28,29,34,35,36,37]. Flanner et al. [28] calculated the radiative forcing due to cryosphere changes in the northern hemisphere, including the Arctic, during 1979–2008. They derived the land albedo from the Moderate Resolution Imaging Spectroradiometer (MODIS) MCD43C3 collection 5 dataset, sea ice albedo from the Advanced Very High Resolution Radiometer (AVHRR) Polar Pathfinder (APP) dataset [37], and surface albedo radiative kernel from the National Center for Atmospheric Research (NCAR) Community Atmosphere Model version 3 (CAM3) [38]. They found that cryospheric cooling declined by 0.22 (0.15–0.32) W/m2 on average from 1979 to 2008. Cao et al. [29] and Cao et al. [34] studied SIRF for the maximum sea ice coverage area in the Northern Hemisphere from 1982 to 2009. The two studies analyzed SIRF according to the albedo data. Five monthly surface albedo products from 1982 to 2009 were used: Cloud, Albedo, and Radiation dataset, AVHRR-based, version 1 (CLARA-A1), European Centre for Medium-Range Weather Forecasts Interim Reanalysis (ERA-Interim), Modern-Era Retrospective Analysis for Research and Applications (MERRA), National Centers for Environmental Prediction Climate Forecast System Reanalysis (CFSR), and the Japanese 55-Year Reanalysis (JRA-55). These studies used the average value of two radiative kernels from the Geophysical Fluid Dynamics Laboratory Atmosphere Model 2 (GFDL AM2) and NCAR CAM3. In the northern hemisphere, SIRF increased by 0.20 ± 0.05 W/m2 due to the loss of sea ice from 1982 to 2009 according to the CLARA-A1 satellite-based surface albedo data [29]. There was a maximum difference of 26 W/m2 in SIRF depending on the albedo reanalysis data used [34]. Pistone et al. [35] and Marcianesi et al. [37] estimated SIRF, although they did not apply the Flanner et al. [28] concept directly. Pistone et al. [35] studied SIRF over the Arctic Ocean north of 60° N from 1979 to 2011. They used the planetary albedo from the Clouds and Earth’s Radiant Energy System (CERES) product for the period 2000–2011. The planetary albedo during 1979–1999 was calculated from sea ice using a total least squares linear regression of albedo and sea ice between 2000 and 2011. The change in SIRF in the northern hemisphere due to sea ice loss was 0.43 ± 0.07 W/m2. Marcianesi et al. [36] investigated the northern polar region that covers the latitudes from 48.5° N to the north pole and is included in the CERES Energy Balanced And Filled (EBAF) dataset. They found that the change in sea ice albedo caused an annual average increase in solar incoming radiation absorption of 1.82 ± 0.47 W/m2 in the Arctic Ocean during 1982–2015.
Some studies have shown that Arctic amplification is strong in winter, when surface albedo is not observed [39,40,41]. As sea ice changes, so too do the surface albedo and skin temperature. Skin temperature is an important parameter for quantifying the exchange of water vapor and energy between the surface and atmosphere [42]. Due to the regional characteristics of the Arctic, the surface albedo is only observed from March to September. However, in the case of temperature, all 12 months directly affect the Arctic climate. Screen et al. [5] suggested that strong positive ice–temperature feedbacks have emerged in the Arctic, increasing sea ice loss and the chances of rapid warming. Pithan et al. [43] showed that the temperature feedback mechanism contributes more to Arctic amplification than albedo feedback from the surface. However, no studies related to skin temperature radiative forcing using radiative kernels, such as albedo-based radiative forcing, have been conducted. Various climate models provide surface temperature and albedo kernels according to surface changes [38,44,45,46,47,48].
In this study, as well as surface albedo-based radiative forcing according to sea ice changes, skin temperature-based radiative forcing was also calculated. The purpose of this study was to estimate the SIRF, to evaluate changes in the energy balance directly caused by surface changes of the Arctic Ocean. The characteristics of radiative forcing according to the data obtained using the radiative kernels of various climate models were compared, because the results differ depending on the data used [35,49]. Arctic warming is accelerating in areas where sea ice changes are serious [50]. Furthermore, climate change in the Arctic displays seasonality [51,52]. In consideration of this phenomenon, this study analyzed the characteristics of radiative forcing according to Arctic Ocean regions and season.

2. Materials and Methods

2.1. Data

2.1.1. Surface Albedo

We used the surface albedo from the second edition of the satellite-derived climate data record, CLARA (CLARA-A2). Monthly average data were used only for regions where sea ice existed in the Northern Hemisphere from 1982 to 2015, and the spatial resolution was 0.25 degrees. The CLARA-A2 dataset was obtained using the AVHRR sensor onboard the polar orbiting National Oceanic and Atmospheric Administration (NOAA) and Meteorological Operational (METOP) satellites. The CLARA-A2 surface albedo improved atmospheric correction using dynamic aerosol optical depths compared to the CLARA-A1 [53]. A quality assessment of the CLARA surface albedo dataset indicated high-quality Arctic data [53,54]. This dataset has been used in previous studies of Arctic surface albedo [29,30,35,36,37,38].

2.1.2. Skin Temperature

The skin temperature represents the temperature of the uppermost surface layer, which has no heat capacity and can instantaneously respond to changes in the surface flux [55]. The data used in this study were ERA5 reanalyses provided by the European Centre for Medium-Range Weather Forecasts (ECWMF). The reanalysis datasets combined remote sensing observations, in situ measurements, and modeled results, and serve as an important resource for understanding climate change in the Arctic [56]. We used monthly average data with a spatial resolution of 0.25 degrees for regions with sea ice. These datasets were compared with data from international buoy programs, including the International Arctic Buoy Programme (IABP), Multidisciplinary Drifting Observatory for the study of Arctic Climate (MOSAiC), and Cold Regions Research and Engineering Laboratory (CRREL). The monthly average data used in this study were strongly correlated with the buoy observations, with the highest correlation coefficient being 0.98 [57].

2.1.3. Sea Ice Concentration (SIC)

We used daily NSIDC sea ice concentration data for January 1982 to December 2015 (spatial resolution = 25 km) in this study [58]. This dataset was used because it provides a time series of sea ice concentrations derived from several passive microwave instruments, such as the Scanning Multichannel Microwave Radiometer (SMMR) onboard Nimbus-7, Special Sensor Microwave/Imagers (SSM/I) onboard the Defense Meteorological Satellite Program (DMSP)-F8, -F11, and -F13, and Special Sensor Microwave Imager/Sounder (SSMIS) on DMSP-F17. This dataset has an uncertainty of about ±5% compared to the actual sea ice concentration in winter, and ±15% in summer when melt ponds are present on the sea ice [58]. In addition, many studies have analyzed the algorithm performance [59,60,61,62]. We estimated SIRF according to the Arctic regions provided by the National Centers for Environmental Information (NCEI) [63], as shown in Figure 1 (only when the SIC value existed).

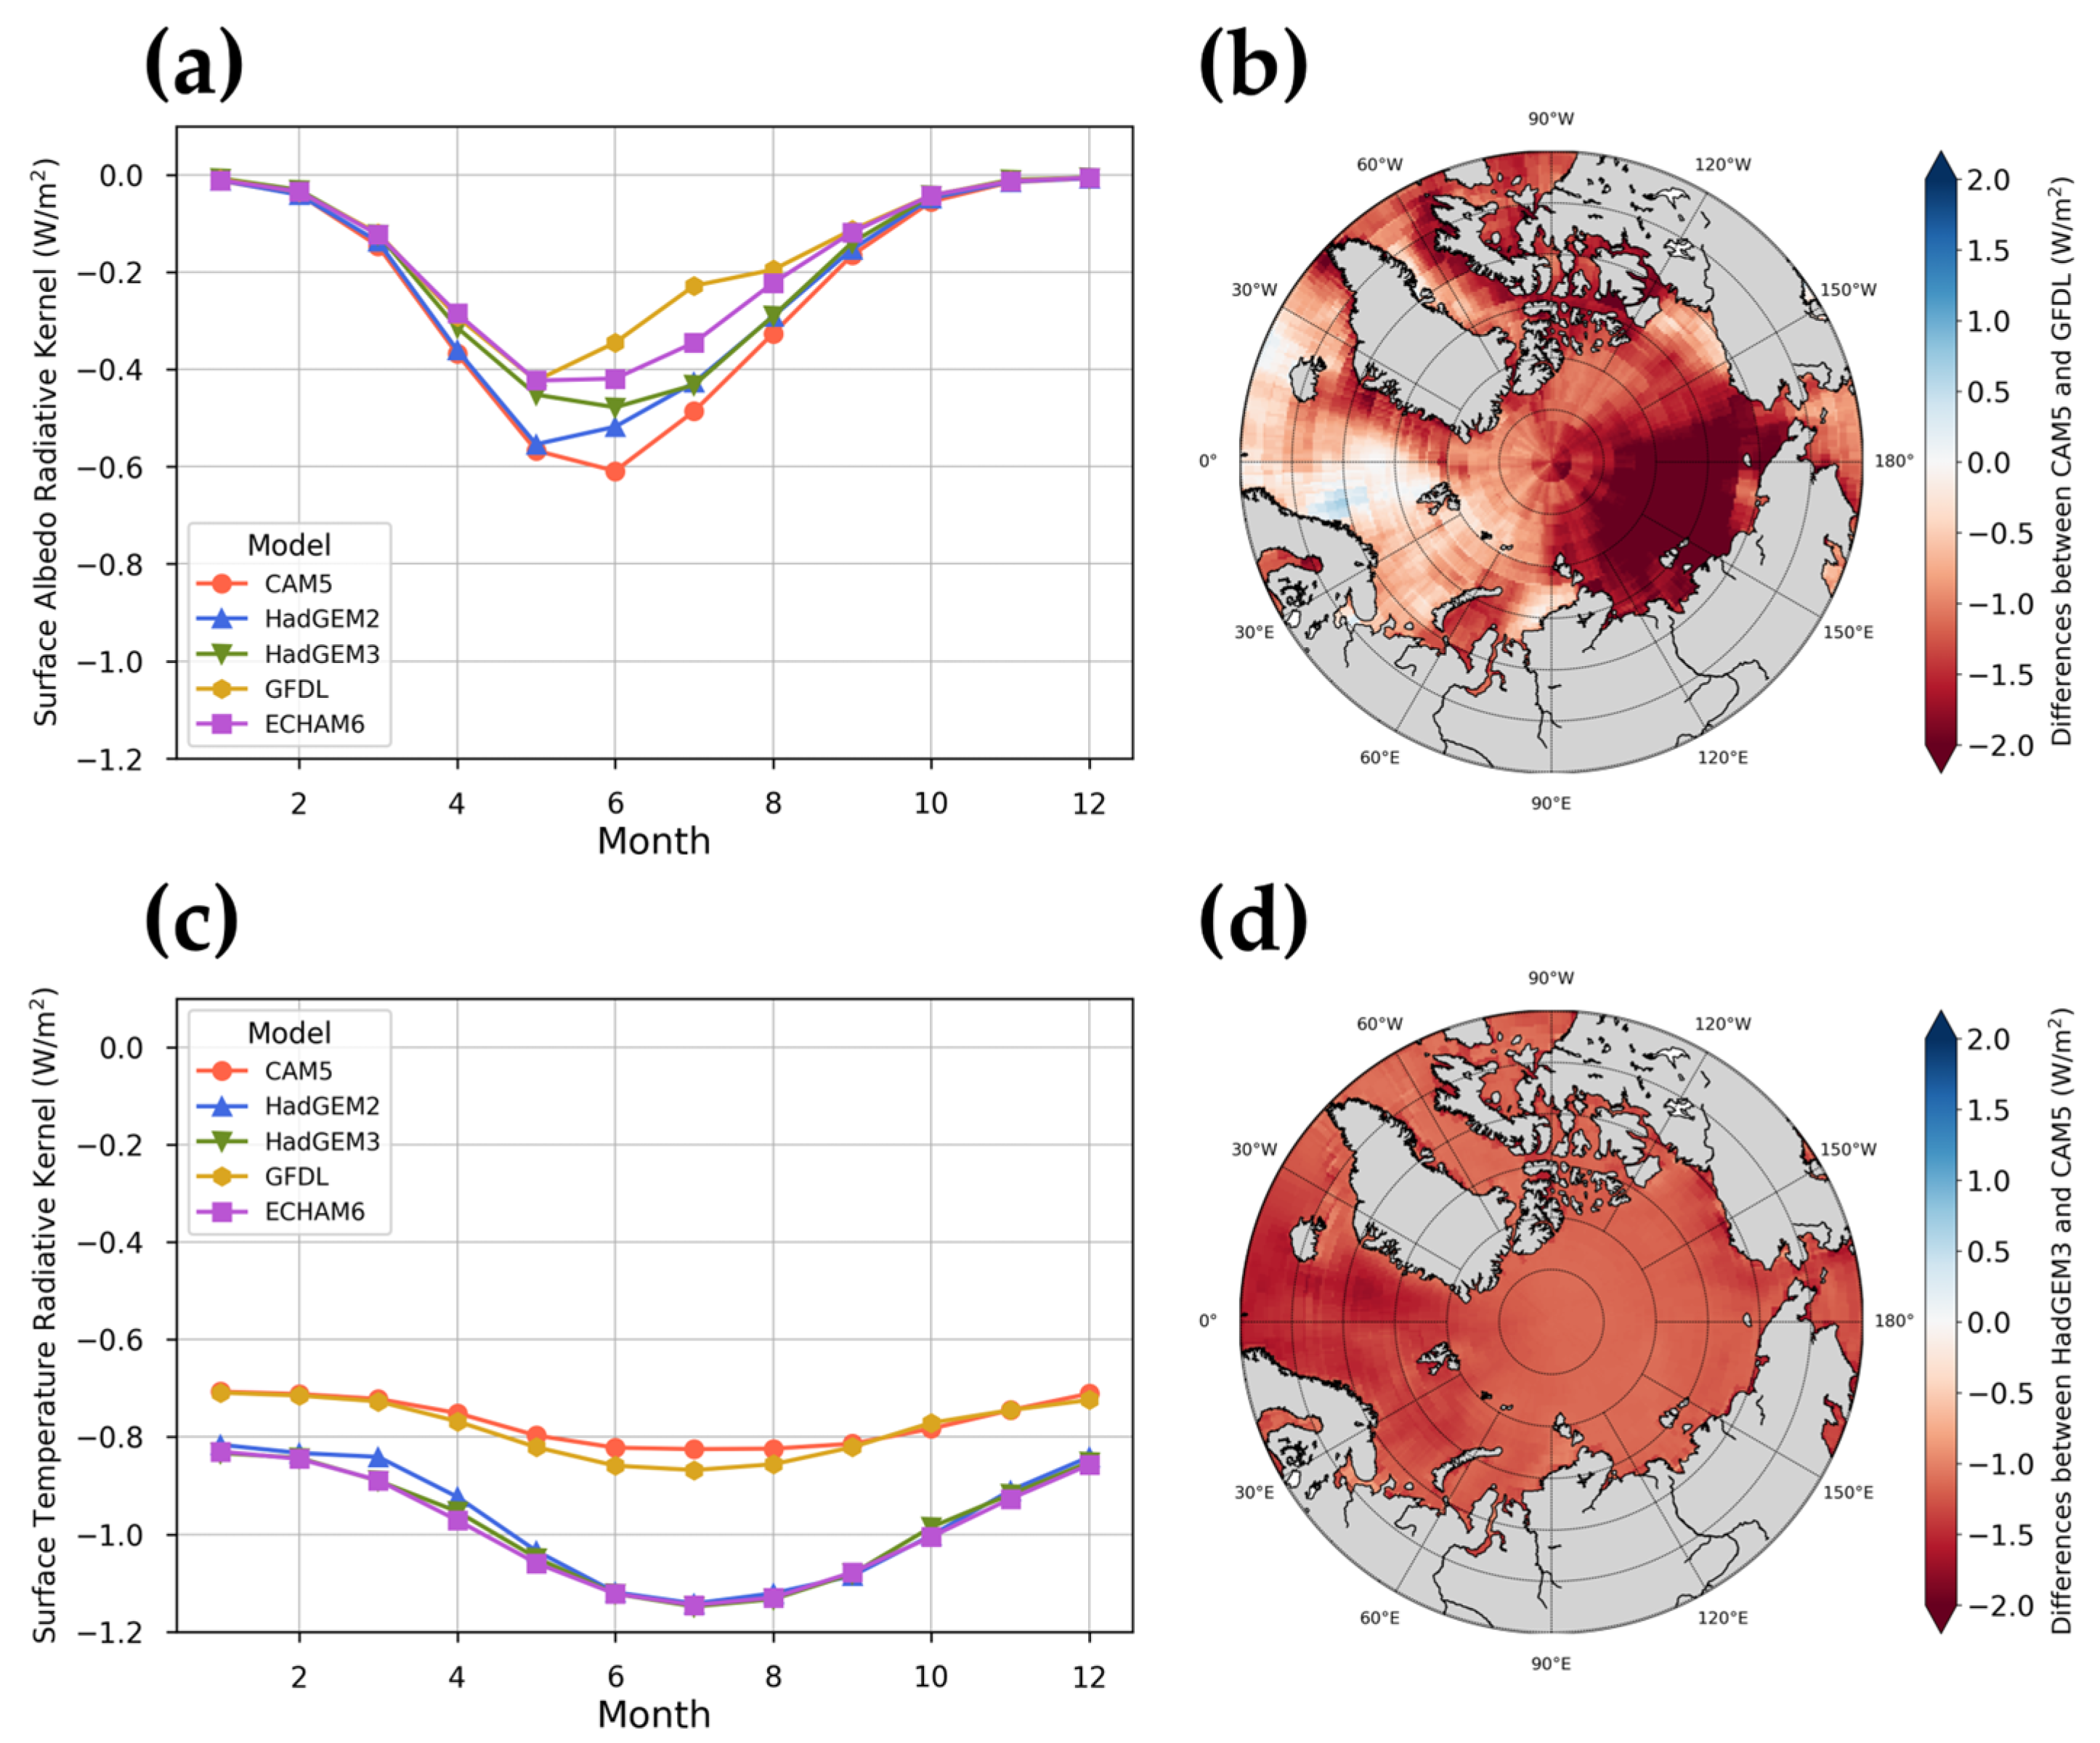
2.1.4. Radiative Kernels

Radiative kernels explain how a small perturbation in a radiatively relevant state variable affects the Earth’s energy balance [39,44]. Radiative kernels are based on state-of-the-art general circulation models (GCMs). However, the time periods, durations, and input data of the atmospheric state climatologies used to compute the kernels vary widely [64]. To minimize the uncertainty caused by GCMs, we obtained five GCM-based radiative kernels from Community Atmosphere Model version 5 (CAM5) [44], Hadley Centre Global Environment Model version 2 (HadGEM2) [45], Hadley Centre Global Environment Model version 3 (HadGEM3) [46], GFDL [47], and European Center and Hamburg model version 6 (ECHAM6) [48].
In this study, we used two radiative kernels in all-sky conditions: surface albedo and skin temperature. The surface albedo kernel describes the response of shortwave radiation at the top of the atmosphere (TOA) to a 1% change in surface albedo [47]. The intra-annual variability of the five albedo radiative kernels in the Arctic is shown in Figure 2a. The overall trend was similar, but there was a difference according to each GCM in May–July. The CAM5 model determined that the influence of albedo was high in summer, while the GFDL model showed that it was relatively low. Figure 2b shows the spatial distribution of the difference between CAM5 and GFDL in June, which was the period with the greatest difference between GCMs. The CAM5 surface albedo radiative kernel had low values in most areas. There was a difference of about 2 W/m2 among the Chukchi, Laptev, and East Siberian seas.
The surface temperature kernel describes the response of longwave radiation at the TOA to a 1 K change in surface temperature [47]. This will have a larger impact on climate than the surface albedo radiative kernel, with less seasonal variability (Figure 2c). The CAM5 and GFDL models produced similar average values in the Arctic region, and the monthly variability was relatively low compared to other GCMs. The HadGEM2, HadG-EM3, and ECHAM6 models indicated similar distributions. Figure 2d shows the differences between the HadGEM3 and CAM5 values in July, when the biggest difference occurred. Overall, the HadGEM3 value was lower than 0.55 W/m2 over the entire Arctic, and there were no regional characteristics.
A summary of the data used in this study is shown in Table 1. The data used to calculate SIRF had different temporal and spatial resolutions. We used the great circle distance (GCD) method to obtain a spatial resolution of 25 km for all surface albedo data for the Arctic. To equalize the temporal resolution of radiative kernels, monthly mean values of sea ice concentration were generated.

2.2. Method

The radiative kernel method is widely used for estimating the radiative forcing induced by changes in climate factors [65,66]. We applied the radiative kernel method to estimate radiative forcing according to sea ice change in the Arctic. SIRF describes the instantaneous influence of sea ice on the TOA energy budget (unit of W·m−2) [28]. In this study, we calculated two types of SIRF: albedo-SIRF and temperature-SIRF. The time (t)-dependent SIRF within study area R, in turn within area A composed of grid cells r, can be expressed using Equation (1) [28]:
S I R F ( t , R ) = 1 A ( R ) R   S ( t , r ) α S ( t , r ) F α ( t , r ) d A ( r )  
where S ( t , r ) is the sea ice concentration over the northern hemisphere, α S x ( t , r ) is the rate of variation of α (surface albedo or skin temperature) with sea ice change, and F α ( t , r ) is the response of TOA shortwave radiation to surface albedo changes, or of TOA longwave radiation to skin temperature changes. Following Flanner et al. [28], we assumed that the temporal and spatial variations of α S and F α were consistent with the sea ice concentration S and α , respectively. α S is the surface albedo (or skin temperature) change induced by sea ice change, which can be simplified as the albedo (or skin temperature) difference between sea-ice-covered and open-ocean water environments. For the open-ocean water environment, we used a previously reported value (0.0676 [29]) for albedo and the Optimum Interpolation Sea Surface Temperature (OISST) data for skin temperature. The OISST provides sea surface temperature, even in regions where sea ice exists, using linear equations of sea ice concentration and sea surface temperature [67]. F α can be obtained from the surface albedo (or skin temperature) radiative kernels. When the value of the surface albedo radiative kernel is positive, the direction of the energy flux is upward; however, the opposite is true for the skin temperature radiative kernel [47]. Therefore, we calculated the SIRF by multiplying the temperature kernel by a negative number to determine the joint effects of albedo and temperature. Changes were calculated by multiplying the linear slope by the time interval; the p-values never reached significance at ≤0.05.

3. Results and Discussion

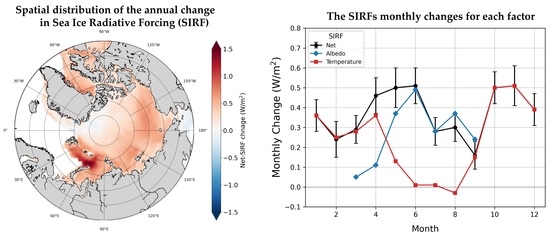
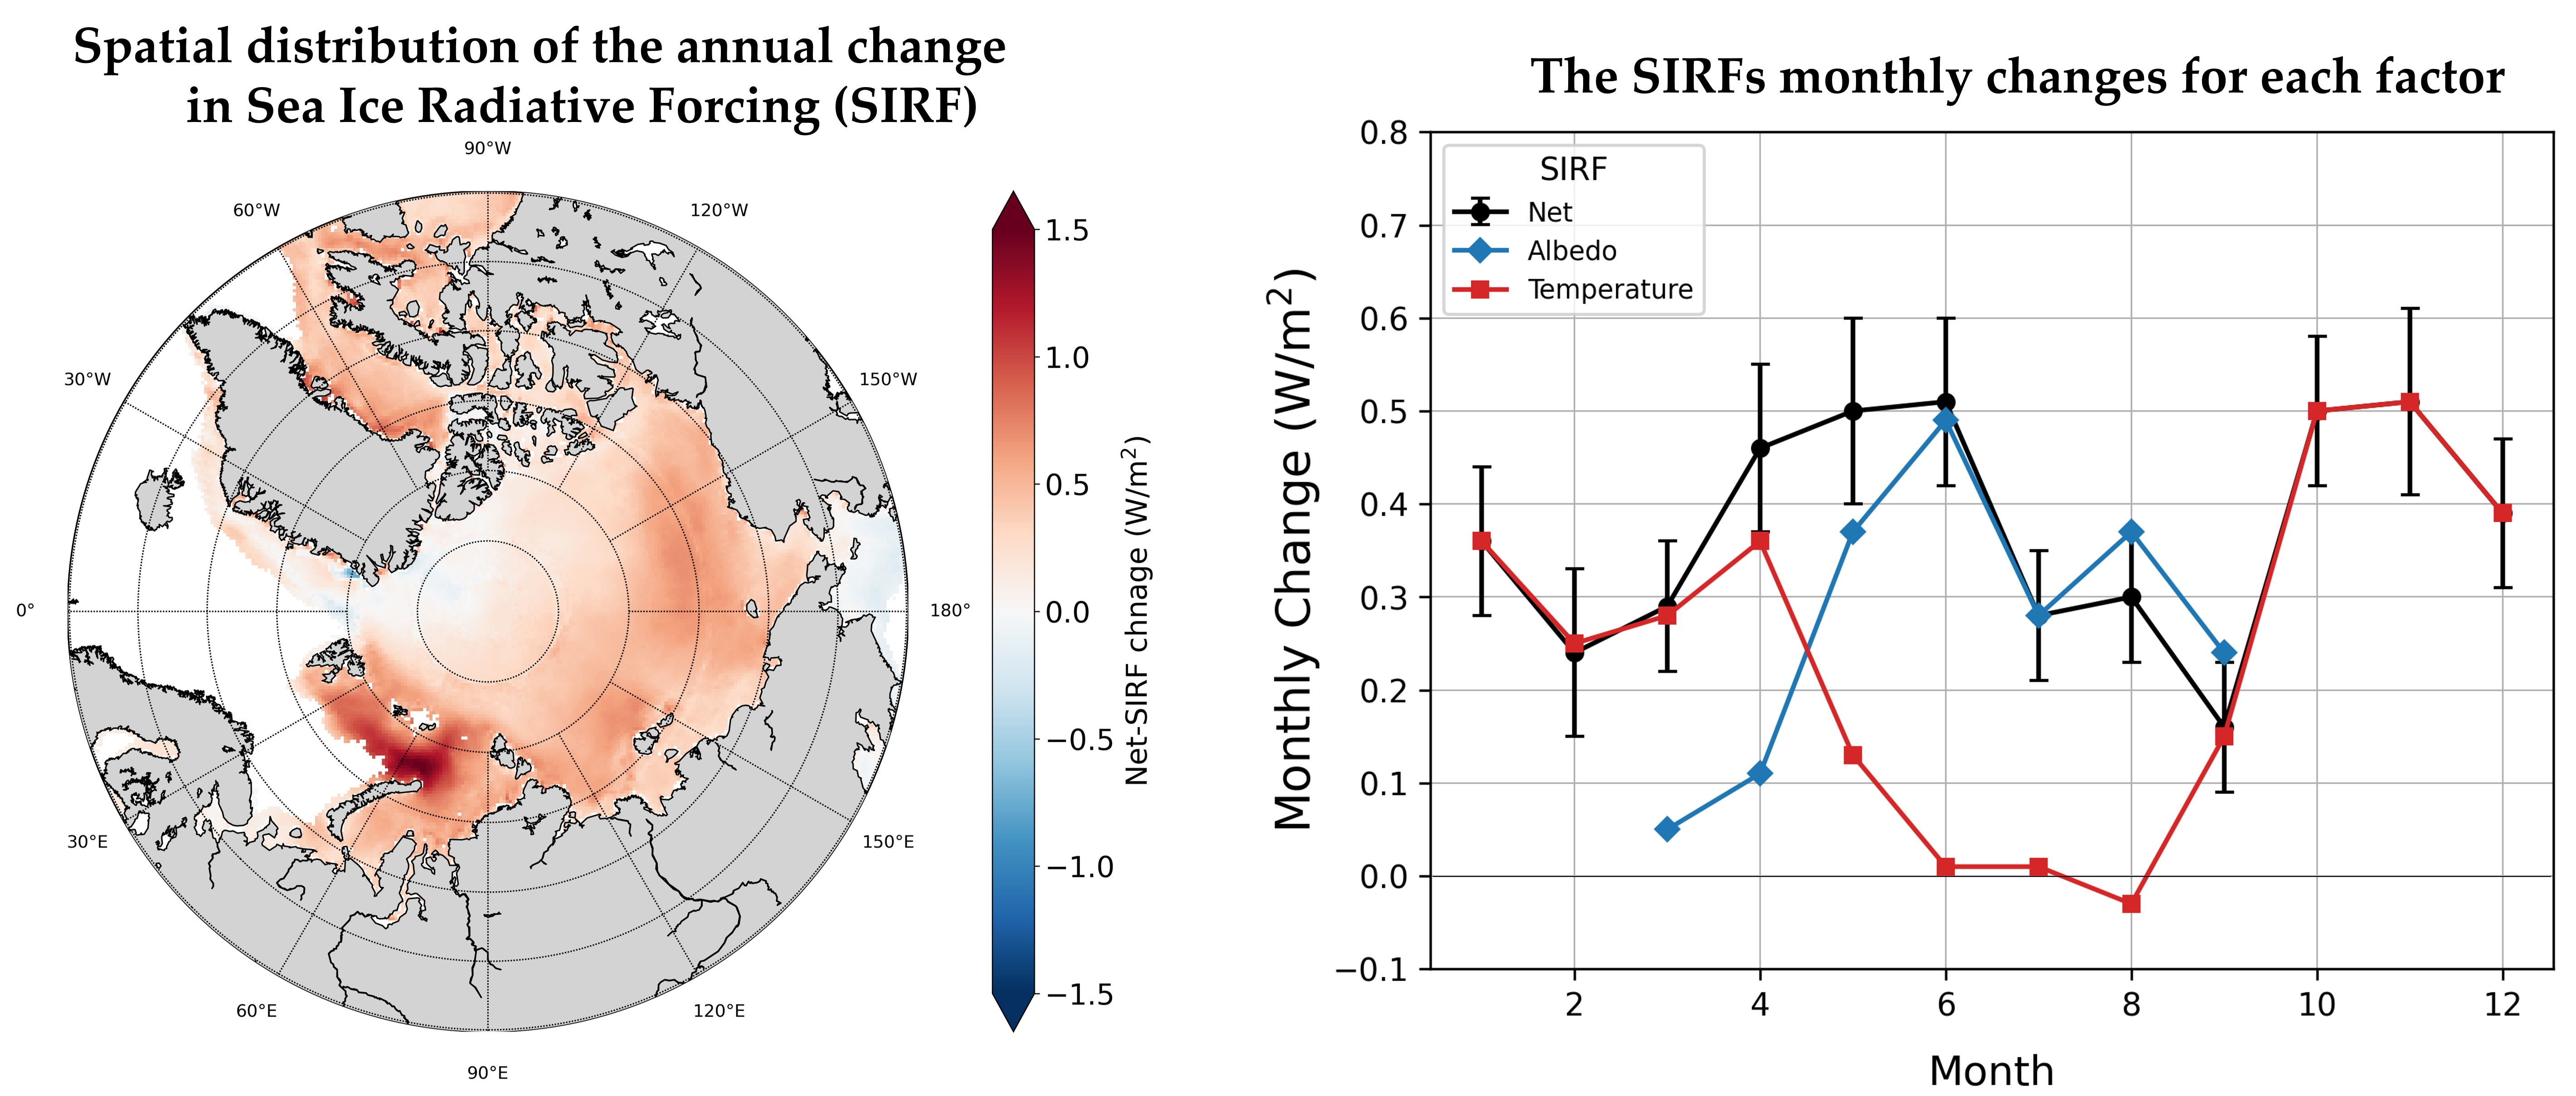
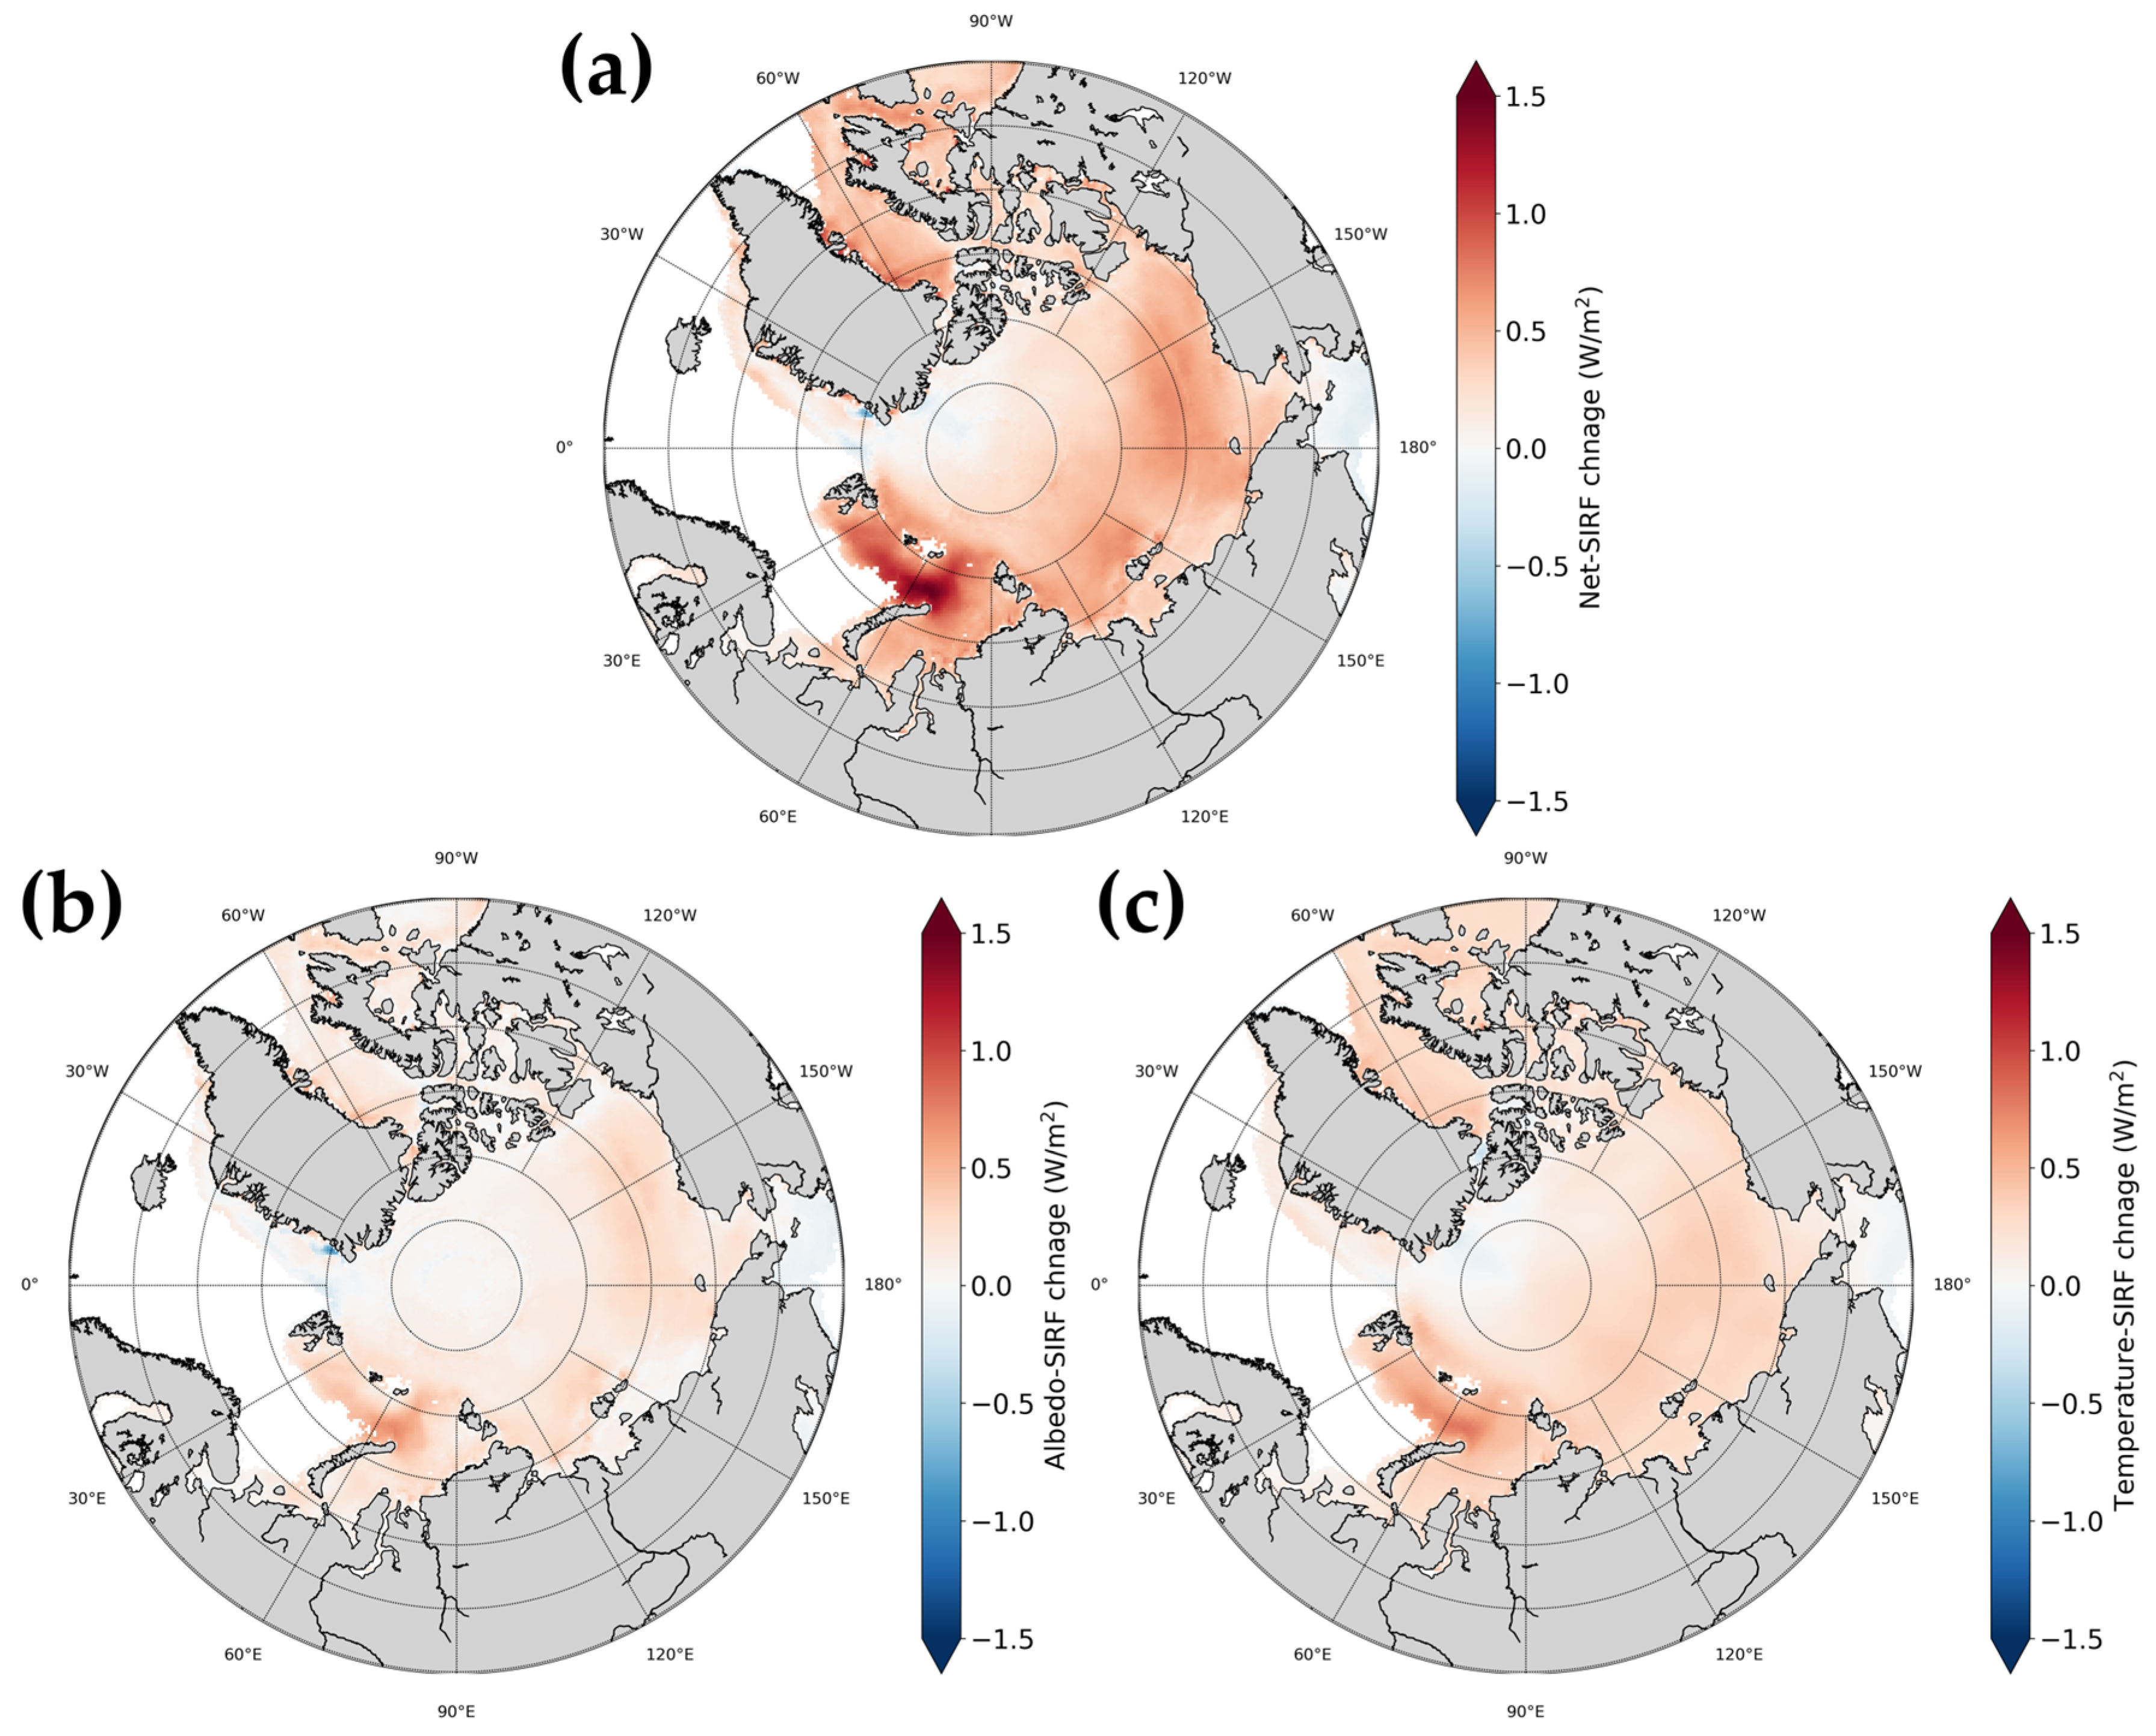
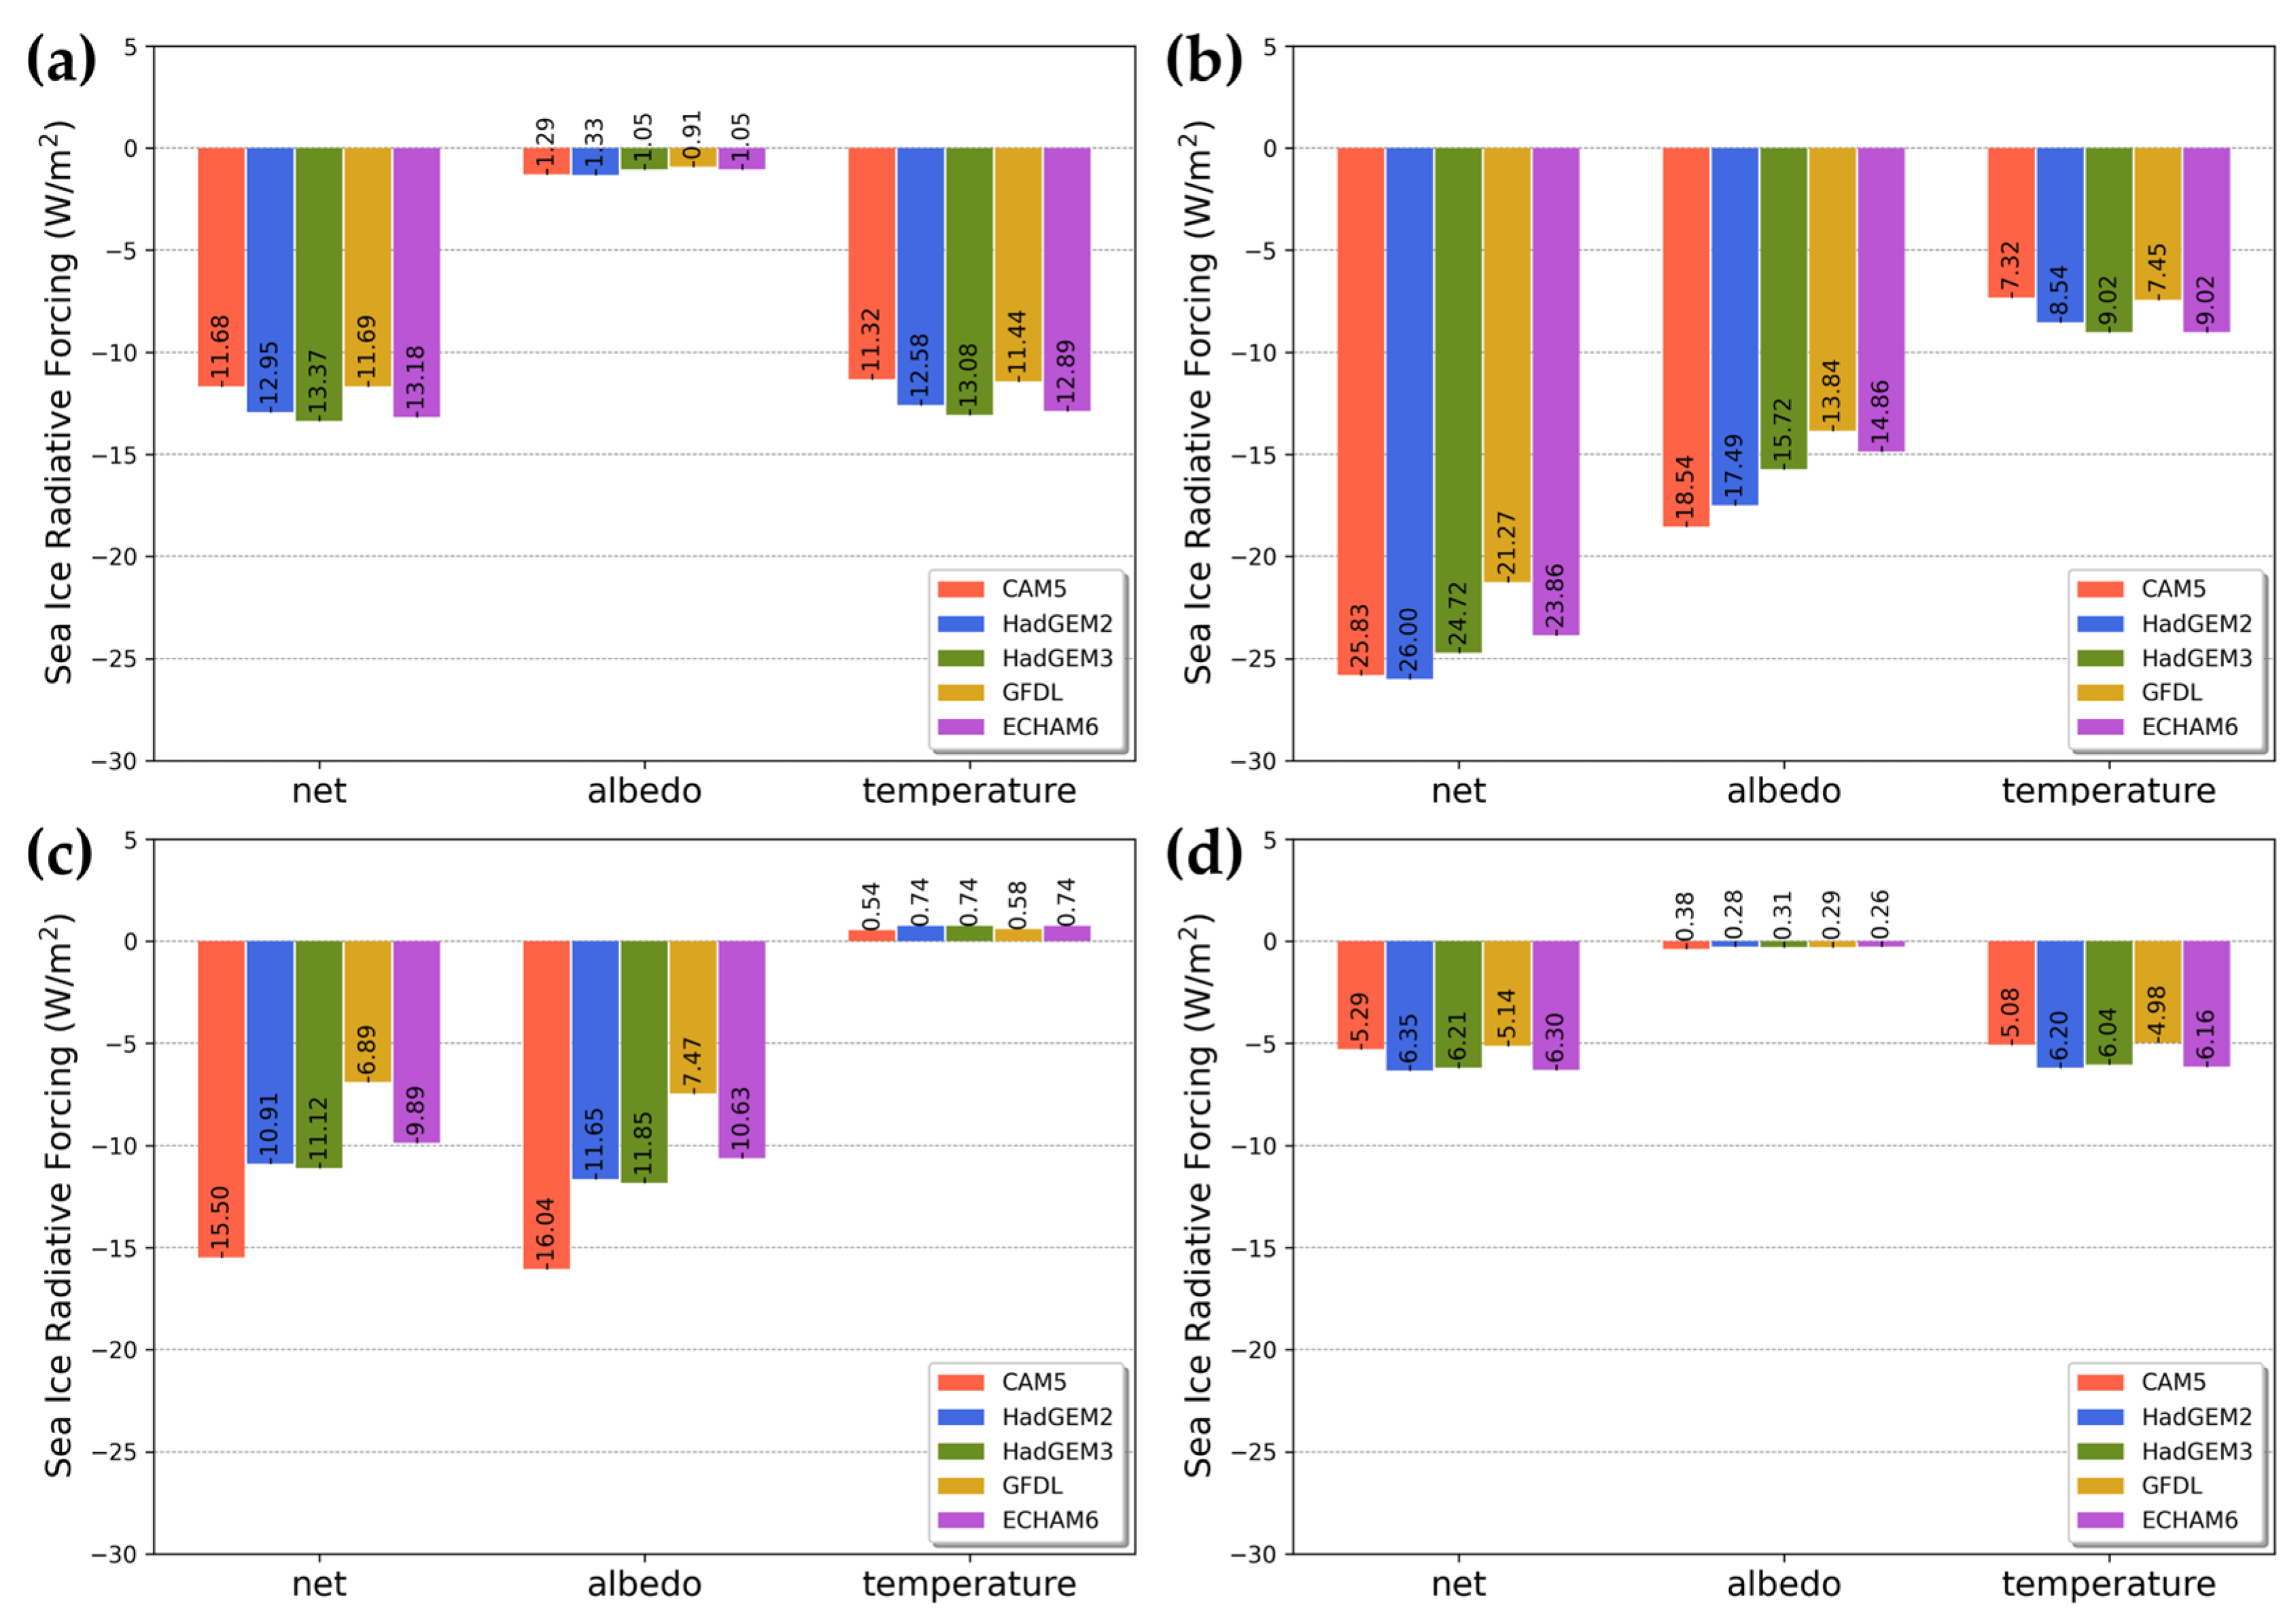
3.1. Annual Characteristic of SIRFs in the Arctic

We calculated the albedo-SIRF and temperature-SIRF using the radiative kernel method, and the sum of the two SIRFs was expressed as net-SIRF. Figure 3 shows the annual average SIRF according to the GCMs from 1982 to 2015.
Regardless of the GCM used, net-SIRF was found to be increasing. The value differed depending on the GCM used, but the trend remained the same. The highest values of net-SIRF were in the order of GFDL, ECHAM6, HadGEM3, HadGEM2, and CAM5. The annual average net-SIRF was calculated as −54.57 ± 3.84 W/m2 by averaging the GCM-based kernels. The average net-SIRF differed by as much as 12.64 W/m2, depending on the GCM used. Unlike other models, there was a relatively large difference in the GFDL-based net-SIRF. The albedo-SIRF and temperature-SIRF also displayed increasing trends, with the values depending on the climate model used. Both SIRFs were calculated to be about −30~−20 W/m2. The average albedo-SIRF differed by as much as 12.94 W/m2, depending on the GCM used, with the CAM5-based albedo-SIRF having the lowest average value (−35.14 ± 1.88 W/m2) and the GFDL-based Albedo-SIRF having the highest average value (−22.17 ± 1.09 W/m2). The average temperature-SIRF differed by as much as 4.41 W/m2, depending on the GCM used, with the HadGEM3-based temperature-SIRF having the lowest average value (−28.60 ± 2.75 W/m2) and the CAM5-based temperature-SIRF having the highest average value (−24.19 ± 2.29 W/m2). The temperature-SIRF changed by 0.22 ± 0.14 W/m2 per year, which was about twice as large as the annual change of albedo (0.12 ± 0.12 W/m2 per year).
We calculated SIRF by averaging the GCM-based kernels for each factor, to confirm the change in SIRF by region, because the overall change trend was similar regardless of the GCM used. Figure 4 shows the spatial distribution of the annual change in SIRF for each factor. The change trend according to sea area was similar for all SIRFs. As shown in Figure 3, there was a relatively strong increasing trend in the overall temperature-SIRF compared to the albedo-SIRF. The calculated values were net-SIRF = 0.62 ± 0.25 W/m2, albedo-SIRF = 0.24 ± 0.14 W/m2, and temperature-SIRF = 0.38 ± 0.11 W/m2 in the Kara Sea, where there was a tendency for net-SIRF to increase more rapidly than in other regions (Table 2). Temperature-SIRF also had a greater impact in these regions. Previous studies [68,69,70,71,72] also showed that the changes in the Barents and Kara seas were more rapid than in other regions of the Arctic. Kumar et al. [68] stated that the rapid change in the region was due to the increase in outgoing longwave radiation (OLR) caused by enhanced heat transfer from the ocean to the atmosphere. In the Baffin, Chukchi, Beaufort, and Laptev regions, the net-SIRF changed faster than the average rate of change in the Arctic. These results were similar to those of previous albedo-SIRF studies [29,36].
The SIRF values tended to decrease in the Baring Sea and some parts of East Green-land, which contrasted with the increasing trend of SIRF values in most of the Arctic region shown in Figure 4. This was because the albedo and temperature values in the Baring and East Greenland regions, where sea ice was present, did not significantly differ from the values in the open-ocean water environment used in this study. We calculated SIRF in regions where sea ice was present [30]. According to the NSIDC [73], only areas with an SIC value of 15% or higher are defined as sea ice areas. The Baring and East Greenland regions had sea ice but, except in winter, the SIC values were less than 15%. These regions contain seasonal ice, while other regions consist of multiyear ice. The albedo of seasonal ice is consistently less than that of multiyear ice [74]. The difference between multiyear and seasonal ice was also evident in the emissivity [75] and the microwave backscattering [76,77], which are closely related to skin temperature. Due to these characteristics, the SIRF trend in these regions was calculated differently from other regions in the Arctic.

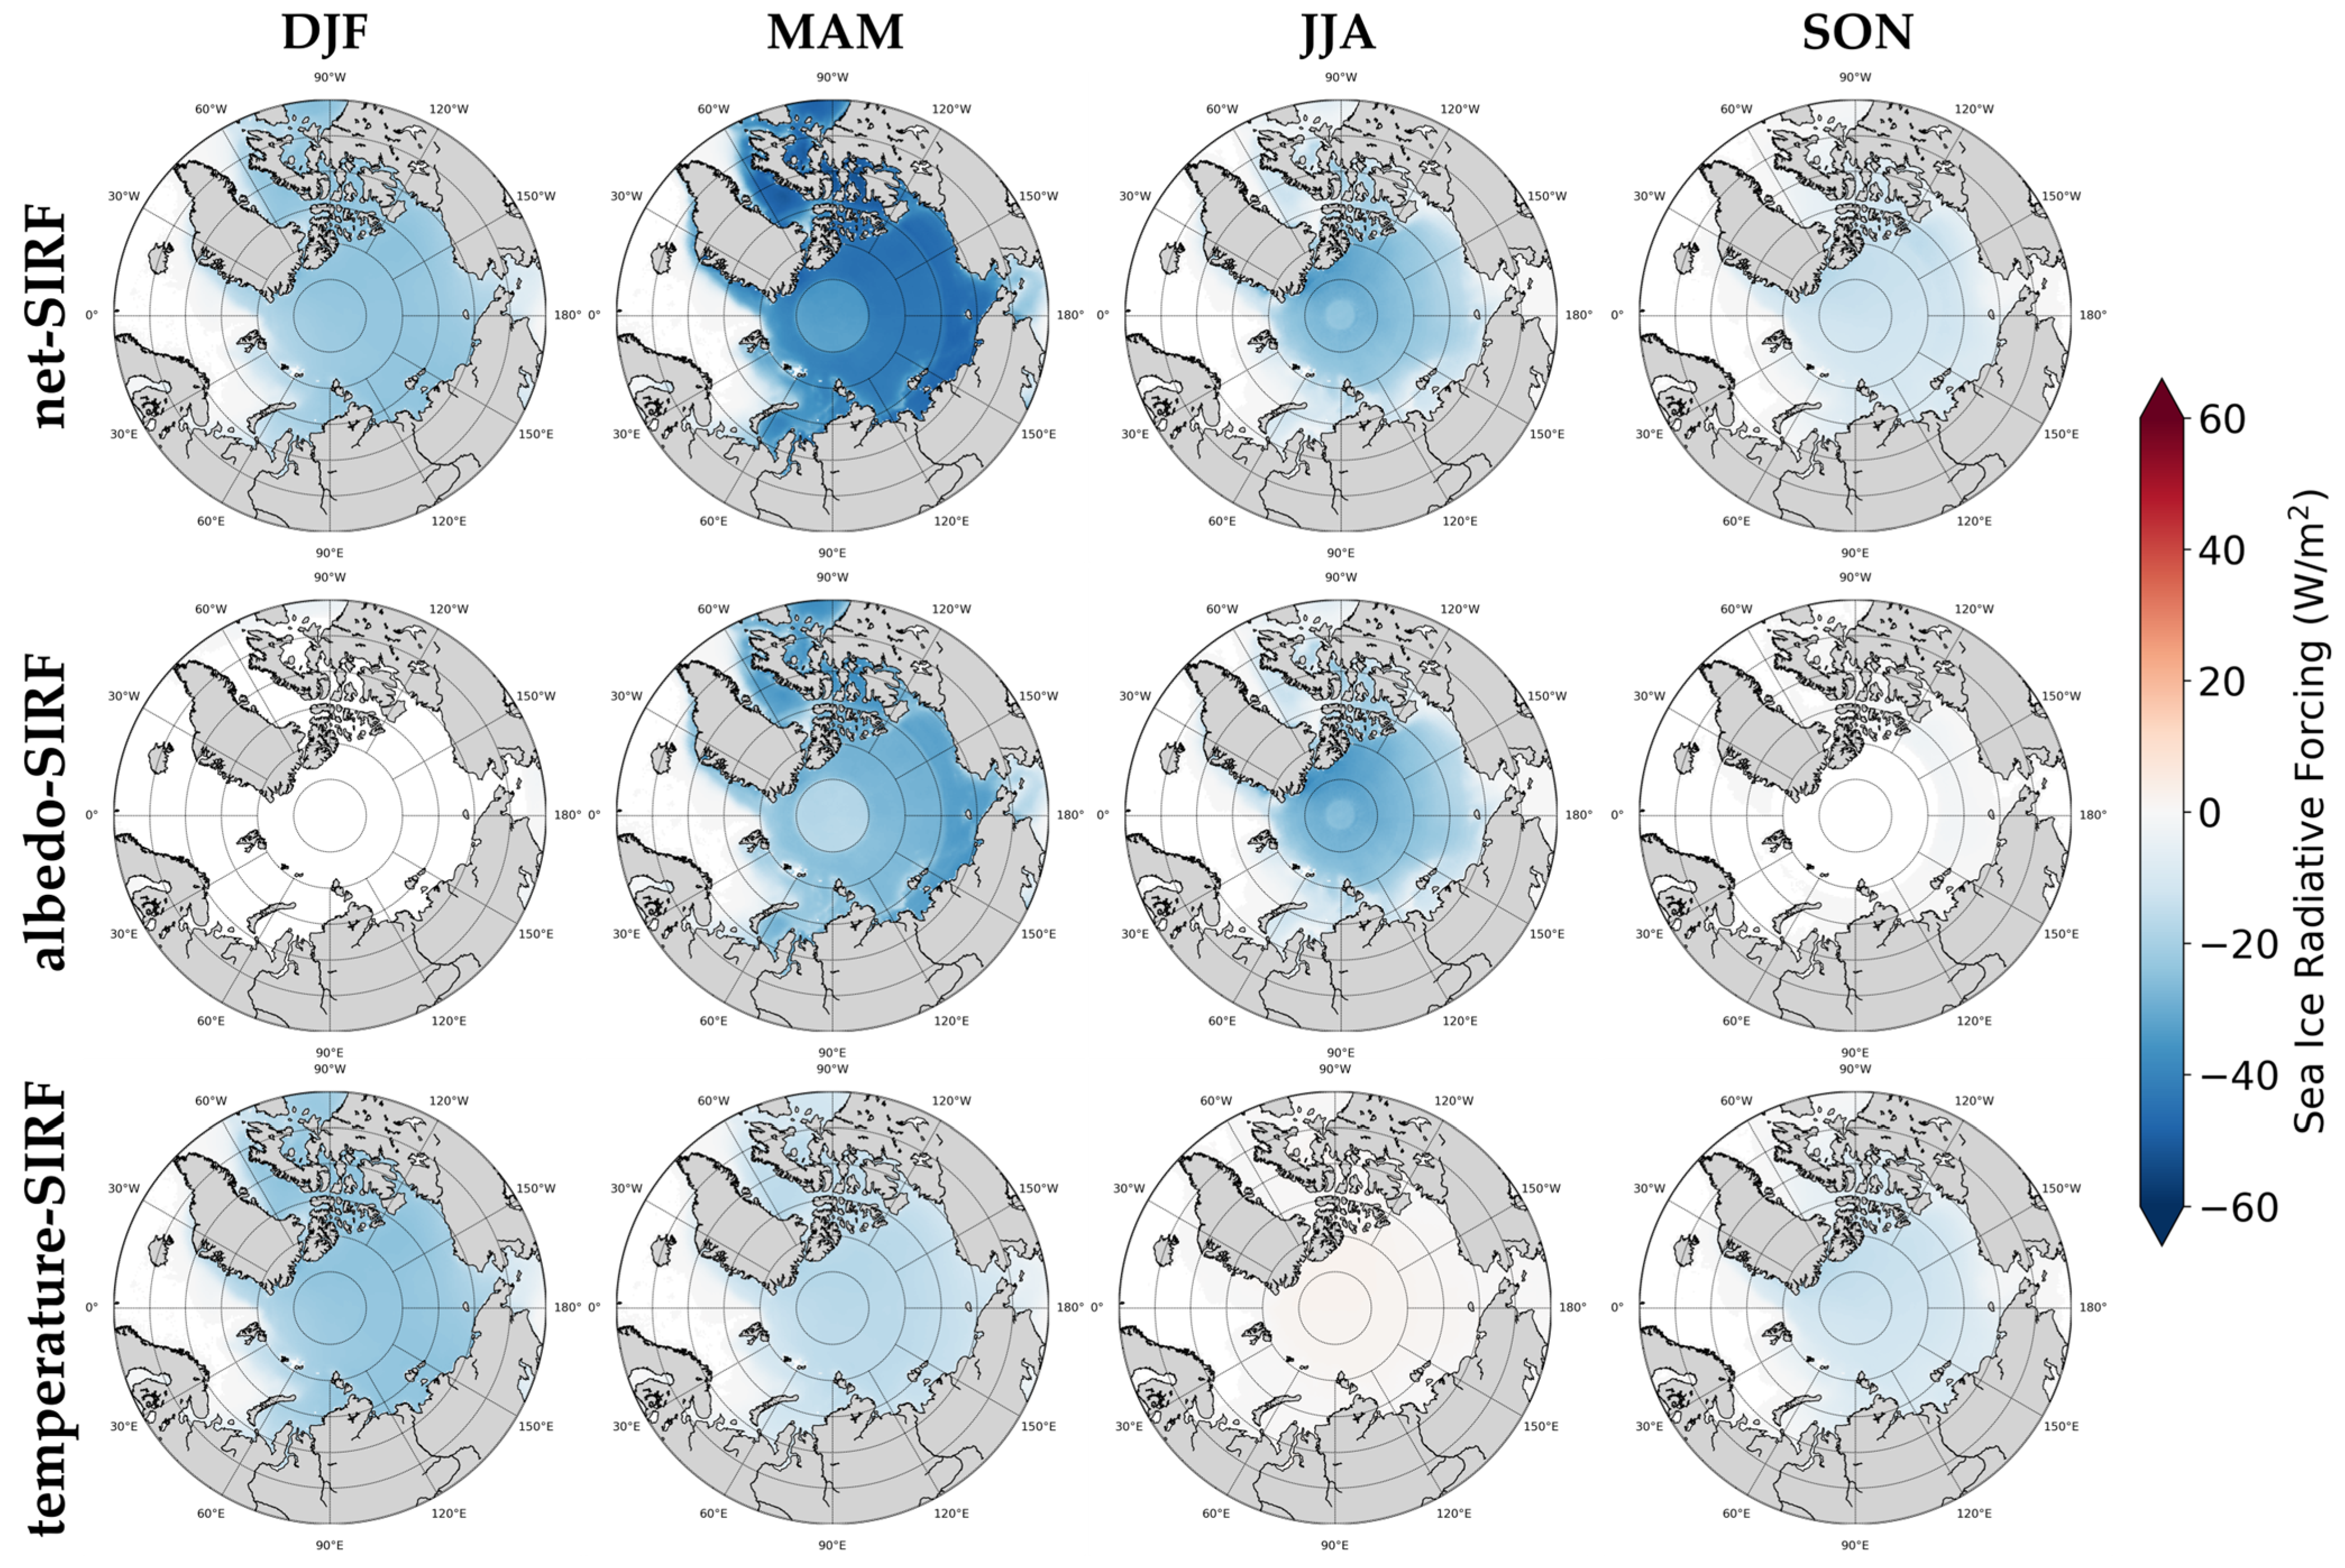
3.2. Seasonal Characteristic of SIRFs in the Arctic

Due to the onset of the polar night, previous studies of albedo-SIRF [29,34,35,36,37] considered only the months March to September, and the surface albedo radiative kernel value was calculated as 0. However, there are seasonal characteristics, with some studies showing that the Arctic amplification was strengthened in winter [39,40,41]. Therefore, we analyzed the trend of SIRFs according to season. All the variables necessary for calculating the seasonal SIRFs used the seasonal average values.
The average SIRFs for each season according to the GCMs during the study period are shown in Figure 5. During the December−January−February (DJF) period, an average net-SIRF of −12.57 W/m2 was calculated, with an average difference of 0.83 W/m2 among the different GCMs (Figure 5a). This was mostly due to the effect of the temperature-SIRF. Because surface albedo was not observed in most areas of the Arctic region in winter, the albedo-SIRF was not significant. The HadGEM3-based net-SIRF had the greatest effect, with an average of −13.37 ± 10.65 W/m2, while the CAM5-based net-SIRF had the smallest impact, with an average of −11.68 ± 9.26 W/m2.
During the March−April−May (MAM) period, an average net-SIRF of −24.34 W/m2 was calculated, with an average difference of 1.92 W/m2 among the GCMs (Figure 5b). The lowest average net-SIRF among all seasons occurred during MAM [29]. Albedo values started to be observed in this period. For all GCMs, the average albedo-SIRF (−16.09 ± 1.92 W/m2) was lower than the average temperature-SIRF (−8.27 ± 0.83 W/m2). The CAM5-based net-SIRF (−25.83 ± 19.64 W/m2) and HadGEM2-based net-SIRF (−26.00 ± 19.64 W/m2) were similar, while the GFDL-based net-SIRF (−21.27 ± 16.48 W/m2) had the highest value. For CAM5, the albedo-SIRF was calculated to be −18.54 ± 14.28 W/m2, which was lower than for other GCMs, while the temperature-SIRF was highest at −7.32 ± 5.80 W/m2.
We calculated an average net-SIRF of −10.86 W/m2 for the June−July−August (JJA) period, and there was an average difference of 3.09 W/m2 among the GCMs used (Figure 5c). In this period, there was a larger difference in net-SIRF among the GCMs compared to other seasons. This was mostly due to albedo-SIRF (average −11.53 ± 3.07 W/m2). The CAM5-based albedo-SIRF was the lowest, at −16.04 ± 15.62 W/m2, and the GFDL-based albedo-SIRF was the highest, at −7.47 ± 7.41 W/m2. The difference between the two SIRFs was 8.57 W/m2, which was the largest difference among the GCMs used in this study. The temperature-SIRF was only 0.67 ± 0.10 W/m2, and therefore had little influence compared to albedo-SIRF. All temperature-SIRF values were positive due to the characteristics of the data used in this study. Sea ice melts rapidly in this period. Based on the ERA5 skin temperature data used in this study, the skin temperature was estimated to be close to 0 °C when ice is melting [78]. This is a higher temperature than the skin temperature set for the open ocean water environment, despite the presence of sea ice in the area. For this reason, the temperature-SIRF was positive at that time.
As shown in Figure 5d, a net-SIRF of −5.86 W/m2 was calculated for the September−October−November (SON) period, and there was an average difference of 0.59 W/m2 among the GCMs used. The highest average net-SIRF was calculated during the SON period. Surface albedo was not observed during this period, and the average albedo-SIRF was low (−0.30 ± 0.05 W/m2). The highest value was calculated for the GFDL-based net-SIRF (−5.14 ± 4.72 W/m2), and the lowest value for the HadGEM2-based net-SIRF (−6.35 ± 5.79 W/m2). Compared to the other seasons, the differences among GCMs were smallest in this period.
Compared to the seasonal differences in SIRF, the differences according to the GCM used were relatively small. The seasonal pattern of each SIRF was similar in all GCMs. We therefore calculated seasonal SIRF using the average of the kernels of GCMs for each factor; their spatial distribution is shown in Figure 6. During the MAM and JJA periods, the net-SIRF and albedo-SIRF were distributed in a circular pattern in the Arctic Central Sea, with different values calculated for the surrounding areas. Albedo-SIRF values were al-most non-existent in the DJF and SON periods because albedo data were not obtained during these periods. There were months in which albedo-SIRF was not calculated when deriving the seasonal average SIRF. As shown in Figure 5c, the temperature-SIRF had positive values in all regions in the JJA period. This is because of the characteristics of the ERA5 skin temperature, as previously described. Except for these regions, seasonal SIRF values during the entire study period did not show regional characteristics.
Table 3 shows the seasonal trend of SIRF changes in the sea areas analyzed in Section 3.1. The annual SIRF change in these sea areas was larger than that for the entire Arctic region (Table 2). There were few regional characteristics in the seasonal average SIRF (Figure 5); however, the seasonal trend of SIRF changes differed by region.
We did not consider the seasonal trend in albedo-SIRF during the DJF and SON periods, because albedo-SIRF was not calculated in most of the seas during these periods. Therefore, net-SIRF and temperature-SIRF were assigned the same value. The net-SIRF of 0.34 ± 0.28 W/m2 was calculated for the entire Arctic during the DJF period, and the highest temperature-SIRF value (0.78 ± 0.42 W/m2) was observed in the Barents region. The lowest value (0.24 ± 0.07 W/m2) was observed in the Beaufort region, which was also lower than that for the Arctic overall.
There was a net-SIRF value of 0.41 ± 0.39 W/m2, albedo-SIRF value of 0.16 ± 0.26 W/m2, and temperature-SIRF value of 0.25 ± 0.19 W/m2 throughout the Arctic region during the MAM period. In the net-SIRF calculation, temperature-SIRF contributed more than albedo-SIRF. However, this trend differed depending on the region. The albedo-SIRF changed more rapidly in the Baffin region (net-SIRF = 0.61 ± 0.37 W/m2, albedo-SIRF = 0.32 ± 0.29 W/m2, temperature-SIRF = 0.30 ± 0.14 W/m2), and Barents region (net-SIRF = 0.96 ± 0.66 W/m2, albedo-SIRF = 0.59 ± 0.41 W/m2, and temperature-SIRF = 0.38 ± 0.27 W/m2) than other areas. The net-SIRF value of the Barents region was the largest during the entire study period. Conversely, the smallest value was observed in the Beaufort region (net-SIRF = 0.33 ± 0.13 W/m2), in which the albedo-SIRF was also the smallest (0.11 ± 0.12 W/m2). Overall, the difference in average albedo-SIRF (0.16 W/m2) tended to be larger than that in the average temperature-SIRF (0.08 W/m2) in most regions.
During the JJA period, the net-SIRF (0.35 ± 0.28 W/m2), albedo-SIRF (0.35 ± 0.31 W/m2), and temperature-SIRF (0.00 ± 0.05 W/m2) were calculated. Due to the characteristics of the ERA5 skin temperature data [78] used in the temperature-SIRF calculation, it had virtually no change trend, as shown in Figure 5c. Unlike other seasons, during this period there were large changes in net-SIRF compared to the entire Arctic in all of the analyzed regions. The largest change in net-SIRF (0.63 ± 0.34 W/m2) occurred in the Kara region, with relatively little change observed in the Baffin region (0.41 ± 0.27 W/m2).
In the SON period, a net-SIRF of 0.41 ± 0.22 W/m2 was calculated for the entire Arctic. The highest annual change in net-SIRF was seen in the Barents region, and in other seasons this area always had greater net-SIRF changes than elsewhere in the Arctic. However, during the SON period, the net-SIRF was 0.38 ± 0.24 W/m2, which was lower than the average value for the Arctic. This value was the second lowest in this period. The region with the highest value was the Chukchi Sea, with a net-SIRF of 0.73 ± 0.22 W/m2.

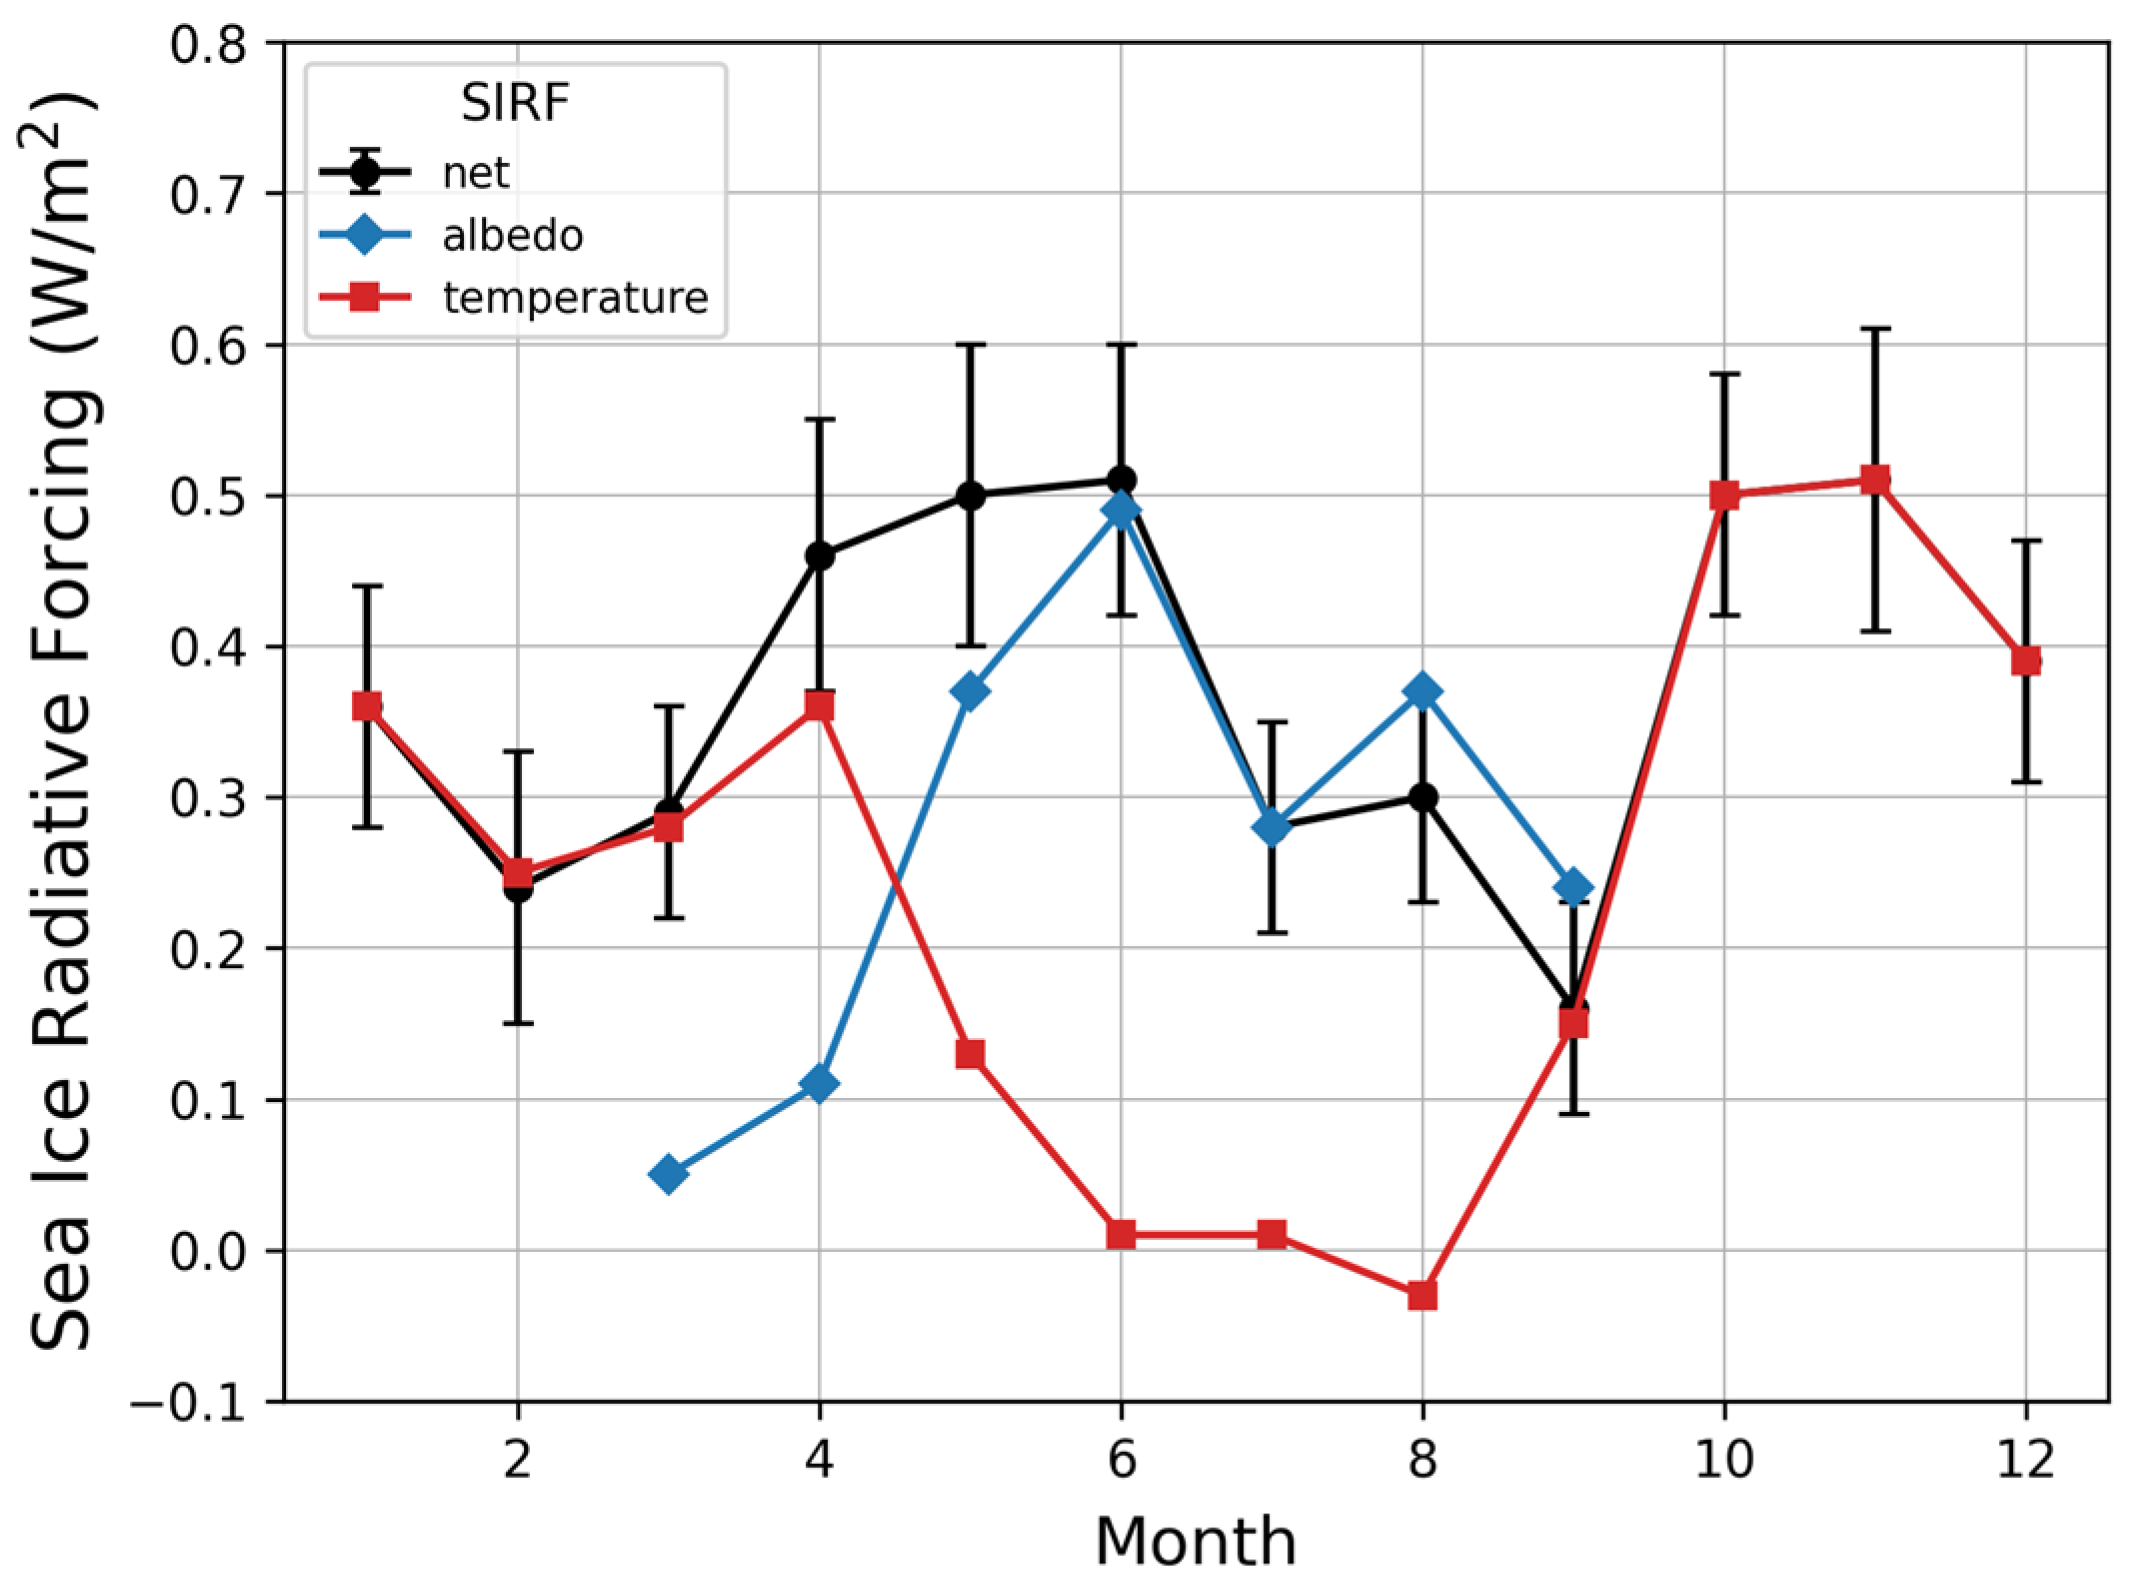
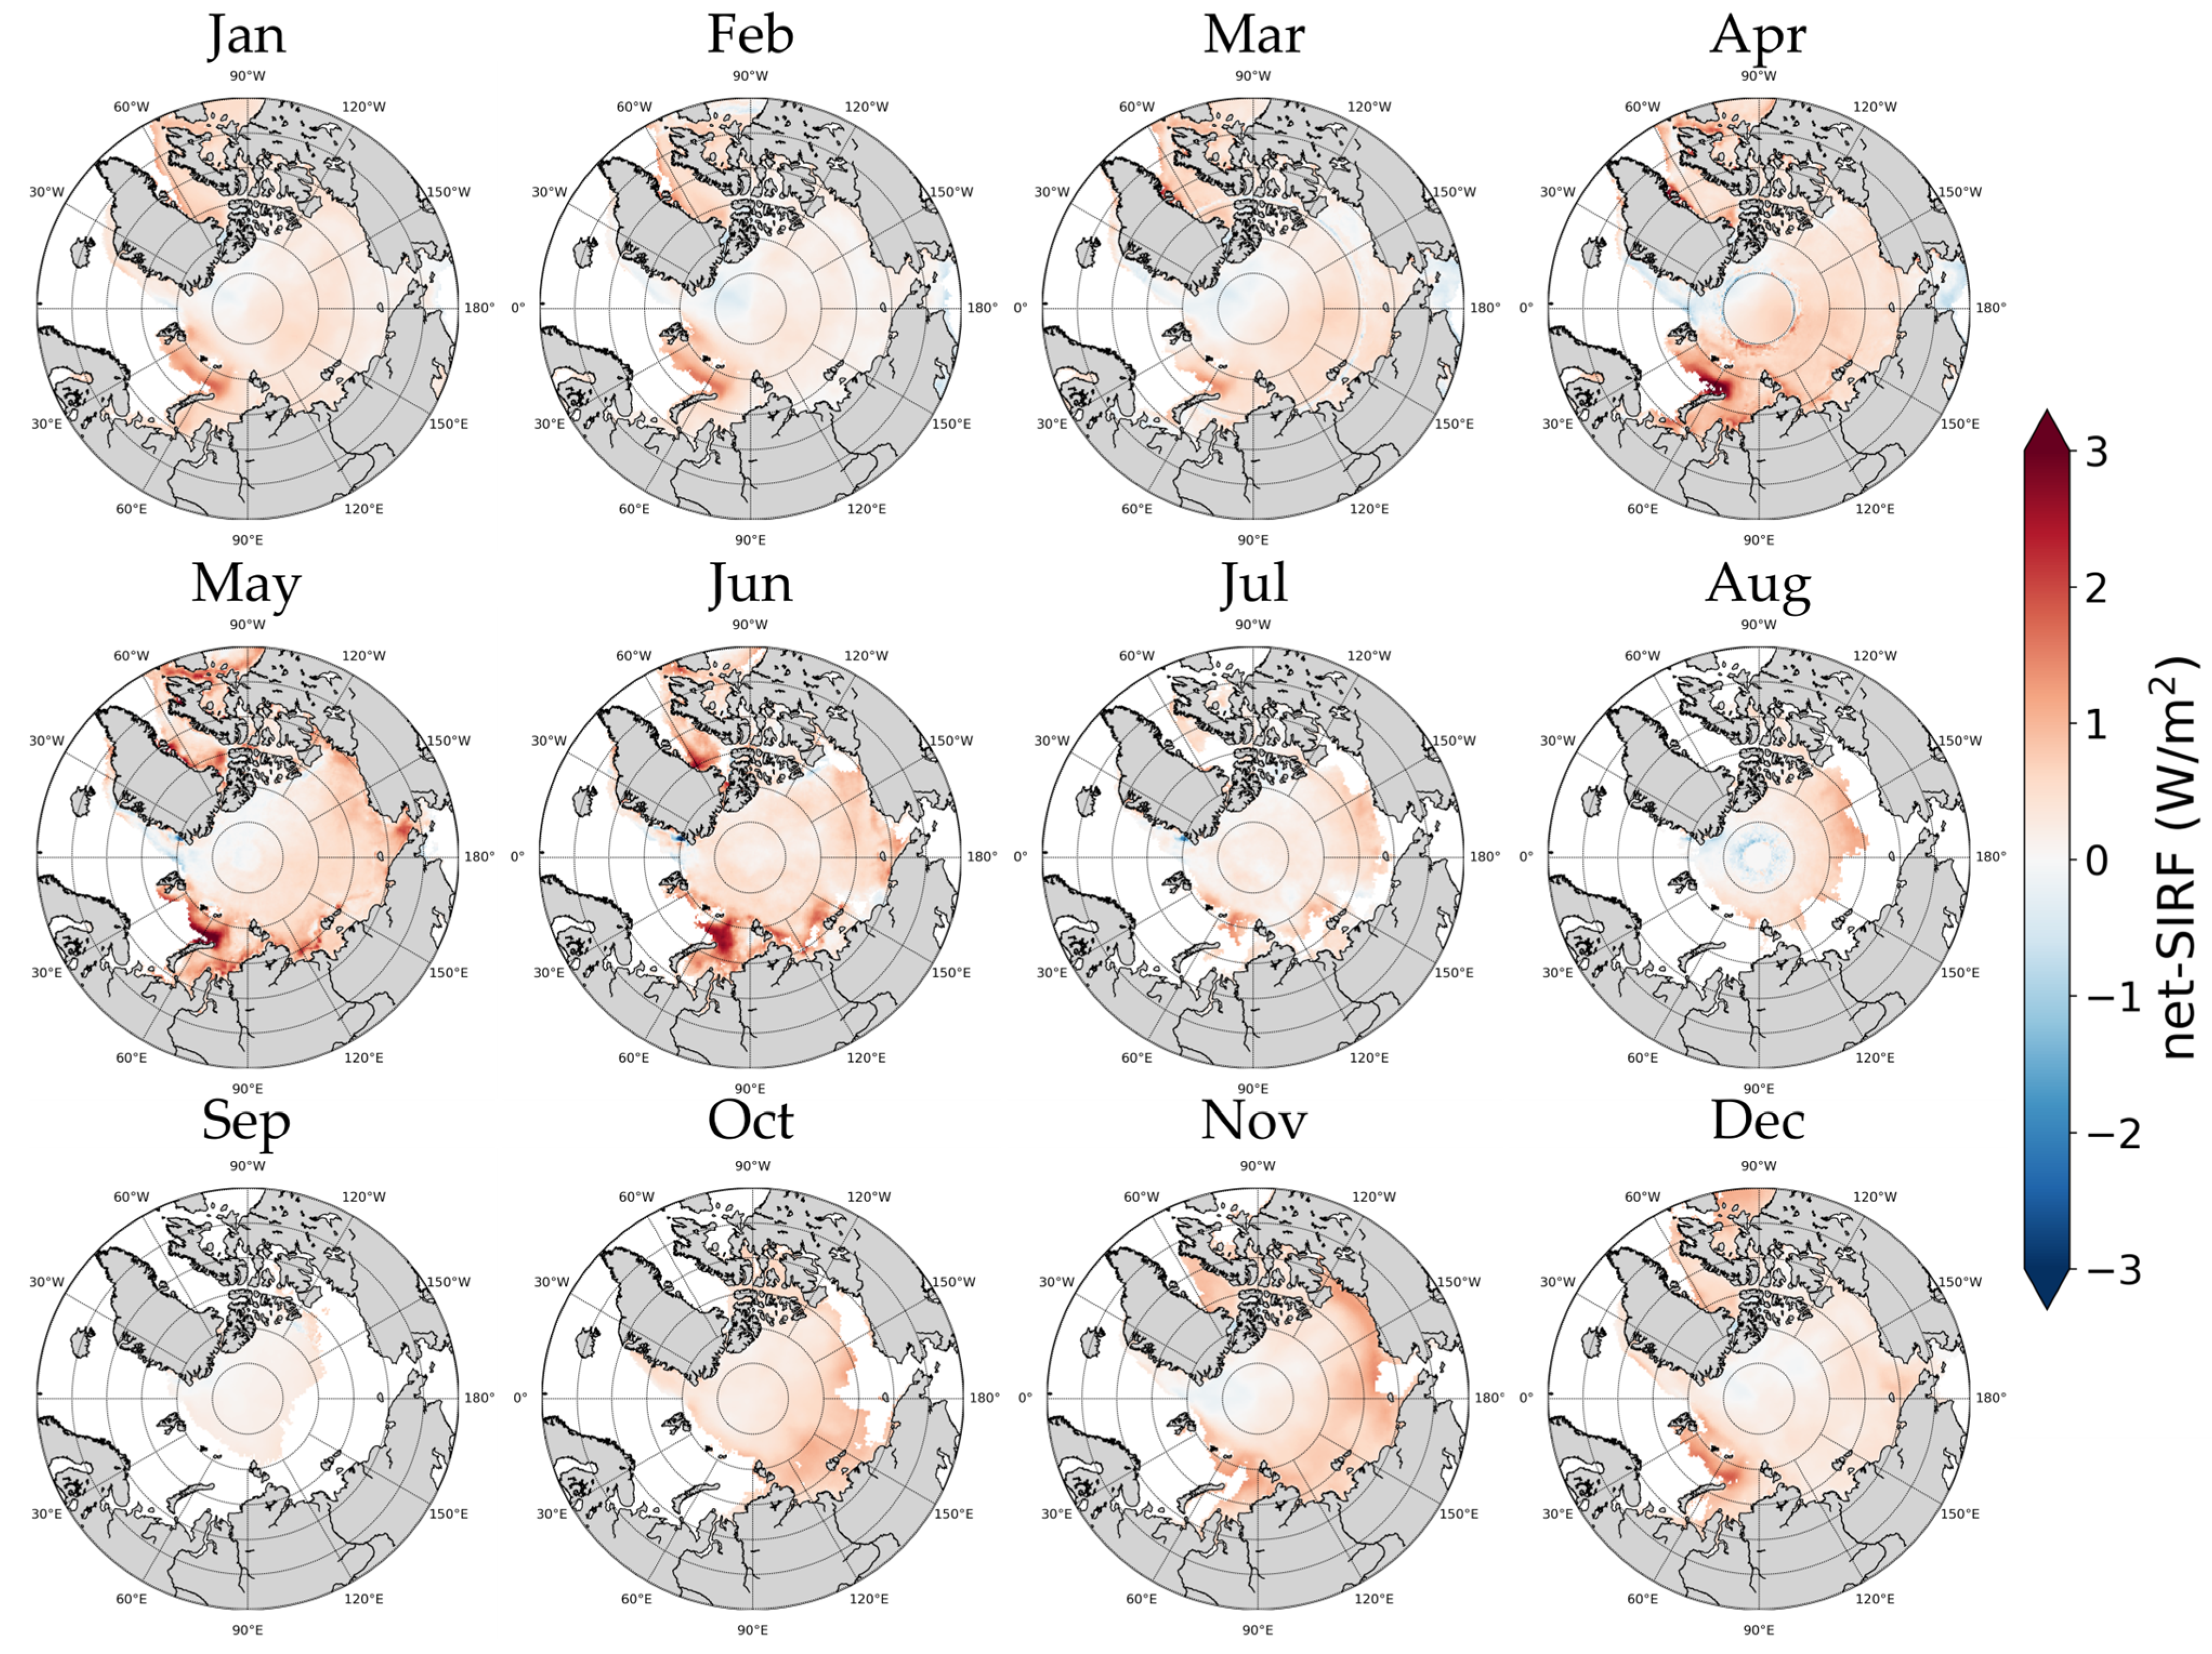
3.3. Monthly Characteristic of SIRFs in the Arctic

We calculated the monthly net-SIRF from the average of five radiative kernels during the study period, as shown in Figure 7. The pattern of change was different depending on the month; however, there was an increasing trend overall. April–June is the period when sea ice begins to melt rapidly, and the albedo-SIRF had a large influence on the net-SIRF in this period. In contrast, the highest net-SIRF was estimated in September. In this study, SIRF was calculated for areas where sea ice exists. This is the time of year when sea ice has the smallest extent in the Arctic. The temperature-SIRF is hardly estimated during this period due to the characteristics of the ERA5 skin temperature.
Figure 8 shows the monthly cycle of net-SIRF changes over a 34-year period, which was calculated from a linear trend using the average of five radiative kernels. The results were significant at the 0.05 level. The monthly change trend of albedo-SIRF in this study was similar to that of previous studies [29,36]. However, when comparing net-SIRF with albedo-SIRF, there were some differences in the results of this study compared to previous ones. In other studies, the greatest change in SIRF occurred in May–June, while in this study there were large changes not only in May–June but also in October–November. The net-SIRF change trend in May was affected by both the albedo-SIRF (0.37 ± 0.07 W/m2) and temperature-SIRF (0.13 ± 0.05 W/m2). The changes in June were mostly due to the albedo-SIRF. The values in October and November were similar to those in May–June due to the influence of the temperature-SIRF (0.50 ± 0.08 and 0.51 13 ± 0.10 W/m2, respectively). The period with the lowest change trend was September. As shown in Table 3, the change trend in the temperature-SIRF was not significant from June to August (0.01 ± 0.01 W/m2, p ≥ 0.3). Because of these characteristics, the distribution of the temperature-SIRF (−0.03–0.51 W/m2) values was wider than that of albedo-SIRF (0.05–0.49 W/m2).
The spatial distribution of net-SIRF changes based on the average of five radiative kernels is shown in Figure 9. As in the previous results, the increasing trend was stronger in the Barents, Laptev, and Kara areas than in other areas, regardless of the month. In April–June, when the change in albedo-SIRF was large, the differences between regions were larger than in other months. During this period, the amount of change in net-SIRF was 1.5 W/m2 or higher not only in the Barents, Laptev, and Kara regions, but also in some areas of Baffin Bay. In contrast, there was a trend toward a decreasing net-SIRF in East Greenland and parts of the Arctic Central Sea in April. In August, a decreasing trend was observed in the Arctic Central Sea. Figure 8 shows that in October and November, the periods in which the net-SIRF change was high was due to the influence of temperature-SIRF, and the difference between regions was relatively small compared to April and June. This result emulated the regional characteristics reported by Bintanja and Krikken [79], although radiative forcing was not calculated using the same method.

4. Concluding Remarks

We calculated the net-SIRF, albedo-SIRF, and temperature-SIRF according to sea ice changes in the Arctic during 1982–2015 and analyzed the characteristics of radiative forcing by season and region. We identified the factors affecting SIRF by year, season, and month. In addition, we further analyzed the regions where annual changes are more rapid than the Arctic average. Annual average radiative forcing differed depending on the cli-mate model used, but all change trends were the same. The average albedo-SIRF and temperature-SIRF during the study period were similar; however, the albedo-SIRF changed by 0.12 ± 0.07 W/m2 per year, while the temperature-SIRF changed by 0.22 ± 0.07 W/m2 per year. The Baffin, Barents, Kara, Laptev, Beaufort, and Chukchi regions had the largest net-SIRF changes in the Arctic. Among these areas, the Kara Sea experienced the most rapid changes, with a net-SIRF of 0.62 ± 0.25 W/m2, albedo-SIRF of 0.24 ± 0.14 W/m2, and temperature-SIRF of 0.38 ± 0.11 W/m2. Analysis by season showed that the change trend of net-SIRF did not differ significantly, while the albedo-SIRF and temperature-SIRF dis-played clear seasonality. Only the effect of the temperature-SIRF was apparent in the DJF and SON periods, and only the effect of the albedo-SIRF change was apparent in the JJA period. During the MAM period, the temperature-SIRF (0.25 ± 0.19 W/m2) changed more rapidly than the albedo-SIRF (0.16 ± 0.26 W/m2). The regions where SIRF changed most rapidly differed by season. The monthly change of net-SIRF was largest in June and November, due to the influence of the albedo-SIRF (0.49 ± 0.09 W/m2) in June and temperature-SIRF (0.51 ± 0.10 W/m2) in November. In April–June, when the influence of albedo was large, the net-SIRF changed abruptly in the Barents and Kara seas, while in November, when the influence of temperature was large, there was little difference between the regions.
The improved calculation of SIRF will improve our understanding of the physical mechanisms that cause Arctic sea ice loss, shed light on the cause of net TOA flux variability [80], and enable the climate parameters that contribute to Arctic amplification to be determined [5]. Many studies have considered albedo to be the main factor responsible for arctic amplification [28,81,82]. The albedo-SIRF changes in this study displayed a pattern similar to those of previous studies [29,36]. In this study, the net-SIRF was calculated by considering not only the albedo-SIRF, but also the temperature-SIRF. The albedo-SIRF and temperature-SIRF had similar effects on net-SIRF; however, there has been a rapid acceleration of changes in the temperature-SIRF compared to the albedo-SIRF. Thus, more rapid change in the Arctic may be predicted when only albedo is used in estimations. Further research is needed to determine the effects of changes in skin temperature and albedo on Arctic sea ice from a surface perspective.

Author Contributions

Conceptualization, N.-H.S., M.S., H.-C.K. and K.-S.H.; methodology, N.-H.S., K.-S.L. and K.-S.H.; formal analysis, N.-H.S., S.C., D.J. (Donghyun Jin) and M.S.; investigation, N.-H.S., J.W. and N.K.; writing: original draft preparation, N.-H.S.; writing: review and editing, N.-H.S. and K.-S.H.; visualization, N.-H.S., D.J. (Donghyun Jin), D.J. (Daeseong Jung) and S.S.; supervision, K.-S.H.; project administration, H.-C.K. and K.-S.H.; funding acquisition, K.-S.H. All authors have read and agreed to the published version of the manuscript.

Funding

This research was funded by the Korea Polar Research Institute, grant number PE22040.

Data Availability Statement

The CLARA-A2 are available at the CM SAF website at https://wui.cmsaf.eu/safira/action/viewDoiDetails?acronym=CLARA_AVHRR_V002_01 (accessed on 28 April 2022). The ECMWF ERA5 data are available at the ECMWF website at https://cds.climate.copernicus.eu/cdsapp#!/search?type=dataset (accessed on 28 April 2022). The NSIDC data are available at the NSIDC website at https://nsidc.org/data (accessed on 28 April 2022). The CAM5 and the ECHAM6 data are available at the NCAR website at https://climatedataguide.ucar.edu/climate-data/radiative-kernels-climate-models (accessed on 28 April 2022). The HadGEM2 and the HadGEM3 data are available at the University of Leeds website at http://homepages.see.leeds.ac.uk/~mencsm/kernels.htm (accessed on 28 April 2022). The GFDL data are available at the University of Miami website at https://climate.rsmas.miami.edu/data/radiative-kernels/index.html (accessed on 28 April 2022).

Conflicts of Interest

The authors declare no conflict of interest.

References

  1. GCOS. Snow: Essential Climate Variable (ECV) Factsheet. 2022. Available online: https://gcos.wmo.int/en/essential-climate-variables/sea-ice/ (accessed on 26 April 2022).
  2. Ledley, T.S. A coupled energy balance climate-sea ice model: Impact of sea ice and leads on climate. J. Geophys. Res. Atmos. 1988, 93, 15919–15932. [Google Scholar] [CrossRef]
  3. Manabe, S.; Wetherald, R.T. The Effects of Doubling the CO2 Concentration on the climate of a General Circulation Model. J. Atmos. Sci. 1975, 32, 3–15. [Google Scholar] [CrossRef] [Green Version]
  4. Serreze, M.C.; Barrett, A.P.; Stroeve, J.C.; Kindig, D.N.; Holland, M.M. The emergence of surface-based arctic amplification. Cryosphere 2009, 3, 11–19. [Google Scholar] [CrossRef] [Green Version]
  5. Screen, J.A.; Simmonds, I. The central role of diminishing sea ice in recent arctic temperature amplification. Nature 2010, 464, 1334–1337. [Google Scholar] [CrossRef] [Green Version]
  6. Cowtan, K.; Way, R.G. Coverage bias in the HadCRUT4 temperature series and its impact on recent temperature trends. Q. J. R. Meteorol. Soc. 2014, 140, 1935–1944. [Google Scholar] [CrossRef] [Green Version]
  7. Cohen, J.; Screen, J.A.; Furtado, J.C.; Barlow, M.; Whittleston, D.; Coumou, D.; Francis, J.; Dethloff, K.; Entekhabi, D.; Overland, J.; et al. Recent Arctic amplification and extreme mid-latitude weather. Nat. Geosci. 2014, 7, 627. [Google Scholar] [CrossRef] [Green Version]
  8. Hoffert, M.I.; Covey, C. Deriving Global Climate Sensitivity from Paleoclimate Reconstructions. Nature 1992, 360, 573–576. [Google Scholar] [CrossRef] [Green Version]
  9. Miller, G.H.; Alley, R.B.; Brigham-Grette, J.; Fitzpatrick, J.J.; Polyak, L.; Serreze, M.C.; White, J.W.C. Arctic amplification: Can the past constrain the future? Quat. Sci. Rev. 2010, 29, 1779–1790. [Google Scholar] [CrossRef]
  10. Bekryaev, R.V.; Polyakov, I.V.; Alexeev, V.A. Role of polar amplification in long-term surface air temperature variations and modern Arctic warming. J. Clim. 2010, 23, 3888–3906. [Google Scholar] [CrossRef]
  11. Wang, Q.; Fan, X.; Wang, M. Evidence of high-elevation amplification versus Arctic amplification. Sci. Rep. 2016, 6, 19219. [Google Scholar] [CrossRef] [Green Version]
  12. Blunden, J.; Arndt, D.S. State of the Climate in 2018. Bull. Am. Meteorol. Soc. 2019, 100, Si-S306. [Google Scholar] [CrossRef] [Green Version]
  13. IPCC. Climate Change 2013: The Physical Science Basis. Contribution of Working Group I to the Fifth Assessment Report of the Intergovernmental Panel on Climate Change; Cambridge University Press: Cambridge, UK, 2013; p. 1535. [Google Scholar] [CrossRef] [Green Version]
  14. Davy, R.; Outten, S. The arctic surface climate in CMIP6: Status and developments since CMIP5. J. Clim. 2020, 33, 8047–8068. [Google Scholar] [CrossRef]
  15. Touzi, R. Target Scattering Decomposition in Terms of Roll-Invariant Target Parameters. IEEE Trans. Geosci. Remote Sens. 2007, 45, 73–84. [Google Scholar] [CrossRef]
  16. Muhuri, A.; Manickam, S.; Bhattacharya, A. Scattering Mechanism Based Snow Cover Mapping Using RADARSAT-2 C-Band Polarimetric SAR Data. IEEE J. Sel. Top. Appl. Earth Obs. Remote Sens. 2017, 10, 3213–3224. [Google Scholar] [CrossRef]
  17. Bhattacharya, A.; Muhuri, A.; De, S.; Manickam, S.; Frery, A.C. Modifying the Yamaguchi Four-Component Decomposition Scattering Powers Using a Stochastic Distance. IEEE J. Sel. Top. Appl. Earth Obs. Remote Sens. 2015, 8, 3497–3506. [Google Scholar] [CrossRef] [Green Version]
  18. Nature, Arctic Sea Ice Hits 2021 Minimum. 2022. Available online: https://0-www-nature-com.brum.beds.ac.uk/articles/d41586-021-02649-6 (accessed on 26 April 2022).
  19. Peng, G.; Matthews, J.L.; Wang, M.; Vose, R.; Sun, L. What Do Global Climate Models Tell Us about Future Arctic Sea Ice Coverage Changes? Climate 2020, 8, 15. [Google Scholar] [CrossRef] [Green Version]
  20. Hankel, C.; Tziperman, E. The Role of Atmospheric Feedbacks in Abrupt Winter Arctic Sea Ice Loss in Future Warming Scenarios. J. Clim. 2021, 34, 4435–4447. [Google Scholar] [CrossRef]
  21. Mioduszewski, J.R.; Vavrus, S.; Wang, M.; Holland, M.; Landrum, L. Past and future interannual variability in Arctic sea ice in coupled climate models. Cryosphere 2019, 13, 113–124. [Google Scholar] [CrossRef] [Green Version]
  22. CMIP. Arctic Sea Ice in CMIP6. Geophys. Res. Lett. 2020, 47, e2019GL086749. [Google Scholar] [CrossRef]
  23. Stroeve, J.; Notz, D. Changing state of Arctic sea ice across all seasons. Environ. Res. Lett. 2018, 13, 103001. [Google Scholar] [CrossRef]
  24. Hall, A. The role of surface albedo feedback in climate. J. Clim. 2004, 17, 1550–1568. [Google Scholar] [CrossRef] [Green Version]
  25. Bony, S.; Colman, R.; Kattsov, V.M.; Allan, R.P.; Bretherton, C.S.; Dufresne, J.L.; Hall, A.; Soden, B.J.; Tselioudis, G.; Webb, M.J. How well do we understand and evaluate climate change feedback processes? J. Clim. 2006, 191, 3445–3482. [Google Scholar] [CrossRef] [Green Version]
  26. Goosse, H.; Kay, J.E.; Armour, K.C.; Bodas-Salcedo, A.; Chepfer, H.; Docquier, D.; Jonko, A.; Kushner, P.J.; Lecomte, O.; Massonnet, F.; et al. Quantifying climate feedbacks in polar regions. Nat. Commun. 2018, 9, 1919. [Google Scholar] [CrossRef] [PubMed]
  27. Thackeray, C.W.; Hall, A. An emergent constraint on future Arctic sea-ice albedo feedback. Nat. Clim. Change 2019, 9, 972–978. [Google Scholar] [CrossRef]
  28. Flanner, M.G.; Shell, K.M.; Barlage, M.; Perovich, D.K.; Tschudi, M.A. Radiative forcing and albedo feedback from the Northern Hemisphere cryosphere between 1979 and 2008. Nat. Geosci. 2011, 4, 151. [Google Scholar] [CrossRef]
  29. Cao, Y.; Liang, S.; Chen, X.; He, T. Assessment of sea ice albedo radiative forcing and feedback over the Northern Hemisphere from 1982 to 2009 using satellite and reanalysis data. J. Clim. 2015, 28, 1248–1259. [Google Scholar] [CrossRef]
  30. Xiao, L.; Che, T.; Chen, L.; Xie, H.; Dai, L. Quantifying Snow Albedo Radiative Forcing and Its Feedback during 2003–2016. Remote Sens. 2017, 9, 883. [Google Scholar] [CrossRef] [Green Version]
  31. Chen, X.; Liang, S.; Cao, Y. Satellite observed changes in the Northern Hemisphere snow cover phenology and the associated radiative forcing and feedback between 1982 and 2013. Environ. Res. Lett. 2016, 11, 084002. [Google Scholar] [CrossRef]
  32. Chen, X.; Yang, Y.; Yin, C. Contribution of Changes in Snow Cover Extent to Shortwave Radiation Perturbations at the Top of the Atmosphere over the Northern Hemisphere during 2000–2019. Remote Sens. 2021, 13, 4938. [Google Scholar] [CrossRef]
  33. Chen, X.; Liang, S.; Cao, Y.; He, T.; Wang, D. Observed contrast changes in snow cover phenology in northern middle and high latitudes from 2001–2014. Sci. Rep. 2015, 5, 16820. [Google Scholar] [CrossRef] [Green Version]
  34. Cao, Y.; Liang, S.; He, T.; Chen, X. Evaluation of Four Reanalysis Surface Albedo Data Sets in Arctic Using a Satellite Product. IEEE Geosci. Remote Sens. Lett. 2016, 13, 384–388. [Google Scholar] [CrossRef]
  35. Pistone, K.; Eisenman, I.; Ramanathan, V. Observational determination of albedo decrease caused by vanishing Arctic sea ice. Proc. Natl. Acad. Sci. USA 2014, 111, 3322–3326. [Google Scholar] [CrossRef] [Green Version]
  36. Marcianesi, F.; Aulicino, G.; Wadhams, P. Arctic sea ice and snow cover albedo variability and trends during the last three decades. Polar Sci. 2021, 28, 100617. [Google Scholar] [CrossRef]
  37. Wang, X.; Key, J.R. Arctic surface, cloud, and radiation properties based on the AVHRR polar pathfinder data set. Part I: Spatial and temporal characteristics. J. Clim. 2005, 18, 2558–2574. [Google Scholar] [CrossRef] [Green Version]
  38. Shell, K.M.; Kiehl, J.; Shields, C.A. Using the radiative kernel technique to calculate climate feedbacks in NCAR’s community atmospheric model. J. Clim. 2008, 21, 2269–2282. [Google Scholar] [CrossRef]
  39. Kumar, A.; Perlwitz, J.; Eischeid, J.; Quan, X.; Xu, T.; Zhang, T.; Hoerling, M.; Jha, B.; Wang, W. Contribution of sea ice loss to Arctic amplification. Geophys. Res. Lett. 2010, 37, 2–7. [Google Scholar] [CrossRef] [Green Version]
  40. Serreze, M.C.; Barry, R.G. Processes and impacts of Arctic amplification: A research synthesis. Global Planet. Change 2011, 77, 85–96. [Google Scholar] [CrossRef]
  41. Haine, T.W.N.; Martin, T. The Arctic-Subarctic sea ice system is entering a seasonal regime: Implications for future Arctic amplification. Sci. Rep. 2017, 7, 4618. [Google Scholar] [CrossRef]
  42. Tsuang, B.J.; Tu, C.Y.; Tsai, J.L.; Dracup, J.; Arpe, K.; Meyers, T. A more accurate scheme for calculating Earth’s skin temperature. Clim. Dyn. 2009, 32, 251–272. [Google Scholar] [CrossRef] [Green Version]
  43. Pithan, F.; Mauritsen, T. Arctic amplification dominated by temperature feedbacks in contemporary cliamte models. Nat. Geosci. 2014, 7, 181–184. [Google Scholar] [CrossRef]
  44. Pendergrass, A.G.; Conley, A.; Vitt, F.M. Surface and Top-of-Atmosphere Radiative Feedback Kernels for CESM-CAM5. Earth Syst. Sci. Data 2018, 10, 317–324. [Google Scholar] [CrossRef] [Green Version]
  45. Smith, C.J.; Kramer, R.J.; Myhre, G.; Forster, P.M.; Soden, B.J.; Andrews, T.; Boucher, O.; Faluvegi, G.; Flaschner, D.; Hodnebrog, O.; et al. Understanding Rapid Adjustments to Diverse Forcing Agents. Geophys. Res. Lett. 2018, 45, 12023–12031. [Google Scholar] [CrossRef] [PubMed] [Green Version]
  46. Smith, C.J.; Kramer, R.J.; Sima, A. The HadGEM3-GA7. 1 radiative kernel: The importance of a well-resolved stratosphere. Earth Syst. Sci. Data 2020, 12, 2157–2168. [Google Scholar] [CrossRef]
  47. Soden, B.J.; Held, I.M.; Colman, R.; Shell, K.M.; Kiehl, J.T.; Shields, C.A. Quantifying climate feedbacks using radia-tive kernels. J. Clim. 2008, 21, 3504–3520. [Google Scholar] [CrossRef]
  48. Stevens, B.; Giorgetta, M.A.; Esch, M.; Mauritsen, T.; Crueger, T.; Rast, S.; Salzmann, M.; Schmidt, H.; Bader, J.; Block, K.; et al. Atmospheric component of the MPI-M earth system model: ECHAM6. J. Adv. Model. Earth Syst. 2013, 5, 146–172. [Google Scholar] [CrossRef]
  49. Seo, M.; Kim, H.C.; Lee, K.S.; Seong, N.H.; Lee, E.; Kim, J.; Han, K.S. Characteristics of the Reanalysis and Satellite-Based Surface Net Radiation Data in the Arctic. J. Sens. 2020, 2020, 8825870. [Google Scholar] [CrossRef]
  50. Dai, A.; Luo, D.; Song, M.; Liu, J. Arctic amplification is caused by sea-ice loss under increasing CO2. Nat. Commun. 2019, 10, 121. [Google Scholar] [CrossRef] [Green Version]
  51. Bliss, A.C.; Steele, M.; Peng, G.; Meier, W.N.; Dickson, S. Regional variability of Arctic sea ice seasonal change climate indicators from a passive microwave climate data record. Environ. Res. Lett. 2019, 14, 045003. [Google Scholar] [CrossRef]
  52. Bintanja, R.; van der Linden, E. The changing seasonal climate in the Arctic. Sci. Rep. 2013, 3, 1556. [Google Scholar] [CrossRef] [Green Version]
  53. Karlsson, K.G.; Anttila, K.; Trentmann, J.; Stengel, M.; Meirink, J.F.; Devasthale, A.; Hanschmann, T.; Kothe, S.; Jääskeläinen, E.; Sedlar, J.; et al. CLARA-A2: The second edition of the CM SAF cloud and radiation data record from 34 years of global AVHRR data. Atmos. Chem. Phys. 2017, 17, 5809–5828. [Google Scholar] [CrossRef] [Green Version]
  54. Riihelä, A.; Laine, V.; Manninen, T.; Palo, T.; Vihma, T. Validation of the Climate-SAF surface broadband albedo product: Comparisons with in situ observations over Greenland and the ice-covered Arctic Ocean. Remote Sens. Environ. 2010, 114, 2779–2790. [Google Scholar] [CrossRef]
  55. Climate Data Store. ERA5-Land Hourly Data from 1950 to Present. Available online: https://cds.climate.copernicus.eu/cdsapp#!/dataset/reanalysis-era5-land?tab=overview (accessed on 27 April 2022).
  56. Lindsay, R.; Wensnahan, M.; Schweiger, A.; Zhang, J. Evaluation of seven different atmospheric reanalysis products in the Arctic. J. Clim. 2014, 27, 2588–2606. [Google Scholar] [CrossRef] [Green Version]
  57. Yu, Y.; Xiao, W.; Zhang, Z.; Cheng, X.; Hui, F.; Zhao, J. Evaluation of 2-m air temperature and surface temperature from ERA5 and ERA-I using buoy observations in the arctic during 2010–2020. Remote Sens. 2021, 13, 2813. [Google Scholar] [CrossRef]
  58. Cavalieri, D.J.; Parkinson, C.L.; Gloersen, P.; Zwally, H.J. Sea Ice Concentrations from Nimbus-7 SMMR and DMSP SSM/I-SSMIS Passive Microwave Data, Version 1; NASA National Snow and Ice Data Center Distributed Active Archive Center: Boulder, CO, USA, 1996. [CrossRef]
  59. Cavalieri, D.J.; Crawford, J.P.; Drinkwater, M.R.; Eppler, D.T.; Farmer, L.D.; Jentz, R.R.; Wackerman, C.C. Aircraft active and passive microwave validation of sea ice concentration from the Defense Meteorological Program Special Sensor Microwave Imager. J. Geophys. Res. 1991, 96, 21989–22008. [Google Scholar] [CrossRef]
  60. Ivanova, N.; Johannessen, O.M.; Pedersen, L.T.; Tonboe, R.T. Retrieval of Arctic sea ice parameters by satellite passive microwave sensors: A comparison of eleven sea ice concentration algorithms. IEEE Trans. Geosci. Rem. Sens. 2014, 52, 723–7246. [Google Scholar] [CrossRef]
  61. Meier, W.N. Comparison of passive microwave ice concentration algorithm retrievals with AVHRR imagery in the Arctic peripheral seas. IEEE Trans. Geosci. Rem. Sens. 2005, 43, 1324–1337. [Google Scholar] [CrossRef]
  62. Maslanik, J.A. Effects of weather on the retrieval of sea ice concentration and ice type from passive microwave data. Int. J. Remote Sens. 1992, 13, 37–54. [Google Scholar] [CrossRef]
  63. National Center for Environmental Information. Regional Sea Ice. Available online: https://www.ncdc.noaa.gov/snow-and-ice/regional-sea-ice/overview (accessed on 27 April 2022).
  64. Bright, R.M.; O’Halloran, T.L. Developing a Monthly Radiative Kernel for Surface Albedo Change from Satellite Climatologies of Earth’s Shortwave Radiation Budget: CACK V1.0. Geosci. Model Dev. 2019, 12, 3975–3990. [Google Scholar] [CrossRef] [Green Version]
  65. Chen, X.; Long, D.; Hong, Y.; Liang, S.; Hou, A. Observed radiative cooling over the Tibetan Plateau for the past three decades driven by snow-cover-induced surface albedo anomaly. J. Geophys. Res. 2017, 122, 6170–6185. [Google Scholar] [CrossRef]
  66. Jonko, A.K.; Shell, K.M.; Sanderson, B.M.; Danabasoglu, G. Climate feedbacks in CCSM3 under changing CO2 forcing. Part I: Adapting the linear radiative kernel technique to feedback calculations for a broad range of forcings. J. Clim. 2012, 25, 5260–5272. [Google Scholar] [CrossRef] [Green Version]
  67. Reynolds, R.W.; Smith, T.M.; Liu, C.; Chelton, D.B.; Casey, K.S.; Schlax, M.G. Daily High-Resolution-Blended Analyses for Sea Surface Temperature. J. Clim. 2007, 20, 5473–5496. [Google Scholar] [CrossRef]
  68. Kumar, A.; Yadav, J.; Mohan, R. Spatio-temporal change and variability of Barents-Kara sea ice, in the Arctic: Ocean and atmospheric implications. Sci. Total Environ. 2020, 753, 142046. [Google Scholar] [CrossRef] [PubMed]
  69. Parkinson, C.L.; Cavalieri, D.J. Arctic sea ice variability and trends, 1979–2006. J. Geophys. Res. Ocean. 2008, 113, 1979–2006. [Google Scholar] [CrossRef]
  70. Smedsrud, L.H.; Esau, I.; Ingvaldsen, R.B.; Eldevik, T.; Haugan, P.M.; Li, C.; Lien, V.S.; Olsen, A.; Omar, A.M.; Otterå, O.H.; et al. The role of the Barents Sea in the Arctic climate system. Rev. Geophys. 2013, 51, 415–449. [Google Scholar] [CrossRef] [Green Version]
  71. Boisvert, L.N.; Petty, A.A.; Stroeve, J.C. The Impact of the Extreme Winter 2015/16 Arctic Cyclone on the Barents–Kara Seas. Mon. Weather Rev. 2016, 144, 4279–4287. [Google Scholar] [CrossRef]
  72. Lind, S.; Ingvaldsen, R.B.; Furevik, T. Arctic Warming Hotspot in the Northern Barents Sea Linked to Declining Sea-Ice Import. Nat. Clim. Change 2018, 8, 634–639. [Google Scholar] [CrossRef]
  73. National Snow and Ice Data Center. All About Sea Ice. Available online: https://nsidc.org/cryosphere/seaice/data/terminology.html (accessed on 27 April 2022).
  74. Perovich, D.K.; Polashenski, C. Albedo evolution of seasonal Arctic sea ice. Geophys. Res. Lett. 2012, 39, 5097–5112. [Google Scholar] [CrossRef]
  75. Lee, S.M.; Sohn, B.J.; Kim, S.J. Differentiating between first-year and multiyear sea ice in the arctic using microwave-retrieved ice emissivities. J. Geophys. Res. Atmos. 2017, 122, 5097–5112. [Google Scholar] [CrossRef]
  76. Adodo, F.I.; Remy, F.; Picard, G. Seasonal variations of the backscattering coeeficient measured by radar altimeters over the Antarctic Ice Sheet. Crypsphere 2018, 12, 1767–1778. [Google Scholar] [CrossRef] [Green Version]
  77. Bergstedt, H.; Zwieback, S.; Bartsch, A.; Leibman, M. Dependence of C-band backscatter on ground temperature, air temperature and snow depth in arctic permafrost regions. Remote Sens. 2018, 10, 142. [Google Scholar] [CrossRef] [Green Version]
  78. ECMWF IFS. DOCUMENTATION—Cy43r1 Operational Implementation Part IV: Physical Processes; ECMWF: Reading, UK, 2016. [Google Scholar]
  79. Bintanja, R.; Krikken, F. Magnitude and pattern of Arctic warming governed by the seasonality of radiative forcing. Sci. Rep. 2016, 6, 38287. [Google Scholar] [CrossRef] [PubMed] [Green Version]
  80. Wielicki, B.A. Changes in Earth’s Albedo Measured by Satellite. Science 2005, 308, 825. [Google Scholar] [CrossRef] [PubMed]
  81. Winton, M. Amplified Arctic climate change: What does surface albedo feedback have to do with it? Geophys. Res. Lett. 2006, 33, L03701. [Google Scholar] [CrossRef] [Green Version]
  82. Winton, M. Sea ice-albedo feedback and nonlinear Arctic climate change. In Arctic Sea Ice Decline: Observations, Projections, Mechanisms, and Implications; DeWeaver, E., Bitz, C., Tremblay, L.B., Eds.; AGU: Washington, DC, USA, 2008; Volume 180, pp. 111–131. [Google Scholar] [CrossRef] [Green Version]
Figure 1. Location map in the Arctic regions.
Remotesensing 14 02512 g001
Figure 2. Distribution of radiative kernels in the Arctic. (a) Temporal distribution of surface albedo radiative kernel (all-sky) monthly means according to GCM. (b) The spatial distribution of the difference between CAM5 and GFDL surface albedo radiative kernel. (c) Temporal distribution of surface temperature radiative kernel (all-sky) monthly means according to GCM. (d) The spatial distribution of the difference between HadGEM3 and CAM5 surface temperature radiative kernel.
Remotesensing 14 02512 g002
Figure 3. Time series distribution of annual average SIRF according to the GCMs from 1982 to 2015 in the Arctic: (a) net-SIRF, (b) albedo-SIRF, (c) temperature-SIRF.
Remotesensing 14 02512 g003
Figure 4. Spatial distribution of the annual change in SIRFs for each factor based on mean of five radiative kernels: (a) net-SIRF, (b) albedo-SIRF, (c) temperature-SIRF.
Remotesensing 14 02512 g004
Figure 5. The seasonal average SIRFs according to GCMs. (a) December−January−February period, (b) March−April−May period, (c) June−July−August period, (d) September−October−November period.
Remotesensing 14 02512 g005
Figure 6. Seasonal SIRFs using the average of the kernels of GCMs for each factor. The horizontal line represents the period (DJF: December−January−February, MAM: March−April−May, JJA: June−July−August, SON: September−October−November), and the vertical line represents the radiative forcing for each factor (net-SIRF, albedo-SIRF, temperature-SIRF).
Remotesensing 14 02512 g006
Figure 7. Temporal distribution of the monthly net-SIRF using the average of five radiative kernels.
Remotesensing 14 02512 g007
Figure 8. The SIRFs monthly changes for each factor from 1982 to 2015.
Remotesensing 14 02512 g008
Figure 9. Spatial distribution of the net-SIRF monthly change.
Remotesensing 14 02512 g009
Table 1. Summary of datasets used in the study.
VariablesDatasetsHorizontal ResolutionTemporal ResolutionTime SpanReference
Surface AlbedoCLARA-A225 kmMonthly1982–2015[53]
Skin TemperatureERA50.25°Monthly1982–2015[55]
Sea Ice ConcentrationNECI0.25°Daily1982–2015[58]
Radiative KernelsCAM51.25°Monthly-[44]
HadGEM21.88°[45]
HadGEM31.88°[46]
GFDL2.5°[47]
ECHAM61.88°[48]
Table 2. SIRFs annual change according to region (W/m2).
Arctic Ocean (All)BaffinBarentsKaraLaptevBeaufortChukchi
Net0.34 ± 0.240.41 ± 0.170.58 ± 0.360.62 ± 0.250.50 ± 0.100.42 ± 0.120.49 ± 0.14
Albedo0.12 ± 0.120.15 ± 0.100.24 ± 0.170.24 ± 0.140.18 ± 0.080.19 ± 0.090.21 ± 0.07
Temperature0.22 ± 0.140.27 ± 0.120.35 ± 0.210.38 ± 0.110.31 ± 0.040.24 ± 0.050.28 ± 0.07
Table 3. SIRFs seasonal change according to region (W/m2).
Period Arctic Ocean (All)BaffinBarentsKaraLaptevBeaufortChukchi
DJF *Net0.34 ± 0.280.62 ± 0.280.78 ± 0.420.60 ± 0.290.28 ± 0.060.24 ± 0.070.27 ± 0.06
Albedo-------
Temperature0.34 ± 0.280.62 ± 0.280.78 ± 0.420.60 ± 0.290.28 ± 0.060.24 ± 0.070.27 ± 0.06
MAM *Net0.41 ± 0.390.61 ± 0.370.96 ± 0.660.78 ± 0.360.61 ± 0.150.33 ± 0.130.48 ± 0.12
Albedo0.16 ± 0.260.32 ± 0.290.59 ± 0.410.34 ± 0.260.20 ± 0.170.11 ± 0.120.17 ± 0.13
Temperature0.25 ± 0.190.30 ± 0.140.38 ± 0.270.45 ± 0.060.41 ± 0.040.23 ± 0.060.30 ± 0.06
JJA *Net0.35 ± 0.280.41 ± 0.270.48 ± 0.360.63 ± 0.340.51 ± 0.230.51 ± 0.220.56 ± 0.20
Albedo0.35 ± 0.310.41 ± 0.280.49 ± 0.390.63 ± 0.400.51 ± 0.260.55 ± 0.240.60 ± 0.23
Temperature0.00 ± 0.050.00 ± 0.020.00 ± 0.04−0.01 ± 0.070.00 ± 0.04−0.04 ± 0.03−0.04 ± 0.03
SON *Net0.41 ± 0.220.32 ± 0.110.38 ± 0.240.51 ± 0.210.56 ± 0.10.51 ± 0.160.73 ± 0.22
Albedo-------
Temperature0.41 ± 0.220.32 ± 0.110.38 ± 0.240.51 ± 0.210.56 ± 0.10.51 ± 0.160.73 ± 0.22
* DJF: December−January−February; MAM: March−April−May; JJA: June−July−August; SON: September−October−November.
Publisher’s Note: MDPI stays neutral with regard to jurisdictional claims in published maps and institutional affiliations.

