Article

Experimental Analysis of Atmospheric Ducts and Navigation Radar Over-the-Horizon Detection

1
School of Information Engineering, Wuhan University of Technology, Wuhan 430070, China
2
China Research Institute of Radiowave Propagation, Qingdao 266107, China
3
Hubei Engineering Research Center of RF-Microwave Technology and Application, Wuhan 430070, China
4
School of Science, Wuhan University of Technology, Wuhan 430070, China
5
School of Electronic Engineering, Xidian University, Xi’an 710071, China
*
Author to whom correspondence should be addressed.
Remote Sens. 2022, 14(11), 2588; https://0-doi-org.brum.beds.ac.uk/10.3390/rs14112588
Submission received: 27 April 2022 / Revised: 23 May 2022 / Accepted: 26 May 2022 / Published: 27 May 2022

Abstract

:
Since the height of sea detection radar antenna and ship targets is relatively low, it is generally believed that its over-the-horizon detection is mainly caused by the evaporation duct at sea. To fully understand the influence of atmospheric ducts on radar over-the-horizon detection, a shore-based navigation radar was used to carry out over-the-horizon detection experiments; radiosondes were used to measure the atmospheric profile and evaporation duct monitoring equipment was used to measure the evaporation duct. Based on experimental data and model simulation, a comparative analysis of a navigation radar’s over-the-horizon detection, the evaporation duct, and the lower atmospheric duct is presented in this study. The results show that the atmospheric duct can affect the signal propagation of the navigation radar, thus resulting in over-the-horizon detection. The long-range over-the-horizon detection of the navigation radar is caused by the strong lower atmospheric duct, while the evaporation duct can generally only form weak over-the-horizon detection, which is different from the general cognition.

1. Introduction

When electromagnetic waves propagate in the troposphere, they are affected by the atmospheric environment, resulting in phenomena such as refraction, diffraction, and attenuation, which affect the performance of radio monitoring systems [1,2,3]. The atmospheric duct is a special atmospheric structure that can bend ultrashort waves and microwave frequency signals through super-refraction, propagating them along the earth’s surface with small attenuation; this results in abnormal propagation of the radio system, such as radar over-the-horizon detection, and over-the-horizon communication [4,5,6].
Atmospheric ducts can be classified into the following three types according to their different formation mechanisms and spatial distributions: evaporation ducts, surface ducts and elevated ducts. Surface ducts and elevated ducts can also be collectively referred to as lower atmospheric ducts [7,8]. Evaporation ducts are formed due to the evaporation of seawater and invariably exist in the ocean, thus attracting extensive scientific attention [9,10,11]. However, with increasing research on atmospheric ducts, researchers have found that lower atmospheric ducts also have a high probability of occurrence and can have significant impacts on both land and maritime radio systems [5,12,13]. By measuring the profile data of parameters such as atmospheric pressure, atmospheric temperature, and relative humidity, radiosondes can reflect the gradient characteristics of parameters such as temperature and humidity, which is why they are often used to detect lower atmospheric ducts [14,15,16].
Navigation radars are generally installed on ships to allow the detection of surrounding target positions to aid navigation, collision avoidance, and self-positioning. Their operating frequency is generally in the X-band and the antennae are close to the sea surface, making them easily affected by evaporation ducts. In 1989, K.D. Anderson used a 16.5 GHz shipborne ground search radar to conduct experiments, the results of which show that an evaporation duct can realize the over-the-horizon propagation of the radar with high signal strength [17]. In 2009, Zhang Yu et al. carried out an evaporation duct measurement and radar detection experiments. The experimental results reinforce the consistency between the actual measurement of the evaporation duct and the over-the-horizon propagation of radar signals [18]. In recent years, the Coupled Air-Sea Processes and Electromagnetic ducting Research project has carried out long-term experiments and analysis on the correlation between the evaporation duct environment and actual propagating signals [19,20].
A radar is also affected by lower atmospheric ducts that produces over-the-horizon detection [5]. In 2017, Han Jia et al. simulated and analyzed the propagation loss of an X-band shipborne radar in different atmospheric duct environments. In the surface duct environment, the radar electromagnetic wave propagates far away in the duct layer with minor loss, resulting in over-the-horizon detection [21]; however, comparative experiments on lower atmospheric ducts and radar over-the-horizon detections are seldom carried out, creating a lack of comparative analysis of measured data.
In September 2019, a comprehensive observation experiment was carried out in the Guangdong Province of China. A shore-based navigation radar was used for over-the-horizon detection and radiosondes were used to measure the atmospheric profile. Evaporation duct monitoring equipment was used to measure the evaporation duct. Based on the detection results of a navigation radar, the results of evaporation ducts and lower atmospheric ducts during the experiment, and model simulation, this paper comprehensively compares and analyzes the influence of evaporation ducts and lower atmospheric ducts on navigation radar over-the-horizon detection.

2. Theoretical Models and Methods

2.1. Atmospheric Duct Diagnostic Method

An atmospheric duct is an abnormal atmospheric structure in the troposphere. The atmospheric modified refractive index gradient of this atmospheric structure satisfies the following equation [1]:
d M / d h < 0
where the modified refractive index M can be obtained through the following equations [22,23,24]:
M = N + z a × 10 6
N = K 1 T P + K 2 e T
e = E 0 exp k 1 t d t 01 + t d t d < 0 E 1 exp k 2 t d t 02 + t d t d > 0
where N is the refractive index, z is the altitude in m, the earth’s radius a = 6370 km, T is the atmospheric temperature in K, P is the atmospheric pressure in hPa, e is the water vapor pressure in hPa, and t d is the dew point temperature in °C. The coefficients are respectively equal and are as follows: K 1 = 77.6 , K 2 = 4810 , E 0 = 6.115 , E 1 = 6.1121 , k 1 = 22.452 , k 2 = 17.502 , t 01 = 272.55 , t 02 = 240.97 .
According to the aforementioned equations and the profile data on atmospheric pressure, atmospheric temperature, and dew point temperature, the modified refractive index profile can be calculated. If there is a layer that satisfies Equation (1), it is considered that a lower atmospheric duct occurs at this moment. In the presence of a lower atmospheric duct, there are generally three cases of modified refractive index, as shown in Figure 1 [6].

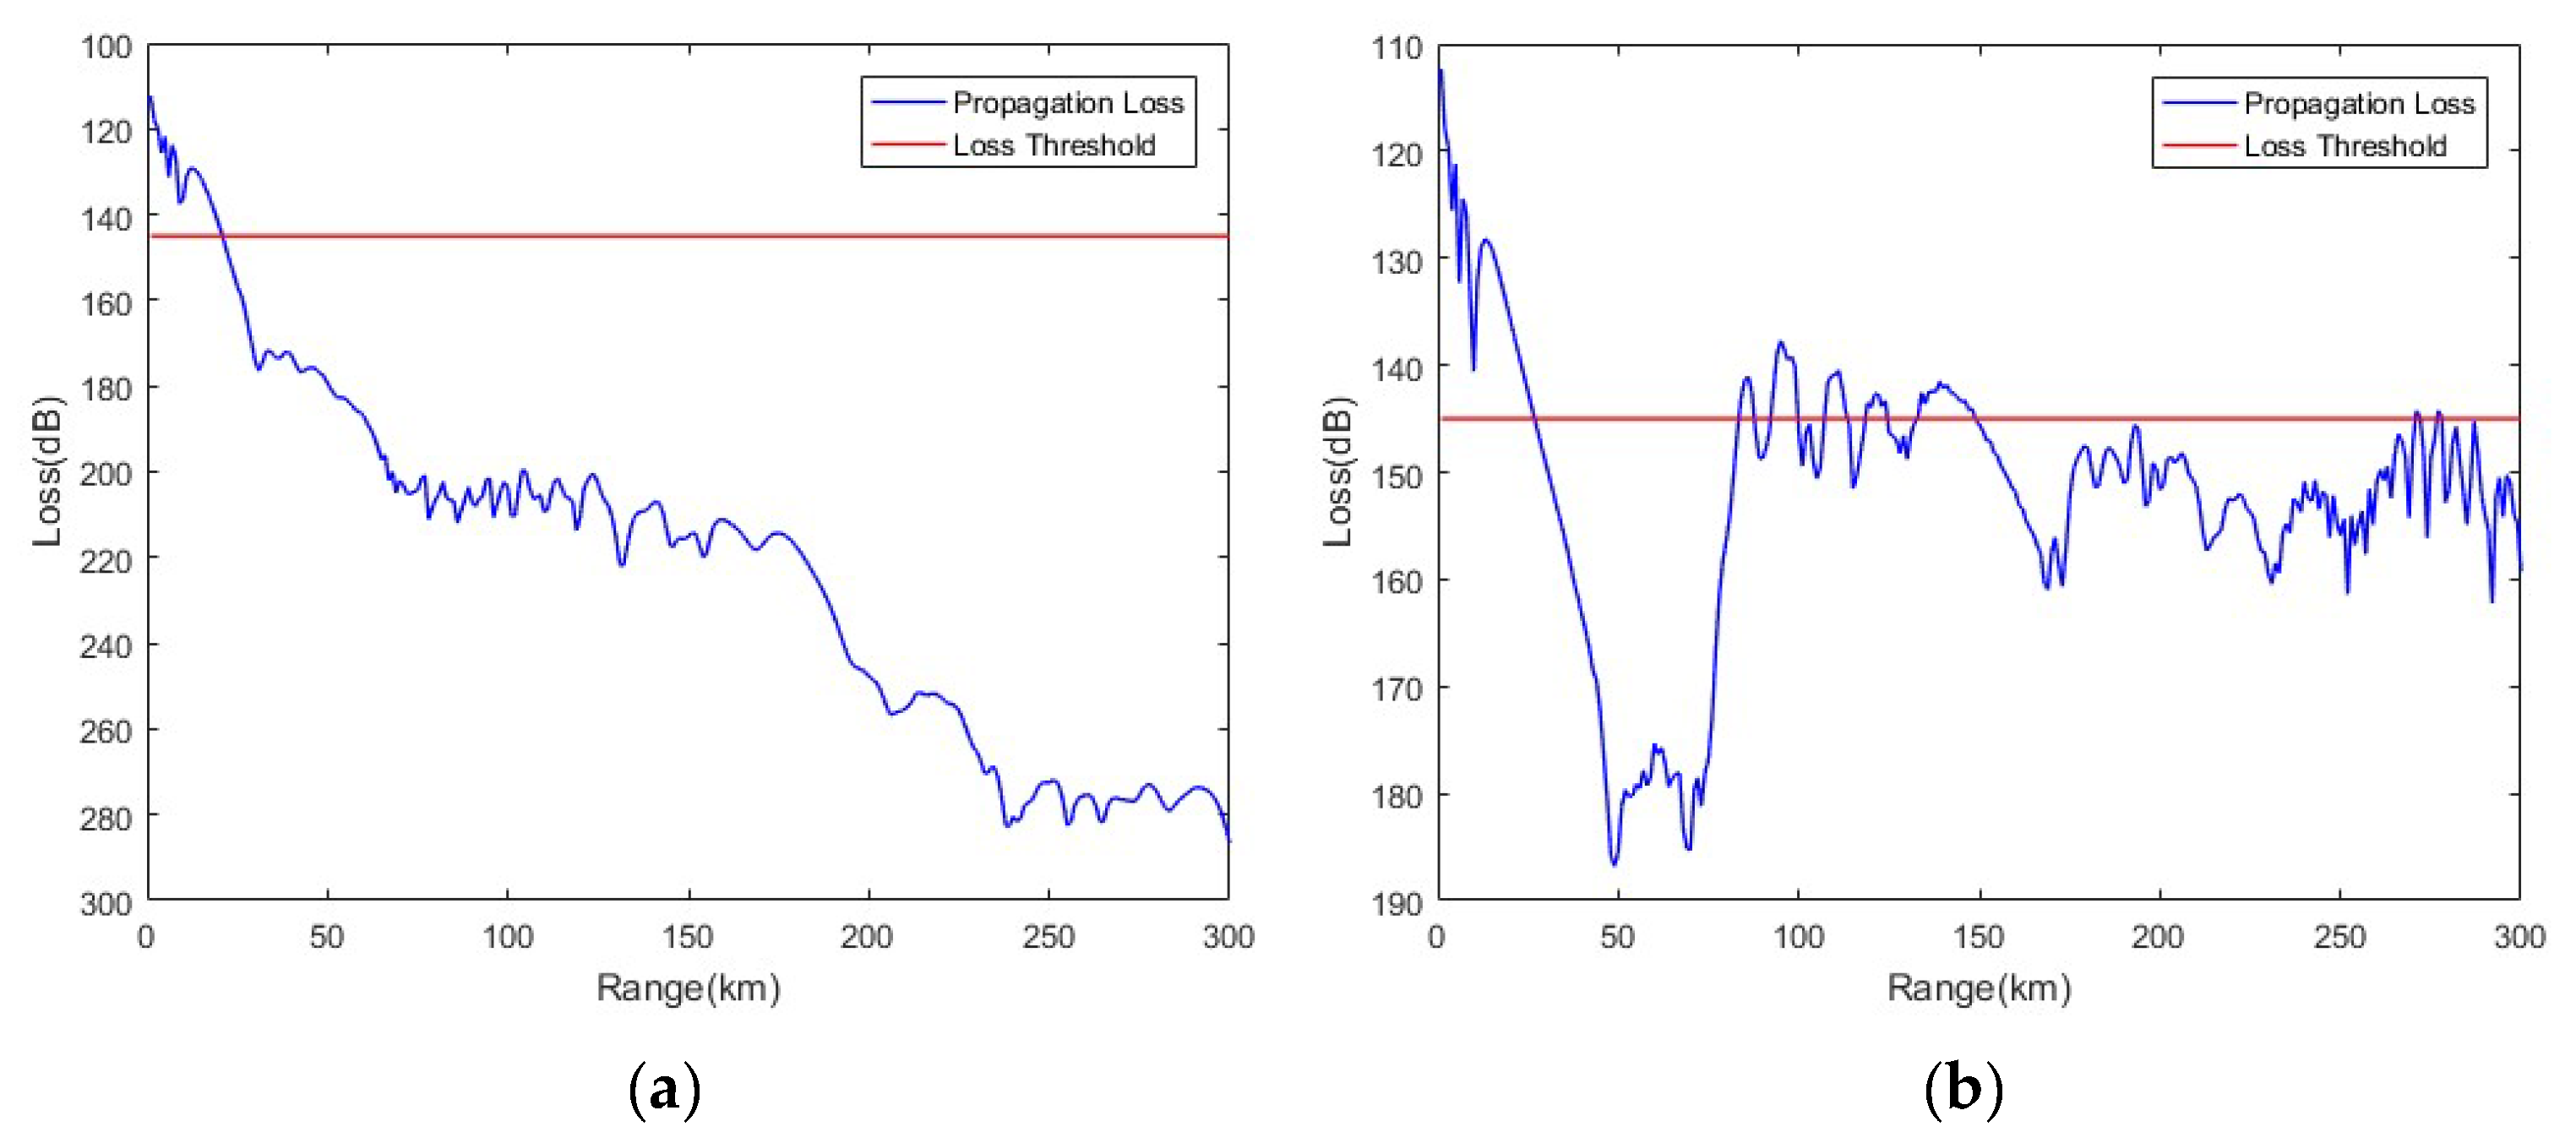
2.2. Electromagnetic Wave Propagation Loss Model

Through the parabolic approximation of the Helmholtz wave equation, the parabolic equation model (PE) of electromagnetic wave propagation is formed. This affects the study of abnormal propagation of electromagnetic waves in complex environments, such as atmospheric ducts [24,25,26,27], the basic equations for which are given below [28,29,30]:
2 u ( x , z ) z 2 + 2 i k u ( x , z ) x x + k 2 n 2 ( x , z ) l u ( x , z ) = 0
where k is the free space wave number, n (x, z) is the atmospheric refractive index, u ( x , z ) = E y e i k x is for horizontal polarization, and Ey is the component of the electric field in the Y direction, u ( x , z ) = H y e i k x is for vertical polarization, and Hy is the component of the magnetic field in the Y direction.
When solving the PE, the upper boundary adopts the Hamming window function to realize the absorption boundary condition. The Hamming window function is a filter widely used in signal processing. The expression is as follows:
φ ( t ) = 1 + cos ( π t ) 2
The lower boundary (z = 0) is the sea surface and the following Leontovich surface impedance boundary condition is used:
u z + α u = 0
Considering the roughness of the sea surface,
α = i k sin θ 1 R 1 + R
where θ is the rubbing angle and R is the equivalent reflection coefficient of the rough surface, which can be expressed by the Miller–Brown model as the following equations:
R = R 0 exp ( ξ ) I 0 ( i ξ )
ξ = 8 π h λ sin θ 2
where R0 is the reflection coefficient of the smooth sea surface, I0 is the zero-order Bessel function, λ is the wavelength of the electromagnetic wave, and h is the root mean square height of the sea surface.
U ( x , p ) = F [ u ( x , z ) ] = u ( x , z ) e i p z d z
Then, the form of the distributed Fourier solution of PE is used as follows:
u ( x + δ x , z ) = e i ( k / 2 ) ( n 2 1 ) δ x F 1 [ U ( x , p ) e i ( p 2 δ x / 2 k ) ]
Using the field strength at the initial location and the upper and lower boundary conditions, the field value for the selected area can be calculated. Then, the propagation factor F can be expressed as the following equation:
F = x u ( x , z )
where x is the propagation distance. Propagation loss can be calculating using the following equation:
L ( R ) = 20 log 4 π R λ 20 log F
where R is the distance between the measurement point and the emission point in m, and λ is the wavelength in m.

2.3. Navigation Radar Over-the-Horizon

According to the principle of radar detection, the radar horizon equation is as follows [31]:
R = 2 a k h 1 + h 2
where R is the radar horizon in m, a is the earth’s radius in m, k is the earth factor, and h1 and h2 are the height of the radar antenna and the equivalent height of the target in m, respectively. k = 1 is for not considering normal atmospheric refraction, whereas k = 4/3 is for considering normal atmospheric refraction and is usually used. This is because, under the normal atmospheric refraction effect, the radar signal will bend to the earth’s surface when propagating in the atmosphere, thus increasing the radar detection range.
In the atmospheric duct environment, if the radar signal frequency, antenna height, antenna elevation angle, and other parameters meet certain conditions, the radar signal will travel far along the atmospheric duct layer with little loss; when the detection distance exceeds the radar horizon, over-the-horizon detection occurs.

3. Experimental Design

The experiment was carried out on the coast of MaoMing City, in the Guangdong Province of China. The specific geographical location and experimental equipment are shown in Figure 2. The experiment was carried out from 30 August 2019 to 28 September 2019.
The navigation radar is installed on the roof of the coast to detect ship targets at sea and obtain radar over-the-horizon detection data. Some parameters of the navigation radar are shown in Table 1.
Table 1 shows that the navigation radar’s frequency is 9400 MHz and the antenna elevation angle is 0°, which is easily captured by the atmospheric duct, thus resulting in over-the-horizon detection. In addition, the height of the navigation radar antenna is 17 m, and the height of the target ship is generally not more than 25 m. According to the radar horizon Equation (15), it is estimated that the navigation radar horizon does not exceed 38 km. According to the distance of all ship targets detected by the navigation radar, the measured maximum detection distance of the navigation radar is obtained. If it exceeds the horizon distance of 38 km, it is considered that over-the-horizon detection has occurred. Figure 3 shows examples of the results of the navigation radar horizon detection and over-the-horizon detection.
During the experiment, radiosondes were used to measure the profiles of atmospheric pressure, atmospheric temperature, and relative humidity almost twice a day. Atmospheric modified refractive index profiles were obtained through calculation to detect the presence or absence of lower atmospheric ducts, as well as the parameters of the lower atmospheric duct. Figure 4 shows an example of the atmospheric profile data, showing that the measured atmospheric profile has dense layers and large jitter and needs to be smoothed to be fitted for the lower atmospheric duct calculations.
Evaporation duct monitoring equipment is set up on the offshore experimental platform 6.5 km away from the shore to monitor the evaporation duct at sea. Figure 5 shows examples of the monitoring results of the height of the evaporation ducts; the variation characteristics of the evaporation duct height over time can be observed here.

4. Analysis of Experimental Results

4.1. Over-the-Horizon Detection and Evaporation Duct Data Analysis

Navigation radar observation data collected during the experiment were preprocessed and the longest distance of all the radar detected targets for every hour was obtained. Figure 6 shows the measured maximum detection range of the navigation radar distributed by time.
From Figure 6, it can be clearly observed whether over-the-horizon detection has occurred in the navigation radar. From the data in the figure, it can be observed that there were over-the-horizon phenomena on 8, 13, 17, 22, and 28 September 2019. Among these, the over-the-horizon phenomenon was particularly intense on 8 and 13 September and the maximum detection distance was occasionally over 100 km.
The monitoring results of the evaporation duct height during the experiment are shown in Figure 7. It can be clearly observed that from 22 September to 24 September, the evaporation duct height was relatively high, that is, up to 40 m (see Figure 7).
According to the data presented in Figure 6 and Figure 7, the evaporation duct height and the maximum detection distance of navigation radar were 27.8 m and 50 km, respectively, at 03:00 on 23 September 2019 and 6.8 m and 94 km, respectively, at 21:00 on 7 September 2019. Using the parabolic equation model, the propagation loss of the navigation radar signal in the evaporation duct environment at the above two times is simulated and calculated. The evaporation duct environment profiles and simulation results of the propagation loss are shown in Figure 8.
From Figure 8a, it can be observed that the navigation radar signal can propagate far away with little loss in the environment of an evaporation duct with a height of 27.8 m, so as to form over-the-horizon detection. This is consistent with the maximum detection distance of 50 km measured by the radar. This shows that a strong evaporation duct can make the navigation radar form over-the-horizon detection. From Figure 8b, it can be observed that the navigation radar signal propagates normally in the environment of an evaporation duct with a height of 6.8 m. Over-the-horizon detection is not formed, which is inconsistent with the maximum detection distance of 94 km measured by the radar. Therefore, it is inferred that the radar over-the-horizon detection at this time is caused by the lower atmospheric duct.
A scatter diagram providing a comparative analysis of the radar maximum detection distance and the evaporation duct height is shown in Figure 9, which shows that there is poor consistency between the two. A correlation analysis is conducted between the radar maximum detection distance and the evaporation duct height and the correlation coefficient is found to be −0.08, that is, suggesting a weak correlation. From this, it can be inferred that the navigation radar over-the-horizon detection during the experiment was not caused by the evaporation duct in some cases.
It can be inferred from the above analysis that, although the strong evaporation duct environment can generate the over-the-horizon detection of the navigation radar, over-the-horizon detection is not caused by the evaporation duct in some cases. It is more likely caused by the lower atmospheric duct.

4.2. Case Study of Typical Over-the-Horizon Detection

Figure 6 shows that the maximum detection distance of the navigation radar has a relatively evident change process on 7 and 8 September 2019. Figure 10 shows the distribution of the navigation radar maximum detection distance during this process.
It is clear from Figure 10 that the navigation radar produced horizon detection on the morning of 7 September 2019, which gradually changed to over-the-horizon detection in the afternoon. This continued until the early morning of 8 September 2019, finally changing back to horizon detection on the morning of 8 September 2019. From the afternoon of 8 September 2019 to early morning on 9 September 2019, the navigation radar produced over-the-horizon detection. During this process, the maximum detection distance of the navigation radar reached more than 100 km.
Querying the data in Figure 10 shows that the maximum detection distances of the navigation radar at 8:00 and 21:00 on 7 September 2019 were 33 km and 103 km, respectively; that is, horizon detection and strong over-the-horizon detection. The heights of the evaporation duct at 8:00 and 21:00 on 7 September 2019 were found to be 10.5 m and 6.8 m, respectively, which are both relatively low. It can be observed that the over-the-horizon detection at 21:00 was not caused by the evaporation duct.
Atmospheric profile data at 08:00 and 21:00 on 7 September 2019 were obtained and the atmospheric modified refractive index profile is shown in Figure 11. Figure 11 shows that there is no atmospheric duct at 08:00 on 7 September 2019, while an evident lower atmospheric duct existed at 21:00 on that day. Using the atmospheric modified refractive index profile at 21:00 on 7 September 2019, the parameters of the lower atmospheric duct were calculated. The top height, bottom height, layer bottom height, layer thickness, and strength of the lower atmospheric duct are 258.3 m, 0 m, 123.8 m, 134.5 m, and 24.9 M, respectively.
Using the parabolic equation model, the propagation loss of the navigation radar signal under the above two atmospheric environment profiles is simulated and calculated. The simulation results are shown in Figure 12.
It is clear from Figure 12 that the navigation radar signal has clear propagation differences in the two different atmospheric environments. As can be observed from Figure 12a, since there was no atmospheric duct at 08:00 on 7 September 2019, the navigation radar signal basically propagated normally and no over-the-horizon detection occurred. From Figure 12b, it can be observed that due to the strong surface duct at 21:00 on 7 September 2019, the navigation radar signal was trapped in the duct layer and propagated to the distance with little propagation loss, thus forming over-the-horizon detection.
According to the navigation radar parameters and the radar equation, it can be assumed that the maximum one-way propagation loss threshold allowed by the navigation radar is 145 dB. Assuming that the equivalent height of the ship target at sea is 10 m, Figure 13 shows the simulated propagation loss and loss threshold of the navigation radar at this height.
In Figure 13, the area where the propagation loss is smaller than the loss threshold is the detection range of the navigation radar. Therefore, it is clear from Figure 13 that the maximum detection distance of the navigation radar at 08:00 and 21:00 on 7 September 2019 is significantly different. From Figure 13a, the simulated maximum detection distance of the navigation at 08:00 on 7 September 2019 is ~30 km, which is normal horizon detection and consistent with the radar measured distance of 33 km. From Figure 13b, the simulated maximum detection distance at 21:00 on 7 September 2019 is more than 100 km, which is a strong over-the-horizon detection and consistent with the radar measured distance of 103 km. The measured and simulated results can show that the lower atmospheric duct can cause over-the-horizon detection of the navigation radar and the strong lower atmospheric duct can produce long over-the-horizon range.

4.3. Comprehensive Comparative Analysis

The maximum detection distance of the navigation radar synchronized with the time of the radiosonde data are estimated. Based on the atmospheric modified refractive index profiles obtained from radiosonde data, the presence or absence of the lower atmospheric duct and duct parameters can be calculated according to Equation (1) and Figure 1. Comparative statistics of the lower atmospheric duct and the over-the-horizon detection of the navigation radar are calculated. The results are shown in Table 2.
Table 2 shows that consistency between the lower atmospheric duct and the navigation radar over-the-horizon detection reaches 51.6%, which indicates a strong correlation. Inconsistency between the two mainly occurred because the radiosonde data have an atmospheric duct and navigation radar without over-the-horizon detection, a total of 28 times. Radiosonde data have an atmospheric duct and the navigation radar has over-the-horizon detection 14 times. The average bottom height of the lower atmospheric duct was 112.6 m, with an average duct strength of 8.2 M. It can be observed that due to the low height of the navigation radar and the ship target, when the bottom height of the lower atmospheric duct is low and the duct strength is strong, the phenomenon of over-the-horizon detection occurs easily.
The reasons why radiosonde data have lower atmospheric ducts and navigation radar without over-the-horizon detection include the following. (1) When the bottom height of the lower atmospheric duct is high or the intensity is small, it is difficult for the navigation radar signals to be captured; (2) radiosonde data only form a single-point profile measurement and cannot fully reflect the environmental information of the navigation radar on the sea detection path. If lower atmospheric ducts only occur on the land side, they will not affect the signal propagation of navigation radar; (3) ff there are no long-distance ship targets at sea, even if the navigation radar signal can travel long distances in the atmospheric duct layer, it cannot detect an over-the-horizon target.
Table 2 shows that the navigation radar has 15 over-the-horizon detections, of which radiosonde data have 14 atmospheric ducts, with 93.3% consistency. Table 3 shows the lower atmospheric duct parameters diagnosed by radiosonde data when the navigation radar has over-the-horizon detection.
From Table 3, it can be observed that the farthest over-the-horizon detection distance of the navigation radar was 106 km, followed by 103 km, 94 km, 74 km, 65 km, and so on. The atmospheric duct parameters of the five farthest over-the-horizon detections are counted. The average values of the duct bottom height, duct thickness, and duct strength are 0.72 m, 269.3 m, and 4.6 M, respectively. This means that the duct bottom heights are low, the ducts are strong; thus, the navigation radar can produce strong over-the-horizon detection. Table 4 shows the results of evaporation duct height monitoring and the navigation radar detection distance that are synchronized with the aforementioned five strong over-the-horizon detections.
Table 4 shows that the heights of the evaporation duct at the five aforementioned times are all relatively low, with an average value of 10.5 m; this may not allow the navigation radar to produce strong over-the-horizon detection. From this, it can be inferred that strong over-the-horizon detection of the aforementioned navigation radar is caused by the strong lower atmospheric duct.
The 15 over-the-horizon detections of the navigation radar listed in Table 3 consist of 9 occurrences of surface duct, 5 occurrences of elevated duct, and 1 occurrence of no duct. Among the elevated ducts, four have duct bottom heights greater than 200 m. The modified refractive index profiles for these four elevated ducts are obtained, as shown in Figure 14.
Considering both Table 3 and Figure 14, it can be observed that the lowest duct bottom height among the four elevated ducts depicted in Figure 14 is 296.8 m, occurring at 20:00 on 13 September 2019. Based on the modified refractive index profile at this moment, the propagation loss of the navigation radar signal is simulated by the parabolic equation model. The result of this is shown in Figure 15.
Figure 15 shows that the navigation radar signal is essentially unaffected and propagates normally, since the bottom height of the elevated duct is high and the navigation radar antenna is low. Therefore, it can be inferred that the four elevated ducts with duct bottom heights greater than 200 m cannot cause the over-the-horizon detection of the navigation radar. That is, the four aforementioned over-the-horizon detection phenomena of the navigation radar should be affected by the evaporation duct.
From Table 3, the time when there is no duct or when the elevated duct with a duct bottom height is greater than 200 m is obtained. Table 5 shows the results of evaporation duct height monitoring and the navigation radar detection distance at the time selected above.
It can be observed from Table 5 that the evaporation duct heights at the selected five times are all high with an average value of 18.8 m, which can cause the over-the-horizon detection of the navigation radar. According to the statistics of the navigation radar detection distance at the above times, the average value is 44.8 km, indicating a weak over-the-horizon phenomenon. It is generally believed that the navigation radar frequency is the X-band and the antenna is low, which is easily affected by the evaporation duct, thus producing a strong over-the-horizon detection phenomenon. The actual measurement results show that although the evaporation duct can cause the over-the-horizon detection of the navigation radar, the over-the-horizon phenomenon is weak.

5. Conclusions

Based on the navigation radar detection data and the monitoring results of the evaporation duct, this paper analyzes the influence of the evaporation duct environment on the over-the-horizon detection of a navigation radar. Following this, a typical navigation radar over-the-horizon detection change process is conducted and analyzed. In addition, this study conducts a comparative analysis of lower atmospheric ducts and navigation radar over-the-horizon detection.
The above measured and simulated results show that although the strong evaporation duct environment can cause over-the-horizon detection of the navigation radar, over-the-horizon detection is not caused by the evaporation duct in some cases, but the lower atmospheric duct. Furthermore, the lower atmospheric duct and navigation radar over-the-horizon detection have a strong correlation, and the far over-the-horizon detection of the navigation radar is generally determined by the strong lower atmospheric duct. In addition, in the absence of the lower atmospheric duct, the over-the-horizon phenomenon of the navigation radar caused by the evaporation duct is generally weak.
In conclusion, the lower atmospheric duct can affect the propagation of the navigation radar signal, resulting in over-the-horizon detection. Far over-the-horizon detection of the navigation radar is caused by the strong lower atmospheric duct. The evaporation duct can generally only form weak over-the-horizon detection, which is different from general cognition. Numerous reasons for the aforementioned phenomena are assessed in this study and the most notable of which include the following. First, the system detection ability of the navigation radar is weak. Second, the evaporation duct has poor abilities to trap the energy of electromagnetic wave signals, while the strong lower atmospheric duct is very strong. The combined effect of the two factors leads to weak over-the-horizon detection of the navigation radar in the evaporation duct, but relatively strong effects in the strong lower atmospheric duct.
This study can provide a reference for a more comprehensive and in-depth understanding of the impact of the atmospheric duct environment on radar detection ability. Due to the impossibility of obtaining navigation radar signal environmental data along the entire propagation path, this study only analyzed the phenomenon of over-the-horizon detection. If complete and accurate regional environmental data can be obtained in the future, a more precise analysis of the correlation between atmospheric ducts and over-the-horizon detection distance of the navigation radar can be conducted.

Author Contributions

Conceptualization, C.-G.L., L.-F.H. and H.-G.W.; Methodology, L.-F.H. and H.-G.W.; Experiment, J.H., Y.-S.Z. and L.-F.H.; Software, L.-F.H. and H.-G.W.; Validation, L.-F.H., C.-G.L. and Q.-L.Z.; Formal analysis, L.-F.H. and L.-J.Z.; Investigation, L.-F.H.; Resources, L.-F.H. and Q.-L.Z.; Data curation, L.-F.H. and Q.-N.W.; Writing—original draft preparation, L.-F.H.; Writing—review and editing, C.-G.L., H.-G.W. and L.-J.Z.; Visualization, L.-F.H. and L.-J.Z.; Supervision, C.-G.L.; Project administration, C.-G.L.; Funding acquisition, C.-G.L. and Q.-L.Z. All authors have read and agreed to the published version of the manuscript.

Funding

This research was funded by the National Natural Science Foundation of China (grant number 42076195).

Institutional Review Board Statement

Not applicable.

Informed Consent Statement

Not applicable.

Data Availability Statement

Not applicable.

Acknowledgments

We thank all the editors and reviewers for their valuable comments that greatly improved the presentation of this paper. We are very grateful to Bohe Marine Meteorological Science Experimental Base for providing the experimental site.

Conflicts of Interest

The authors declare that they have no conflict of interest.

References

  1. Sirkova, I.; Mikhalev, M. Parabolic Wave Equation Method Applied to the Tropospheric Ducting Propagation Problem: A Survey. Electromagnetics 2006, 26, 155–173. [Google Scholar] [CrossRef]
  2. Liu, X.Z.; Wu, Z.S.; Wang, H.G. Inversion Method of Regional Range-Dependent Surface Ducts with a Base Layer by Doppler Weather Radar Echoes Based on WRF Model. Atmosphere 2020, 11, 754. [Google Scholar] [CrossRef]
  3. Bech, J.; Codina, B.; Lorente, J. Forecasting Weather Radar Propagation Conditions. Meteorol. Atmos. Phys. 2007, 96, 229–243. [Google Scholar] [CrossRef]
  4. Compaleo, J.; Yardim, C.; Xu, L. Refractivity-from-Clutter Capable, Software-Defined, Coherenton-Receive Marine Radar. Radio. Sci. 2021, 56, e2020RS007173. [Google Scholar] [CrossRef]
  5. Wang, H.; Su, S.P.; Tang, H.C.; Jiao, L.; Li, Y. Atmospheric Duct Detection Using Wind Profiler Radar and RASS. J. Atmos. Ocean. Technol. 2019, 36, 557–565. [Google Scholar] [CrossRef]
  6. Sirkova, I. Duct Occurrence and Characteristics for Bulgarian Black Sea Shore Derived from ECMWF Data. J. Atmos. Sol. Terr. Phys. 2015, 135, 107–117. [Google Scholar] [CrossRef]
  7. Brooks, I.M.; Goroch, A.K.; Rogers, D.P. Observations of Strong Surface Radar Ducts over the Persian Gulf. J. Appl. Meteor. 1999, 38, 1293–1310. [Google Scholar] [CrossRef] [Green Version]
  8. Saeger, J.T.; Grimes, N.G.; Rickard, H.E.; Hackett, E.E. Evaluation of Simplified Evaporation Duct Refractivity Models for Inversion Problems. Radio Sci. 2015, 50, 1110–1130. [Google Scholar] [CrossRef]
  9. Zhang, Q.; Yang, K.D.; Shi, Y. Spatial and Temporal Variability of the Evaporation Duct in the Gulf of Aden. Tellus A 2016, 68, 29792. [Google Scholar] [CrossRef] [Green Version]
  10. Zhang, J.P.; Wu, Z.S.; Wang, B. An Adaptive Objective Function for Evaporation Duct Estimations from Radar Sea Echo. Chin. Phys. Lett. 2011, 28, 034301. [Google Scholar] [CrossRef]
  11. Han, J.; Wu, J.J.; Zhu, Q.L.; Wang, H.; Zhou, Y.; Jiang, M.; Zhang, S.; Wang, B. Evaporation Duct Height Nowcasting in China’s Yellow Sea Based on Deep Learning. Remote Sens. 2021, 13, 1577. [Google Scholar] [CrossRef]
  12. Wang, H.B.; Zhang, L.J.; Wang, H.G. The Climatological Analysis of the Lower Atmospheric Ducts in South China Sea. Chin. J. Radio Sci. 2019, 34, 533–642. [Google Scholar]
  13. Kaissassou, S.; Lenouo, A.; Tchawoua, C.; Lopez, P.; Gaye, A.T. Climatology of Radar Anomalous Propagation over West Africa. J. Atmos. Sol. Terr. Phys. 2015, 123, 1–12. [Google Scholar] [CrossRef]
  14. Patterson, W.L. Climatology of Marine Atmospheric Refractive Effects: A Compendium of the Integrated Refractive Effects Prediction System (IREPS) Historical Summaries. Naval Ocean Systems Center Tech. 1982, 573, 525. [Google Scholar]
  15. Babin, S.M. Surface Duct Height Distributions for Wallops Island, Virginia, 1985–1994. J. Appl. Meteorol. Climatol. 1996, 35, 86–93. [Google Scholar] [CrossRef] [Green Version]
  16. Mentes, Ş.; Kaymaz, Z. Investigation of Surface Duct Conditions over Istanbul, Turkey. J. Appl. Meteorol. Climatol. 2007, 46, 318–337. [Google Scholar] [CrossRef]
  17. Anderson, K.D. Radar Measurements at 16.5 GHz in the Oceanic Evaporation Duct. IEEE Trans. Antennas Propagat. 1989, 37, 100–106. [Google Scholar] [CrossRef] [Green Version]
  18. Zhang, Y.; Wu, S.H. Experimental Study of Consistency About Evaporation Duct’s Appearance and the Radar’s Over-the-Horizon Detection. Ship Sci. Technol. 2009, 31, 77–79. [Google Scholar]
  19. Wang, Q.; Denny, P.; Alappattu, S.; Billingsley, S.; Burkholder, R.J.; Christman, A.J.; Creegan, E.D.; de Paolo, T.; Eleuterio, D.P.; Fernando, H.J.S.; et al. Casper: Coupled Air-Sea Processes and Electronmagnetic(EM) Wave Ducting Research. Amer. Meteor. Società. 2018, 99, 1449–1471. [Google Scholar] [CrossRef]
  20. Wang, Q.; Burkholder, R.J.; Yardim, C.; Xu, L.; Pozderac, J.; Christman, A.; Fernando, H.J.S.; Alappattu, D.P.; Wang, Q. Range and Height Measurement of X-Band EM Propagation in the Marine Atmospheric Boundary Layer. IEEE Trans. Antennas. Propagat. 2019, 67, 2063–2073. [Google Scholar] [CrossRef]
  21. Han, J.; Jiao, L. Assessment on the Shadow Zone Caused by the Atmospheric Duct for the Shipboard Radar and the Shadow Zone Filling Measures. J. Ocean. Technol. 2017, 36, 91–95. [Google Scholar]
  22. Atkinson, B.W.; Zhu, M. Coastal Effects on Radar Propagation in Atmospheric Ducting Conditions. Meteorol. App. 2005, 13, 53–62. [Google Scholar] [CrossRef]
  23. Yang, S.; Li, X.; Wu, C.; He, X.; Zhong, Y. Application of the PJ and NPS Evaporation Duct Models over the South China Sea (SCS) in Winter. PLoS ONE 2017, 12, e0172284. [Google Scholar] [CrossRef] [PubMed]
  24. Pastore, D.M.; Greenway, D.P.; Stanek, M.J.; Wessinger, S.E.; Haack, T.; Wang, Q.; Hackett, E.E. Comparison of Atmospheric Refractivity Estimation Methods and Their Influence on Radar Propagation Predictions. Radio. Sci. 2021, 56, e2020RS007244. [Google Scholar] [CrossRef]
  25. Skolnik, M.I. RADAR Systems; McGraw-Hill: New York, NY, USA, 2001. [Google Scholar]
  26. Sirkova, I. Brief Review on PE Method Application to Propagation Channel Modeling in Sea Environment. Open. Eng. 2012, 2, 19–38. [Google Scholar] [CrossRef]
  27. Wagner, M.; Gerstoft, P.; Rogers, T. Estimating Refractivity from Propagation Loss in Turbulent Media. Radio. Sci. 2016, 51, 1876–1894. [Google Scholar] [CrossRef] [Green Version]
  28. Wang, H.G. Method and Experiment of Troposheric Ducts Inversion Using Ground-Based GNSS Occultation; Xidian University: Xi’an, China, 2013. [Google Scholar]
  29. The Concept of Transmission Loss for Radio Links. ITU-R P.341-7-2019. 2019. Available online: https://www.itu.int/dms_pubrec/itu-r/rec/p/R-REC-P.341-7-201908-I!!PDF-E.pdf (accessed on 26 April 2022).
  30. Calculation of Free-Space Attenuation. ITU-R P.525-4-2019. 2019. Available online: https://www.itu.int/dms_pubrec/itu-r/rec/p/R-REC-P.525-4-201908-I!!PDF-E.pdf (accessed on 26 April 2022).
  31. Palmer, A.J.; Baker, D.J. A Novel Simple Semi-Empirical Model for the Effective Earth Radius Factor. IEEE Trans. Broadcast. 2006, 52, 557–565. [Google Scholar] [CrossRef]
Figure 1. Modified refractive index profiles of lower atmospheric ducts. Here, ht is the top height of the duct; dh is the thickness of the duct; Δ M is the strength of the duct; hb is the bottom height of the duct layer; δ is the thickness of the duct layer; and he is the bottom height of the duct.
Remotesensing 14 02588 g001
Figure 2. Experimental location and equipment used in the study. (a) The navigation radar; (b) the radiosondes; (c) evaporation duct experimental platform.
Remotesensing 14 02588 g002
Figure 3. Examples of the detection results of the navigation radar. (a) Horizon detection; (b) Over-the-horizon detection.
Remotesensing 14 02588 g003
Figure 4. Examples of atmospheric profile data. (a) Atmospheric temperature profile; (b) relative humidity profile; (c) modified refractive index profile.
Remotesensing 14 02588 g004
Figure 5. Examples of the monitoring results of the evaporation duct height.
Remotesensing 14 02588 g005
Figure 6. Distribution of maximum detection distance of navigation radar.
Remotesensing 14 02588 g006
Figure 7. Monitoring results of evaporation duct height.
Remotesensing 14 02588 g007
Figure 8. Evaporation duct profiles and navigation radar signal propagation loss. (a) At 03:00 on 23 September 2019; (b) at 21:00 on 7 September 2019.
Remotesensing 14 02588 g008
Figure 9. Relationship between radar maximum detection distance and evaporation duct height.
Remotesensing 14 02588 g009
Figure 10. Navigation radar maximum detection distance on 7–8 September 2019.
Remotesensing 14 02588 g010
Figure 11. Atmospheric modified refractive index profiles at 08:00 and 21:00 on 7 September 2019.
Remotesensing 14 02588 g011
Figure 12. Simulation results of navigation radar signal propagation loss. (a) At 8:00 on 7 September 2019; (b) at 21:00 on 7 September 2019.
Remotesensing 14 02588 g012
Figure 13. Simulated propagation loss and loss threshold of navigation radar. (a) At 08:00 on 7 September 2019; (b) at 21:00 on 7 September 2019.
Remotesensing 14 02588 g013
Figure 14. Modified refractive index profiles of four elevated ducts.
Remotesensing 14 02588 g014
Figure 15. Simulation results of navigation radar signal propagation loss at 20:00 on 13 September 2019. (a) Propagation loss; (b) radar detection range.
Remotesensing 14 02588 g015
Table 1. Navigation radar parameters.
ParameterParameter Value
Frequency9400 MHz
Peak Power12 kw
Antenna Height17 m
Antenna Elevation Angle
Antenna Gain29 dB
Vertical Beam Width22°
Polarization ModeHorizontal
Table 2. Comparison of navigation radar time over-the-horizon detection and lower atmospheric ducts.
Atmospheric DuctNo Atmospheric Duct
Over-the-horizon141
No over-the-horizon2819
Table 3. Lower atmospheric duct parameters when the navigation radar has over-the-horizon detection.
No.TimeDuct Top Height/mDuct Bottom Height/mDuct Thickness/mDuct Strength/MDuct TypeRadar Detection Distance/km
12019090716198.20198.27.0Surface duct65
22019090718170.60170.68.7Surface duct74
32019090721258.30258.324.9Surface duct94
42019090813685.7558.4127.33.2Elevated duct57
52019090819235.70235.724.9Surface duct106
62019090821487.63.6484.07.4Elevated duct103
72019091008570.4384.8185.62.5Elevated duct46
82019091020546.5332.2214.34.5Elevated duct41
92019091320431.5296.8134.84.0Elevated duct40
102019091420204.30204.314.6Surface duct48
11201909150810.6010.61.6Surface duct39
12201909160847.8047.88.3Surface duct53
13201909170821.7021.71.1Surface duct55
14201909180824.4024.42.4Surface duct43
152019092317----No duct40
Table 4. Strong over-the-horizon detection distances and evaporation duct heights.
No.TimeEvaporation Duct Height/mRadar Detection Distance/km
1201909071611.665
2201909071810.874
320190907216.894
4201909081912.2106
5201909082111.3103
Table 5. Navigation radar detection distance and evaporation duct height.
No.TimeEvaporation Duct Height/mRadar Detection Distance/km
1201909081316.457
2201909100812.946
3201909102014.341
4201909132016.640
5201909231733.640
Publisher’s Note: MDPI stays neutral with regard to jurisdictional claims in published maps and institutional affiliations.

