1. Introduction
The Sustainable Development Goals (SDGs) address different issues for a better and more sustainable future for all countries. SDGs and their related thematic issues such as water, energy, climate, oceans, urbanization, transport, science and technology are highlighted in 17 goals including 169 targets and supported by 232 indicators to measure and monitor progress. The challenges lie in finding effective techniques and methods to support them.
Earth observation and particularly remote sensing systems have the potential to become one of the main tools for achieving the targets set by the SDGs. They help to collect data and produce global geospatial data sets. The SDG indicators can be interpreted and measured through direct use of geospatial data itself or through integration with statistical data [
1]. Remote sensing data can be used as an input for modeling and evaluation of measures in a variety of SDGs and targets (urban climate, water balance, soil protection, etc.) [
2].
After Bulgaria’s accession to the European Union (EU) in 2007, large-scale reforms were started in all sectors of the economy and social life, as well as the harmonization of the legislative and regulatory frameworks with the EU requirements. As a result, in areas such as ecology and environmental protection, protection from natural and man-made disasters, as well as agriculture, information systems have been developed and implemented as a key element for control and monitoring based mainly on geo-spatial data, such as the national system for environmental monitoring implemented by the Ministry of Environment and Water, and the Integrated Administration and Control System implemented by the Ministry of Agriculture, Food and Forestry.
The use of Earth Observation (EO) data in Bulgaria is limited and is reduced mainly to the Aerospace Monitoring Center (AMC), which includes a receiving station for MODIS–Terra and Aqua satellites within the Ministry of Interior and the use of aerial and satellite data in the Land Parcel Identification System. In 2014, the national geo-information portal “INSPIRE” was introduced, but it initially offered a limited set of geospatial data and a not very user-friendly interface. The portal was updated in 2021 through the implementation of a dedicated project, essential for Bulgaria in terms of spatial data policy and implementation of obligations on the establishment of infrastructure for spatial information (Directive INSPIRE).
At the same time, all 17 SDG are reflected in the National Development Programme Bulgaria 2030, and this program states the country’s commitment to achieving the targets.
Considering these gaps, the Risk Space Transfer–Technology Transfer Office, Bulgarian Academy of Sciences (RST-TTO) started the development of geo-information portals based on Earth Observation data, as a technology demonstration platform to present to potential users the opportunities and benefits of using EO data in various fields—natural disasters and accidents, environment, and agriculture. In this article, the authors synthesize and discuss the achievements made during their work on the above.
Both the RST-TTO (Sofia, Bulgaria) and TAKT-IKI Ltd. (Sofia, Bulgaria; the spin-off company of RST-TTO) participate in a number of international projects, such as European Space Agency and the Horizon 2020—GEO-CRADLE and E-SHAPE. The first project aims to promote the uptake and exploitation of EO activities in North Africa, Middle East, and the Balkans. E-SHAPE is a unique initiative that brings together decades of public investment in EO and in cloud capabilities into services for the decision makers, the citizens, the industry, and the researchers. The project includes 37 pilot applications under 7 thematic areas that address societal challenges, foster entrepreneurship, and support sustainable development. These projects allowed to gain the experience and knowledge regarding the implementation of SDGs through EO data, presented in this article. Based on the outputs of the above projects and a current implementation of a third project, the different platforms are developed and deployed for technology demonstrations of the potential of EO data in geospatial technologies in several domains: water quality monitoring, disaster mapping, and agriculture. These three projects’ achievements are reflected in this article’s study goal: to propose an approach for implementation of SDGs through EO data in three main domains (water quality monitoring, disaster mapping, and smart agriculture) supported by the SDG indicators identified in the National Development Programme Bulgaria 2030.
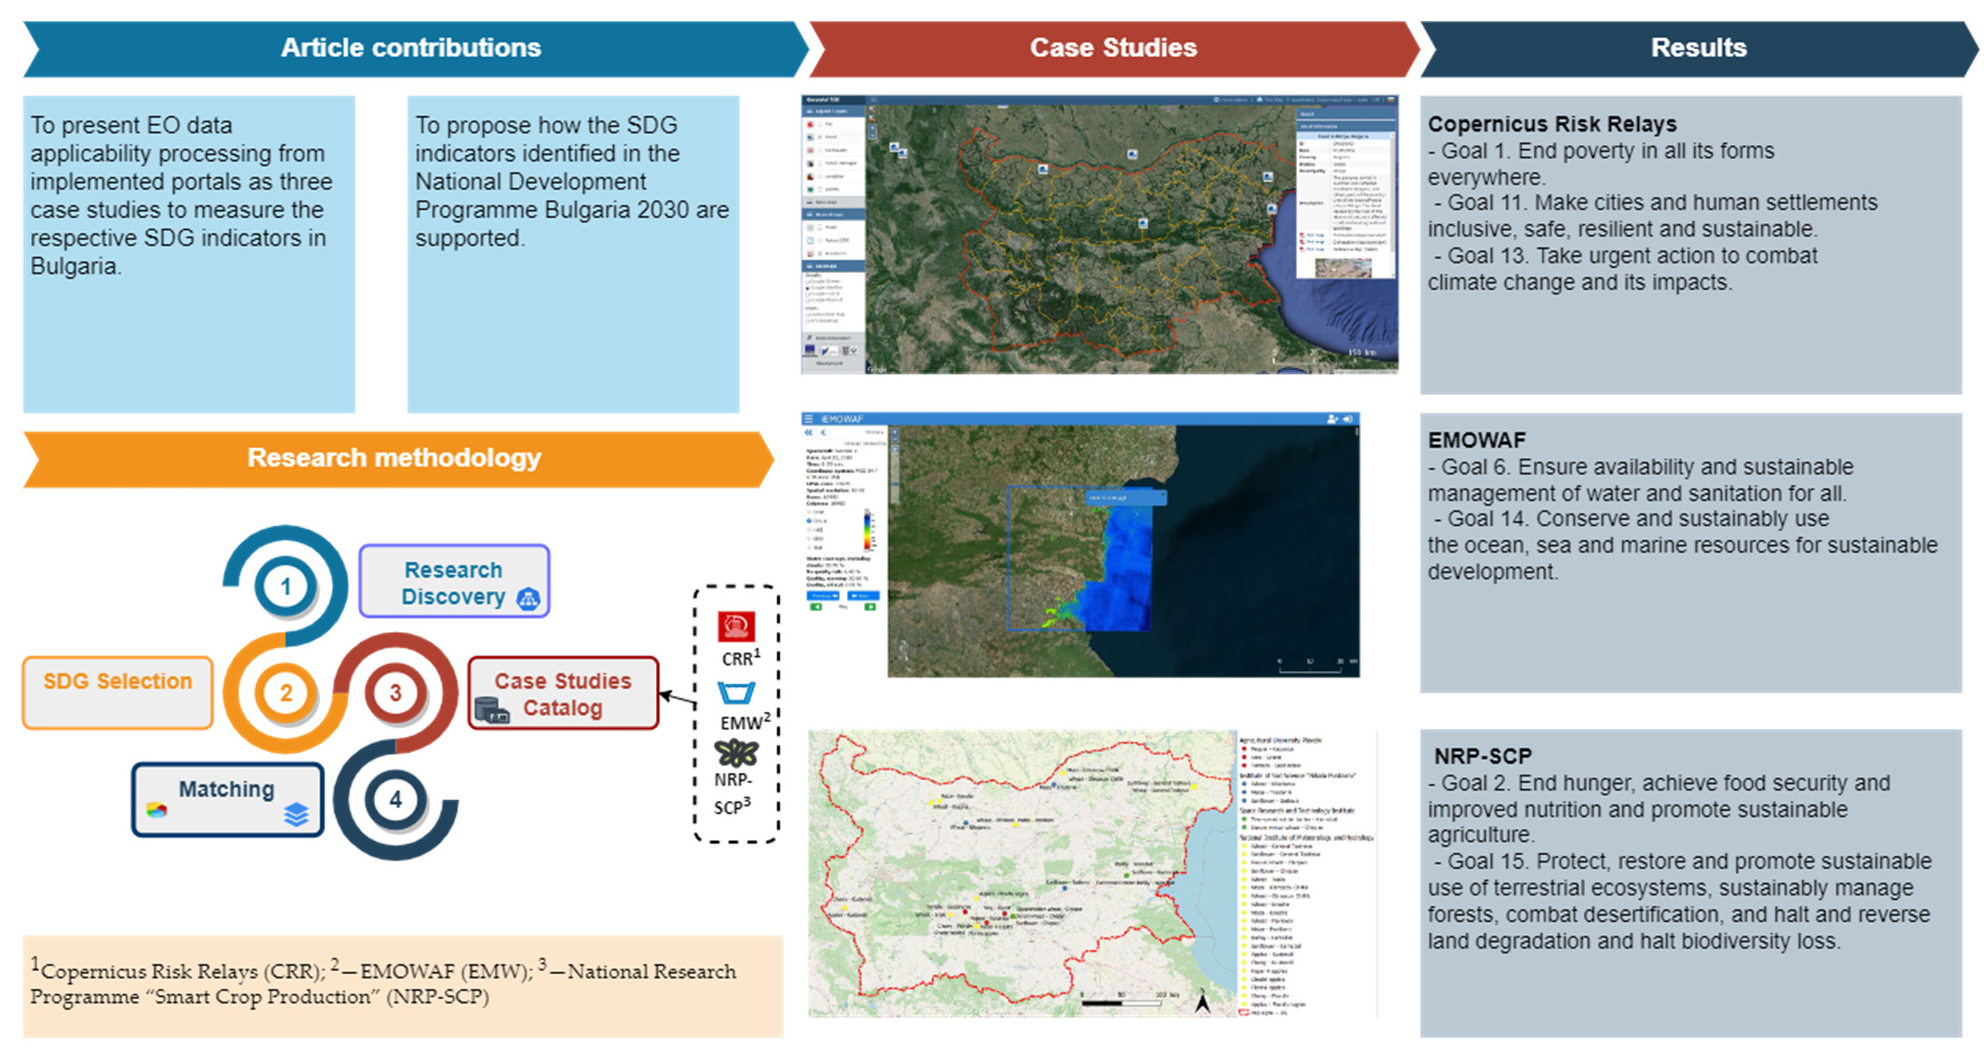
Therefore, the main contributions of the presented study are:
To present EO data applicability processing from implemented portals as three case studies to measure the respective SDG indicators in Bulgaria;
To propose how the SDG indicators identified in the National Development Programme Bulgaria 2030 are supported.
The rest of this paper is organized as follows.
Section 2 reviews and analyzes relevant research and studies.
Section 3 describes the four main steps of the research approach applied here.
Section 4 presents how EO can support the SDG indicators identified in the National Development Programme Bulgaria 2030.
Section 5 gives as examples three main case studies which use EO in the area of water quality monitoring, disaster mapping, and agriculture.
Section 6 discusses how these examples contribute to the SDG indicators in Bulgaria.
Section 7 is a summary of the paper and future research directions.
2. State of the Art
Earth Observation and satellite data are increasingly acknowledged in implementation of SDG and a widening spectrum of the associated indicators. Some practitioners summarize the main advantages of the EO data for SDGs monitoring to include regular and repetitive observation, multiannual time series of data acquisition, cost-effectiveness for monitoring remote and inaccessible areas, and a synoptic view of the Earth’s surface [
1]. Availability of spatial images with very high spatial and temporal resolution enable modeling of the impact of policy measures through identifying the relevant socioeconomic descriptors [
2] and understanding the functional relationships of planning [
3].
The involvement of the private sector in developing downstream applications and use of data gives an additional boost to these trends and supports the governments in managing the 2030 Agenda. Empirical results are shared to help build capacity and broaden the EO application to solve humanity’s pending challenges—such as environmental protection, the use of natural resources, the increasing mobility of people and goods, growing security threats, and also health and humanitarian crises. These challenges can be summarized in several main SDG-related factors, amongst which are population distribution, resource consumption, and environmental cost.
The usage of EO for the implementation of SDG goals is a key factor to meet these challenges. Several previous studies have discussed that issue. For example, the paper [
4] analyzes existing EO systems to generate data for SDG indicators addressed via the remote sensing of environments special issue contributions. The paper discusses main resolution characteristics and assesses factors that hinder the full integration of EO solutions for the SDGs within country processes, institutions of government, and policies.
In addition, Kussul [
5] proposes a methodology for calculating SDGs with the use of satellite data. The main improvements consist of using moderate and high spatial resolution satellite data and state-of-the-art deep learning methodology for land cover classification and for assessing land productivity. In this research, harmonized Landsat and Sentinel-2 data are analyzed and used for land productivity analysis and yield assessment, as well as Landsat 8, Sentinel-2, and Sentinel-1 time series are utilized for crop mapping. The study results in SDG indicator calculations for the whole territory of Ukraine: 15.1.1—Forest area as proportion of total land area; 15.3.1—Proportion of land that is degraded over total land area; and 2.4.1—Proportion of agricultural area under productive and sustainable agriculture.
The indicator 15.3.1 is also considered by Giuliani et al. [
6] who discuss the EO role in targeting land degradation, which necessitates actions for protecting biodiversity, ecosystems services, and ensuring food security. Effective assessments and mapping of the degraded lands is recommended by the SDGs. The indicator 15.3.1 requires a scalable and flexible framework to monitor land degradation at different geographical scales and collect regular data production by countries to inform and assess it through space and time (national, regional, global) using various components of the Global Earth Observation System of Systems platform. The proposed approach follows the data–information–knowledge pattern using the “trends.Earth” model to compute the three sub-indicators—Land Productivity Dynamics, Land Cover Change, Soil Organic Carbon Stocks—with various data sources to generate the indicator and implement additional components for model execution and orchestration, knowledge management, and visualization.
Another aspect of using EO for implementation of SDG goals involves spatial images which are of specific interest to sustainability development goals related to sustainable agriculture (SDG 2), clean water (SDG 6), sustainable cities and communities (SDG 11), life on land (SDG 15) with many researchers exploring more than one of the goals on a global, national, or local level. For example, the implementation of SDG is addressed by Cochran [
7] in a research paper demonstrating the uses of EO data to assist the multi-scale assessment of the SDGs. The paper highlights the activities of the EnviroAtlas in mapping the ecosystem services indicators at national, regional, and local level. Such mapping can contribute to targets set forth in numerous goals, such as SDG 6 (clean water), SDG 11 (sustainable cities and communities), and SDG 15 (life on land). Geospatial resources provided by EnviroAtlas provide open access to indicators based on EO data and allow for assessment at multiple extents and resolutions which are critical to broadly addressing national to subnational SDG goals and targets. Hermosilla et al. [
8] analyze and assess the performance of a contextual object-based classification methodology and demonstrate its high potential to correctly and accurately discriminate and assign agricultural land use classes. The tested object-based classification methodology could be used to increase the frequency, efficiency, and detail level of urban studies. Frick and Tervooren [
3] propose a methodological framework for the assessment of urban indicators and argue that green volume and soil sealing are increasingly easy to assess due to new air- and spaceborne sensors and should enable fact-based policy making.
SDG 6 (clean water) and SDG 15 (life on land) are also addressed by Whitcraft [
9]. The research paper describes the current and potential uses of EO data and tools in the activities of the Group on Earth Observations Global Agricultural Monitoring (GEOGLAM) Initiative. The GEOGLAM community provides information on the state and changes in agricultural production and suggests contribution to both supporting the attainment of several of the 17 SDGs and many of the 169 targets. GEOGLAM’s major impact relates to Goal 2 (zero hunger), but also supports goals addressing water (Goal 6), responsible consumption and production (Goal 12), climate action (Goal 13), life on land (Goal 15), and global partnerships for sustainable development (Goal 17).
More details for SDG 6.6.1 are presented by Weise et al. [
10] who propose the use of satellite data in the Satellite-based Wetland Observation Service project for monitoring. The research paper applies SWOS tools to test the potential for the mapping of wetlands in a case study in Albania and demonstrates its effectiveness to derive metrics relevant to the monitoring of the above indicator. The rising availability of free and open EO data, such as the Sentinel satellite data of the Copernicus program and long-term Landsat archive, provides the basis for mapping wetlands and thus contributes to SDG reporting obligations.
In addition, the cost-effective solutions for monitoring and tracking SDG 2, SDG 6, and SDG 15 are suggested by Wu et al. [
11] using cloud-based services that integrate crowdsourcing and public Earth Observation data. The proposed solution provides particularly for low-income countries and proposes the development of free reusable and customizable reporting cloud services for the SDGs.
In water quality monitoring and disaster mapping fields, Nidhi Nagabhat et al. [
12] present a novel perspective toward widening the scope of remote sensing data and geographic information systems (GIS) toward the implementation of the SDG agenda. The paper addresses SDG 6, SDG 11, and SDG 16 indicators and how they benefit from geospatial data. The research applies a two-phased method to help an enhanced understanding of the interplay between the direct and indirect drivers of water and climate crisis-driven migration at different levels, local to global. The first phase covers selected studies of Lake Chad, the Aral Sea region, and the Nile Delta and demonstrates the application of GIS and remote sensing data to explain the water and migration scenarios related to water quality and water extremes (mainly droughts and floods). The second phase showcases global-scale analysis and a geospatial platform. It is used to display various dimensions on a global scale and address risks and conflicts related to migration.
In more details, Lorenzo-Alonso [
13] describes the use of EO regarding to SDG 11, especially in the Disaster Risk Reduction (DRR). The paper discusses the European Space Agency initiative Earth Observation for Sustainable Development (EO4SD) which tasked a team of European companies and institutions to develop EO services for supporting the implementation of DRR. Integration of satellite-borne data and ancillary data to generate insight and actionable information is thereby considered a key factor for improved decision making concerning the disaster management. Urban areas challenges are explored by other researchers as well. Balsa-Barreiro et al. [
14] analyze spatiotemporal patterns of population distribution and demonstrate the applicability of special networks to map the depopulation trends and associated economic decline and thus support decision making to address the overemphasis on urban areas.
According to the agriculture field, sustainability, resilience, and replicability potentials of a small-scale community-supported agriculture model experience for food production is explored by Cristiano [
15]. The study shares lessons learnt to encourage replicability and/or scaling up to possibly provide clean and just food, while targeting the currently endangered food- and agriculture-related SDGs.
The applicability of these and other research results to policy making is essential. Balsa-Barreiro et al. [
16] address four global indicators through special locations and the resulting shifting centers of gravity over the period 1960–2016. The authors point to the usefulness of tracing the dynamics of such shifts to predict upcoming trends and thus support policy makers. Monitoring carbon dioxide emissions, populations, and urban populations might be enabled through Earth Observation applications and help chart the shifts in gravity and future challenges associated with these. Banerjee et al. [
2] demonstrate the applicability of spatial analysis in identifying the socioeconomic descriptors for spatial socioeconomic impact assessment modeling of government planning.
Recent research results prove the applicability to SDGs and policy making on a global scale (see
Table 1).
A review of national initiatives in Bulgaria, such as geospatial portals, using EO and geospatial data was made. The review does not claim to be exhaustive as the research is based on publicly available resources. There are numerous national initiatives related to the creation of GIS portals implemented by ministries, municipalities, research institutes and universities, private companies, and other institutions using funding from the EU and national sources. Currently, several national geoportals are using geospatial data with different purposes as most of them are used for commercial use by Bulgarian citizens. They provide up-to-date data in the field of transport, water and river management, floods, cadaster and regulation, air quality, maritime, environment, agriculture, protected areas, habitats and biotopes, land use, soil, human health, and sea regions. The main providers of information to the National Spatial Data Portal have their own geospatial data portals.
The currently available GIS portals are maintained by public institutions and organizations responsible for regional development, maritime, water, and forestry, amongst others. Some of the Bulgarian municipalities have also developed GIS portals tailored to the specific needs of the municipalities but not all of them are publicly available.
All the above portals are not created for the contribution of monitoring to the SDGs but they are improving citizens’ access to important information to help them make informed decisions which is critical for local governments. GIS easily enable data visualization, spatial analysis, and new insights into the communities they serve.
Availability of EO data and growing private sector involvement in Bulgaria is in line with the global trends in the field. A recent feasibility study mapped the scientific and industrial potential and interest to engage in the space sector. EO is clearly indicated as an area of highest potential by both companies and academia in the country, and accounts for the largest share in public spending. This market dynamic has resulted in the growth of several strong private sector players who are actively exploring the EO data and applications. However, there is no research available in Bulgaria related to the applicability of EO to national commitments to the SDGs.
The review of recent studies proves that the research community has well advanced in the development of methodologies and showcases how EO data can effectively support governments, including in Bulgaria, in addressing SDGs and monitoring the implementation along an increasing number of indicators. The fast speed and increasing sophistication of EO applications and tools would continue to play a role in broadening the set of indicators and targets that can effectively be measured and managed on a global scale.
3. Approach Overview
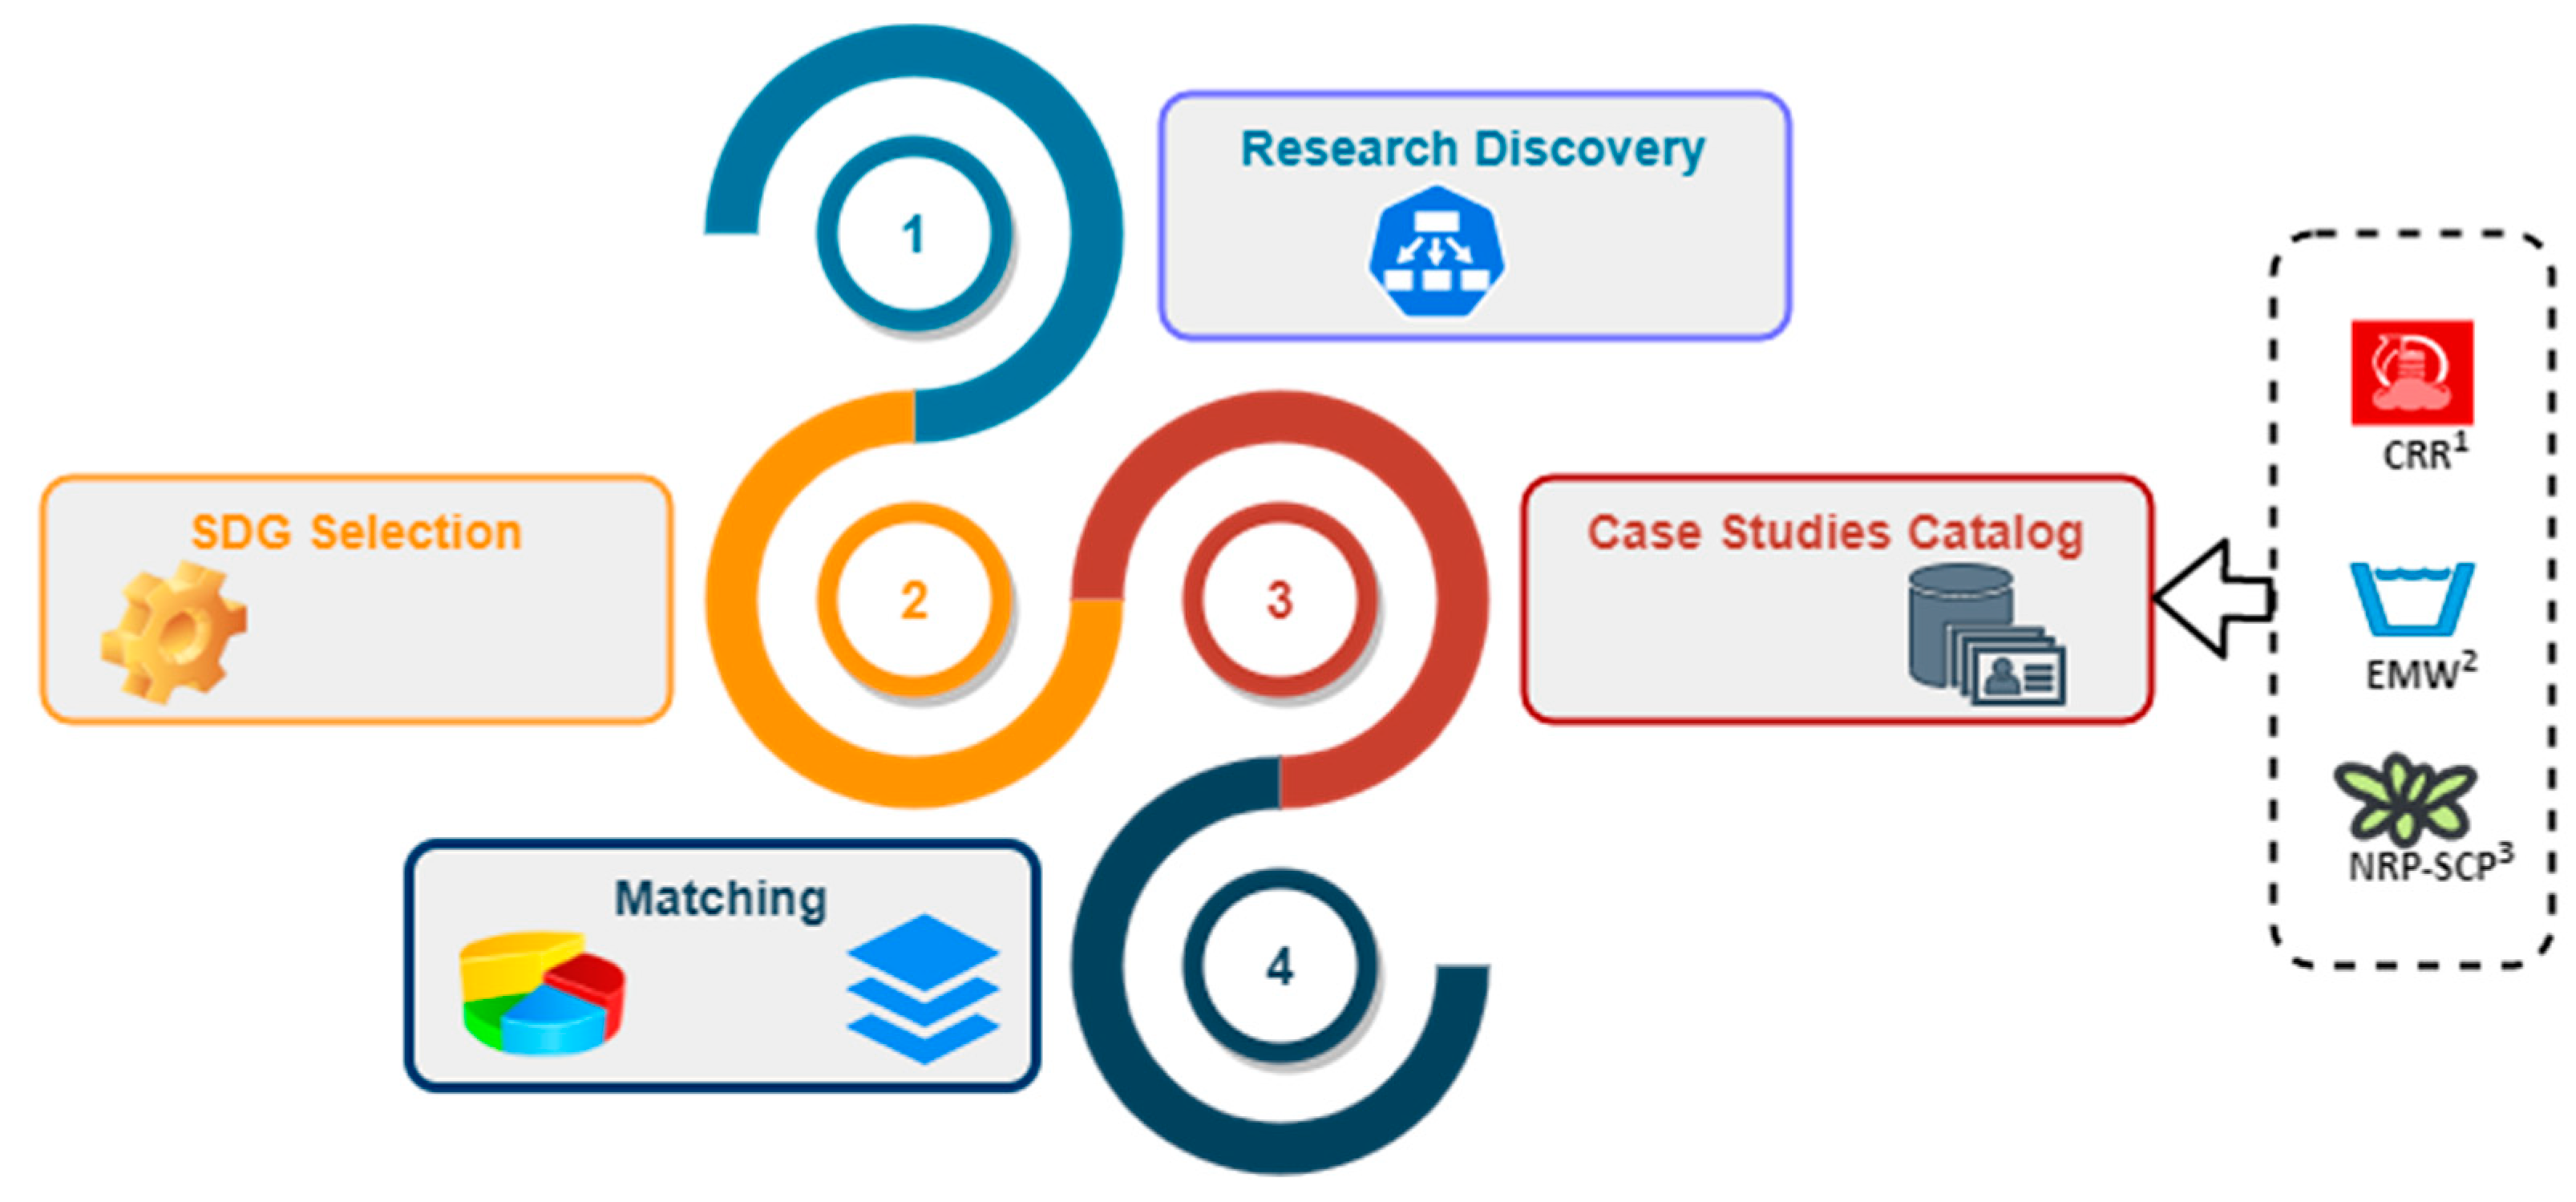
In order to achieve the main goal and contributions of the paper, this section presents the research approach applied in our study. The proposed approach shows four main steps (
Figure 1) which are research discovery, SDGs selection, case studies catalogue, and matching.
The first step, Research Discovery, includes a review of the latest studies which investigate the contribution of EO to the different SDG indicators (
Section 2 above). The main keywords for selected criteria of research works are EO and SDG, and as an additional requirement in Bulgaria.
SDG Selection is the second step which defines the SDG indicators included in this study. The two main data resources explored at this step, are: the CEOS Earth Observation Handbook [
18] and National Development Programme Bulgaria 2030. The selection of data resources aligns with the goal to identify the EO-supported indicators which map to the targets set in the Bulgarian National Development Programme.
The third step, Case Studies Catalogue, presents the usage of EO in three specific case studies in Bulgaria which cover the main challenges in SDGs—water quality monitoring, disaster mapping, and smart agriculture.
The last step, Matching, uses the results of previous steps as input and presents the contribution of EO technologies to the measurement of indicators related to the use of SDGs in three specific examples (portals) for Bulgaria in order to identify which of them can be used in line with national priority areas.
4. Sustainable Development Goal Indicators
The adoption of the 2030 Agenda for Sustainable Development and its SDGs reflects the ambition of the countries to direct their efforts, strategies, and policies towards ensuring a better and more sustainable future. The 2030 Agenda has served as guidance to governments to develop the appropriate implementation strategies and allocate resources [
19] to address its three areas—social inclusion, economic development, and environmental stability. The 17 SDGs are broken down into a total of 169 targets supported by 232 indicators to measure and monitor progress.
Implementing and monitoring 2030 Agenda and SDGs prompted a discussion amongst researchers and practitioners on several practical questions including those related to choosing the priorities, targets, and indicators, as well as applicable methods for measurement of sustainability [
20]. This discussion relates also to collecting the measurement data as well as to the approach for calculating the effects achieved.
Bulgaria has reflected all 17 SDG in its strategic documents and committed to achieving the targets. The National Development Programme Bulgaria 2030 sets three strategic goals (accelerated economic development; demographic upswing; and reduction of inequalities) supported by five strategic axes and 13 priorities which align with the SDGs and detail the selected indicators. The country has performed a Voluntary National Review of the progress in achieving the SDGs [
21] (see
Table 2).
Earth Observation (EO) plays an important role with regards to SDGs along several lines [
22]. First, EO enables monitoring the progress on the targets and reporting on the indicators through spatial and temporal satellite data. Second, satellite data might assist national authorities in achieving the SDGs. EO responds to the importance of high quality, timely, and accessible data to inform the implementation of SDGs.
EO is a reliable source of accurate data collected from satellite, airborne, and in situ sensors. This data provides information—current and temporal evolution over time—regarding the state of the atmosphere, oceans, coasts, rivers, soil, crops, forests, ecosystems, natural resources, ice, snow, and built infrastructure. Such observations can be directly used for planning activities in a number of SDGs and the related targets and indicators.
5. EO Case Studies for the SDG Indicators in Bulgaria
The three case studies using EO data are developed by the RST-TTO, whose mission is to raise awareness of aero-space technologies, strengthen the cooperation between science and business community, develop new market opportunities, and support the active participation of the Bulgarian organizations and businesses into the aero-space sector.
These pilot cases paved the implementation of EO data processing and analytics infrastructure with widespread data architecture and services. The potential for further upgrade of “cloud computing, artificial intelligence and big data” should be considered as one of the first national initiatives presenting the contribution of EO for SDG targets and indicators.
5.1. Copernicus Risk Relay
The Copernicus Risk Relay web portal was developed as part of the project “Strengthening and expanding the aerospace technology transfer office for crisis management and disaster resilience”. The portal aim is to enable easy browsing and view of data on fires, floods, earthquakes, industrial damage, landslides, and storms from the Copernicus Emergency Management Service (EMS), especially the rapid mapping service for the users (
Figure 2).
The portal automatically checks the list of activations on the EMS website and updates its database accordingly. The portal provides the opportunity to add other sources of data or mapped disasters from other sources (
Figure 3). It features a search engine that assists with locating the disaster, as well as a date range slider to help to filter the results. The portal also provides translation of the data into Bulgarian language.
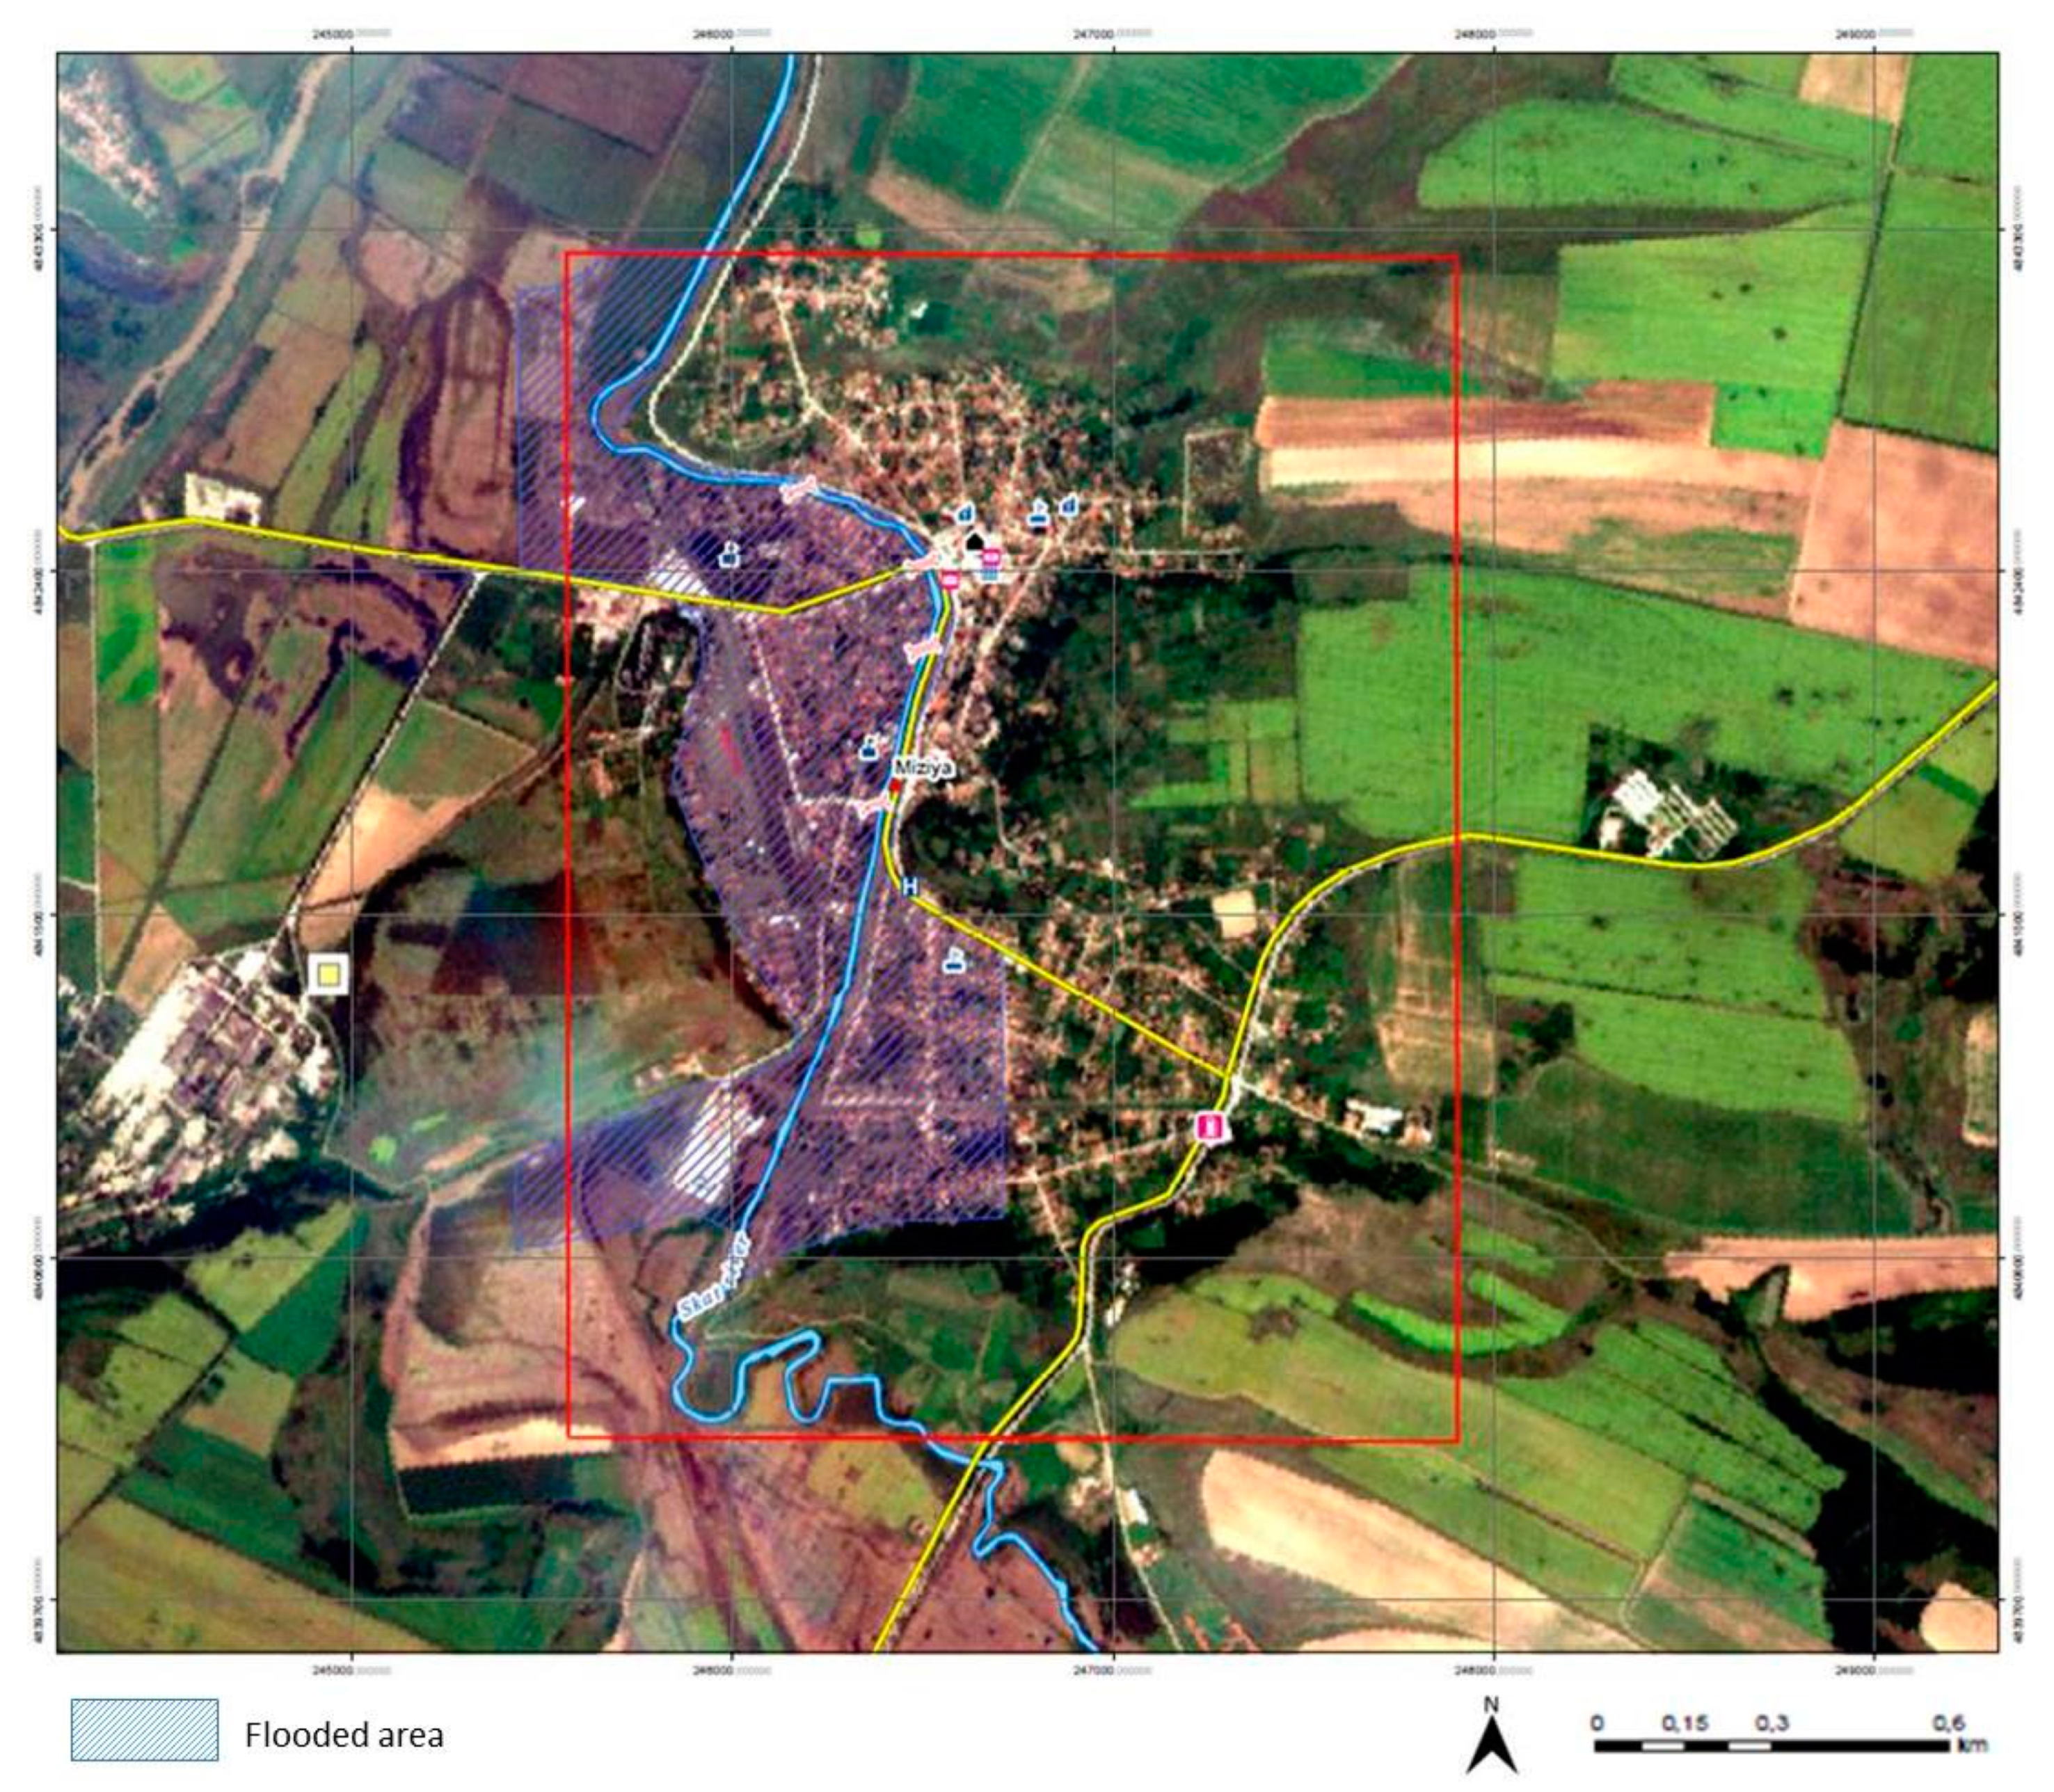
The mapping of the extreme rainfall in summer 2014, which affected Northwest Bulgaria and other parts of the country, can be pointed at as a technological demonstration of the portal’s capabilities to integrate local and global data. One of the most affected cities was Miziya. The flood caused by the river of Skat on 2 August 2014 affected residential and agricultural buildings, road infrastructure, and agriculture areas. The number of affected buildings was around 700 and over 800 people were evacuated from the town and other villages along the river. Unfortunately, the flood caused two casualties. The map presented in
Figure 3 shows the flooded critical infrastructure in Miziya district and is uploaded on the Copernicus Risk Portal. The information of the flooded area is derived by semi-automatic processing technique, refined by visual interpretation of pre-event (27 July 2014) and post-event (8 August 2014) satellite imagery from RapidEye, with GSD 6.5 m. The basic vector map layers are derived from OpenStreetMap (road network, hydrographic information, and objects of critical infrastructure).
5.2. EO Monitoring for Better Water Management and Flood Prevention in Bulgaria
The project “Earth Observation Monitoring for better Water Management and Flood Prevention” (EMOWAF) was developed and implemented as a pilot usage of EO technology in Bulgaria and implementation of a novel IT solution for monitoring, analysis, and management of water quality. Using Sentinel-2 and Landsat-8 satellite data, the developed web portal has unlimited possibilities to visualize different types of satellite images. The project activities comply with the requirements of the European Water Framework Directive—to achieve good qualitative and quantitative status of all water bodies (including marine waters up to one nautical mile from shore). EMOWAF is developed as a Platform-as-a-Service which integrates three geospatial databases—analytical, in situ, and EO—and supports water quality monitoring, environmental monitoring, and coastal protection. The main goal is to provide integration, customization, confidence, and acceptance of EO existing products and data to the end users. An additional aim of EMOWAF is to define the ecological consequences and enable prevention of threats to human lives as a result of environmental pollution.
The project was implemented in three main steps:
- (1)
Integration of the existing database for the national water monitoring network
The input data set with analytical measurements was created and was loaded in the database of the EMOWAF portal to form the complete National Station Data Set, including the locations of the monitoring stations, all of the monitored parameters, the time period of monitoring, and the type of monitoring.
- (2)
Conduction of in situ measurements with WISP-3 hyperspectrometer and processing of the collected data
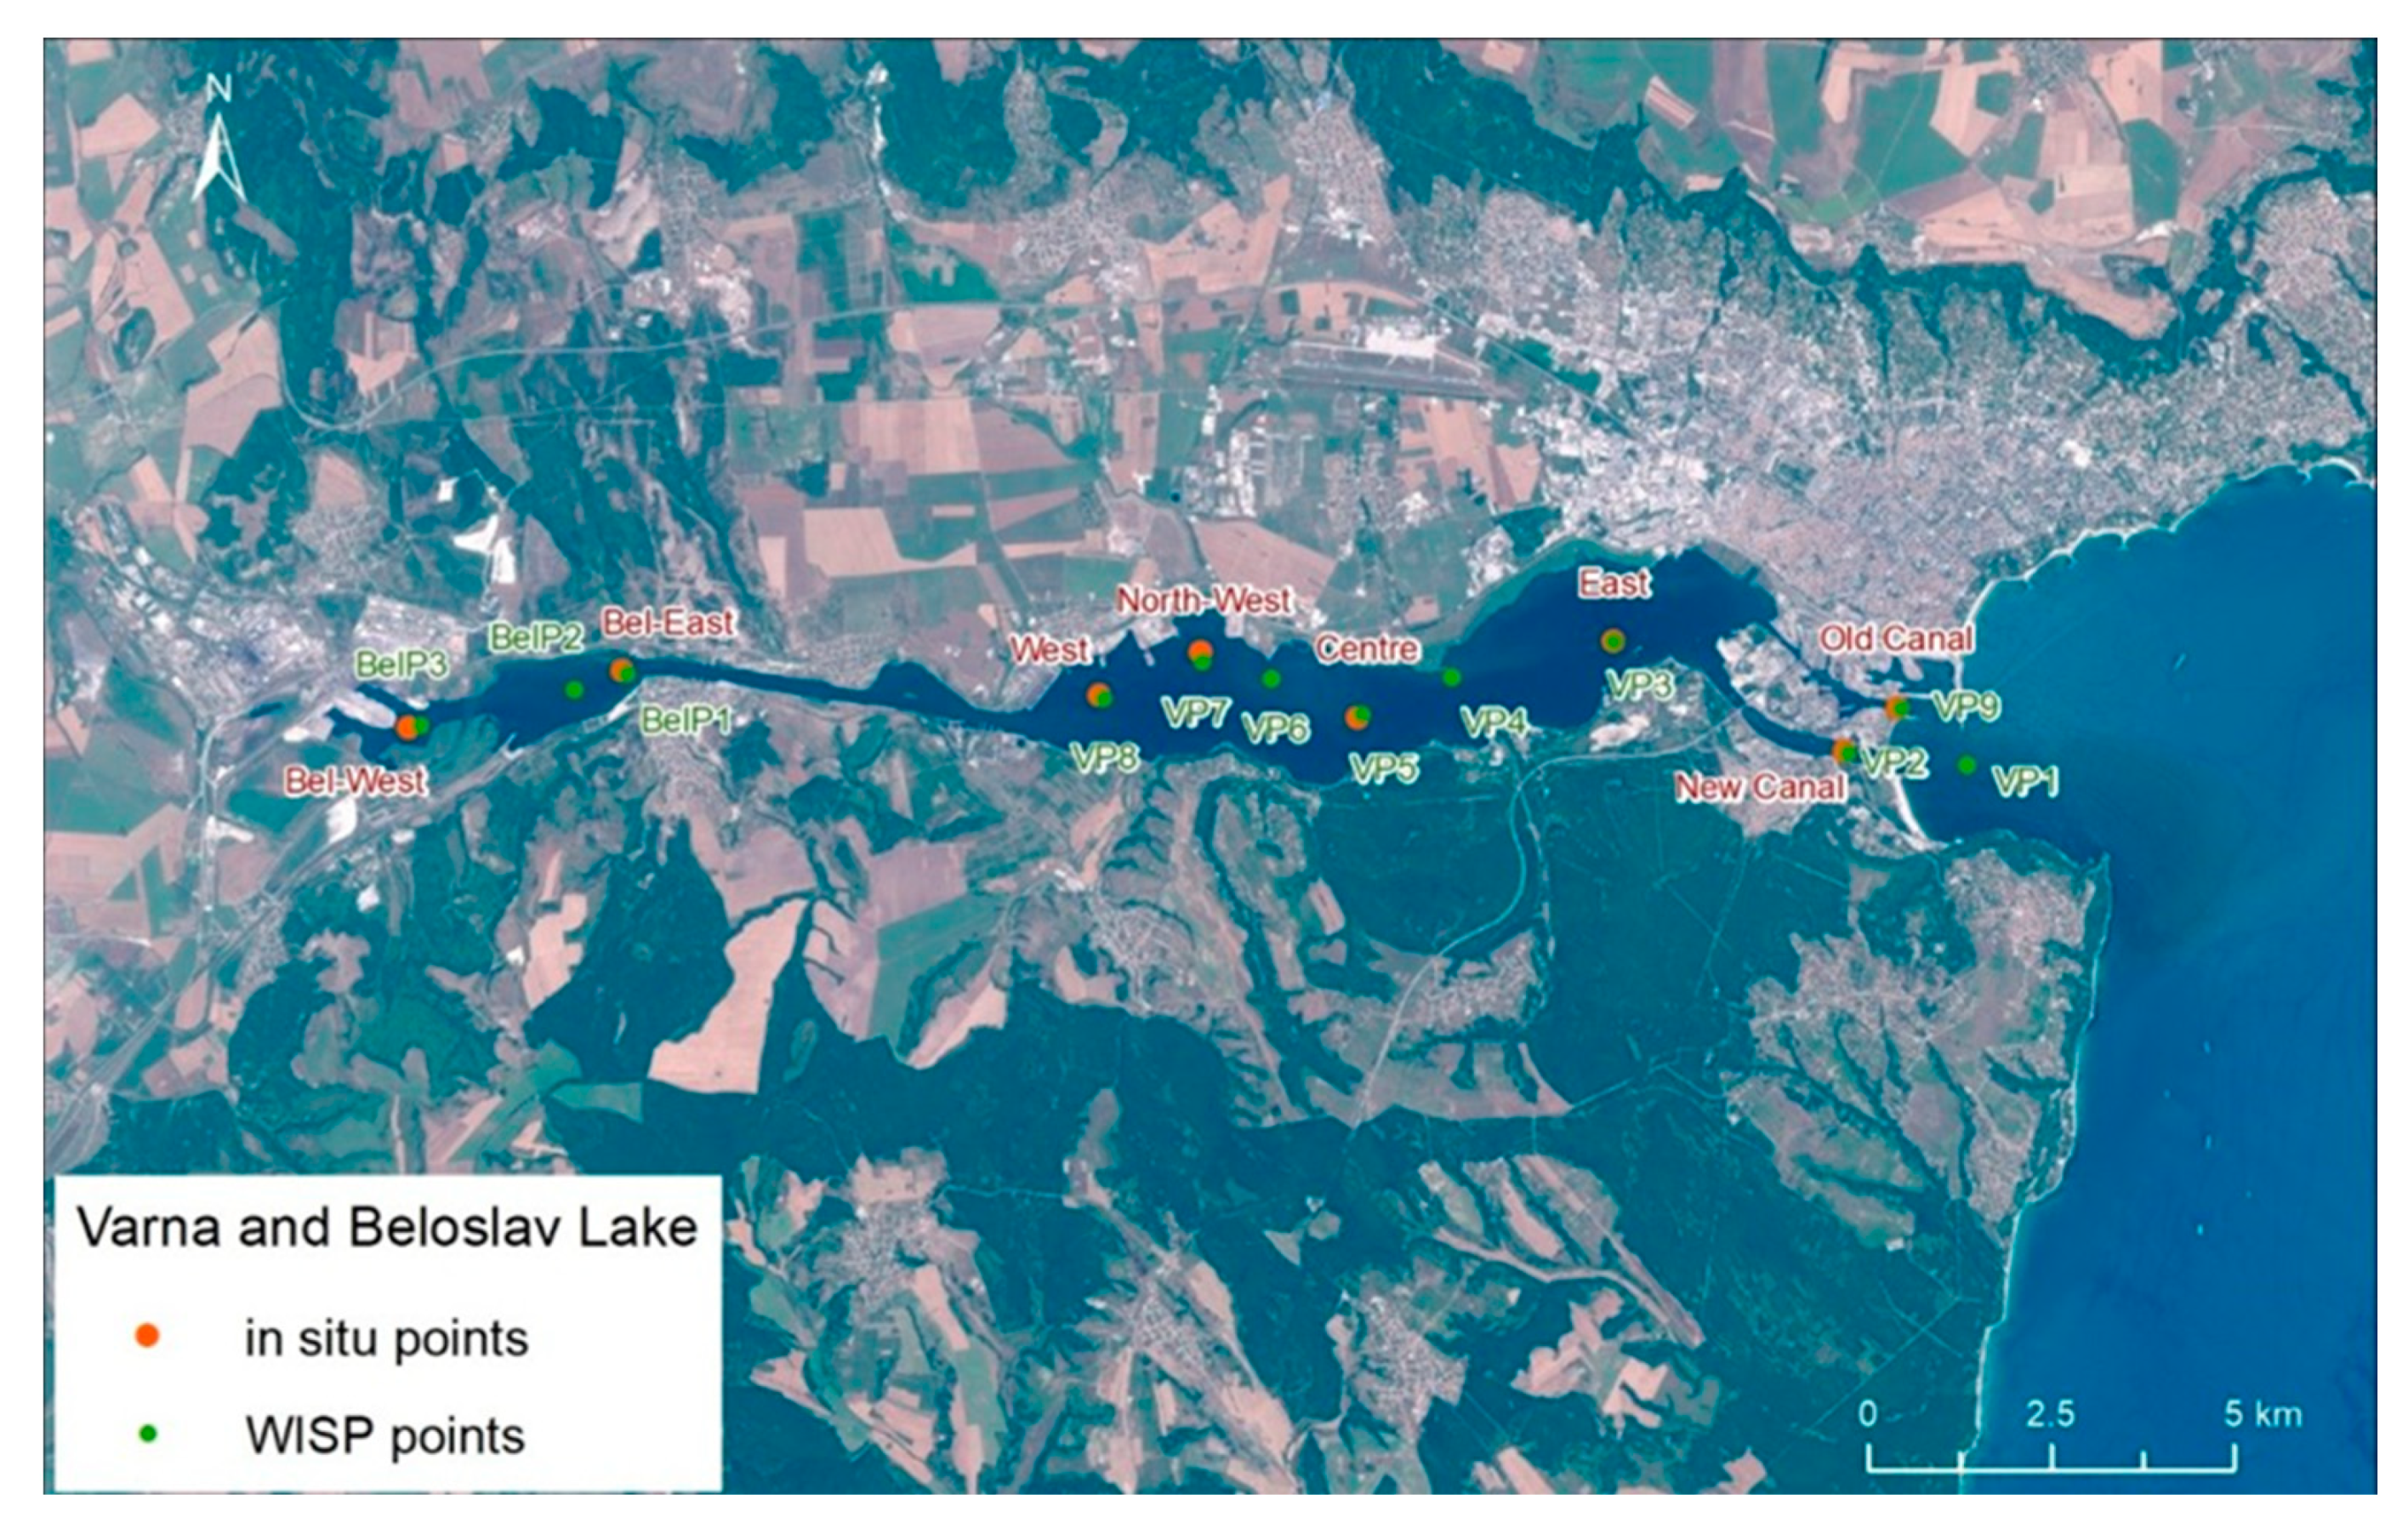
In May and June 2018, several field campaigns were conducted with a field hyperspectrometer WISP-3 for different types of lakes in Bulgaria. Two pilot areas were selected: Iskar Dam Lake and Varna Lake (
Figure 4). The location points of the analytical measurements and the in situ measurements we conducted with the WISP instrument for Varna Lake are visualized in
Figure 5. The field hyperspectral measurement campaigns for the pilot case (test areas of interest 1 and 2) were organized and conducted. A set of three light measurements (down-welling irradiance—Ed; total upwelling radiance—Lt; down-welling radiance—Lsky) was conducted with a hand-held device. At first, a subsurface irradiance reflectance R (0-) from these three measurements (400–800 nm) was calculated, then above water Rrs (λ). The dataset was processed to retrieve the water quality parameters—phycocyanin, suspended solids, chlorophyll a (CHL), and Secchi depth (SDD).
- (3)
EO data collection and processing for retrieval of water quality parameters
a. Pilot areas
The satellite imagery is the main data source for the water quality assessment in this project, as the usage of the in situ station and hyperspectral measurements was foreseen mainly for testing and validation purposes. Definition of the input satellite dataset including an overview of Sentinel-2 and Landsat-8 and other public and commercial satellites that could be used for water quality assessment was undertaken.
The analysis and evaluation of the coverage of satellite tiles (S-2) with areas of interest for pilot areas 1 and 2 concluded with the need for predefinition of areas of interest of pilot area 2 and including additional lakes (
Figure 4) which will increase the type of the lakes analyzed in the frame of the project:
Black Sea coastal lakes—lake Atanasovsko, lake Burgas, and lake Mandrensko (lake type L9: Black Sea medium salty lakes).
Water reservoirs—Tsonevo dam lake (lake type L14: large lowland reservoirs up to middle depth) and Kamchia dam lake (lake type L11: large deep reservoirs).
b. Time series dataset creation
The algorithm for the dataset creation process, using raw EO data from Sentinel-2 and Landsat-8, was presented and the suitable satellite images to be further processed were selected. The structure of the satellite dataset was drawn up and the configuration file’s parameters of the water parameters retrieval tool were developed and set up.
The times series data set included data from 2015 to 2018 from S-2 with more than 300 processed results giving information about the main water quality parameters—chlorophyll a, turbidity, colored dissolved matter, Secchi disk depth, and harmful algae bloom for Varna lake and Iskar Dam Lake. The processed data products for water quality were uploaded into the database and published in EMOWAF (
Figure 6).
c. Validation
The process of validation included a detailed analysis of the data from analytical measurements, hyperspectral data from conducted field campaigns, and satellite-derived data for the water quality parameters. Analytical information on the water quality parameters from the monitoring stations included in the Operational Monitoring of Bulgarian Water Bodies for the two pilot water bodies was compared with both the performed hyperspectral measurement campaigns’ data and the satellite-derived results. The validation of results from EO water quality process was compared with in situ analytical and hyperspectral data and accuracy of the main parameters was evaluated.
5.3. National Research Program “Smart Crop Production”
National Research Programme “Smart Crop Production” (NRP-SCP) aims to support the development of agriculture as a high-tech, sustainable, highly productive, and attractive sector of the Bulgarian economy, which will help to improve the living conditions of farmers and rural areas. The NRP-SCP was approved and initiated together with the National Research Programme “Intelligent Animal Husbandry” as a governmental priority in the area of the smart agriculture. In addition, these studies will contribute to more sustainable management of natural resources, reduction in the harmful effects of agriculture on the environment and the use of pesticides, and increasing the quality and safety of agricultural products; thus, ensuring food security and public health. Participants in the NRP-SCP are scientific organizations, universities, and representatives of the industry.
The main goal of the NRP-SCP is the implementation of fundamental and applied research for the development of models for robotic technologies, digital methods for diagnostics and forecast, as well as digital management of plant growing farms to ensure a sustainable and efficient food system.
The activities under the program are divided into four components:
Component 1: Digital Internet of Things and robotic technologies for the production of plant products. Development of infrastructure for smart agriculture.
Component 2: Diagnostics and forecast through artificial intelligence.
Component 3: Smart system for management of agricultural processes.
Component 4: Artificial intelligence and digital technologies
The connection between the National Research Programme “Intelligent Animal Husbandry” started together with the NRP-SCP can be identified in the activities of the former’s Work Package 4—“Intelligent systems for monitoring and analysis of the pasture and meadow productivity”.
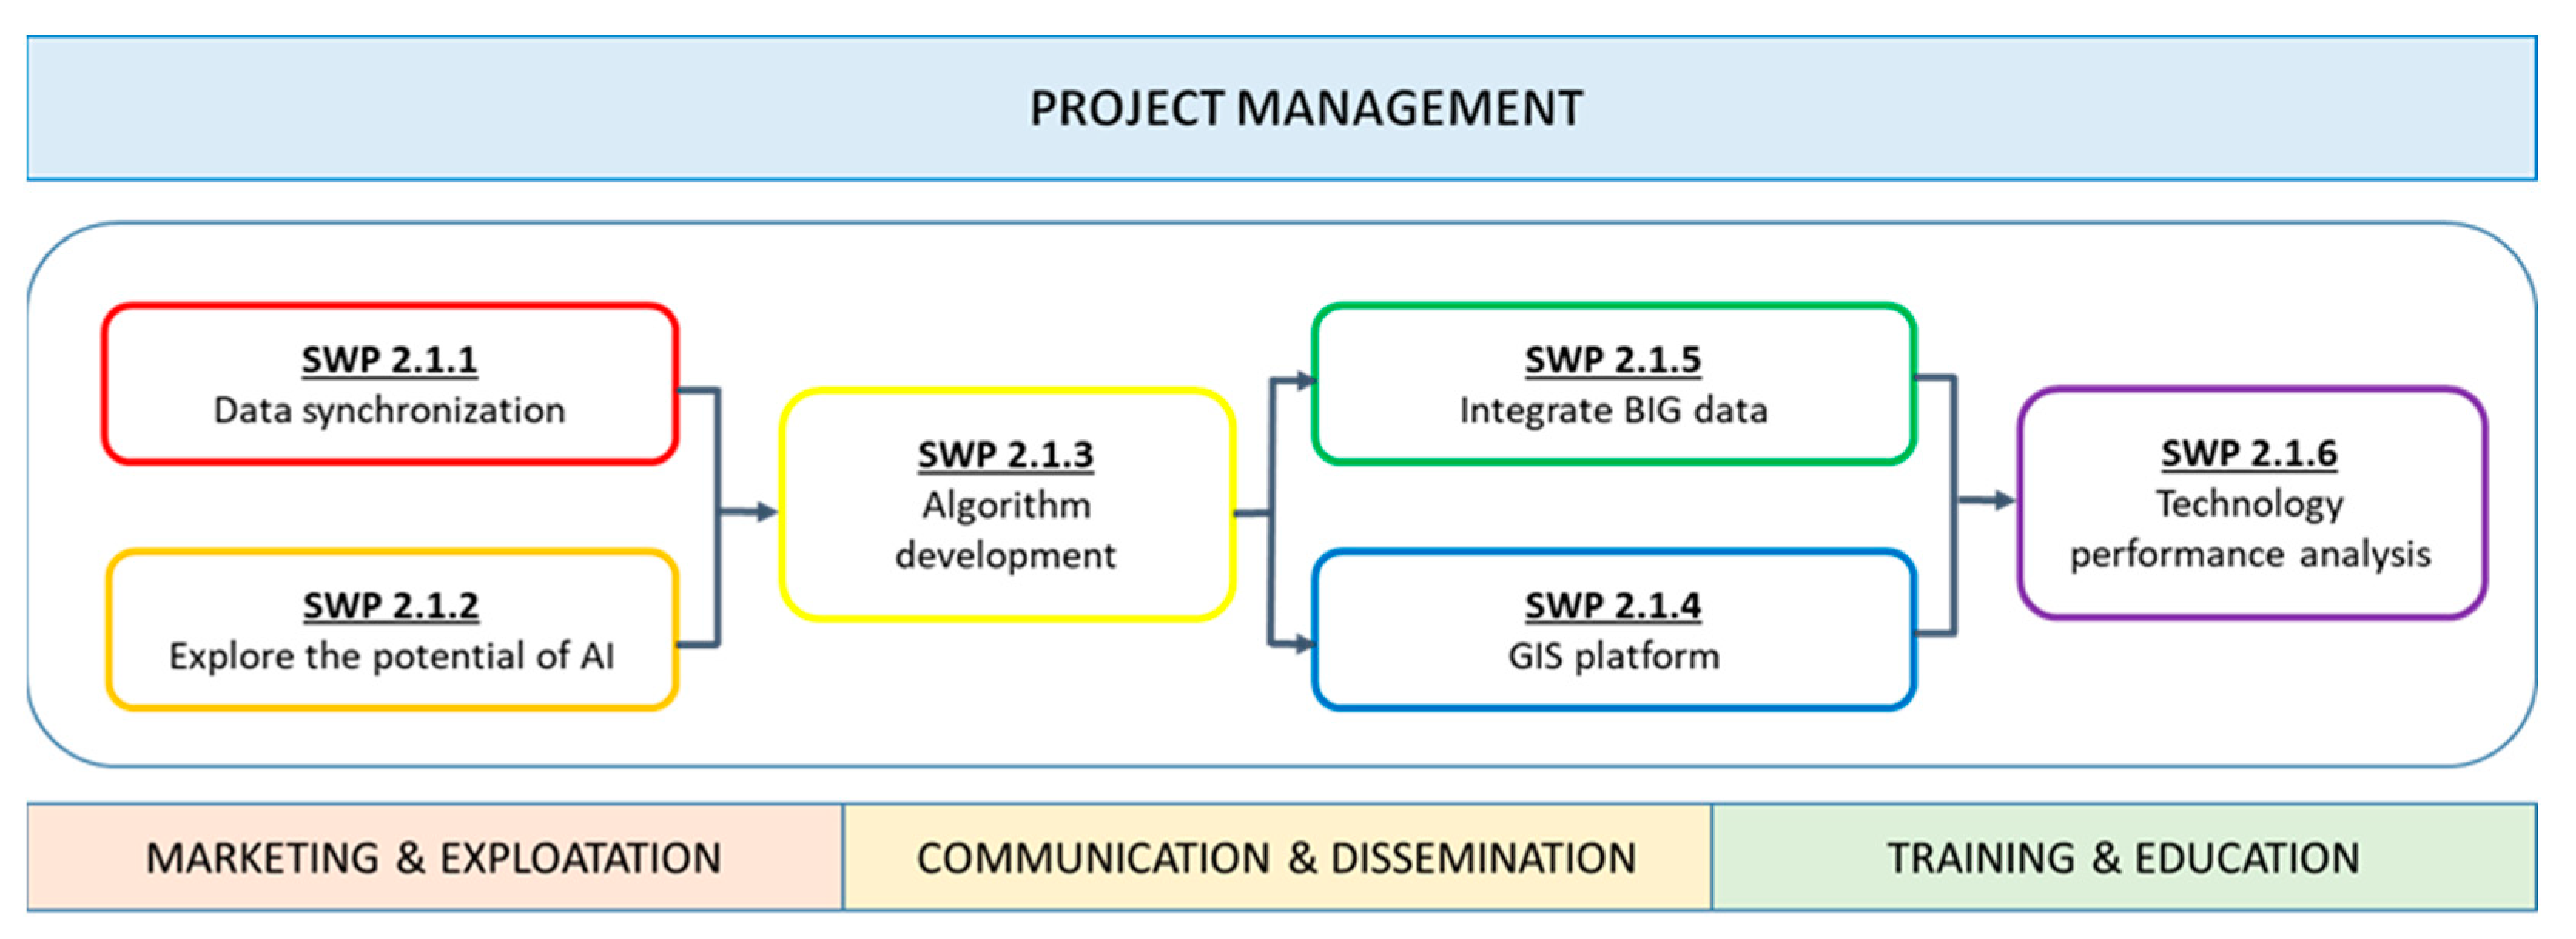
Work Package 2.2 “Use of Earth Observation data” which is part of Component 2 of the NRP-SCP is entirely dedicated to the use of Earth Observation data. In the frame of the component, the research focuses on the possibilities for synchronizing hyperspectral satellite data with in situ data to monitor the ecobiological status of different crops and the ability of artificial intelligence to make decisions using satellite data for monitoring and diagnostics, depending on information about climate conditions (
Figure 7).
Based on the results from the tasks mentioned above, algorithms will be developed for joint use of remote sensing data in combination with images obtained from alternative monitoring technologies, for training of artificial intelligence to recognize and determine the type of crop and the degree of its development. The algorithms will be used for the integration of big data from satellite, aero, and ground measurements for soil analysis.
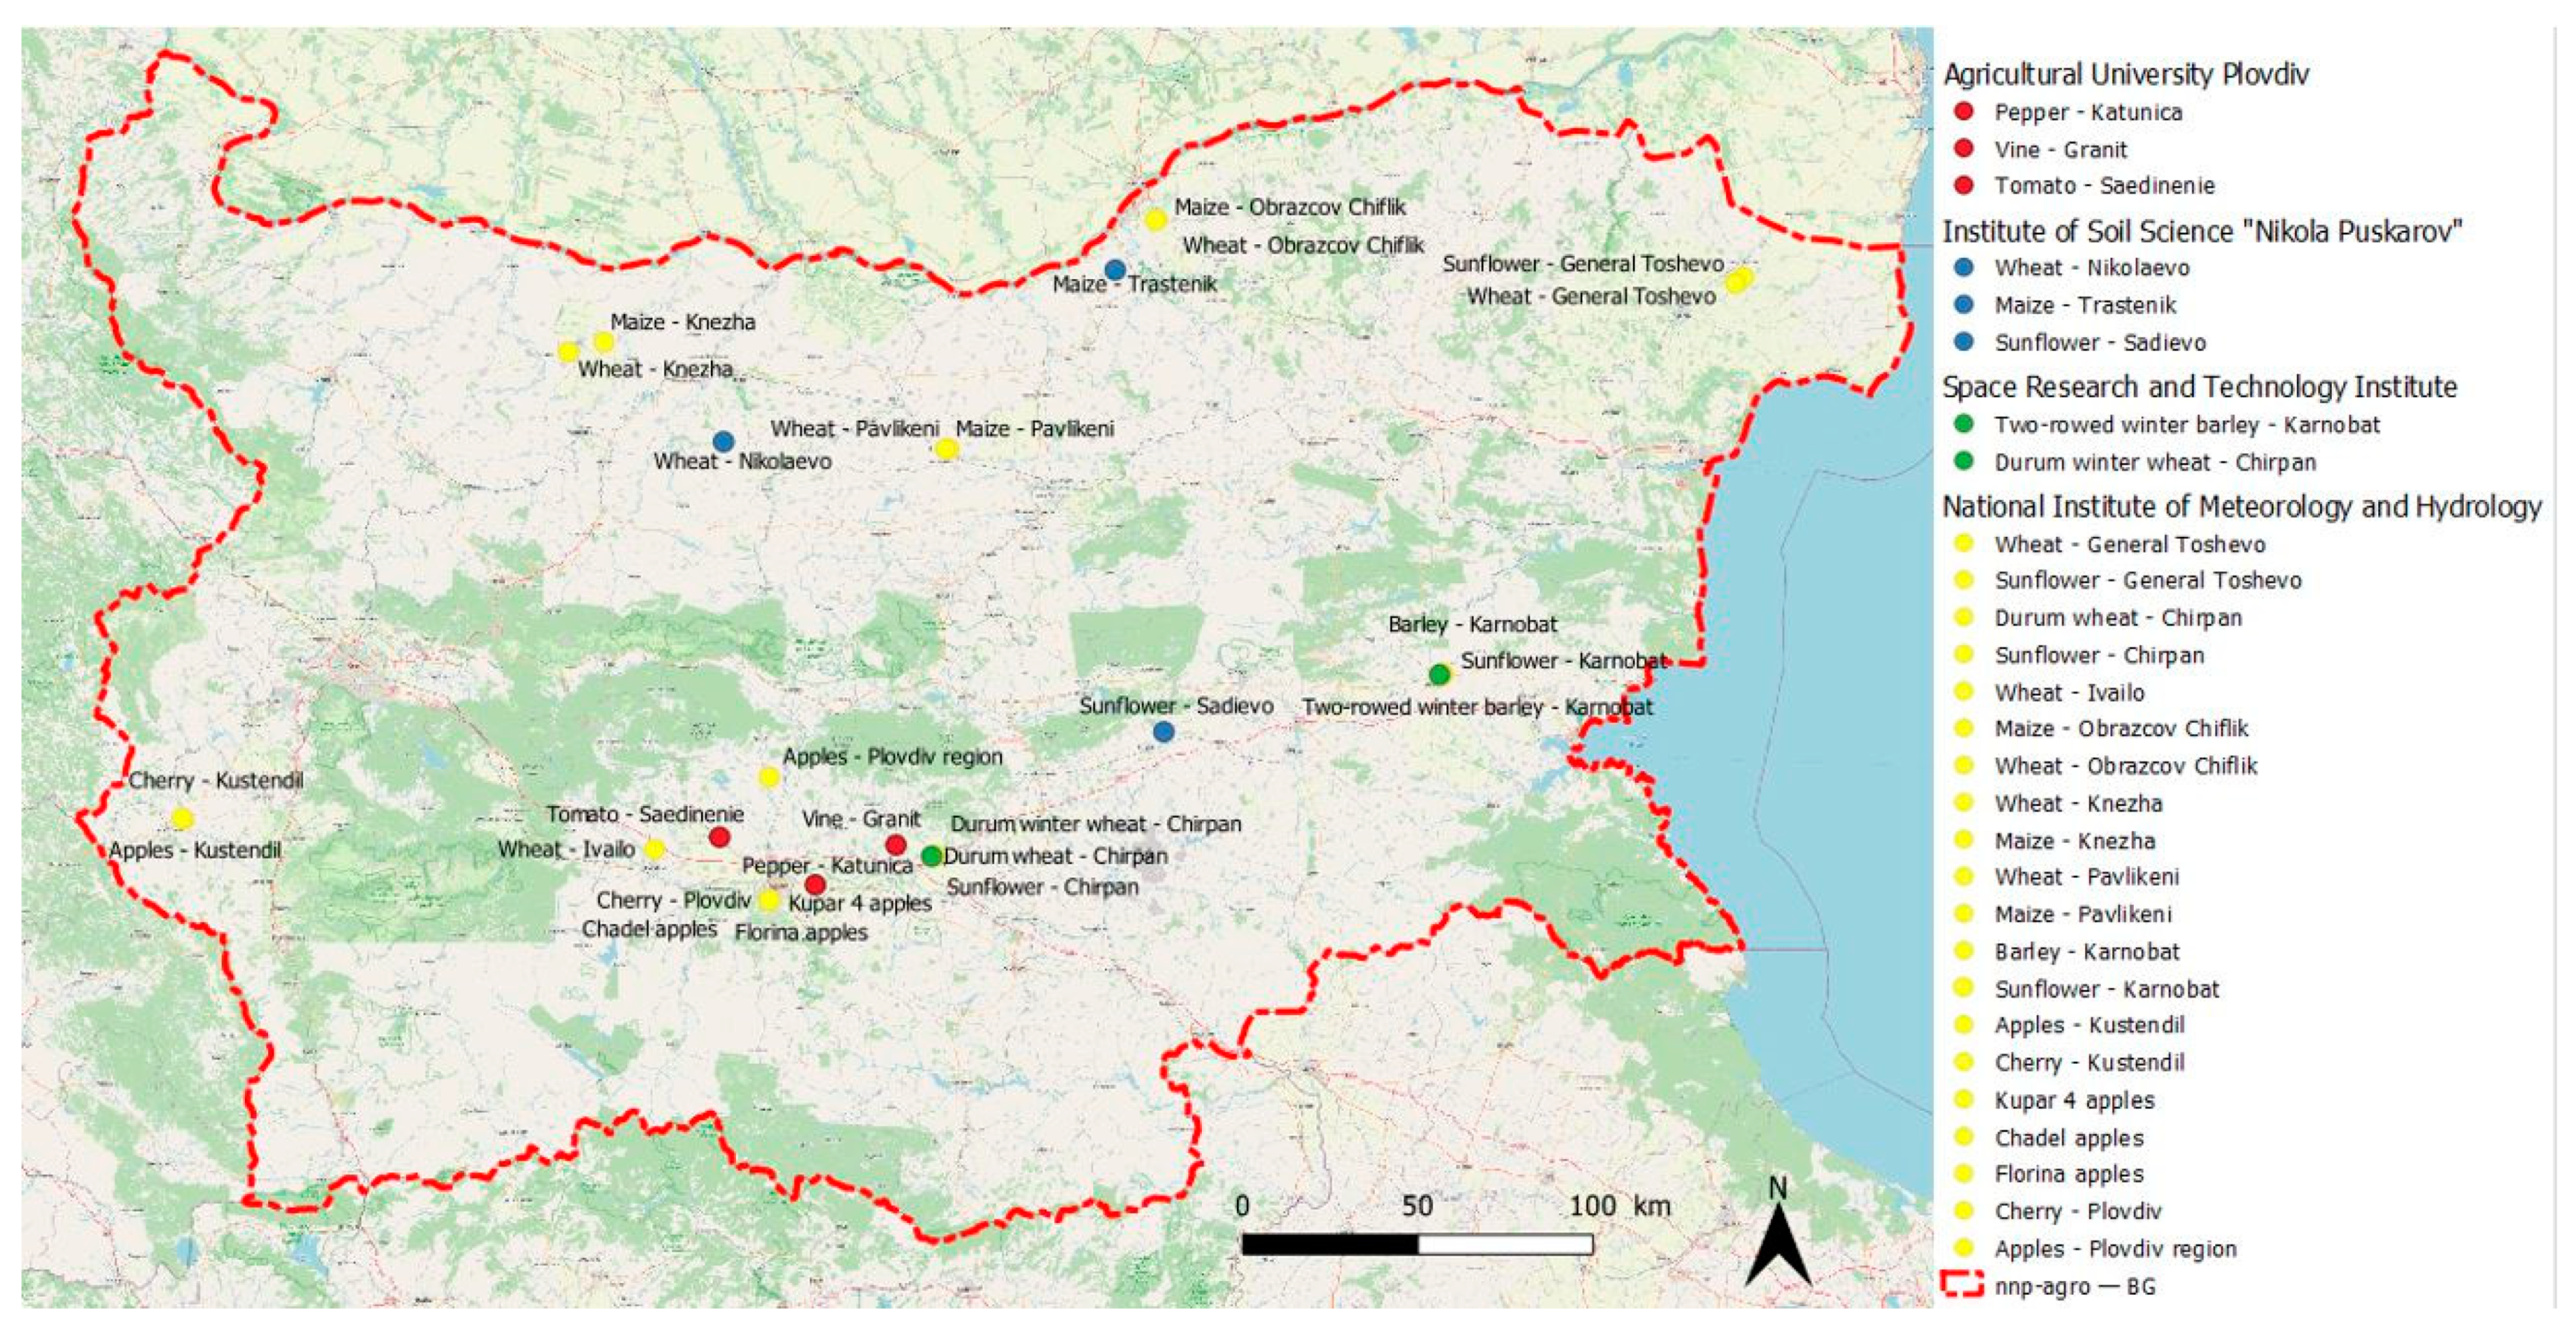
Figure 8 shows the selected pilot areas in Bulgaria and the yields of major crops included in the project framework. The integrated data will be used for the development of a National Digital Soil Catalogue and a software GIS platform which will integrate data from advanced technologies for monitoring of soil parameters, forecasting for the yields of major crops, and data obtained from satellites such as Soil Water Index (SWI), Surface Soil Moisture (SSM), Normalized Difference Vegetation Index (NDVI), Burnt Area), as well as images from Sentinel-1X, Sentinel-2X, Sentinel-3X, and Sentinel-5P. The activities under Work Package 2.2 will conclude with an analysis of the effectiveness of the newly developed technologies, by examining existing areas of different crops.
Test studies were conducted to determine and specify spatial and radiometric parameters of phenological observations of vegetable and vineyards in real production sites in order to develop a methodology for conducting synchronous terrestrial and satellite experiments for remote sensing of crop types. Preliminary data were collected for the indicated cultures in real conditions for the purpose of subsequent verification of the parameters and characteristics obtained after processing of the test images (unmanned aerial vehicle, satellites with high and very high resolution in different spectral channels). The aim is to derive typical features to be classified into typical characteristics classes and to establish the relationship between the observed parameters for crop development by a particular methodology and their identification through remote monitoring. Data from very high resolution (VHR) satellite WordView-3 for one of the test fields is provided and (Normalized Differential Vegetation Index) NDVI values were calculated (
Appendix A,
Figure A1) providing much better spatial resolution than the estimated processing of Sentinel-2 data in
Appendix A,
Figure A2.
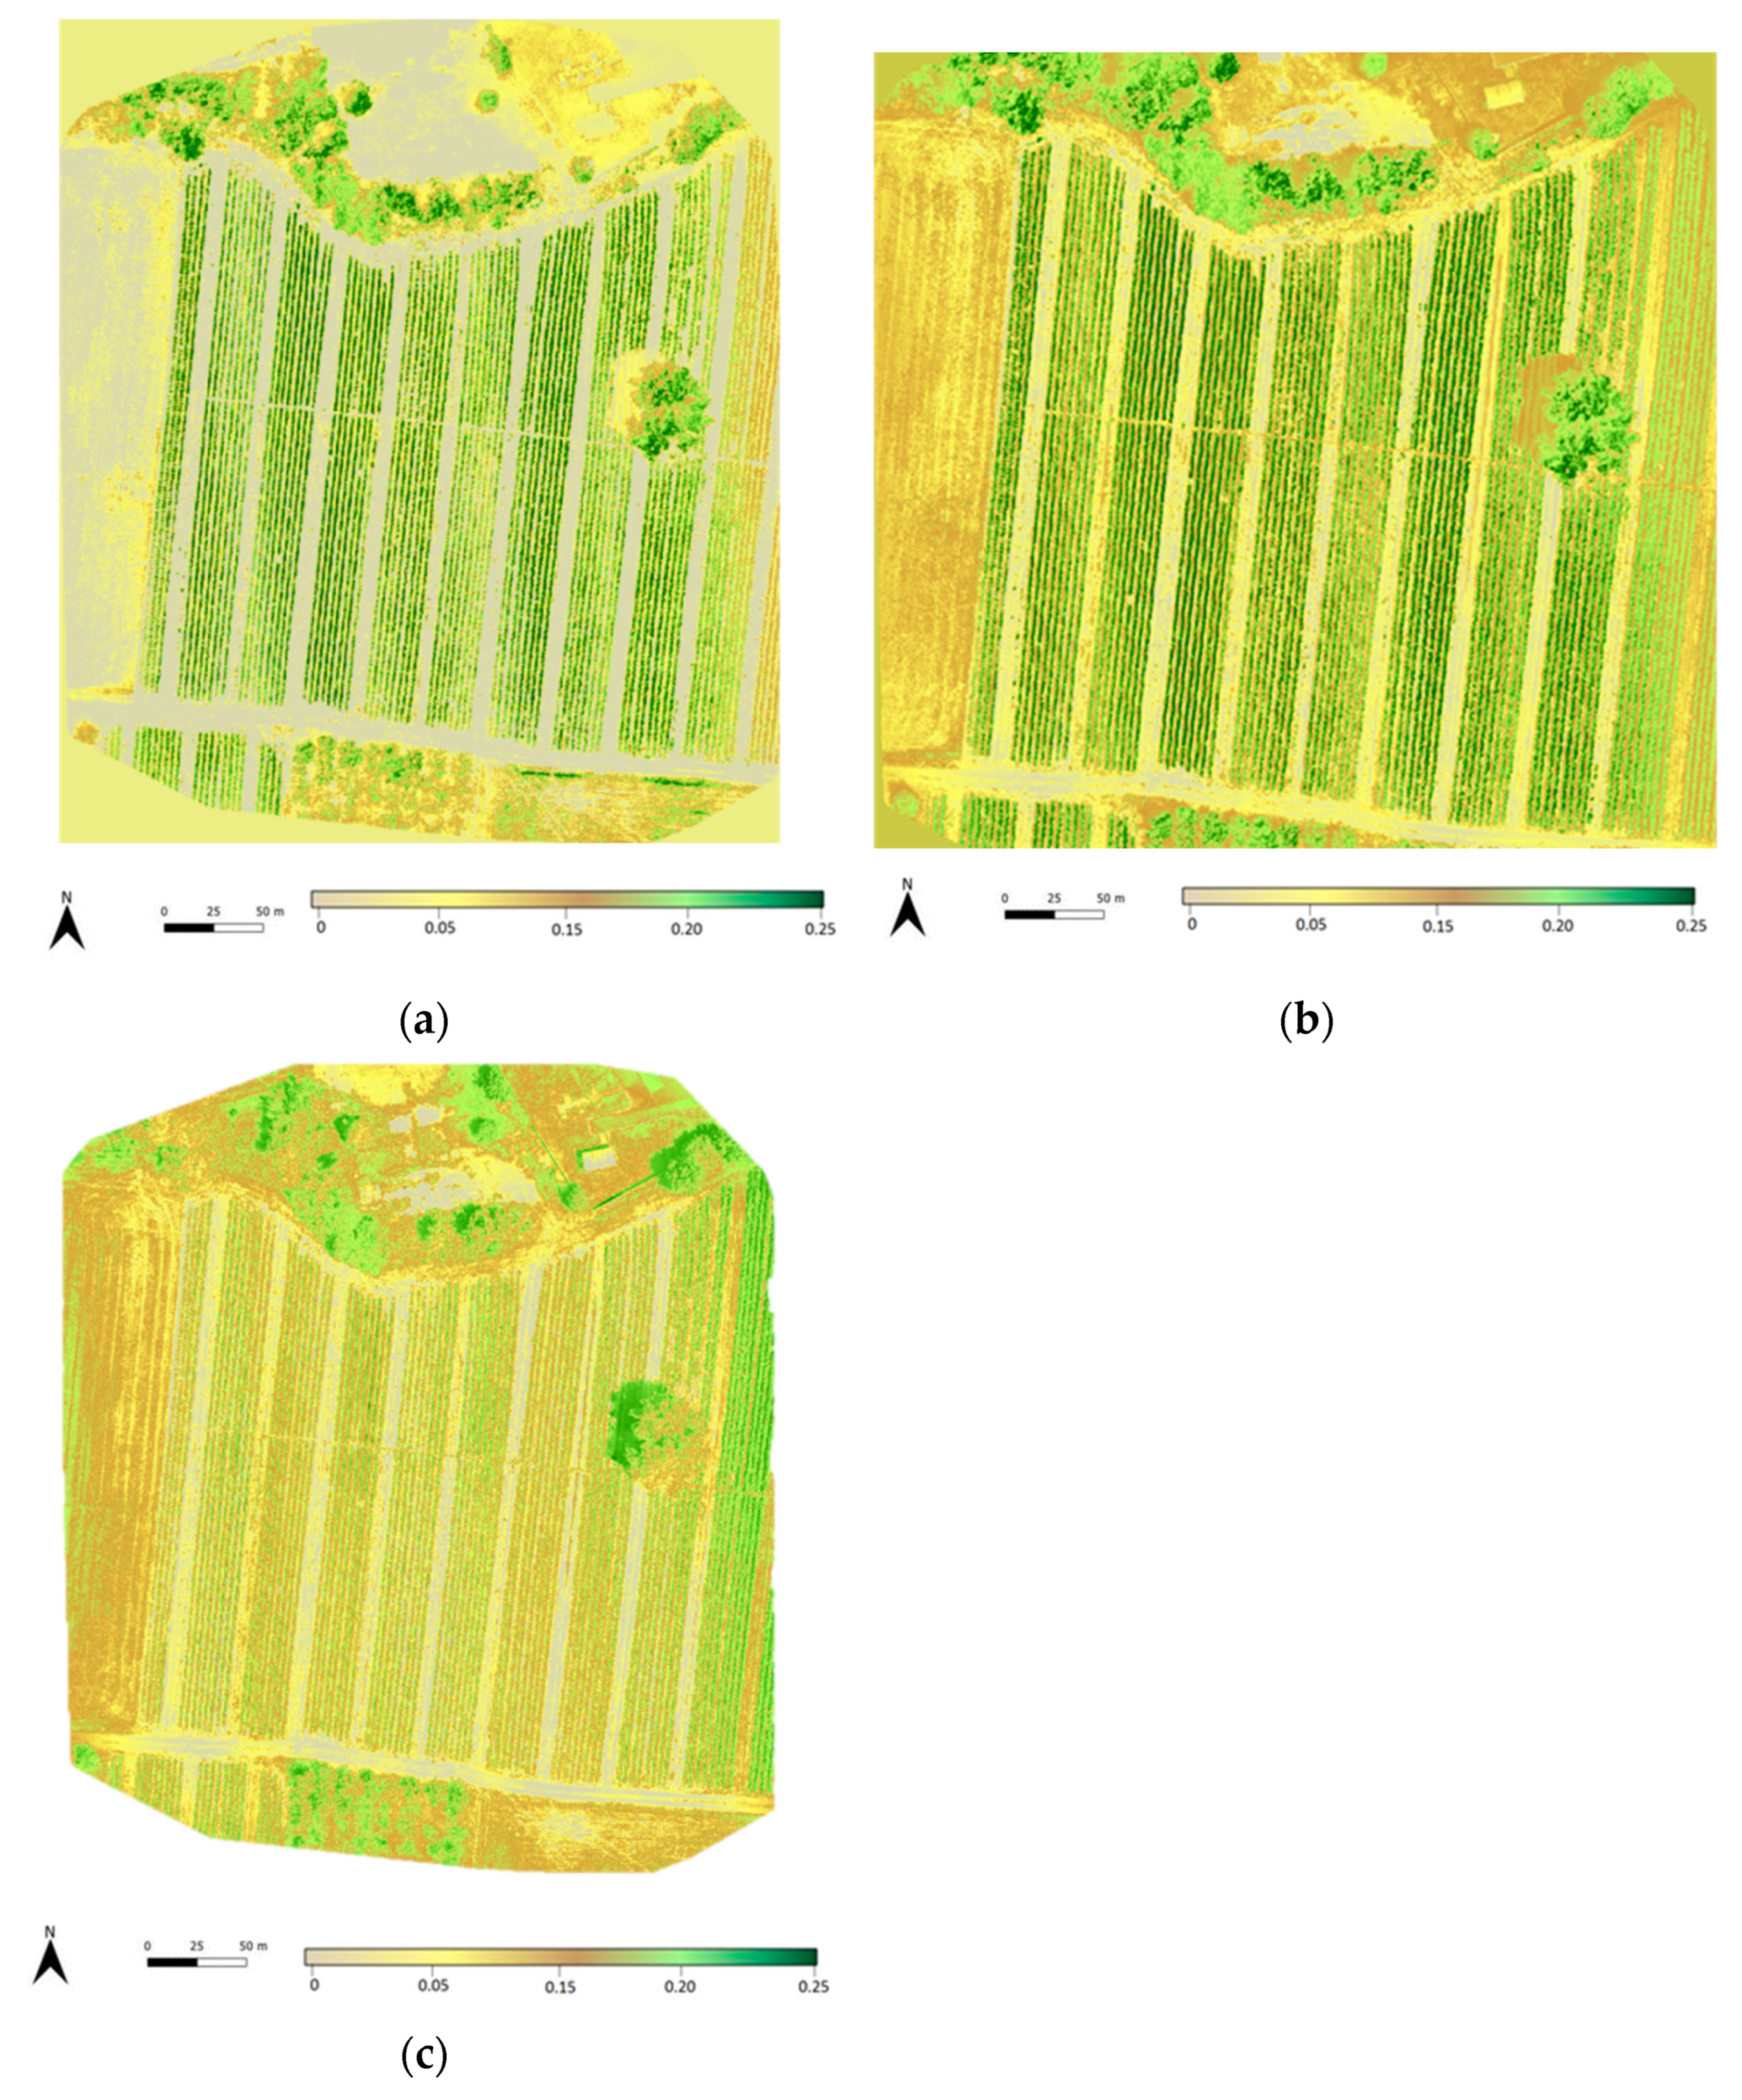
A field campaign with an unmanned aerial vehicle (UAV) was conducted in July 2021 for Katunica, Bulgaria pepper field and the following biophysical parameters important for crop monitoring were retrieved from the processing of the UAV data—NDVI, GNDVI (Green Normalized Difference Vegetation), LCI (Leaf Chlorophyll Index), NDRE (Normalized Difference Red Edge Index), and OSAVI (Optimized Soil Adjusted Vegetation Index) presented in
Appendix A,
Figure A3.
During the first year of the NRP Smart Crop, a study of the potential to adapt the Copernicus Global Land Monitoring indicators to the regional scale (down-scaling) was conducted. A technology test was undertaken based on semi-natural modeling of the real multispectral UAV’s data, to be adapted to the existing S2 Toolbox Level 2 Product algorithm for LAI, FAPAR, and FCOVER [
23]. Preliminary results (
Appendix A,
Figure A4) are encouraging and show that there is a possibility to adapt and to use an algorithm using neural networks to be adapted for VHR and UAV data. For the second year, additional field tests are planned, including in situ measurement and analysis of the spectral characteristics of the studied crop culture (pepper), combined with synchronous observations with UAVs and VHR sensors.
6. Discussion
In the previous section, we highlighted how the results from three projects in EO thematic applications can be used for two objectives. The first objective is to demonstrate the applicability of EO data to affect or to measure the respective SDG indicators in Bulgaria. The second: how EO can support the SDG indicators identified in the National Development Programme Bulgaria 2030.
Table 3 shows how these case studies can contribute the SDG indicators reporting for Bulgaria.
In
Table 3, we compared the SDG indicators we identified, grouped by the different objectives with the possible application of the cases described above. It should be noted that not all indicators were examined for EO relevance [
24]. Therefore, we considered the EO services offered by the case applications in two aspects. The first one is directly influencing the indicators and the second in an indirect way.
The Copernicus Risk Relays project is important as it provides information through EO data for various disasters. The services developed can achieve an indirect impact on the indicators linked to SDGs 1, 11, and 13. These data are mainly statistical information on a locality or country affected by various disasters. Data for SDG 1 and SDG 13 indicators can be found in
Appendix B,
Table A1, which presents information on the development and implementation of an indicator framework for SDGs in Bulgaria [
19] for the period 2016–2019. The services provided within this project can inform the government and the population in a timely manner about disasters, and thus can have a positive impact on indicators such as number of directly affected persons, number of deaths and missing persons, and direct economic loss. This can also be applied to climate change as part of causing disasters reflected in Goal 13 indicators—13.1.1 and 13.1.2. The Copernicus Risk Relays project, which is evolving towards disaster prediction and simulations, has contributed to the impact of Goal 11 on the indicators of national disaster risk reduction strategies.
The other key project is EMOWAF which provides quality services to water resources including their dynamics, as addressed in SDG 6 and SDG 14. In a step-by-step monitoring methodology for indicator 6.3.2 [
25], which has been developed as part of the UN-Water Integrated Monitoring Initiative for SDG 6, there are two levels defined. Level 1 uses a water quality index composed of core physico-chemical water quality parameters and it is structured as a five-step approach. The steps include definition of river basins, water bodies and monitoring stations, collection of water quality data, and assessment of the water quality data. Following the same methodology, the EMOWAF portal integrates three main types of geospatial data: (a) analytical data from the national measurement network of the Bulgarian Executive Environment Agency for the assessment of physic-chemical parameters of water; (b) in situ data measurements obtained by a specialized hyperspectrometer (WISP) for assessment of water quality, conducted at the same control points of the national measuring network; and (c) retrieval of five main biophysical parameters (turbidity (TUR), total suspended matter (TSM), chlorophyll a (CHL), harmful algae blooms (HAB), colored dissolved organic matter (CDOM), and Secchi depth (SDD)) by processing high resolution satellite data (EO data).
On the other hand, Level 2 monitoring ensures that the balance between global and national relevance is met. In Level 2, an additional approach is mentioned—the use of EO data could “provide an important and cost-effective additional data source for monitoring of large rivers and lakes in the near future”. The EMOWAF project has implemented the main component water quality processor. It has derived the main parameters defining the water quality status of water bodies, addressed by the EMOWAF project: turbidity (TUR), total suspended matter (TSM), chlorophyll a (CHL), harmful algae blooms (HAB), colored dissolved organic matter (CDOM), and Secchi depth (SDD). These parameters can be explored as additional data implemented in the methodology. In relation to indicator 6.5.2, steps 1 and 2 from the methodology for monitoring transboundary cooperation [
26] could be identified using EMOWAF services.
As mentioned above, one of the parameters determined in the EMOWAF project is the chlorophyll-a concentration. This is a proxy indicator for SDG 14, indicator 14.1.1 (sub-indicator index of coastal eutrophication) which is defined in the step-by-step guide to implementing the indicator for SDG indicator 14.1.1 [
27]. The biophysical water quality parameters obtained from satellite data can also provide information for SDG indicator 14.2.1—proxy indicator: Integrated Coastal Zone Management (ICZM) protocol, as the spatial resolution of the imageries provide a better picture of the coastal zone.
The main goal of work package 2.2 of the NRP-SCP project is implementation and adaptation of the Copernicus Global Land Monitoring products such as SWI, SSM, NDVI, LAI, etc., merged with VHR/HR and UAV data. The downscaling of the parameters will help small and medium farmers and thus will support indicator 2.4.1, SDG 2.
Indicators 15.1.1 and 15.2.1 are used to report progress on Targets 15.1 and 15.2 which are critically important for achieving sustainable forest management and forest conservation. The share of forest area as a proportion of total land area for Bulgaria for the period 2017–2020 is shown in
Table A1. The indicator 15.1.1 is calculated as the percentage relation between forest area and total land area of a country and it requires the information for the two components [
28]. This indicator is regularly monitored and reported, and that is why it is important that information from multiple sources could be obtained and captured. Therefore, the GIS platform of the NRP-SCP project might be used for remote sensing analysis of forest area in Bulgaria to provide the necessary information.
Indicator 15.2.1 covers the forest area net change rate and can be monitored by EO data to map the changes. However, a better spatial resolution of multispectral satellite data and radar satellite data can be used to improve the accuracy.
The three sub-indicators (land cover, land productivity, and soil organic carbon) of 15.3.1 proportion of land that is degraded over total land area, provide good coverage in order to assess the quantity and quality of land-based natural endowment and its associated ecosystem services [
29] via using EO datasets from MODIS—Vegetation Index Products (NDVI and EVI), ESA Climate Change Initiative and Land Cover products from Copernicus Land Service.
One of the defined functionalities of the GIS platform of the NRP-SCP project is to visualize land cover layers for Bulgaria (forest, grassland, cropland, wetland, artificial land, bare land, and water bodies) [
26]. In this way, it is possible to support the calculation of the land cover sub-indicator as described in [
26] as the land cover changes can occur because of changes in land management practices such as agricultural intensification, deforestation, etc.
The sub-indicator land productivity is represented as vegetation indices and is closely related to the NDVI index, for which calculation data can be obtained from the Copernicus Global Land Service products. Most of the monitoring data of sub-indicator 15.3.1 is easily accessible from widely used regional and global data sources mentioned above. However, the scale of the data products is 250 m and 1 km per pixel which is a limiting factor for detailed assessment. For these reasons, the National Research Program “Smart Crop Production” may provide information with improved spatial resolution.
7. Conclusions
In the paper, we highlighted how three projects’ results in EO thematic applications can be used for two objectives. First, we demonstrated the applicability of EO data for measuring the respective SDG indicators in Bulgaria. Second, we showed how EO can support the SDG indicators identified in the National Development Programme Bulgaria 2030. Three main case studies using EO in the area of water quality monitoring, disaster mapping, and agriculture were discussed in view of their contribution to the SDG indicators in Bulgaria.
Copernicus Risk Relays Portal is the first example in Bulgaria, showing the potential of adaption of the Global Geospatial Data (Copernicus EMS) on a national level. It keeps full interoperability on the global level with the opportunity to integrate national geospatial database generated from EO data (Mapping of Miziya flooding in 2014) related to the above-mentioned SDGs.
The EMOWAF project upgraded the results and extended the scope of the previous case, contributing not only to adapting national geospatial data to a global system, but to actually implementing a methodology for assessing key indicators, which are integrated and verified with the existing national in situ data. Thus, it creates an opportunity for real use of SDG indicators at a national level.
The aim of the third project, NRP-SCP, is to use geospatial information (obtained from various sources—space, aircraft, and ground) which will, de facto, allow use not only in indicators to assess the implementation of the respective SDGs, but will apply new methods such as artificial intelligence and machine learning to allow testing and evaluation of the contribution for some indicators that are at level 2, and for which monitoring does not yet exist.
Our further goal is to develop an integrated system for the evaluation of the SDG indicators, based on EO data, which can grow from the local to the regional level and to contribute to the improvement in the methods for evaluation of the SDG indicators.


 ,
, 


