Article

Land Use Dynamic Changes in an Arid Inland River Basin Based on Multi-Scenario Simulation

1
College of Geography and Remote Sensing Sciences, Xinjiang University, Urumqi 830046, China
2
State Key Laboratory of Desert and Oasis Ecology, Xinjiang Institute of Ecology and Geography, Chinese Academy of Sciences, Urumqi 830011, China
3
College of Geography and Tourism, Xinjiang Normal University, Urumqi 830054, China
*
Author to whom correspondence should be addressed.
Remote Sens. 2022, 14(12), 2797; https://0-doi-org.brum.beds.ac.uk/10.3390/rs14122797
Submission received: 15 April 2022 / Revised: 19 May 2022 / Accepted: 8 June 2022 / Published: 10 June 2022

Abstract

:
The Tarim River Basin is the largest inland river basin in China. It is located in an extremely arid region, where agriculture and animal husbandry are the main development industries. The recent rapid rise in population and land demand has intensified the competition for urban land use, making the water body ecosystem increasingly fragile. In light of these issues, it is important to comprehensively grasp regional land structure changes, improve the degree of land use, and reasonably allocate water resources to achieve the sustainable development of both the social economy and the ecological environment. This study uses the CA-Markov model, the PLUS model and the gray prediction model to simulate and validate land use/cover change (LUCC) in the Tarim River Basin, based on remote sensing data. The aim of this research is to discern the dynamic LUCC patterns and predict the evolution of future spatial and temporal patterns of land use. The study results show that grassland and barren land are currently the main land types in the Tarim River Basin. Furthermore, the significant expansion of cropland area and reduction in barren land area are the main characteristics of the changes during the study period (1992–2020), when about 1.60% of grassland and 1.36% of barren land converted to cropland. Over the next 10 years, we anticipate that land-use types in the basin will be dominated by changes in grassland and barren land, with an increasing trend in land area other than for cropland and barren land. Grassland will add 31,241.96 km2, mainly in the Dina River and the lower parts of the Weigan-Kuqu, Kashgar, Kriya, and Qarqan rivers, while barren land will decline 2.77%, with significant decreases in the middle and lower reaches of the Tarim River Basin. The findings of this study will provide a solid scientific basis for future land resource planning.

Graphical Abstract

1. Introduction

Land use/cover change (LUCC) is closely related to regional climate and ecological development. It is also of great importance to agriculture, industry, transportation and housing and has become a hot issue in global climate change [1,2,3]. Driven by a rapidly increasing global population along with resource depletion and environmental problems, the conflict between humans and land is deepening [4,5,6]. For example, urbanization has led to changes in land structure, over-exploitation and utilization of arable land and water resources, and degradation of grasslands, which have led to a series of ecological and environmental problems [7,8,9]. The current agricultural cash crop in the basin is mainly cotton, and the excessive waste of water resources and degradation of ecological functions of rivers and lakes on a local scale have resulted from human production and lifestyle such as over-cultivation, over-grazing and groundwater over-extraction. Natural vegetation has also been severely damaged as a result, leading to grassland degradation, increased desertification and declining biodiversity [10,11]. The phenomenon of LUCC manifests as different regional characteristics when applied to specific regions [12]. The simulation prediction models commonly used for future LUCC mainly include the CA-Markov model, the PLUS model, the gray prediction model, CLUE-S, and the artificial neural network model [13,14,15].
Fruitful results have thus far been achieved in applying these prediction models. For example, Sibanda used the CA-Markov model to simulate future LUCC in the Shashe sub-catchment and estimated the ecological value of the wetland in order to gauge the impact that LUCC would have on the area [16]. Cao analyzed the spatial and temporal characteristics of global cropland from two different perspectives—agroecological and geopolitical—using a dynamic land use attitude model [17]. Tang selected the CA-Markov and CLUE-S models to evaluate and predict the spatial and temporal evolution and future trends of habitat quality under the influence of LUCC [18]. Jiao used the system dynamics (SD) model, the grey prediction (GM) model, and the Markov model to simulate the dynamics of land use in a river delta under different development scenarios, where socio-economic progress is the dominant factor [8].
In related studies, Matlhodi combined CA-Markov models with cellular automata models and simulated future LUCC in the Gaborone Dam water bodies to improve the sustainability of the catchment [19]. CA-Markov models are often used in land use simulations because of their advantages in spatio-temporal representation and simulation accuracy [20,21]. Therefore, simulating and predicting the dynamics of LUCC in a region by selecting different models can help reveal the trends and patterns of future land change in the region, promote the coordinated development of oasis water and land resources, and make a positive contribution to alleviating the human–land conflict [22].
The Tarim River Basin is China’s largest inland basin. Despite its imposing size, the basin is one of the most ecologically fragile regions in the country [23,24]. At present, deserted land is still expanding and taking various forms. Saline land is widely distributed, and the danger of soil salinization is serious. Grassland degradation and soil erosion. Grassland degradation is serious, and soil erosion poses a major hazard to economic construction and the safety of people’s life and property [25,26]. The process of desertification in the basin as well as the unharmonious development of the human–land relationship are causing enormous challenges [27]. Even so, the economic development and social stability of the region largely depend on the area’s ecological protection to sustain human progress [28].
The rapid development of the social economy and the continuous exploitation of regional resources have led to unreasonable and uncontrolled development of land resources as well as an excessive waste of water. The impact of these changes has been devastating for the ecological environment [29,30]. This study explores the evolution of land use patterns in the Tarim River Basin based on remote sensing data. Integrated quantitative prediction and spatial simulation methods are used to study the dynamic evolution of the basin’s land use for a future time period (2020–2030). The CA-Markov model, PLUS model and gray prediction model are selected to quantitatively and spatially simulate results. These results are then verified and compared, and the evolution of future spatial and temporal patterns of land use in the Tarim River Basin are simulated and analyzed. The main objective of the research project is to analyze the spatial and temporal characteristics of different land types in the basin, along with their inter-transfer patterns and land structure changes, in order to provide a scientific basis for the construction of the “Silk Road Economic Belt”.

2. Materials and Methods
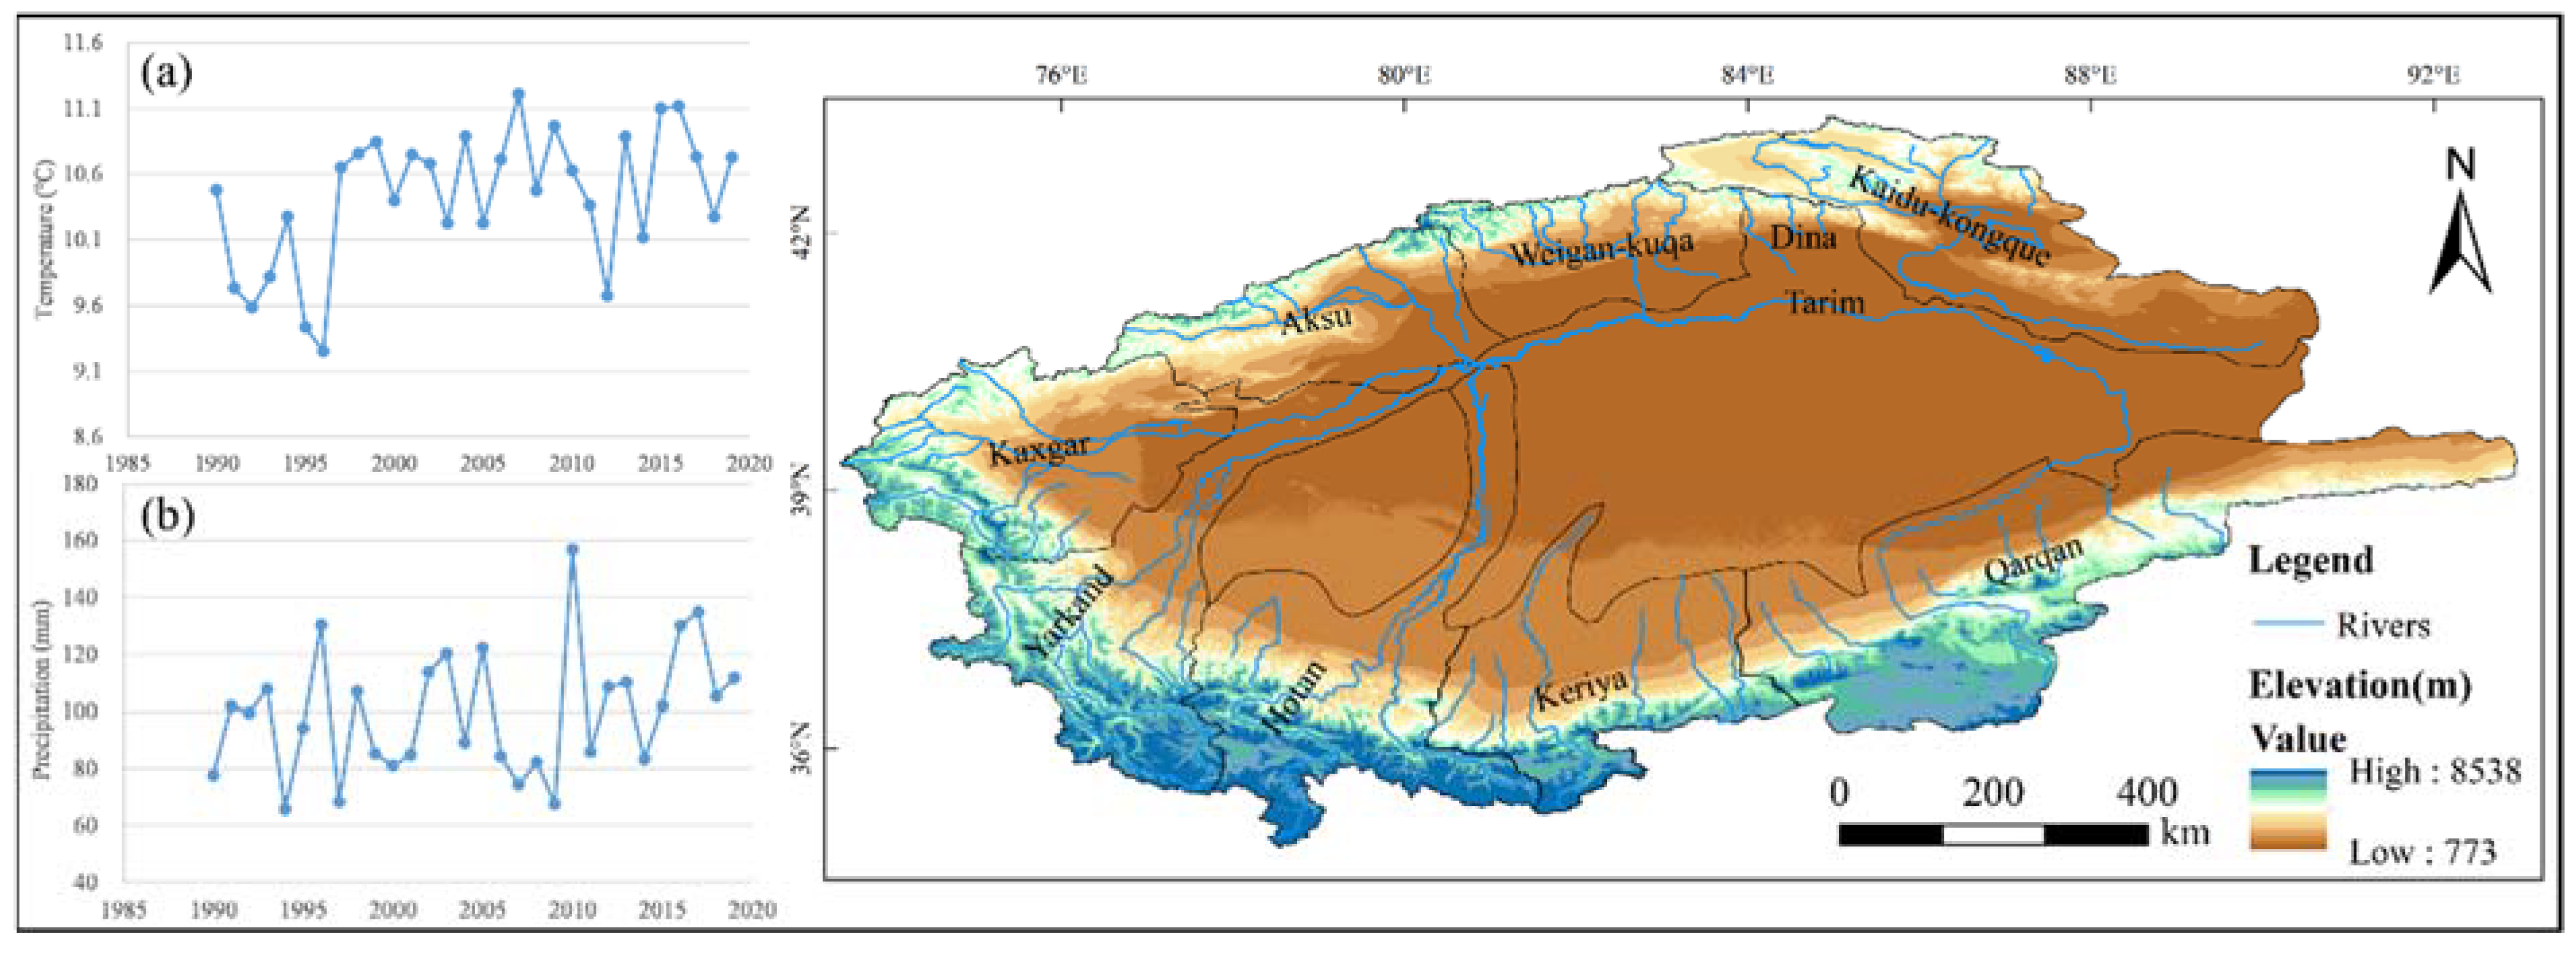
2.1. Study Area

The Tarim River Basin is the largest inland river basin in China. It is located at the southern foothills of the Tianshan Mountains at the geographical coordinates of 73°10′–94°05′E, 34°55′–43°08′N (Figure 1). The total area of the basin is 1.02 × 10⁶ km2, and the annual surface runoff is approximately 3.98 × 10¹⁰ m3 [31].
Because the basin is located inland, it has a continental arid climate characterized by generally dry weather and an average temperature of 10.7 °C. There is a large annual temperature difference and diurnal temperature difference, scarce precipitation (averaging 17.4–42.8 mm annually), and high evaporation intensity (1800–2900 mm) (Yaning et al., 2009). Furthermore, because the recharge is mostly based on mountain precipitation and snow melt water, the ecosystem is very fragile and thus sensitive to global climate change effects [32]. At the same time, however, the Tarim River Basin is also the core of the “Silk Road Economic Belt” and an important transportation hub and commercial and trade logistics center for the Belt. Its strategic significance makes the basin a critical component in oasis city development [33].

2.2. Data Sources

To analyze land structure and change trends in the Tarim River Basin, we selected remote sensing, land use, meteorological information and attribute data from 1992 to 2020, along with land use dynamic attitude/intensity and transfer matrices. We also used the same information sources to simulate and predict dynamic changes of land use in the basin for a future period.
The remote sensing data were obtained from the European Space Agency land use data from 1992 to 2020. Eight periods of remote sensing data with four-year intervals (1992, 1996, 2000, 2004, 2008, 2012, 2016 and 2020) were selected at a spatial resolution of 300 m × 300 m. Data products based on the PROBA-Vegetation (PROBA-V) (temporal and spatial resolutions are per year/300 m, with signal-to-noise ratios of 155 (blue), 430 (red), 529 (NIR), 380 (mid-infrared), mainly for global vegetation observations) and Sentinel-3 OLCI (S3 OLCI) (solar radiation reflected by the Earth is measured in 21 spectral bands at a ground spatial resolution of 300 m) satellites. The classification levels of this dataset were defined using the United Nations Food and Agriculture Organization’s (UN FAO) Land Cover Classification System (LCCS). This data source was chosen for its long-term consistency, annual updates, and high accuracy on a global scale. To ensure continuity, the land cover maps are consistent with a series of annual global LC maps produced by the European Space Agency (ESA) Climate Change Initiative (CCI) from 1990 to 2015. The dataset is attractive for many applications besides scientific research, such as land accounting, forest monitoring, and desertification. The land use datasets presented in this paper are available for free at https://www.copernicus.eu/en (accessed on 26 May 2022).
In addition, meteorological data, including information on average annual temperature and annual precipitation, were obtained from the China Meteorological Science Data Sharing Service (http://cdc.cma.gov.cn (accessed on 26 May 2022)). Attribute data were obtained from Xinjiang Splendid 50 Years and Xinjiang Statistical Yearbook (1990–2020).

2.3. Data Validation

In this study, the confusion matrix and Kappa coefficient methods were employed to evaluate the accuracy and precision of remote sensing interpretation [34]. We first extracted 300 random units in the study area (including cropland, grassland, woodland, built-up land, water bodies and barren land), and then compared multiple field survey data with high-resolution images from Google Earth for validation. Finally, we verified the accuracy of the classification results and model simulation results by calculating the Kappa coefficients [35]. The calculation formula is
k a p p a = P o P c P p P c
P o = n 1 n , P c = 1 N
where P o is the proportion of correctly simulated rasters, P c is the desired proportion of correctly simulated rasters, P p is the proportion of correctly simulated rasters under ideal classification, n is the total number of rasters, n 1 is the number of correctly simulated rasters, and N is the number of land use types (N = 6 in this study).
The results show that the classification accuracy of the cropland in the study area is 86.25%; the accuracies of woodland and grassland are 82.65% and 83.26%, respectively; the accuracies of built-up land and water bodies are 85.45% and 87.57%, respectively; and the accuracy of barren land is 84.71%, with a Kappa coefficient of 0.89.

2.4. Land Use Dynamics/Intensity

Land use dynamics not only quantitatively describes the rate of change of a certain land use type within a certain time frame in the study area, but it also plays an active role in predicting future land change trends [36]. The land use intensity index is the amount of change in a unit area of each land use type at the beginning and end of the study period in a spatial unit. It represents a quantification of the rate of change in area of land use types in that spatial area [12]. By analyzing the changes and trends of both during the study period, the trends of land use types in land use/cover in the study area are more intuitively reflected.
K = U b U a U a × 1 T × 100 %
L T I = U b U a L A × 1 T × 100 %
where K is the degree of dynamic change of a land type during the study period, LTI is the land use intensity index, Ua and Ub denote the area of that land use type at the beginning and end of the study period, respectively, LA is the total area, and T is the length of the study time.

2.5. Land Use Transfer Matrix

The land use transfer matrix reflects the dynamic processes of area transformation among land use types in the study area at both the beginning and end of a study period. The evolution of land use is further investigated by exploring the change of area between different land use types in the Tarim River Basin and their mutual transformation process [37].
S i j = S 11 S 1 n S n 1 S n n
where S denotes area; i, j (i, j = 1, 2, ..., n) indicate land use types before and after transfer; S i j describes the area of LUCC from type i to j; and n represents the number of land use types before and after transfer.

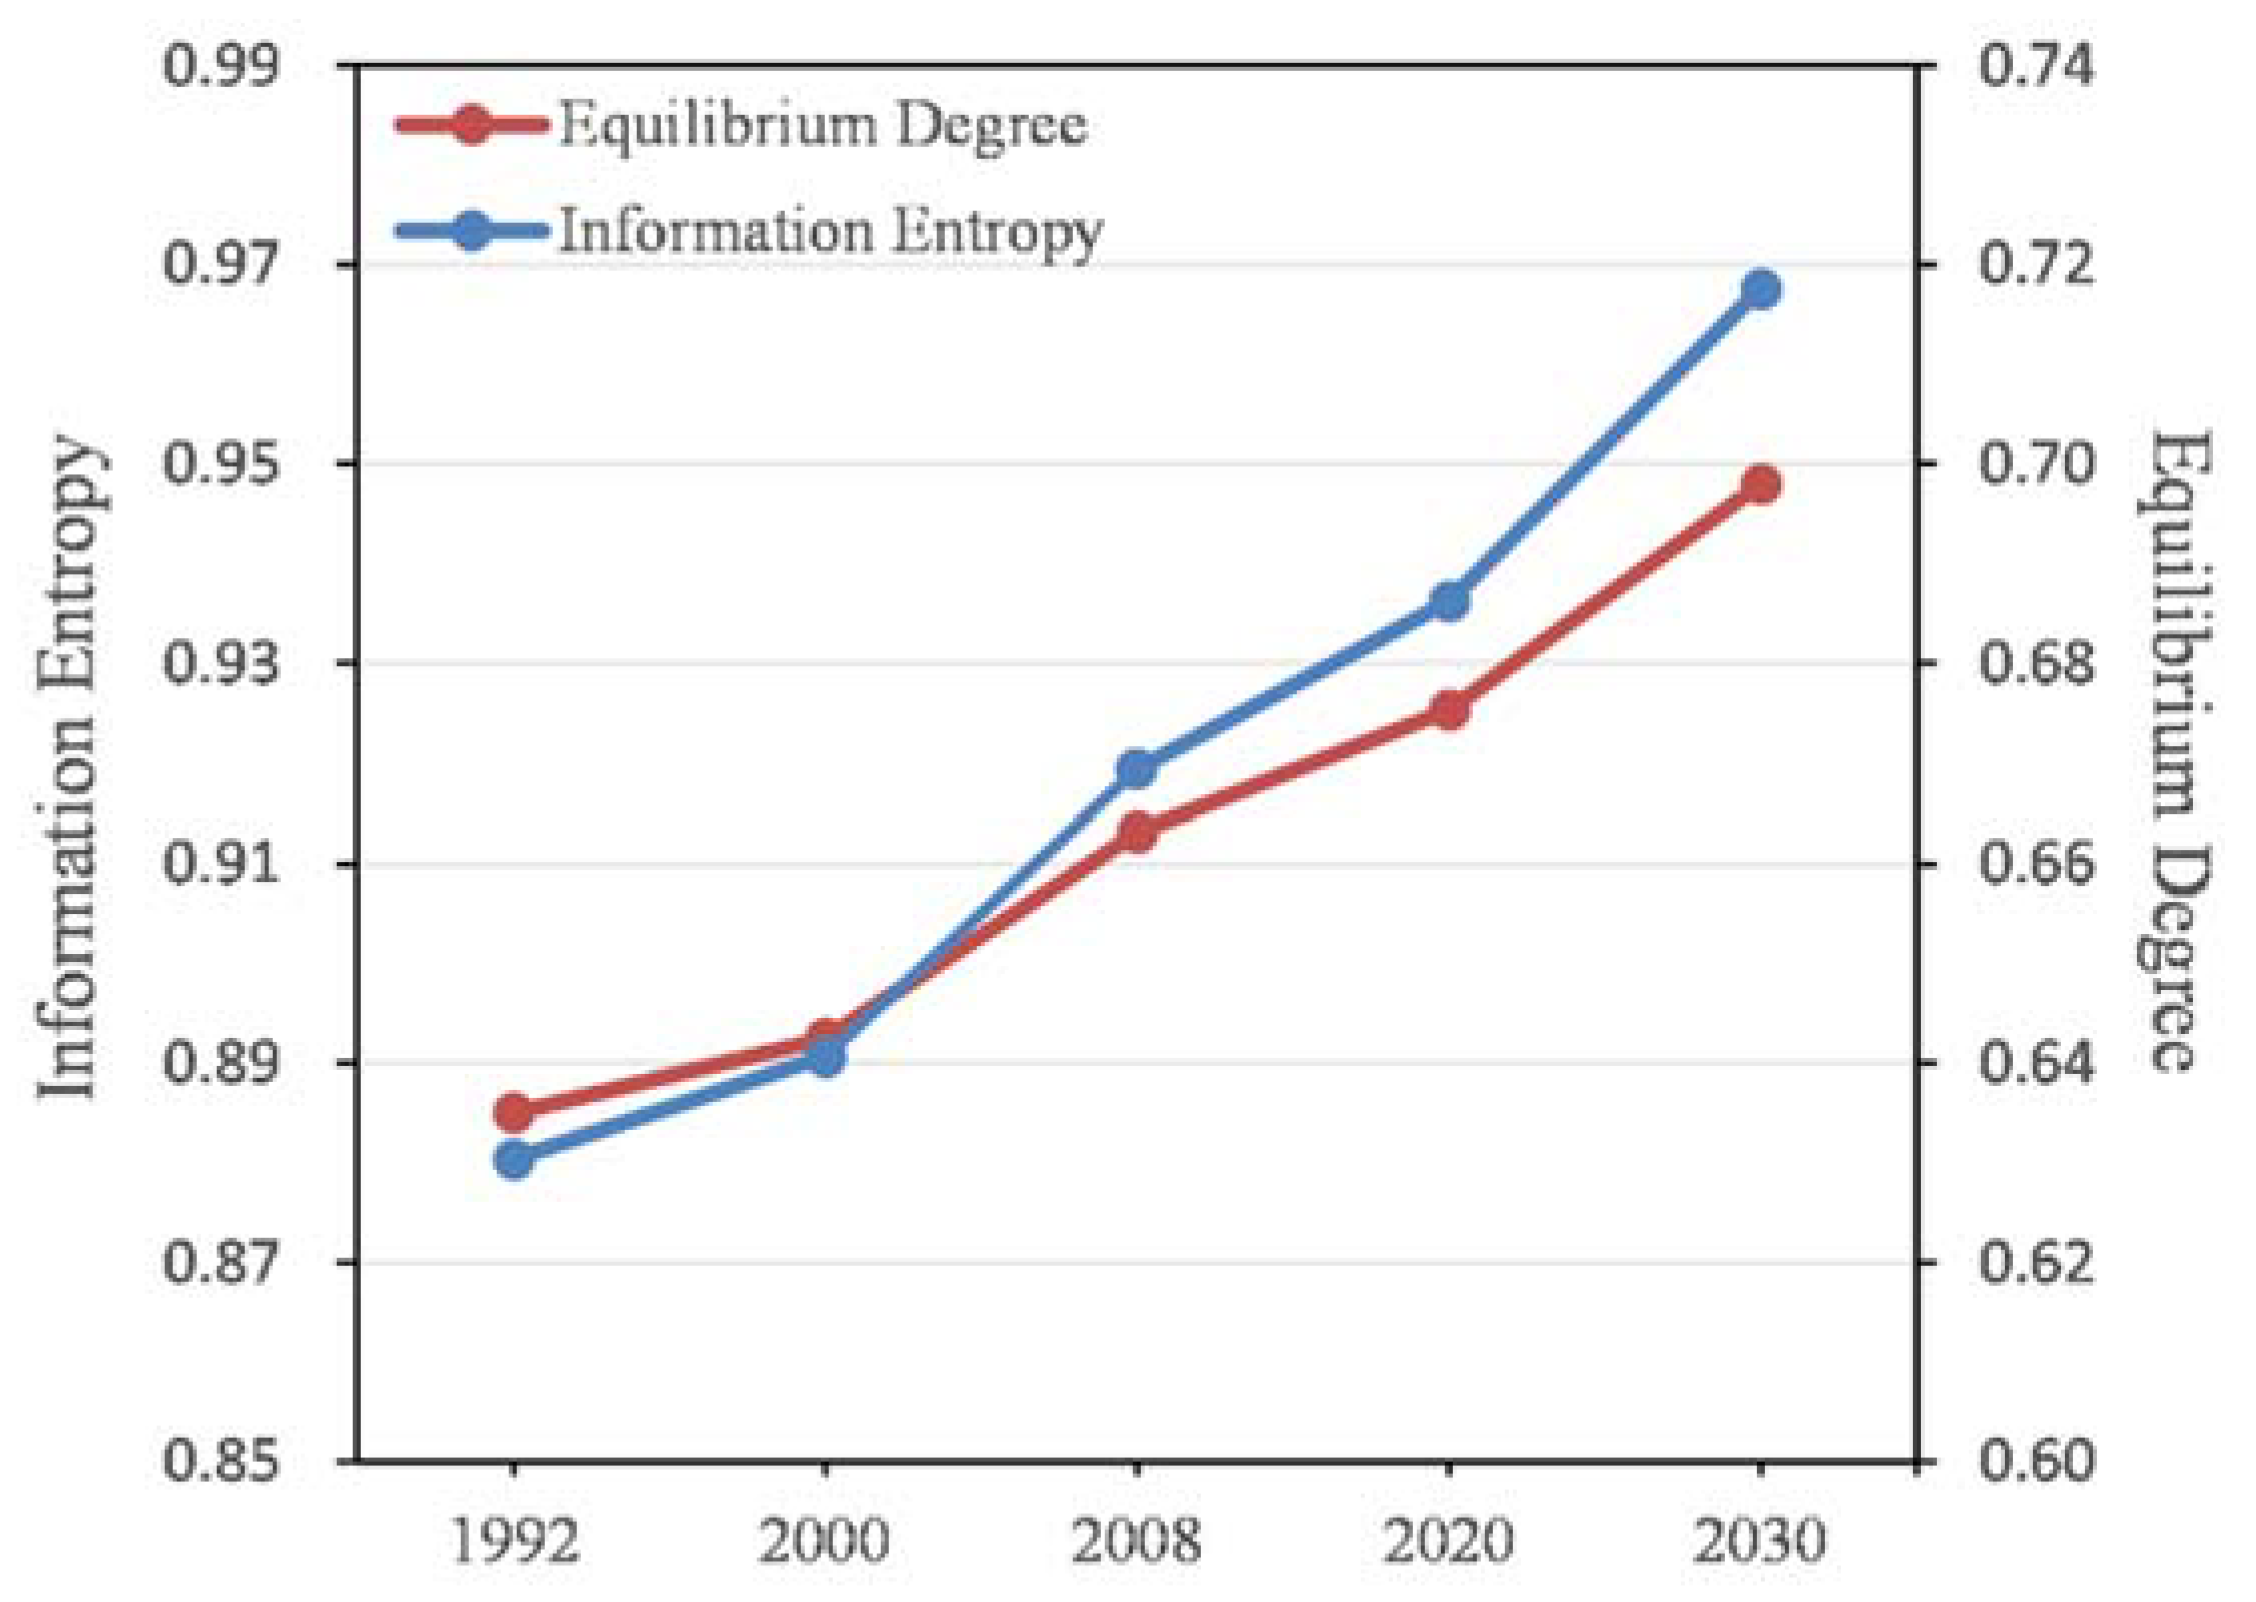
2.6. Information Entropy and Equilibrium Degree of Land Use Structure

Information entropy and equilibrium are one of the important models to study land use change, which can measure the degree of order of land use system and the equilibrium of land use structure. The level of information entropy (H) can reflect the degree of land structure equilibrium such that the higher the value of information entropy, the lower the degree of land use order. To make the land structures of different development stages more comparable, the equilibrium degree of land use structure (E) is introduced as a quantity reflecting the equilibrium of land use structure. E ∈ [0, 1], and the larger the value of equilibrium degree, the stronger the equilibrium [38,39].
H = i = 1 m P i l n ( P i )
E = i = 1 m P i l n ( P i ] / ln ( m )
In the above two equations, m and Pi denote the number of land use types and the proportion of area of category i land use type, respectively.

2.7. CA-Markov Model

In this study, the CA-Markov model is used to simulate future land use in the Tarim River Basin. The Markov model is a method for predicting the probability of time occurrence based on the Markov chain process theory. It is commonly used for predicting geographical events with no posteriority characteristics [40,41]. The land use evolution describes the nature of the Markov process, the land use type corresponds to the “possible states” of the Markov process, and the area or proportion of mutual transformation between land use types is the state transfer probability [42]. We can express this relationship as
S t + 1 = P i j × S t
P i j = P 11 P 1 n P n 1 P n n
[ 0 P i j < 1 ,   and   j = 1 n P i j = 1 i . j = 1 , 2 n ]
where S(t+1) is the system state in period t + 1, and Pij is the state transfer probability matrix.

2.8. PLUS Model

The PLUS model is a raster data-based, patch-generated LUCC simulation model proposed by the High Performance Spatial Computing Intelligence Laboratory of the China University of Geosciences [43]. The coupled land expansion analysis strategy and CA model is based on multi-type random patch seeding. The main advantage of the model is that it can analyze the contribution of different drivers to land use types and then realize the simulation of land use dynamics under different future scenarios [44].

2.9. Gray Prediction Model

The gray model (GM) uses differential equations to determine the characteristics of a system. This model is especially suitable for studying the analysis of systems with short time series, little statistical data, and incomplete information. It is also one of the most popular methods for forecasting in social and economic fields [45]. The goal of the GM is to extract information from LUCC historical data and provide predictions [46].
In this study, the CA-Markov model, the PLUS model, and the gray prediction model were selected for the quantitative simulation of future LUCC in the basin’s water bodies. As a first step, we selected the land use data from 2000 to 2010 in order to calibrate the parameters of the three models and simulate LUCC in 2015. Then, we verified the actual land use data in 2015 and compared those results with the simulation results of the three models (Figure 2).

3. Results

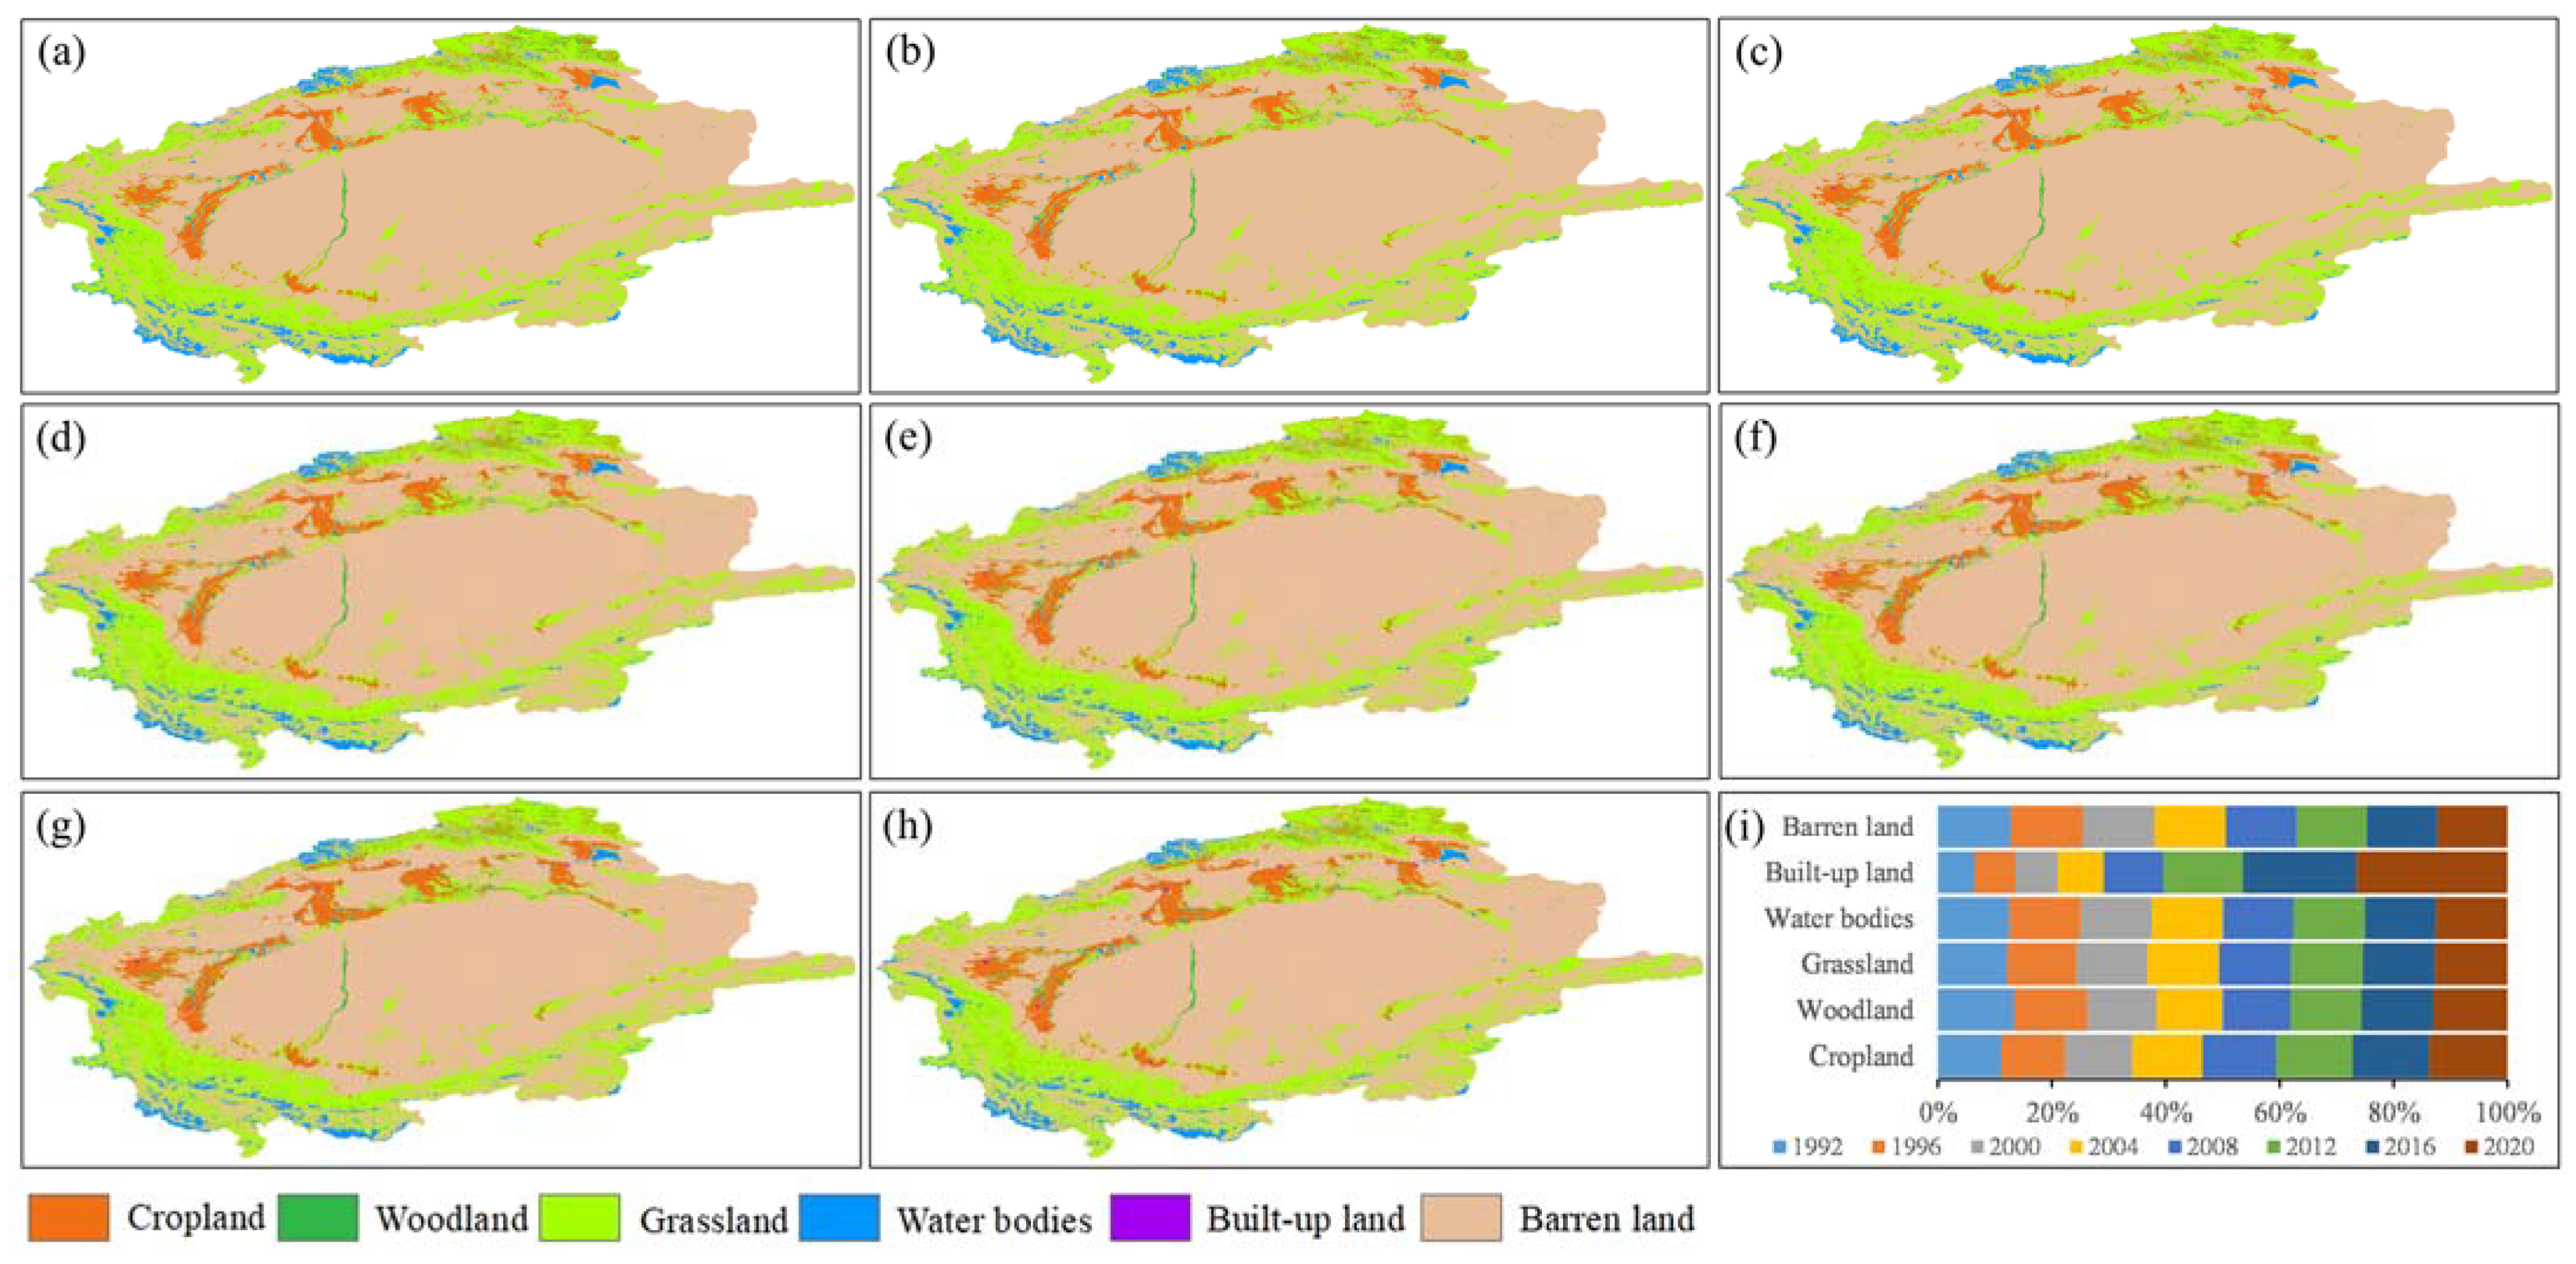
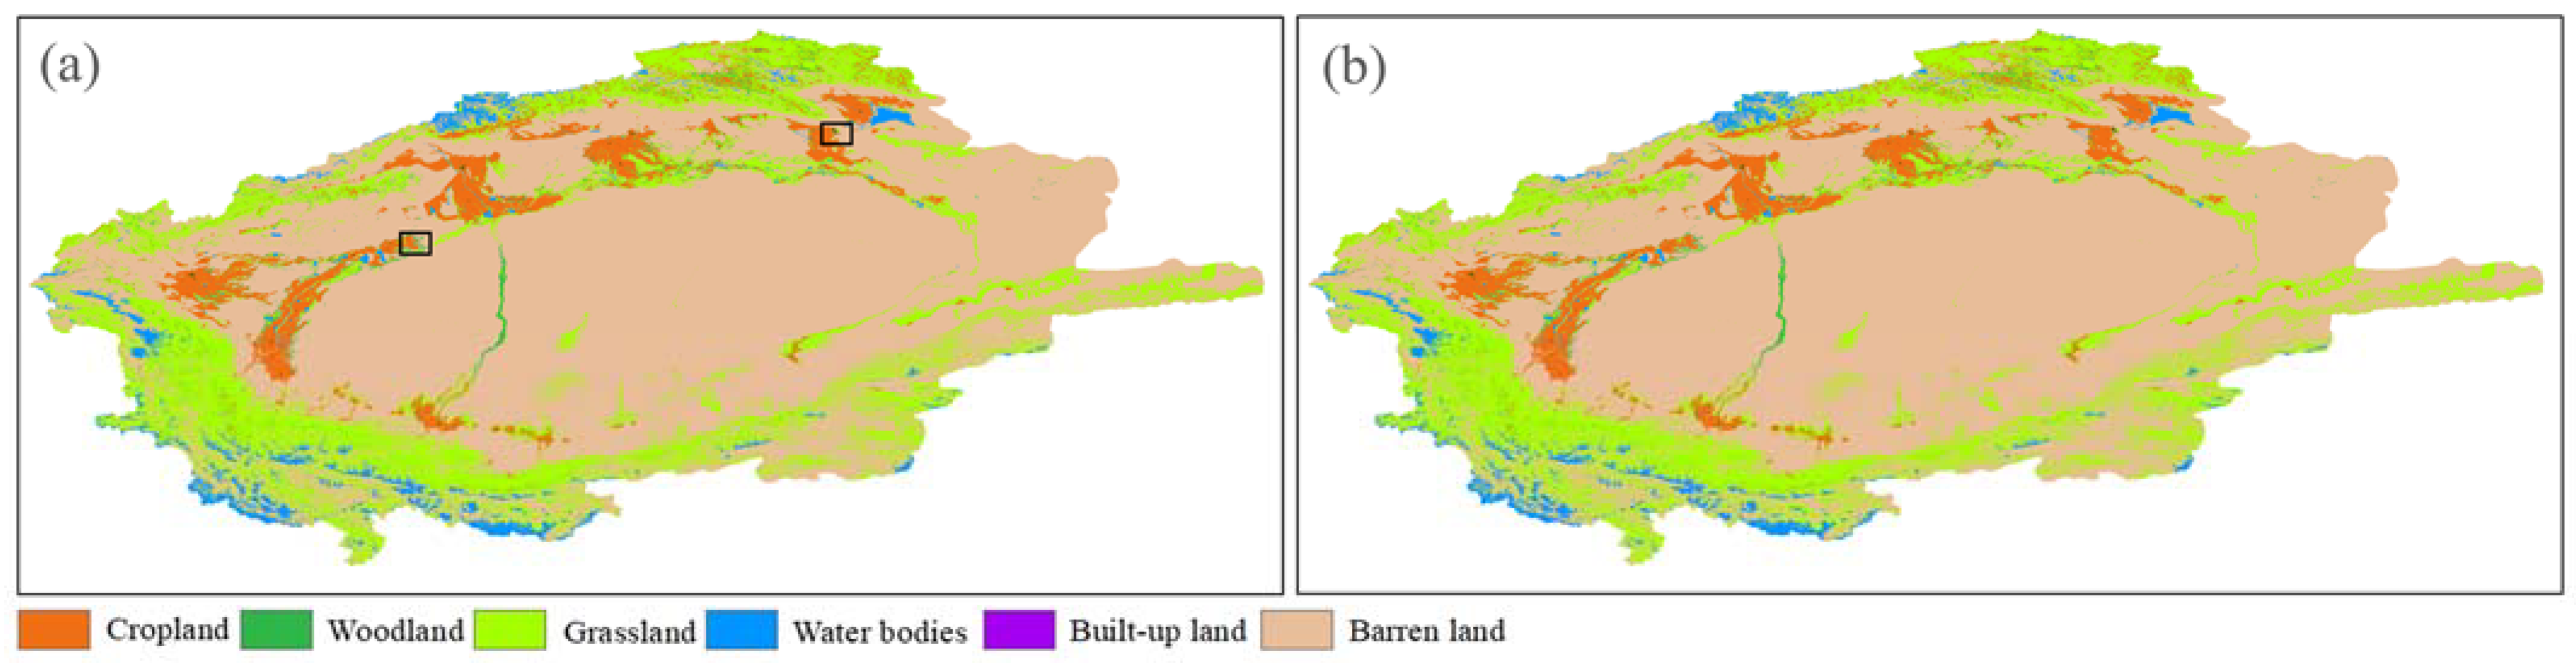
3.1. Evolution of Dynamic Land Use Patterns

3.1.1. Land Use/Cover

From 1992 to 2020, significant LUCC occurred in the Tarim River Basin (Figure 3). The main manifestation is the continuous increase in cultivated land and the continuous decrease in barren land. The growth rate of cropland during the period was as high as 24.21%, and the new area was mainly located in the middle and upper reaches of the basin. Most of the LUCC is concentrated in the middle and lower reaches of the Kaidu-Kongque, Aksu, Weigan-Kuqu and Kashgar rivers, and a small part is concentrated in the lower reaches of the Yarkand, Hotan and Kriya rivers. The area of barren land decreased by 22,342.83 km2, with a significant decrease in the middle reaches of the Tarim River Basin.
During the study period, grassland increased by 10,235.29 km2, mainly in the upper reaches of the basin. The area of woodland (decrease) and water bodies (increase) changed less, and the area of built-up land increased more. The ranking of LUCC in the study area has remained constant since 1992, showing barren land > grassland > cropland > water bodies > woodland > built-up land.

3.1.2. Changes in Land Use Dynamics/Intensity

Both the land use dynamics and land use intensity indices can reflect the quantitative changes of a certain land use type within a certain time frame in the region, and we selected these two indicators together to analyze the changes and trends of different land use types in the watershed in different periods, which can reflect the trends of land use types in the study area in each period more intuitively and comprehensively.
The dynamic land use attitude and land use intensity index (Table 1) of each land use type in the Tarim River Basin changed significantly at different times during the study period. The land use dynamics of cultivated land in the study area was 0.89% between 1992 and 2000, indicating an expanding trend. The land use dynamics of grassland and barren land were 0.27% and −0.12%, with a smaller change in both types of land compared to cropland and a decreasing trend in barren land. In addition, the land use intensity indices for cropland, grassland and barren land are higher, pointing to a faster rate of area change for the three land types.
The magnitude of change in water bodies during the study period is relatively insignificant, whereas the degree of change in woodland and built-up land is quite drastic, with dynamic attitudes of −1.11% and 2.11%, respectively. During 2000–2008, the attitude of cropland movement was 1.25%, indicating an increasing trend of area expansion. The area of barren land underwent a major reduction of 8896.83 km2, while the area of grassland shows a slight and slow rise. The land use intensity indices for cropland, grassland and barren land remain at a high level, and there is a significant increase in cropland and barren land. The area of woodland and water bodies decreased slightly during this period, slowing the trend from the previous period, while the dynamic attitude of built-up land was 4.96%, indicating that it is still in an increasing trend.
From 2008 to 2020, the area of woodland and water bodies increased slightly, in addition to the continuous increase in the area of cropland, grassland and built-up land. However, the trend of barren land was still decreasing, though at a slower pace. The land use intensity indices for cropland and barren land were more prominent during the period, at 0.30% and −0.62%, respectively. Moreover, the dynamic degree of water bodies in the Tarim River Basin was 0.04%, and the area of water bodies increased due to the accelerated melting of snow in the mountains. Between 1992 and 2020, the main characteristics of LUCC in the basin were the continuous expansion of cultivated land, the sharp reduction in barren land, and the steady increase in grassland and built-up land.

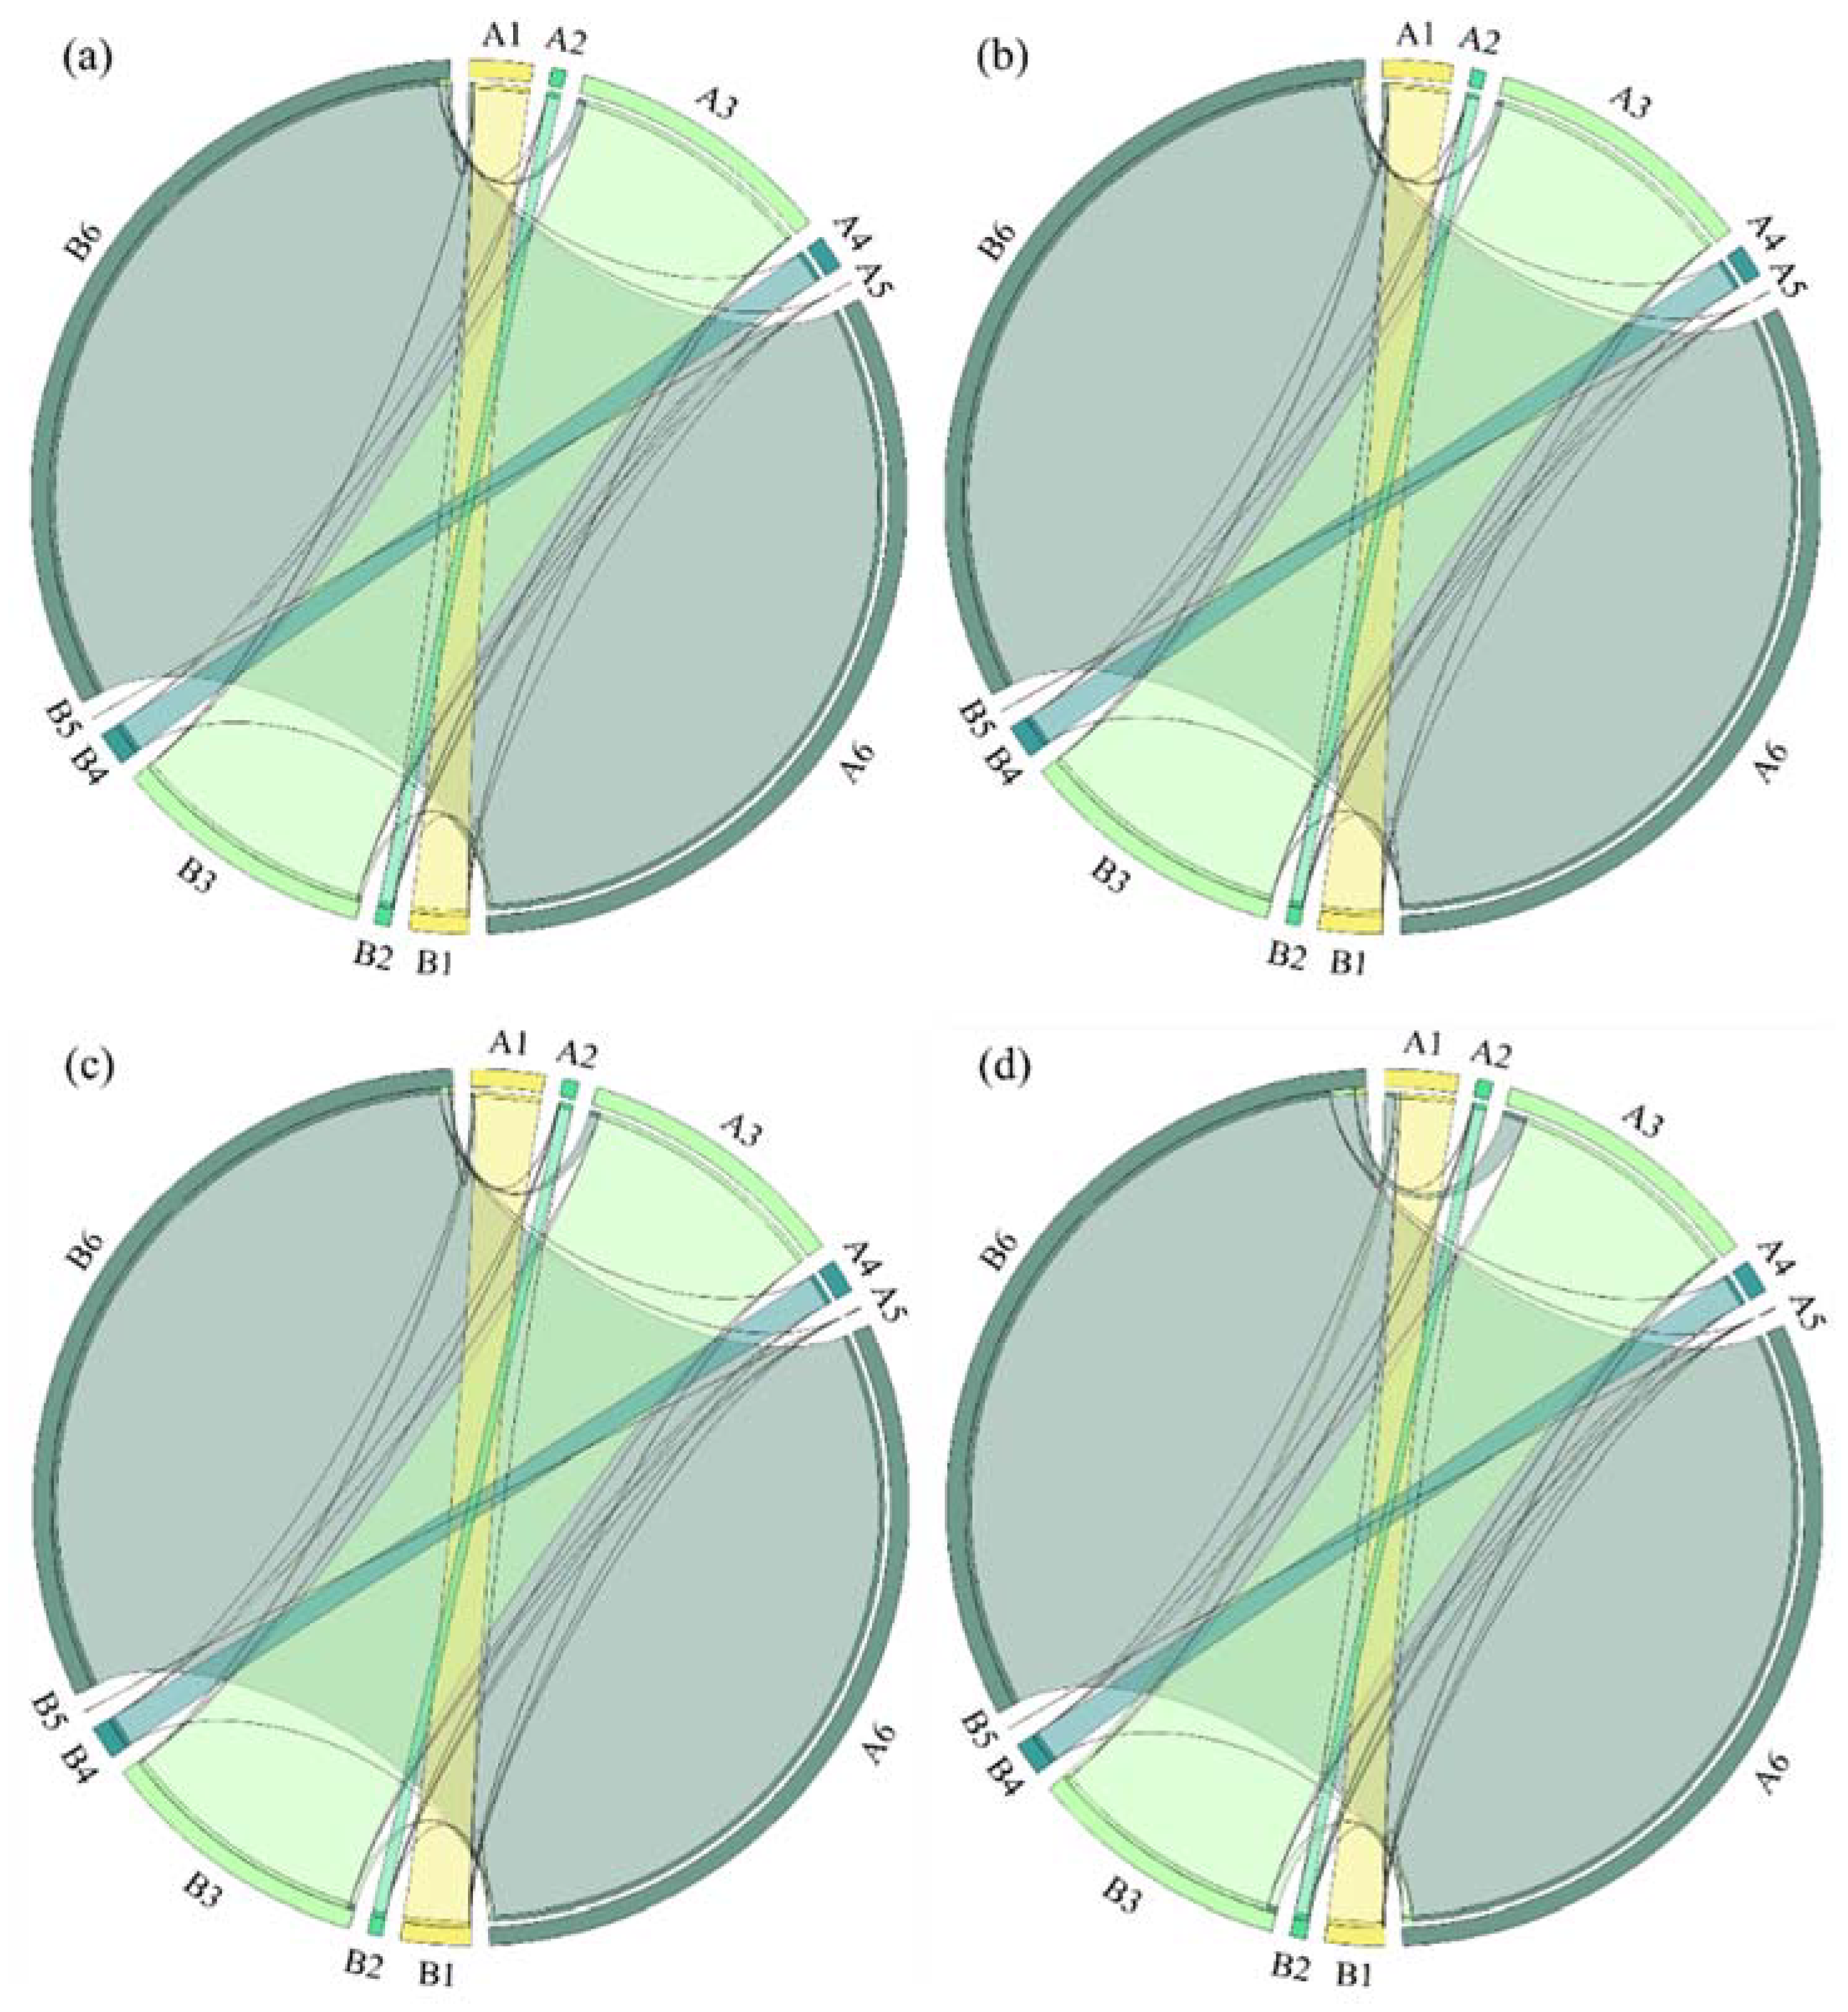
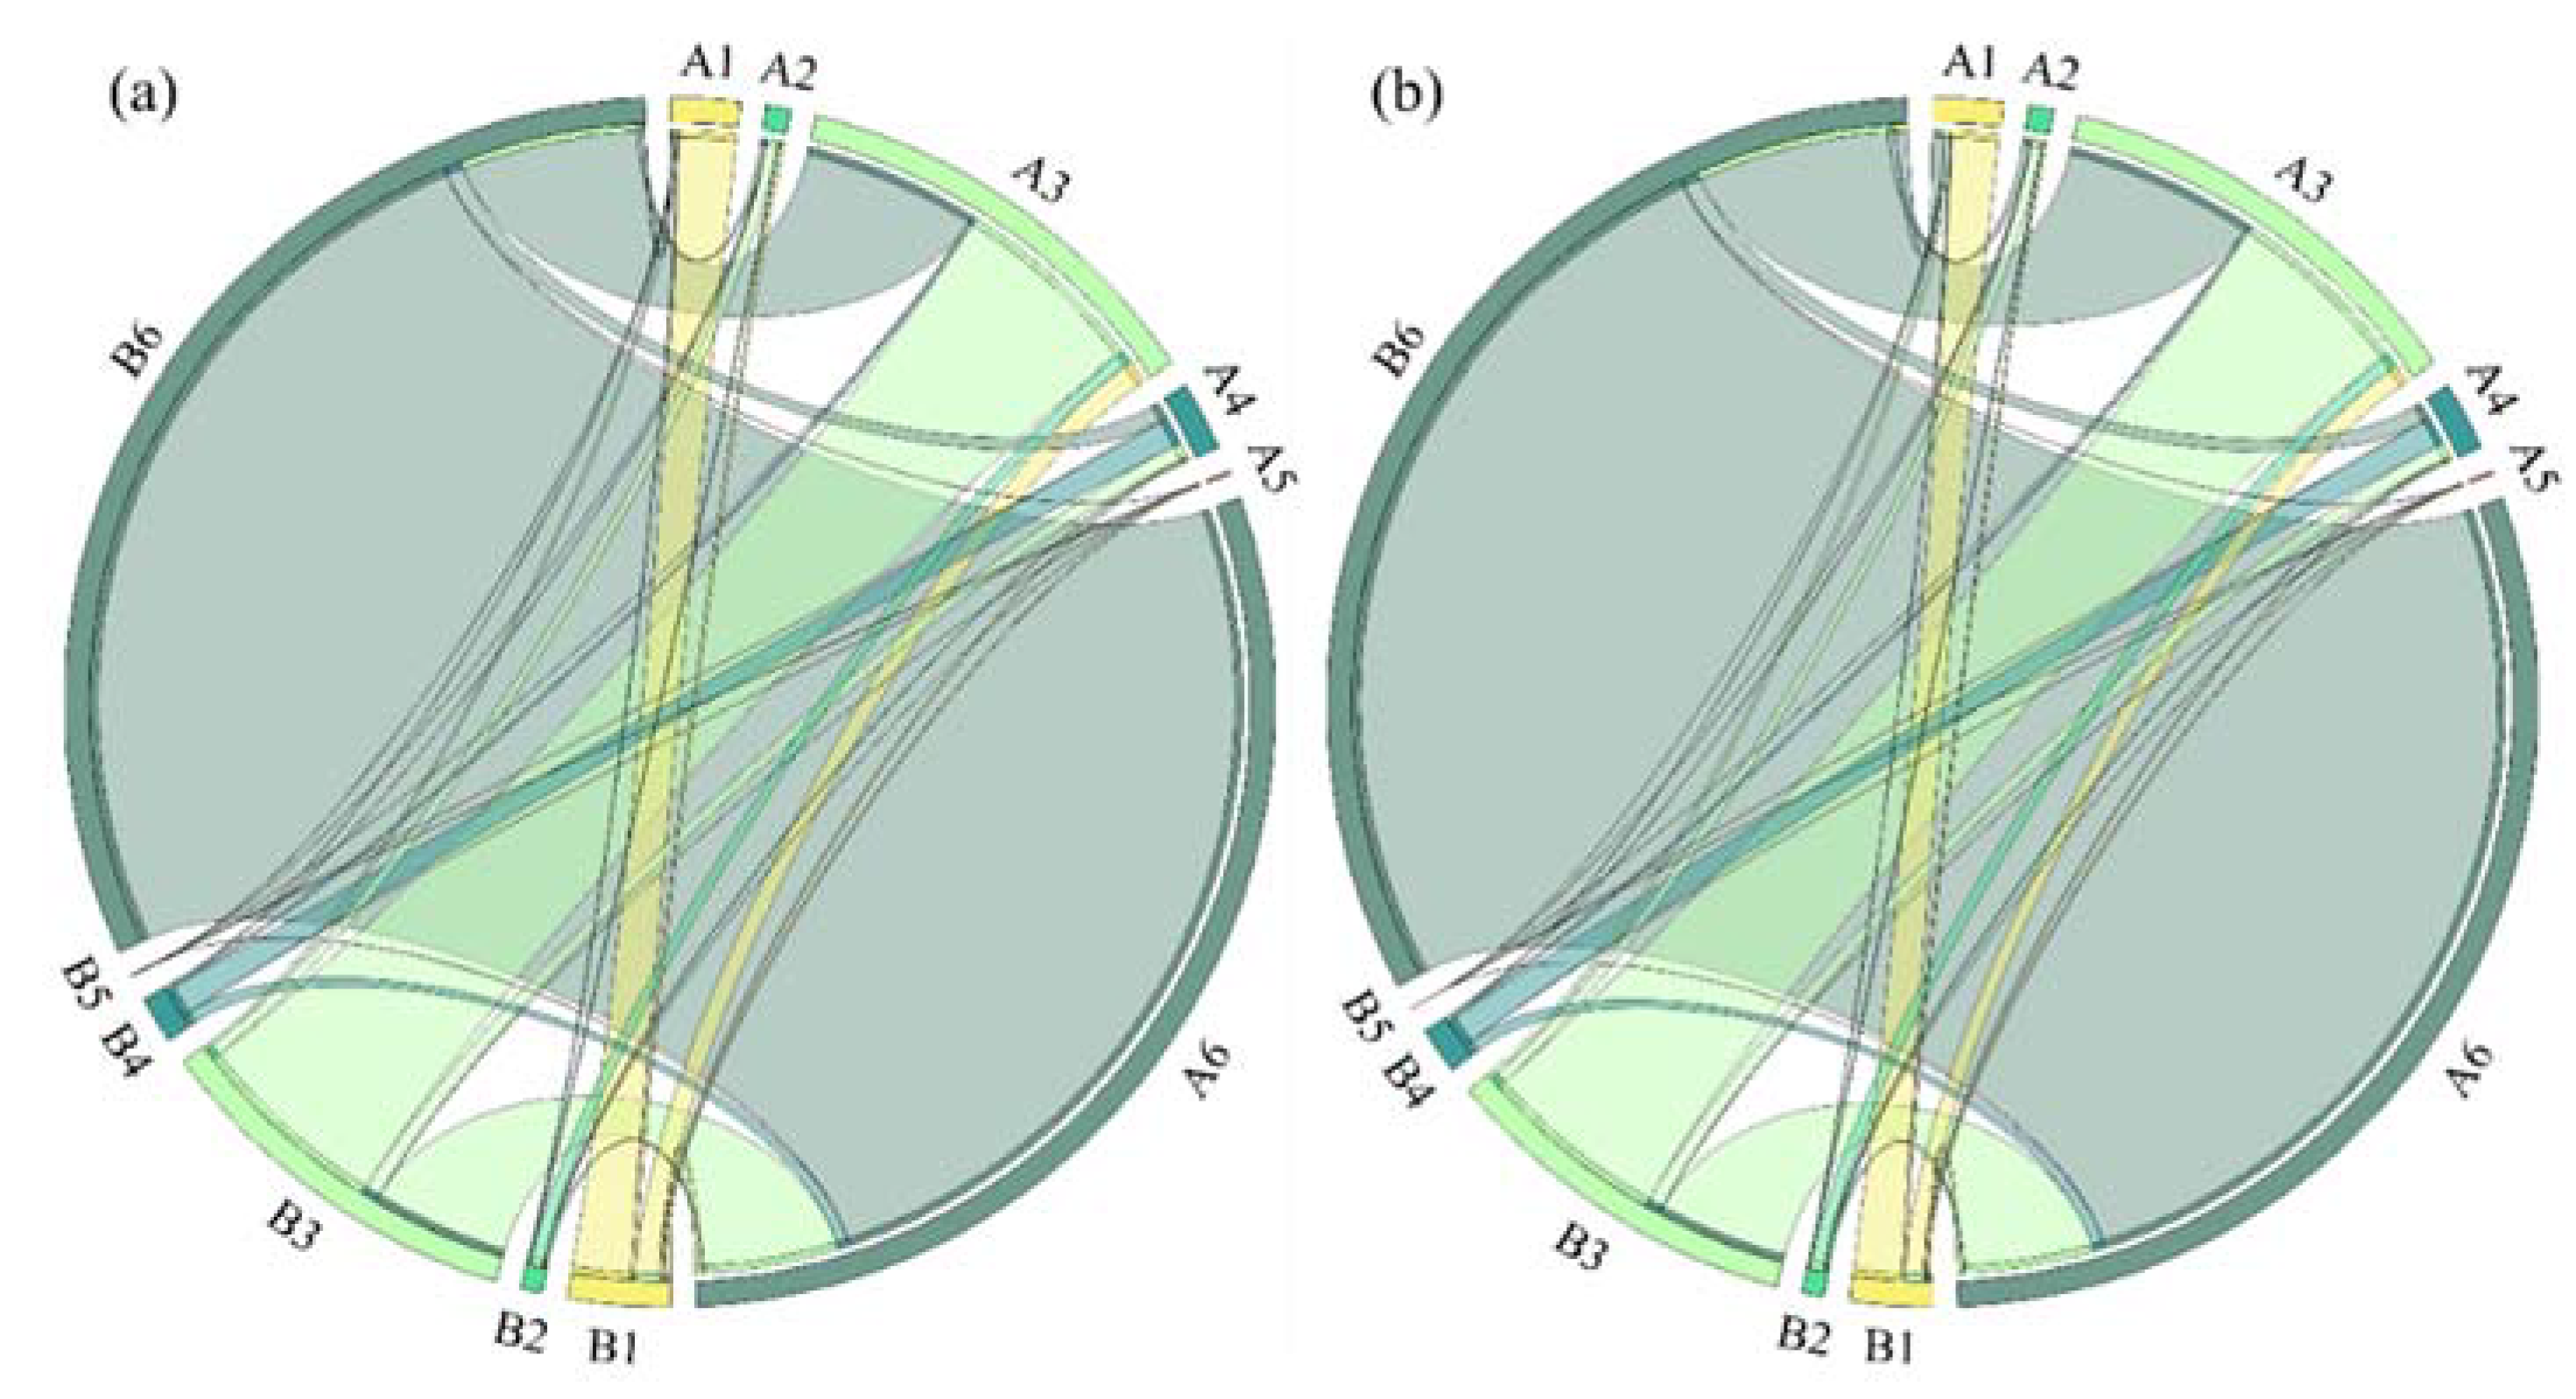
3.2. Analysis of Land Use Structure Change

As can be seen from the land type transfer matrix of the Tarim River Basin for the period 1992–2020 (Figure 4), there are frequent area transformations between land types during the period. The whole period can be divided into three phases: 1992–2000, 2000–2008 and 2008–2020. An analysis of the mutual transformation between land types is given below.
(1)
The conversion between cropland, woodland, grassland and barren land was prominent from 1992 to 2000. The increase in cropland was mainly due to the conversion of grassland and barren land, with the conversion of unused land to cropland accounting for 90.28% of the increase in cropland during the period, and the conversion of grassland to cropland accounting for 9.45%. The conversion of woodland and barren land to grassland is the main reason for the increase in grassland area, accounting for 22.20% and 85.38%. During 1992–2000, 8.59% of woodland was converted to barren land, while the conversion of barren land to water bodies accounted for 86.12% of the increased area of water bodies.
(2)
The expansion of cropland occurred mainly between 2000 and 2008. A large part of this conversion was from barren land, accounting for 85.44%. The rest was converted from grassland, accounting for 14.46% of the arable area. The conversion between grassland and other land types is significant, with 11.65% of the increase in grassland area being transferred from forest to grassland, and 48.30% of barren land being converted to grassland. The proportion of barren land converted to woodland was 2.78%, and the proportion of cropland and grassland converted to built-up land was 47% and 42.42%, respectively, from 2000 to 2008.
(3)
The conversion between land types was relatively stable from 2008 to 2020, with the overall conversion of grassland and barren land continuing to increase, accounting for 51.90% and 59.70% of the rise in cropland. Cropland was also converted to built-up land, accounting for 69.10% of the total. In addition to the conversion of barren land into cropland, there was also a conversion of barren land to woodland and grassland, accounting for 8.41% and 59.54% of the conversion, with 47.40% being grassland to woodland.
The increase in cultivated and grassland and the decrease in the area of barren land in the basin during 1992–2020 are both very significant changes and show the clear transformation into other land types. The main transformations were of grassland into cropland, woodland and built-up land, and the continuous development and utilization of barren land into cropland, grassland and woodland. Since 1992, with the rapid increase in population, cropland has expanded significantly, resulting in the encroachment of cropland on grassland and barren land across the entire region. The conversion of barren land to grassland and cropland occurred at the same time, especially in the oasis areas in the middle and upper reaches of the Tarim River Basin.

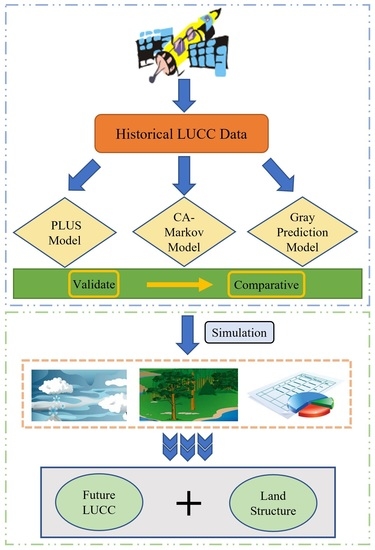
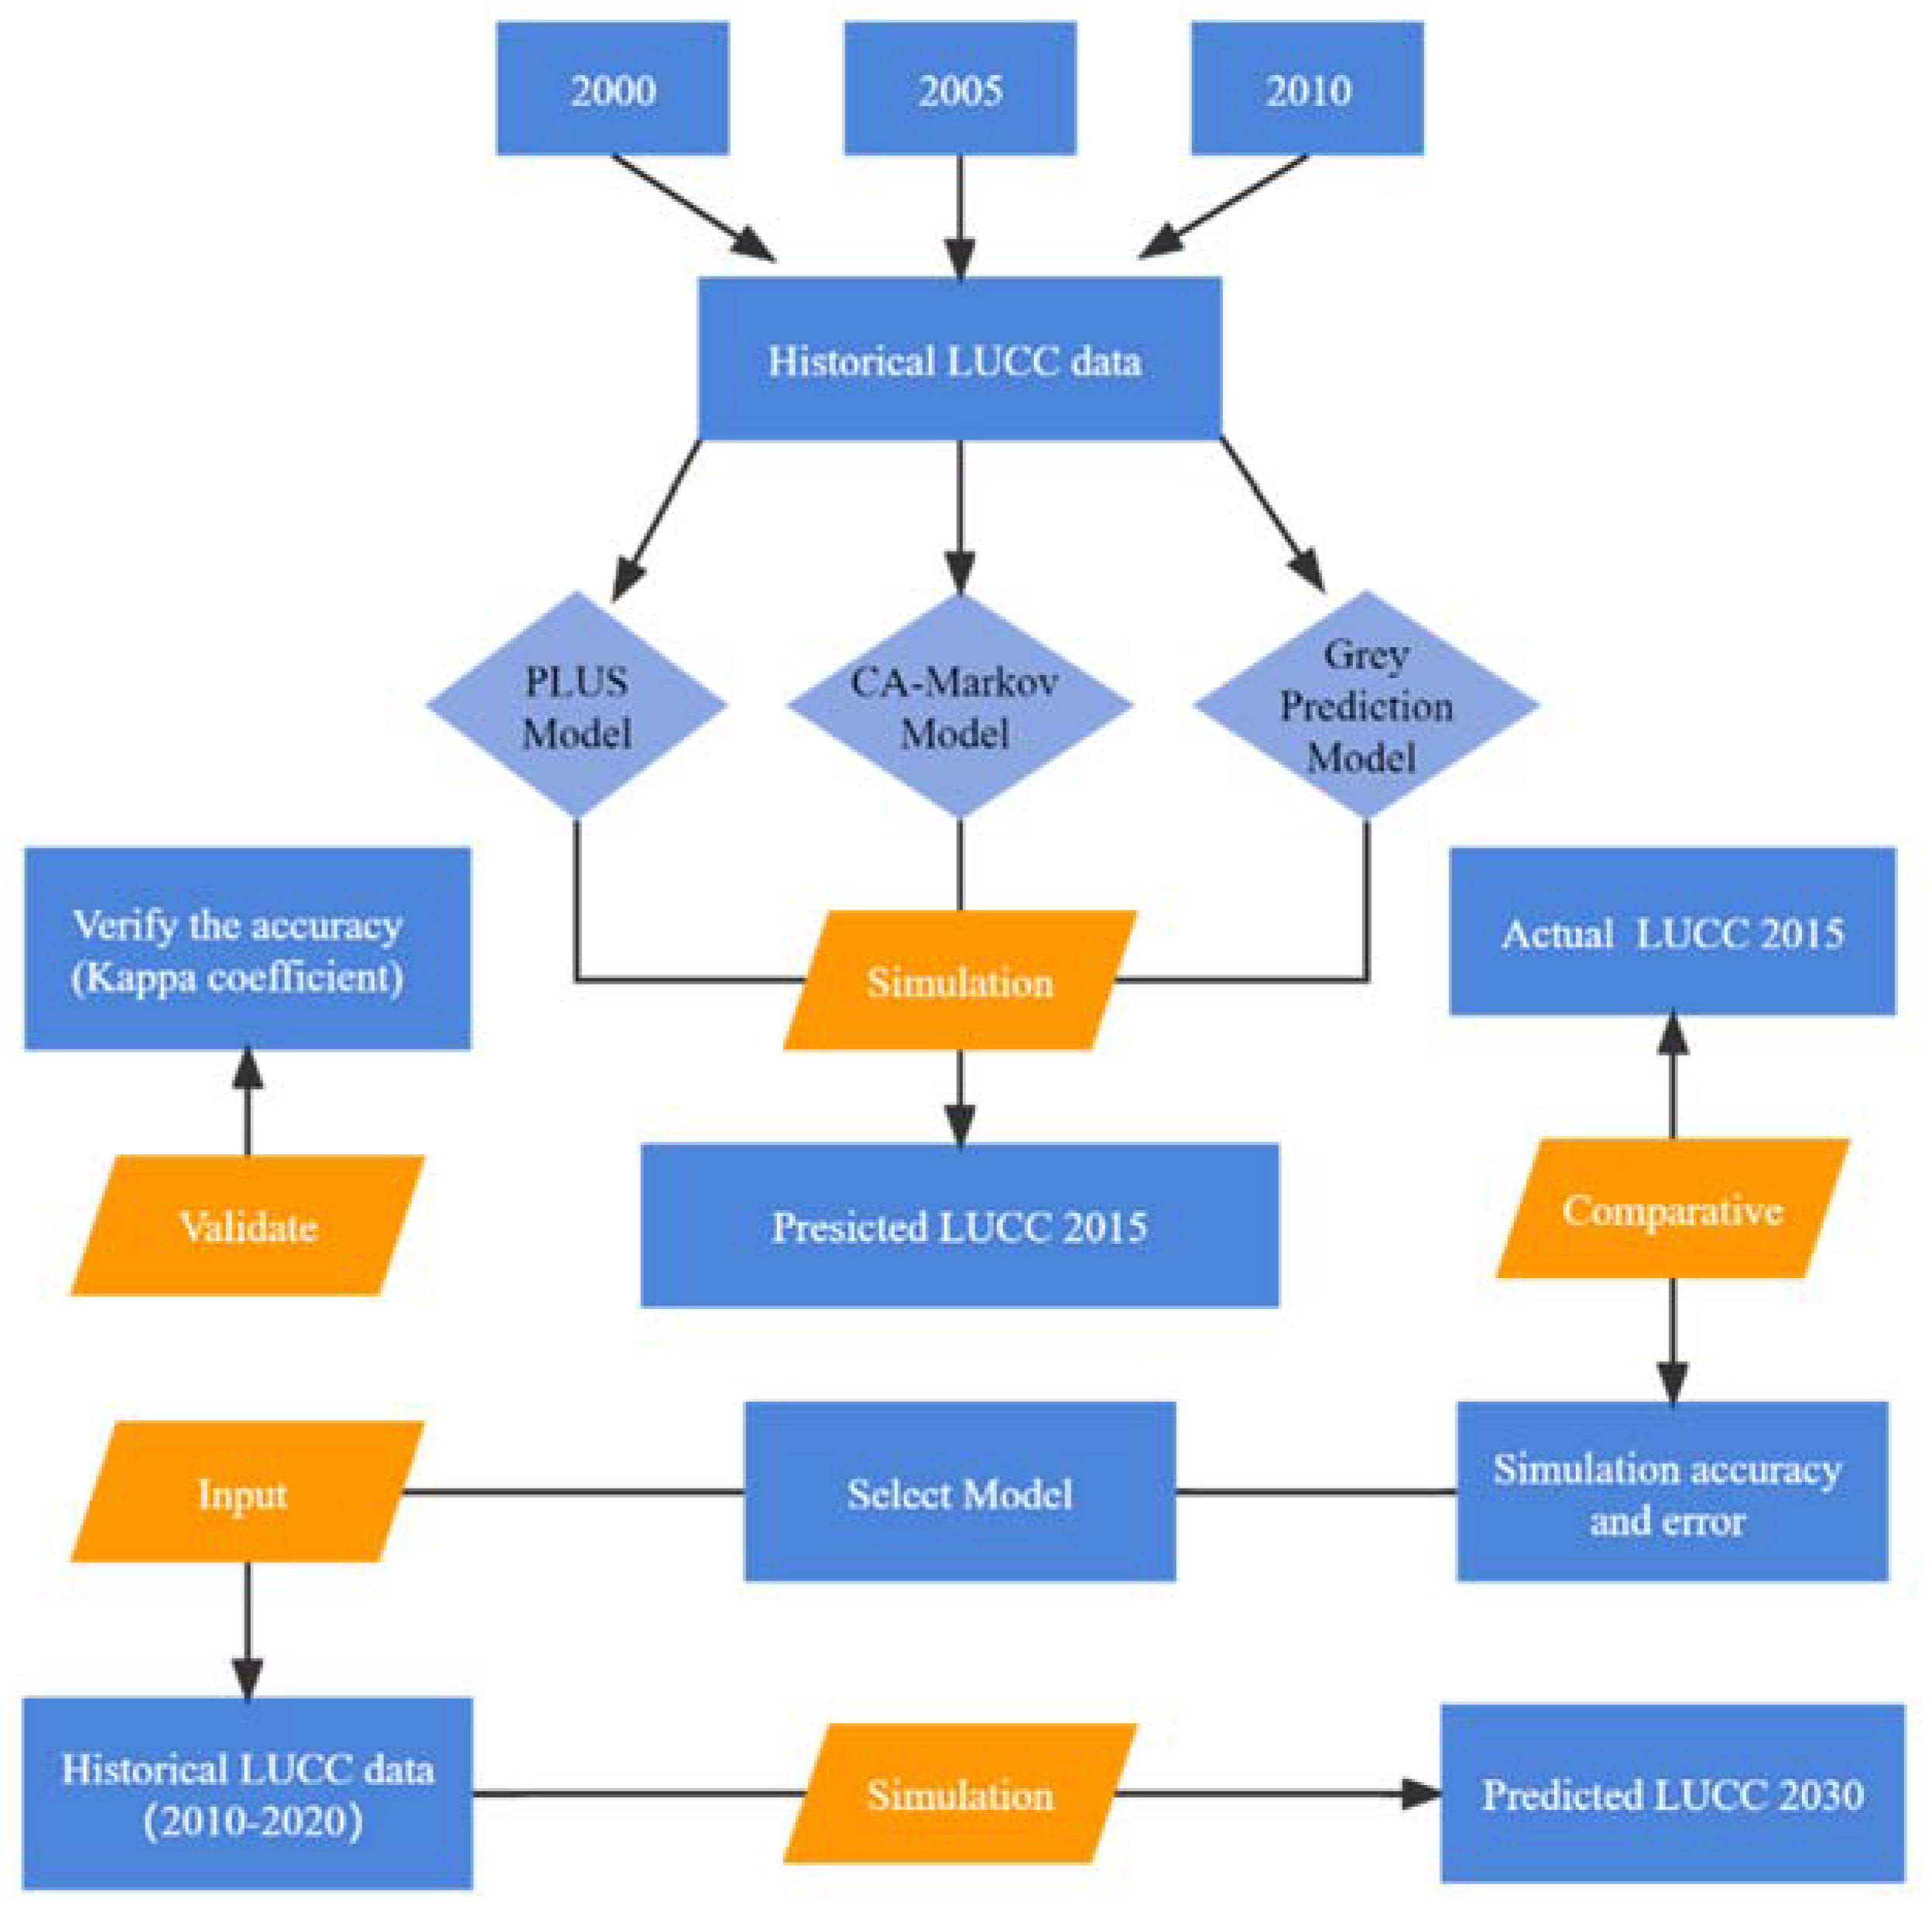
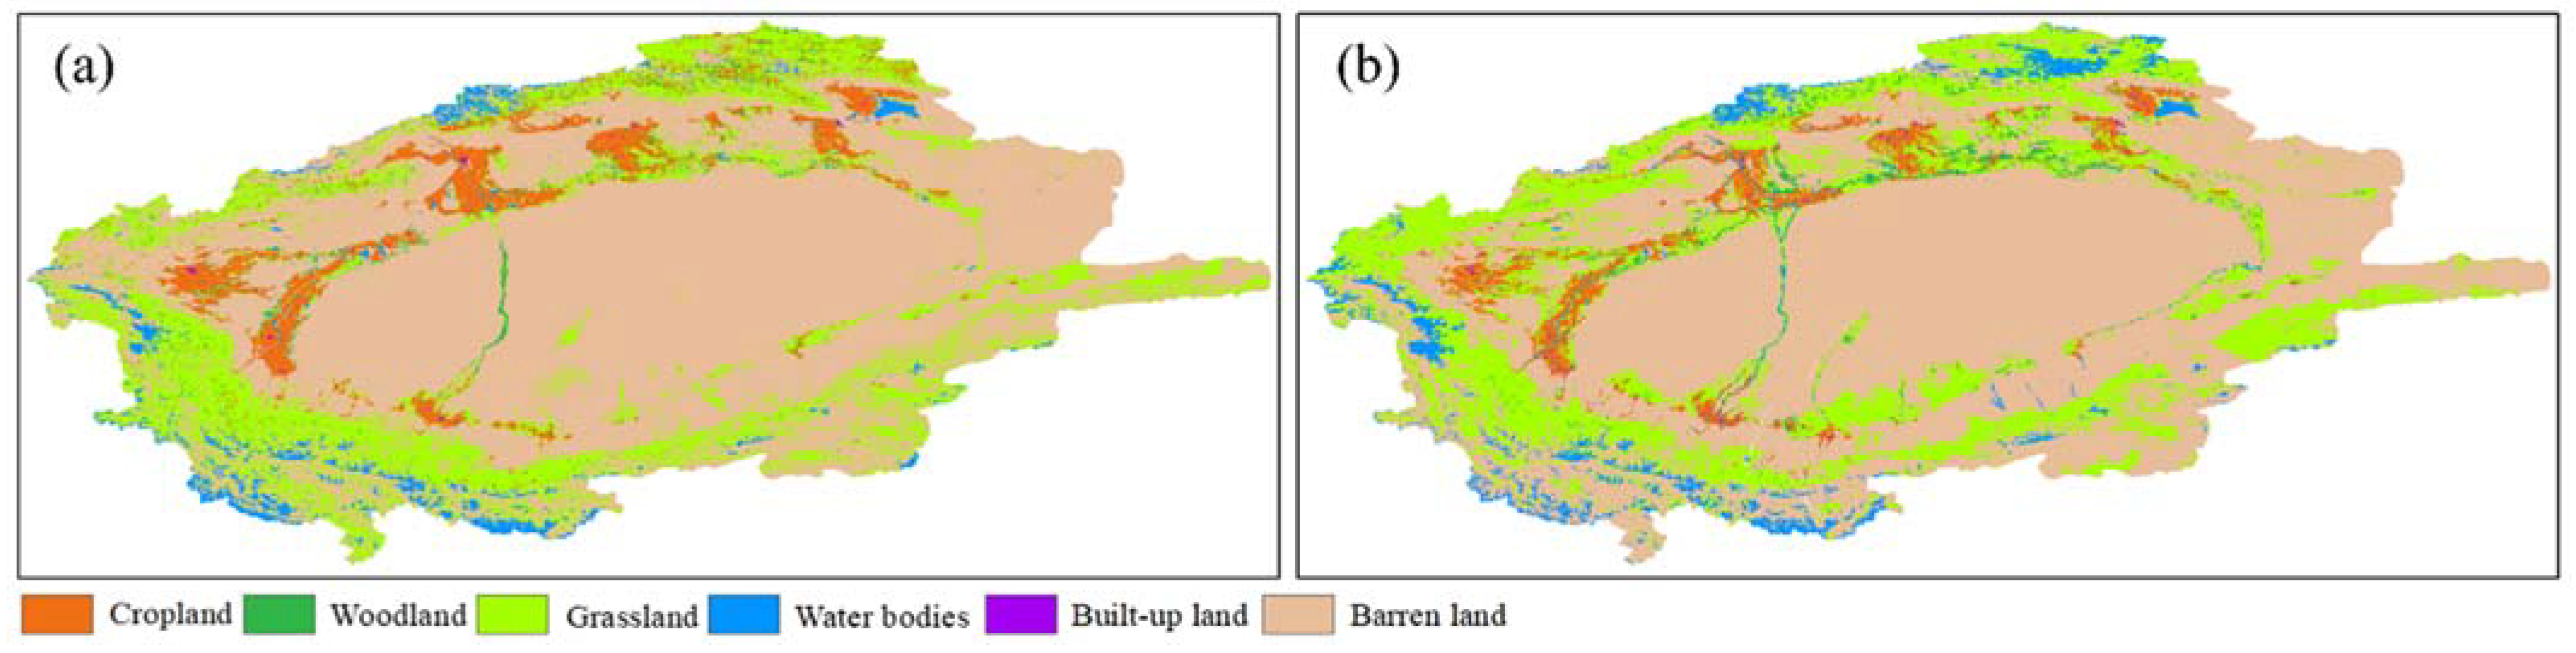
3.3. Simulation and Projection of Future Land Use

3.3.1. Comparison of Simulation Results of Different Models

According to the comparison between the simulation results of the models and the real data (Table 2), the absolute value of the error rate of all simulations is less than 3.17% except for built-up land. The largest error occurs in the built-up land simulation, with the highest absolute value error of 6.17%. This was mainly due to the small base of built-up land area and the large variation within the period, which led to a large error in the three simulation results compared with the actual results. Among the three model simulations, the CA-Markov model had the lowest absolute value of overall error rate for all land use types. Therefore, of these three models, the CA-Markov model is the best one to use for quantitative LUCC simulations.
Land use data for 2000, 2005 and 2010 were first selected to simulate the 2015 LUCC in the Tarim River Basin using the CA-Markov model. Next, we compared and validated the simulation with the actual data in spatial terms (Figure 5). The results show that the quantitative results are in high agreement with the spatial results, and the simulation results are consistent with the actual ones, which are mainly shown in the two types of woodland and built-up land. There are slight deviations in the distribution of land types between the actual results (Figure 5a) and the model simulation results (Figure 5b), with the differences being mainly concentrated in the lower reaches of the Kaidu-Kongque and Kashgar rivers. In the process of validating the simulation results, the Kappa coefficients of different land types in the water bodies exceeded 0.85, with Kappa coefficients of 0.91 for cropland, 0.87 for woodland, 0.93 for grassland, 0.97 for water bodies, 0.86 for built-up land, and 0.92 for barren land. The Kappa coefficient of built-up land is relatively insignificant, as the base of the area occupied by built-up land is too small and volatile. From these results, we see that the CA-Markov model can accurately and quantitatively simulate and predict LUCC in the Tarim River Basin.

3.3.2. Future Land Use/Cover

After comparing the simulation results of the three models, we chose the CA-Markov model to simulate 2030 land use pattern changes in the Tarim River Basin at temporal and spatial scales. Furthermore, by comparing the land use pattern changes in 2020 (a) and 2030 (b) in Figure 6 and Table 3, we can see that the land use pattern of the basin in 2020-2030 shows an increase in grassland, woodland, water bodies and built-up land and a decrease in barren land and cropland. During the same period, the cropland area decreased by 3599.42 km2 and the intensity was −0.54 %. This decrease in area was concentrated in the Kashgar River and in the lower reaches of the Weigan-Kuqu, Aksu, and Yarkand rivers. The increases in grassland and woodland of 7.34% and 6.92%, respectively, can be explained by the drastic changes in the dynamic attitude of grassland (0.67%) and the intensity of land use (1.63%). These both increased significantly in the lower Weigan-Kucha and Kashgar rivers, and in the Dina, Kriya and Qarqan rivers. The total amount of barren land decreased by 19,164.99 km2, or 2.77%, with most of the decrease being concentrated in the middle and lower reaches of the basin.
From these data, we can see that changes in water bodies during the period were very dramatic, with the land use dynamic attitude of water bodies and woodland being 1.33% and 0.63%, respectively. The area increases were concentrated in the upper reaches of the Tarim River Basin and in the middle and lower reaches of the basin’s rivers. There was a rise in the area of built-up land, but because the base of built-up land area remained small, the dynamic attitude was high.

3.4. Land Structure Changes in a Future Period

Comparing the simulation results with those from the past, we found frequent transformations among various land types in the Tarim River Basin across different periods. The main feature of these changes was the mutual transformation of cropland, grassland, and barren land with other land types (Figure 7). From 2020 to 2030, most of the cropland is anticipated to convert to grassland, at a conversion ratio of 64.01%, while the remaining portion is expected to convert to woodland, water bodies, built-up land and barren land, accounting for 9.13%, 6.32%, 5.34% and 12.89%, respectively. Most of the increased area of grassland will come from barren land, which mainly accounts for 83.38%. Barren land will also likely convert to woodland and water bodies, with a 5.57% and 13.42% conversion rate, respectively. During the 2020–2030 period, in addition to the conversion of cropland and barren land to water bodies, woodland and grassland will also convert to water bodies, at an anticipated rate of 6.80% and 55.75%, respectively.
In 1992, the area of grassland and built-up land increased significantly along the same trend line as that in 2020–2030. Barren land suffered a major decrease compared to 1992. According to the transfer matrix for the period 1992–2030, cropland, grassland and barren land are the three most active land types during the period. Moreover, in addition to the mutual transformation between these three land types, there is also a conversion to woodland, water bodies and built-up land. The main source of the increase in built-up land is cropland, with a conversion ratio of 74.64%. Woodland is converted mainly from cropland and barren land, and water bodies are transformed by grassland and barren land, at a rate of 53.35% and 29.91%, respectively. In general, the conversion of grassland and barren land to other land types is greater, and the conversion between grassland and barren land is quite drastic. The conversion of cropland and barren land to grassland led to an increase in its area, with a conversion ratio of 20.65% and 74.51%, respectively.
Based on the land type data of the Tarim River Basin from 1992 to 2020 and future simulations for 2030, the information entropy and equilibrium degree of land use structure were calculated and analyzed (Figure 8). An increasing trend in the information entropy of land use structure occurred from 1992 to 2030. It rose rapidly from 2000 to 2008, indicating a dramatic change in the disorder of the land use system during this period. From 2008 to 2020, there is a relative slowdown in the trend, with changes in arable and grassland areas playing an important role in the process. The trend of equilibrium degree is similar to that of information entropy, whose value increases from 0.64 in 1992 to 0.70 in 2030 and has a significant upward trend after 2020. The overall results indicate that the land use structure of the Tarim River Basin gradually balances in the future period, and that the balance of the distribution of various land structures will be improved.

4. Discussion

4.1. CA-Markov Model Validation and Applicability

Since there are many factors affecting the changes in the spatial and temporal patterns of regional land use, a more objective and scientific calculation of the future land use demand is needed [47]. Markov chain models simulate and predict future land use patterns based on land use data and can also effectively integrate human factors and land use [48,49,50]. This approach has been widely used in land use prediction and urban area planning, and has achieved good results [8,15,51]. However, there are still some shortcomings in the Markov chain model. For instance, it often overestimates the area of water bodies and woodland while underestimating the land use classification categories of cropland, built-up land, and barren land [52,53,54]. It is also difficult to accurately determine the population requirements of different forest species during future simulations under various scenarios [55]. The Kappa index has varied between 0.80 and 1 in correlation studies, indicating the high consistency of the CA-Markov model [28,34]. The validation result of this study was 0.89, which was then found to be consistent by comparing the area and spatial distribution of different land types. This shows that the CA-Markov model is highly reliable for simulating LUCC in the Tarim River Basin.
In modeling and predicting future land use changes, it is usually necessary to consider the influence of data such as temperature and precipitation, ecology and social economy, as well as different land use constraints such as policy making, urban planning and road distance to reflect more realistic results. Despite the satisfactory accuracy and reliability of the model simulation results, the resolution of the remotely sensed data products may be one of the limiting factors that have an impact on the accuracy of the simulation results, which we will focus on in our future work. Moreover, the limitations of the current study are also reflected in the need to integrate the various factors affecting land change in future studies. Among these factors, water resources play an important role in the evolution of regional land use patterns [56,57]. At present, it is difficult to quantify the impact of water, so this study did not consider water resources as a limiting factor. Further investigations could consider how to quantify the driving role of water; they could also consider how the model could avoid or compensate for the accuracy and reasonableness of the predicted results in simulations of future scenarios.
This will be our focus of future research on optimal land use model allocation. If more constraints such as water resources, soil types, climate factors, etc., were added to the parameter settings of the model, the accuracy of future land prediction results would be greatly improved [58]. In addition, in future studies, we will simulate and predict future LUCC under different scenarios of ecological protection, maintenance of status quo, and rapid urbanization; we will also analyze the impact of different LUCC scenarios on the resource environment and ecological carrying capacity.

4.2. Impacts of Climate Change and Human Activities on LUCC in the Water Bodies

Natural and social factors are the main causes of LUCC in the region [59]. The natural environment is the basis of land resources and is important in the process of rapid economic development [60]. In recent decades, in the context of global warming, the decline in glacier reserves in mountainous areas, the rapid growth of runoff and precipitation, and the accelerated melting of alpine snow cover have greatly increased the area of water bodies in the basin [61,62]. Significant increase in temperature and precipitation with global warming, receding glaciers and reduced snowmelt will have an impact on surface water in the study area. In addition, the climate of the Tarim River Basin is extremely dry, with strong evaporation and a fragile and sensitive ecological environment. Many natural disasters caused by the effects of climate and precipitation may hinder development in arid zones and threaten the stability of the basin [63].
From 1992 to 2020, the total population in the Tarim River Basin increased from 729.04 million to 1195.17 million, an increase of 453.96 million or 61.25 % over 1990 levels. With such a rapid rise in population, the need to meet subsistence and economic development has led to a significant increase in demand for land. Cropland area increased from 48814.69 km2 in 1992 to 60630.56 km2 in 2020, mainly due to the restructuring of the region’s industries, which saw the cultivation of food crops replaced with the cultivation of cotton on a large scale. After 2000, the state reduced the agricultural tax though grain and cotton prices continued to climb [64]. With the vigorous development of social economy, the gross domestic product of the basin has likewise been rising, from CNY 10.702 billion to CNY 412.712 billion, along with the continuous promotion of urbanization [31].
Meanwhile, barren land has substantially decreased since 1992, at a total reduction of 22342.83 km2, while the area of built-up land has shown an accelerated increase. After 2008, woodland area expanded by 1061.08 km2, which fully indicates that the afforestation policy focusing on economic construction has been well implemented and enforced within the region [65]. Due to the large base and proportion of the current agricultural population, the burgeoning population will intensify urbanization and urban land conflicts as society continues to develop.

4.3. Future Land Structure Optimization

We selected the land use dynamic attitude/intensity and transfer matrix to comprehensively analyze the quantitative structure and spatial distribution characteristics of land use in the Tarim River Basin. The simulation results show that the area of grassland, woodland, water bodies and built-up land is expected to expand over the next 10 years, especially in urban areas. Similarly, the area of built-up land transferred in is anticipated to be much larger than the area transferred out, and the area will consequently grow rapidly. Increases in urbanization have a positive effect on economic development by satisfying human needs, but they may also lead to ecological problems [66,67,68].
In recent studies, Yan et al. showed that urbanization exacerbates the daytime warming effect [69], while Wei et al. suggested that urbanization generally boosts PM2.5 (Particles less than or equal to 2.5 microns in diameter) concentrations [70]. In the process of socio-economic development, different regions have a variety of land use needs as well as unique land use structure characteristics [71,72]. Wang et al. argued that regional planning policies can influence the degree of urbanization [73], whereas Gong et al. reported that while the implementation of land use policies is beneficial to ecosystem functioning, it may also exacerbate water scarcity [74]. Therefore, it is necessary to link socio-economic with sustainable development, and to optimize and adjust the regional land structure and rationalize the use of regional land resources. Such an approach requires formulating reasonable policies from numerous perspectives in order to promote quantitative land use structure and spatial layout. Effective quantification of urban land development under rapid socio-economic development can strengthen the management mechanism of land structure and is essential for the coordinated development of regional resources and ecological security.

5. Conclusions

In this study, we first selected the CA-Markov, PLUS, and gray prediction models to simulate land use/cover in the Tarim River Basin and then verified and compared the simulation results of the three models, ultimately exploring the evolution of future land use dynamics and structural changes in the basin. Our key findings are provided below.
The main features of LUCC in the Tarim River Basin during 1992–2020 are the continuous expansion of cropland and the significant reduction of barren land. Cropland expansion is prominent in the middle and upper basin. The primary characteristics of the region’s LUCC are the transformation of grassland into cropland, woodland and built-up land, along with the continuous development and utilization of barren land into cropland, grassland and woodland in the water bodies. These changes are particularly evident in the oasis areas of the middle and upper basin. By comparing the simulation results of the three models, the absolute value of the error rate is less than 3.17% for all simulations, except for built-up land. The final CA-Markov model shows the lowest absolute value of the overall error rate among the three models and is more reliable.
The land use pattern in 2020–2030 indicates a likely increase in grassland, woodland, water bodies and built-up land as well as a decrease in barren land and cropland. Grassland area is anticipated to increase by 16,646.35 km2 over the next 10 years, mainly in the Dina, Kriya and Qarqan rivers, and in the lower parts of the Weigan-Kuqu and Kashgar rivers. Cropland is expected to decrease in the Kashgar River as well as in the lower reaches of the Weigan-Kuqu, Aksu, and Yarkand rivers. The simulation results also indicate that the area of barren land will decrease by 2.77% in the middle and lower reaches of the basin.
Additionally, cropland, grassland and barren land are expected to become the most active land types in the transfer process, with the increase in grassland area mainly coming from the transfer of barren land, at a proportion of 74.51%. With the rising demand for population and land, we can only hope that the excessive development and utilization of soil and water resources will slow down or avoid the aggravation of ecological problems, such as cropland expansion, grassland degradation, and water scarcity. Slowing down the process and implementing rational policies will likely lead to a more stable development period that considers the sustainability needs of both humans and the environment.

Author Contributions

Y.H. and Y.C. conceived the original design of this paper. Z.L., Y.L. and F.S. put forward valuable suggestions for this article. S.Z., C.W. and M.F. improved the structure of the paper. All authors have read and agreed to the published version of the manuscript.

Funding

The research was supported by the International Cooperation Program of Chinese Academy of Sciences (131965KYSB20210045) and the Strategic Priority Research Program of Chinese Academy of Sciences (XDA20100303).

Data Availability Statement

The data presented in this study are available on request from the corresponding author.

Conflicts of Interest

The authors declare no conflict of interest.

References

  1. Li, Z.; Li, M.; Xia, B. Spatio-temporal dynamics of ecological security pattern of the Pearl River Delta urban agglomeration based on LUCC simulation. Ecol. Indic. 2020, 114, 106319. [Google Scholar] [CrossRef]
  2. Hu, C.; Zhang, L.; Wu, Q.; Soomro, S.; Jian, S. Response of LUCC on runoff generation process in Middle Yellow River Basin: The Gushanchuan Basin. Water 2020, 12, 1237. [Google Scholar] [CrossRef]
  3. Zhu, Z.; Woodcock, C.E. Continuous change detection and classification of land cover using all available Landsat data. Remote Sens. Environ. 2014, 144, 152–171. [Google Scholar] [CrossRef] [Green Version]
  4. Yang, H.; Zhong, X.; Deng, S.; Xu, H. Assessment of the impact of LUCC on NPP and its influencing factors in the Yangtze River basin, China. Catena 2021, 206, 105542. [Google Scholar] [CrossRef]
  5. Li, J.; Rodriguez, D.; Tang, X. Effects of land lease policy on changes in land use, mechanization and agricultural pollution. Land Use Pol. 2017, 64, 405–413. [Google Scholar] [CrossRef]
  6. Chen, Y.; Li, Z.; Li, W.; Deng, H.; Shen, Y. Water and ecological security: Dealing with hydroclimatic challenges at the heart of China’s Silk Road. Environ. Earth Sci. 2016, 75, 881. [Google Scholar] [CrossRef]
  7. Maimaiti, B.; Chen, S.; Kasimu, A.; Simayi, Z.; Aierken, N. Urban spatial expansion and its impacts on ecosystem service value of typical oasis cities around Tarim Basin, northwest China. Int. J. Appl. Earth Obs. Geoinf. 2021, 104, 102554. [Google Scholar] [CrossRef]
  8. Wang, S.; Zhou, K.; Zuo, Q.; Wang, J.; Wang, W. Land use/land cover change responses to ecological water conveyance in the lower reaches of Tarim River, China. J. Arid Land 2021, 13, 1274–1286. [Google Scholar] [CrossRef]
  9. Zhang, Z.; Xu, E.; Zhang, H. Complex network and redundancy analysis of spatial–temporal dynamic changes and driving forces behind changes in oases within the Tarim Basin in northwestern China. Catena 2021, 201, 105216. [Google Scholar] [CrossRef]
  10. Chen, Y.; Hao, X.; Chen, Y.; Zhu, C. Study on water system connectivity and ecological protection countermeasures of Tarim River Basin in Xinjiang. Bull. Chin. Acad. Sci. 2019, 34, 1156–1164. [Google Scholar]
  11. de Graaf, I.E.; Gleeson, T.; Sutanudjaja, E.H.; Bierkens, M.F. Environmental flow limits to global groundwater pumping. Nature 2019, 574, 90–94. [Google Scholar] [CrossRef] [PubMed]
  12. Ning, J.; Liu, J.; Kuang, W.; Xu, X.; Zhang, S.; Yan, C.; Li, R.; Wu, S.; Hu, Y.; Du, G. Spatiotemporal patterns and characteristics of land-use change in China during 2010–2015. J. Geogr. Sci. 2018, 28, 547–562. [Google Scholar] [CrossRef] [Green Version]
  13. Jiao, M.; Hu, M.; Xia, B. Spatiotemporal dynamic simulation of land-use and landscape-pattern in the Pearl River Delta, China. Sustain. Cities Soc. 2019, 49, 101581. [Google Scholar] [CrossRef]
  14. Liang, X.; Guan, Q.; Clarke, K.C.; Liu, S.; Wang, B.; Yao, Y. Understanding the drivers of sustainable land expansion using a patch-generating land use simulation (PLUS) model: A case study in Wuhan, China. Comput. Environ. Urban Syst. 2021, 85, 101569. [Google Scholar] [CrossRef]
  15. Zhang, Z.; Hu, B.; Jiang, W.; Qiu, H. Identification and scenario prediction of degree of wetland damage in Guangxi based on the CA-Markov model. Ecol. Indic. 2021, 127, 107764. [Google Scholar] [CrossRef]
  16. Sibanda, S.; Ahmed, F. Modelling historic and future land use/land cover changes and their impact on wetland area in Shashe sub-catchment, Zimbabwe. Modeling Earth Syst. Environ. 2021, 7, 57–70. [Google Scholar] [CrossRef]
  17. Cao, M.; Zhu, Y.; Lü, G.; Chen, M.; Qiao, W. Spatial distribution of global cultivated land and its variation between 2000 and 2010, from both agro-ecological and geopolitical perspectives. Sustainability 2019, 11, 1242. [Google Scholar] [CrossRef] [Green Version]
  18. Tang, F.; Fu, M.; Wang, L.; Zhang, P. Land-use change in Changli County, China: Predicting its spatio-temporal evolution in habitat quality. Ecol. Indic. 2020, 117, 106719. [Google Scholar] [CrossRef]
  19. Matlhodi, B.; Kenabatho, P.K.; Parida, B.P.; Maphanyane, J.G. Analysis of the future land use land cover changes in the Gaborone dam catchment using CA-Markov model: Implications on water resources. Remote Sens. 2021, 13, 2427. [Google Scholar] [CrossRef]
  20. Aburas, M.M.; Ho, Y.M.; Ramli, M.F.; Ash’aari, Z.H. Improving the capability of an integrated CA-Markov model to simulate spatio-temporal urban growth trends using an Analytical Hierarchy Process and Frequency Ratio. Int. J. Appl. Earth Obs. Geoinf. 2017, 59, 65–78. [Google Scholar] [CrossRef]
  21. da Cunha, E.R.; Santos, C.A.G.; da Silva, R.M.; Bacani, V.M.; Pott, A. Future scenarios based on a CA-Markov land use and land cover simulation model for a tropical humid basin in the Cerrado/Atlantic forest ecotone of Brazil. Land Use Pol. 2021, 101, 105141. [Google Scholar] [CrossRef]
  22. Jiang, L.; Liu, Y.; Wu, S.; Yang, C. Analyzing ecological environment change and associated driving factors in China based on NDVI time series data. Ecol. Indic. 2021, 129, 107933. [Google Scholar] [CrossRef]
  23. Fu, A.; Li, W.; Chen, Y.; Wang, Y.; Hao, H.; Li, Y.; Sun, F.; Zhou, H.; Zhu, C.; Hao, X. The effects of ecological rehabilitation projects on the resilience of an extremely drought-prone desert riparian forest ecosystem in the Tarim River Basin, Xinjiang, China. Sci Rep. 2021, 11, 18485. [Google Scholar] [CrossRef] [PubMed]
  24. Abbas, A.; He, Q.; Jin, L.; Li, J.; Salam, A.; Lu, B.; Yasheng, Y. Spatio-temporal changes of land surface temperature and the influencing factors in the Tarim Basin, Northwest China. Remote Sens. 2021, 13, 3792. [Google Scholar] [CrossRef]
  25. Nian, D.; Linz, M.; Mooring, T.A.; Fu, Z. The changing extreme values of summer relative humidity in the Tarim Basin in northwestern China. Clim. Dyn. 2022, 1–14. [Google Scholar] [CrossRef]
  26. Hou, Y.; Chen, Y.; Ding, J.; Li, Z.; Li, Y.; Sun, F. Ecological impacts of land use change in the arid Tarim River Basin of China. Remote Sens. 2022, 14, 1894. [Google Scholar] [CrossRef]
  27. Liu, M.; Jiang, Y.; Xu, X.; Huang, Q.; Huo, Z.; Huang, G. Long-term groundwater dynamics affected by intense agricultural activities in oasis areas of arid inland river basins, Northwest China. Agric. Water Manag. 2018, 203, 37–52. [Google Scholar] [CrossRef]
  28. Tang, Q.; Wang, J.; Jing, Z.; Yan, Y.; Niu, H. Response of ecological vulnerability to land use change in a resource-based city, China. Resour. Policy 2021, 74, 102324. [Google Scholar] [CrossRef]
  29. Chen, H.; Chen, Y. Changes of desert riparian vegetation along the main stream of Tarim River, Xinjiang. Chin. J. Ecol. 2015, 34, 3166. [Google Scholar]
  30. Sun, F.; Wang, Y.; Chen, Y.; Li, Y.; Zhang, Q.; Qin, J.; Kayumba, P.M. Historic and simulated desert-oasis ecotone changes in the arid Tarim River Basin, China. Remote Sens. 2021, 13, 647. [Google Scholar] [CrossRef]
  31. Fang, G.; Yang, J.; Chen, Y.; Li, Z.; Ji, H.; De Maeyer, P. How hydrologic processes differ spatially in a large basin: Multisite and multiobjective modeling in the Tarim River Basin. J. Geophys. Res. Atmos. 2018, 123, 7098–7113. [Google Scholar] [CrossRef]
  32. Chen, Y.; Ye, Z.; Shen, Y. Desiccation of the Tarim River, Xinjiang, China, and mitigation strategy. Quat. Int. 2011, 244, 264–271. [Google Scholar] [CrossRef]
  33. Chen, Y.; Li, Z.; Fan, Y.; Wang, H.; Deng, H. Progress and prospects of climate change impacts on hydrology in the arid region of northwest China. Environ. Res. 2015, 139, 11–19. [Google Scholar] [CrossRef] [PubMed]
  34. Pontius, R.G., Jr.; Millones, M. Death to Kappa: Birth of quantity disagreement and allocation disagreement for accuracy assessment. Int. J. Remote Sens. 2011, 32, 4407–4429. [Google Scholar] [CrossRef]
  35. Singh, S.K.; Laari, P.B.; Mustak, S.; Srivastava, P.K.; Szabó, S. Modelling of land use land cover change using earth observation data-sets of Tons River Basin, Madhya Pradesh, India. Geocarto Int. 2018, 33, 1202–1222. [Google Scholar] [CrossRef]
  36. Shu, J.; Xiu, H.; Xiang, Z. Analysis on influencing factors of land use change in three typical areas of western China. Geogr. Res. 2006, 25, 79–86. [Google Scholar]
  37. Long, H.; Liu, Y.; Hou, X.; Li, T.; Li, Y. Effects of land use transitions due to rapid urbanization on ecosystem services: Implications for urban planning in the new developing area of China. Habitat Int. 2014, 44, 536–544. [Google Scholar] [CrossRef]
  38. He, D.; Hou, K.; Wen, J.; Wu, S.; Wu, Z. A coupled study of ecological security and land use change based on GIS and entropy method—A typical region in Northwest China, Lanzhou. Environ. Sci. Pollut. Res. 2022, 29, 6347–6359. [Google Scholar] [CrossRef]
  39. Xu, C.; Pu, L.; Kong, F.; Li, B. Spatio-temporal change of land use in a coastal reclamation area: A complex network approach. Sustainability 2021, 13, 8690. [Google Scholar] [CrossRef]
  40. Fischer, G.; Sun, L. Model based analysis of future land-use development in China. Agric. Ecosyst. Environ. 2001, 85, 163–176. [Google Scholar] [CrossRef]
  41. Veldkamp, A.; Lambin, E.F. Predicting land-use change. Agric. Ecosyst. Environ. 2001, 85, 1–6. [Google Scholar] [CrossRef]
  42. Pijanowski, B.C.; Brown, D.G.; Shellito, B.A.; Manik, G.A. Using neural networks and GIS to forecast land use changes: A land transformation model. Comput. Environ. Urban Syst. 2002, 26, 553–575. [Google Scholar] [CrossRef]
  43. Zhai, H.; Lv, C.; Liu, W.; Yang, C.; Fan, D.; Wang, Z.; Guan, Q. Understanding spatio-temporal patterns of land use/land cover change under urbanization in Wuhan, China, 2000–2019. Remote Sens. 2021, 13, 3331. [Google Scholar] [CrossRef]
  44. Li, C.; Wu, Y.; Gao, B.; Zheng, K.; Wu, Y.; Li, C. Multi-scenario simulation of ecosystem service value for optimization of land use in the Sichuan-Yunnan ecological barrier, China. Ecol. Indic. 2021, 132, 108328. [Google Scholar] [CrossRef]
  45. Wang, J.; Ma, X.; Wu, J.; Dong, Y. Optimization models based on GM (1, 1) and seasonal fluctuation for electricity demand forecasting. Int. J. Electr. Power Energy Syst. 2012, 43, 109–117. [Google Scholar] [CrossRef]
  46. Rao, Y.; Zhou, M.; Ou, G.; Dai, D.; Zhang, L.; Zhang, Z.; Nie, X.; Yang, C. Integrating ecosystem services value for sustainable land-use management in semi-arid region. J. Clean Prod. 2018, 186, 662–672. [Google Scholar] [CrossRef]
  47. Yang, L.; Xie, Y.; Zong, L.; Qiu, T.; Jiao, J. Land use optimization configuration based on multi- objective genetic algorithm and FLUS model of agro-pastoral ecotone in Northwest China. J. Geo-Inf. Sci. 2020, 22, 568–579. [Google Scholar]
  48. Li, K.; Feng, M.; Biswas, A.; Su, H.; Niu, Y.; Cao, J. Driving factors and future prediction of land use and cover change based on satellite remote sensing data by the LCM model: A case study from Gansu Province, China. Sensors 2020, 20, 2757. [Google Scholar] [CrossRef]
  49. Gidey, E.; Dikinya, O.; Sebego, R.; Segosebe, E.; Zenebe, A. Cellular automata and Markov Chain (CA_Markov) model-based predictions of future land use and land cover scenarios (2015–2033) in Raya, northern Ethiopia. Modeling Earth Syst. Environ. 2017, 3, 1245–1262. [Google Scholar] [CrossRef]
  50. Han, H.; Yang, C.; Song, J. Scenario simulation and the prediction of land use and land cover change in Beijing, China. Sustainability 2015, 7, 4260–4279. [Google Scholar] [CrossRef] [Green Version]
  51. Fu, X.; Wang, X.; Yang, Y. Deriving suitability factors for CA-Markov land use simulation model based on local historical data. J. Environ. Manag. 2018, 206, 10–19. [Google Scholar] [CrossRef] [PubMed]
  52. Hyandye, C.; Martz, L.W. A Markovian and cellular automata land-use change predictive model of the Usangu Catchment. Int. J. Remote Sens. 2017, 38, 64–81. [Google Scholar] [CrossRef]
  53. Maviza, A.; Ahmed, F. Analysis of past and future multi-temporal land use and land cover changes in the semi-arid Upper-Mzingwane sub-catchment in the Matabeleland south province of Zimbabwe. Int. J. Remote Sens. 2020, 41, 5206–5227. [Google Scholar] [CrossRef]
  54. Rahman, M.; Tabassum, F.; Rasheduzzaman, M.; Saba, H.; Sarkar, L.; Ferdous, J.; Uddin, S.Z.; Zahedul Islam, A. Temporal dynamics of land use/land cover change and its prediction using CA-ANN model for southwestern coastal Bangladesh. Environ. Monit. Assess. 2017, 189, 565. [Google Scholar] [CrossRef]
  55. Liao, W.; Liu, X.; Xu, X.; Chen, G.; Liang, X.; Zhang, H.; Li, X. Projections of land use changes under the plant functional type classification in different SSP-RCP scenarios in China. Sci. Bull. 2020, 65, 1935–1947. [Google Scholar] [CrossRef]
  56. Yin, J.; He, F.; Xiong, Y.; Qiu, G. Effects of land use/land cover and climate changes on surface runoff in a semi-humid and semi-arid transition zone in northwest China. Hydrol. Earth Syst. Sci. 2017, 21, 183–196. [Google Scholar] [CrossRef] [Green Version]
  57. de Mello, K.; Taniwaki, R.H.; de Paula, F.R.; Valente, R.A.; Randhir, T.O.; Macedo, D.R.; Leal, C.G.; Rodrigues, C.B.; Hughes, R.M. Multiscale land use impacts on water quality: Assessment, planning, and future perspectives in Brazil. J. Environ. Manag. 2020, 270, 110879. [Google Scholar] [CrossRef]
  58. Wang, J.; Zhang, J.; Xiong, N.; Liang, B.; Wang, Z.; Cressey, E.L. Spatial and temporal variation, simulation and prediction of land use in ecological conservation area of Western Beijing. Remote Sens. 2022, 14, 1452. [Google Scholar] [CrossRef]
  59. Ponce-Campos, G.E.; Moran, M.S.; Huete, A.; Zhang, Y.; Bresloff, C.; Huxman, T.E.; Eamus, D.; Bosch, D.D.; Buda, A.R.; Gunter, S.A. Ecosystem resilience despite large-scale altered hydroclimatic conditions. Nature 2013, 494, 349–352. [Google Scholar] [CrossRef]
  60. Liu, X.; Liang, X.; Li, X.; Xu, X.; Ou, J.; Chen, Y.; Li, S.; Wang, S.; Pei, F. A future land use simulation model (FLUS) for simulating multiple land use scenarios by coupling human and natural effects. Landsc. Urban Plan. 2017, 168, 94–116. [Google Scholar] [CrossRef]
  61. Li, B.; Chen, Y.; Li, W.; Chen, Z.; Zhang, B.; Guo, B. Spatial and temporal variations of temperature and precipitation in the arid region of northwest China from 1960–2010. Fresenius Environ. Bull. 2013, 22, 362–371. [Google Scholar]
  62. Bolch, T.; Duethmann, D.; Wortmann, M.; Liu, S.; Disse, M. Declining glaciers endanger sustainable development of the oases along the Aksu-Tarim River (Central Asia). Int. J. Sustain. Dev. World Ecol. 2022, 29, 209–218. [Google Scholar] [CrossRef]
  63. Li, Y.; Chen, Y.; Li, Z. Dry/wet pattern changes in global dryland areas over the past six decades. Glob. Planet. Chang. 2019, 178, 184–192. [Google Scholar] [CrossRef]
  64. Chen, Z.; Chen, Y.; Li, W.; Chen, Y. Changes of runoff consumption and its human influence intensity in the mainstream of Tarim river. Acta Geogr. Sinica 2011, 66, 89–98. [Google Scholar]
  65. Liu, Y.; Li, J.; Yang, Y. Strategic adjustment of land use policy under the economic transformation. Land Use Pol. 2018, 74, 5–14. [Google Scholar] [CrossRef]
  66. Chen, W.; Chi, G.; Li, J. The spatial association of ecosystem services with land use and land cover change at the county level in China, 1995–2015. Sci. Total Environ. 2019, 669, 459–470. [Google Scholar] [CrossRef]
  67. Hou, X.; Liu, J.; Zhang, D.; Zhao, M.; Xia, C. Impact of urbanization on the eco-efficiency of cultivated land utilization: A case study on the Yangtze River Economic Belt, China. J. Clean. Prod. 2019, 238, 117916. [Google Scholar] [CrossRef]
  68. Liang, L.; Wang, Z.; Li, J. The effect of urbanization on environmental pollution in rapidly developing urban agglomerations. J. Clean. Prod. 2019, 237, 117649. [Google Scholar] [CrossRef]
  69. Yan, Z.; Zhou, D.; Li, Y.; Zhang, L. An integrated assessment on the warming effects of urbanization and agriculture in highly developed urban agglomerations of China. Sci. Total Environ. 2021, 804, 150119. [Google Scholar] [CrossRef]
  70. Wei, G.; Sun, P.; Jiang, S.; Shen, Y.; Liu, B.; Zhang, Z.; Ouyang, X. The driving influence of multi-dimensional urbanization on PM2.5 concentrations in Africa: New evidence from multi-source remote sensing data, 2000–2018. Int. J. Environ. Res. Public Health 2021, 18, 9389. [Google Scholar] [CrossRef]
  71. Barai, K.R.; Harashina, K.; Satta, N.; Annaka, T. Comparative analysis of land-use pattern and socioeconomic status between shrimp- and rice- production areas in southwestern coastal Bangladesh: A land-use/cover change analysis over 30 years. J. Coast Conserv. 2019, 23, 531–542. [Google Scholar] [CrossRef]
  72. Maharjan, A.; Kochhar, I.; Chitale, V.S.; Hussain, A.; Gioli, G. Under-standing rural outmigration and agricultural land use change in the Gandaki Basin, Nepal. Appl. Geogr. 2020, 124, 102278. [Google Scholar] [CrossRef]
  73. Wang, Y.; Ren, Y.; Song, L.; Xiang, Y. Responses of extreme high temperatures to urbanization in the Beijing–Tianjin–Hebei urban agglomeration in the context of a changing climate. Meteorol. Appl. 2021, 28, 2024. [Google Scholar] [CrossRef]
  74. Gong, B.; Liu, Z. Assessing impacts of land use policies on environmental sustainability of oasis landscapes with scenario analysis: The case of northern China. Landsc. Ecol. 2020, 36, 1913–1932. [Google Scholar] [CrossRef]
Figure 1. Sketch map of the Tarim River Basin, China. The water and elevation information comes from the Resources and Environment Data Center of the Chinese Academy of Science (http://www.resdc.cn (accessed on 26 May 2022)). (a) Average annual temperature of the Tarim River basin. (b) Average annual precipitation in the Tarim River Basin.
Remotesensing 14 02797 g001
Figure 2. Flow chart showing primary steps in the simulation process.
Remotesensing 14 02797 g002
Figure 3. Land uses in the Tarim River Basin from 1992 to 2020. (a) 1992, (b) 1996, (c) 2000, (d) 2004, (e) 2008, (f) 2012, (g) 2016, (h) 2020. (i) The area changes of different types during the period.
Remotesensing 14 02797 g003
Figure 4. Land use transfer map of the Tarim River Basin from 1992 to 2020. (a) 1992–2000, (b) 2000–2008, (c) 2008–2020, (d) 1992–2020. A1–A6 are the land types in the starting years, B1–B6 are land types in the end years. (A1/B1: Cropland; A2/B2: Grassland; A3/B3: Woodland; A4/B4: Built-up land; A5/B5: Water bodies; A6/B6: Barren land).
Remotesensing 14 02797 g004
Figure 5. Map of simulated and actual land use change in the Tarim River Basin in 2015. (a) Actual land use data, (b) Simulation land use data.
Remotesensing 14 02797 g005
Figure 6. Land use change in Tarim River Basin from 2020 to 2030. (a) 2020–2030, (b) 1992–2030.
Remotesensing 14 02797 g006
Figure 7. Map of future land use shifts in the Tarim River Basin. (a) 2020–2030, (b) 1992–2030. A1–A6 are the land types in the starting years, B1–B6 are land types in the end years. (A1/B1: Cropland; A2/B2: Grassland; A3/B3: Woodland; A4/B4: Built-up land; A5/B5: Water bodies; A6/B6: Barren land).
Remotesensing 14 02797 g007
Figure 8. Change of land use information entropy and equilibrium degree.
Remotesensing 14 02797 g008
Table 1. Land use dynamics/intensity in the Tarim River Basin, 1992–2020 (%). (a) Land use dynamics. (b) Land use intensity indices.
Land
Type
CroplandWoodlandGrasslandWater BodiesBuilt-Up LandBarren Land
(a)(b)(a)(b)(a)(b)(a)(b)(a)(b)(a)(b)
1992–20000.890.34−1.11−0.110.270.460.030.012.110−0.12−0.70
2000–20081.250.51−0.22−0.020.230.39−0.09−0.024.960.01−0.16−0.87
2008–20200.450.300.760.100.060.160.040.0112.760.05−0.08−0.62
1992–20200.861.16−0.08−0.030.1710011.190.06−0.11−2.19
Table 2. Comparison of the simulation results of the three models.
Land TypeActual
Data (km2)
CA-Markov Model (km2)Error (%)PLUS
Model (km2)
Error (%)Grey Prediction Model (km2)ERROR (%)
Cropland59,423.8659,274.170.2560,472.821.7760,063.681.08
Woodland12230.7212,126.860.8512,306.860.6211,843.143.17
Grassland225,724.43225,233.080.22225,447.030.12232,862.153.16
Water bodies27,943.3727,931.420.0427,896.770.1727,676.050.96
Built-up land584.64559.384.32552.425.51548.596.17
Barren land694,092.98694,975.090.13692,418.090.24688,730.400.77
Table 3. Dynamic attitude/intensity analysis of land use in Tarim River Basin during 2020–2030 (km2).
Land TypeCroplandWoodlandGrasslandWater BodiesBuilt-Up LandBarren Land
202060,630.5612,693.30226,727.6428,030.61777.47691,140.42
203057,031.1413,572.21243,374.0032,134.731912.49671,975.43
Ub-Ua−3599.42878.9116,646.354104.121135.02−19164.99
K/%−0.540.630.671.3313.27−0.25
LTI/%−0.350.091.630.400.11−1.88
Publisher’s Note: MDPI stays neutral with regard to jurisdictional claims in published maps and institutional affiliations.

