
Evaluation of Food Security Based on Remote Sensing Data—Taking Egypt as an Example


School of Remote Sensing and Information Engineering, Wuhan University, Wuhan 430079, China
*
Author to whom correspondence should be addressed.
Remote Sens. 2022, 14(12), 2876; https://0-doi-org.brum.beds.ac.uk/10.3390/rs14122876
Submission received: 23 April 2022
/
Revised: 31 May 2022
/
Accepted: 14 June 2022
/
Published: 16 June 2022
(This article belongs to the Special Issue Remote Sensing for Food Security, Sustainability, and Precision Agriculture)
Abstract
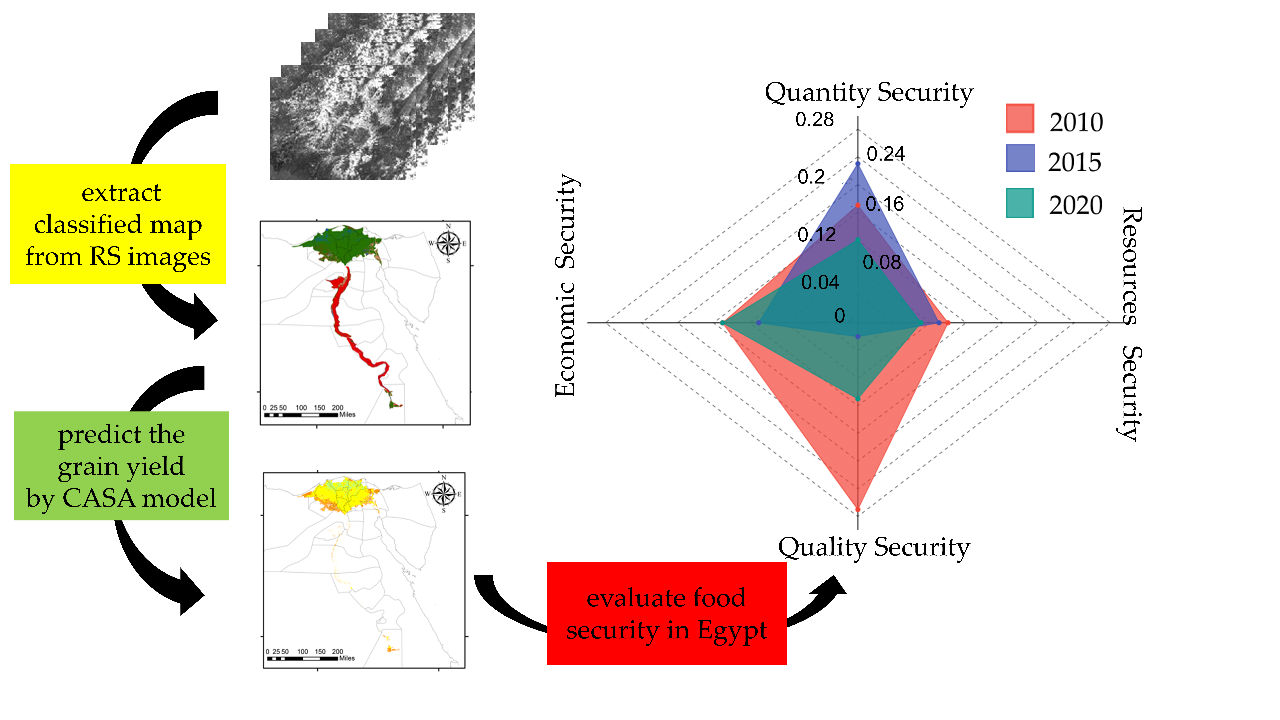
:Egypt, a country with a harsh natural environment and rapid population growth, is facing difficulty in ensuring its national food security. A novel model developed for assessing food security in Egypt, which applies remote sensing techniques, is presented. By extracting the gray-level co-occurrence matrix (GLCM) mean texture features from Sentinel-1 and Landsat-7 images, the arable land used to grow grain crops was first classified and extracted using a support vector machine. In terms of the classified results, meteorological data, and normalized difference vegetation index (NDVI) data, the Carnegie–Ames–Stanford approach (CASA) model was adopted to compute the annual net primary production (NPP). Then, the NPP yield conversion formula was used to forecast the annual grain yield. Finally, a method for evaluating food security, which involves four dimensions, i.e., quantity security, economic security, quality security, and resource security, was established to evaluate food security in Egypt in 2010, 2015, and 2020. Based on the proposed model, a classification accuracy of the crop distribution map, which is above 82%, can be achieved. Moreover, the reliability of yield estimation is verified compared to the result estimated using statistics data provided by Food and Agriculture Organization (FAO). Our evaluation results show that food security in Egypt is declining, the quantity and quality security show large fluctuations, and economic and resource security are relatively stable. This model can satisfy the requirements for estimating grain yield at a wide scale and evaluating food security on a national level. It can be used to provide useful suggestions for governments regarding improving food security.

1. Introduction
Food security is one of the most important factors for social harmony, political stability, and sustainable economic development. A food security evaluation model, which can be employed to predict the yield of grain crops and analyze food security problems, is of great significance for formulating agricultural policies, standardizing food markets, and adjusting planting structure [1]. Food security has received extensive attention from the international community since 1974 [2]. However, although international organizations and governments have been struggling to solve this issue for more than 30 years, the global food crisis has not been resolved yet, and has even become more severe [3,4,5]. In recent years, global climate change, soil desertification, salinization, urbanization, and other issues have negatively influenced grain production in Egypt. Meanwhile, a high population growth rate and fluctuating global food prices have further increased the severity of its food security problems [6,7].
Food security has been an issue of public interest for a long time. Early works mainly focused on the estimation of grain production, grain circulation control and management, yield potential prediction, and food security evaluation [8,9,10,11]. In recent years, since remote sensing can monitor the crops in time and provide various observation results for the agricultural sector with high revisit frequency and high accuracy, many studies have assessed food security using optical or radar satellite images. These studies can be mainly divided into two categories [12]. Some existing works conducted at a wide scale have mainly focused on using satellite images with wide-area coverage and geographic information system (GIS) software to analyze variations in land use [13,14], agricultural irrigation [15], and soil erosion [16,17]. In contrast, some works conducted at a detailed scale have mainly used high-resolution satellite images and some theoretical models to forecast crop yields with high accuracy [18,19]. Except for the aforementioned works, other works also focused on developing food security evaluation models based on statistical data other than satellite images to ensure accuracy [20].
To date, there have been some studies on food security in Egypt, a country with scarce fertile arable land and a large growing population [6]. Some studies have recently analyzed Egypt’s food security problem from a macroscopic view aiming to predict the future food security risk and provide recommendations for the government [20,21,22], which include analyzing the damage to food security caused by the loss of cultivated land [23], climate change related to temperature and water resources [24,25,26], and grain production [18]. The rest used high-resolution and multi-date images to show the distribution of cultivated crop types in a district located in the northern part of this country [27] and investigated the potentiality of basin soils which are located in the western part of Egypt and are suitable for horizontal agricultural expansion and optimum agricultural use [28]. Therefore, it can be found that a comprehensive evaluation of food security at the national level, in which the multi-source remote sensing data are adopted to extract arable land used to grow grain and cash crops, estimate grain yield, and evaluate food security, has rarely been reported thus far.
As described above, there is an urgent need for improvements in food security to reduce hunger and poverty in Egypt. Therefore, taking Egypt as an example, a novel model is developed in this paper to assess its national food security using remote sensing techniques, which will provide some suggestions for the Egyptian government. The outline of this paper is organized as follows. The study area and the datasets used for analysis are first introduced in Section 2. Next, the methodology is described in Section 3, which includes crop classification, grain yield estimation, and food security evaluation. Results are presented in Section 4. Some factors influencing food security in Egypt and the corresponding suggestions are discussed in Section 5. Finally, conclusions are given in Section 6.
2. Study Area and Datasets
2.1. Study Area
Egypt is located in northeastern Africa and southwestern Asia. It has a total land area of about one million km2, a total population of almost 100 million, and an annual population growth rate of about 2% [20]. According to the Koppen climate classification [29], Egypt has a hot desert climate (BWh) in the southern and central parts and a hot steppe climate (BSh) along the coast [30]. The annual average temperature is around 18 °C and the average temperature of the coldest month is below 14 °C. Furthermore, the annual average precipitation is around 200 mm [29]. In this country, the importance of agriculture is high, and almost 11% of the gross domestic product (GDP) is generated from the agricultural sector. In addition, approximately 58% of Egyptian labor is engaged directly in agricultural work [31]. However, since the rate of population growth in Egypt has increased at a higher rate than the increase in crop production, millions of people are suffering from severe food insecurity [32].
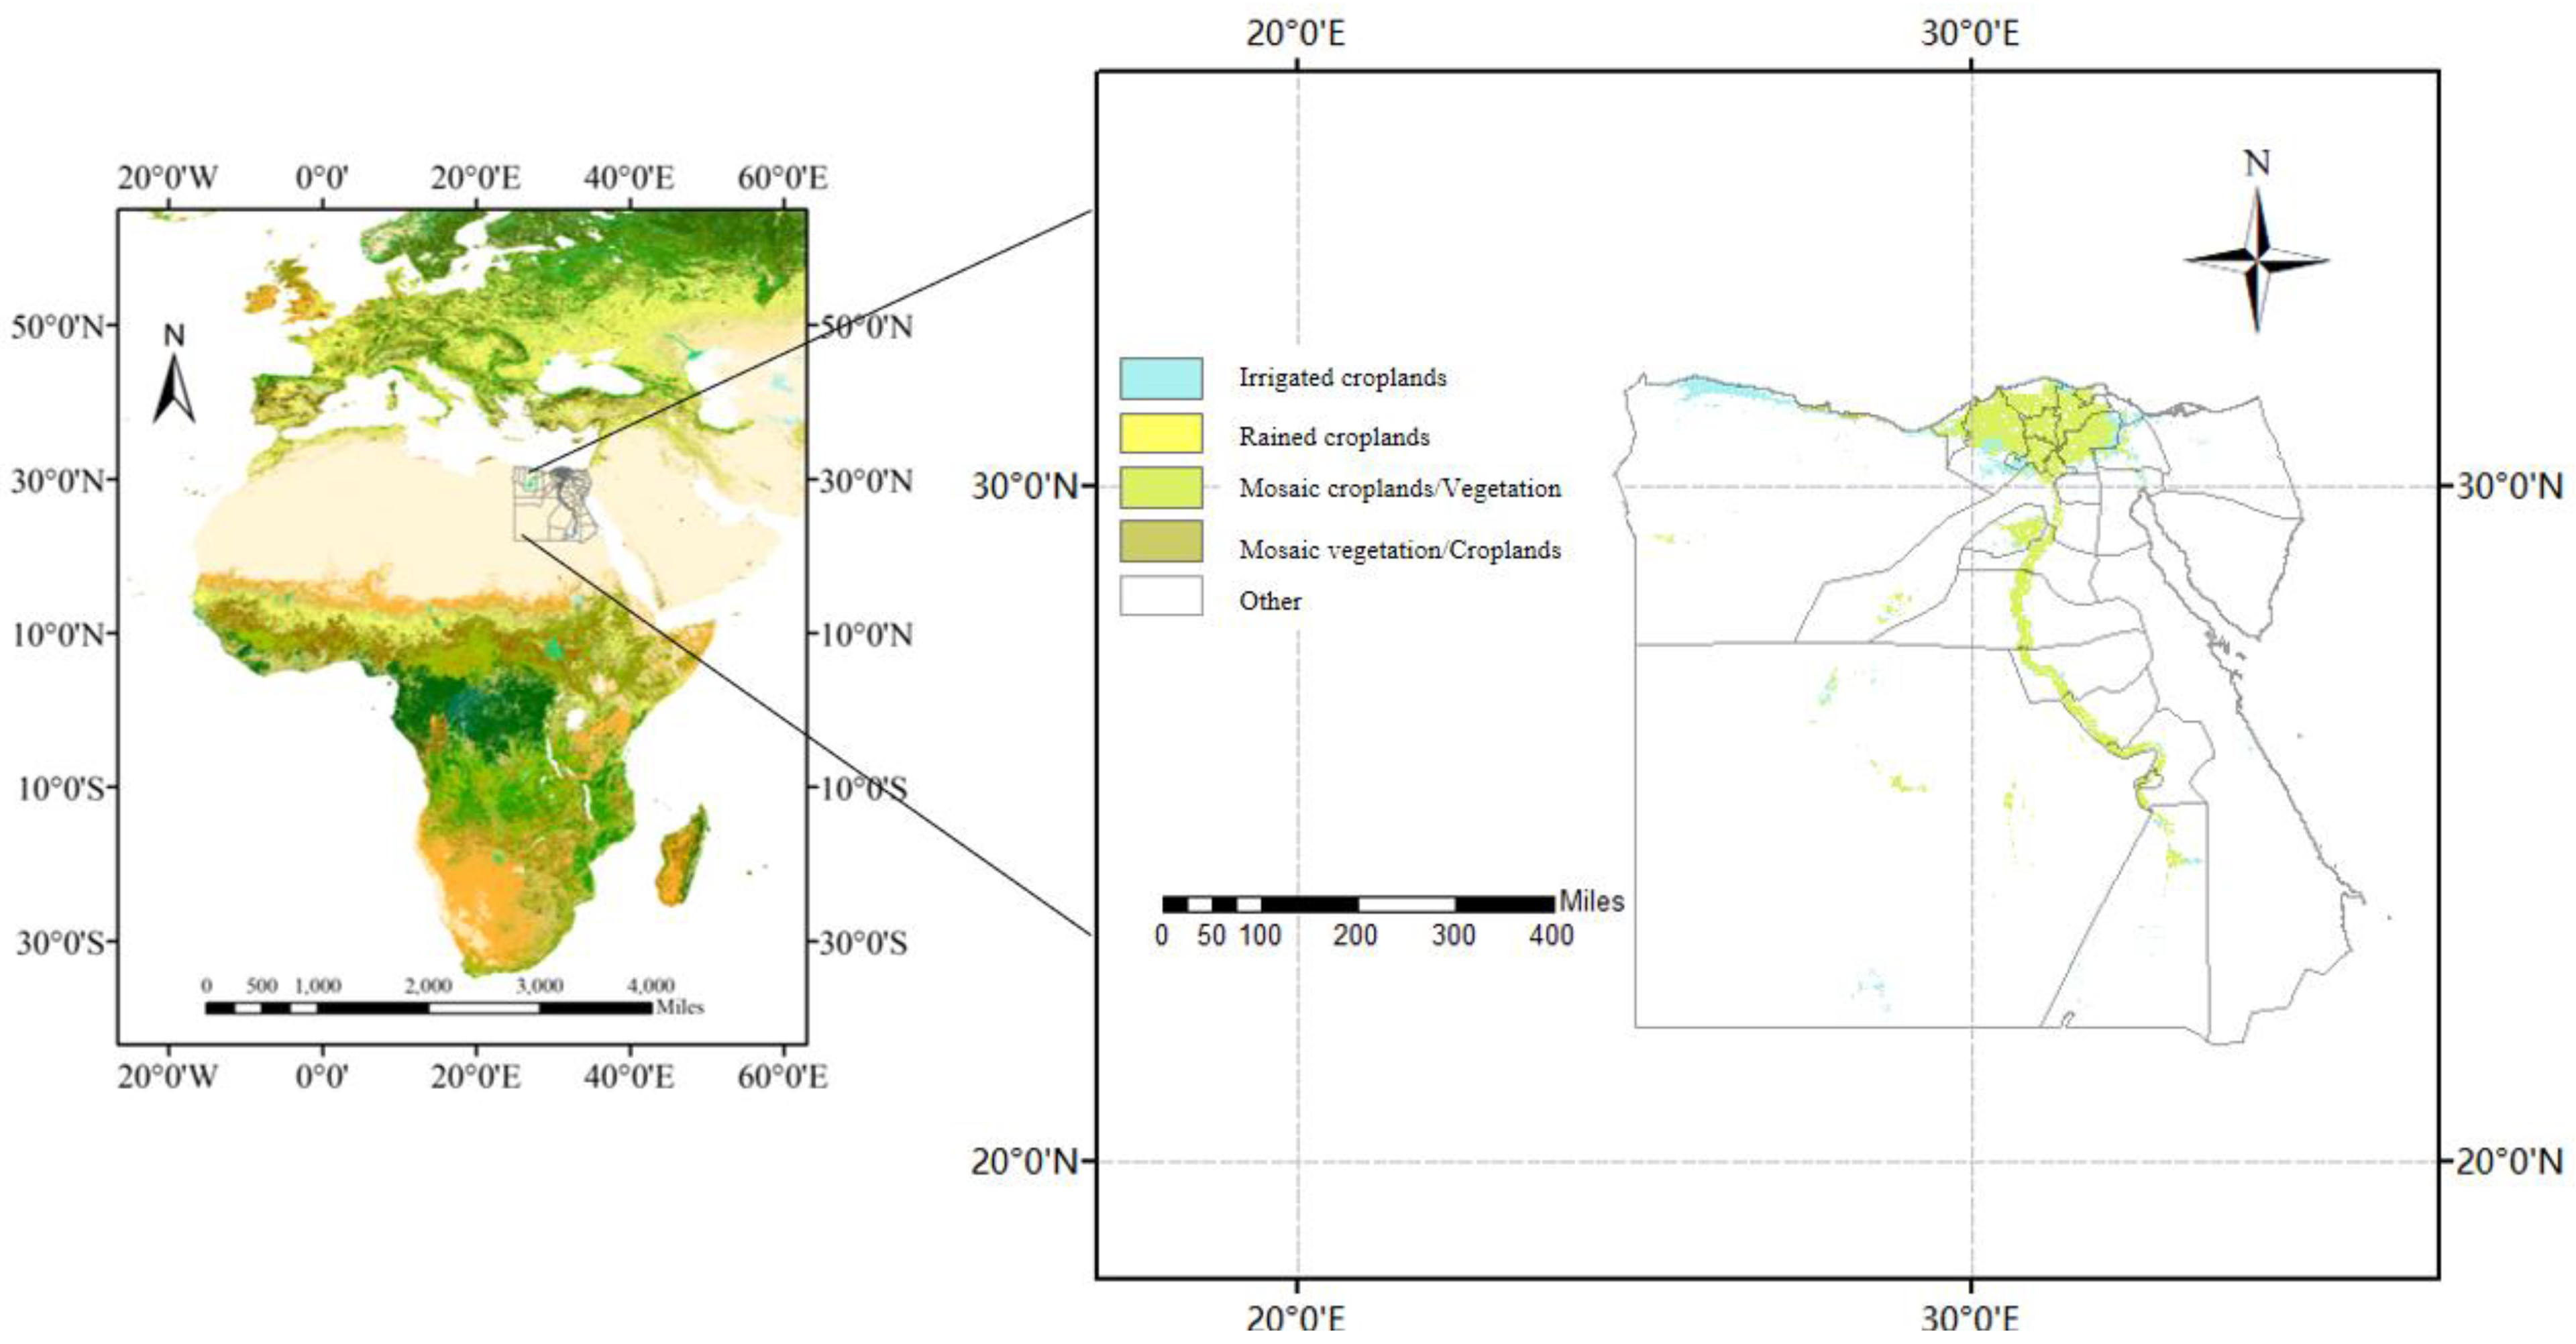
Egypt has about 3.8 million hectares of arable land available for cultivation [7], which is mainly located in the Nile River Delta and the narrow Nile River Valley, as shown in Figure 1. There are two agricultural seasons in Egypt, one for winter and another for summer crops [33]. Major field crops include rice, maize, wheat, cotton, and sugarcane [34]. In general, the cultivated area and food yields are much higher in Lower Egypt, especially for wheat, rice, maize, clover, cotton, fruits, citrus, potato, sugar beet, and tomato. Upper Egypt’s yields of wheat, sugar cane, sorghum, vegetables, tomato, and onion are also relatively high [35,36].
2.2. Datasets
2.2.1. Sentinel-1 Data
Since cash crops and food crops are difficult to distinguish from each other from a single optical image such as the Sentinel-2 satellite image, long time-series of optical images should be adopted to distinguish them. However, optical images are easily affected by weather and cloud cover, resulting in poor quality of some data which thus cannot be used. Compared to optical satellites, synthetic aperture radar (SAR) satellites can produce high-quality microwave images in all-day and all-weather conditions. Thus, long time-series SAR images have great potential in classifying cropland and analyzing the area of cropland change. Sentinel-1 is a C-band SAR equipped with twin polar-orbiting satellites, with a repeat cycle of 12 days [37]. Its single look complex (SLC) data (downloaded from https://asf.alaska.edu/, accessed on 12 January 2021) were adopted in this study and their main characteristics are given in Table 1.
2.2.2. Landsat Data
Since Sentinel-1 was launched in 2014, we chose Landsat 7 data to obtain Egypt’s crop distribution map in 2010, because Landsat 7 can provide a precise assessment of the presence and amount of different land cover types including croplands, forests, and wetlands. Landsat 7 was launched on 15 April 1999 and overpasses every Earth location every 16 days [38]. Its Level-1 data (downloaded from https://earthexplorer.usgs.gov/, accessed on 12 January 2021) were used in this study and their main characteristics are provided in Table 2.
As shown in Table 2, the observation date was selected from March to May in 2010, which can be divided into six periods in terms of the repeat cycle of Landsat 7, and 24 images were acquired. It is worth mentioning here that four Landsat 7 images should be used to cover the whole arable land of Egypt in one observation period. Cloud cover is a severe problem in optical images because it also leads to cloud shadow emerging [39]. In our study, the Landsat 7 images with cloud coverage of more than 25% were discarded first. Then, we assessed the quality of remained images over the area of interest. If cloud shadow and unclear area in an image covered more than 20% of the area of interest, the whole image was discarded. Furthermore, if an image in one period was discarded, the other three images in the same period should also be discarded to ensure the integrity of the whole study area. The final number of available Landsat 7 images used for classification is sixteen corresponding to four periods, and the total number of discarded images is eight corresponding to two periods.
2.2.3. Land Cover Data
To reduce the computational time, the land cover data were adopted to provide a general distribution map of arable land in Egypt, and then the classification of cash and grain crops was conducted based on Sentinel-1 and Landsat 7 data. In this study, both GlobeLand 30 and GlobCover were adopted. Specifically, GlobeLand 30 developed by China is a 30 m global land cover data product [40], and we used its 2010 and 2020 versions (downloaded from http://www.globallandcover.com/, accessed on 12 January 2021) to obtain the distribution maps of arable land in 2010 and 2020, respectively. Similarly, Globcover developed by the European Space Agency is a 300 m global land cover data product and is freely distributed in the Geotiff format [41]. We used its 2015 version (downloaded from https://www.esa.int/ESA_Multimedia/Images/2018/09/2015_global_land_cover_map, accessed on 12 January 2021) to obtain the distribution map of arable land in 2015.
2.2.4. Meteorological Data
Crop yield is significantly influenced by weather conditions; therefore, the meteorological data provided by a special software named “WheatA” were used to obtain meteorological data on parameters such as monthly temperature, precipitation, and solar radiation intensity. This software (downloaded from http://www.wheata.cn/, accessed on 1 May 2021) collects observation data from the International Meteorological Data Center of NOAA Satellite and Information Services, as well as from weather stations in each country, and can provide daily/monthly/yearly global meteorological data for the agricultural industry. Since this software only provides meteorological data from 18 weather stations in Egypt, the Kriging interpolation method provided by the ArcGIS software was adopted to obtain the required meteorological data over the study area. This is due to the fact that there are few meteorological stations in Egypt and we have collected meteorological data from weather stations near the cultivated land as much as possible. On the other hand, Egypt’s cultivated land is distributed on both sides of the Delta and the Nile, with a small latitude span and limited climate change. Therefore, these meteorological data collected from 18 weather stations can generally reflect the climatic conditions of Egypt’s cultivated land.
2.2.5. Normalized Difference Vegetation Index Data
Besides weather conditions, crop yield is also influenced by the growth status of crops. Global MOD13A3 data are provided every month at a 1 km spatial resolution as a gridded Level-3 product in the Sinusoidal projection. Here, the NDVI layer imagery produced from global MOD13A3 data (downloaded from https://earthdata.nasa.gov/search?q=mod17a3, accessed on 1 May 2021) was used to monitor vegetation and crop condition.
2.2.6. Statistics Data
In this study, various statistical data were used to determine the following indicators in the evaluation of food security: Egyptian per capita food consumption, the malnutrition rate, per capita daily protein and fat weight, per unit area water consumption, per unit area nitrogen fertilizer, and the percentage of Egyptians suffering from food insecurity. In addition, statistical data were adopted to assess the estimation accuracy of grain crop yield by the proposed model. All statistical data used were downloaded from the official website of the Food and Agriculture Organization (FAO), i.e., https://www.fao.org/home/en/ (accessed on 1 June 2021). It is worth mentioning here that several indicators could not be obtained in 2020 because of a lack of related statistical data, i.e., per capita food consumption and per capita daily protein and fat weight. To overcome this, we instead used statistical data acquired in 2019 to determine these indicators in 2020, because these data have not changed much over adjacent years.
3. Methodology
3.1. Crop Classification
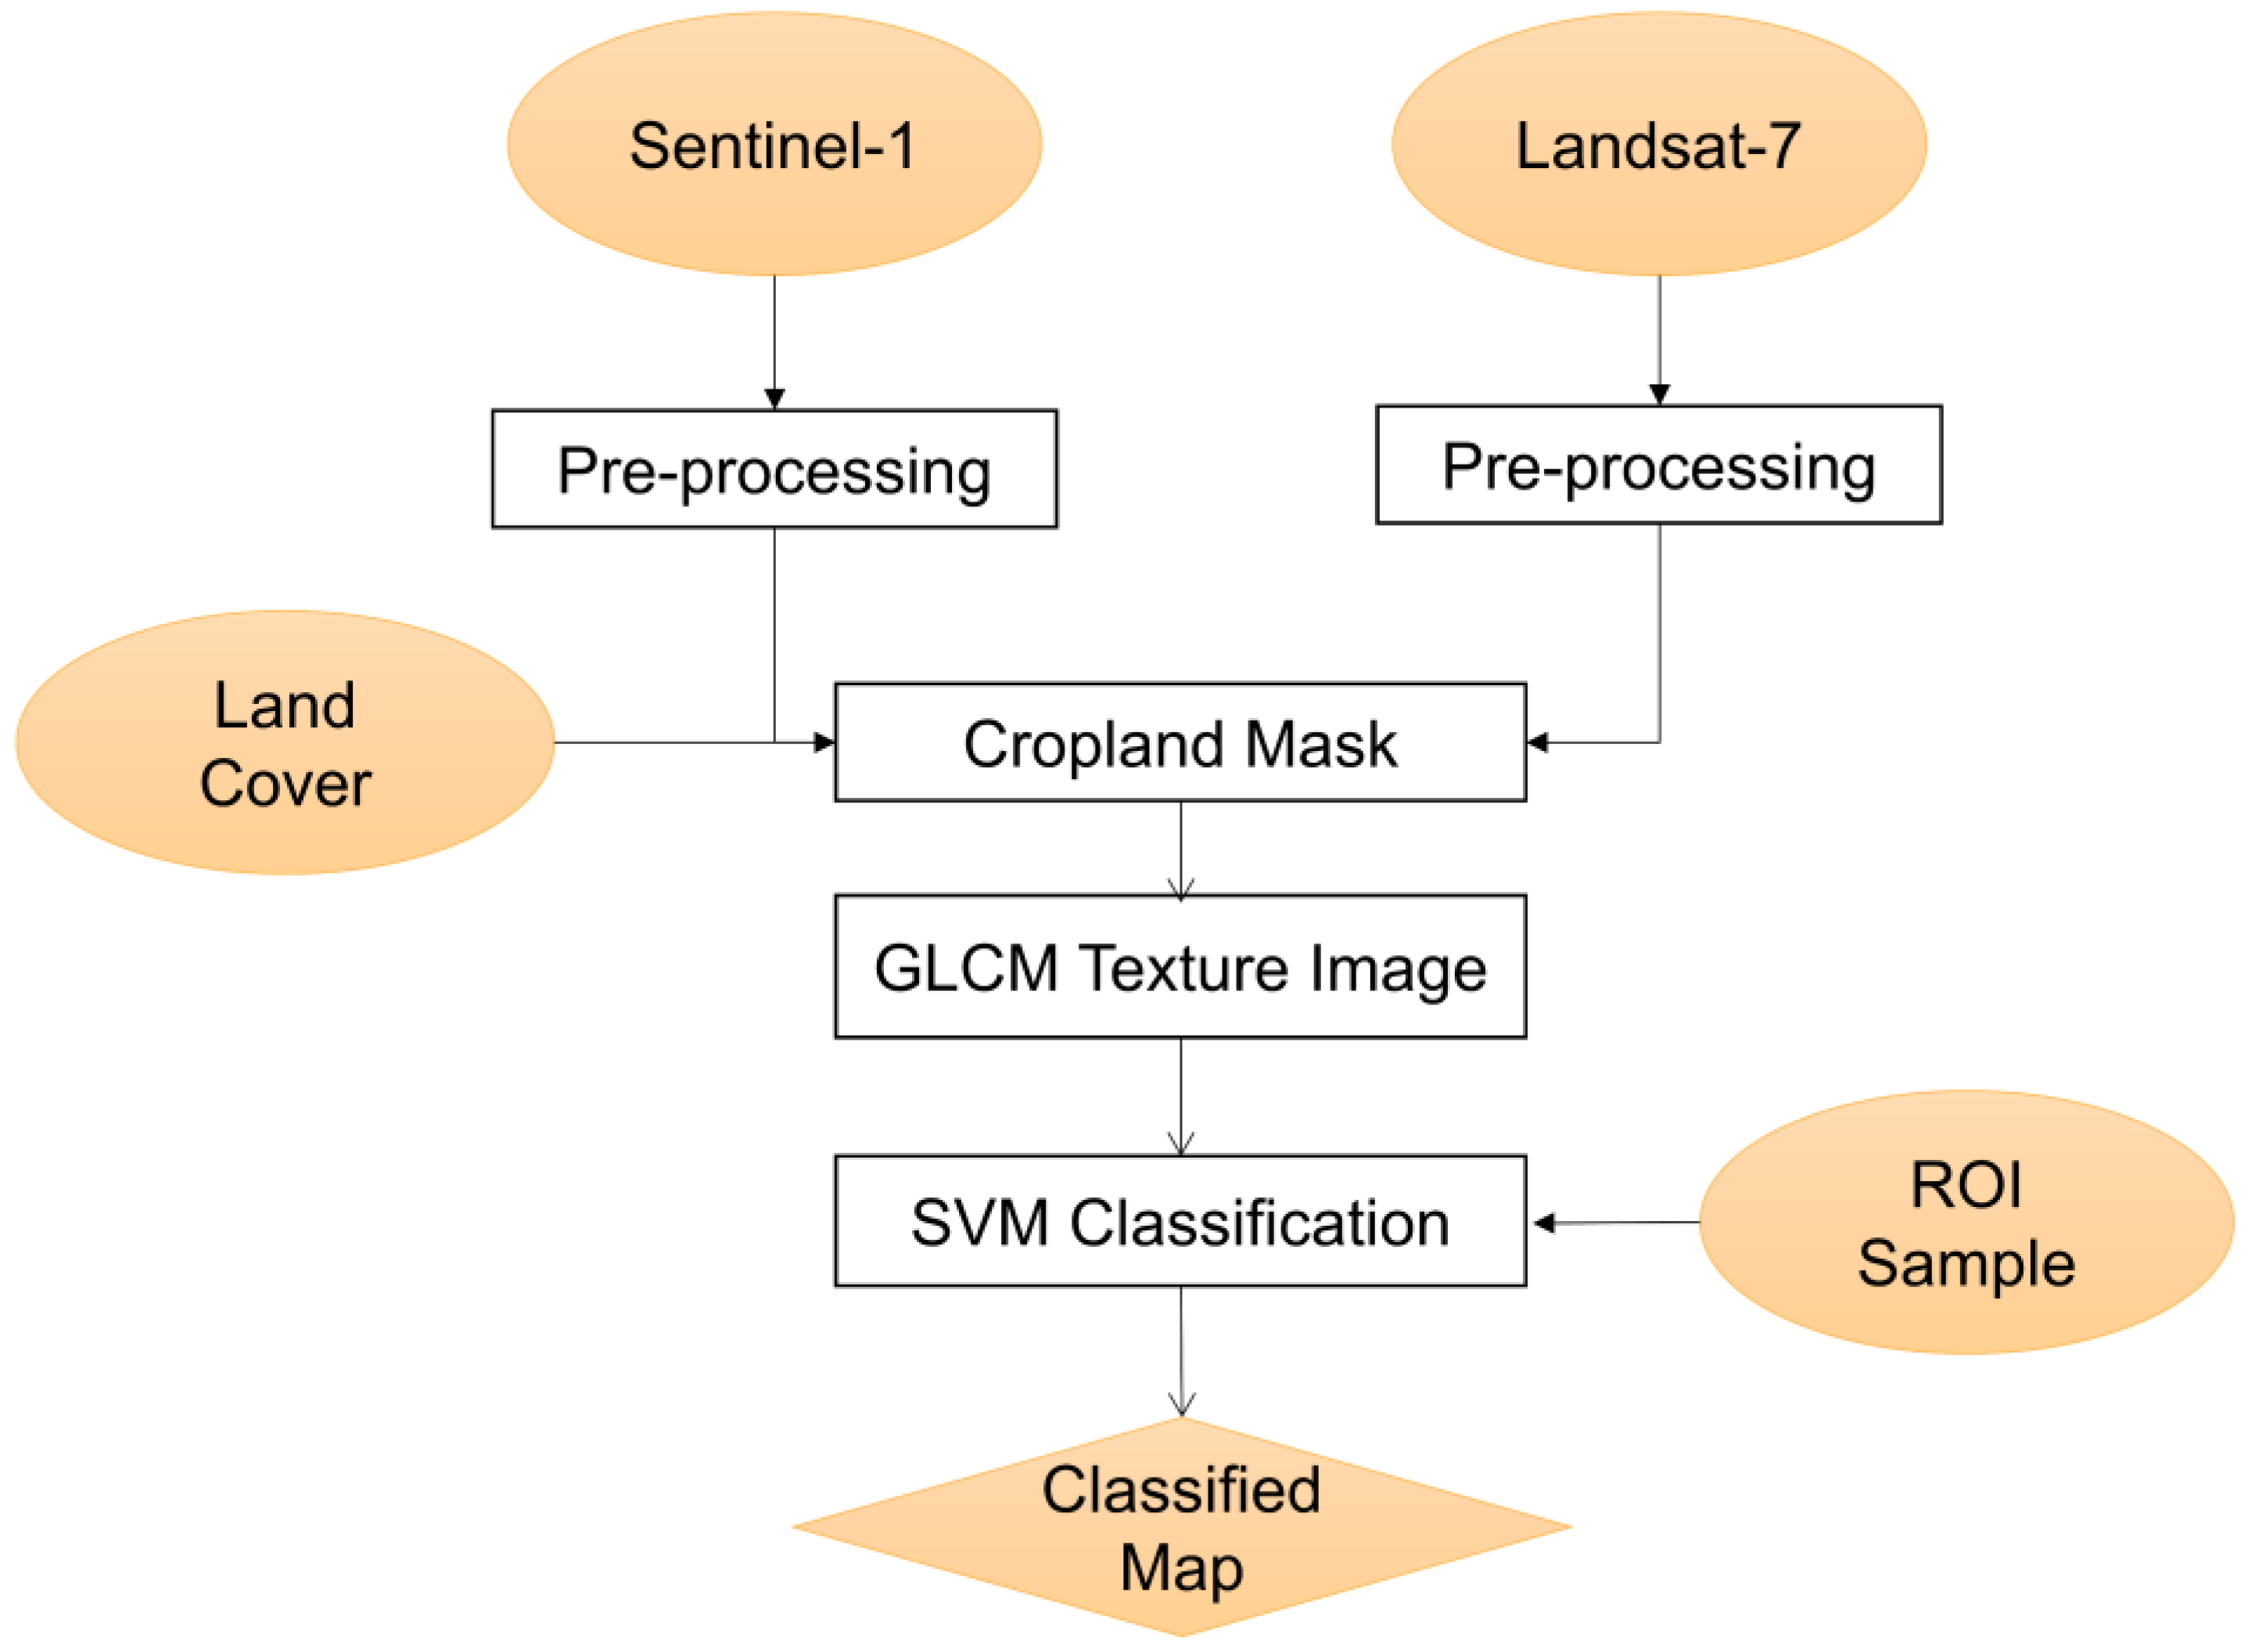
As mentioned earlier, to reduce computational time, the land cover data were adopted to provide a general distribution map of arable land in Egypt. Based on this map, texture features were first calculated and extracted from the Sentinel-1 or Landsat 7 data using the gray-level co-occurrence matrix (GLCM), similar to that described in [42,43] where Landsat and Sentinel-1 satellite data were used to classify crops in a small-scale farm in Zimbabwe and the overall classification accuracy higher than 80% was achieved using the GLCM texture features. Then, arable land was further classified into two kinds of regions used to grow grain and cash crops, respectively, by using support vector machine (SVM). Note that we only need to extract arable land used to grow grain to further predict grain yield. Although the crop classification accuracy achieved with SVM is worse than other methods such as the convolution neural network (CNN), SVM was selected in this study. The reasons are two-fold. Firstly, the crop classification accuracy achieved with SVM can up to 0.8375 [44], which can meet the requirements of this study. Secondly, only about 800 samples were obtained in this study. This means that the number of samples is very small at the national level. If CNN is adopted in this case, not only will overfitting occur, but also the space and time complexities will be much larger compared with the case of SVM. A flowchart of crop classification based on the GLCM texture feature is shown in Figure 2, and each step is described below.
3.1.1. Preprocessing of Sentinel-1 and Landsat 7 Data
Before use, Sentinel-1 SLC data were preprocessed which includes radiometric calibration carried out by calculating the normalized radar cross-section coefficient, thermal noise removal, and geometric terrain correction using the Shuttle Radar Topography Mission (SRTM) Digital Elevation Model (DEM) [45]. Note that, the preprocessing of Sentinel-1 SLC data did not include the speckle noise filtering, because the speckle noise filtering can lower the classification accuracy [42]. As for Landsat 7 data, its preprocessing mainly includes radiometric calibration and atmospheric correction. Here, the atmospheric correction is composed of two major steps, i.e., parameter estimation and surface reflectance retrieval.
3.1.2. Sample Selection
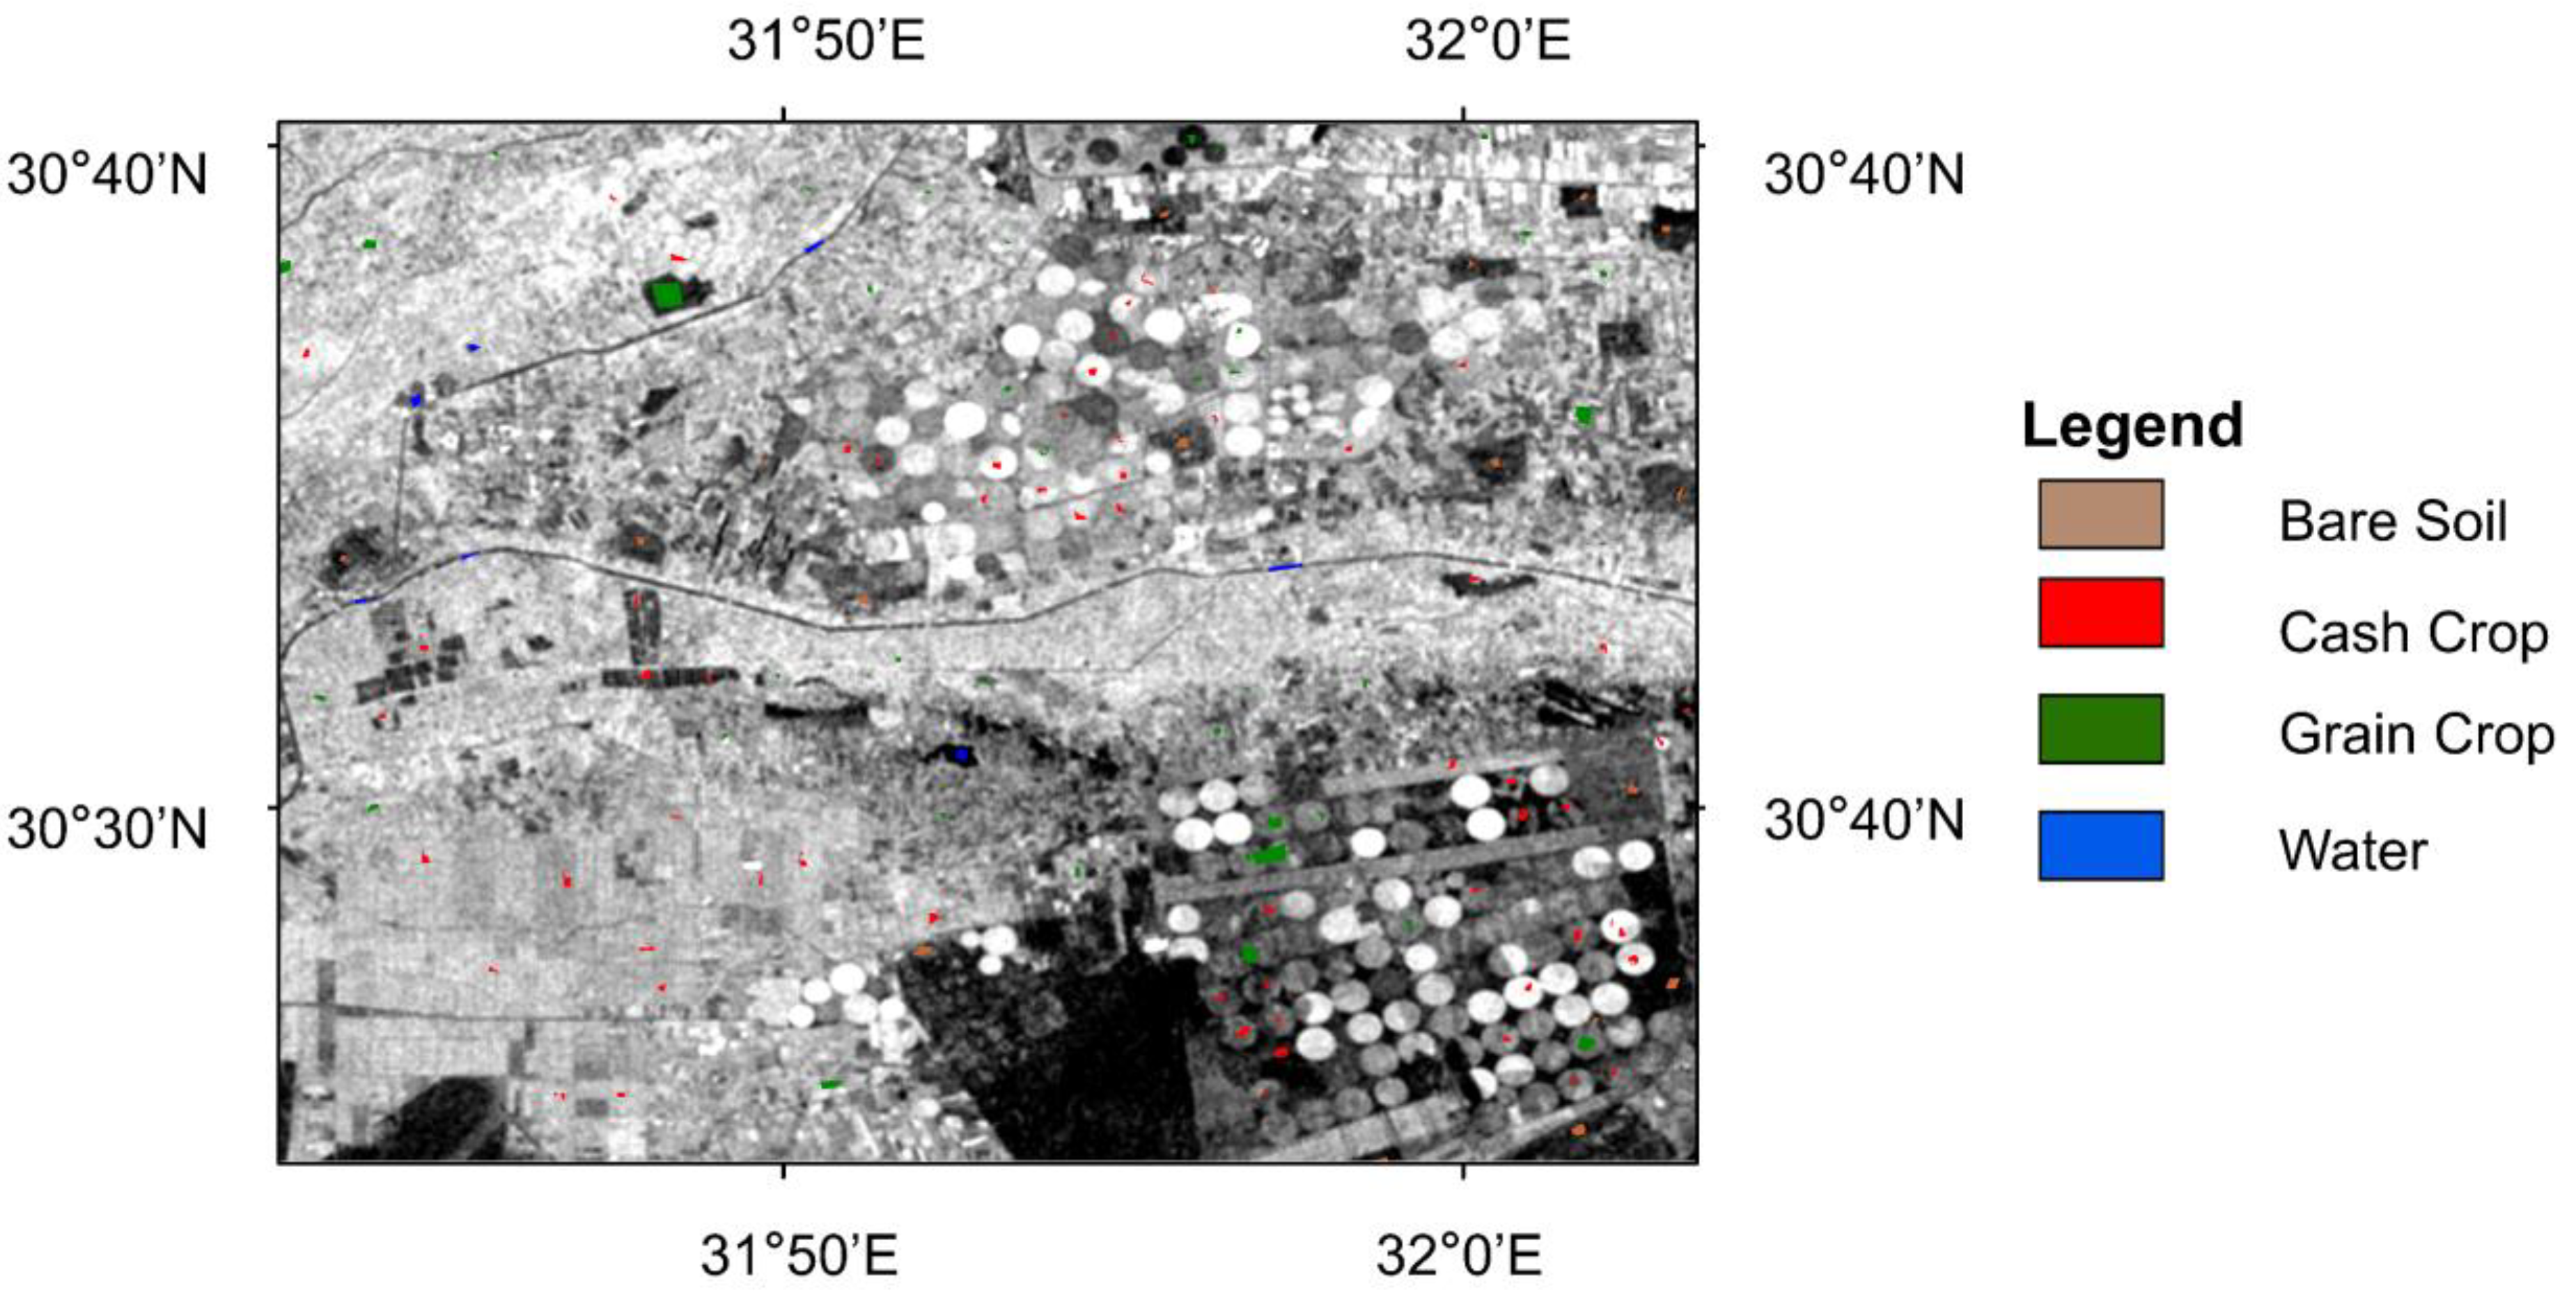
Regarding grain crop in Egypt, wheat is planted in November and harvested in May, and maize and rice are planted generally in June and harvested in September [46]. In contrast, regarding cash crops in Egypt, cotton is planted in March and harvested in September. According to the unique phenology of each crop, corresponding samples were selected for grain and cash crops. In order to improve the training accuracy, samples are polygons that contain multiple pixels; the principle of sample establishment is to evenly distribute samples as far as possible on the premise that the ground object category can be accurately judged. Each polygon contains only one ground object, and the number of pixels is between 25 and 100. This ensures that a variety of pixels with small differences are covered in samples of the same category. In practical operation, more than 800 samples were first labeled in historical imagery acquired over Egypt in 2010, 2015, and 2020. Note that, historical imageries were provided by Google Earth Pro Desktop, and the selected samples contain the polygon of various ground features such as bare soil, water, cash, and grain crops. According to the principle of sample establishment, the number of polygon samples of different categories is related to the total area of classes. Then, one-half of the sample polygons were taken for training and the other half of the feature polygons were used for testing. Division according to polygons rather than pixels is to avoid over-fitting. Figure 3 shows some samples selected from the Google Earth images, overlapped on the GLCM-based texture feature map according to their geographic coordinates. Here, the GLCM-based texture feature map was derived from Sentinel-1 data.
3.1.3. Extraction of Texture Features from GLCM
The texture shows the intensity variations in an image and can be a valuable tool in improving land cover classification accuracy. Texture features extract information from neighboring grey pixels, which is beneficial to describe the distinctive features of various crop types in arable fields [47,48]. Several texture features can be computed from the GLCM matrix. Each element value of the GLCM is calculated as follows:
where is the frequency of the double element point, one of which is the pixel grayscale value i, another pixel grayscale value of j, and the adjacent distance d to in direction.
Moreover, up to seven GLCM textural features can be further derived from GLCM matrix, i.e., contrast, dissimilarity, homogeneity, angular second moment, entropy, GLCM mean, and variance. In this study, GLCM mean texture features were used because they can achieve higher accuracy for SAR image classification than other GLCM textural features, as described by Chen et al. [42]. GLCM mean can be calculated by:
In addition, as described in [42], bigger window sizes can produce smoother texture feature images and achieve higher classification accuracy. When performing the calculation of GLCM, the general distance was set as 1. At the same time, all angles calculated every 45 degrees were tried and averaged, and the window sizes were set as 11 × 11 in this study after a comparison with other window sizes.
3.1.4. Classification and Post-Classification Processing
According to the unique crop phenology for each crop described in Section 3.1.2, crops in Egypt can be classified into cash and grain crops based on the GLCM mean texture features, which were extracted from the Sentinel-1 or Landsat 7 data acquired in different months.
SVM is an extensively used non-parametric statistical machine learning algorithm. It has many advantages such as being fast and possessing a satisfactory capability to deal with crop classification problems [49,50,51]. Therefore, the SVM classification method was implemented for crop discrimination in this study. In practical operation, the texture images created from the Sentinel-1 or Landsat 7 images along with the selected samples were used as the input of the SVM algorithm. The kernel function of SVM is radial basis function, and the gamma in kernel function parameter needs to be set. This value is a floating-point data greater than zero. By default, it is the reciprocal of the number of bands of the input image. Other parameters such as c (penalty coefficient of error item) adopt default values.
After classification, we clumped the classes and used sieve classes to solve the problem of isolated pixels occurring in classification images.
3.2. Estimation of Grain Yield
In this study, the Carnegie–Ames–Stanford approach (CASA) model was first used to estimate the net primary production (NPP) on a monthly time scale. Then, the grain yield was calculated according to the relationship between NPP and grain yield.
Before using the CASA model to estimate NPP, the meteorological data described in Section 2.2.4 were loaded into ArcGIS software to perform Kriging interpolation (parameter selecting default value), which is the method of interpolation deriving from regionalized variable theory. It depends on expressing spatial variation of the property in terms of the variogram, and it minimizes the prediction errors, which are themselves estimated [52]. Then, we obtain continuous raster data from across Egypt. Following data interpolation, all data input to the CASA model were expressed in the World Geodetic System (WGS-84) coordinate system using the Universal Transverse Mercator (UTM) projection, and the size of the pixels in a raster was 1 km × 1 km.
3.2.1. Estimation of NPP Using the CASA Model
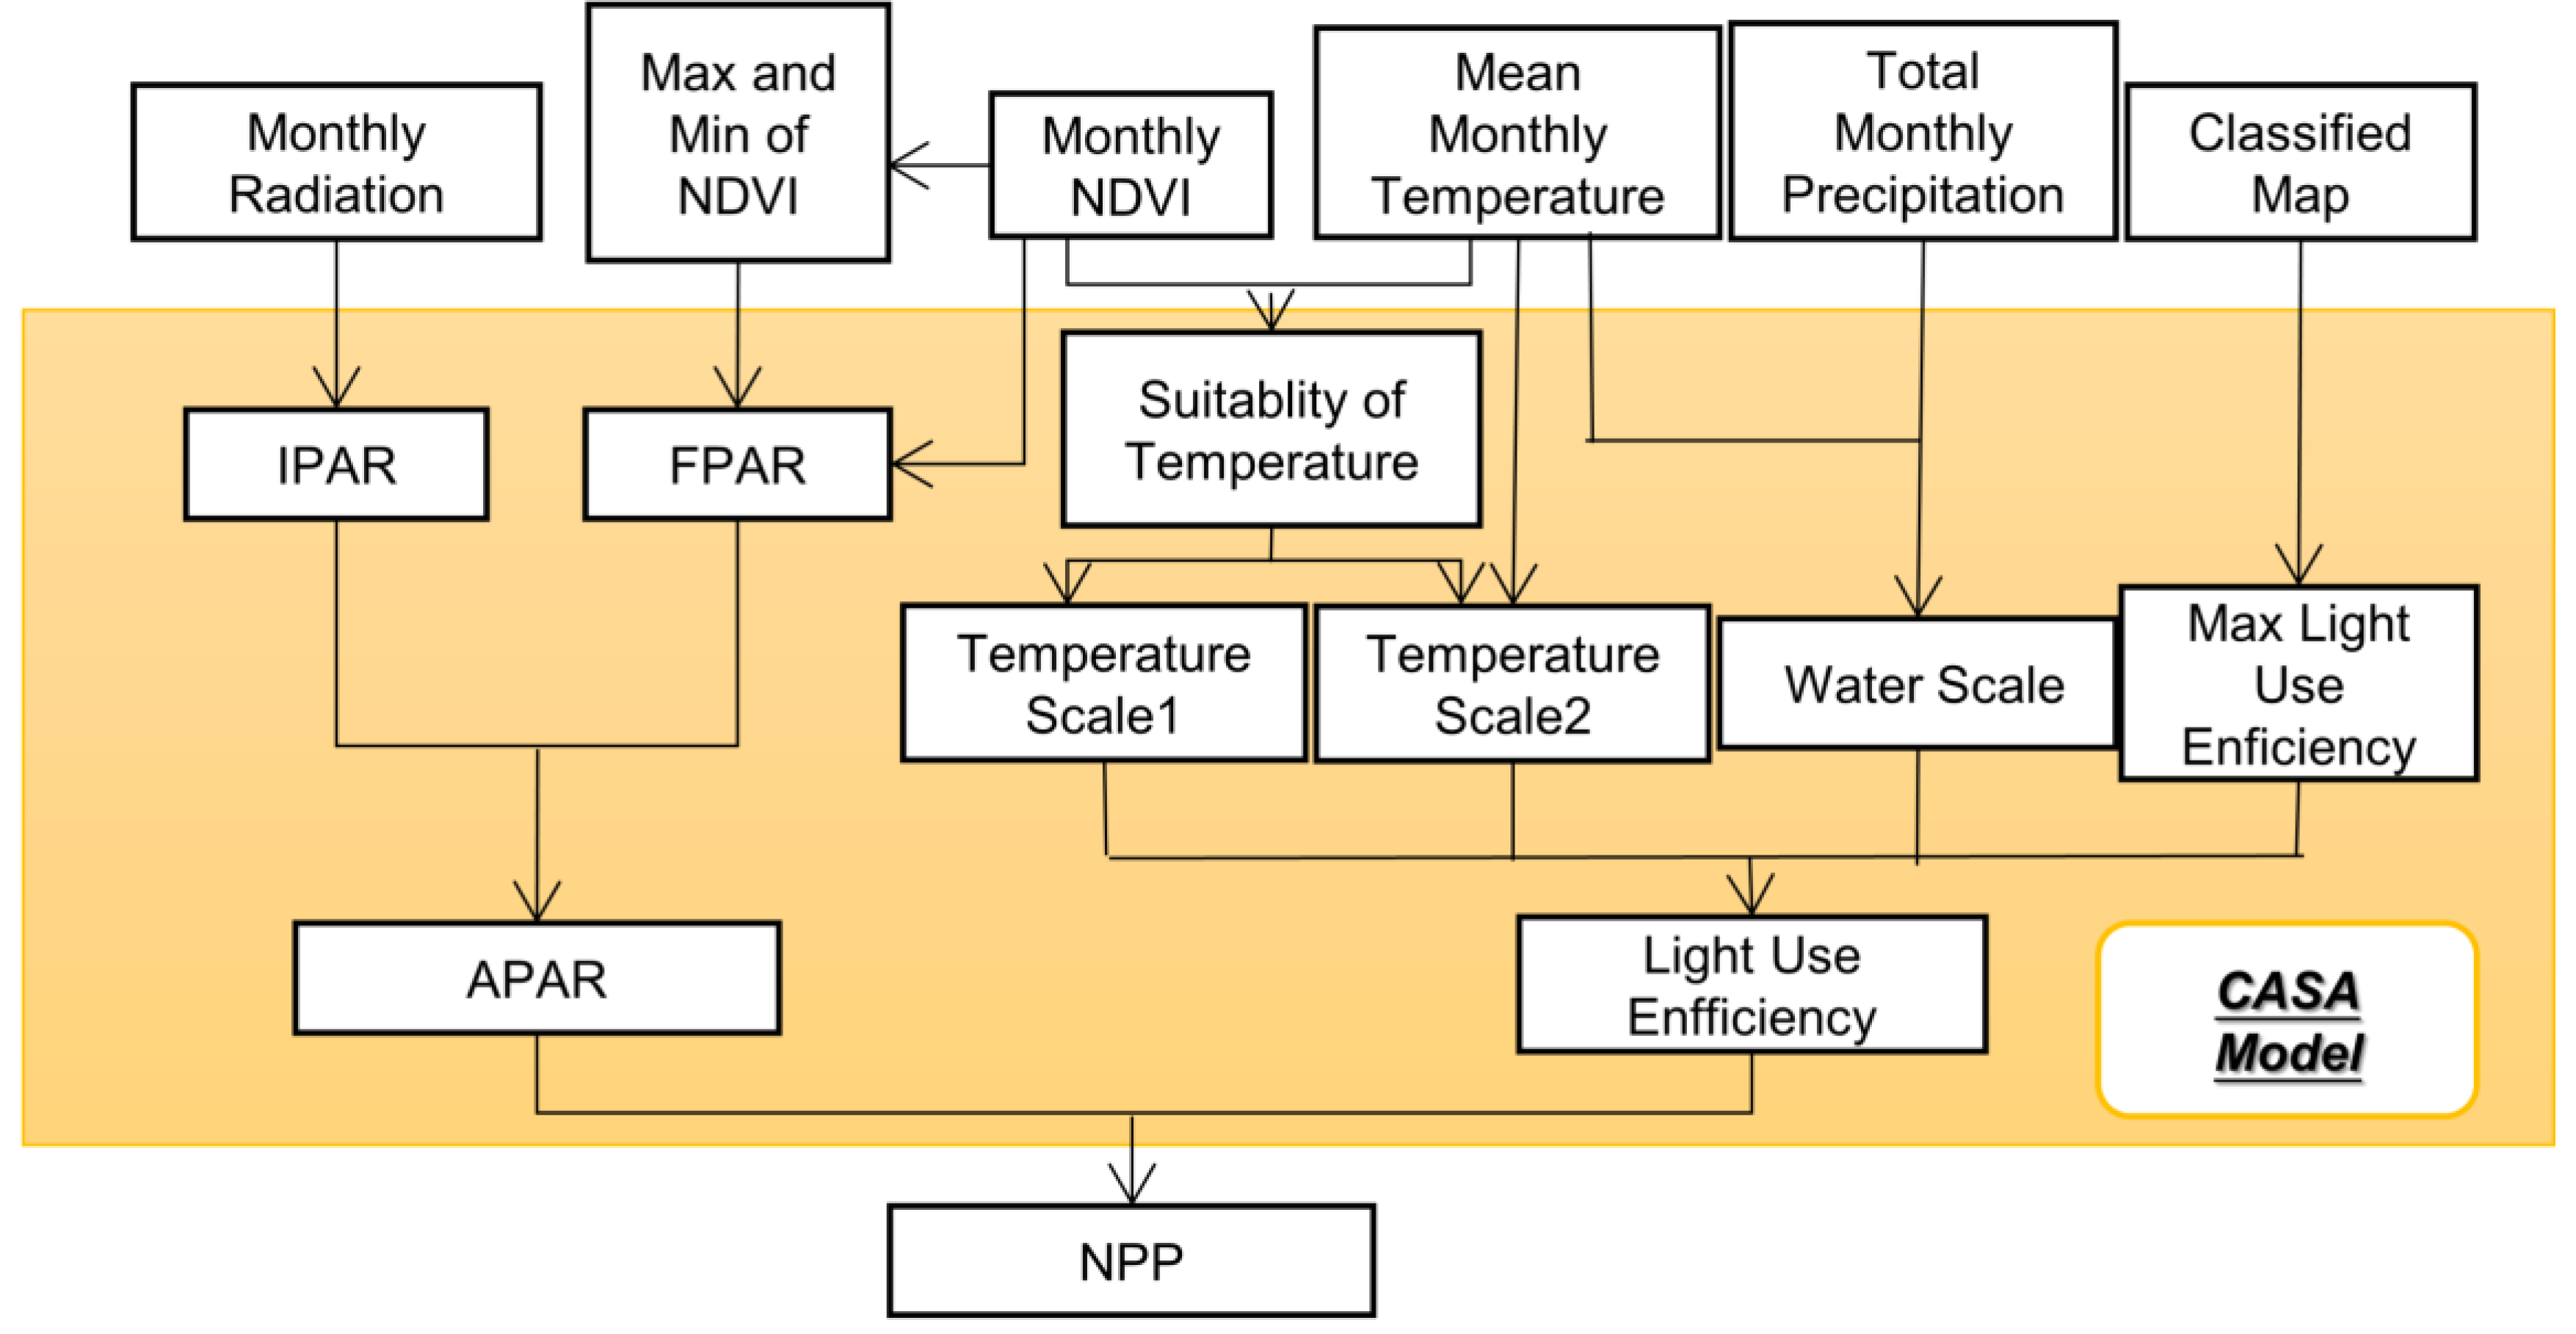
NPP is defined as the overall amount of organic matter accumulated by plants in the primary production stage per unit time and unit area. It is determined by factors such as solar energy, temperature, and precipitation, and is positively influenced by living organisms such as microbial biomass. CASA is a classical parameter model and estimates NPP by focusing on the driving role of the absorbed photosynthetically active radiation (APAR) and the light use efficiency absorbed by vegetation [53]. Different from other prediction models that require fine biochemical parameters, the CASA model only needs to input land cover type, monthly NDVI value, monthly cumulative precipitation, monthly average temperature, and solar radiation’s monthly cumulative value. The parameters that need to be manually input are also introduced in [54], which are more suitable for estimating NPP in a wider range. A flowchart of estimating NPP using the CASA model is shown in Figure 4.
In practical operation, the distribution map for grain crops in Egypt, the monthly NDVI average value, the monthly average temperature, the monthly precipitation, and the monthly solar radiation intensity are input to the CASA model to calculate the annual NPP in Egypt.
3.2.2. Estimation of Grain Yield
Grain yield in Egypt mainly consists of the production of winter wheat, maize, and rice. After the estimation of NPP by the CASA model, we estimated the grain yield according to its relationship with NPP [55] and it can be written as:
where Y denotes the grain yield and its unit is t/ha and is the carbon-conversion coefficient. Since the carbon content of cereal is about 45%, the value of was set as 2.22 [56]. NPP is the cumulative net primary production of organic matter over the entire growing season of grain crop and was estimated using the CASA model. is the distribution coefficient of aboveground parts, and its value was set as 0.9. denotes the water-content coefficient during the storage period after harvest. Since the water-content coefficient of maize, wheat, and rice ranges from 13% to 14%, was set as 13.5%. HI represents the harvest index, and its value was set as 0.47 for the study area [57].
3.3. Food Security Evaluation
In terms of the food safety evaluation index released by the global food security initiative (GFSI) [58], we constructed a food security evaluation model involving four dimensions, i.e., quantity security, economic security, quality security, and resource security.
3.3.1. Quantity Security
Food quantity security focuses on increasing the quantity of food to ensure food supply capacity and to solve the problem of people’s “satisfaction”. Quantity security is the basis of food security and can be evaluated by the following four indices.
- (a)
- Per capita grain land. The area of grain land is the basis of food quantity security and was calculated in terms of the distribution map for grain crops and the total population of Egypt.
- (b)
- Per unit area grain yield. The grain yield per unit area indicates the development of agricultural science and technology and was calculated in terms of the distribution map for grain crops and the prediction of annual grain yield in Egypt.
- (c)
- Per capita food production. Generally speaking, a higher per capita food production indicates that food security is more stable, and it was calculated in terms of the prediction of annual grain yield and the total population of Egypt.
- (d)
- Fluctuation coefficient of grain production. Grain production is mainly influenced by natural, economic, and social factors such as markets and trade, and hence it usually exhibits certain fluctuations. The fluctuation coefficient of grain production is one of the most important factors in measuring the stability of grain production and can be calculated by [59]:where represents the current year’s grain yield and denotes the average value of the grain production of the previous year, the current year, and the next year.
3.3.2. Economic Security
Food economic security pays attention to investigating people’s economic access to food and the solution is that people can “afford” food. At the same time, it inspects domestic food production and supply capabilities, which are also food economic security indicators. Food economic security can be evaluated by the following three indices.
- (a)
- Grain self-sufficiency rate. The grain self-sufficiency rate represents how dependent a country is on food imports. A lower value of this index indicates that this country is more vulnerable to economic security.
- (b)
- The value of agricultural imports. A higher value of agricultural imports indicates that this country is more dependent on the international food market. In Egypt, large amounts of agricultural products are imported every year to meet the domestic food demand.
- (c)
- Per capita food consumption. A higher value of per capita food consumption indicates that the stability of food security is worse.
In this study, the aforementioned three indices were calculated in terms of both government fiscal expenditures and household consumer expenditures provided by the FAO to evaluate food economic security in Egypt.
3.3.3. Quality Security
After quantity security is achieved, quality security becomes a higher requirement for food security. Quality security means that people can obtain rich nutrition to satisfy their own needs, and people’s requirements for dietary diversity can be met. Food quality security can be evaluated by the following three indices.
- (a)
- Malnutrition rate. The malnutrition rate reflects the quality safety of a country’s food supply.
- (b)
- Per capita daily protein consumption weight. Protein is one of the important nutrients and more daily protein consumption corresponds to a higher food quality security.
- (c)
- Per capita daily fat consumption weight. The per capita daily fat consumption weight is usually negatively correlated with food quality safety.
In this study, the aforementioned three indices were obtained from the FAO website (https://www.fao.org/home/en/, accessed on 1 June 2021) and used to evaluate food quality security in Egypt.
3.3.4. Resource Security
Resource security concerns the consumption of fresh water and chemical fertilizers. A large area of Egypt is desert and precipitation is scarce. For a long time, food production in Egypt mainly relied on the excessive utilization of chemical fertilizers and groundwater to increase grain yield. However, this method can cause soil and water pollution, damage the environment and ecosystems, and threaten the security of food ecological resources. Resource security can be evaluated using the following two indices.
- (a)
- Per unit area water resource consumption. Water resources are vital to food production, and water consumption per unit area is negatively correlated with food security.
- (b)
- Per unit area nitrogen fertilizer consumption. Nitrogen fertilizer is of significance to agricultural production because it can contribute to increasing yields and reducing production costs, and the per unit area nitrogen fertilizer consumption is negatively correlated with food security.
3.3.5. Food Security Evaluation Model
To improve the comparability between different indices, the values of all indices were first normalized using the following two equations, and their dimensions and units were not further considered.
When the value of an index is positive, it was normalized by:
When the value of an index is negative, it was normalized by:
where represents the i-th term of the index j and and denote the maximum and minimum of the index j, respectively.
After data normalization, the weight of each index was obtained using the coefficient of variation. The standard formula for the coefficient of variation is expressed as:
where represents the coefficient of variation in the index j, denotes the standard deviation of the index j, and represents the average value of the index j.
The weight of each index can be calculated by:
where represents the weight of the index j and is the sum operator.
Following the calculation of the weight of each index, the total score F, which is used to evaluate the food security, was achieved by:
4. Results
4.1. Crop Classification in Egypt
Because crop classification was carried out at a national level, low-resolution satellite images were adopted to reduce computational time. Each pixel contains different crop types and cannot be fully distinguished. Therefore, images are simply divided into grain and cash crops based on phenological characteristics. Figure 5 shows the crop classification results from Egypt in 2010, 2015, and 2020. Based on the results, the arable area and its variation over different years can be identified. Furthermore, the accuracy of the crop classification results is given in Table 3, Table 4, Table 5 and Table 6 show the confusion matrix of crop classification. From Table 3, it can be seen that the value of overall accuracy (OA) and the Kappa coefficient were at the level of 0.7580 and 0.6341 in 2010, 0.8761 and 0.8138 in 2015, and 0.8244 and 0.7228 in 2020, respectively. From the experimental results, the classification accuracy of the radar data was found to be higher than that of the optical images. First, some optical data cannot be used due to cloud shielding and the spectral ground object reflection curve is not as complete as in radar. Second, from the perspective of the spectrum, the reflectance of different types of vegetation is similar, while the polarization characteristics of radar increase the differences between them (especially for special crops such as rice). This is also the reason why radar data are becoming increasingly popular in crop classification.
From the perspective of spatial distribution characteristics, it can be seen from Figure 5 that Egypt’s arable land in which grain crops grow is mainly concentrated in the Nile Delta plain. Here, the terrain is flat and densely populated, and there are numerous irrigation facilities to satisfy water demands for grain crops, especially rice. Figure 5 also shows that the arable land in which the cash crops grow is mainly located along the banks of the river Nile. Here, the weather is hot, dry, and suitable for the growth of cash crops such as cotton and fruits. Therefore, it can be found that the crop distribution maps shown in Figure 5 are consistent with the geography and climate of Egypt.
After statistical analysis of the spatial distribution map of arable area in Egypt, as shown in Figure 5, the cultivated land used to grow grain crops and the total arable land in 2010, 2015, and 2020 can be estimated and are given in Table 7. The statistical data, which were downloaded from the official website of the FAO, are also given in Table 7 for comparison. It can be found that the estimated and statistical results are in good agreement. Moreover, the cultivated area of grain crops in Egypt increased from 2010 to 2020, and its growth rate was higher than that of the total arable land.
4.2. Estimation of Grain Yield
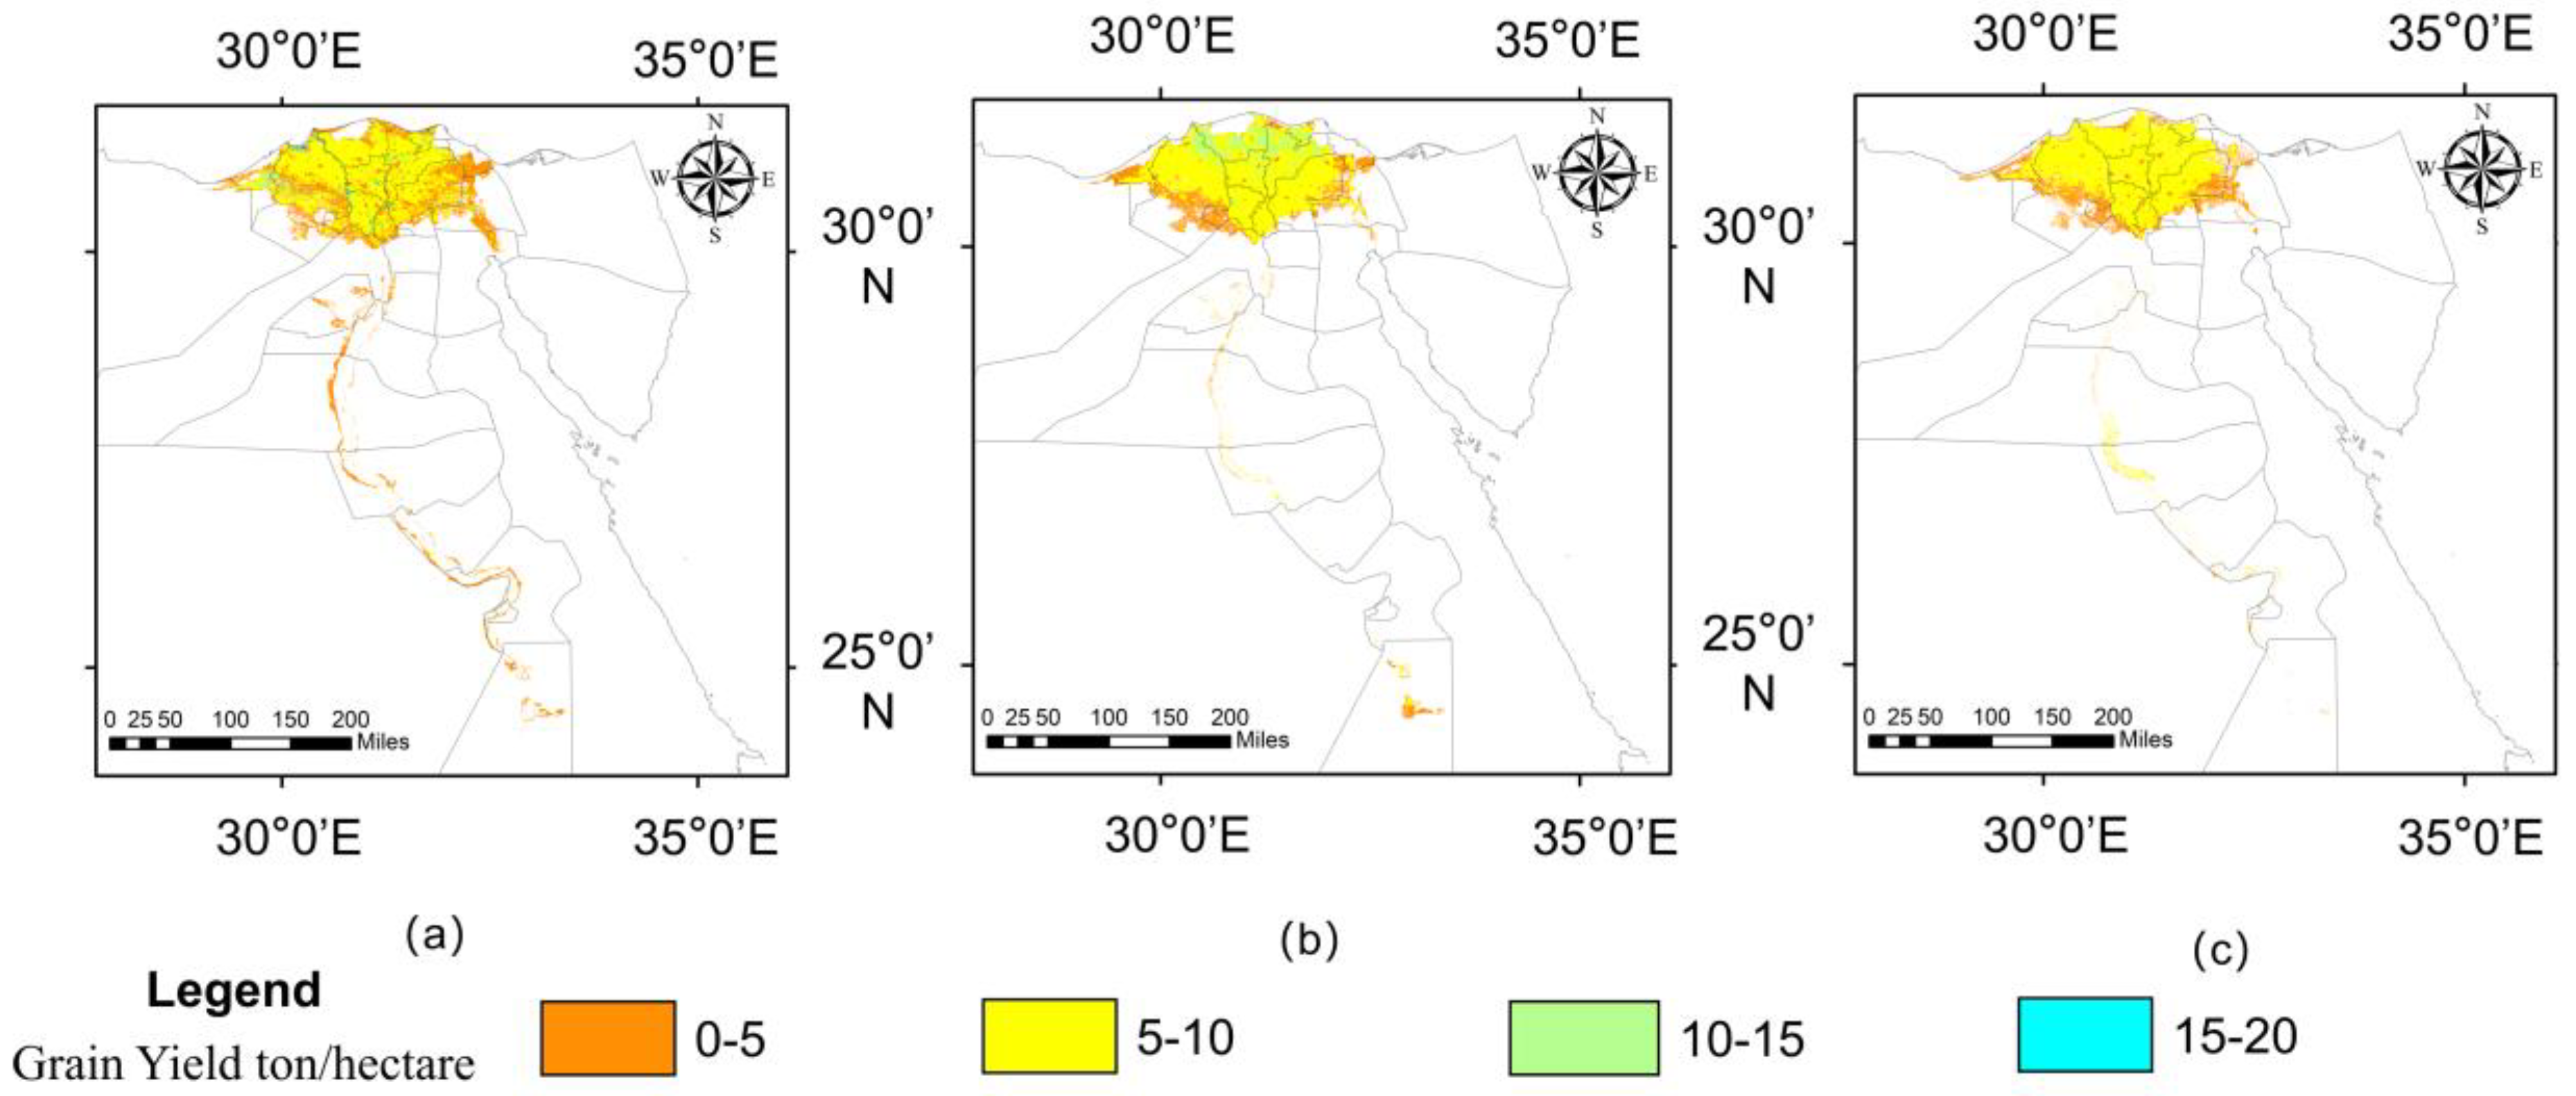
Using the methods described in Section 3.2, the total grain yields estimated in 2010, 2015, and 2020, respectively, are presented in Figure 6.
We can see from Figure 6 that although the total arable land increased from 2010 to 2020, the yield per unit area decreased, and the maximum yield per hectare dropped to 10 t/ha. Table 8 shows the specific values of total grain yield in 2010, 2015, and 2020, which were calculated in terms of Figure 6. Due to the lack of field measurement data, the statistical data listed in Table 8, which were downloaded from the official website of FAO, were used for comparison to evaluate the reliability of the estimated results. The error between the two results is small, i.e., about 5%. Taking into account the estimation of grain yield at the national level and some unpredictable factors such as pest insects, this error is in an acceptable range, and the final estimated results can be used to describe the trend of grain production in Egypt from 2010 to 2020. As shown in Table 8, the total grain yield experiences sustained growth from 2010 to 2020. This is mainly due to the increase in the cultivated area, as well as the increase in the grain yield per unit area. Compared with Table 7, it can be found that the growth rate of grain yield in 2020 was not as fast as that of the arable land. This may be due to the adjustments in the planting structure of grain crops, such as growing less rice to save water resources, as well as the decline in soil fertility and water quality.
4.3. Food Security Evaluation in Egypt
Using the method described in Section 3.3.5, both the weights of four dimensions and the weights of indices in each dimension can be obtained, as listed in Table 9.
Compared with resource security, the weights of quantity, economic, and quality securities are much higher, indicating that the Egyptian government attaches great importance to food quantity and economic and quality securities, and neglects resource security to a certain extent.
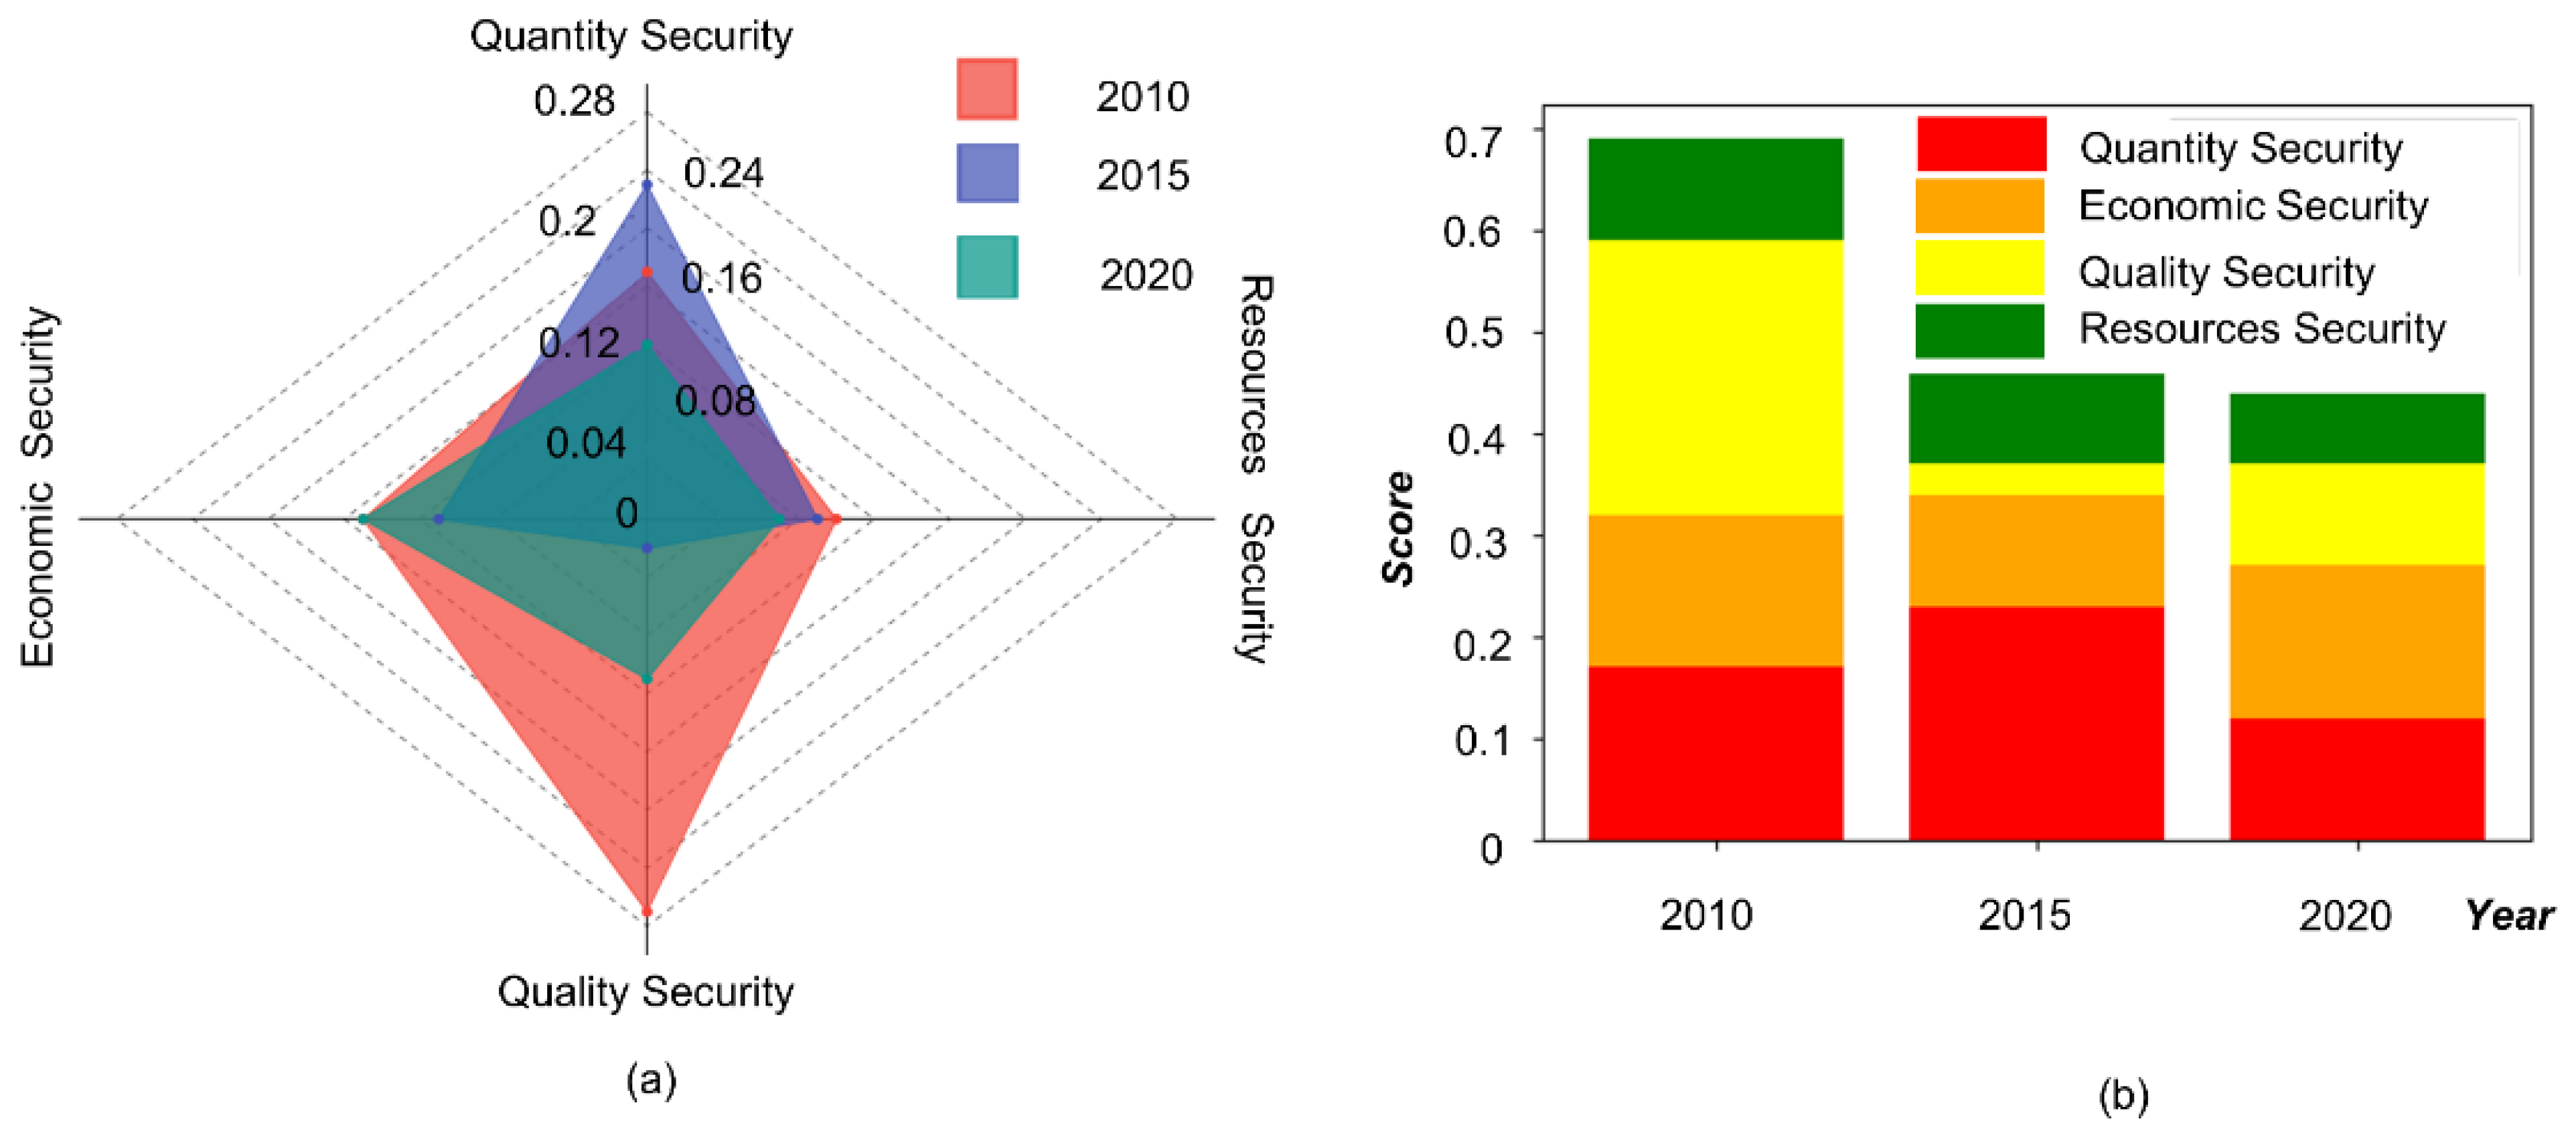
Figure 7 shows the Egyptian food security index and the security index of four dimensions from 2010 to 2020. As indicated by the overall food security index, the score was highest in 2010. After this year, the food security situation in Egypt gradually deteriorated, and a minimum score was achieved in 2020. However, comparing the score in 2015 with that in 2020, we found that the downward trend of the score slowed down. In addition, the statistical data provided by the FAO [60] show that the percentage of Egyptians suffering from food insecurity was approximately 15%, 25%, and 27% in 2010, 2015, and 2020, respectively. Therefore, the same variation in food security in Egypt can be found between the estimated results and FAO statistical data, which verifies the reliability of the evaluated results.
As shown in Figure 7, a significant fluctuation in food quantity security in Egypt can be observed, indicating that the unstableness of food production is the most prominent problem regarding food security in Egypt. Figure 7 also shows a minimum score of economic security in 2015, which means that the capacity in domestic food supply declined in this year, but it recovered in 2020. In contrast to quantity security, we found from Figure 7 that food quality security in Egypt degraded significantly from 2010 to 2020, especially in 2015. This means that Egypt has succeeded in increasing the supply of food at the national level but has achieved less in terms of addressing quality security. In addition, Figure 7 shows that resource security in Egypt continuously degraded from 2010 to 2020, maybe due to the lack of significant advances in agricultural science and technology. Therefore, this implies that large amounts of chemical fertilizer and groundwater have been used to increase grain yield and to ensure a stable food supply in Egypt.
5. Discussion
5.1. Factors Influencing Food Security in Egypt
Since our study is based on remote sensing techniques, the following factors, which influence food security in Egypt and can be derived from remote sensing data, are discussed.
One factor influencing Egypt’s food security is the natural environment, because this is the foundation of agricultural production [61]. Egypt is located in northeastern Africa and is largely covered by desert. Its agriculture and population are mainly concentrated at the narrow Nile River Valley and Delta, only about 4% of Egypt’s total land area. Although government land-reclamation projects have been performed to increase the amount of cultivated land in recent years, the insufficient arable land is still a large problem for Egypt’s grain production. In addition, Egypt mainly has a desert climate, which is hot and dry all year round. Only on the Mediterranean coast is there a mild Mediterranean climate. As a result, the average annual rainfall in Egypt is only 200 mm, and most of the country receives no rainfall all year round, which seriously limits agricultural irrigation [62].
Another factor influencing Egypt’s food security is urbanization. Firstly, with the development of urbanization, more agricultural land has been occupied for urban uses, and hence the total arable land is continuously being reduced. In addition, more farmers have left the countryside because of the superior living environment in cities. The decline in the rural population has seriously affected grain production in Egypt. In addition, over-exploitation of groundwater sources for urban uses also imposes a negative influence on agricultural irrigation in Egypt.
5.2. Several Suggestions to Ensure Food Security in Egypt
Considering the two factors discussed above, the following two suggestions are provided to improve food security in Egypt.
Urbanization and other uses of cultivated land should be strictly controlled. Cultivated land is the foundation of agricultural production, and hence protecting and expanding cultivated land is the first step to ensuring food security. Urbanization and industrialization are becoming a serious threat to cultivated land in Egypt and the government should pay attention to this.
Advanced agriculture technology should be adopted to enhance per unit yield and increase the amount of cultivated land. On the one hand, government land-reclamation projects should continue to be implemented to reclaim more desert for use as arable land for special grain crops. On the other hand, new and excellent crop strains can be bred or imported to improve crop production capacity. Furthermore, the Egyptian government should increase policy support and subsidies for the improvement of agricultural technology and the purchase of advanced production equipment. For example, agricultural mechanization is conducive to improving production efficiency and reducing the population required for agricultural production.
6. Conclusions
Using remote sensing techniques together with other data sources, this paper presented a novel model developed to assess food security in Egypt, analyze the factors influencing food security, and provide some useful suggestions to the government. Compared with the statistical data provided by the FAO, the reliability of this model was preliminarily verified when applied to assess food security in Egypt in 2010, 2015, and 2020. To the best of our knowledge, this is the first work to comprehensively assess food security at a national level using multi-source remote sensing techniques. Nevertheless, some drawbacks can be found in the proposed model. First, due to the lack of field measurement data, sample collection mainly depends on visual interpretation, which greatly affects the accuracy of the experiment. Second, because the data used in the study are open-source data and there is a lack of detailed grain-production data and detection data from densely distributed meteorological stations, we could not carry out high-precision calculation and verification and could only analyze the overall trends in grain production on a wider scale. Third, the number of indicators selected by the food security assessment model is insufficient, especially in terms of economic and resource security. In future work, we will use multi-temporal and high-resolution remote sensing data to further improve the developed model. Furthermore, more field sampling data and relevant statistical data in Egypt will be gathered to further evaluate the performance of the proposed model. In addition, we will adjust the parameters of the developed model and use it to perform food security assessments in other countries.
Author Contributions
Conceptualization, S.S. and R.X.; methodology, Y.Y.; data collection and data analysis, Y.Y.; writing—original draft preparation, S.S. and Y.Y.; writing—review and editing, S.S and Y.Y. All authors have read and agreed to the published version of the manuscript.
Funding
This research is partially supported by the National Natural Science Foundation of China Major Program (Grant No. 42192580, 42192583), Natural Science Foundation of Hubei Province (No. 2021CFB402) and Foundation of Key Laboratory of Aerospace Information Application of CETC under Grant No. SXX19629X060.
Data Availability Statement
The Sentinel-1, Landsat and Modis images are available from Earthdata Search (https://search.earthdata.nasa.gov/search, accessed on 23 April 2022), the meteorological data are available from a special software named “WheatA” (http://www.wheata.cn/, accessed on 23 April 2022), and the statistical data in Egypt are available from Knoema (https://knoema.com/atlas/Egypt, accessed on 23 April 2022).
Acknowledgments
The authors would like to thank the anonymous reviewers for their helpful comments and suggestions.
Conflicts of Interest
The authors declare no conflict of interest.
References
- Prosekov, A.Y.; Ivanova, S.A. Food security: The challenge of the present. Geoforum 2018, 91, 73–77. [Google Scholar] [CrossRef]
- Shafiee-Jood, M.; Cai, X. Reducing food loss and waste to enhance food security and environmental sustainability. Environ. Sci. Technol. 2016, 50, 8432–8443. [Google Scholar] [CrossRef] [PubMed]
- Anderson, W.; Taylor, C.; McDermid, S.; Ilboudo-Nébié, E.; Seager, R.; Schlenker, W.; Cottier, F.; Sherbinin, A.; Mendeloff, D.; Markey, K. Violent conflict exacerbated drought-related food insecurity between 2009 and 2019 in sub-Saharan Africa. Nat. Food 2021, 2, 603–615. [Google Scholar] [CrossRef]
- Zhu, X.; Yuan, X.; Zhang, Y.; Liu, H.; Wang, J.; Sun, B. The global concern of food security during the COVID-19 pandemic: Impacts and perspectives on food security. Food Chem. 2022, 370, 130830. [Google Scholar] [CrossRef] [PubMed]
- Fraser, E.D.G. The challenge of feeding a diverse and growing population. Physiol. Behav. 2020, 221, 112908. [Google Scholar] [CrossRef]
- Deng, J.; Xiang, Y.; Hao, W.; Feng, Y.; Yang, G. Research on the food security condition and food supply capacity of Egypt. Sci. World J. 2014, 2014, 405924. [Google Scholar] [CrossRef] [Green Version]
- Osama, S.; Elkholy, M.; Kansoh, R.M. Optimization of the cropping pattern in Egypt. Alexandria Eng. J. 2017, 56, 557–566. [Google Scholar] [CrossRef]
- Long, S.P.; Ainsworth, E.A.; Leakey, A.D.B.; Morgan, P.B. Global food insecurity. Treatment of major food crops with elevated carbon dioxide or ozone under large-scale fully open-air conditions suggests recent models may have overestimated future yields. Philos. Trans. R. Soc. B 2005, 360, 2011–2020. [Google Scholar] [CrossRef]
- Rosegrant, M.W.; Cline, S.A. Global food security: Challenges and policies. Science 2003, 302, 1917–1919. [Google Scholar] [CrossRef] [Green Version]
- Smyth, S.J.; Phillips, P.W.B.; Kerr, W.A. Food security and the evaluation of risk. Glob. Food Secur. 2015, 4, 16–23. [Google Scholar] [CrossRef]
- Bommarco, R.; Kleijn, D.; Potts, S.G. Ecological intensification: Harnessing ecosystem services for food security. Trends Ecol. Evol. 2013, 28, 230–238. [Google Scholar] [CrossRef] [PubMed]
- Sishodia, R.P.; Ray, R.L.; Singh, S.K. Applications of remote sensing in precision agriculture: A review. Remote Sens. 2020, 12, 3136. [Google Scholar] [CrossRef]
- Weng, Q. Land use change analysis in the Zhujiang Delta of China using satellite remote sensing, GIS and stochastic modelling. J. Environ. Manag. 2002, 64, 273–284. [Google Scholar] [CrossRef] [PubMed] [Green Version]
- MohanRajan, S.N.; Loganathan, A.; Manoharan, P. Survey on Land Use/Land Cover (LU/LC) change analysis in remote sensing and GIS environment: Techniques and Challenges. Environ. Sci. Pollut. Res. 2020, 27, 29900–29926. [Google Scholar] [CrossRef] [PubMed]
- Karthikeyan, L.; Chawla, I.; Mishra, A.K. A review of remote sensing applications in agriculture for food security: Crop growth and yield, irrigation, and crop losses. J. Hydrol. 2020, 586, 124905. [Google Scholar] [CrossRef]
- Ganasri, B.P.; Ramesh, H. Assessment of soil erosion by RUSLE model using remote sensing and GIS-A case study of Nethravathi Basin. Geosci. Front. 2016, 7, 953–961. [Google Scholar] [CrossRef] [Green Version]
- Rahman, M.R.; Shi, Z.H.; Chongfa, C. Soil erosion hazard evaluation—An integrated use of remote sensing, GIS and statistical approaches with biophysical parameters towards management strategies. Ecol. Model. 2009, 220, 1724–1734. [Google Scholar] [CrossRef]
- Mosleh, M.K.; Hassan, Q.K.; Chowdhury, E.H. Development of a remote sensing-based rice yield forecasting model. Span. J. Agric. Res. 2016, 14, 19. [Google Scholar] [CrossRef] [Green Version]
- Donohue, R.J.; Lawes, R.A.; Mata, G.; Gobbett, D.; Ouzman, J. Towards a national, remote-sensing-based model for predicting field-scale crop yield. Field Crop. Res. 2018, 227, 79–90. [Google Scholar] [CrossRef]
- Abdelaal, H.S.A.; Thilmany, D. Grains production prospects and long run food security in Egypt. Sustainability 2019, 11, 4457. [Google Scholar] [CrossRef] [Green Version]
- Riad, P.; Graefe, S.; Hussein, H.; Buerkert, A. Landscape transformation processes in two large and two small cities in Egypt and Jordan over the last five decades using remote sensing data. Landsc. Urban Plan. 2020, 197, 103766. [Google Scholar] [CrossRef]
- Fahim, M.A.; Hassanein, M.K.; Khalil, A.A.; Abou, H.A.F. Climate change adaptation needs for food security in Egypt. Nat. Sci. 2013, 11, 68–74. [Google Scholar]
- Radwan, T.M.; Blackburn, G.A.; Whyatt, J.D.; Atkinson, P.M. Dramatic loss of agricultural land due to urban expansion threatens food security in the Nile Delta, Egypt. Remote Sens. 2019, 11, 332. [Google Scholar] [CrossRef] [Green Version]
- Omar, M.E.D.M.; Moussa, A.M.A.; Hinkelmann, R. Impacts of climate change on water quantity, water salinity, food se-curity, and socioeconomy in Egypt. Water Sci. Eng. 2021, 14, 17–27. [Google Scholar] [CrossRef]
- Eid, A.N.M.; Olatubara, C.O.; Ewemoje, T.A.; El-Hennawy, M.T.; Farouk, H. Inland wetland time-series digital change detection based on SAVI and NDWI indecies: Wadi El-Rayan lakes, Egypt. Remote Sens. Appl.-Soc. Environ. 2020, 19, 100347. [Google Scholar] [CrossRef]
- Sušnik, J.; Vamvakeridou-Lyroudia, L.S.; Baumert, N.; Kloos, J.; Renaud, F.G.; La Jeunesse, I.; Mabrouk, B.; Savić, D.A.; Kapelan, Z.; Ludwig, R.; et al. Interdisciplinary assessment of sea-level rise and climate change impacts on the lower Nile delta, Egypt. Sci. Total Environ. 2005, 503, 279–288. [Google Scholar] [CrossRef]
- Farg, E.; Ramadan, M.N.; Arafat, S.M. Classification of some strategic crops in Egypt using multi remotely sensing sensors and time series analysis. Egypt. J. Remote Sens. Space Sci. 2019, 22, 263–270. [Google Scholar] [CrossRef]
- Saleh, A.M.; Belal, A.B.; Mohamed, E.S. Land resources assessment of El-Galaba basin, South Egypt for the potentiality of agriculture expansion using remote sensing and GIS techniques. Egypt J. Remote Sens. Space Sci. 2015, 18, 19–30. [Google Scholar] [CrossRef] [Green Version]
- Peel, M.C.; Finlayson, B.L.; McMahon, T.A. Updated world map of the Köppen-Geiger climate classification. Hydrol. Earth Syst. Sci. 2007, 11, 1633–1644. [Google Scholar] [CrossRef] [Green Version]
- Domroes, M.; El-Tantawi, A. Recent temporal and spatial temperature changes in Egypt. Int. J. Climatol. 2005, 25, 51–63. [Google Scholar] [CrossRef]
- Shalaby, M.Y.; Al-Zahrani, K.H.; Baig, M.B.; Straquadine, G.S.; Aldosari, F. Threats and challenges to sustainable agriculture and rural development in Egypt: Implications for agricultural extension. J. Anim. Plant Sci. 2011, 21, 581–588. [Google Scholar]
- Wichelns, D. The role of ‘virtual water’ in efforts to achieve food security and other national goals, with an example from Egypt. Agric. Water Manag. 2001, 49, 131–151. [Google Scholar] [CrossRef]
- El-Marsafawy, S.M.; Swelam, A.; Ghanem, A. Evolution of crop water productivity in the Nile Delta over three decades (1985–2015). Water 2018, 10, 1168. [Google Scholar] [CrossRef] [Green Version]
- Tanyeri-Abur, A.; Elamin, N.H. International investments in agriculture in Arab countries: An overview and implications for policy. Food Secur. 2011, 3, 115–127. [Google Scholar] [CrossRef]
- Leff, B.; Ramankutty, N.; Foley, J.A. Geographic distribution of major crops across the world. Glob. Biogeochem. Cycle 2004, 18, 27. [Google Scholar] [CrossRef]
- Nikiel, C.A.; Eltahir, E.A.B. Past and future trends of Egypt’s water consumption and its sources. Nat. Commun. 2021, 12, 1–11. [Google Scholar] [CrossRef]
- Desnos, Y.-L.; Foumelis, M.; Engdahl, M.; Mathieu, P.P.; Zmuda, A. Scientific exploitation of Sentinel-1 within ESA’s seom programme element. In Proceedings of the 2016 IEEE IGARSS, Beijing, China, 10–15 July 2016; IEEE: Washington, DC, USA, 2016; pp. 3878–3881. [Google Scholar] [CrossRef]
- Goward, S.N.; Masek, J.G.; Williams, D.L.; Irons, J.R.; Thompson, R.J. The Landsat 7 mission: Terrestrial research and applications for the 21st century. Remote Sens. Environ. 2001, 78, 3–12. [Google Scholar] [CrossRef]
- Zhu, Z.; Wang, S.; Woodcock, C.E. Improvement and expansion of the Fmask algorithm: Cloud, cloud shadow, and snow detection for Landsats 4–7, 8, and Sentinel 2 images. Remote Sens. Environ. 2005, 159, 269–277. [Google Scholar] [CrossRef]
- Chen, J.; Chen, J.; Liao, A.; Cao, X.; Chen, L.; Chen, X.; He, C.; Han, G.; Peng, S.; Lu, M.; et al. Global land cover mapping at 30 m resolution: A POK-based operational approach. ISPRS J. Photogramm. Remote Sens. 2015, 103, 7–27. [Google Scholar] [CrossRef] [Green Version]
- Pérez-Hoyos, A.; García-Haro, F.J.; San-Miguel-Ayanz, J. Conventional and fuzzy comparisons of largescale land cover products: Application to CORINE, GLC2000, MODIS and GlobCover in Europe. ISPRS J. Photogramm. Remote Sens. 2012, 74, 185–201. [Google Scholar] [CrossRef]
- Chen, S.; Useya, J.; Mugiyo, H. Decision-level fusion of Sentinel-1 SAR and Landsat 8 oli texture features for crop discrimi-nation and classification: Case of Masvingo, Zimbabwe. Heliyon 2020, 6, e05358. [Google Scholar] [CrossRef] [PubMed]
- Useya, J.; Chen, S. Comparative performance evaluation of pixel-level and decision-level data fusion of Landsat 8 OLI, Landsat 7 ETM+ and Sentinel-2 MSI for crop ensemble classification. IEEE J. Sel. Top. Appl. Earth Observ. Remote Sens. 2018, 11, 4441–4451. [Google Scholar] [CrossRef]
- Qu, Y.; Zhao, W.; Yuan, Z.; Chen, J. Crop Mapping from Sentinel-1 Polarimetric Time-Series with a Deep Neural Network. Remote Sens. 2020, 12, 2493. [Google Scholar] [CrossRef]
- Caballero, G.R.; Platzeck, G.; Pezzola, A.; Casella, A.; Winschel, C.; Silva, S.S.; Ludueña, E.; Pasqualotto, N.; Delegido, J. Assessment of multi-date Sentinel-1 polarizations and GLCM texture features capacity for onion and sunflower classification in an irrigated valley: An object level approach. Agronomy 2020, 10, 845. [Google Scholar] [CrossRef]
- Hegazy, A.K.; Fahmy, G.M.; Ali, M.I.; Gomaa, N.H. Growth and phenology of eight common weed species. J. Arid. Environ. 2005, 61, 171–183. [Google Scholar] [CrossRef]
- Nyoungui, A.N.; Tonye, E.; Akono, A. Evaluation of speckle filtering and texture analysis methods for land cover classification from SAR images. Int. J. Remote Sens. 2002, 23, 1895–1925. [Google Scholar] [CrossRef]
- Haralick, R.M.; Shanmugam, K.; Dinstein, I. Textural features for image classification. IEEE Trans. Syst. Man Cybern. 1973, 3, 610–621. [Google Scholar] [CrossRef] [Green Version]
- Phan Thanh, N.; Kappas, M. Comparison of random forest, k-nearest neighbor, and support vector machine classifiers for land cover classification using Sentinel-2 imagery. Sensors 2018, 18, 18. [Google Scholar] [CrossRef] [Green Version]
- Shao, Y.; Lunetta, R.S. Comparison of support vector machine, neural network, and CART algorithms for the land-cover classification using limited training data points. ISPRS J. Photogramm. Remote Sens. 2012, 70, 78–87. [Google Scholar] [CrossRef]
- Shi, J.; Lee, W.-J.; Liu, Y.; Yang, Y.; Wang, P. Forecasting power output of photovoltaic systems based on weather classification and support vector machines. IEEE Trans. Ind. Appl. 2012, 48, 1064–1069. [Google Scholar] [CrossRef]
- Oliver, M.A.; Webster, R. Kriging: A method of interpolation for geographical information systems. Int. J. Geogr. Inf. Syst. 1990, 4, 313–332. [Google Scholar] [CrossRef]
- Monteith, J.L. Solar radiation and productivity in tropical ecosystems. J. Appl. Ecol. 1972, 9, 747–766. [Google Scholar] [CrossRef] [Green Version]
- Yu, D.; Shi, P.; Shao, H.; Zhu, W.; Pan, Y. Modelling net primary productivity of terrestrial ecosystems in East Asia based on an improved CASA ecosystem model. Int. J. Remote Sens. 2009, 30, 4851–4866. [Google Scholar] [CrossRef]
- Wang, Y.; Xu, X.; Huang, L.; Yang, G.; Fan, L.; Wei, P.; Chen, G. An improved CASA model for estimating winter wheat yield from remote sensing images. Remote Sens. 2019, 11, 1088. [Google Scholar] [CrossRef] [Green Version]
- Walker, J.C.G. Biogeochemistry—An analysis of global change—Schlesinger, WH. Science 1991, 253, 686–687. [Google Scholar] [CrossRef]
- Hay, R.K.M. Harvest index: A review of its use in plant breeding and crop physiology. Ann. Appl. Biol. 1995, 126, 197–216. [Google Scholar] [CrossRef]
- Global Food Security Index. Available online: https://impact.economist.com/sustainability/project/food-security-index/ (accessed on 11 May 2022).
- Wang, L. The Crop Yield Estimation and Evaluation for Potential Grain Productivity in North Korea. Master’s Thesis, Northeast Normal University, Changchun, China, 2012. [Google Scholar]
- FAOSTAT: Suite of Food Security Indicators. Available online: https://www.fao.org/faostat/en/#data/FS (accessed on 11 May 2022).
- Zhang, S. The Food Security of Egypt. Master’s Thesis, Northwest University, Xi’an, China, 2017. [Google Scholar]
- Nashwan, M.S.; Shahid, S.; Wang, X. Assessment of satellite-based precipitation measurement products over the hot desert climate of Egypt. Remote Sens. 2019, 11, 555. [Google Scholar] [CrossRef] [Green Version]
Figure 1.
Geographic distribution of cropland in Egypt.

Figure 2.
Flowchart of crop classification based on the GLCM mean texture features.

Figure 3.
Some samples overlapped on the GLCM-based mean texture features map derived from the Sentinel-1 data VH band (specific parameters refers to Section 3.1.3).
Figure 3.
Some samples overlapped on the GLCM-based mean texture features map derived from the Sentinel-1 data VH band (specific parameters refers to Section 3.1.3).

Figure 4.
Flowchart of estimating NPP using the CASA model, where IPAR denotes the intercepted photosynthetically active radiation, FPAR represents the fraction of absorbed photosynthetically active radiation, and APAR is the absorbed photosynthetically active radiation.
Figure 4.
Flowchart of estimating NPP using the CASA model, where IPAR denotes the intercepted photosynthetically active radiation, FPAR represents the fraction of absorbed photosynthetically active radiation, and APAR is the absorbed photosynthetically active radiation.

Figure 5.
Crop classification results obtained from SVM using the GLCM parameter dataset extracted from time-series dataset in Egypt in (a) 2010, (b) 2015, and (c) 2020.
Figure 5.
Crop classification results obtained from SVM using the GLCM parameter dataset extracted from time-series dataset in Egypt in (a) 2010, (b) 2015, and (c) 2020.

Figure 6.
Estimated results of grain yield in Egypt in (a) 2010, (b) 2015, and (c) 2020 using the CASA model.
Figure 6.
Estimated results of grain yield in Egypt in (a) 2010, (b) 2015, and (c) 2020 using the CASA model.

Figure 7.
Food security evaluation results in 2010, 2015, and 2020. (a) The radar chart shows the variation in the four dimensions in different years, and (b) the histogram shows the weight of the different dimensions in 2010, 2015, and 2020.
Figure 7.
Food security evaluation results in 2010, 2015, and 2020. (a) The radar chart shows the variation in the four dimensions in different years, and (b) the histogram shows the weight of the different dimensions in 2010, 2015, and 2020.


Table 1.
Major characteristics of Sentinel-1 data used in our study.
| Item | Specification |
|---|---|
| Acquisition date | November 2014–May 2015 November 2019–May 2020 |
| Imaging mode | Interferometric wide swath (IW) |
| Polarization | Vertical–horizontal |
| Spatial resolution | 2.3 m × 14.1 m |
| Orbit descending | Descending |
| Quantity | 204 |
Table 2.
Major characteristics of Landsat 7 data in our research.
| Item | Specification |
|---|---|
| Acquisition date | March–May 2010 |
| Bands | Blue, green, red, NIR, SWIR |
| Swath size | 170 km × 185 km |
| Spatial resolution | 30 m |
| Quantity | 16 |
Table 3.
The accuracy of crop classification results in Egypt in 2010, 2015, and 2020.
| Class | 2010 | 2015 | 2020 |
|---|---|---|---|
| grain crop | 0.7828 | 0.9074 | 0.8491 |
| cash crop | 0.7075 | 0.8352 | 0.7556 |
| bare soil | 0.6563 | 0.7901 | 0.7851 |
| water | 0.9090 | 0.9609 | 0.9105 |
| OA | 0.7580 | 0.8761 | 0.8244 |
| Kappa | 0.6341 | 0.8138 | 0.7228 |
Table 4.
Confusion matrix of crop classification obtained from SVM using the GLCM parameter dataset extracted from Landsat 7 time-series dataset in 2010.
Table 4.
Confusion matrix of crop classification obtained from SVM using the GLCM parameter dataset extracted from Landsat 7 time-series dataset in 2010.
| Land Use | Grain Crop | Cash Land | Bare Land | Water |
|---|---|---|---|---|
| grain crop | 6517 | 1506 | 313 | 123 |
| cash crop | 1562 | 4721 | 264 | 50 |
| bare soil | 241 | 426 | 1107 | 31 |
| water | 6 | 68 | 3 | 2038 |
Table 5.
Confusion matrix of crop classification obtained from SVM using the GLCM parameter dataset extracted from Sentinel-1 time-series dataset in 2015.
Table 5.
Confusion matrix of crop classification obtained from SVM using the GLCM parameter dataset extracted from Sentinel-1 time-series dataset in 2015.
| Land Use | Grain Crop | Cash Land | Bare Land | Water |
|---|---|---|---|---|
| grain crop | 11,476 | 1225 | 515 | 52 |
| cash crop | 1012 | 7537 | 36 | 25 |
| bare soil | 154 | 262 | 2920 | 65 |
| water | 6 | 1 | 221 | 3337 |
Table 6.
Confusion matrix of crop classification obtained from SVM using the GLCM parameter dataset extracted from Sentinel-1 time-series dataset in 2020.
Table 6.
Confusion matrix of crop classification obtained from SVM using the GLCM parameter dataset extracted from Sentinel-1 time-series dataset in 2020.
| Land Use | Grain Crop | Cash Land | Bare Land | Water |
|---|---|---|---|---|
| grain crop | 11,557 | 1502 | 606 | 220 |
| cash crop | 1159 | 4937 | 24 | 8 |
| bare soil | 502 | 12 | 2367 | 220 |
| water | 394 | 83 | 18 | 2755 |
Table 7.
Estimated and statistical results of cultivated area of grain crops and the total arable land in Egypt in 2010, 2015, and 2020.
Table 7.
Estimated and statistical results of cultivated area of grain crops and the total arable land in Egypt in 2010, 2015, and 2020.
| Year | The Cultivated Area of Grain Crops /106 Hectares | The Total Arable Land /106 Hectares |
|---|---|---|
| 2010 | Estimated result: 2.556 Statistical value: 2.657 | Estimated result: 4.125 Statistical value: 3.671 |
| 2015 | Estimated result: 2.811 Statistical value: 2.804 | Estimated result: 3.928 Statistical value: 3.798 |
| 2020 | Estimated result: 2.906 Statistical value: 3.008 | Estimated result: 3.827 Statistical value: 3.836 |
Table 8.
Estimated and statistical results of the total grain yield in Egypt in 2010, 2015, and 2020.
Table 8.
Estimated and statistical results of the total grain yield in Egypt in 2010, 2015, and 2020.
| Year | Estimated Total Grain Yield | Statistical Data Provided by FAO |
|---|---|---|
| 2010 | 1.8 × 10⁷ million ton | 1.946 × 10⁷ million ton |
| 2015 | 2.185 × 10⁷ million ton | 2.063 × 10⁷ million ton |
| 2020 | 2.061 × 10⁷ million ton | 2.193 × 10⁷ million ton |
Table 9.
Weights of four dimensions and weights of indices in each dimension.
| Dimensions | Weight of Each Dimension | Indices in Each Dimension | Weight of Each Index |
|---|---|---|---|
| Quantity security | 33.32% | Per capita grain land | 7.29% |
| Per unit area grain yield | 7.86% | ||
| Per capita food production | 8.46% | ||
| Fluctuation coefficient of grain production | 9.71% | ||
| Economic security | 22.23% | Grain self-sufficiency rate | 7.37% |
| Value of agricultural imports | 7.60% | ||
| Per capita food consumption | 7.26% | ||
| Quality security | 27.31% | Malnutrition rate | 7.26% |
| Per capita daily protein consumption weight | 10.94% | ||
| Per capita daily fat consumption weight | 9.11% | ||
| Resource security | 17.14% | Per unit area water resource consumption | 7.45% |
| Per unit area nitrogen fertilizer consumption | 9.69% |
Publisher’s Note: MDPI stays neutral with regard to jurisdictional claims in published maps and institutional affiliations. |
© 2022 by the authors. Licensee MDPI, Basel, Switzerland. This article is an open access article distributed under the terms and conditions of the Creative Commons Attribution (CC BY) license (https://creativecommons.org/licenses/by/4.0/).
Share and Cite
MDPI and ACS Style
Shi, S.; Ye, Y.; Xiao, R. Evaluation of Food Security Based on Remote Sensing Data—Taking Egypt as an Example. Remote Sens. 2022, 14, 2876. https://0-doi-org.brum.beds.ac.uk/10.3390/rs14122876
AMA Style
Shi S, Ye Y, Xiao R. Evaluation of Food Security Based on Remote Sensing Data—Taking Egypt as an Example. Remote Sensing. 2022; 14(12):2876. https://0-doi-org.brum.beds.ac.uk/10.3390/rs14122876
Chicago/Turabian StyleShi, Shuzhu, Yu Ye, and Rui Xiao. 2022. "Evaluation of Food Security Based on Remote Sensing Data—Taking Egypt as an Example" Remote Sensing 14, no. 12: 2876. https://0-doi-org.brum.beds.ac.uk/10.3390/rs14122876
Note that from the first issue of 2016, this journal uses article numbers instead of page numbers. See further details here.