Article

Extending the National Burned Area Composite Time Series of Wildfires in Canada

1
Northern Forestry Centre, Canadian Forest Service, Natural Resources Canada, 5320 122 Street NW, Edmonton, AB T6H 3S5, Canada
2
Forest Management Division, Department of Environment and Natural Resources, Government of Northwest Territories, Box 4354, Hay River, NT X0E lG3, Canada
3
Forest Management Division, Department of Environment and Natural Resources, Government of Northwest Territories, Box 7, Fort Smith, NT X0E 0P0, Canada
*
Author to whom correspondence should be addressed.
Remote Sens. 2022, 14(13), 3050; https://0-doi-org.brum.beds.ac.uk/10.3390/rs14133050
Submission received: 3 May 2022 / Revised: 16 June 2022 / Accepted: 22 June 2022 / Published: 25 June 2022
(This article belongs to the Section Forest Remote Sensing)

Abstract

:
Wildfires are a major natural disturbance in Canada that are postulated to increase under a warming climate. To derive accurate trends in burned area and to quantify the effects of fire frequency, duration, and extent, a sufficiently long time series of reliable burned area maps is required. With that in mind, we extended Canada’s National Burned Area Composite (NBAC) dataset from its previous start year (2004) back to 1986. NBAC consists of annual maps in polygon format where the area burned in each fire event is represented by the best available delineation among various mapping methods and data sources of varying quality. Ordered from more to less reliability, in the new 35-year time series (1986 to 2020), 10% of the total burned area was derived from airborne and high-resolution (<5 m) satellite imagery, 81% from change detection methods using 30 m Landsat satellite imagery, and the remaining 9% was largely from aerial surveys. Total (Canada-wide) annual burned area estimates ranged from 215,797 ha in 2020 to 6.7 million ha (Mha) in 1989. We computed 95% confidence intervals for the estimate of each year from 1986 to 2020 based on the accuracy and relative contribution in that year of the different data sources, for both the new NBAC time series and the polygon version of the Canadian National Fire Database (CNFDB), a commonly used source of spatially explicit data on burned area in Canada. NBAC confidence intervals were on average ±9.7% of the annual figure, about one-third the width of the confidence intervals derived for CNFDB. The NBAC time series also included nearly 5000 fire events (totalling 4 Mha, with the largest event being 120,661 ha in size) that are missing in the CNFDB. In a regional analysis for the Northwest Territories, retroactive fire mapping from Landsat imagery reduced historical estimates by 3 Mha (16%), which would result in a 1.6 Mha increase in the reported undisturbed critical habitat for threatened woodland caribou. The NBAC dataset is freely downloadable from the Canadian Wildland Fire Information System.

Graphical Abstract

1. Introduction

Understanding and quantifying the effects of fire disturbance over longer periods requires consistent, accurate information on the location and size of all burned areas [1,2]. For example, to understand wildfire’s role in maintaining ecosystem function and biodiversity under changing wildfire regimes, one needs to know where landscapes have been either more resilient or more prone to fire [3,4]. In most jurisdictions in Canada, the annual reporting and management of fire activities is entrusted to designated fire management agencies [5]. Fire maps are created by those agencies at the end of each fire season and are compiled into the Canadian National Fire Database (CNFDB), a commonly used source of Geographic Information System (GIS) burned area data in Canada [6]. CNFDB comes in two versions, either as GIS polygons representing fire perimeters or as GIS points representing approximate fire locations and including an estimated burned area. While the burned area estimates for individual fires are more accurate in the polygon version, the point version is necessary because many small fires are only reported as points. However, a considerable proportion of the historical CNFDB polygons consists of broad delineations of the fire which often include unburned patches of forest and waterbodies in the reported area estimate [7]. The completeness of the CNFDB has also been questioned, as some fires in remote locations are occasionally missed by some agencies [8].
To tackle these issues, the Canadian Forest Service (CFS) and the Canada Centre for Mapping and Earth Observation (CCMEO) of Natural Resources Canada have produced the National Burned Area Composite (NBAC) [9]. Since 2004, NBAC has been a growing time series of annual maps, where each map consists of a set of GIS polygons representing the area burned by each wildfire event that occurred in that year. Fire events in NBAC are either mapped anew using satellite imagery, or retained from CNFDB if the polygon therein represents a precise delineation of the burn boundary [9]. Each polygon in NBAC contains assigned attributes describing the event, including the amount of area burned, the ignition cause (e.g., lightning or human), the fire start and end dates, and information about how the fire polygon was delineated and from what mapping sources. The burned area data from NBAC feed into the National Forest Carbon Monitoring, Accounting and Reporting System, which the government of Canada uses to meet international reporting commitments on emissions and removals of greenhouse gases [10,11,12]. However, given that the original NBAC dates back only as far as 2004, the ability to report forest carbon emissions from fire disturbance over multiple decades using this dataset is limited. An extended NBAC time series to years predating 2004 could also be used as a forest change indicator to track the effects of a changing climate on Canada’s forests [13].
Thirty-metre imagery from the Landsat satellite series [14], available since 1984, has been widely adopted for burned area mapping at regional and national scales [1,15,16,17]. The mapping relies on change detection algorithms, either bitemporal or time series [18,19,20,21]. In particular, the Multi-Acquisition Fire Mapping System (MAFiMS) designed specifically for NBAC applies the differenced normalized burn ratio (dNBR) [22] to pre- and post-fire Landsat data [9]. An accuracy assessment of the burned area from MAFiMS exceeded 90% relative to reference data from visual interpretation and delineation of post-fire aerial photography [9]. Despite its high accuracy, its conventional approach to preprocessing (searching for and downloading suitable imagery, masking of clouds, image differencing) and postprocessing (visual quality control and occasional spatial editing of the automated delineations) can be labor-intensive. To circumvent this, data from another CFS product, the National Terrestrial Ecosystem Monitoring System Composite to Change (C2C), could be integrated into NBAC to better represent some fire events not mapped with MAFiMS. The C2C uses best-available-pixel composites from the Landsat archive and applies an object-based change detection procedure to map forest disturbances from commercial harvesting and wildfires in the 1985–2015 period [23,24]. Hence, in addition to the pre-2004 period, C2C could also be used to replace less reliable delineations from selected fire events in the 2004–2015 NBAC period.
A partnership between the CFS and the Government of Northwest Territories (GNWT) fire management agency enabled an extensive, MAFiMS-based update of historical fire information in the forest regions of the Northwest Territories (NWT), which in turn demonstrated the feasibility of extending back in time the NBAC time series. Wildfires are the dominant natural disturbance in these regions and have contributed to more than half the national burned area during some extreme wildfire years [25]. The original polygon data in the GNWT historical database did not include a fire perimeter for all wildfire events, and those that were included consisted of broad delineations from aerial surveys that did not remove unburned forest patches inside the polygons. Unburned forest patches provide critical foraging habitat for species-at-risk such as the boreal woodland caribou (Rangifer tarandus caribou) as they move through burned areas [26]. Under the federal recovery strategy for this threatened species, at least 65% of the NWT range of boreal woodland caribou (termed the NT1 range) must be maintained in an undisturbed state to ensure a self-sustaining population [27]. Undisturbed habitat includes areas that have not been affected by wildfire in the last 40 years and are more than 500 m away from an anthropogenic disturbance feature. Therefore, an improved burned area dataset derived from Landsat imagery may change the reported amount of undisturbed habitat for caribou protection and may also have some implications on forest fire management in the NWT.
This paper describes how refined delineations of burned area from Landsat in combination with CNFDB data were used to improve and extend the NBAC dataset to 35 years of fire history. Specific objectives were to (1) create Landsat-derived fire polygons from MAFiMS and C2C for selected fire events; (2) calculate confidence intervals for annual national burned area statistics from both NBAC and CNFDB; and (3) as an application example, use NBAC to assess undisturbed woodland caribou habitat in a northern boreal forest. Annual burned area statistics are presented and discussed both nationally and regionally (for the NWT only) from 1986 to 2020.

2. Materials and Methods

The NBAC dataset consists of annual polygon layers compiled from the best available spatial representation of fire events from multiple sources (for a detailed schematic, see Figure 1 in Hall et al. [9]). Here, we describe four fire-related products used in building the extended NBAC time series, how they were conditioned and integrated, and how we created confidence intervals for the annual national burned area estimates. We end the section with the materials and methods for a case study on the impact of different burned area data sources (CNFDB vs. NBAC) on the estimated amount of undisturbed habitat in the NT1 caribou range. All GIS processes for conditioning the fire polygons and data analysis were performed using ArcGIS 10.5.

2.1. CNFDB: Fire Management Agency Data

CNFDB fire polygons for the period 1986 to 2003 were obtained from the Canadian Wildland Fire Information System [6]. There was considerable variation among the agencies in terms of the methods and data sources used to map fires. Manual sketch mapping and aerial GPS were the most common, but these are often the least accurate because of inconsistent removal of unburned areas within the mapped perimeter and an over-generalized burn boundary [8]. Fire polygons derived from Landsat using standard image differencing algorithms [22] are generally more precise than those derived by aerial GPS [28]. The most accurate fire perimeters, however, are based on high-spatial-resolution data sources, such as visual interpretation of either aerial photography or fine-resolution (<5 m) satellite imagery. Other mapping approaches for smaller fires (e.g., <10 ha) may include buffered points from satellite hotspots [29] or GPS coordinates (lower quality polygons), and ground GPS tracking (higher quality polygons). Agency fire polygons lacking information on their mapping method are still used but are labelled as undefined and include data of varying quality. The fire descriptor values in the CNFDB attribute table were standardized to conform to the NBAC attribute scheme (see Table 2 in Hall et al. [9]), which includes the agency mapping method and data source, the fire cause, and the recorded fire start and end dates.

2.2. MAFiMS: Bitemporal Landsat Fire Mapping

MAFiMS is a mapping algorithm developed specifically for creating fire perimeters using Landsat imagery and is primarily used where agency data are a broad delineation of the burned area [9]. In recent years, MAFiMS was adapted to run with Sentinel-2 satellite imagery as well. MAFiMS was used in three different scopes to extend NBAC to 1986. The first was to map large fires where CNFDB polygons were greater than 50,000 ha, had no waterbodies removed, and were broadly delineated with an imprecise method. The second scope was constrained to the collaborative work in the NWT, where all historic fire polygons, regardless of size, were selected for mapping with MAFiMS. A third scope was to map fires that were detected by satellite hotspots from Advanced Very High Resolution Radiometer (AVHRR) and Moderate Resolution Imaging Spectroradiometer (MODIS) sensors but were unreported in the CNFDB polygon database.
Before running MAFiMS, an analyst selected pre- and post-fire image data from the Landsat collection 1 archive [14]. The selection criteria included having clear-sky conditions over the burned area, and a post-fire acquisition date within the same year as the fire event. If a clear-sky post-fire image was not available, then an image was chosen from the following year after snowmelt (snow-free conditions were ascertained using the Landsat Collection 1 Fractional Snow Covered Area product). Pre-fire images with an acquisition date approximately one year earlier than the date of the post-fire image were selected. An automated system then corrected the pre- and post-fire images for atmospheric conditions, high-relief terrain, and differences in phenology. An intermediate product called the High Change Layer then defined spatial processing units around each fire event in which an adaptive threshold based on the dNBR [22] was applied to map pixels corresponding to burned areas. The spatial units provide a mechanism to capture the unique conditions of vegetation type, conditions of burn, and time of year associated with a particular fire. More details can be found in [9]. The resulting burn layer for each fire event was converted to a vector polygon and then quality assurance was conducted by an interpreter to verify the accuracy of the perimeter delineation.

2.3. C2C: Multitemporal Object-Based Forest Disturbance Mapping

The C2C time series of raster maps of annual forest disturbances, which has a reported accuracy greater than 90% for area burned by wildfire when year of burn is not considered (on average, 11% of the area of change is attributed to the incorrect year in C2C) [23], was used to replace some CNFDB agency polygons that were not mapped using MAFiMS. C2C uses best-available-pixel composites from the Landsat archive that are representative of mid-summer forest conditions (August 1 target date, ±30 days) then analyzes trends in those annual composites to detect and label natural and anthropogenic disturbances [23,24]. Integrating the C2C time series (1985 to 2015) into the NBAC system involved several processing steps. C2C objects (groups of connected pixels with the same numeric identifier) that were classified as fire were converted to GIS polygons and initially grouped by both year and proximity on the basis of overlap with a 1235 m spatial buffer around each object. The buffer size was similar to that used for MAFiMS [9]. Overlapping buffered regions were merged to create a single envelope in which the fire objects inside represent a C2C fire event. Owing to latency effects stemming from the best-available-pixel compositing [24], we applied a temporal adjustment to the C2C fire events to check and potentially correct their year of burn. We considered two types of latency effects: splitting, where a fire event appears split in C2C into two or more events occurring over consecutive years; and lumping, where two or more nearby fire events that occurred in consecutive years appear in full or in part as a single fire event in C2C (see Supplementary Information Figures S1 and S2). Lumping cannot be corrected automatically (it would require manual digitization of the boundary separating the lumped events), hence a conservative procedure was devised to discard any C2C events that could potentially result from a lumping situation. This procedure entailed creating a combined times series of annual layers from CNFDB (both polygon and point versions, the latter converted to polygon using a circular buffer of area equal to the reported burned area), MAFiMS, and HANDS (see Section 2.4). Each annual combined layer is the GIS union of buffered (1235 m exterior buffer) polygons from those three sources. Any C2C event in year t that overlapped with more than one year of years t, t − 1, or t − 2 in the combined time series was discarded, unless more than 80% of the total area of overlap (sum of overlaps in years t, t − 1, and t − 2) occurred in one year and the area overlap in that year was more than 80% of the area of the C2C event. These two exceptions had to be made because otherwise most C2C events would have had to be discarded in regions with frequent fires. The remaining C2C events were assigned to the year of maximum overlap with the annual combined layer, thereby correcting any possible splitting. C2C fire events with no overlap with the combined layers were deemed “orphans”. All orphans greater than 1000 ha were visually checked for latency using post-fire Landsat imagery and integrated into NBAC if they passed the check. The 1000 ha threshold was a compromise between the amount of total burned area added, which decreases rapidly with this threshold, and the human resources available to check the burn year of candidate areas, where this effort increases rapidly as the threshold is lowered.

2.4. HANDS: Coarse-Resolution Burned Area Product

Fire polygons derived from the HANDS (Hotspot and Normalized Difference Vegetation Index (NDVI) Differencing Synergy) algorithm [30], which uses as input 1000 m resolution SPOT VEGETATION satellite data dating back to 1995, were included in NBAC if there were no fire polygons available from CNFDB, MAFiMS, or C2C. These coarser resolution fire polygons are only marginally used in NBAC because fires can most often be mapped from Landsat when clear-sky imagery is available [9].

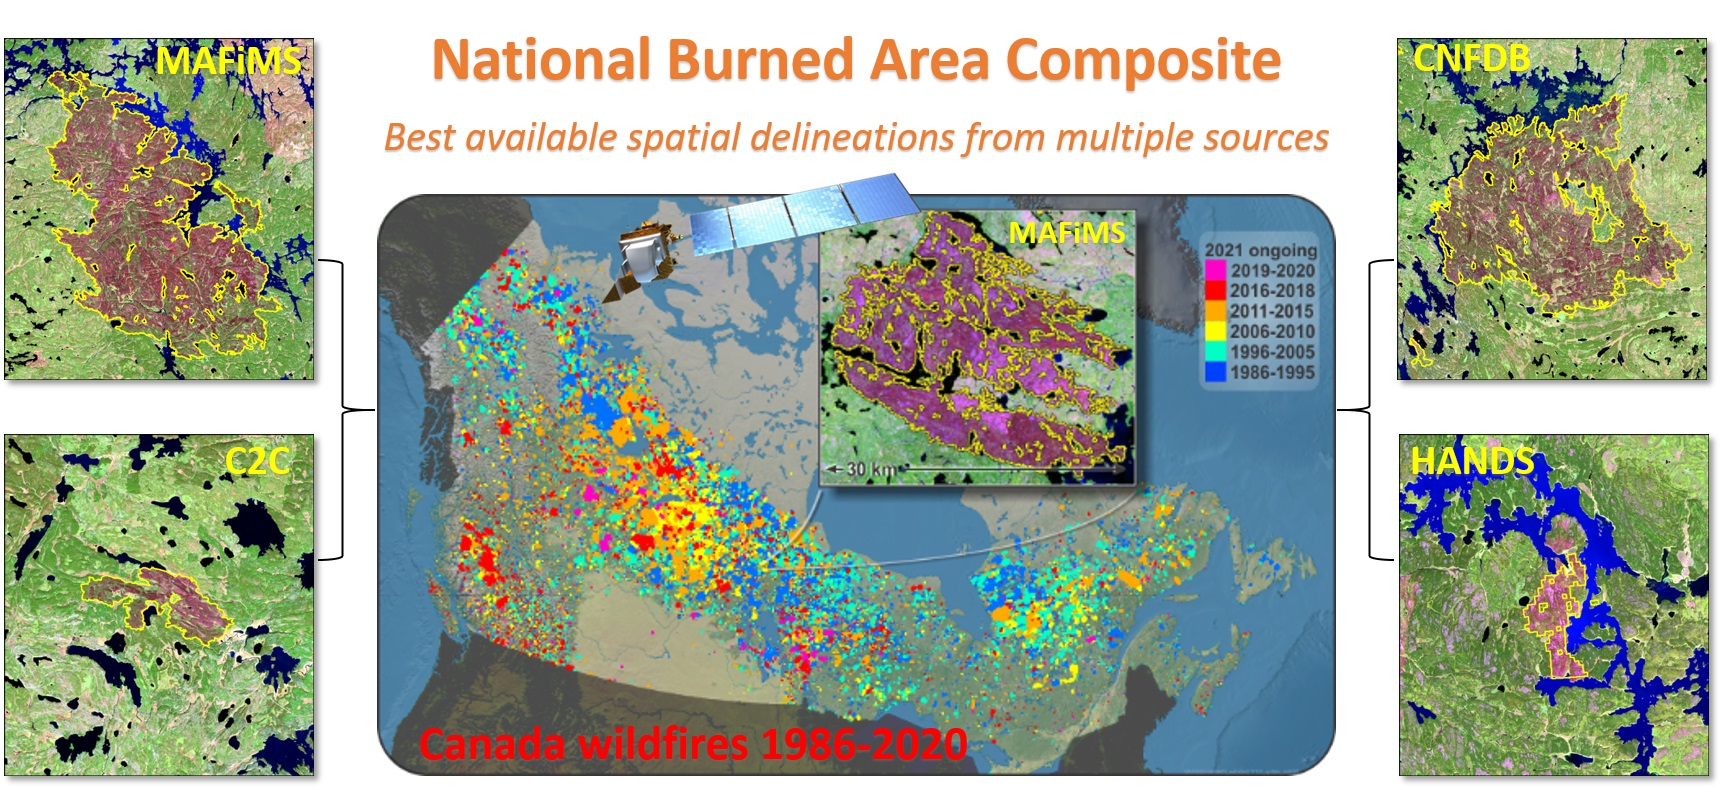
2.5. NBAC: Integrating Multiple Sources

The extended NBAC was created by selecting, for each fire event in the period, the best available polygon out of the previous four data products. That is, if a fire event appeared in more than one of those products, the selection process was governed by the following order of priority: fire events represented by higher quality agency data (e.g., from aerial photography), MAFiMS, C2C, lower quality agency data (e.g., aerial survey), and HANDS. Lower quality agency data were used when there was no MAFiMS polygon available and when the corresponding C2C fire polygon did not pass the conservative filter described in Section 2.3. The area burned by a given fire event is normally estimated as the horizontal projection of the burned terrain as represented by the corresponding polygon in Albers equal-area projection. However, for both lower quality agency data and HANDS, an adjusted area estimate was used instead (see Hall et al. [9] for the adjustment method for HANDS and Skakun et al. [8] for the other), since actual burned area is systematically overestimated for these types of delineations. We included other attribute information when it was available, such as the ignition cause (lightning or human), the fire start and end dates, and the acquisition date of the source data used to delineate the fire polygon (see Table 2 in [9] for a complete list). Fire start and end dates were derived from both satellite hotspots and agency metadata. The hotspot satellite data used for NBAC were derived from AVHRR (1989 to 2000) and MODIS (2001 to 2020). Hotspot fire dates were determined from the first and last hotspot acquisition over a mapped fire event. Fire causes and fire start and end dates as recorded in the agency metadata were retained in the agency polygon when used in NBAC, or transferred from the agency polygon to its counterpart in MAFiMS or C2C. The NBAC maps for 1986 to 2003, as well as the improved NBAC maps for 2004 to 2020 (where some agency polygons had been replaced by MAFiMS or C2C), were then combined to create a 35-year NBAC time series (1986 to 2020). Annual estimates of burned area were broken down by the relative contribution of each data product (CNFDB, MAFiMS, C2C, HANDS) and by fire attribute data (start and end dates, ignition cause). To determine if burned area was increasing or decreasing over the time series we used a Mann–Kendall trend test and calculated slopes using Theil–Sen non-parametric regression. Trends in the NBAC data were compared with those in the polygon version of the CNFDB by ecozones [31].

2.6. Confidence Intervals for Burned Area

Following Hall et al. [9], empirical Monte Carlo simulation methods were used to determine confidence intervals for the total burned area in each year of both the NBAC time series (1986 to 2020), and the CNFDB (constrained to the same period). This involved randomly generating many times a burned area estimate for each fire event in both NBAC and CNFDB, where the error distribution of those replicate estimates followed the error distribution found in a sample consisting of fire events of similar size that were mapped using the same method as the fire under simulation. For this purpose, the mapping methods were ranked into confidence classes; there were six in Hall et al. [9] and seven in the extended NBAC because of the addition of C2C data. The classes are as follows, ranked from highest to lowest confidence: Class 1, air photo interpretation, field GPS, and high-resolution satellite (e.g., RapidEye, QuickBird) delineation; Class 2, MAFiMS; Class 3, C2C; Class 4, manual delineation/thresholding of Landsat imagery from agencies; Class 5, aerial GPS; Class 6, HANDS; and Class 7, undefined, buffered points from hotspots and GPS coordinates, and sketch maps. Classes 1, 4, 5, and 7 are mapping methods used by the agencies that contribute to the CNFDB dataset (Section 2.1). In the NBAC time series, 30% of the approximately 34,500 fire events were mapped by more than one confidence class method (i.e., were represented by multiple data products). Error distribution for MAFiMS (Class 2) and C2C (Class3) was derived from a paired subset of fires (n = 50 for MAFiMS and n = 20 for C2C) mapped by these methods and air photo delineation (Class 1). However, because the sample size of paired fires for C2C (Class 3) was small, the error distributions for Class 2 and Class 3 in the Monte Carlo simulation were combined. To estimate the error distribution in classes 4 through 7, data captured by classes 1 and 2 were used as reference data in a subset of fire events that had delineations produced by either Class 1 or 2 and one of the classes under assessment. It was not possible to use only data captured by Class 1 as reference because of the small number of fire events captured by Class 1 that had a counterpart in classes 4 to 7. The number of fires available for characterizing the error distribution was 1024 for Class 4, 881 for Class 5, 3496 for Class 6, and 2262 for Class 7. A simple proportion error (Ej) for the estimated area (A) for each fire j relative to the reference area, AR, for fire j was calculated as Ej = Aj/ARj. The distribution error for all fires mapped by each confidence class (C) was used to characterize the overall error distribution for that confidence class (EC). As expected, relative errors were larger for lower confidence classes, but they also varied by fire size within a class and were larger for smaller fires. Therefore, both size and confidence class were considered in the Monte Carlo simulation; hence, each class was divided into four size strata, each corresponding to a quartile of the size distribution in that class. The Monte Carlo simulation itself involved randomly generating 1000 values of Ej for each fire j in NBAC, where those values were drawn using the empirical cumulative distribution function derived for each combination of confidence class and size class. The Ej values were then used to generate 1000 alternative estimates of burned area for each fire event j in each year of the NBAC time series. As an additional constraint, these alternative estimates of area burned could not exceed 1 million ha, a size that has never been exceeded in the NBAC record. The results for each iteration (where a burned area estimate is randomly generated following the above procedure) were summed nationally by year, and approximate 95% confidence intervals for each year were derived from the 2.5th and 97.5th percentiles of the distribution of values obtained from the 1000 simulations.

2.7. NWT: Boreal Caribou Undisturbed Habitat

To provide an example of the usefulness of the extended NBAC time series for applications beyond fire, we spatially assessed the amount of undisturbed habitat for boreal woodland caribou in the NT1 range of the NWT (Figure 1). The NT1 range extends from the southern border of the NWT into the Inuvialuit region and Yukon Territory, comprising an area approximately 44 Mha in size. The national recovery strategy [27] sets a target of maintaining at least 65% of the NT1 range in an undisturbed condition to allow the caribou population to be self-sustaining. Undisturbed habitat includes areas in the range that have not been affected by wildfire in the last 40 years and are at least 500 m away from any anthropogenic feature. For this analysis, disturbance layers included NBAC and CNFDB, and a GIS layer of satellite-mapped anthropogenic features. This layer included any human-caused disturbance to the natural landscape that could be visually identified from Landsat imagery (updated to reference year 2015) using a viewing scale of 1:50,000 [32]. In the NT1, the main anthropogenic disturbances were from oil and gas exploration (i.e., seismic lines) and roads.
Two disturbance scenarios were computed to determine changes in undisturbed habitat based on the wildfire datasets. Scenario 1 used NBAC (1986 to 2020) combined with CNFDB (1981 to 1985) to create a 40-year wildfire layer. Scenario 2 used only CNFDB polygons since 1981. Each wildfire layer was merged with the anthropogenic disturbance layer to create a binary map with a single disturbance class. This map was used as an erase feature to compute the amount of undisturbed habitat in NT1. The resulting layer was then partitioned into six subrange planning regions [33] and the proportions of undisturbed area based on scenario 1 and scenario 2 were compared.

3. Results: Annual Mapping of Fires from 1986 to 2020

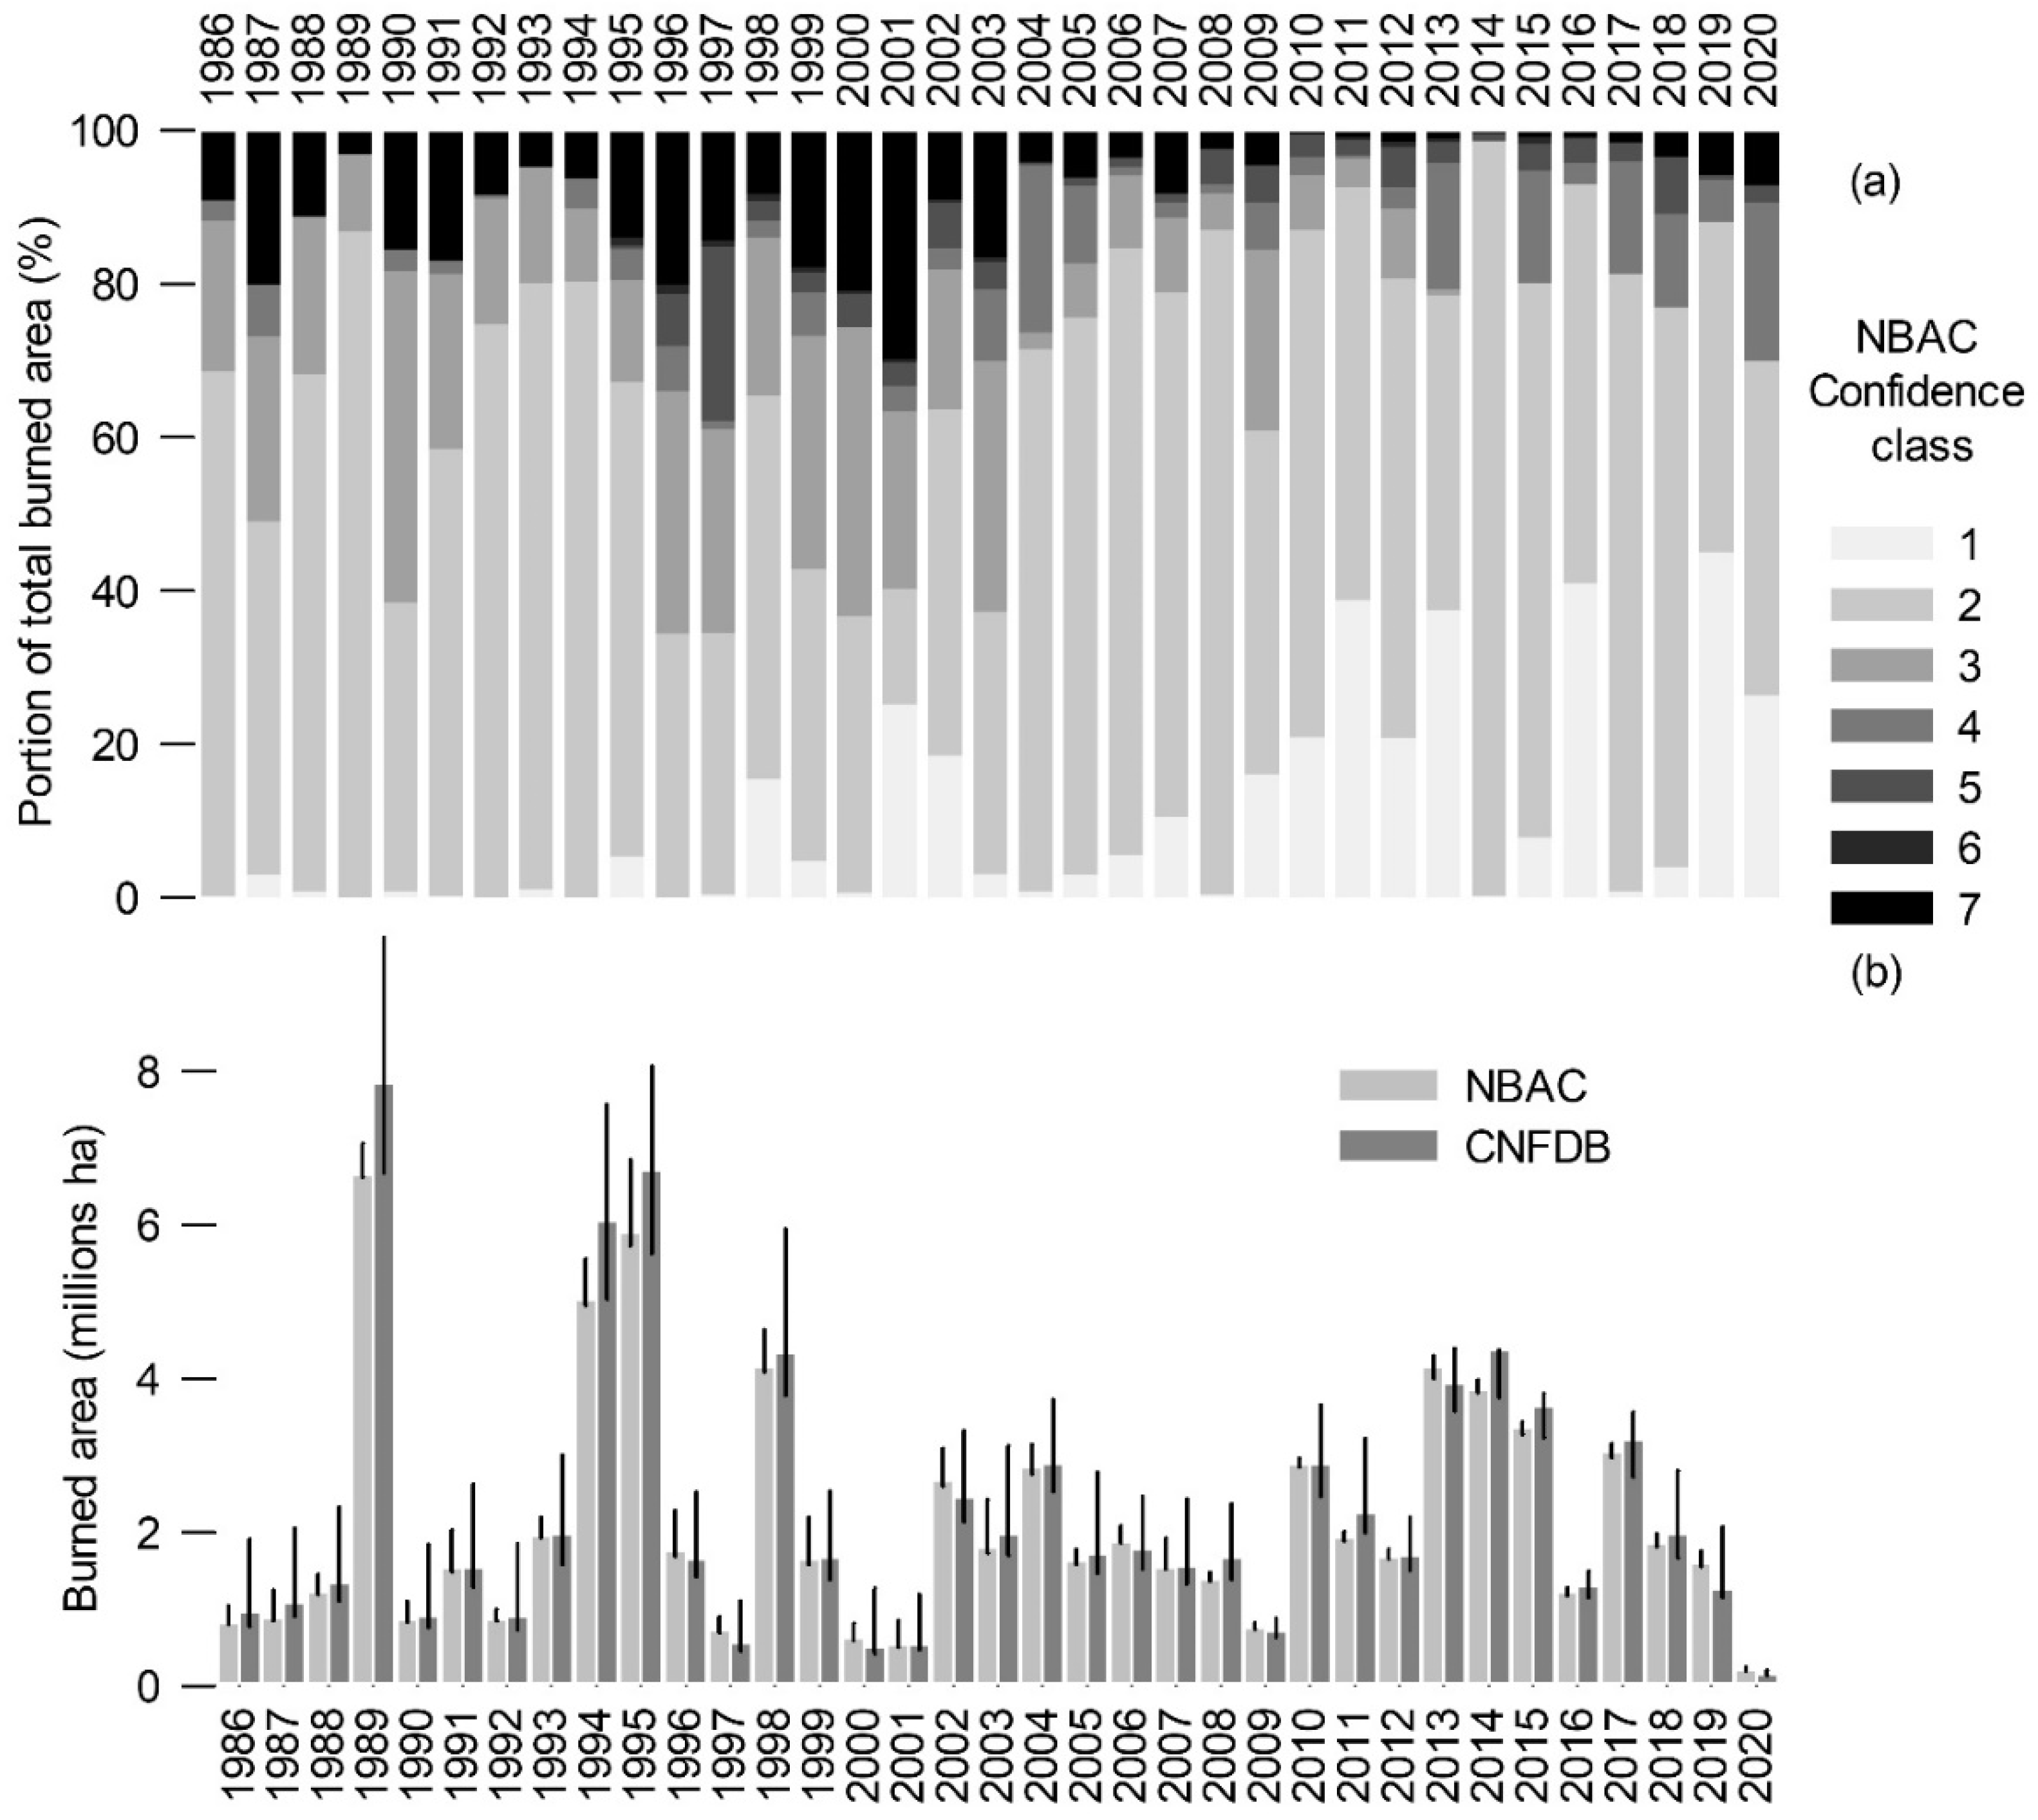
3.1. Burned Area Distribution by Product Source

For the period 1986 to 2020, the proportion of burned area within NBAC was largest for MAFiMS (64.5%), followed by CNFDB (24%), C2C (11.2%), and HANDS (0.3%) (Figure 1). MAFiMS polygons were distributed across all forest regions of Canada, with the largest concentration being in the NWT (96%). Annually, MAFiMS contributions ranged from 98% (2014, where most of the burned area came from NWT) to 15% (2001, a low-fire year where the majority of fires were mapped with either high-quality agency data or C2C). C2C polygons were, likewise, distributed nationally and were present in all fire management jurisdictions. Of the 24% share of the burned area in NBAC from CNFDB, almost one-quarter (24%) corresponded to interpretation of aerial photography, all in Alberta (highest confidence class, see Section 2.6). Another 16% largely corresponded to interpretation of fine resolution (<5 m) satellite imagery, mostly in Quebec (also confidence class 1). Agency mapping of Landsat imagery (manual digitization/thresholding of a dNBR image) corresponded to 23% (confidence class 4) and the remaining 37% corresponded to confidence classes 5 and 7 (aerial GPS, sketch mapping, etc.). Finally, a minimal proportion of the burned area within NBAC was represented by HANDS (0.3%), consisting of the fire events not mapped by the other data sources. Among all data sources and years combined, 91% of NBAC burned area was derived from 30 m or finer imagery (81% and 10%, respectively).

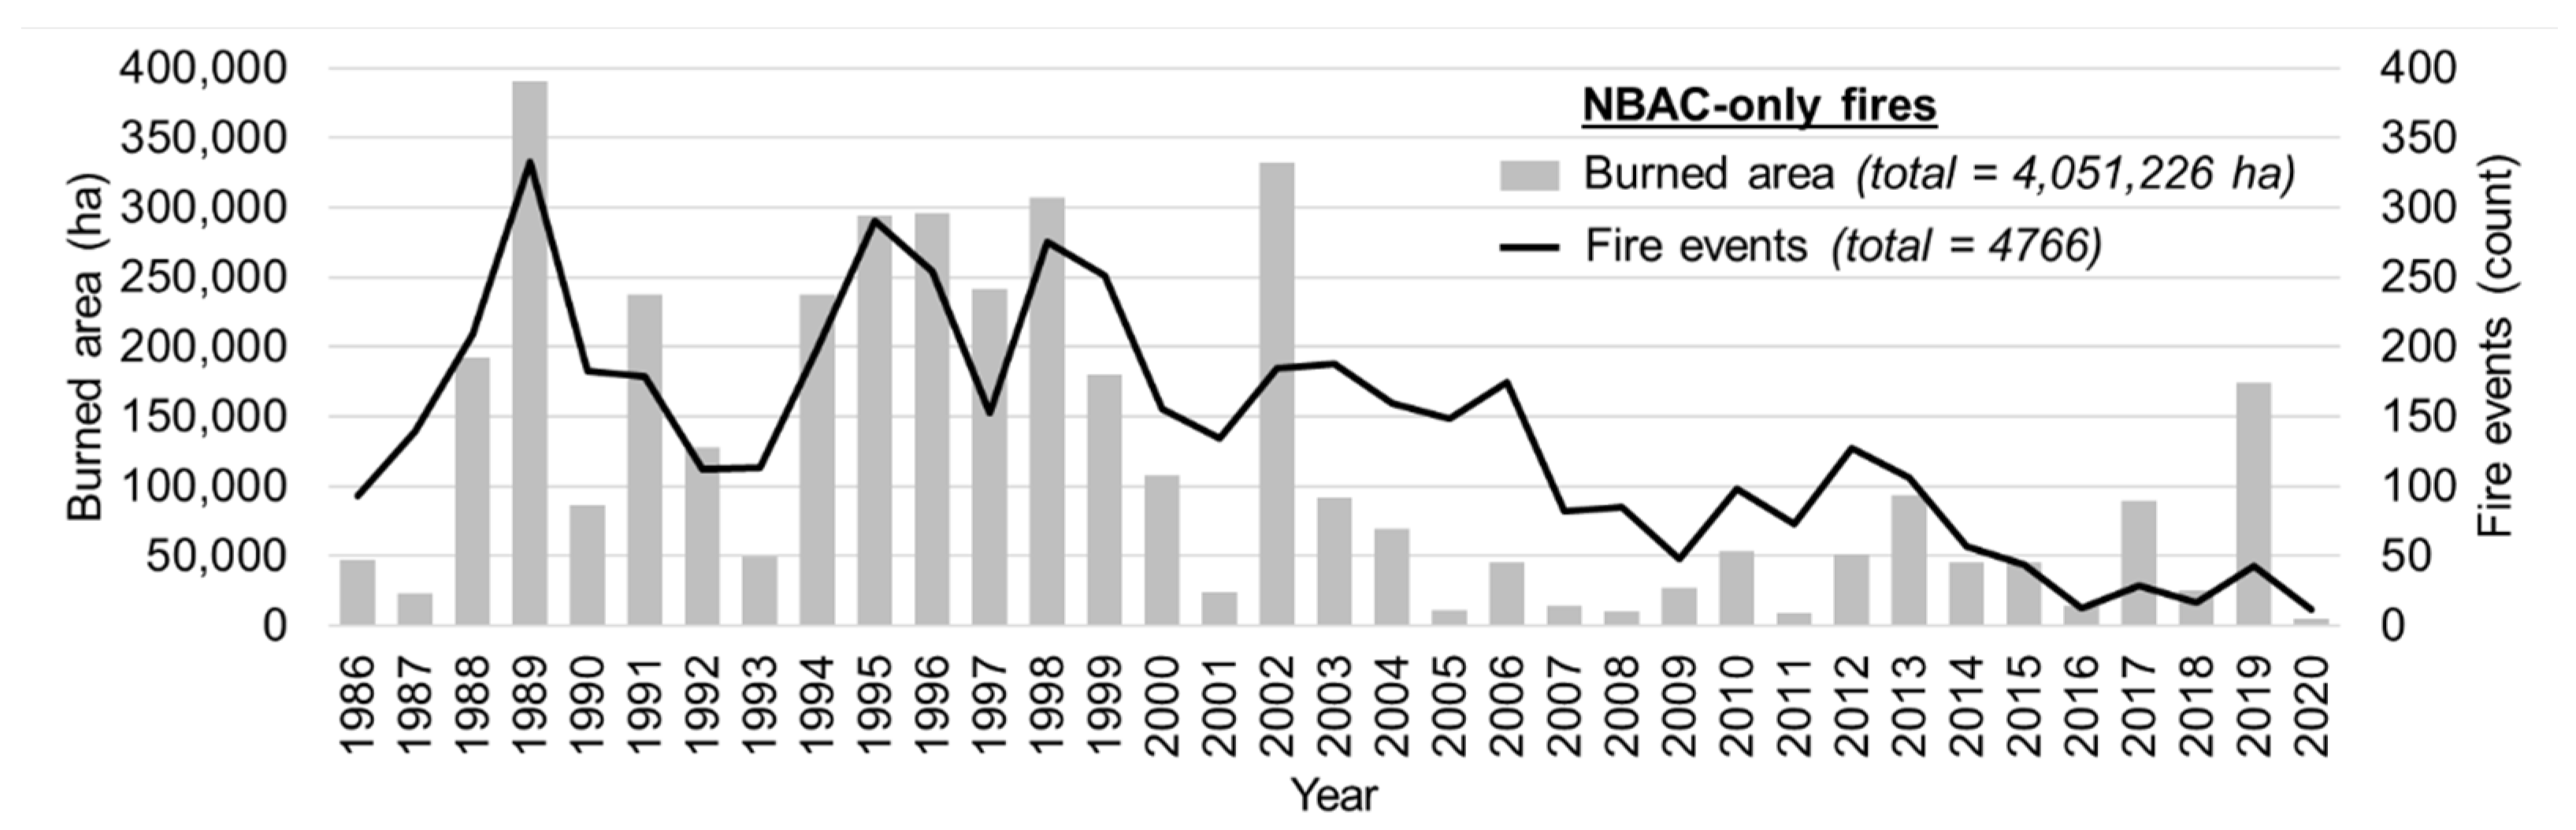
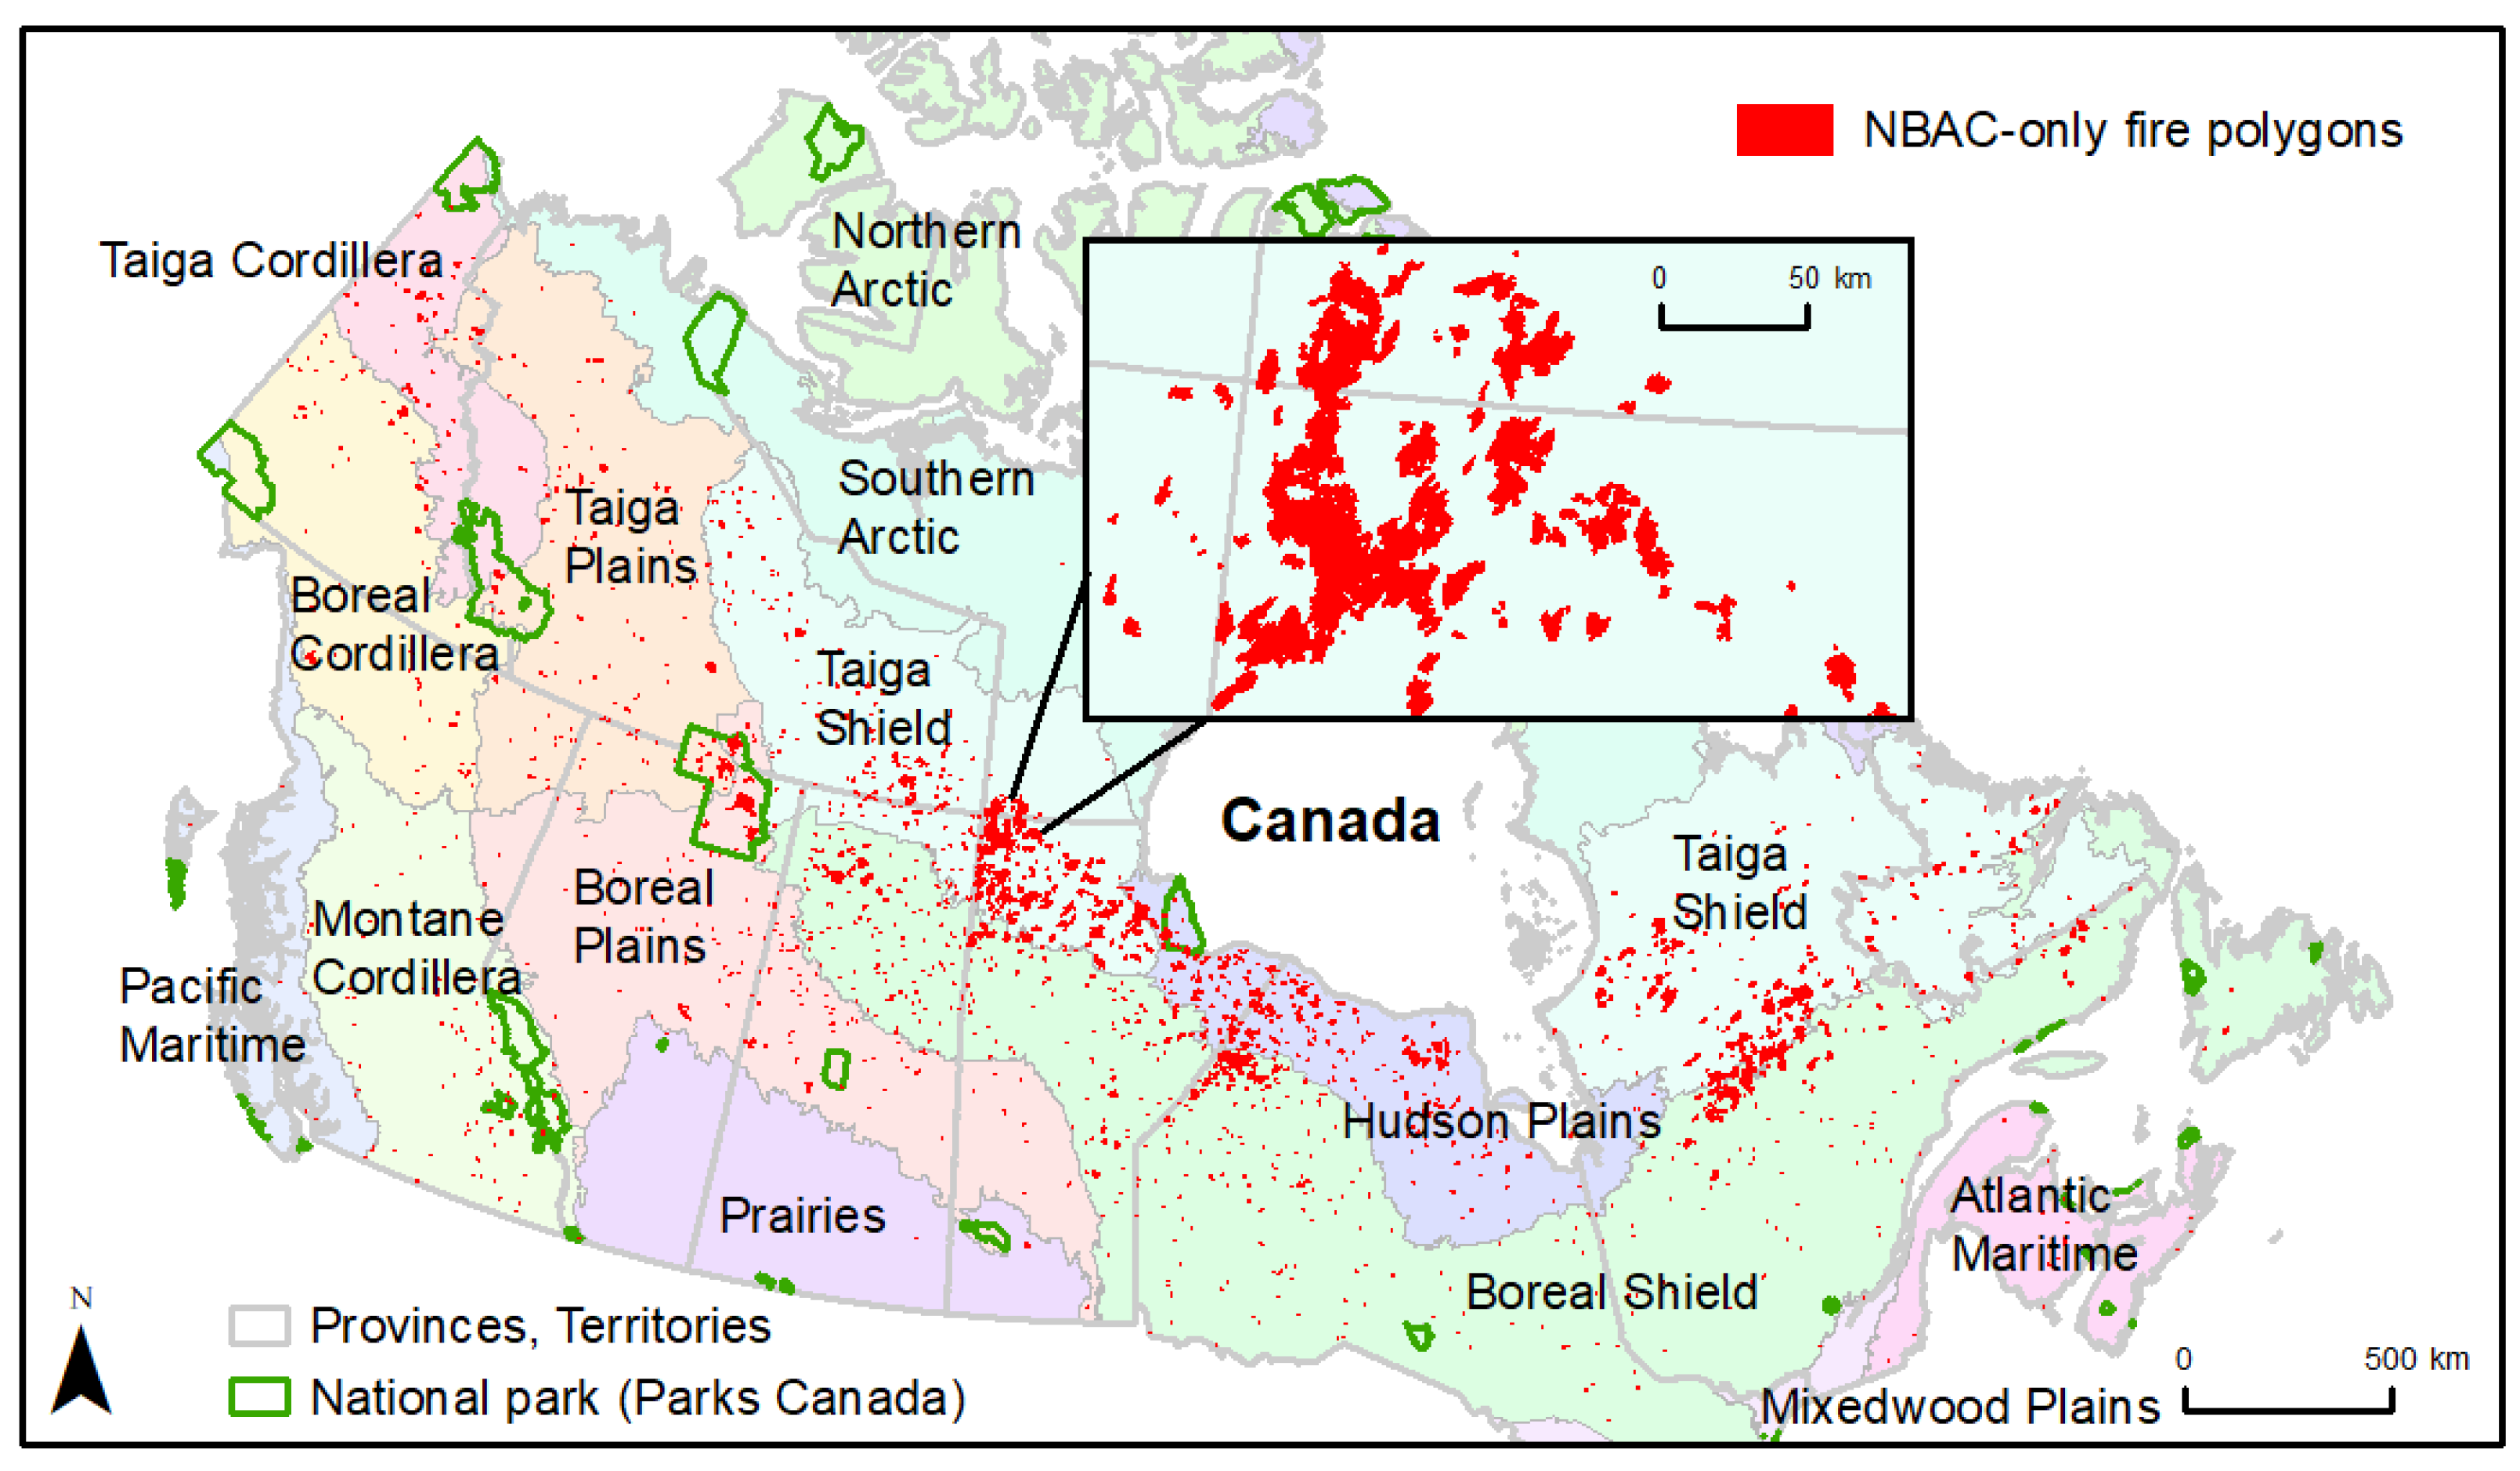
3.2. Annual Burned Area, Fire Attribution, NBAC-Only Fires, and Ecozone Trends

Annual burned area estimates ranged from 215,797 ha (2020) to 6.7 Mha (1989), with an average annual burned area of 2.2 Mha. These results include the area adjustment for lower quality agency and HANDS data, which minimally reduced burned area (1.5% annually) compared with the non-adjusted estimate, owing to the low proportion of these data products within NBAC. Fire start and end dates from satellite hotspots or agency metadata were present in 82% of all fire polygons, corresponding to 98% of the total burned area. Some fire dates were missing because hotspot data collections did not begin until 1989 and not all agencies recorded a start or end date for every fire. Information on fire attribution related to cause (lightning- or human-induced) was available for 75% of all fire polygons, corresponding to 82% (75% lightning-caused, 7% human-caused) of the total burned area. The cause of the fires in the remainder of the burned area was undetermined.
There are 4766 fire events with a total burned area of 4,051,226 ha that appear in NBAC but not in the polygon version of the CNFDB dataset, referred to as NBAC-only fires (Figure 2). The NBAC-only burned area data was created using MAFiMS (60%), C2C (35%), and HANDS (5%). In terms of number of NBAC-only fire polygons, 71% of them had a spatially coincident record in the CNFDB point version. However, the remaining 29% corresponds to 82% of the approximately 4 Mha of NBAC-only burned area, meaning that the majority of these NBAC-only polygons represent burned area unaccounted for in both versions of the CNFDB. By year, the largest amount of NBAC-only data was 390,641 ha in 1989 (Figure 2) and the largest single fire event mapped was in northern Manitoba, where a 120,661 ha fire from 1991 was detected with satellite hotspots and delineated using MAFiMS (Supplementary Information Figure S3). The number and total burned area of NBAC-only fires was highly variable year to year. For example, years 2001 and 2005 had high proportions of NBAC-only fires <200 ha (93% and 89%, respectively), which explains the low burned areas from the high fire counts in those two years (24,162 ha from 134 fires and 11,319 ha from 149 fires, respectively). In contrast, 2019 had fewer NBAC-only fires (just 43) but were larger in size (77% were >200 ha, the largest being 80,620 ha), which yielded a larger annual burned area. Across the ecozones, the largest proportions of NBAC-only burned area were in the Taiga Shield (50%), Boreal Shield (22%), Hudson Plains (12%), and Boreal Plains (5%); each of the other ecozone regions (excluding Northern Arctic) contributed less than 5% of the NBAC-only burned area (Figure 3). The only fires recorded in Nunavut, in the southwest corner of this territory (see inset in Figure 3), were actually NBAC-only fires; this is unsurprising given that Nunavut does not have a fire management agency responsible for mapping wildfires.
The trend analysis using NBAC showed modest changes compared with the analysis using CNFDB data. In most ecozones, NBAC data had either a more positive or negative slope than CNFDB data, but they never changed sign. Statistically significant trends were observed for both fire datasets in the Hudson Plains, Mixedwood Plains, and Montane Cordillera, but only in the Boreal Plains and Atlantic Maritime was there a significant trend in NBAC and a nonsignificant one in CNFDB (Supplementary Information Table S1). For instance, in the Boreal Plains, the slope of the trend increased from 2051.4 ha/y (CNFDB) to 2795.5 ha/y (NBAC), with p-values changing from 0.27 to <0.001, respectively. NBAC was therefore able to detect a significant increasing trend in burned area for the Boreal Plains in 1986–2020; the trend in the CNFDB was not significant.

3.3. Confidence Intervals for Burned Area

The proportion of NBAC burned area in each year as mapped by the seven confidence classes is shown in Figure 4a, with the resulting annual area burned and 95% confidence intervals (2.5th and the 97.5th percentile of 1000 Monte Carlo simulations) in Figure 4b. Annual area burned and 95% CI derived from the CNFDB are also shown in Figure 4b. Numerical values for the estimated 95% confidence intervals for the NBAC are in Supplementary Information Table S2 (Supplementary Table S3 for the CNFDB). For NBAC, the total width of the confidence intervals (97.5th percentile–2.5th percentile) spanned on average ±158,794 ha or ±9.7% of the annual area burned, varying inter-annually from 43,994 ha (year 2020) to 1,124,734 ha (year 1995). Proportionally to area burned, confidence intervals were narrower when more of the burned area was mapped by confidence classes 1 and 2. More burned area was mapped by confidence classes 1 and 2 from 2004 to 2020 (on average 81.5% of annual burned area, Figure 4a) than from 1986 to 2003 (57.1% of annual burned area, Figure 4a). This is reflected in a narrower confidence interval from 2004 to 2020 (±5.1%) than from 1986 to 2003 (±13.6%), relative to ±9.7% overall. Confidence intervals computed for the CNFDB time series using the same methods were on average 1,140,311 ha or 66% of the annual area burned, ranging from 59,765 ha (year 2020) to 3,069,117 ha (year 1989), or ±32.8% overall, 3.4 times wider than those for NBAC.

3.4. NWT Fires and Undisturbed Caribou Habitat

In the NWT, historical estimates of burned area in NBAC were significantly smaller than those originally reported by the agency in CNFDB. The total burned area reported in NBAC for the NWT was nearly 3 Mha less (16%), even though it included the addition of 478,107 ha missing in the historical record in CNFDB (Table 1). This reduction decreased the mean annual burned area from 585,943 ha to 493,109 ha. The largest annual reductions in burned area were for years 1994 (571,074 ha), 2014 (567,728 ha), and 1995 (412,611 ha).
The more accurate MAFiMS-based fire mapping in NBAC also led to a 1.6 Mha increase in the reported amount of undisturbed habitat for boreal woodland caribou in the NT1 range (Table 2). This increase is modest in relative terms (3% of the NT1 area), because of the presence of seismic lines in many of the areas previously reported as burned, which still count as disturbed. Undisturbed habitat increased for most NT1 GNWT planning regions (Table 2); the largest gain was observed for the Southern NWT (735,928 ha), followed by Wek’èezhìi (447,536 ha), Sahtú (302,160 ha), Gwich’in (143,053 ha), and Inuvialuit (7518 ha). Undisturbed habitat decreased in the Yukon planning region (−3402 ha) because more fires were mapped in NBAC (from NBAC-only fires) than in the CNFDB for that region.

4. Discussion

Accurate estimates of burned area depend on the quality of the mapped fire perimeter and the removal of unburned islands and water. This information is critical to understanding the frequency, duration, and trends of wildfires across Canada’s forests [34]. Historical fire maps created by the fire management agencies and compiled in the CNFDB relied largely on aerial surveys using a hand-held GPS or hand-drawn sketch maps, and as a result they have overestimated annual burned area by 11% on average since comprehensive reporting began in the 1950s [8]. Improved fire polygons using Landsat imagery have been created for NBAC since 2004 [9], but extending backwards the time series required a multi-source approach using existing Landsat disturbance mapping systems. The MAFiMS conventional approach based on pre- and post-fire imagery allowed for the selection of post-fire image dates as close as possible to the fire end date, which was particularly important in regions where rapid post-fire vegetation regrowth could obscure spectral changes caused by fire [35,36]. However, the labor intensity of MAFiMS processing limited our ability to map all fire events nationally. Fire data obtained from the C2C product based on Landsat time-series change detection required adjusting the year of burn for some fire events. Fires that occurred earlier in the growing season were often fully captured because of the mid-summer target date of the best-available-pixel compositing algorithm [23]. However, fires that started in mid-summer or late in the season were sometimes partially mapped or assigned to the incorrect year depending on the date of the best available pixels in the area (see the Elephant Hill fire example in Cardille et al. [37]). A conservative approach was adopted regarding quality checks for integrating new C2C delineations into NBAC, wherein we only replaced an agency delineation with C2C when it was clear that the C2C polygon was better than the agency’s and was free from “lumping” (Section 2.3). While C2C only represents 11% of the burned area in the time series, when combined with MAFiMS, over 75% of the burned area in NBAC comes from Landsat delineations that are more accurate than their CNFDB counterparts.
An important contribution of the new NBAC is the addition of 4 Mha of fires largely missing in the CNFDB historical record (82% of those 4 Mha are unreported in both the CNFDB point and polygon versions). The incompleteness of the Canadian fire history in the CNFDB hampers comprehensive analyses of historical burned area [7,34]. This data gap can be attributed in part to policy changes in minimum mapping sizes and fire protection zones. For example, in Ontario, only forest fires greater than 200 ha had their perimeters mapped before 1998; this threshold was lowered to 40 ha thereafter [38]. Early fire surveillance was also less likely to include northern regions that were remote from human settlement and roads, where forest fires would go undetected and unreported [39]. In NBAC, large areas of these unreported fires were detected and mapped over northern Manitoba, Ontario, and Quebec (Figure 3); these fires occurred prior to year 2000 (Figure 2), before use of satellite imagery by some agencies became common [8]. Furthermore, some of these newly mapped, NBAC-only polygons fill data gaps in the CNFDB originating from partial mapping of cross-border fires, where one agency mapped the fire perimeter within their jurisdiction but it remained unmapped by the adjacent agency. The addition of new and more refined burned area polygons in NBAC also leads to different conclusions about trends in wildfire activity. For example, in the Boreal Plains, the CNFDB data show no trend in area burned since 1986, whereas the NBAC data show a significant positive trend.
Another important contribution of this study was the creation of confidence intervals (CIs) for the annual burned area estimates in both NBAC and CNFDB following a Monte Carlo analysis of the uncertainties associated with the different delineation sources present in both time series. The relative width of the CIs is variable across years (Figure 4b) because the proportion of burned area mapped by the different sources varies year to year. In particular, the original period of the NBAC time series (starting in 2004) had larger amounts of high-quality agency data (e.g., from visual interpretation of air photos or high spatial resolution satellite) than the extended period (1986 to 2003). This resulted in narrower confidence intervals for the original period (±5.1% vs. ±13.6% for 1986–2003), which is similar to the value reported by Hall et al. [9] for 2004 to 2016 (±4.3%). Inter-annual variation in the CI width is largely due to variation in the proportion of confidence class 7 (undefined, buffered points from both hotspots and GPS coordinates, and sketch maps). These fires represent 8.4% (range 0.2 to 29.5%) of annual data in the NBAC, and 53.2% (range 1.8 to 96.2%) of the data in the CNFDB. The correlation between this proportion and the CI width is r2 = 0.92 for the NBAC and r2 = 0.4 for the CNFDB. To better understand the impact of confidence class 7 on CI width, two examples in the Supplementary Information help illustrate that fire delineations from this class can considerably underestimate (Figure S4a) and overestimate (Figure S4b) area burned relative to MAFiMS data. In the underestimation case, the relative difference can be much greater than in the overestimation case, and this is even more pronounced for large fires. This means that years where NBAC contains larger fires from confidence class 7 will subsequently have larger propagated error and, therefore, a wider CI. To mitigate this impact and make the Monte Carlo simulation more realistic, the maximum size an individual fire can reach during the simulation is limited to 1 million ha, a size that has never been exceeded in the NBAC record. Overall, given that the method to derive confidence intervals is identical for NBAC and CNFDB, our results support the conclusion that NBAC has achieved a substantial reduction in the uncertainty of annual burned area statistics in Canada (see pWidth ratio column, in Table S3; on average, CNFDB confidence intervals are 3.4 times wider than those in NBAC). To further refine the confidence interval estimates would require increasing the sample size of mapped pairs comparing MAFiMS and C2C to air photo delineation (Class 1, currently n = 50 for MAFiMS and n = 20 for C2C) such that these two classes may be analyzed separately.
A wildlife application of the NBAC time series in NWT suggests there are more than 1.6 million hectares of undisturbed habitat in the NT1 range that are characterized as disturbed when CNFDB data are used. Previous estimates from the federal boreal caribou recovery strategy reported NT1 undisturbed caribou habitat to be 76% of total area in 2012 and 65% in 2017 [40], whereas our analysis indicates that the current figure in 2020 is closer to 71% (70% if the analysis is constrained to 2017, as in [40]). Other studies have shown that Landsat-based burned area maps can accurately identify unburned islands of suitable habitat for caribou [41,42], consistent with our conclusion that the more refined burned-area data in NBAC provide more accurate estimates of undisturbed habitat in NT1. If the NBAC time series captured the full 40-year range required by the federal recovery strategy, it is likely that the undisturbed proportion would increase more, considering that 1981 was a significant burn year in which nearly 1 Mha was mapped over the NT1 range in the CNFDB data. Areas above the 65% undisturbed threshold can involve less mitigation effort than highly disturbed areas, where GNWT land management actions may include enhanced fire suppressions (e.g., prescribed burns or fire breaks to reduce fuel loads) and ecological restoration programs to ensure disturbed habitat is recovering [33]. Range planning has started in the southern NWT and Wek’èezhìı regions, where disturbances are highest (Table 2) and declines in populations have been documented [33]. Other provinces and territories in Canada in need of refined assessments of undisturbed critical habitat could integrate the NBAC time series into disturbance mapping.
Regarding future work, two developments are underway: (i) further extending back in time the NBAC time series to 1972; and (ii) adding burn severity information to NBAC. Prior to the launch of Landsat 5 in 1984, the first Landsat satellites had on board a sensor of coarser spatial and spectral resolution than the 30 m Thematic Mapper (TM) sensor and its successors: the 60 m Multispectral Scanner System (MSS). The MSS lacked the shortwave infrared band but had a near infrared band, thus allowing to compute the Normalized Vegetation Difference Index, which can also be used for fire mapping [43]. As for burn severity, at present, the National Forest Carbon Monitoring, Accounting and Reporting System for estimating emissions and removals of greenhouse gases in Canada’s managed forests considers all burned areas in NBAC as stand-replacing disturbances (i.e., complete mortality of trees, extensive combustion of some biomass pools and surface litter pools) [44]. Although the majority of fires in Canada’s forests do burn at high severity [45,46], there is substantial variability in mortality and biomass combustion within fires [4] that is not captured by the area estimates alone. Currently, the NBAC time series is being updated with new attribution based on burn severity classes (low, moderate, high) to refine estimations of combustion and mortality in the Canadian carbon budget model. This update will incorporate a new, national model based on field-measured Composite Burn Index plots that relate combustion and overstory tree mortality to raster-based burn severity metrics from the Canada Landsat Burned Severity (CanLaBS) product [2]. The implementation of burn severity attribution into the NBAC polygons (e.g., proportion burned by high severity) will also be systematically automated for consistent annual production. Combining maps of area burned with event-specific information on burn severity across the entire NBAC time series will also result in better data for generating forest change indicators of fire disturbance to track effects of a changing climate on Canada’s forests [13].

5. Conclusions

In this study, we enhanced and doubled the span of a time series of accurate, annual maps of forest burned area across Canada. Following the original concepts of NBAC in Hall et al. [9], we integrated spatial delineations of fire events from multiple sources, including Canadian fire management agencies and two Landsat-based products (MAFiMS, C2C) from the Canadian Forest Service of Natural Resources Canada. In the new NBAC time series, 91% of the total burned area was derived from airborne and satellite imagery of 30 m resolution or finer. In addition to burned area, other attributes (fire start and end dates, ignition cause) were appended to the attribute table of fire event polygons in each annual layer. An important contribution from the new NBAC time series is the mapping of 4 Mha of burned area that had been largely unreported in the CNFDB. Another conspicuous difference with CNFDB is that NBAC has substantially reduced uncertainty in burned area reporting: confidence intervals for annual burned area averaged ±9.7% in NBAC, about one-third the width of the confidence intervals derived for CNFDB. These improvements resulted in significant trends in wildfire activity being detectable in NBAC for some ecozones. In the Northwest Territories, burned area estimations from NBAC were 3 Mha less (16%) than reported by the agency, which would result in a 1.6 Mha increase in the calculation of the amount of undisturbed critical habitat for threatened boreal woodland caribou in the NT1 range.
The NBAC burned area polygons can help improve our understanding of landscape fire dynamics in Canada. New innovations in the time series will soon include attribution of burn severity for each NBAC polygon for national-scale application in the Canadian carbon budget model. Additionally, advancements in processing of historical Landsat imagery [14] are providing opportunities to extend NBAC further back to the 1970s. Researchers and practitioners can download the NBAC data from the Canadian Wildland Fire Information System (https://cwfis.cfs.nrcan.gc.ca, accessed on 1 January 2022).

Supplementary Materials

The following supporting information can be downloaded at: https://0-www-mdpi-com.brum.beds.ac.uk/article/10.3390/rs14133050/s1, Figure S1: C2C “splitting” is where a fire event appears split in C2C into two or more events occurring over two consecutive years. In this example, a 2011 fire event is mapped by an agency polygon and hotspot points (a). C2C mapped the fire as occurring in 2011 and 2012 (b). A temporal adjustment to the 2012 portion of the C2C event corrected the year of the burn to 2011 (c). C2C = National Terrestrial Ecosystem Monitoring System Composite to Change; Figure S2: Two unrelated examples of C2C “lumping”, where two nearby fire events that occurred in consecutive years appear as a single fire event in C2C. Each row shows a 2004 fire event adjacent to a separate fire event in 2005, both assigned to the correct year by the fire agency as corroborated by satellite hotspots (a, c). In contrast, C2C mapped the two events in each location as a single fire occurring in 2005 (b, d), which could not be temporally corrected in this study or used in NBAC. C2C = National Terrestrial Ecosystem Monitoring System Composite to Change. NBAC = National Burned Area Composite; Figure S3: A fire event in Manitoba for year 1991 was detected using fire hotspots (green dots) from the AVHRR satellite, but was missed by the agency and not recorded in the CNFDB polygon or point data (A). In NBAC, this fire event was mapped with Landsat imagery (figure backdrop) using MAFIMS, resulting in 120,661 ha of previously unreported burned area (B). NBAC = National Burned Area Composite. AVHRR = Advanced Very High Resolution Radiometer; CNFDB = Canadian National Fire Database; MAFiMS = Multi-Acquisition Fire Mapping System; Figure S4: Examples of agency fire sketch maps that significantly underestimate (a) and overestimate (b) the area burned compared to delineations derived from MAFiMS in NBAC; Table S1: Regional trends by ecozone of annual burned area according to NBAC and CNFDB for the period 1986 to 2020. Only those ecozones with significant trends (p < 0.1) are shown. Ecozones map available from https://en.wikipedia.org/wiki/Ecozones_of_Canada (accessed on 1 January 2022); Table S2: Annual statistics of fires in Canada 1986–2020 according to NBAC, including the estimated 95% confidence intervals lower and upper limits, and absolute and relative width; Table S3: Annual statistics of fires in Canada 1986-2020 according to CNFDB, including the estimated 95% confidence intervals (CIs) lower and upper limits, and absolute and relative width. PWidth size ratio indicates how many times the CIs in CNFDB are wider than those in NBAC.

Author Contributions

Conceptualization, R.S. and G.C.; methodology, R.S., G.C., J.M. and S.R.; software, R.S. and S.R.; validation, J.M.; formal analysis, R.S., E.W., K.G. and M.C.; data acquisition and curation, R.S., S.R. and J.L.; writing—original draft preparation, R.S., G.C. and J.M.; writing—review and editing, all authors; project administration, R.S. and G.C. All authors have read and agreed to the published version of the manuscript.

Funding

Funding for the evaluation and incorporation of C2C into the extended NBAC time series was provided from the Forest Change program of Natural Resources Canada. Funding and in-kind resources for Landsat fire mapping in the NWT using MAFiMS were provided by the Government of NWT (CRA R00893).

Data Availability Statement

The C2C Landsat-derived change product and other open data layers depicting Canada’s forested ecosystems can be obtained here: https://opendata.nfis.org/mapserver/nfis-change_eng.html. The NBAC and CNFDB wildfire datasets that support the findings of this study are openly available at https://cwfis.cfs.nrcan.gc.ca/ (accessed on 1 January 2022).

Acknowledgments

We sincerely thank Ron Hall for his vision, initial conceptualization, and securing of funds for undertaking the extension of the NBAC time series. Internal reviews by Ron Hall and Txomin Hermosilla are greatly appreciated. We also express our thanks to Jennifer Thomas for an editorial review which improved the quality of the originally submitted manuscript.

Conflicts of Interest

The authors declare no conflict of interest.

References

  1. Eidenshink, J.; Schwind, B.; Brewer, K.; Zhu, Z.L.; Quayle, B.; Howard, S. A project for monitoring trends in burn severity. Fire Ecol. 2007, 3, 3–21. [Google Scholar] [CrossRef]
  2. Guindon, L.; Gauthier, S.; Manka, F.; Parisien, M.-A.; Whitman, E.; Bernier, P.; Beaudoin, A.; Villemaire, P.; Skakun, R. Trends in Wildfire Burn Severity across Canada, 1985 to 2015. Can. J. For. Res. 2021, 51, 1230–1244. [Google Scholar] [CrossRef]
  3. Hart, S.J.; Henkelman, J.; McLoughlin, P.D.; Nielsen, S.E.; Truchon-Savard, A.; Johnstone, J.F. Examining Forest Resilience to Changing Fire Frequency in a Fire-prone Region of Boreal Forest. Glob. Change Biol. 2018, 25, 869–884. [Google Scholar] [CrossRef] [PubMed]
  4. Whitman, E.; Parisien, M.-A.; Thompson, D.K.; Hall, R.J.; Skakun, R.S.; Flannigan, M.D. Variability and Drivers of Burn Severity in the Northwestern Canadian Boreal Forest. Ecosphere 2018, 9, e02128. [Google Scholar] [CrossRef] [Green Version]
  5. Tymstra, C.; Stocks, B.J.; Cai, X.; Flannigan, M.D. Wildfire Management in Canada: Review, Challenges and Opportunities. Prog. Disaster Sci. 2020, 5, 100045. [Google Scholar] [CrossRef]
  6. Natural Resources Canada. Canadian National Fire Database. Natural Resources Canada, Canadian Forest Service, Northern Forestry Centre, Edmonton, Alberta. 2022. Available online: https://cwfis.cfs.nrcan.gc.ca/ (accessed on 1 January 2022).
  7. Stocks, B.J.; Mason, J.A.; Todd, J.B.; Bosch, E.M.; Wotton, B.M.; Amiro, B.D.; Flannigan, M.D.; Hirsch, K.G.; Logan, K.A.; Martell, D.L.; et al. Large Forest Fires in Canada, 1959–1997. J. Geophys. Res. 2003, 108, 8149. [Google Scholar] [CrossRef]
  8. Skakun, R.; Whitman, E.; Little, J.M.; Parisien, M.-A. Area Burned Adjustments to Historical Wildland Fires in Canada. Environ. Res. Lett. 2021, 16, 064014. [Google Scholar] [CrossRef]
  9. Hall, R.J.; Skakun, R.S.; Metsaranta, J.M.; Landry, R.; Fraser, R.H.; Raymond, D.; Gartrell, M.; Decker, V.; Little, J. Generating Annual Estimates of Forest Fire Disturbance in Canada: The National Burned Area Composite. Int. J. Wildland Fire 2020, 29, 878–891. [Google Scholar] [CrossRef]
  10. Kurz, W.A.; Apps, M.J. Developing Canada’s National Forest Carbon Monitoring, Accounting and Reporting System to Meet the Reporting Requirements of the Kyoto Protocol. Mitig. Adapt. Strateg. Glob. Change 2006, 11, 33–43. [Google Scholar] [CrossRef]
  11. de Groot, W.J.; Landry, R.; Kurz, W.A.; Anderson, K.R.; Englefield, P.; Fraser, R.H.; Hall, R.J.; Banfield, E.; Raymond, D.A.; Decker, V.; et al. Estimating Direct Carbon Emissions from Canadian Wildland Fires. Int. J. Wildland Fire 2007, 16, 593–606. [Google Scholar] [CrossRef]
  12. Metsaranta, J.M.; Shaw, C.; Kurz, W.A.; Boisvenue, C.; Morken, S. Uncertainty of Inventory-Based Estimates of the Carbon Dynamics of Canada’s Managed Forest (1990–2014). Can. J. For. Res. 2017, 47, 1082–1094. [Google Scholar] [CrossRef]
  13. Gauthier, S.; Lorente, M.; Kremsater, L.; De Grandpre, L.; Burton, P.J.; Aubin, I.; Hogg, E.H.; Nadeau, S.; Nelson, E.A.; Taylor, A.R.; et al. Tracking Climate Change Effects: Potential Indicators for Canada’s Forests and Forest Sector; Natural Resources Canada, Canadian Forest Service: Ottawa, ON, Canada, 2014; 86p. [Google Scholar]
  14. Wulder, M.A.; White, J.C.; Loveland, T.R.; Woodcock, C.E.; Belward, A.S.; Cohen, W.B.; Fosnight, E.A.; Shaw, J.; Masek, J.G.; Roy, D.P. The Global Landsat Archive: Status, Consolidation, and Direction. Remote Sens. Environ. 2016, 185, 271–283. [Google Scholar] [CrossRef] [Green Version]
  15. Oliveira, S.L.J.; Pereira, J.M.C.; Carreiras, J.M.B. Fire Frequency Analysis in Portugal (1975–2005), Using Landsat-Based Burnt Area Maps. Int. J. Wildland Fire 2011, 21, 48–60. [Google Scholar] [CrossRef]
  16. Goodwin, N.R.; Collett, L.J. Development of an Automated Method for Mapping Fire History Captured in Landsat TM and ETM + Time Series across Queensland, Australia. Remote Sens. Environ. 2014, 148, 206–221. [Google Scholar] [CrossRef]
  17. Guindon, L.; Bernier, P.; Gauthier, S.; Stinson, G.; Villemaire, P.; Beaudoin, A. Missing Forest Cover Gains in Boreal Forests Explained. Ecosphere 2018, 9, e02094. [Google Scholar] [CrossRef] [Green Version]
  18. Henry, M.C. Comparison of Single-and Multi-Date Landsat Data for Mapping Wildfire Scars in Ocala National Forest, Florida. Photogramm. Eng. Remote Sens. 2008, 74, 881–891. [Google Scholar] [CrossRef] [Green Version]
  19. Stroppiana, D.; Bordogna, G.; Carrara, P.; Boschetti, M.; Boschetti, L.; Brivio, P.A. A Method for Extracting Burned Areas from Landsat TM/ETM+ Images by Soft Aggregation of Multiple Spectral Indices and a Region Growing Algorithm. ISPRS J. Photogramm. Remote Sens. 2012, 69, 88–102. [Google Scholar] [CrossRef]
  20. Bastarrika, A.; Alvarado, M.; Artano, K.; Martinez, M.; Mesanza, A.; Torre, L.; Ramo, R.; Chuvieco, E. BAMS: A Tool for Supervised Burned Area Mapping Using Landsat Data. Remote Sens. 2014, 6, 12360–12380. [Google Scholar] [CrossRef] [Green Version]
  21. Zhu, Z. Change Detection Using Landsat Time Series: A Review of Frequencies, Preprocessing, Algorithms, and Applications. ISPRS J. Photogramm. Remote Sens. 2017, 130, 370–384. [Google Scholar] [CrossRef]
  22. French, N.H.F.; Kasischke, E.S.; Hall, R.J.; Murphy, K.A.; Verbyla, D.L.; Hoy, E.E.; Allen, J.L. Using Landsat Data to Assess Fire and Burn Severity in the North American Boreal Forest Region: An Overview and Summary of Results. Int. J. Wildland Fire 2008, 17, 443–462. [Google Scholar] [CrossRef]
  23. Hermosilla, T.; Wulder, M.A.; White, J.C.; Coops, N.C.; Hobart, G.W.; Campbell, L.B. Mass Data Processing of Time Series Landsat Imagery: Pixels to Data Products for Forest Monitoring. Int. J. Digit. Earth 2016, 9, 1035–1054. [Google Scholar] [CrossRef] [Green Version]
  24. White, J.C.; Wulder, M.A.; Hermosilla, T.; Coops, N.C.; Hobart, G.W. A nationwide annual characterization of 25 years of forest disturbance and recovery for Canada using Landsat time series. Can. J. Remote Sens. 2017, 194, 303–321. [Google Scholar] [CrossRef]
  25. Natural Resources Canada. The State of Canada’s Forests 2015; Natural Resources Canada, Canadian Forest Service: Ottawa, ON, Canada, 2015; 75p. [Google Scholar]
  26. Lewis, K.J.; Johnson, C.J.; Karim, N. Fire and lichen dynamics in the Taiga Shield of the Northwest Territories and implications for barren-ground caribou winter forage. J. Veg. Sci. 2019, 30, 448–460. [Google Scholar] [CrossRef]
  27. Environment Canada. Recovery Strategy for the Woodland Caribou (Rangifer tarandus caribou), Boreal Population, in Canada; Species at Risk Act Recovery Strategy Series; Environment Canada: Ottawa, ON, Canada, 2012. [Google Scholar]
  28. Kolden, C.A.; Weisberg, P.J. Assessing Accuracy of Manually-Mapped Wildfire Perimeters in Topographically Dissected Areas. Fire Ecol. 2007, 3, 22–31. [Google Scholar] [CrossRef]
  29. Hantson, S.; Padilla, M.; Corti, D.; Chuvieco, E. Strengths and Weaknesses of MODIS Hotspots to Characterize Global Fire Occurrence. Remote Sens. Environ. 2013, 131, 152–159. [Google Scholar] [CrossRef]
  30. Fraser, R.; Li, Z.; Cihlar, J. Hotspot and NDVI differencing synergy (HANDS): A new technique for burned area mapping over boreal forest. Remote Sens. Environ. 2000, 74, 362–376. [Google Scholar] [CrossRef]
  31. Ecological Stratification Working Group. A National Ecological Framework for Canada; Report and National Map at 1:7500 000 Scale; Agriculture and Agri-Food Canada, Research Branch, Centre for Land and Biological Resources Research and Environment Canada, State of the Environment Directorate, Ecozone Analysis Branch: Ottawa, ON, Canada; Hull, UK, 1995. [Google Scholar]
  32. Pasher, J.; Seed, E.; Duffe, J. Development of Boreal Ecosystem Anthropogenic Disturbance Layers for Canada Based on 2008 to 2010 Landsat Imagery. Can. J. Remote Sens. 2013, 39, 42–58. [Google Scholar] [CrossRef]
  33. Government of the Northwest Territories. A Framework for Boreal Caribou Range Planning; Environment and Natural Resources, Government of the Northwest Territories: Yellowknife, NT, Canada, 2019; ISBN 978-0-7708-0266-0. [Google Scholar]
  34. Hanes, C.C.; Wang, X.; Jain, P.; Parisien, M.-A.; Little, J.M.; Flannigan, M.D. Fire-Regime Changes in Canada over the Last Half Century. Can. J. For. Res. 2019, 49, 256–269. [Google Scholar] [CrossRef]
  35. Bartels, S.F.; Chen, H.Y.H.; Wulder, M.A.; White, J.C. Trends in Post-Disturbance Recovery Rates of Canada’s Forests Following Wildfire and Harvest. For. Ecol. Manag. 2016, 361, 194–207. [Google Scholar] [CrossRef] [Green Version]
  36. Boucher, D.; Gauthier, S.; Thiffault, N.; Marchand, W.; Girardin, M.; Urli, M. How Climate Change Might Affect Tree Regeneration Following Fire at Northern Latitudes: A Review. New For. 2020, 51, 543–571. [Google Scholar] [CrossRef] [Green Version]
  37. Cardille, J.A.; Perez, E.; Crowley, M.A.; Wulder, M.A.; White, J.C.; Hermosilla, T. Multi-Sensor Change Detection for Within-Year Capture and Labelling of Forest Disturbance. Remote Sens. Environ. 2022, 268, 112741. [Google Scholar] [CrossRef]
  38. Ministry of Natural Resources. NRVIS/OLIW Data Management Model for Fire Disturbance Area; Land Information Ontario, 2006. Version 1.0; Ministry of Natural Resources: Peterborough, ON, Canada, 2006. [Google Scholar]
  39. Bridge, S.R.J.; Miyanishi, K.; Johnson, E.A. A Critical Evaluation of Fire Suppression Effects in the Boreal Forest of Ontario. For. Sci. 2005, 51, 41–50. [Google Scholar] [CrossRef]
  40. Environment and Climate Change Canada. Report on the Progress of Recovery Strategy Implementation for the Woodland Caribou (Rangifer Tarandus Caribou), Boreal Population, in Canada for the Period 2012–2017; Species at Risk Act Recovery Strategy Series; Environment and Climate Change Canada: Ottawa, ON, Canada, 2017. [Google Scholar]
  41. Kansas, J.; Vargas, J.; Skatter, H.G.; Balicki, B.; McCullum, K. Using Landsat Imagery to Backcast Fire and Post-Fire Residuals in the Boreal Shield of Saskatchewan: Implications for Woodland Caribou Management. Int. J. Wildland Fire 2016, 25, 597–607. [Google Scholar] [CrossRef]
  42. Russell, K.L.; Johnson, C.J. Post-Fire Dynamics of Terrestrial Lichens: Implications for the Recovery of Woodland Caribou Winter Range. For. Ecol. Manag. 2019, 434, 1–17. [Google Scholar] [CrossRef]
  43. Chen, W.; Moriya, K.; Sakai, T.; Koyama, L.; Cao, C.X. Mapping a burned forest area from Landsat TM data by multiple methods. Geomat. Nat. Hazards Risk. 2016, 7, 384–402. [Google Scholar] [CrossRef] [Green Version]
  44. Kurz, W.; Dymond, C.; White, T.; Stinson, G.; Shaw, C.; Rampley, G.; Smyth, C.; Simpson, B.; Neilson, E.; Trofymow, J.; et al. CBM-CFS3: A Model of Carbon-Dynamics in Forestry and Land-Use Change Implementing IPCC Standards. Ecol. Model. 2009, 220, 480–504. [Google Scholar] [CrossRef]
  45. Kafka, V.; Gauthier, S.; Bergeron, Y. Fire Impacts and Crowning in the Boreal Forest: Study of a Large Wildfire in Western Quebec. Int. J. Wildland Fire 2001, 10, 119–127. [Google Scholar] [CrossRef]
  46. Ferster, C.; Eskelson, B.; Andison, D.; LeMay, V. Vegetation Mortality within Natural Wildfire Events in the Western Canadian Boreal Forest: What Burns and Why? Forests 2016, 7, 187. [Google Scholar] [CrossRef] [Green Version]
Figure 1. The National Burned Area Composite of wildfires in Canada from 1986 to 2020, by data product source. MAFiMS: Multi-Acquisition Fire Mapping System, CNFDB: Canadian National Fire Database, C2C: Composite to Change, HANDS: Hotspot and NDVI Differencing Synergy.
Remotesensing 14 03050 g001
Figure 2. Annual burned area and count of NBAC-only fires (unreported in the polygon version of the CNFDB).
Remotesensing 14 03050 g002
Figure 3. Location of NBAC-only fires (unreported in the polygon version of the CNFDB). Within the ecozones, the largest proportions of NBAC-only burned areas were in the Taiga Shield (50%), Boreal Shield (22%), Hudson Plains (12%), and Boreal Plains (5%). Each of the other ecozone regions (excluding Northern Arctic) contributed less than 5%.
Remotesensing 14 03050 g003
Figure 4. Proportion of burned area mapped by each confidence class method in each year in the extended NBAC (a), and annual area burned with 95% confidence intervals for the extended NBAC and the CNFDB (b).
Remotesensing 14 03050 g004
Table 1. Summary of forest wildfires in the NWT from 1986 to 2017 * using CNFDB and NBAC data.
UnitNWT: CNFDBNWT: NBAC
Number of fires mappedcount27373196
Average annual area burned ha585,943493,109
Total area burned of all firesha18,750,18515,779,487
Difference in area burned (NBAC minus CNFDB)ha –2,970,698
Percent change of total area (NBAC minus CNFDB)% –16
NBAC-only burned area (unreported in CNFDB)ha 478,107
* Historical fire polygons for the NWT are updated in NBAC to 2017. In 2018, CFS and the Government of NWT wildfire agency began working collaboratively to produce current-year fire polygons and the data are the same in CNFDB and NBAC. CFS = Canadian Forest Service; NWT = Northwest Territories.
Table 2. Estimations of boreal woodland caribou undisturbed habitat for the different planning regions within the NT1 range using NBAC versus CNFDB data.
NT1 Planning RegionProportion of NT1 Area (%)Change in Undisturbed Area Using NBAC (ha)Proportion of Undisturbed Area Using NBAC (%)Proportion of Undisturbed Area Using CNFDB (%)
Inuvialuit775189797
Gwich′in9143,0537167
Sahtú34302,1608078
Wek’èezhìi11447,5366859
Southern NWT37735,9285854
Yukon2−34027778
Total1001,632,7937168
Publisher’s Note: MDPI stays neutral with regard to jurisdictional claims in published maps and institutional affiliations.

