
Exploring VIIRS Night Light Long-Term Time Series with CNN/SI for Urban Change Detection and Aerosol Monitoring


1
Center for Satellite Applications and Research, NOAA/NCWCP, College Park, MD 20740, USA
2
CISESS, University of Maryland, 5825 University Research Ct., College Park, MD 20740, USA
3
ESRI DC Regional Office, 8615 Westwood Center Dr., Vienna, VA 92373, USA
*
Author to whom correspondence should be addressed.
Remote Sens. 2022, 14(13), 3126; https://0-doi-org.brum.beds.ac.uk/10.3390/rs14133126
Submission received: 23 May 2022
/
Revised: 22 June 2022
/
Accepted: 25 June 2022
/
Published: 29 June 2022
(This article belongs to the Special Issue Remote Sensing of Night-Time Light)
Abstract
:There is a great need to study the decadal long-term time series of urban night-light changes since the launch of Suomi NPP, NOAA-20, to future JPSS-2, 3, and 4 in the next decades. The recently recalibrated and reprocessed Suomi NPP VIIRS/DNB dataset overcomes a number of limitations in the operational data stream for time series studies. However, new methodologies are desirable to explore the large volume of historical data to reveal long-term socio-economic and environmental changes. In this study, we introduce a novel algorithm using convolutional neural network similarity index (CNN/SI) to rapidly and automatically identify cloud-free observations for selected cities. The derived decadal clear sky mean radiance time series allows us to study the urban night light changes over a long period of time. Our results show that the radiometric changes for some metropolitan areas changed on the order of 29% in the past decade, while others had no appreciable change. The strong seasonal variation in the mean radiance appears to be highly correlated with seasonal aerosol optical thickness. This study will facilitate the use of recalibrated/reprocessed data, and improve our understanding of urban night light changes due to geophysical, climatological, and socio-economic factors.

1. Introduction
The launch of the Suomi NPP satellite with the Visible Infrared Imaging Radiometer Suite (VIIRS) has inspired many novel studies in both geophysical and social economic research. In particular, the VIIRS Day/Night Band (DNB) enabled unprecedented capabilities in low light imaging at night, with the ability to detect faint lights emitted from the atmosphere or the so-called air glows at a radiance level on the order of 1.0 × 10⁻¹⁰ W/(cm2-sr). Recent studies also suggest that it might be able to detect bio-luminescence if the instrument is well calibrated [1]. This is in addition to the well-publicized fishing boat detection [2], light outages [3], and night fires which are at higher radiance levels. It can also be used to detect the internal waves and possibly other oceanic surface features under sun and moon glint [4]. For social economic applications, numerous published results have correlated economic activities with night lights. Ten years of valuable global observations of night light from Suomi NPP VIIRS/DNB have been accumulated at the NOAA CLASS archive. Recent efforts at NOAA Center for Satellite Applications and Research (STAR) have recalibrated and re-processed the Suomi NPP sensor data records (or level 1b) which is made available currently through the NOAA cooperative institute at University of Maryland, and will be made available on the NOAA CLASS later [5]. In addition, NOAA-20 VIIRS was launched in November 2017 and has been operating successfully for 4+ years, and it will be followed by JPSS-2, 3, and 4 in the next decades, all equipped with VIIRS. Therefore, the night light observation data will grow significantly and greater opportunities will exist to use the night light data for geophysical, environmental, climatological, and social economic studies.
Despite the tremendous progress, the use of VIIRS DNB data is still somewhat limited for scientific research and great potential exists. There are several known challenges. First, most social economic studies use the NOAA NGDC-produced monthly composite clear sky average radiances. While this dataset works well for correlation studies with social economic variables where there is no stringent need for stability in the time series, it has drawbacks when used for time series analysis, because the NGDC data was created based on operationally produced VIIRS SDRs at NOAA operations which had a number of inconsistencies, and that makes it difficult for time series studies where stable calibration is a prerequisite. In addition, extracting time series data for a small urban area from a large global dataset can be challenging. Second, for studies using the VIIRS SDR data, obtaining clear sky images is a major challenge. This is because the traditional method relies on using the cloud masks generated from other channels of VIIRS, which is a downstream product produced separately in the data production. Applying the VIIRS cloud mask to DNB requires some skills in spatial matching especially at high scan angles since the spatial resolution difference between DNB and other bands grows with scan angle. Unfortunately, a large percentage of the satellite observations always have cloud coverage. As a result, time series analysis using the VIIRS DNB data becomes difficult. Another challenge for data access is that NOAA NGDC has ceased the production of the monthly mean VIIRS night light data as of 15 October 2019, and the follow-on effort has been transferred to the academic sector at the Colorado School of Mines (https://ngdc.noaa.gov/eog/index.html, accessed on 21 June 2022).
In this study, we present an Artificial Intelligence CNN/SI method for separating clear sky from cloudy DNB images automatically so that a time series can be generated for analyzing the long-term urban night light changes, and we demonstrate its use for selected metropolitan areas. The recalibrated/reprocessed Suomi NPP VIIRS/DNB data used in this study has much improved data quality, stability, and accuracy, and allows us to detect long term urban night light changes. It is known that urban night lights are affected by a number of other factors, such as moon light which varies greatly for a given urban area, clouds and aerosols which may attenuate and/or diffuse urban lights. In the following sections, we present the methodology and data, followed by applications for selected cities. The time series for these cities are analyzed with concluding remarks and recommended future studies.
2. Methodology and Data
The Suomi NPP and NOAA-20 satellites have an equator crossing time of ~1:30 a.m. descending local time, or near mid-night. There are advantages and disadvantages for this observation time. At midnight, the night lights are more stable compared to early evening when there would still be varying light changes due to daily human activities. Therefore, the observations from the VIIRS/DNB would be mainly for late night lights which are mostly lit overnight, including street lights. On the flip side, the late-night light does not capture the range of human activities and most likely would underestimate the light intensity over the areas of study because of the observation time at mid-night.
This study addresses two major issues in time series analysis using VIIRS DNB datasets. The first is long-term calibration stability, achieved by using recalibrated VIIRS/DNB SDR, and the second is the development of a method to perform rapid identification of clear sky images using the AI CNN/SI approach for night time images. The traditional cloud mask-based approach is rather complex since it requires a separate data set (cloud mask product), and the pixel by pixel matching is not straightforward since VIIRS DNB has a near constant spatial resolution across scan while the cloud mask is based on radiometric band observations (also known as VIIRS M-bands) which have a growing pixel size towards the high scan angles from nadir, from 750 m to 1.6 km to the edge of the scan [6]. In addition, the cloud mask is a separate product with a latency in production which means one would have to find the matching data files from the archive. There are also issues related to different versions of the cloud masks with different algorithms that make the task more complex.
To address these challenges, we present a novel methodology using artificial intelligence. In our study, we experimented with two separate AI based approaches. The first approach is an atypical method, in which image similarity comparisons are performed between a known clear sky image of a given city and all candidate images, which produces a similarity index (SI) for each pair of images based on CNN/SI. The clear sky images are found based on the similarity index in the subsequent classification, much like face matching based on photographs from a database of photographs, or genetic identification based on DNAs.
The second approach uses the typical procedure of training the CNN model to learn cloudy vs. clear night light images of selected cities. The model is then validated and used to predict whether a given night light image is clear or cloudy within a certain accuracy. Based on experiments comparing the two approaches, we found that the second approach has greater potential because once it is well trained, it is able to find clear sky images of any city; however, the current results show that the prediction accuracy is not ideal (<64%) for cloudy images. In contrast, the CNN/SI image similarity approach is more accurate although it has to be done for each city separately and with georeferencing. As a result, in this study, the CNN/SI approach is used.
The AI CNN/SI model used in this study is the popular Tensorflow/Keras with Python. The MobileNet V2 CNN [7] is used for image identification and similarity analysis between VIIRS DNB images. Images with high SI similarity are clustered and grouped together. A simpler explanation of this process is that a clear sky night light image of a city has a distinct spatial pattern, while cloudy images have a different, blurred pattern; therefore, the similarity index (SI) between the clear sky and cloudy images are lower than those between clear sky images. In addition, since cloud patterns are usually random, cloudy night light images typically do not have high similarities to other night light observations, either clear sky or cloudy. However, exceptions do exist, in which two cloudy night light images could be very similar. Therefore, in this study we introduce the known “seed” clear sky night light image as a reference in comparisons based on similarity index (SI). Similarly, lunar-contaminated night light images would have a different pattern than clear sky images acquired during the new moon, although we found that clear sky images during the new moon may have higher similarities to those during full or partial moon. Therefore, another criterion is used to screen out lunar-illuminated images, which is based on the minimum radiance within the study area (typically over large water bodies). If the minimum radiance is lower than a threshold value, then the image is considered unaffected by the lunar light. We have experimented with a threshold value between 0.5 and 1.0 nW/(cm2-sr), and choose to use 0.6 nW/(cm2-sr), which is the same value used by Elvidge [8] as the DNB noise floor in their study.
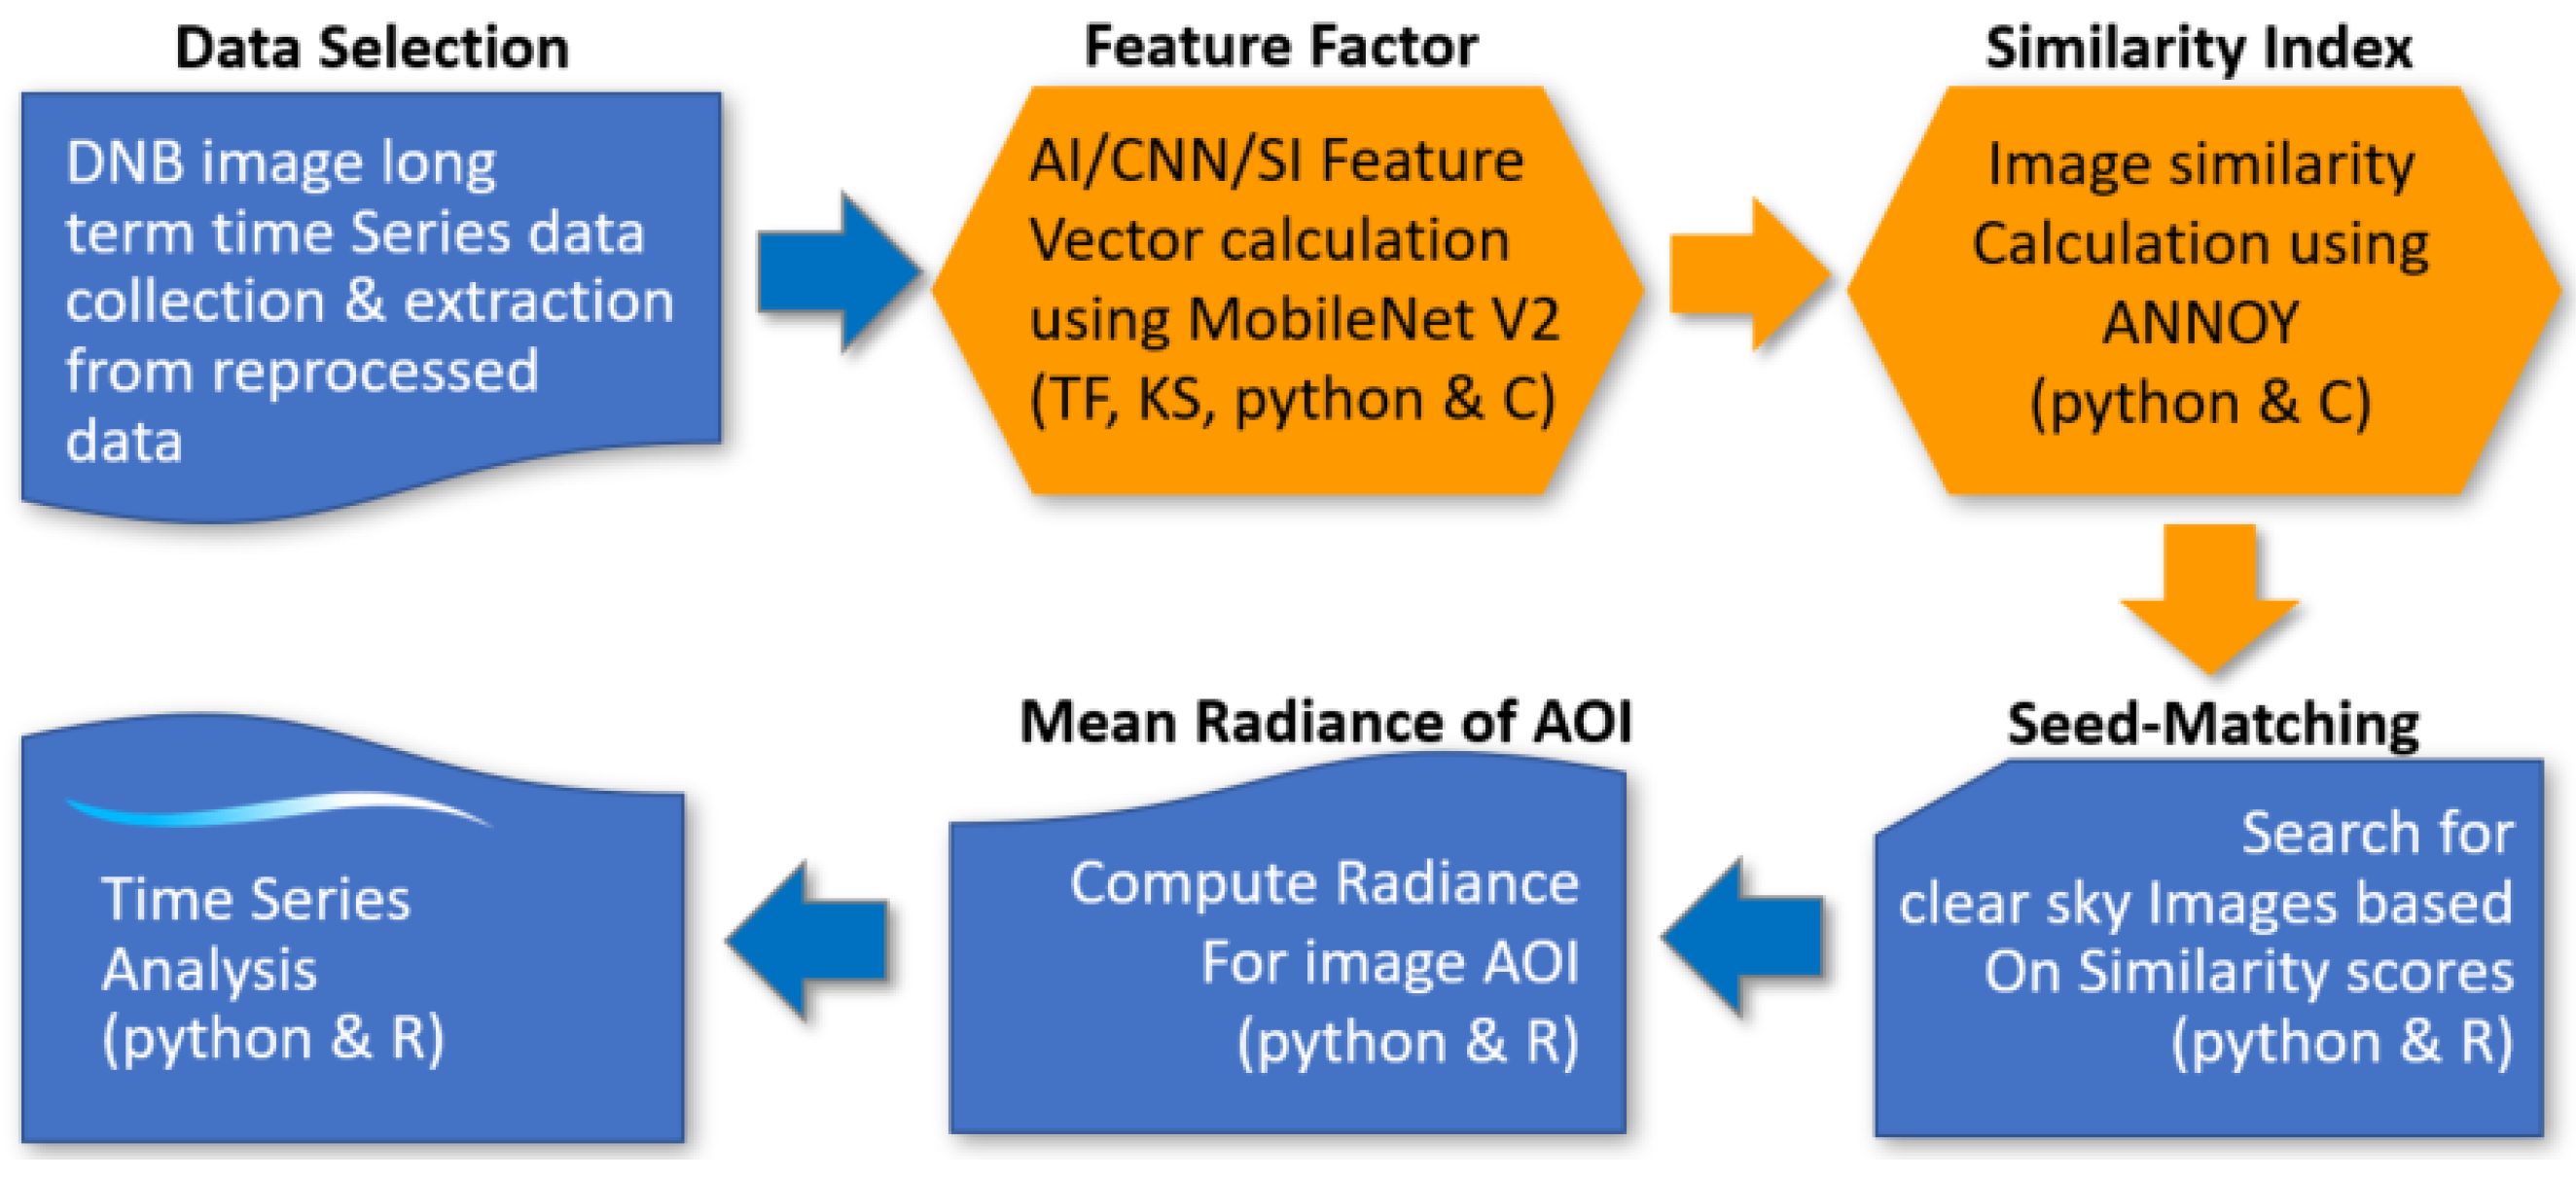
Figure 1 provides an overview of the method and procedure used in this study. First, a time series of near nadir VIIRS/DNB night light images over a particular city is collected from the reprocessed database. In our case, the reprocessed VIIRS SDR (or level 1b) is used, as discussed earlier. Second, the CNN/SI model is applied to the areas of interest for the city selected to generate a unique identification called “feature vector” for each image, with multiple dimensions. Third, based on the unique identification of the images, a similarity index (SI) is computed between every pair of images in this multi-dimensional space. Fourth, our algorithm then searches for images with high similarity to the known clear sky “seed” image based on similarity scores recursively. Finally, the mean radiances for the selected clear sky images are computed for the area of interest, which becomes the time series for analysis of urban night light changes.
While the procedure and methodology are relatively straightforward, as presented in Figure 1, the key component of CNN/SI requires further explanation. In this study, we leverage several state-of-the-art key components that have become available in the field of artificial intelligence in the last few years, which includes Tensorflow, Keras, MobileNet V2, image feature vector, and ANNOY as discussed below:
Tensorflow is an end-to-end open-source platform for machine learning developed by Google. It has tools, libraries, and community resources that let developers easily build and deploy machine learning applications. Keras is a deep learning API written in Python, running on top of the machine learning platform Tensorflow. TensorFlow Hub provides many reusable machine learning models online. It makes transfer learning very easy, as it provides pre-trained models for different problems and tasks, such as image classification and segmentation. In this study, it is used as the basis and interface to the MobileNet V2 as discussed later.
A key concept in the AI/CNN/SI approach used in this study is the image feature vector which is a unique list of numbers or identifiers that represents a particular image, used for image similarity calculations or image classification tasks. An analogy of image feature vector or signature to an image would be the DNA to a human. It more closely resembles DNA than a signature, because each feature vector has categorical or inheritance information embedded. Low-level image features are minor details of the image, such as lines, edges, corners, or dots, while high-level features are built on top of low-level features to detect objects and larger shapes in the image. Both types of features can be detected using CNN. Some convolutional layers can capture low-level features, while the later layers learn to recognize common shapes and objects.
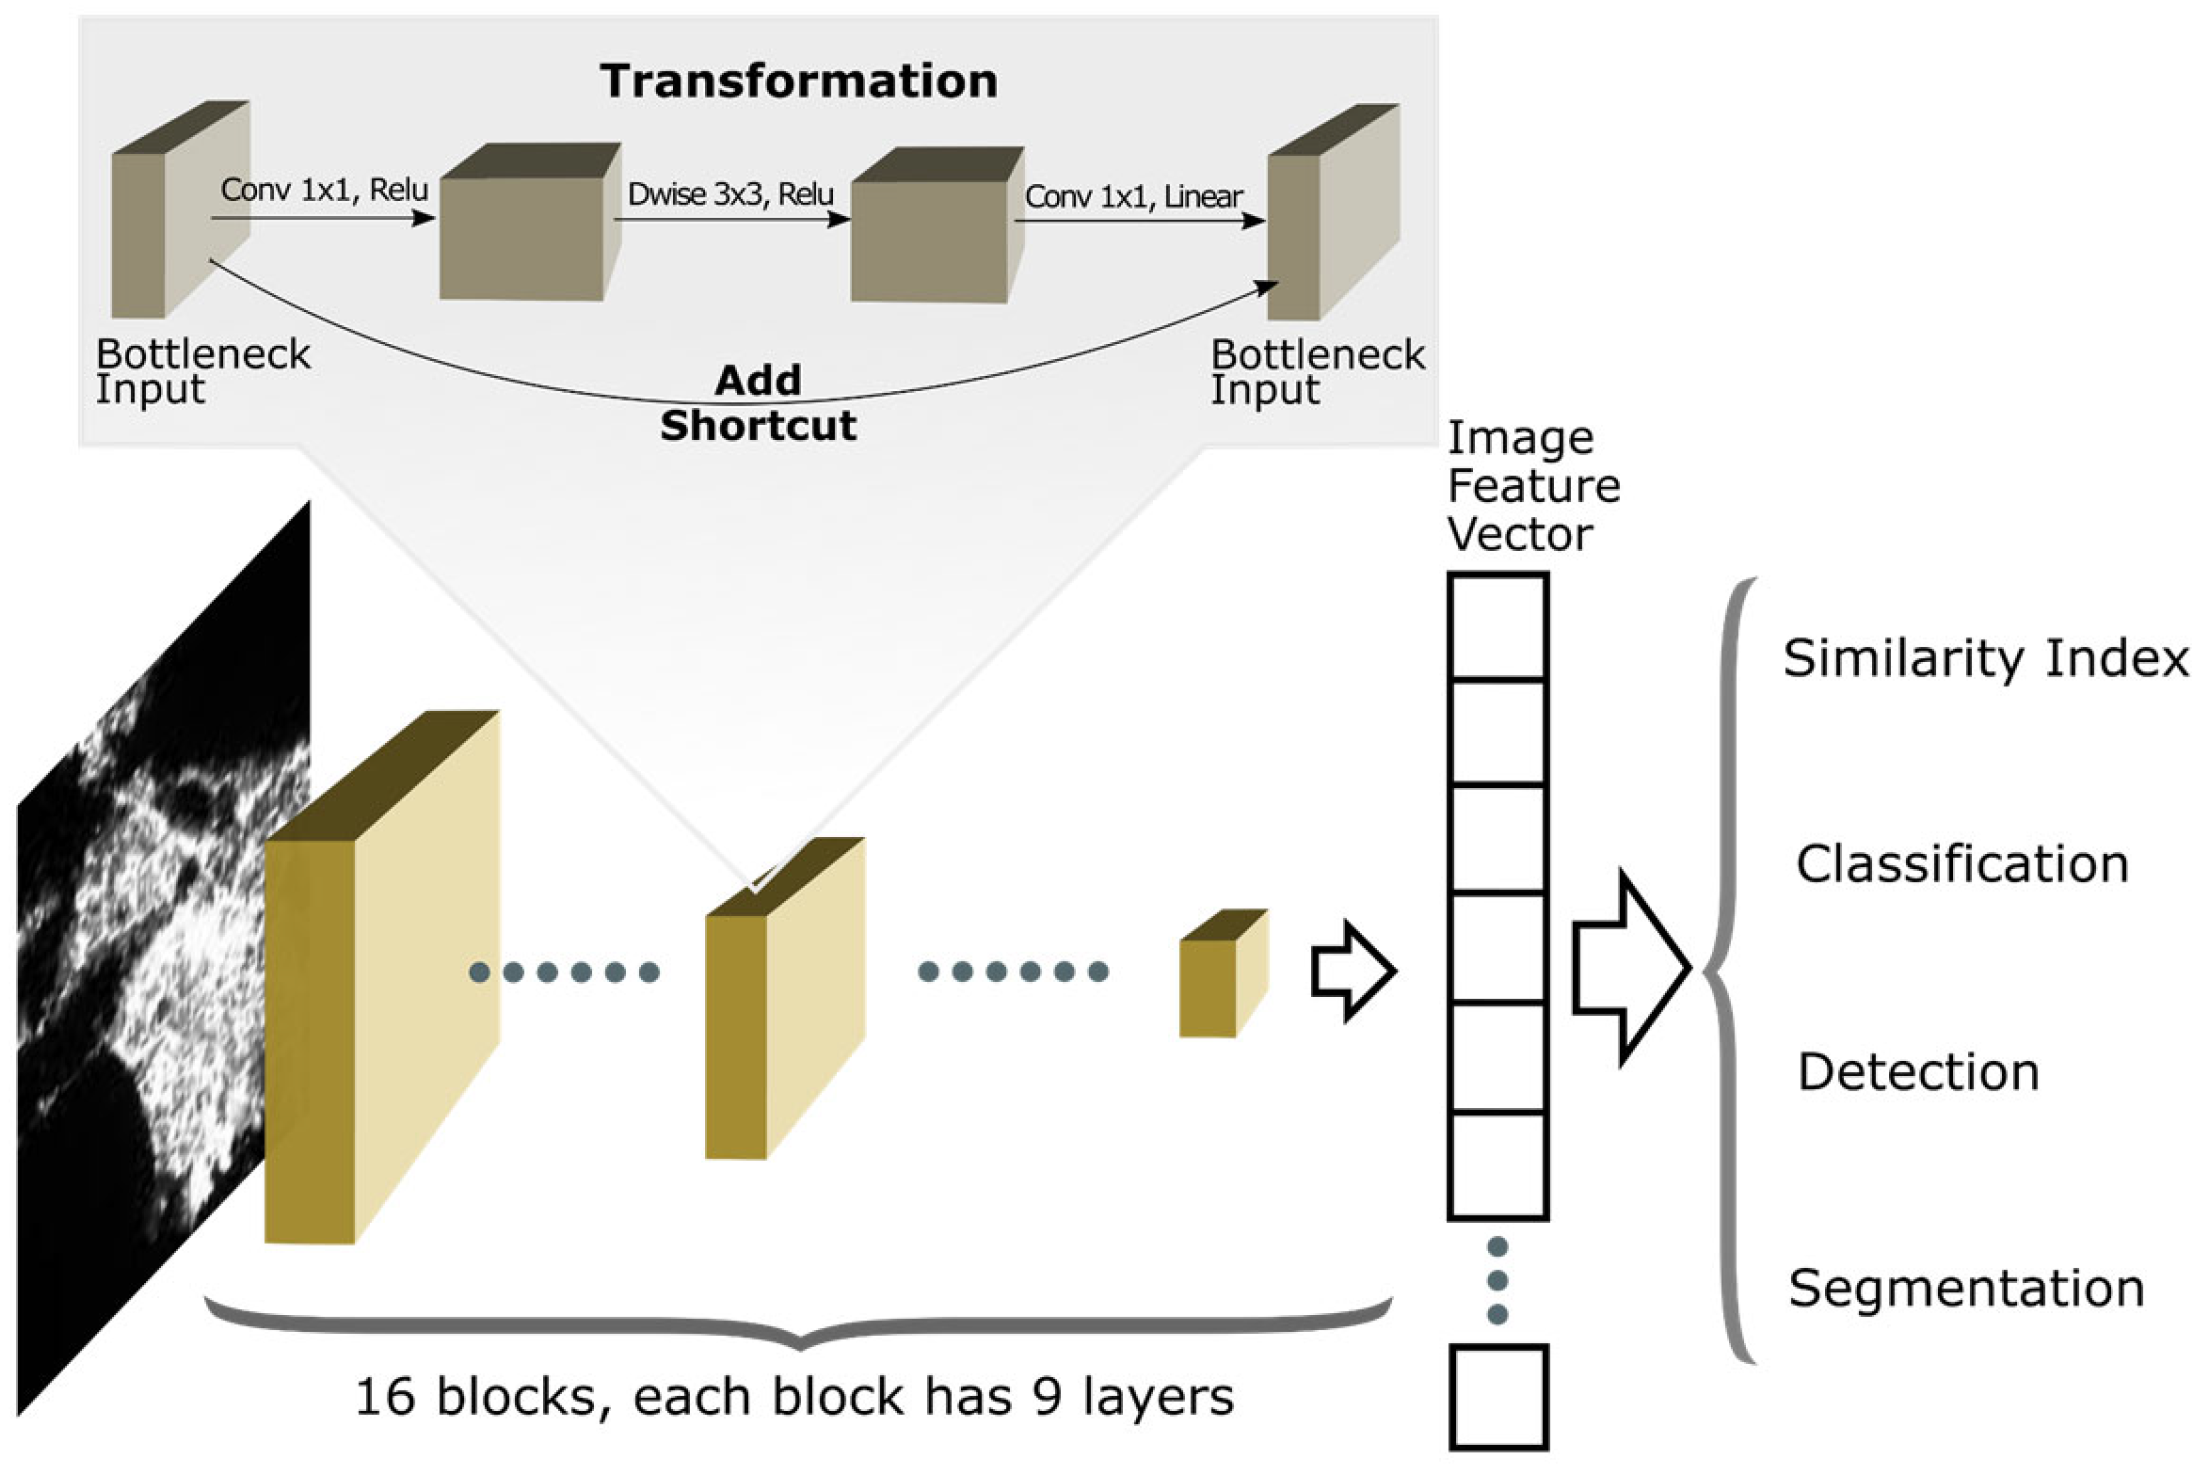
In this study, the CNN MobileNet V2 which is available on the Tensorflow Hub is used to extract features of VIIRS/DNB night light images. In searching for the CNN model among a number of candidates, we found that this model works well for VIIRS/DNB images with a general-purpose laptop, instead of relying on high power computers as many AI applications require. The spatial resolution of a VIIRS DNB image is 750 × 750 m2, compared to the area of a typical large city <100 × 100 km2. Therefore, a large city can be covered by a VIIRS DNB image with approximately 100 × 100 pixels. This works well with MobileNet V2 which allows array size up to 224 × 244. In this study, MobileNet V2 is essential in generating the image feature vector for each of the VIIRS/DNB images.
MobileNet V2 is widely used for computer vision applications in many real-world applications, including object detection, fine-grained classifications, face attributes, and localization. It is a deep neural network architecture suitable for mobile and resource constrained applications. Therefore, we envision that the methodology presented here can be implemented in cell phones or PDA devices in the future to tell whether a city is clear or cloudy in near real time. MobileNet V2 is 16 blocks (96 layers) deep. It features depth-wise separable convolution with kernel size of 3 × 3, with 3.4 million parameters (Figure 2). Benchmark testing shows that its accuracy is comparable to other state-of-the-art CNN models such as VGG 16.
Another key component in this AI approach is the ANNOY (Approximate Nearest Neighbor Oh Yeah), which is an open-source library for approximating nearest neighbor based on the image feature vector and similarity indices generated in the previous step. ANNOY can quickly compute the similarity index in the multidimensional space between a given pair of images based on their image feature vectors.
The following are detailed procedures for our AI/CNN/SI-based algorithm:
- The VIIRS/DNB night light images for a city of interest are obtained from the reprocessed VIIRS/DNB dataset [5]. Only the observations near nadir for the city of interest are included in this study to avoid scan angle-dependent observation issues. Typically, there are two nadir passes near the city, one on the left side of the city center, and one on the right side. Given the orbital repeating cycle of 16 days, there are two qualified observations for each cycle within the selected area, which amounts to ~45 images per year. For the time period from 2012 to 2020, we typically obtained about ~365–380 images, which are re-projected or georeferenced onto a common grid with a constant 750 × 750 m2 resolution for the given city with nearest neighbor resampling of the radiance pixels (without interpolation to preserve the radiance values). The reprojection makes it easier to perform quantitative radiometric comparisons between images and further facilitates the AI/CNN/SI similarity-based image feature vector comparisons.
- The image feature vectors are generated for each image using Tensor-flow/Keras/MobileNet V2 so that each image has a unique feature vector ID based on the characteristics or “Image DNA”. Then a cluster analysis is performed based on the similarity index (SI) of the feature vector.
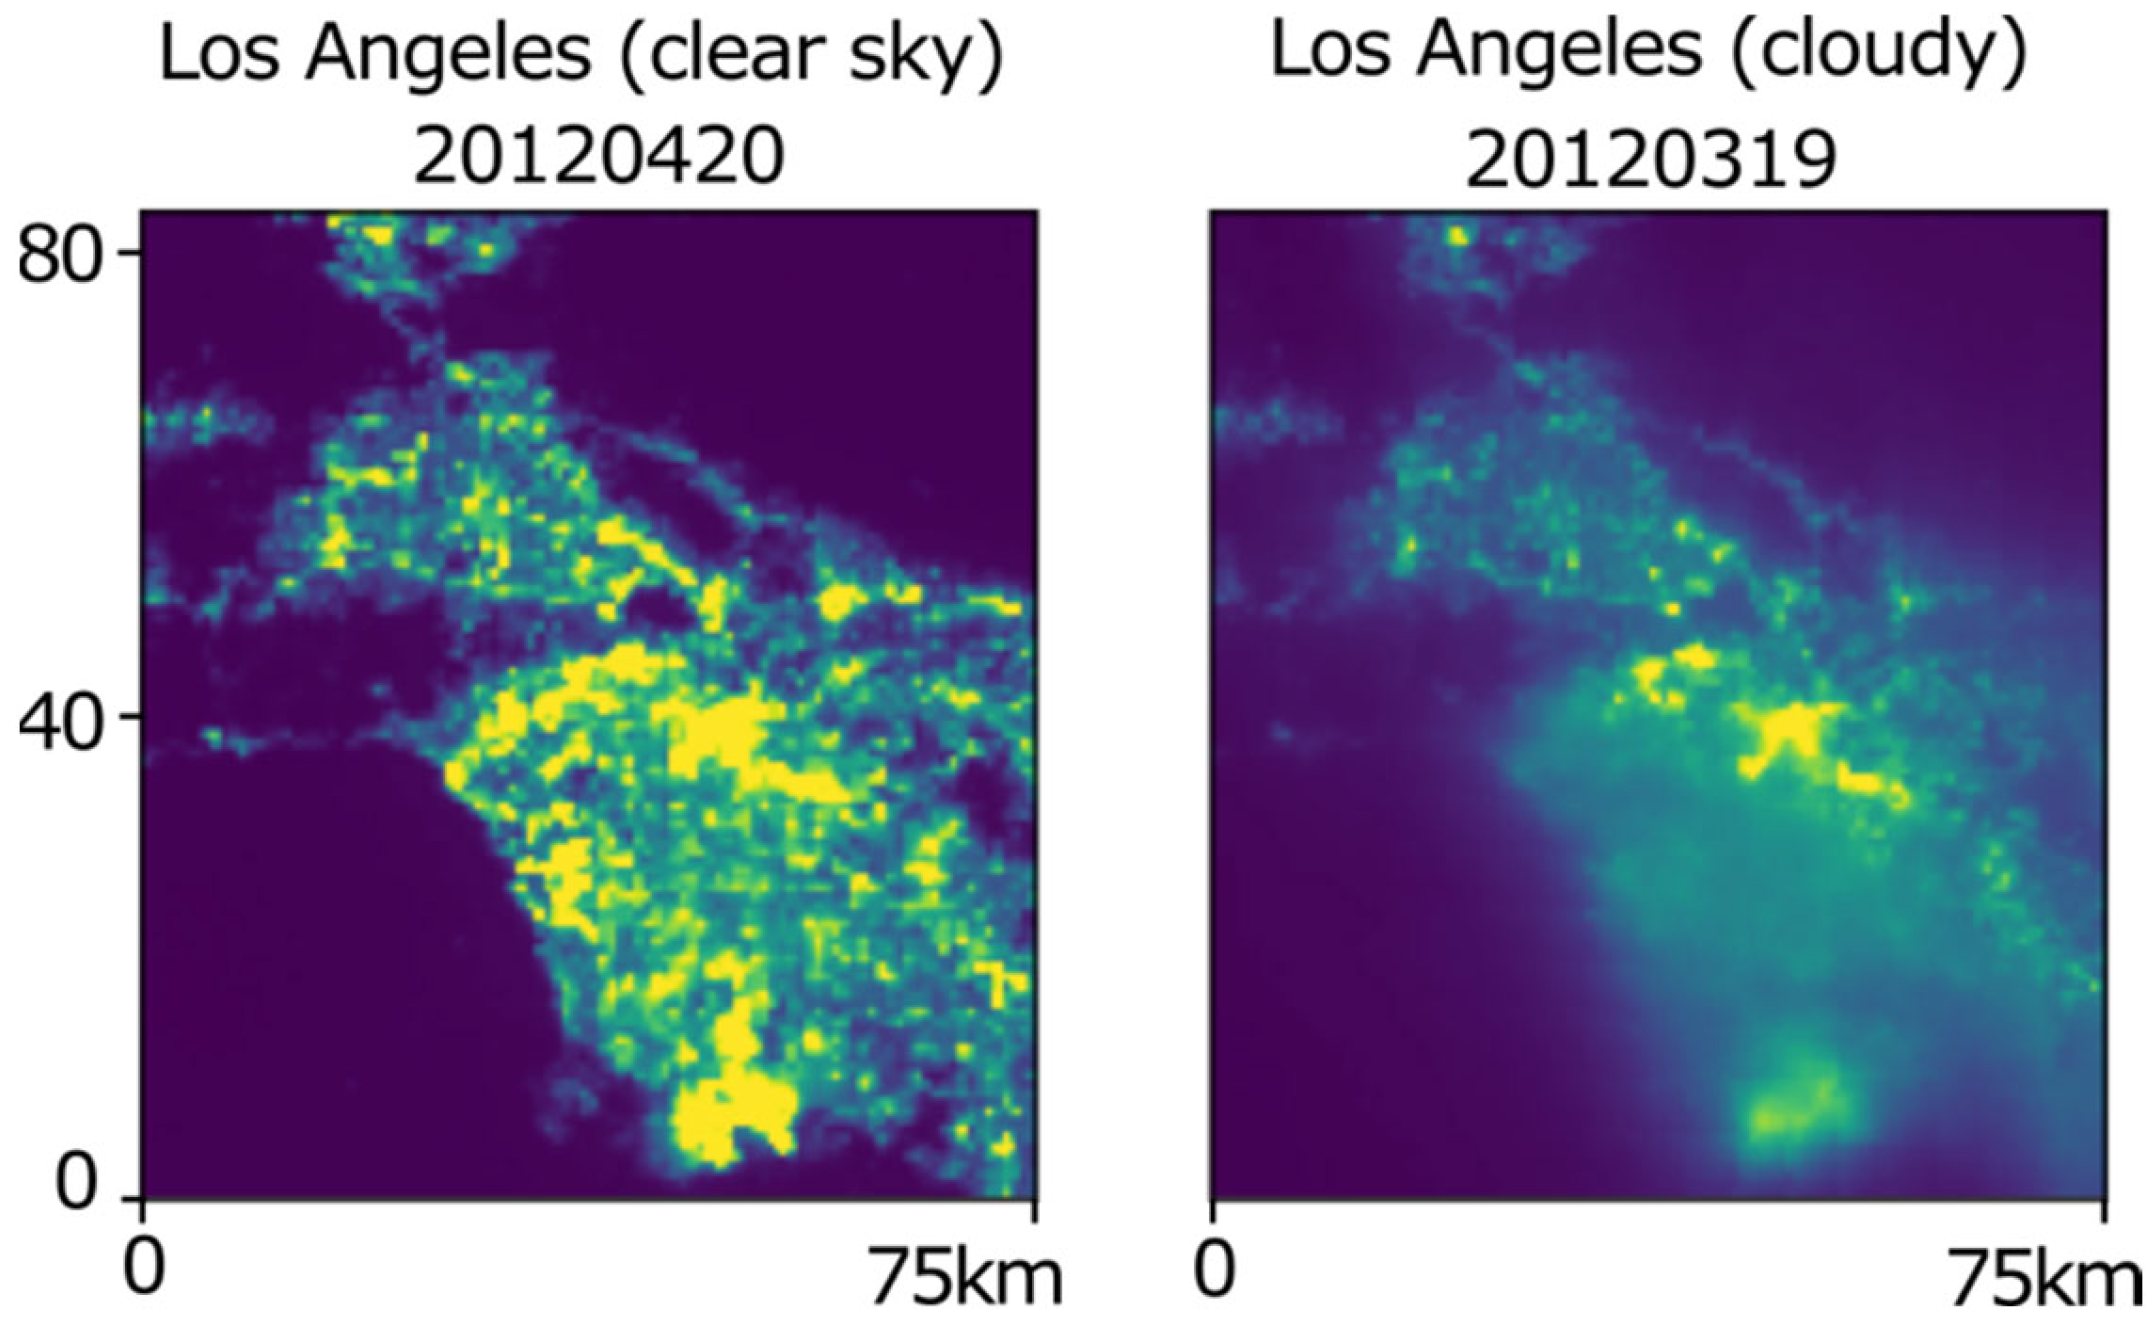
- The image pairs are grouped together based on similarity index (SI). A similarity of 1.0 means the two images are identical. All other image pairs have similarities less than 1.0, typically between 0.6 and 0.98. We found that images with the highest similarities are typically clear sky images near new moon days. This is because clear sky night light images for a given city have a fairly fixed pattern, while cloudy and lunar illuminated ones typically vary (Figure 3). Therefore, using the similarity index can effectively filter out the images contaminated by cloud and lunar illumination. However, we also found that there are cases where two cloudy images may have high similarities in cases where the cloud is spatially uniform over the city, or the cloud optical depth is large enough to obscure the urban night lights significantly. Therefore, we introduced a step to identify a known clear sky image as the “seed” image for the clustering so that images with high similarities to the “seed” image are identified as clear sky images. The algorithm searches for images with similarity to those with clear sky recursively with a given threshold value of similarity.
- To validate the results from the AI based algorithm, sample data are taken to compare with the traditional cloud-mask based method, which relies on a separate product generated using cloud-mask algorithms. The errors of commission vs. omission are estimated.
- The next step is to compute the total radiance for the city of interest for the selected images in the time series. Then the total radiance change over time can be plotted as a time series, and statistical analysis using the Python and R statistical package is performed.
- As an option, a movie loop of the selected images can be made to confirm the clear sky images selected in the study visually.
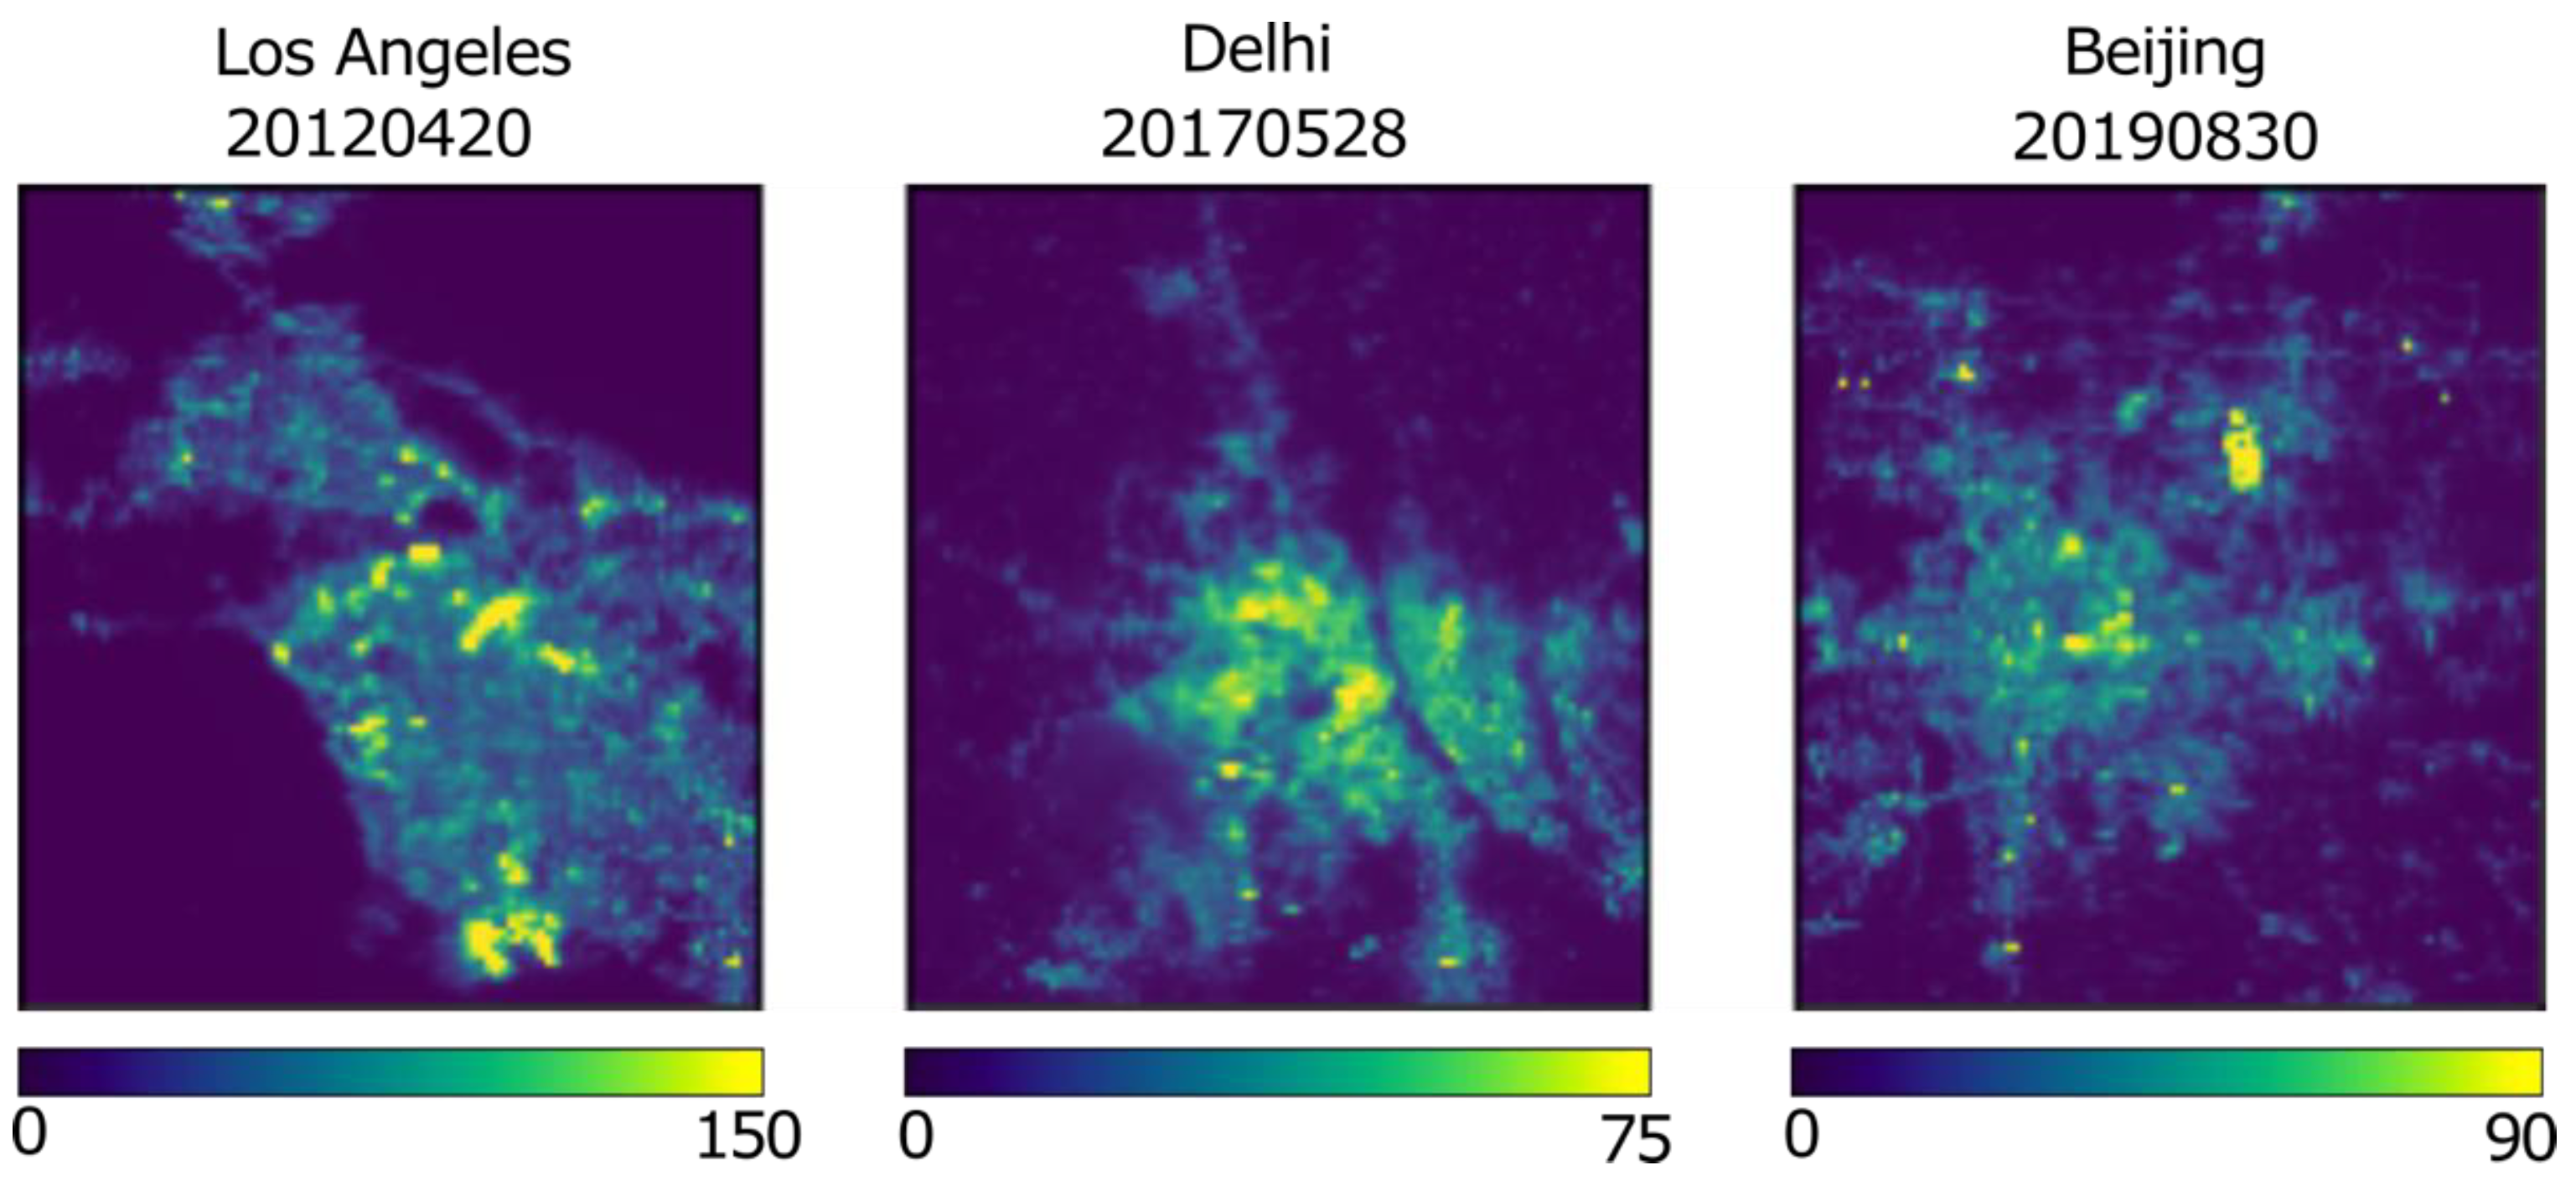
The metropolitan areas used for this study to demonstrate our methodology included Los Angeles, Beijing, and Delhi (Figure 4). These cities are chosen based on a combination of cloud frequency, urban growth, and climate types. We believe that the methodology is applicable to all major metropolitan areas with a size greater than 50 × 50 km2 in area, given the spatial resolution of VIIRS DNB of 750 × 750 m2. The metropolitan areas of interest (AOI) in this study are somewhat arbitrary but selected based on several considerations. (1) The exact same area (based on latitude/longitude coordinates) is used for long term time series analysis by projecting the VIIRS DNB pixels onto the same fixed grid with cell size of 750 × 750 m2 as discussed previously (Figure 4). (2) The AOI covers the downtown areas as well as adjacent suburbs where bright lights are observed from the VIIRS/DNB. (3) The AOI typically do not coincide with the administrative or political boundaries (which might change over time), compared to the fixed grid, which is based on latitude/longitude; also, the aerosols and night light distributions are not likely to follow administrative/political boundaries. (4) AOI should include dark areas such as water bodies or dark forest areas in order to exclude lunar-illuminated pixels using the minimum radiance threshold algorithm.
3. Results and Discussion
In this section, we first evaluate the accuracy of the AI/CNN/SI method for identifying clear sky VIIRS DNB night time images in terms of error of commission vs. omission. Then the clear sky mean radiance time series from VIIRS DNB over selected cities are analyzed in relation to social-economic and environmental factors. Finally, the suitability of VIIRS DNB for urban night time aerosol monitoring, based on a combination of its spectral response and the active light spectral characteristics, is analyzed.
3.1. Assessing the Accuracy of the Algorithm Separating Clear from Cloudy Images
To assess the accuracy in separating clear sky from cloudy images, we performed two tests on the Los Angeles dataset. The first is visual inspection of the movie loops and images for the processed images. By comparing the results with the original images, we found that most images are identified correctly, although some images identified as clear may have scattered clouds in the peripheral areas of the city (or typically suburbs).
The second is a quantitative test where we took random samples of the images from the time series and obtained their corresponding VIIRS cloud masks. The cloud masks coded each pixel of the image into four categories: 0 = confidently clear; 1 = probably clear; 2 = probably cloudy; 3 = confidently cloudy. It is known that a given image may contain a mixture of these four categories, and it is difficult to obtain totally clear images over a study region because there are always some clouds in any part of the world at a given time. As a result, we developed a mean cloudiness index (MCI) which takes the mean value of the cloud mask code of the pixels for the area of study. For example, a MCI of <1.05 is considered clear, while MCI > 1.05 is considered cloudy in this study. We evaluate the results based on the error of commission vs. error of omission. Here, errors of commission are those cloudy images (with MCI > 1.05) that are mistakenly identified as clear sky images. In contract, error of omission are those clear sky images (with MCI < 1.05) that are mistakenly identified as cloudy images. Since our objective is to use clear sky VIIRS DNB images, the error of commission is more significant than the error of omission. In other words, skipping some clear sky images in the time series is not as critical as including some cloudy images.
Our results show that among the 65 random samples from the 380 images (17%), the error of commission is ~3.1%, in which two cases were identified as clear but they were probably cloudy according to the cloud mask test (with MCI scores of 1.4 and 1.7). Put another way, 96.9% of the selected VIIRS DNB images are truly clear sky. We found that cloud optical thickness may play a role here. Night lights can penetrate optically thin clouds, so the image may appear clear but the cloud mask may report it as cloudy. In comparison, 14 were labeled as cloudy but were actually clear sky (error of omission 21.5%). Overall, 32 (or 75.4%) are fully identified correctly as clear. However, this is assuming that the cloud mask represents the truth, which may not necessarily be the case, especially for urban areas, due to limitations of the cloud mask algorithm [9].
Further inspection of the error of omission cases suggest that these were affected by two factors: one is the reference seed image used for the similarity analysis. In this test, images on days 21 February 2012, (#7) and 15 April 2020 (#375) were used as seed images, and were both identified as clear in both cloud mask and visual inspection tests. It is likely that if more seed images are used in the analysis, the accuracy rate could further increase, although increasing the number of seed images would reduce the efficiency of the AI method. The other factor is the cutoff threshold for the similarity scores, for which there is a trade-off between number of samples selected vs. the degree of similarity. In our study, the SI index ranged from 0.5 to 0.99 (on a scale of 0–1.0) for all samples, and we narrowed it down to the 0.90 to 0.95 range. We found that for SI >0.95 (only limit to highly similar data), there will be too few samples remaining, while SI <0.90 (which includes more less similar data), the time series becomes noisy. The SI acts as an AI tuning parameter in this study and as a result, 0.90 was used in the final analysis. Nevertheless, the result ensured that the vast majority of the images (96.9%) were correctly identified as clear sky and for the purpose of clear sky VIIRS DNB images time series in this study, we believe that the AI/CNN/SI method is successful.
In the early phases of testing the algorithm presented in Section 2, we found that there were a few pairs of images with similarity of 1.0 which was unexpected. After visual inspection of those images, we were positively surprised that they were either duplicated images or blank images due to human errors in the data collection process. This is encouraging because this method could be used for data quality assurance of satellite images. It is also worth noting that the quantitative accuracy evaluation using cloud masks took significant effort and some of the cloud masks had to be regenerated because they were not all available in the archive. This is also the same reason that a more rapid method of clear sky image identification algorithm is much more desirable, as developed in this study.
3.2. Long-Term Time Series Analysis and Potential for Aerosol Monitoring
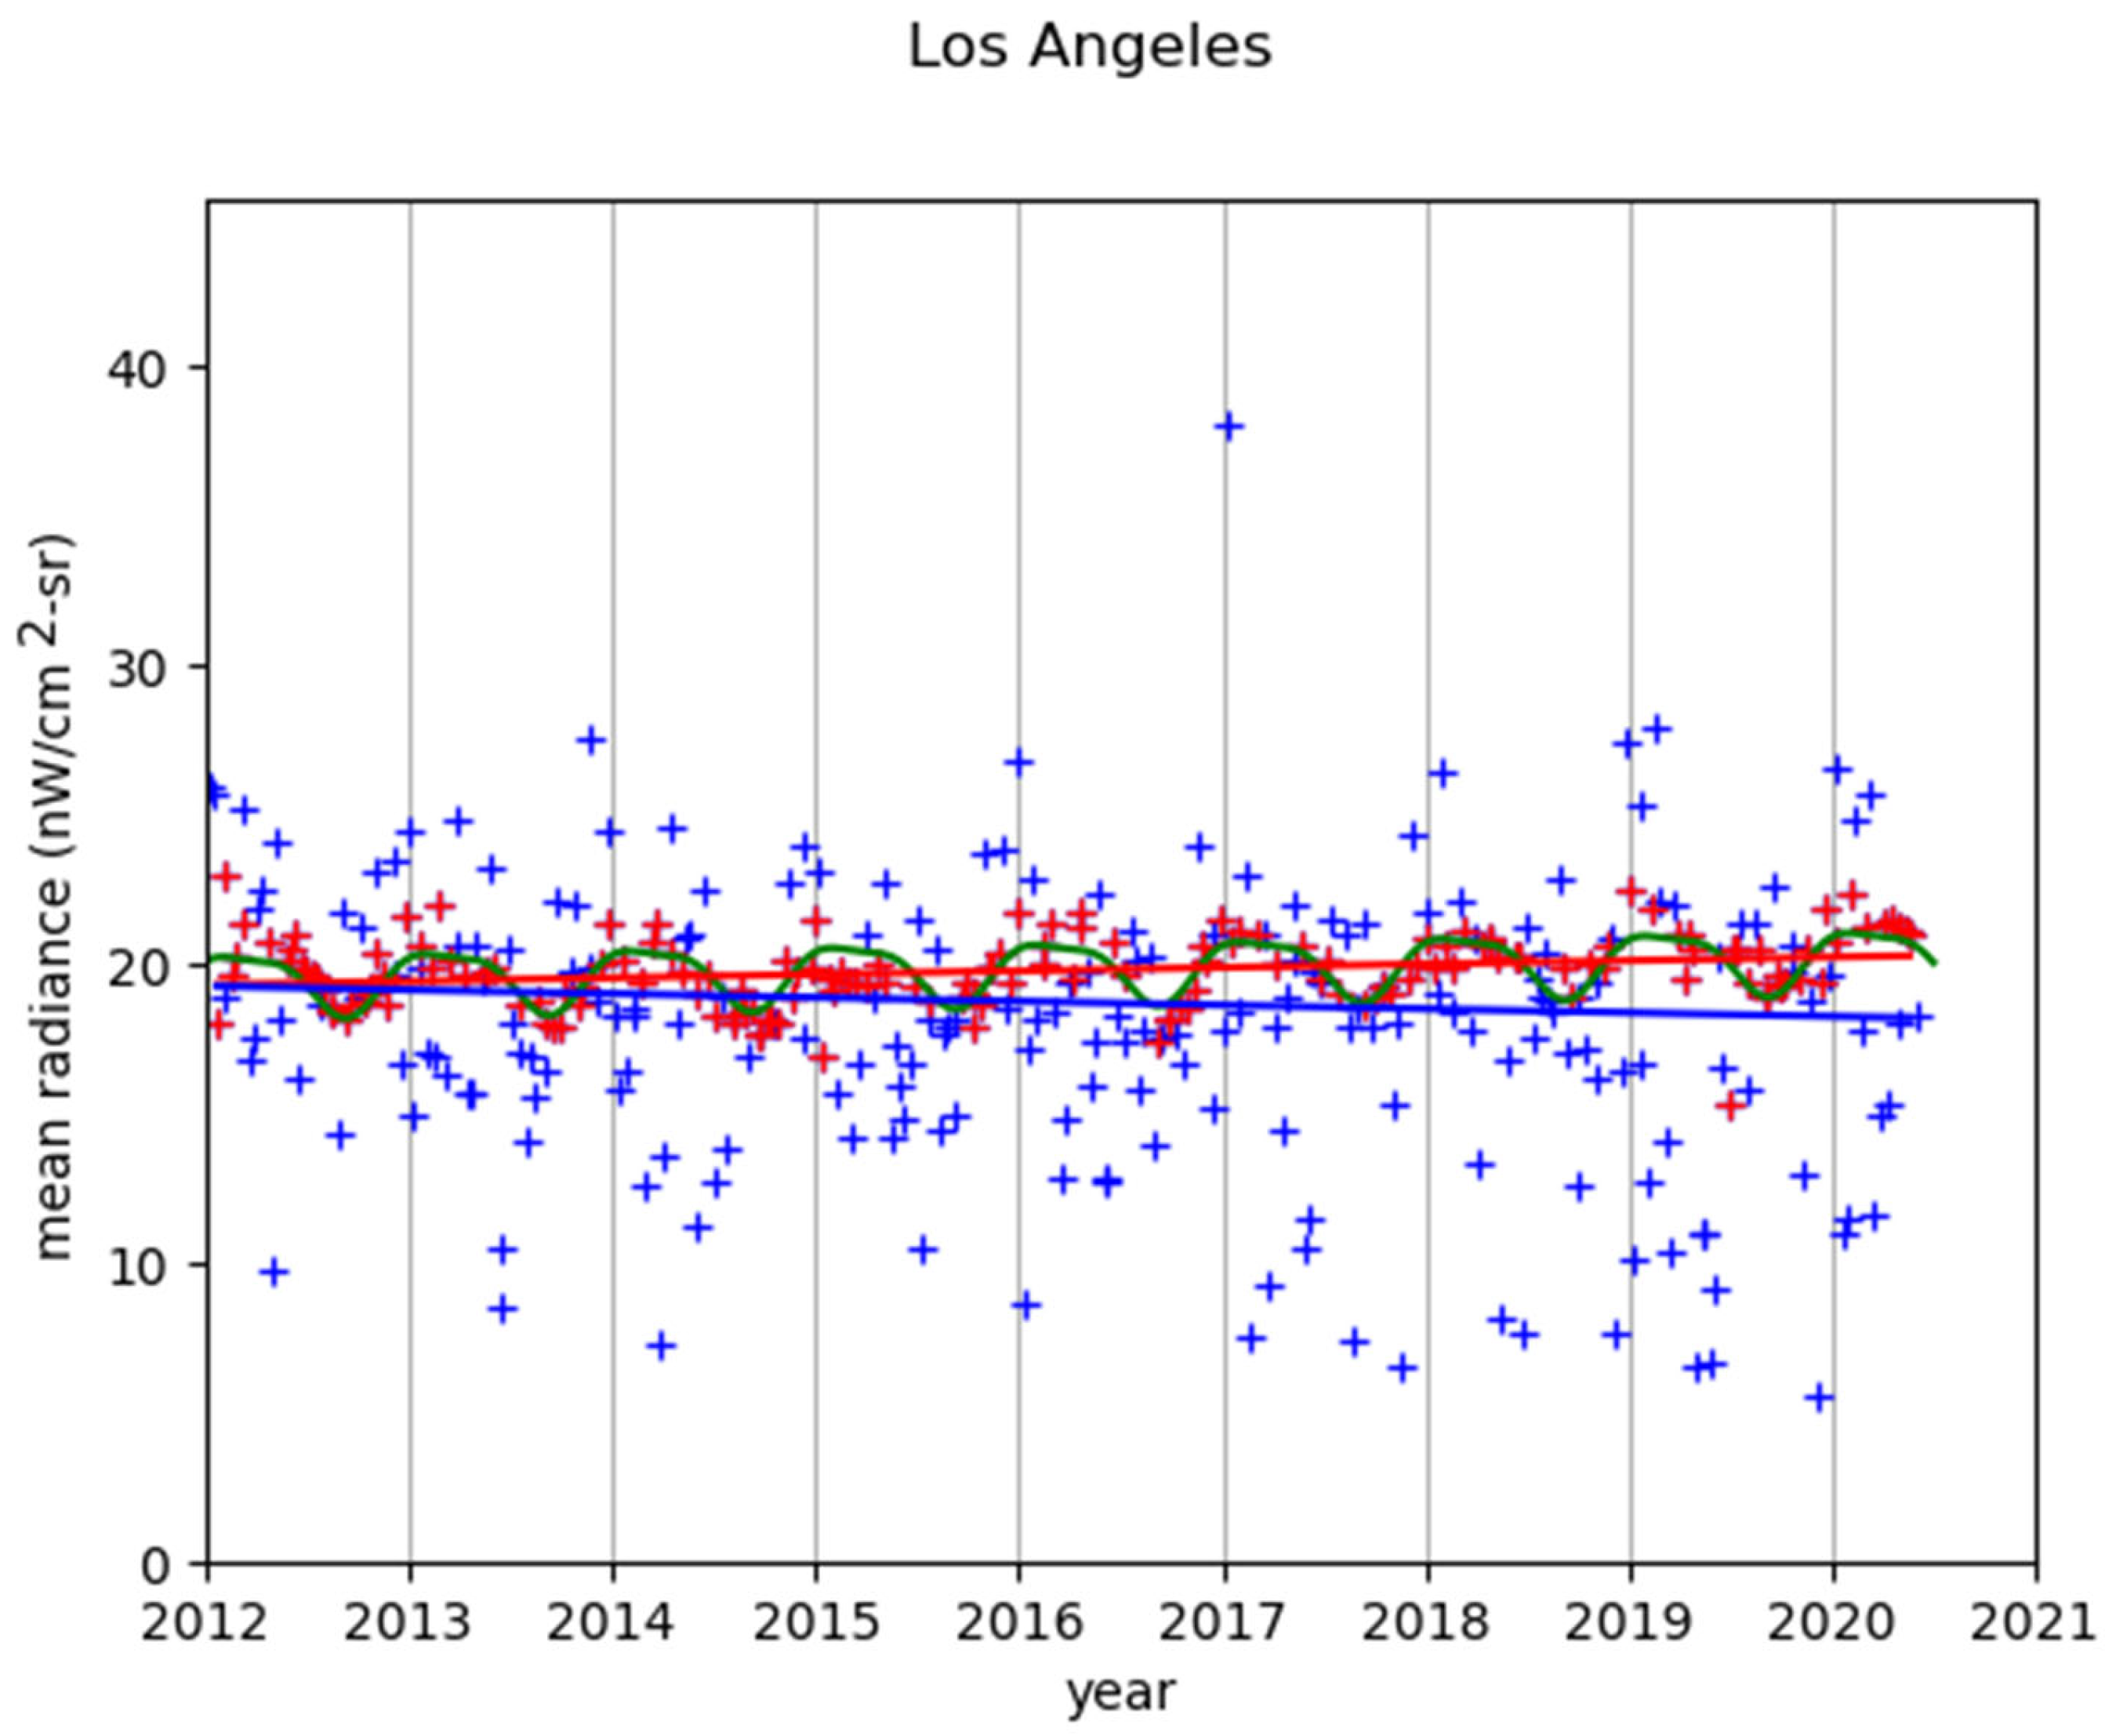
Using the AI-based clear sky image identification method presented in the previous section, we found that the data processing is relatively fast as it takes approximately five minutes to process each city with about 350 to 400 images for the time series from 2012 to 2021 (about 2 GB in storage space for each city). The clear sky images are identified, and a time series of the mean radiances for those are plotted and compared for all images in the time series for the city. Figure 5 compares the mean radiances between the identified clear sky vs. all images for Los Angeles. It shows that the time series, without applying the AI algorithm, would produce results with data points so scattered that an erroneous downward trend in the time series would result. However, after applying the AI algorithm, the identified clear sky image radiances form a very distinct pattern in the time series, and a slight positive trend emerges.
Further examination of the clear sky time series in Figure 5 suggests two interesting patterns: the first pattern is that there appears to be an annual oscillation (hormonic fit curve in Figure 5) with a high mean radiance (22 nW/(m2-sr)) in the winter months, and a low (17 nW/(m2-sr)) in the summer months or a variability of approximately 26% which has far exceeded the calibration uncertainties documented in previous studies [5,10,11]. Since all observations are near nadir and scan angles are nearly identical with 16 days orbital repeating cycles, the scan angle effect [12,13] can also be ruled out. This pattern is especially clear from 2017 to 2020 but also identifiable for other years. An analysis of the climatology in Los Angeles and other possible causes suggest that this is likely due to seasonal changes in the aerosol optical depth (AOD). In the winter months the AOD is lower than in the summer months. We have also investigated other possible factors, such as residual moon lights, seasonal changes in night-time human activities, daylight saving time changes, and orbital variations, but none of them can explain this seasonal pattern.
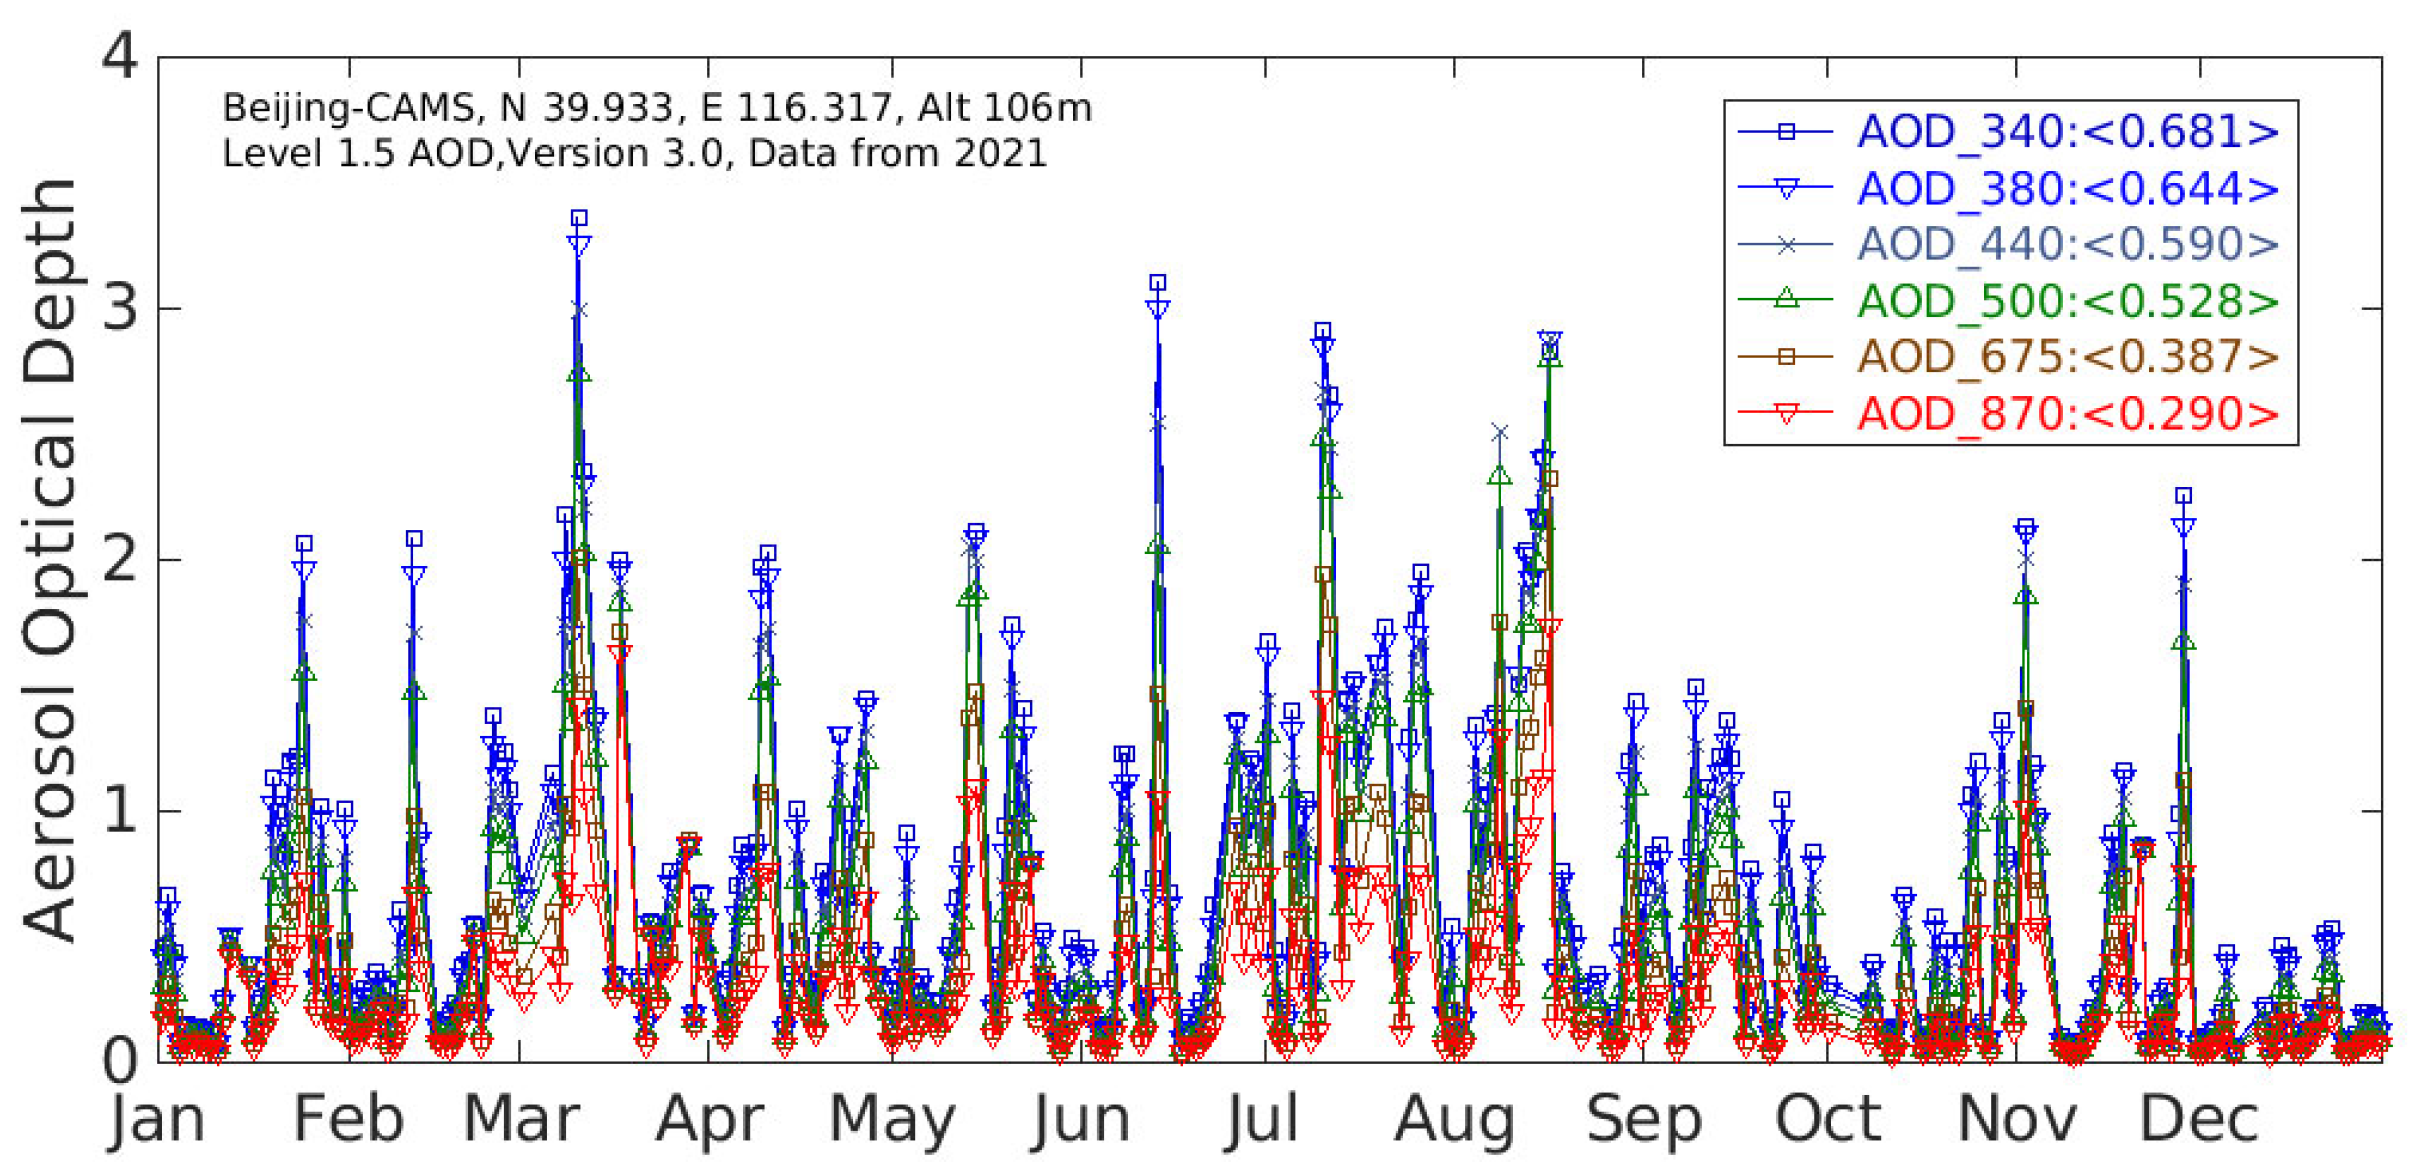
Previous aerosol studies have shown similar seasonal patterns in AOD for selected areas and cities. In study [14] (Figure 3), when comparing MODIS and VIIRS daytime retrieved aerosols over land, it was shown that a strong seasonal change in the AOD at 550 nm exists and is in very good agreement between MODIS Terra, Aqua, and Suomi NPP VIIRS retrievals. The peak values in AOD appear to be in the summer months around June, while the trough occurs in later fall to early winter months, although the exact time varied from year to year between 2012 to 2019. Similarly, in a study comparing aerosol retrievals from CALIPSO and MODIS, study [15] (Figure 5) showed strong seasonal variations in AOD over several regions including S.E. Asia, Sahara, N.W. China, and S. America. Although the seasonal cycles are not synchronized among all the areas, there appears to be a pattern with a low AOD in the winter months and high AOD in the summer months in most of the regions presented in their study. Of course, the study period [15] (2006–2011) does not overlap with our current study; nonetheless, this seasonal pattern appears to be persistent, according to their study. Another study [16] (Figure 3) also shows a seasonal pattern in AOD over north India, although it is not always lowest in the winter months. Finally, AERONET [17] measurements in Beijing show that the peak AOD appears in summer month (Figure 6), and the troughs occur in winter months, although the AOD values can have a large dynamic range for any given month. It should be noted that AOD and PM2.5 are not the same. AOD measures the total column aerosol between the ground light source and the satellite, while PM2.5 measures the aerosol near the surface. These two quantities have a complex relationship depending on many factors for a particular location. It is also noted that many of the AERONET stations have data gaps for months or even years, such as Los Angeles, and India, probably due to instrument issues.
Studies using VIIRS DNB observations to retrieve night AOD under lunar illumi-nation have shown good agreement with those from daytime retrievals using other VIIRS bands [18,19]. If the method presented in this study can monitor aerosols at night, it would be a significant complement to global aerosol monitoring over urban areas because the VIIRS/DNB data has been available since 2012 on Suomi NPP, and has been succeeded by NOAA-20 (J1), as well as the followon satellites on J2, J3, and J4 well into 2040 time frame.
The second pattern in Figure 5 is that for Los Angeles, there was a minor increase of 0.13%/year over time in the mean radiance in this time series during the period, based on the trend from linear regression. The increasing trend is clearer from 2016 and onward, which represents urban growth (population increased from 3.9 M to 4 M or 2.5% during the period), while before 2016 this was not the case, in fact, a downward trend may be observed from 2012 to 2016 (with a slope of −0.06/year in linear trend). However, one caveat in interpreting this light intensity change is that there are two opposing effects affecting light change: urbanization which would make it brighter [21]; while aerosol increase would make it dimmer. In other words, in the VIIRS/DNB observations of nightlight intensity, the following equation might apply:
where L is the mean radiance observed by VIIRS/DNB over the city; NL is the light intensity of the urban night lights; AOD is the aerosol optical depth. Note here that NL and AOD have opposite effects. A high AOD would attenuate more NL which would make L smaller. In other words, the radiance increases if more light is radiated. However, if there is significant increase in AOD, the VIIRS/DNB observed radiance would decrease. Similarly, if NL is constant over time, a decrease in AOD would lead to an increase in L. Unfortunately, these two factors cannot be easily separated, except for cities that have known unchanging nightlight intensity in the time series.
L = f (NL, −AOD)
There is also an additional factor that might impact the time series of night radiance: the type of night lamp or light bulb used. There has been a change from the traditional HPS (High Pressure Sodium Lamp) to LED (Light Emitting Diode) during this time period [22] in US cities and abroad. As a result, the downward trend in VIIRS/DNB observed radiance could also be affected by changing light sources which would affect the nightlight intensity.
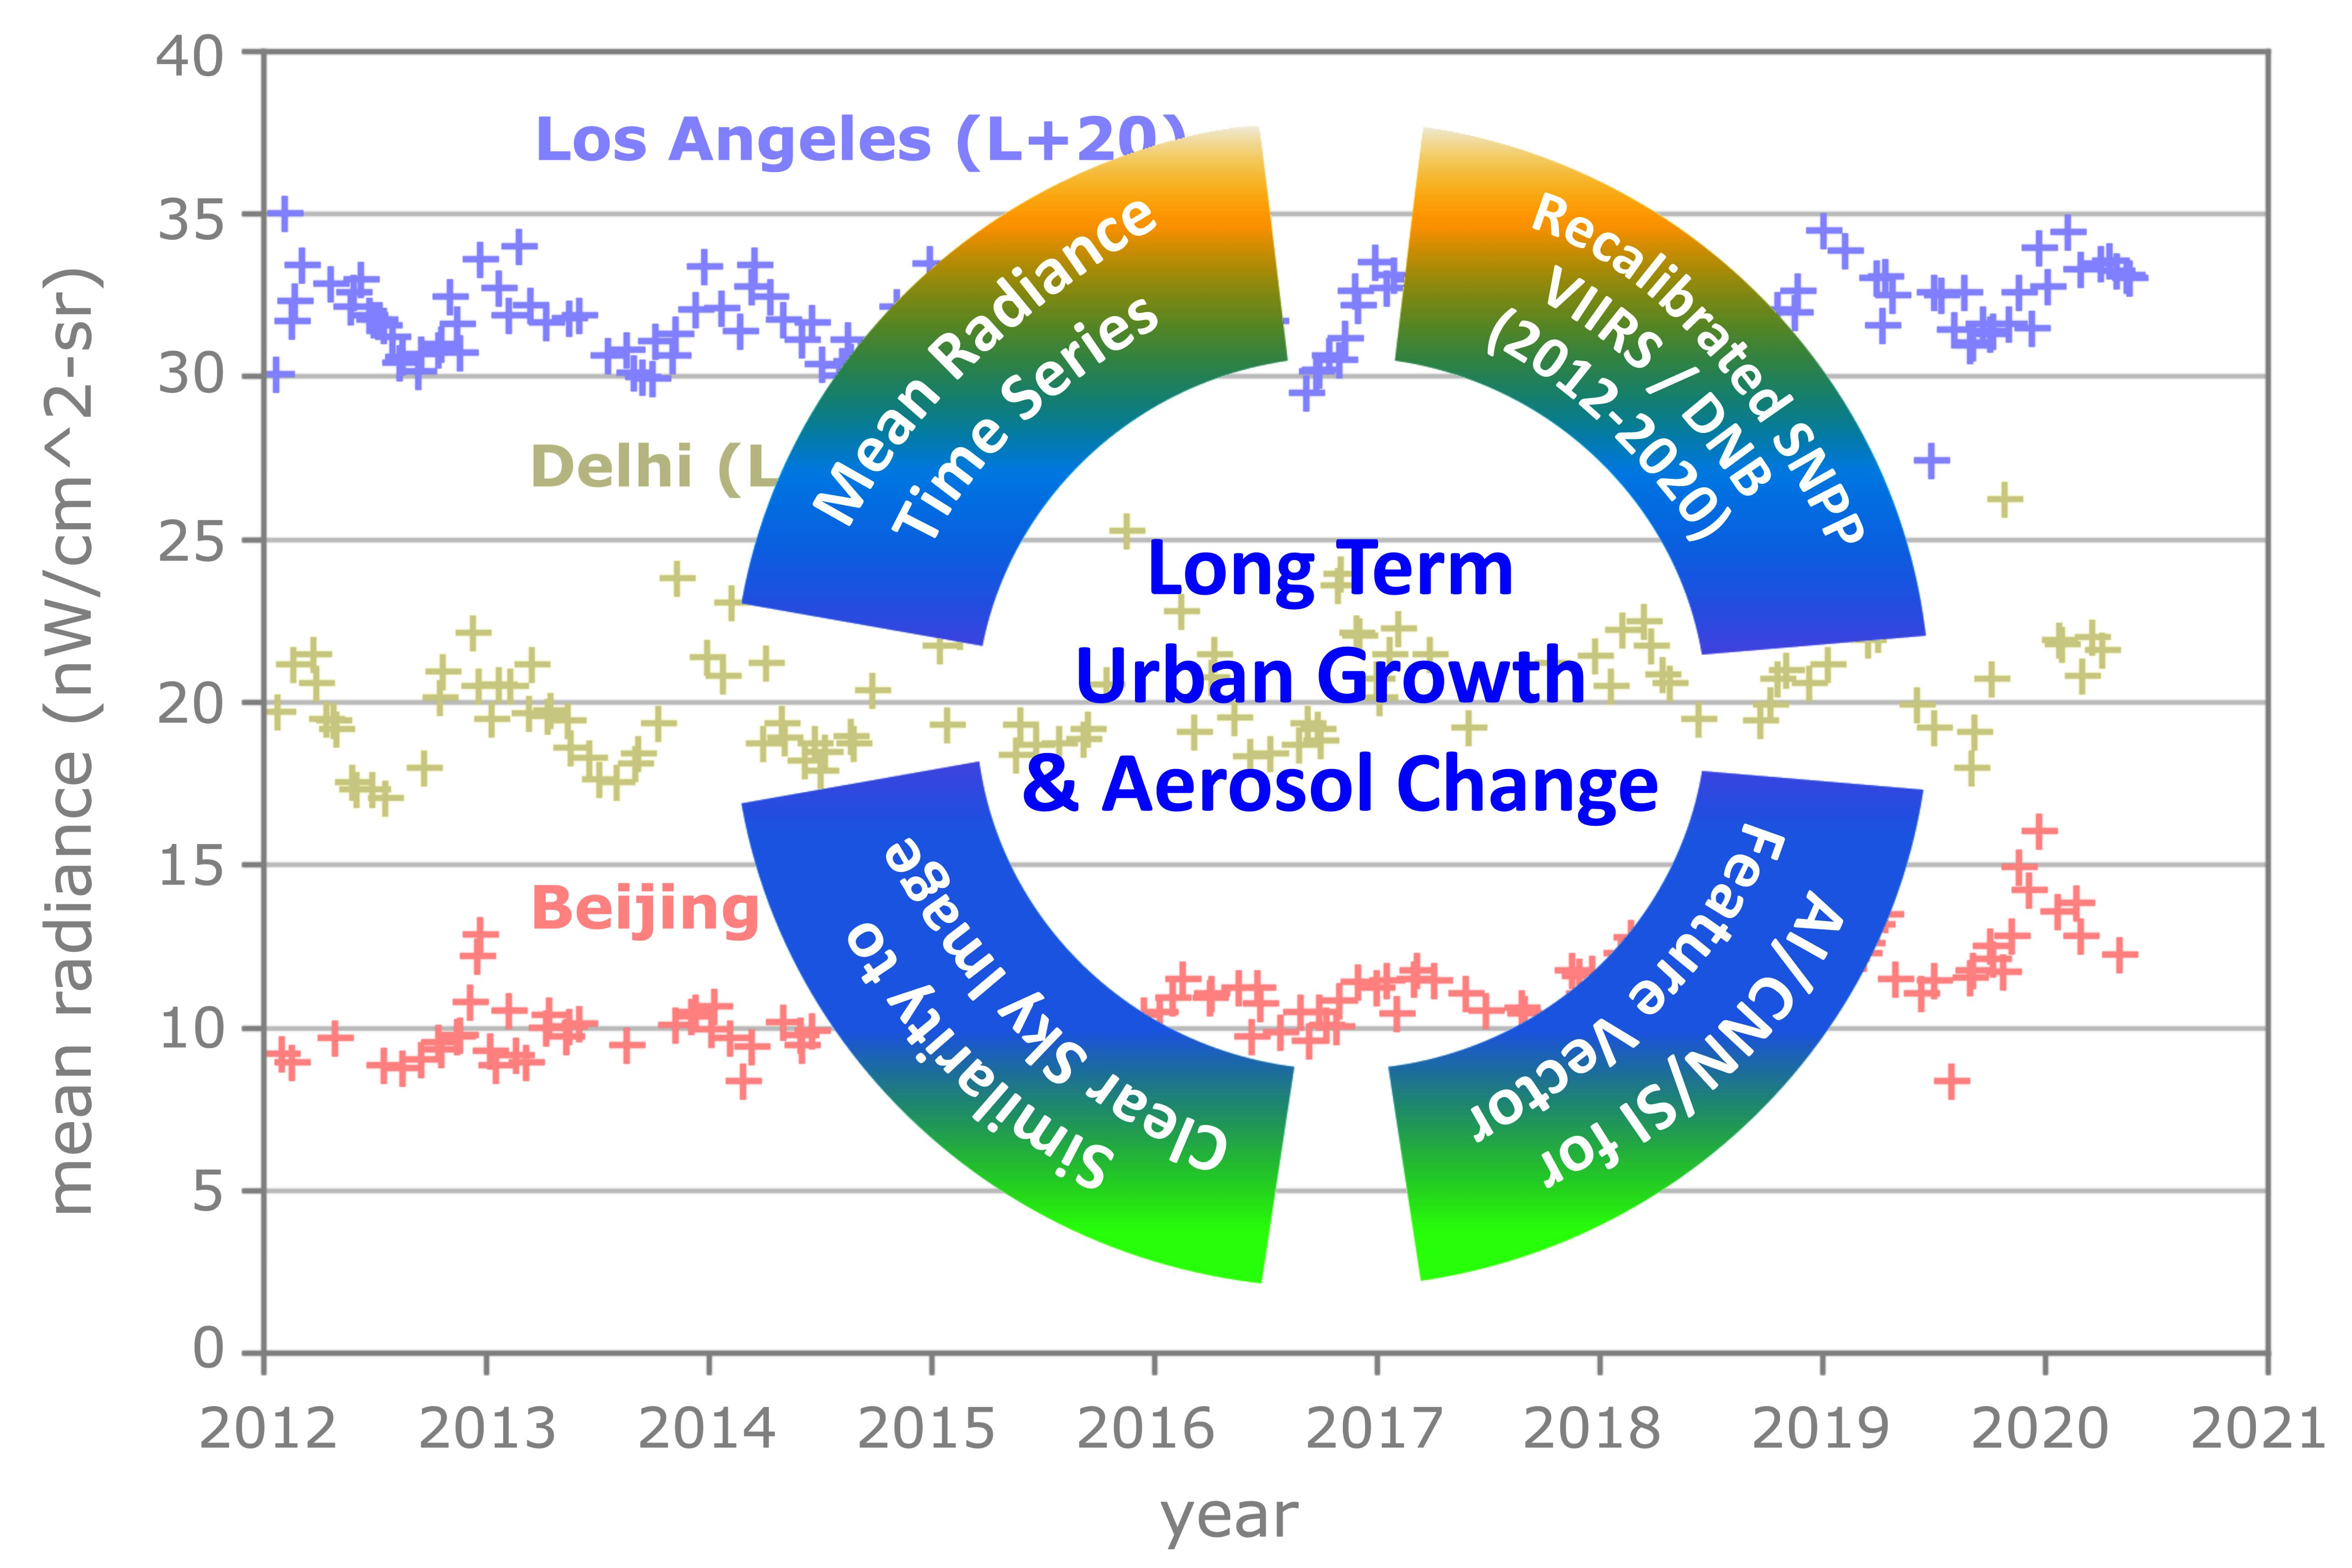
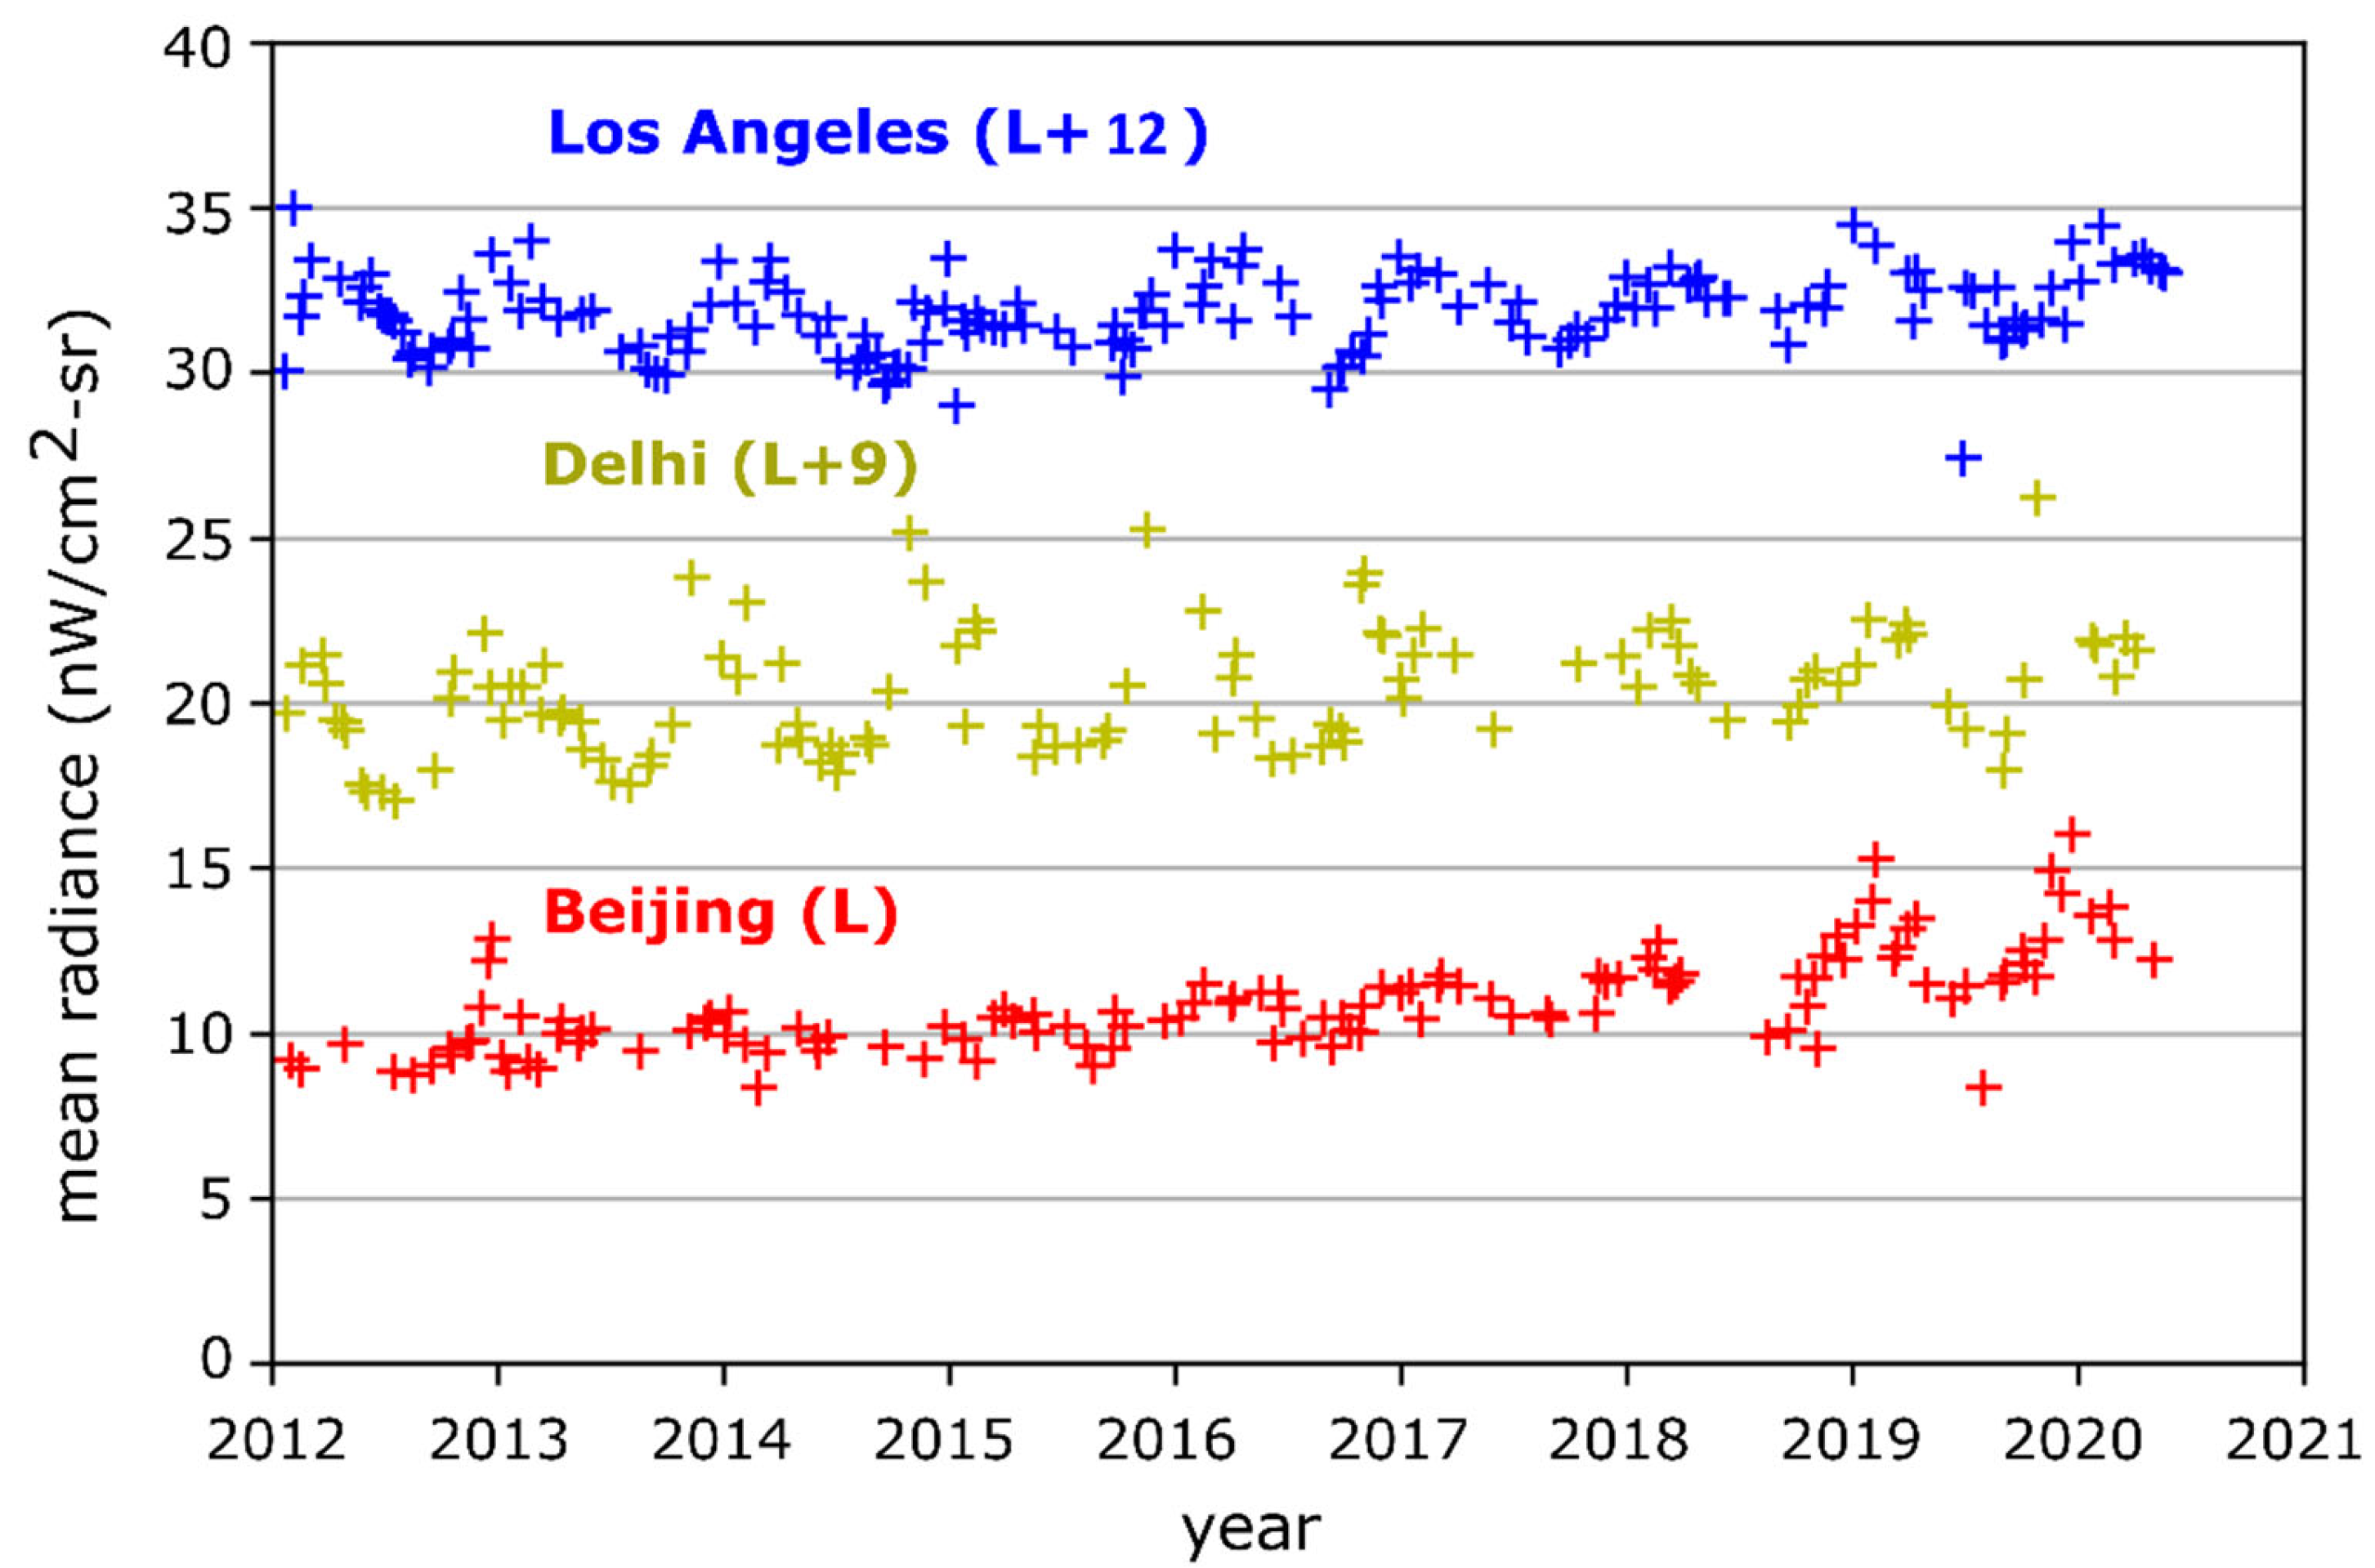
The same approach presented earlier for the Los Angeles time series is extended to the analysis for Beijing and Delhi. The nightlight time series for these three cities is presented in Figure 7. Note that the absolute mean value differences between different cities are affected by the area of interest selected for each city, so their absolute value differences are not critical; therefore, this study focuses on the time series analysis of selected cities to investigate the light intensity changes over time.
We found that all three cities have an annual variation in the light intensity. For Delhi, the amplitude of the oscillation appears to be larger than for the other two cities, and the peak appears more often in spring than in winter. Compared to the time series of Los Angeles, the nightlight radiance time series of Beijing has similar seasonal oscillations, with a high in the winter when the AOD is lower and a low in the summer months when the AOD is higher, similar to the AERONET data shown in Figure 6. However, the oscillation for the Beijing time series appears to become stronger (~50%) in recent years after 2019, having been weaker pre-2016 (~25%). This could be due to the fact that in the early years, pollution was much more severe and aerosol optical thickness was high all year round (e.g., maximum AOD before 2015 was >4, while it was <3 in 2019), according to AERONET measurements (https://aeronet.gsfc.nasa.gov/cgi-bin/data_display_aod_v3?site=Beijing-CAMS&nachal=2&level=3&place_code=10, accessed on 21 June 2022), a UN Environment report (https://wedocs.unep.org/bitstream/handle/20.500.11822/27645/airPolCh_EN.pdf?sequence=1&isAllowed=y, accessed on 21 June 2022), as well as Beijing AOD studies [23]. As the air became cleaner in recent years, the seasonal variation became stronger. In other words, the aerosol optical depth and PM2.5 have changed due to the cleaner air initiatives in recent years.
The other obvious trend is that the Beijing’s mean radiance has increased signifi-cantly from 2012 to 2020, from ~9.97 to ~12.89 nW/(cm2-sr), an increase of 29.3% for the time period (or ~3.66%/year). This is likely due to urban growth and urbanization. Population statistics show that the Beijing population has grown from 17.3 M to 20.5 M (or 18%) from 2012 to 2020 (https://worldpopulationreview.com/world-cities/beijing-population, accessed on 21 June 2022).
A summary of the time series data used in this study is listed in Table 1. In this study we only analyzed the near nadir observations, and the total number of images would be significantly increased if off nadir data are also included. However, as discussed earlier, the off-nadir effect would also become a variable which would require future studies. The clear sky images without moon were selected in the final time series plot in Figure 7. In this study, the same CNN/SI threshold is used for all three cities, and future studies should explore a city-specific threshold which might further improve the results.
3.3. Physical Basis for Using VIIRS/DNB as Active Light Source for Aerosol Monitoring
The idea of using the VIIRS DNB night light as an active light source for monitoring aerosols is not new. In [24], a preliminary study of VIIRS/DNB calibration identified the need for a ground-based calibration light source to improve the calibration accuracy, and recognized the potential for aerosol monitoring. In [11], a ground-based LED point light source with a well-constructed integrating sphere as a calibration source for VIIRS DNB was developed to establish NIST traceability in a NOAA SBIR project, and a second objective of that study was to explore its use for aerosol monitoring, for which comparisons with AERONET measurements at a site near South Dakota were performed, together with radiative transfer simulations. Results showed that the ground-based light source radiance agreed with that of NOAA-20 measurements better than 11% of the faint light, and approximately half of the difference was likely due to the atmosphere, including aerosols (the other half was due to measurement differences between ground and satellite). Therefore, aerosol is a significant contributor to the radiometric measurements by the VIIRS/DNB of the ground-based light source. Previous studies have also explored the measurements of aerosols with satellite observations of night lights [21]. The theoretical basis has also been studied with models from light pollution perspectives [25,26,27]
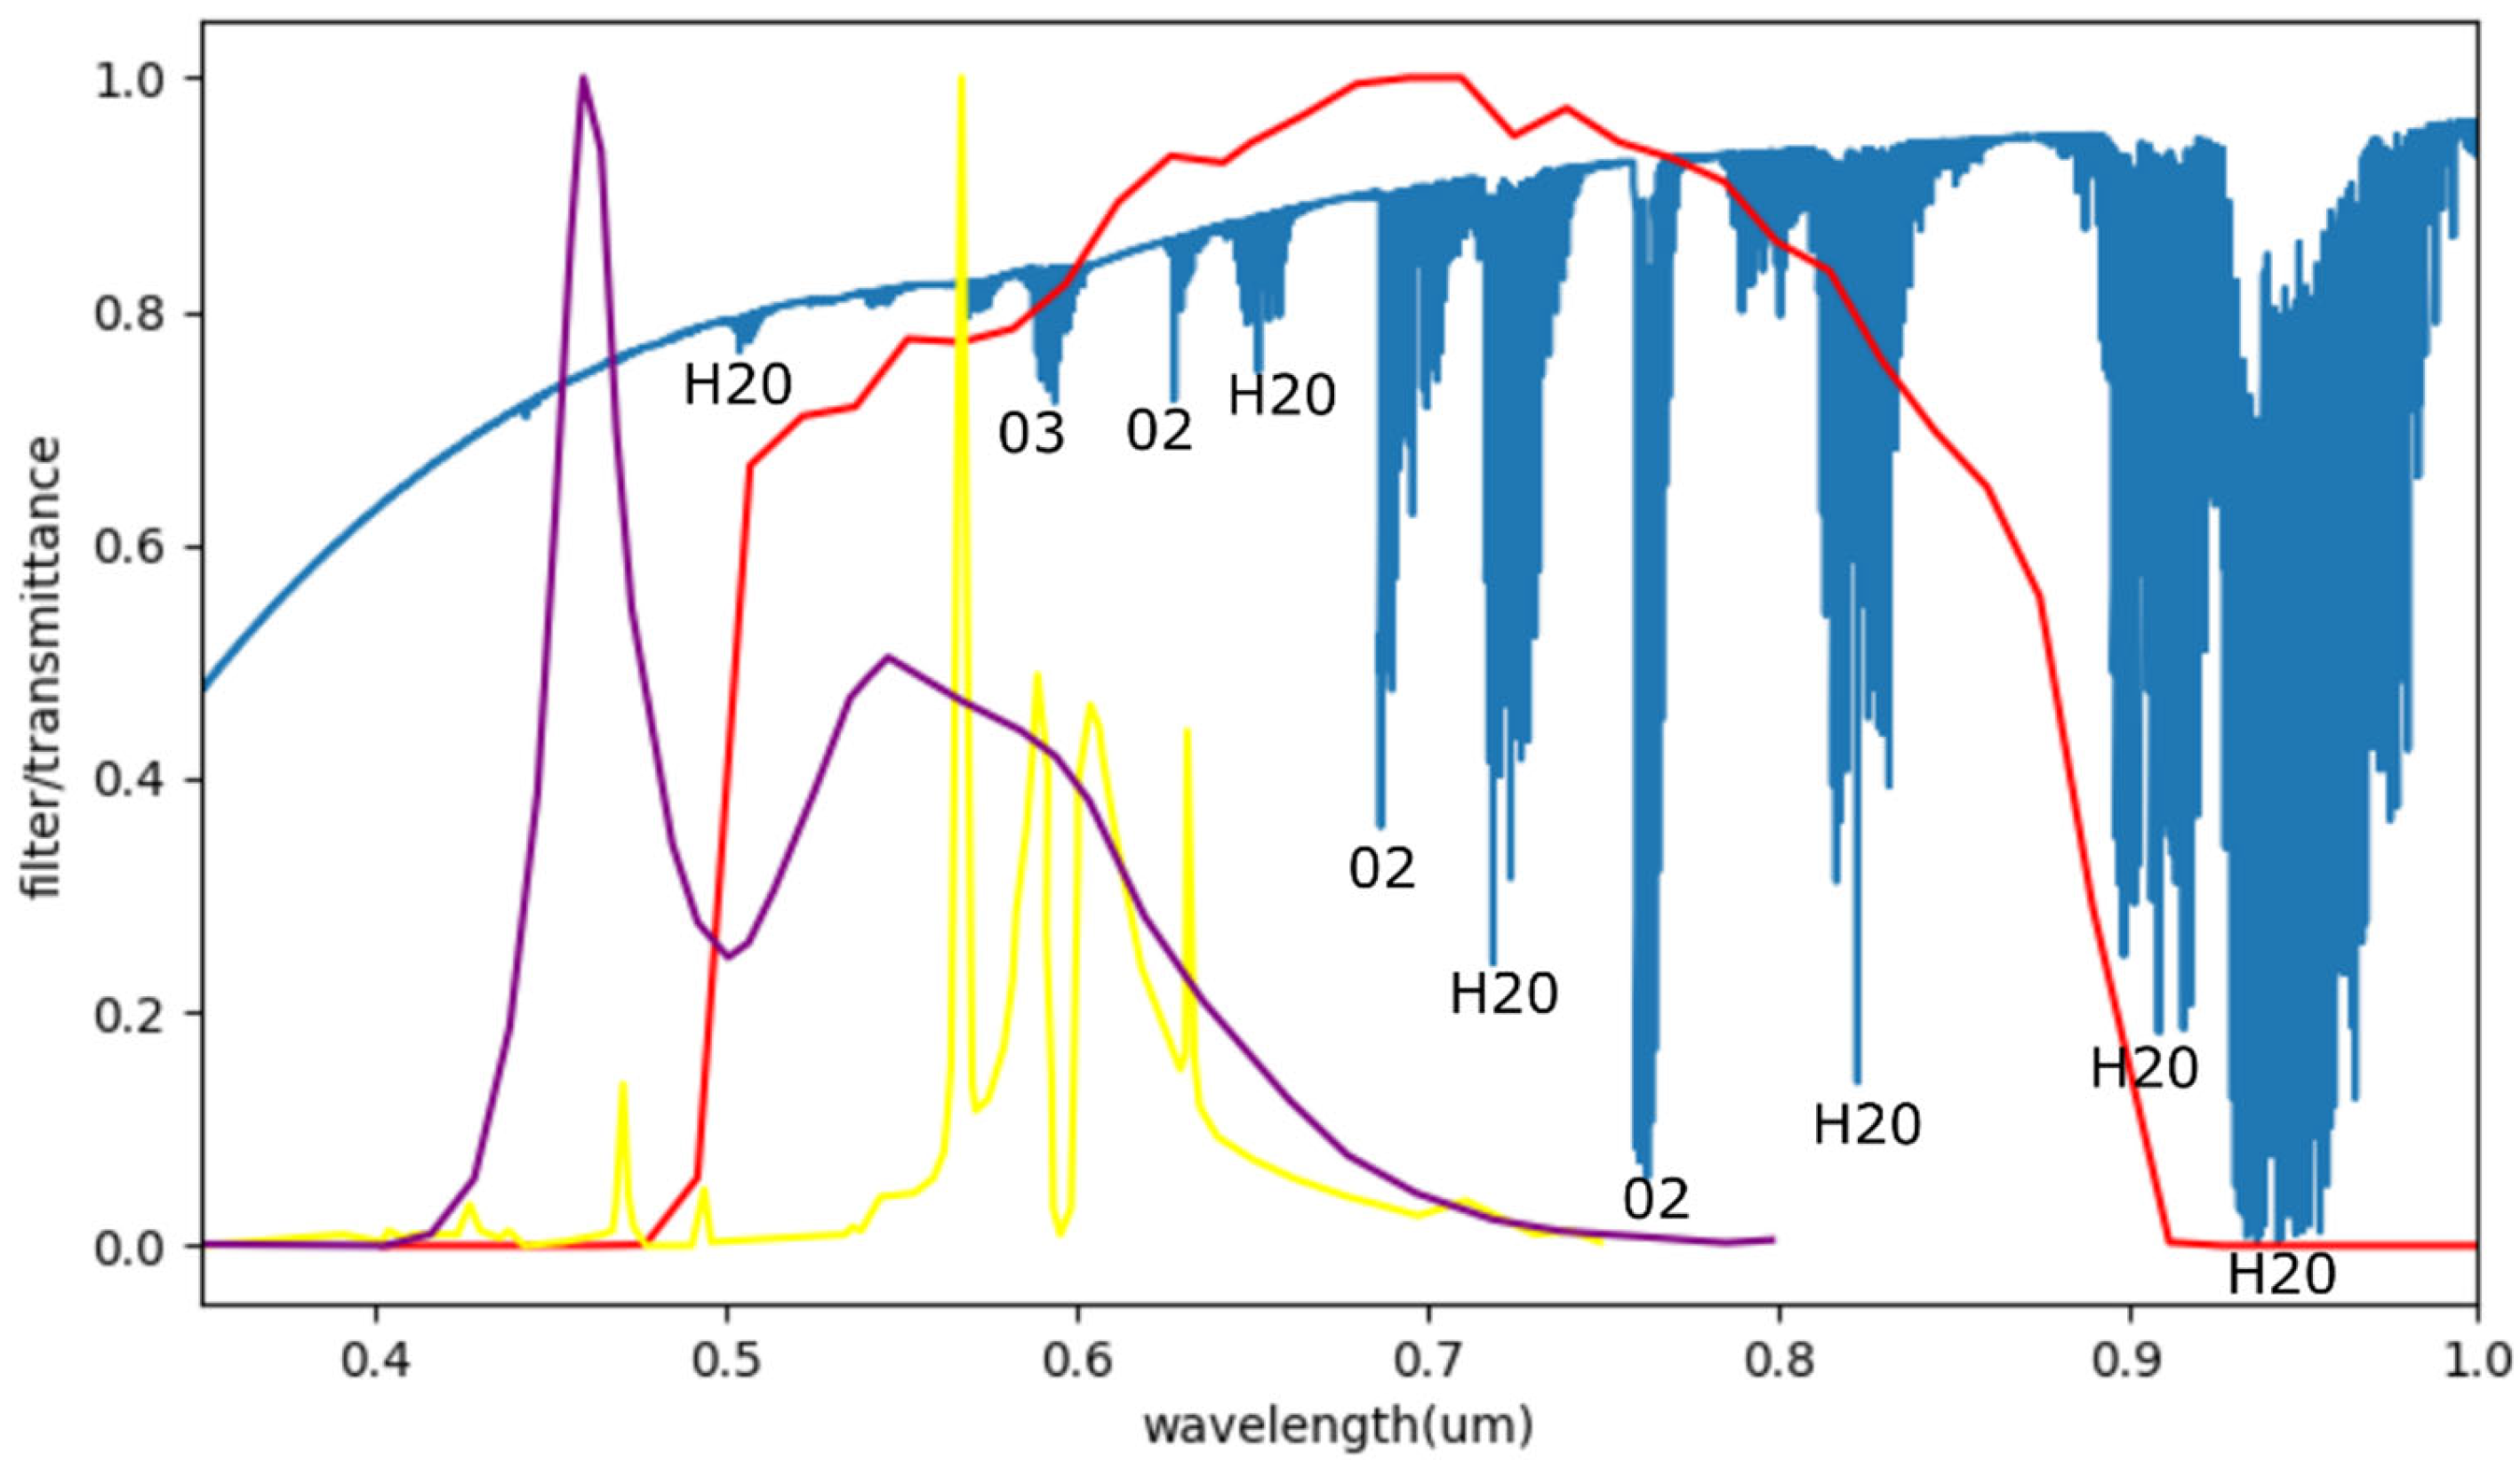
It is known that the VIIRS DNB spectral response covers a wide range from 0.4 to 0.9 um, in which aerosol, water vapor, and oxygen absorptions can all have an impact on the measured radiances. However, as Figure 8 shows, the urban night light spectra are dominated by HPS (High Pressure Sodium Lamp) and LED (Light Emitting Diode), which have a much narrower spectral range concentrated between 0.4 and 0.65 um [22,24], and therefore are largely unaffected by water vapor and oxygen absorptions. Therefore, the absorption and scattering from aerosol become a major factor affecting the light intensity of night light measurements from VIIRS/DNB. Effectively, the center spectra in the VIIRS/DNB measurement of nightlights are in the 0.45 to 0.6 um spectral region as shown in Figure 8, which is appropriate for aerosol measurements.
Using urban night light to monitor aerosols has distinct advantages and is a unique type of active remote sensing. At night, the anthropogenic aerosols are more stable, and using night light to detect aerosols over land is largely free from background noise. The approach complements the traditional approach of aerosol retrievals with solar bands during daytime under solar illumination over land, where a number of challenges still exist, such as background noise, landcover reflectance, volumetric large particle-size scattering, as well as the reliance on climatology information. It is noted that there is a growing scientific community using VIIRS/DNB for nightlight research. In addition to the social-economic and geophysical studies discussed earlier, there is also the astronomy community for the study of light pollution at night (https://lighttrends.lightpollutionmap.info/, accessed on 21 June 2022), where aerosol is also a major factor. Finally, the CNN/SI approach presented in this study focuses on city specific analysis, which distinguishes it from the traditional cloud mask-based approach, as discussed earlier. It complements the latter for night-time aerosol studies with rapid identification of clear sky images for specific cities, and its applicability to large scale studies require further exploration.
4. Summary and Future Studies
In this paper we presented an artificial intelligence (CNN/SI)-based algorithm for finding clear sky night light VIIRS/DNB images for urban areas. Since the urban night light pattern is relatively stable at local midnight, and many observations are contaminated by clouds, a high similarity index compared to a seed clear sky night image allows us to identify and search for clear sky images for a given city. The algorithm is based on similarity calculations using CNN with MobileNet V2 module in Tensorflow which works efficiently on personal laptop computers without the need for intensive computation. We demonstrated that using this algorithm, a time series of night light images can be developed for a given city. Examples are provided for selected cities including Los Angeles, Delhi, and Beijing, which show distinct seasonal variations, as well as long-term increases in the night light mean radiances. We found that the long-term changes in the night light intensity and seasonal variations are likely caused by a combination of urban development and changes in aerosol optical depth.
Future studies will expand the analysis to additional world-wide cities using the reprocessed Suomi NPP VIIRS night light images to study the time series for those cities, as well as the possible relationship with aerosols and urban growth trends. Further tuning of the CNN/SI threshold for specific cities may also improve the results. Using VIIRS observed night lights as an active light source to monitor aerosol optical depth is very promising. We also plan to expand the AI-based clear sky image identification algorithm to other satellite data for more applications.
Author Contributions
C.C. is responsible for the conceptualization, data analysis, and writing the manuscript; B.Z. is responsible for the VIIRS data reprocessing, data extraction, preparation, and analysis; F.X. contributed to the interpretation, experiments and analysis methods using convolutional neural network; Y.B. contributed to the graphics work, data collection, verification, and manuscript editing. All authors have read and agreed to the published version of the manuscript.
Funding
This research was funded by the NOAA JPSS JSTAR program [NOAA grant NA19NES4320002 (Cooperative Institute for Satellite Earth System Studies—CISESS) at the University of Maryland/ESSIC].
Data Availability Statement
The original Suomi NPP VIIRS/DNB data are available from http://www.class.noaa.gov (all accessed on 21 June 2022). The reprocessed Suomi NPP VIIRS/DNB data can be obtained from https://ncc.nesdis.noaa.gov/VIIRS/index.php, and will be made available on http://www.class.noaa.gov by 2023. All data are in the public domain and freely available.
Acknowledgments
We thank the anonymous reviewers (external), as well as Douglas Howard (internal) for a critical review of this manuscript with constructive suggestions and comments. We also thank Brent Holben and his staff for establishing and maintaining the Beijing-CAMS AERONET site used in this investigation. Thanks are extended to NOAA Lapenta Summer Intern Madison Lytle of California Polytechnic State University for cross verification of satellite overpasses, and summer intern Clarence Lam from University of Maryland/CISESS for CNN/SI code verification. The views and opinions in this paper are solely those of the authors and do not constitute a statement of policy, decision, or position on behalf of NOAA or the U.S. Government.
Conflicts of Interest
The authors declare no conflict of interest.
References
- Miller, S.D.; Haddock, S.H.D.; Straka, W.C.; Seaman, C.J.; Combs, C.L.; Wang, M.; Shi, W.; Nam, S.-H. Honing in on bioluminescent milky seas from space. Sci. Rep. 2021, 2021, 15443. [Google Scholar] [CrossRef] [PubMed]
- Elvidge, C.D.; Zhizhin, M.; Baugh, K.; Hsu, F. Automatic Boat Identification System for VIIRS Low Light Imaging Data. Remote Sens. 2015, 7, 3020–3036. [Google Scholar] [CrossRef] [Green Version]
- Cao, C.; Shao, X.; Uprety, S. Detecting Light Outages after Severe Storms Using the S-NPP/VIIRS Day/NightBand Radiances. IEEE Geosci. Remote Sens. Lett. 2013, 10, 1582–1586. [Google Scholar] [CrossRef]
- Liu, B.; D’Sa, E.J. Oceanic Internal Waves in the Sulu–Celebes Sea under Sunglint and Moonglint. IEEE Trans. Geosci. Remote Sens. 2019, 57, 6119–6129. [Google Scholar] [CrossRef]
- Cao, C.; Zhang, B.; Shao, X.; Wang, W.; Uprety, S.; Choi, T.; Blonski, S.; Gu, Y.; Bai, Y.; Lin, L.; et al. Mission-Long Recalibrated Science Quality Suomi NPP VIIRS Radiometric Dataset Using Advanced Algorithms for Time Series Studies. Remote Sens. 2021, 13, 1075. [Google Scholar] [CrossRef]
- Cao, C.; De Luccia, F.J.; Xiong, X.; Wolfe, R.; Weng, F. Early On-Orbit Performance of the Visible Infrared Imaging Radiometer Suite Onboard the Suomi National Polar-Orbiting Partnership (S-NPP) Satellite. IEEE Trans. Geosci. Remote Sens. 2014, 52, 1142–1156. [Google Scholar] [CrossRef] [Green Version]
- Sandler, S.; Howard, A.; Zhu, M.; Zhmoginov, A.; Chen, L. MobileNetV2: Inverted Residuals and Linear Bottlenecks. In Proceedings of the 2018 IEEE/CVF Conference on Computer Vision and Pattern Recognition, Salt Lake City, UT, USA, 18–23 June 2018; pp. 4510–4520. [Google Scholar] [CrossRef] [Green Version]
- Elvidge, C.D.; Zhizhin, M.; Ghosh, T.; Hsu, F.-C.; Taneja, J. Annual Time Series of Global VIIRS Nighttime Lights Derived from Monthly Averages: 2012 to 2019. Remote Sens. 2021, 13, 922. [Google Scholar] [CrossRef]
- Li, Z.; University of Wisconsin, Madison, WI, USA. Personal Communication, 2022.
- Liao, L.; Weiss, S.; Mills, S.; Hauss, B. Suomi NPP VIIRS day-night band on-orbit performance. J. Geophys. Res. 2013, 118, 12705–12718. [Google Scholar] [CrossRef]
- Ryan, R.E.; Pagnutti, M.; Burch, K.; Leigh, L.; Ruggles, T.; Cao, C.; Aaron, D.; Blonski, S.; Helder, D. The Terra Vega Active Light Source: A First Step in a New Approach to Perform Nighttime Absolute Radiometric Calibrations and Early Results Calibrating the VIIRS DNB. Remote Sens. 2019, 11, 710. [Google Scholar] [CrossRef] [Green Version]
- Bai, Y.; Cao, C.; Shao, X. Assessment of scan-angle dependent radiometric bias of Suomi-NPP VIIRS day/night band from night light point source observations. Proc. SPIE Earth Obs. Syst. 2015, 9607, 960727. [Google Scholar] [CrossRef]
- Li, X.; Ma, R.; Zhang, Q.; Li, D.; Liu, S.; He, T.; Zhao, L. Anisotropic characteristic of artificial light at night—Systematic investigation with VIIRS DNB multi-temporal observations. Remote Sens. Environ. 2019, 233, 111357. [Google Scholar] [CrossRef]
- Sawyer, V.; Levy, R.C.; Mattoo, S.; Cureton, G.; Shi, Y.; Remer, L.A. Continuing the MODIS Dark Target Aerosol Time Series with VIIRS. Remote Sens. 2020, 12, 308. [Google Scholar] [CrossRef] [Green Version]
- Ma, M.; Bartlett, K.; Harmon, K.; Yu, F. Comparison of AOD between CALIPSO and MODIS: Significant differences over major dust and biomass burning regions. Atmos. Meas. Tech. 2013, 6, 2391–2401. [Google Scholar] [CrossRef] [Green Version]
- Abish, B.; Mohanakumar, K. A Stochastic Model for Predicting Aerosol Optical Depth over the North Indian Region. Int. J. Remote Sens. 2013, 34, 1449–1458. [Google Scholar] [CrossRef]
- Holben, B.N.; Eck, T.F.; Slutsker, I.; Tanre, D.; Buis, J.P.; Setzer, A.; Vermote, E.; Reagan, J.A.; Kaufman, Y.J.; Nakajima, T.; et al. AERONET—A federated instrument network and data archive for aerosol characterization. Remote Sens. Environ. 1998, 66, 1–16. [Google Scholar] [CrossRef]
- Zhou, M.; Wang, J.; Chen, X.; Xu, X.; Colarco, P.R.; Miller, S.D.; Reid, J.S.; Kondragunta, S.; Giles, D.M.; Holben, B. Nighttime smoke aerosol optical depth over U.S. rural areas: First retrieval from VIIRS moonlight observations. Remote Sens. Environ. 2021, 267, 112717. [Google Scholar] [CrossRef]
- Johnson, R.S.; Zhang, J.; Hyer, E.J.; Miller, S.D.; Reid, J.S. Preliminary investigations toward night time aerosol optical depth retrievals from the VIIRS Day/Night Band. Atmos. Meas. Tech. 2013, 6, 1245–1255. [Google Scholar] [CrossRef] [Green Version]
- Holben, Goloub and Chen. AERONET. 2021. Available online: https://aeronet.gsfc.nasa.gov/cgi-bin/data_display_aod_v3?site=Beijing-CAMS&nachal=2&level=3&place_code=10 (accessed on 21 June 2022).
- Cavazzani, S.; Ortolani, S.; Bertolo, A.; Binotto, R.; Fiorentin, P.; Carraro, G.; Zitelli, V. Satellite measurements of artificial light at night: Aerosol effects. Mon. Not. R. Astron. Soc. 2020, 499, 5075–5089. [Google Scholar] [CrossRef]
- Cao, C.; Bai, Y. Quantitative analysis of VIIRS DNB nightlight point source for light power estimation and stability monitoring. Remote Sens. 2014, 6, 11915–11935. [Google Scholar] [CrossRef] [Green Version]
- Kondragunta, S.; NOAA/Center for Satellite Applications and Research, College Park, MD, USA. Personal Communication, 2022.
- Cao, C.; Zong, Y.; Bai, Y.; Shao, X. Preliminary study for improving the VIIRS DNB low light calibration accuracy with ground based active light source. In Earth Observing Systems XX; Butler, J.J., Xiong, X., Eds.; International Society for Optics and Photonics: San Diego, CA, USA, 2015; pp. 96070D1–96070D8. [Google Scholar]
- Kocifaj, M. Light pollution model for cloudy and cloudless night skies with ground-based light sources. Appl. Opt. 2009, 48, 4650. [Google Scholar] [CrossRef]
- Kocifaj, M.; Komar, L. A role of aerosol particles in forming urban skyglow and skyglow from distant cities. Mon. Not. R. Astron. Soc. 2016, 458, 438–448. [Google Scholar] [CrossRef] [Green Version]
- Kocifaj, M. Multiple scattering contribution to the diffuse light of a night sky: A model which embraces all orders of scattering. J. Quant. Spectrosc. Radiat. Transf. 2018, 206, 260–272. [Google Scholar] [CrossRef]
Figure 1.
Algorithm Flowchart for Urban Night Light Long-Term Time Series Analysis (blue = developed by the authors; orange = adopted and integrated).
Figure 1.
Algorithm Flowchart for Urban Night Light Long-Term Time Series Analysis (blue = developed by the authors; orange = adopted and integrated).

Figure 2.
MobileNet V2 Architecture and Workflow.

Figure 3.
Clear vs. cloudy VIIRS/DNB night light image samples over Los Angeles show dissimilar patterns (unit: km).
Figure 3.
Clear vs. cloudy VIIRS/DNB night light image samples over Los Angeles show dissimilar patterns (unit: km).

Figure 4.
Sample VIIRS/DNB nightlight images (color indicates light intensity, unit: nW/cm−2-sr).

Figure 5.
Suomi NPP VIIRS/DNB Observed Urban Mean Radiance Time Series (9 years from 2012 to 2020) before (blue cross with linear fit) and after (red cross with linear fit) applying AI based algorithm for Los Angeles (lunar-contaminated images are also screened out). Green curve shows hormonic fit to the time series. Each data point in the plot is the mean radiance value within the AOI calculated from the VIIRS/DNB image for that day.

Figure 6.
In situ measurements of Aerosol Optical Depth (AOD, daily average) at the NASA AERONET Beijing station shows high AOD in summer months and lower AOD in winter months [20].
Figure 6.
In situ measurements of Aerosol Optical Depth (AOD, daily average) at the NASA AERONET Beijing station shows high AOD in summer months and lower AOD in winter months [20].

Figure 7.
Urban night light mean radiance (L) time series (2012–2020) for Los Angeles [centered at: 34.05°N, 118.24°W] (blue: L + 12), Delhi [28.7°N, 77.1°E] (yellow, L + 9), and Beijing [39.9°N, 116.41°E] (red, L). Each data point in the plot is the mean radiance value within the AOI calculated from the VIIRS/DNB image for that day.

Figure 8.
VIIRS/DNB spectral response (red), HPS (yellow) and LED (purple) spectra, and Atmospheric Spectral Transmittance (blue).
Figure 8.
VIIRS/DNB spectral response (red), HPS (yellow) and LED (purple) spectra, and Atmospheric Spectral Transmittance (blue).


Table 1.
SNPP/VIIRS/DNB images used in this study.
| Total # of Images in the Time Series | Clear Sky without Moon | |
|---|---|---|
| Los Angeles | 380 | 161 |
| Delhi | 380 | 151 |
| Beijing | 364 | 123 |
Publisher’s Note: MDPI stays neutral with regard to jurisdictional claims in published maps and institutional affiliations. |
© 2022 by the authors. Licensee MDPI, Basel, Switzerland. This article is an open access article distributed under the terms and conditions of the Creative Commons Attribution (CC BY) license (https://creativecommons.org/licenses/by/4.0/).
Share and Cite
MDPI and ACS Style
Cao, C.; Zhang, B.; Xia, F.; Bai, Y. Exploring VIIRS Night Light Long-Term Time Series with CNN/SI for Urban Change Detection and Aerosol Monitoring. Remote Sens. 2022, 14, 3126. https://0-doi-org.brum.beds.ac.uk/10.3390/rs14133126
AMA Style
Cao C, Zhang B, Xia F, Bai Y. Exploring VIIRS Night Light Long-Term Time Series with CNN/SI for Urban Change Detection and Aerosol Monitoring. Remote Sensing. 2022; 14(13):3126. https://0-doi-org.brum.beds.ac.uk/10.3390/rs14133126
Chicago/Turabian StyleCao, Changyong, Bin Zhang, Frank Xia, and Yan Bai. 2022. "Exploring VIIRS Night Light Long-Term Time Series with CNN/SI for Urban Change Detection and Aerosol Monitoring" Remote Sensing 14, no. 13: 3126. https://0-doi-org.brum.beds.ac.uk/10.3390/rs14133126
Note that from the first issue of 2016, this journal uses article numbers instead of page numbers. See further details here.